Abstract
The unique minerals of the Au-Pd-Hg system in gold grains from heavy concentrates of the Itchayvayam placers and watercourses draining and ore samples of the Barany outcrop at the Itchayvayam mafic–ultramafic complex (Kamchatka, Russia) were investigated. Gold grains from watercourses draining and heavy concentrates of the Itchayvayam placers contain substitution structures formed by Pd,Hg-rich low-fineness gold (Au0.59–0.52Pd0.24–0.25Hg0.17–0.23, 580‰–660‰) and Pd,Hg-poor high-fineness gold (Au0.94–0.90Pd0.02–0.04Hg0.03, 910‰–960‰). Potarite (PdHg) without and with impurities (Au < 7.9, Cu < 3.5, Ag < 1.2 wt.%), Ag-poor high-fineness gold (Au0.91Ag0.09, 950‰), Ag,Pd,Hg-bearing middle-fineness gold (Au0.75Ag0.08Pd0.09Hg0.08—Au0.88Ag0.09Pd0.02Hg0.01, 820‰–930‰), and Pd,Hg-rich low-fineness gold with minor contents Ag and Cd (Au0.51–0.55Pd0.25–0.22Hg0.21–0.16Ag0.03–0.06Cd0.01, fineness 580‰–630‰) were observed as individual microinclusions in the ore samples of the Barany outcrop. XRD and EBSD study results show that the Pd,Hg-rich low-fineness gold is isotypic to gold and has the same structure type, but different cell dimensions. According to data obtained for the Itchayvayam and some deposits and ore occurrences with Pd,Hg-bearing gold, the stable ternary phases and solid solutions of the following compositions in the Au-Pd-Hg system have been identified: Pd,Hg-poor gold (Au0.94–0.90Pd0.02–0.04Hg0.03), Pd,Hg-rich gold (Au0.59–0.52Pd0.24–0.25Hg0.17–0.23), Au-potarite (PdHg0.62Au0.38—Pd1.04Hg0.96—Au0.80Pd0.68Hg0.52), and Au,Hg-bearing palladium (Pd0.7Au0.3Hg0.1). The genesis of Pd,Hg-rich gold is insufficiently studied. We supposed that the meteoric waters or low-temperature hydrotherms rich in Pd and Hg could lead to the replacement Pd,Hg-poor gold by Pd,Hg-rich gold. High concentrations of Pd in Pd,Hg-bearing gold indicate a genetic relationship with mafic–ultramafic rocks.
1. Introduction
Native gold with silver impurity is the most abundant Au mineral in nature [1,2,3,4,5,6,7,8,9]. Detailed studies of native gold composition show that it contains a wide range of impurities—Cu, Hg, Pd, Pt, Ni, Fe, and other metals [6,10,11,12,13,14,15,16,17,18,19]. Native gold containing palladium impurity is called “porpecite” or palladium gold (Au,Pd). The name “porpecite” was not approved by the CNMNC MMA, since the mineral of the composition (Au>>Pd) is a structural analogue and is considered a Pd-rich chemical variety of native gold (www.mindat.org). Palladium concentrations in native gold usually may reach 20 wt.%, but more often they are 0.9–9 wt.% [15,20,21,22]. “Mercury” gold (Au,Hg) or gold amalgams contain up to 18 wt.% Hg [23,24,25]. Experimental and theoretical data on the stability in the Au–Pd–Hg system are known only for mono- and binary phases [26,27,28,29] and are absent for ternary ones.
Research on natural gold alloys [30,31,32,33,34] can also provide important information on the composition and structures of ordered phases in complex systems with noble metals. Several minerals are known in the Au-Pd-Hg system (https://www.mindat.org/min-51827.html accessed on 4 April 2022): weishanite (Au,Hg(Ag)), aurihydrargyrumite (Au6Hg5), potarite (PdHg), gold, palladium, and mercury. Results of studies of Au-Pd-Hg mineralization from some deposits of noble metals showed the presence of ternary phases: Pd(Hg,Au) and (Pd,Au)3Hg2 [34]; Pd(Pt)AuHg, Au-rich potarite [10,35]. The list of unnamed minerals in the database https://www.mindat.org/ contains phases of the following composition: Pd0.7Au0.3Hg0.1, Pd3Au2, Au3Pd, Au2Pd; (Pd,Au)3Hg2 (Table A1).
Our study is based on gold grains and ore samples from the Barany outcrop of the Itchayvayam mafic–ultramafic complex (Kamchatka, Russia) that contain unique minerals of the Au-Pd-Hg system Au-Pd-Hg compounds with low and high contents of Pd and Hg impurities. The preliminary data of native gold composition for the Itchayvayam placers were received by Sidorov et al. (2009, 2019) [36,37]. The Au-Hg-Pd mineral containing 14.5–15.1 wt.% Pd and 19–22 wt.% Hg (this composition is nearly stoichiometric Au2PdHg or Au0.5Pd0.25Hg0.25) and intergrown with cooperate (PtS), vysotskite (PdS), and malanite (CuPt2S4) was found in the Itchayvayam River. The attempts to obtain a crystal structure for this phase and a relatively close alloy with (Pd + Au)/Hg = 3/2 were unsuccessful [37,38,39]. Pd- and Hg-enriched gold is rare and poorly characterized [10,13,40,41].
The aim of this work is to determine the composition and crystal structure of Pd,Hg-rich gold and to study the relationships of Au-Pd-Hg phases in separate gold grains and ore samples from the Barany outcrop of the Itchayvayam mafic–ultramafic complex (Kamchatka, Russia), and gold grains from the adjacent placers. Identification and investigation of ternary phases in the Au-Pd-Hg system are of great theoretical and applied importance in geochemistry, metallurgy, chemical technology, and ecology. The unique properties of Pd- and Au-based alloys enable them to be widely used in instrumentation, electrochemical, chemical, jewelry, and other industries [42]. The addition of palladium to gold increases its melting point, modulus of elasticity, strength, hardness, and turns yellow gold white (https://www.azom.com/article.aspx?ArticleID=2372 accessed on 5 August 2022). Au-Pd and Pd-Hg compounds are used as electrocatalysts for oxygen reduction reactions [43]. Despite the wide application of Au-Pd alloys, data on the stable ternary phases in the Au-Pd-Hg system are absent.
Additionally, important tasks of this research are to summarize and analyze data on the composition of the mineral phases of the Au-Pd-Hg ternary system for other objects and the conditions for the formation of Pd,Hg-bearing gold. The concentration levels and ratios of various elements in individual gold grains can provide a geochemical history or “fingerprint” of ore-forming events. These fingerprints can be used to identify sources of gold [17,44,45,46,47,48,49].
2. Geological Background
The Itchayvayam (or “Itchayvayamskiy”) complex is approximately 70 km2 in area and is the largest zoned mafic–ultramafic complex in the Koryak-Kamchatka Platinum Belt (Russia) (Figure 1). The Belt is located at the Olyutorsky (another name is “Achayvayam-Valaginsky”) arc terrain, which is the remnant of the late-Cretaceous Olyutorsky intra-ocean island arc, later collided with the easternmost margin of Paleo-Asia (e.g., [50]). It is located between the upper drainage basins of the Kamenistaya and Itchayvayam Rivers, about 20 km west of Anastasia Bay on the Bering Sea [37]. The host rocks of this massif belong to Vatyna Formation and Achayvayam Formation (Campanian and Maastrichtian stages, respectively). The Vatyna Formation consists of jasper, volcanoclastic rocks, and lavas, the latter of which are primarily basalts with MORB geochemical signatures. According to [51,52], a similar rock assemblage represents the Achayvayam Formation, but jasper is minor, and basalts bear arc geochemical signatures. Hence, the boundary between the formations corresponds to the incipience of the Olyutorsky arc. Isoferroplatinum grains from the placers related to the Itchayvayam complex yielded 190Pt–4He ages from 69.9 ± 4.1 to 70.6 ± 4.0 Ma, which corresponds the ages of host sedimentary rocks and the genetically similar Ural-Alaskan complex Galmeonan, that yielded hornblende and biotite 40Ar/39Ar ages ranging from 71.9 to 73.9 Ma [53].
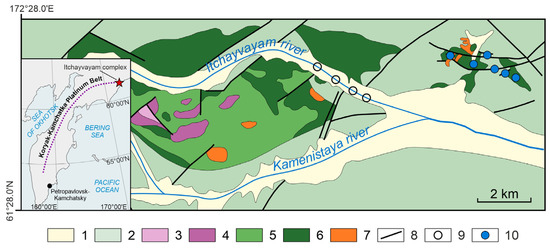
Figure 1.
Geological scheme of the Itchayvayam mafic–ultramafic complex and Barany satellite, modified after Razumny et al. (2004) [54]. 1—alluvium, 2—volcanic and sedimentary rocks of Late Cretacous Vatynskaya formation and Achayvayam formation, 3—dunite, 4—wehrlite, 5—pyroxenite, 6—gabbro, 7—monzonite, monzodiorite, monzogabbro, 8—faults, 9—sampling points (from placer, after Sidorov et al. (2019) [37], 10—sampling points (from outcrops, this study).
The Itchayvayam complex is elongated latitudinally and on the surface consists of the main body and two satellite intrusions (Barany and Ailiolan), which according to geophysical data, merge at depth to form a single igneous intrusion [37]. The Itchayvayam complex consists mainly of anorthite gabbro, wehrlite, clinopyroxenite, and dunite. The Barany and Ailiolan satellite intrusions consist of gabbro, which was intruded by later monzonite and monzodiorite bodies, bears stockwork zones with bornite–chalcopyrite mineralization. Native gold and several Pd and Ag tellurides were reported in these zones [54].
Placer PGM occurrences spatially related to the Itchayvayam complex are located on the floodplains and alluvial terraces of the Kamenistaya and Itchaivayam rivers. Three assemblages of PGM, derived from different parts of a complex present: isoferroplatinum assemblage derived from dunite, native platinum assemblage derived from clinopyroxenite and wehrlite, and Au-Pd-Hg assemblage derived from gabbro of either the main body of Itchayvayam complex or its satellite Barany massif [37].
Investigations of the Barany occurrence revealed the following inferred resources: 40,000 tons of Cu, 14.5 tons of Ag, 3 tons of Au, and 0.4 tons of Pd. The prospects occurred in 1995–2000 and in 2016. Later, they were terminated because of the unprofitability of mining the relatively small deposit in conditions of remoteness from existing infrastructure facilities and settlements.
3. Samples and Analytical Methods
Studied samples were collected from alluvial deposits of the Itchayvayam river (61°31′17″ N 172°25′22″ E) and lode sulfide veins in monzogabbro of the Barany satellite of the Itchayvayam mafic–ultramafic complex (61°32′47″ N 172°27′13″ E). The 10 individual gold grains obtained by flushing the watercourses draining the Barany outcrop and 8 gold grains from the heavy concentrates of the placer alluvial deposits of the Itchayvayam river (see sampling points in Figure 1) were studied. Some of the individual gold grains were embedded in epoxy and polished. The polished gold grains examined with a reflected light microscope Olympus BX51 show heterogeneity, different colors, and textures. Chemical analyses of minerals were conducted at the Analytical Center for Multi-elemental and Isotope Research in the Sobolev Institute of Geology and Mineralogy SB RAS in Novosibirsk, using an MIRA 3 LMU electron scanning microscope (Tescan Orsay Holding, Brno, Czech Republic) with the microanalysis system Aztec Energy Xmax-50 (Oxford Instruments Nanoanalysis, Oxford, UK) (analysts Dr. N. Karmanov and M. Khlestov). The composition of native gold and other minerals was studied at the following parameters: accelerating voltage was 20 kV, spectrum recording time was 60 s (total area of spectra > 106 counts). The following X-ray lines were selected: Lα for Pd, Ag, and Mα for Au and Hg. Pure metals (Pd, Ag, Au) and HgTe were used as standards. The lower limits of the determined content (in wt.%) were 0.25 for Ag, 0.6 for Au, 0.8 for Hg, and 0.5 for Pd. Error in determining the main components with the contents higher than 10 wt.% did not exceed 1 rel.%, and when the content of components ranged 2%–10%, the error was no higher than 6–8 rel.%. Close to the lower limit of detection, the error was 15–20 rel.%. In some cases, the live time of spectrum acquisition increased to 120 s, the lower limits of determined contents and the random error of the analysis decreased about 1.4 times. To reduce the effect of microrelief of samples on the quality of analysis, data on the primary homogeneous gold were obtained in the scanning mode of individual sections from 10 × 10 to 100 × 100 μm2 in size. The composition of small gold grains (<10 μm) was determined with a 10 nm point probe, but the size of the generation region of X-ray emission in gold with the electron beam energy 20 kV was 1 μm. Therefore, the data of analysis cannot be considered quantitative for a single phase if its minimum size is less than 2 µm.
Four polished sections of ore samples of gabbro-monzonites from the Itchayvayam mafic–ultramafic complex (Kamchatka) were also studied in detail. The massif is made up of the main body and a small satellite Barany outcrop. The latter is composed completely of gabbroids intruded by dikes and sill-like bodies of gabbros, diorites, monzodiorites, and quartz monzonites. Sites of hydrothermal-metasomatic processing represented by propilitization, actinolization, and pyritization are widespread within the outcrop. The ore mineralization is restricted to the contact of gabbroids and makes up zones of veined-streaky, stockwork bornite–chalcopyrite mineralization. Ore minerals are represented by the association of sulfides (Figure 2) and noble metals; the main minerals are bornite, chalcopyrite, and chalcocite, and less common minerals are ilmenite, native gold, hessite, naumannite, potarite, and temagamite. The ores also contain cinnabar, acanthite, rutile, titanite, barite, and oxides of rare earth elements.
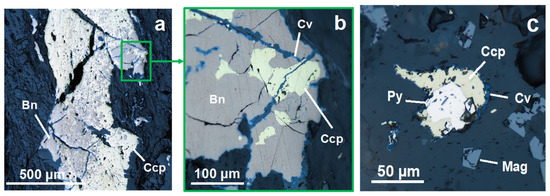
Figure 2.
Photos in reflected light of typical ores in altered gabbro-monzonites of the Barany outcrop of Ithchayvam complex: (a) bornite-chalcopyrite vein, (b) magnified part of photo “a”, note covellite altering primary sulfides along the fractures, (c) magnetite and sulfides in strongly altered gabbro-monzonite. Mineral abbreviations in Figures and the text: Au—native gold, Bn—bornite, Ccp—chalcopyrite, Cpe—cooperite, Cv—covellite, Ep—epidote, Mag—magnetite, Pmp—pumpellyite, Prh—prehnite, Ptr—potarite, Py—pyrite, Spi—spionkopite, Tem—temagamite, Tnr—tenorite.
Electron probe microanalyses (EPMA) of four polishing sections of ore samples were performed in the Institute of Volcanology and Seismology, Far East Branch of the Russian Academy of Sciences (analyst V.M. Chubarov), using the TescanVega-3 electron scanning microscope equipped with an energy dispersive spectrometer (EDS X-MAX with detection area 80 mm2). Some analyses were duplicated using the Camebax 244 microprobe equipped with four wavelength-dispersive spectrometers and energy-dispersive spectrometer X-MAX 50. As standards for noble metal minerals, we used the samples of high-purity 6 metals obtained in the Moscow Institute of 120 Steel and Alloys, which were checked for compliance and composition uniformity. Pure Au, Ag, Ni, Fe, Se, and Sb were used as standards. To determine As, Fe, and S, we used synthetic compounds FeS2, FeAsS, and InAs. Similarly, Te, Hg, Sb, Bi, Pb, Cd, and Cu were determined using synthetic compounds CdTe, CuSbS2, Bi2S3, PbS, HgS, and CuFeS2. Determination of the elements was conducted using the analytical lines of the X-ray spectrum: Kα for Fe, Cu, Zn, Ni, Mo, V, Ti, Cr, S, Al, Mg, Ca, Mn, Na, Si, Sc, P, F, and O; Lα for Sb, As, Pd, Ag, Se, Te, and Cd; Mα for Au, Hg, and Pb. Analyses were carried out using an accelerating voltage of 20 kV and sample current on the reference standard Ni: 0.7 nA for SEM Vega-3; 20 nA for Camebax 244 electron microprobe. The minimum detection limit connected with the sensitivity of the EPMA analysis is about 0.1 wt.%.
X-ray powder diffraction study of selected samples was performed on a Stoe IPDS-2T diffractometer (MoKα radiation, graphite monochromator) using Gandolfi mode. Two-dimensional X-ray patterns were radially integrated with the help of the XArea software package. The results were processed in the Stoe WinXPOW 2.21 and Match 3.5.3.109 program packages. Phase analysis was carried out through the PDF-4+ database (PDF-4+—International Centre for Diffraction Data (ICDD), accessed on 12 April 2022).
The gold grains were also investigated using a Rigaku R-Axis Rapid II (St. Petersburg State University, X-ray diffraction Resource Center) diffractometer equipped with a curved image plate detector and a rotating anode X-ray source with CoKα radiation, scan speed 1139°/min, step width 0.02°, 2-theta range 0–140°. The data were integrated using the software package Osc2Tab/SQRay [55]. All X-ray diffraction powder analyses were carried out at room temperature.
EBSD data were acquired in the Geomodel research center of Saint-Petersburg State University using a scanning electron microscope Hitachi S-3400N (Hitachi, Tokyo, Japan) equipped with Oxford NordLys (Oxford Instruments Nanoanalysis, Oxford, UK) Nano electron backscatter diffraction (EBSD) and EDS X-MAX 20 detectors detector under the following conditions: 30 kV accelerating voltage, 2 nA beam current, 40 ms per point dwell time in mapping mode and 200 ms in spot mode, 2 × 2 binning and simultaneous EDX mapping. All the data were handled automatically using Oxford Channel5 software package based on of Au structure (ICSD 44362). Prior to EBSD mapping the samples were polished by Ar plasma using an Oxford Instruments Ionfab300 etcher, an exposition of 10 min, an angle of 45◦, an accelerating voltage of 500 V, a current of 200 mA, and a beam diameter of 10 cm (Nanophotonics Resource Center, Scientific Park, St. Petersburg, Russia).
4. Results
4.1. Mineral Au-Hg-Pd Phases of Gabbro-Monzonites of the Barany Outcrop at Itchayvayam Mafic–ultramafic Complex
The individual gold grains obtained by panning the watercourses draining the Barany outcrop and ore samples of gabbro-monzonites contain the minerals of the Au-Pd-Hg system. Gold grains consist of Pd,Hg-bearing high-fineness and low-fineness gold. The ore samples contain potarite and Pd,Hg,Ag,Cd-bearing gold of different fineness. Optical photos (Figure 3a and Figure 4a) clearly show that gold grains are heterogeneous and differ in color with bright yellow, bluish-grey, and greyish-yellow zones. The greyish-yellow zones are represented by substitution textures consisting of tiny bluish-grey inclusions in a yellow matrix. In the SEM photo (BSE mode) (Figure 3b and Figure 4c), these two phases (yellow and bluish-grey) seem to be light- and dark-grey.
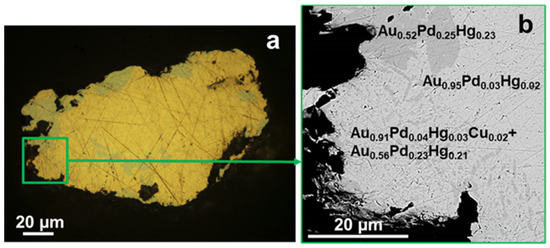
Figure 3.
(a) Optical photo (in reflected light) of gold grain 1, (b) SEM photo (BSE mode) of its left fragment.
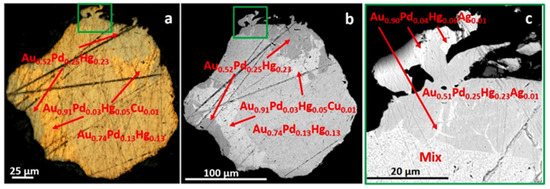
Figure 4.
(a) Optical photo (in reflected light) of gold grain 2, (b) SEM photo (BSE mode) of this grain and (c) its left marginal area.
The EPMA data show that the yellow phase consists of high-fineness gold (910‰–964‰) with minor amounts of Hg (2.9–5.9 wt.%), Pd (1.1–3.3 wt.%), and, in places, Cu (0.7 wt.%) or Ag (0.3–1.5 wt.%) that corresponds to Au0.94Pd0.03Hg0.03—Au0.89Pd0.06Hg0.05, Au0.92Pd0.03Hg0.03Cu0.02, or Au0.90Pd0.04Hg0.05Ag0.01 (Table 1). Some gold grains contain gold particles without Pd with Ag or Cu impurities (Table 1, grains 1, 3).

Table 1.
The composition of heterogeneous gold grains consisting of two phases—Pd,Hg-poor high-fineness and Pd,Hg-rich low-fineness gold (in wt.%, formula, NAu). The individual 5 gold grains obtained by panning the watercourses draining the Barany outcrop.
The formula composition Au0.52Pd0.25Hg0.23—Au0.59Pd0.24Hg0.17 was determined for the bluish-grey phase when calculated for 1 formula unit. The maximum gold concentration in this phase is 65.0 wt.%, the minimum is 57.2 wt.%, the content of Pd is 14.4–15.9 wt.%, and Hg is 19.1–27.8 wt.%, and the rare presence of no more than 0.9 wt.% Ag was also observed (Table 1, grains 1, 2, 4, and 5).
In one of the gold grains, the core contains high-fineness gold, while the peripheral part consists of low-fineness gold with veinlets of high-fineness gold or zones with a substitution structure formed by two Au-Pd-Hg phases (Figure 3a,b). In another gold grain, the core is composed of a substitution structure with an adjacent high-fineness zone, which is replaced by the low-fineness gold in the marginal part (Figure 4a–c).
The ore samples from the Itchayvayam mafic–ultramafic complex (Kamchatka, Russia) were found to contain native gold in the form of individual microinclusions (Figure 5). High-fineness gold (820‰–930‰) with impurities of Ag (4.5–6.1 wt.%), Pd (1.2–5.2 wt.%), and Hg (1.3–8.5 wt.%) (Au0.87Ag0.10Pd0.01Hg0.02) is present in epidote (Figure 5a) and in the veinlets with copper sulfate (Cu4SO4(OH)2(H2O)7) in epidote (Figure 4b and Table 2). More high-fineness gold with minor impurity of Ag (4.6–4.9 wt.%) and without Pd and Hg (Au0.91Ag0.09, 950‰) is intergrown with bornite, cooperate, tenorite in epidote, and prehnite (Figure 5c and Table 2).
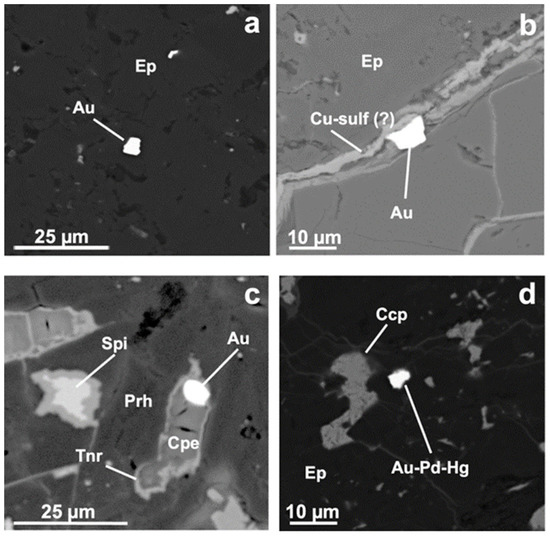
Figure 5.
SEM images (BSE mode) of high- and low-fineness gold (see composition in Table 2 and Table 3) and associated minerals in polished ore samples: (a) high-fineness gold (Au) in epidote (Ep); (b) high-fineness gold in Cu-sulphate veinlet in epidote; (c) high-fineness gold with cooperate (Cpe), tenorite (Tnr) in prehnite (Prh); (d) Pd,Hg-rich low-fineness gold and chalcopyrite in epidote.

Table 2.
Composition of Ag,Pd,Hg-bearing gold (in wt.%, fineness ‰, formula) and minerals in association with it in polished ore samples of gabbro-monzonites from Barany outcrop of the Itchayvayam mafic–ultramafic complex (East Kamchatka).
The low-fineness gold with high contents of Pd and Hg and low contents of Ag and Cd (Au0.51–0.55Pd0.25–0.22Hg0.21–0.16Ag0.03–0.06Cd0.01, fineness 580‰–630‰) (Table 3) and chalcopyrite were found as a microinclusions in epidote (Figure 5d). The ore samples also contain microinclusions of other minerals of palladium (temagamite Pd3HgTe3, merenskiite PdTe2, and mertieite II Pd8(Sb,As)3) and silver (Cd-bearing acanthite Ag2S; Cd, Se-bearing hessite, Ag2Te; naumannite Ag2Se) (Figure 6).

Table 3.
Composition of Ag,Pd,Hg,Cd-bearing low-fineness gold (in wt.%, fineness ‰, formula) with chalcopyrite in epidote in polished ore samples of gabbro-monzonites from Barany outcrop of the Itchayvayam mafic–ultramafic complex (Kamchatka, Russia).
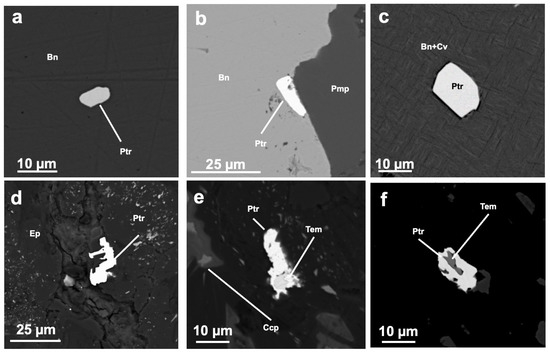
Figure 6.
SEM images (BSE mode) of potarite and minerals in association with it in polished ore samples: (a) potarite (Ptr) crystal in bornite (Bn); (b) potarite inclusion in association with bornite and pumpellyite (Pmp); (c) potarite crystal in bornite–covellite matrix (Bn + Cv); (d) potarite in epidote (Ep); (e,f) potarite–temagamite intergrowth.
The ore samples contain potarite (PdHg) (Figure 6), frequently with minor amounts of Au, Ag, and Cu. Table 4 shows the composition of potarite and associated minerals. Microinclusions of potarite (4–10 microns) are present in bornite (Figure 6a), occasionally in the intergrowth with pumpellyite (Figure 6b), in the bornite–covellite matrix (Figure 6c) or epidote (Figure 6d). Potarite frequently contains microinclusions of temagamite Pd3HgTe3 (Figure 6e,f).

Table 4.
Composition of potarite (in wt.%, formula) and minerals in association with it in polished ore samples from the Barany outcrop of the Itchayvayam mafic–ultramafic complex (Kamchatka, Russia).
The content of Au in potarite is no more than 7.9 wt.% (Pd0.94Hg0.84Au0.12Cu0.10). Rarely, potarite contains no more than 1.2 wt.% Ag (Pd0.98Hg0.98Ag0.04). The concentrations of Cu in potarite vary from 0.8 to 3.5 wt.%, which corresponds to the formula composition Pd0.98–0.92Hg0.98–0.92Cu0.04–0.16. Cu-bearing potarite occurs in intergrowth with copper sulfides (bornite, chalcocite, and covellite). The presence of Cu in potarite may be due to the influence of the copper sulfide matrix (Figure 6a–e).
4.2. Mineral Au-Hg-Pd Phases in the Grains from Heavy Concentrates of the Itchayvayam Placers
The first EPMA results on the grains of heavy concentrates from the placers of the Itchayvayam River showed several Au-Hg-Pd phases (Sidorov et al. 2019) [37]. The most widespread phases are high-fineness gold (910‰–950‰) Au0.94–0.88Pd0.03–0.05Hg0.03–0.04Ag0–0.03 ([37], (p. 7), Table 2, no. 5–7 in wt.%: Au—91.8 ÷ 95.6, Hg 3.4–4.4, Pd 1.6–3, Ag 0–1.5) and low-fineness gold Au0.59–0.55Pd0.24–0.25Hg0.17–0.19Ag0–0.01 (in wt.%: Au—62.4 ÷ 65, Hg—19.1–22, Pd—14.4–15.1, Ag—0–0.5) ([37], (p. 7), Table 2, no. 1–4). These two phases form intergrowths and are in association with cooperite (PtS) and malanite (CuPt2S4). Minor amounts of silver are rarely present in high- and low-fineness gold. The low-fineness gold forms thin veins in cooperite and precipitates later than other PGE minerals in the grains.
The gold grain from the heavy concentrates of the Itchayvayam placer contains low-fineness gold replacing high-fineness gold (Figure 7). The composition of low- and high-fineness phases in the grains of placer gold from [36,37] and the composition of these phases from gold grains and ore samples received in this study are similar, which is well seen on the ternary diagram Au(Ag,Cu)-Hg-Pd (Figure 8).
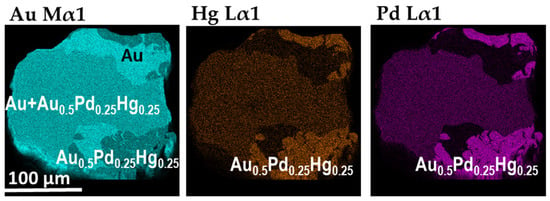
Figure 7.
Maps of areal distribution of elements (Au, Hg and Pd) in characteristic rays. The gold grain from the heavy concentrate of the Itchayvayam River placer (Kamchatka, Russia).
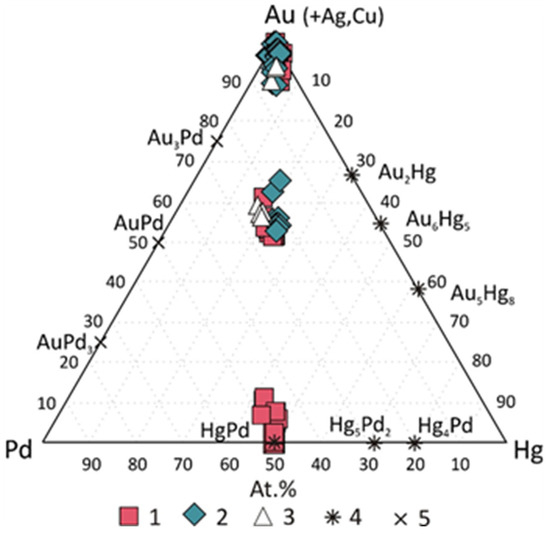
Figure 8.
Composition of native gold and Au-Hg-Pd phases (at.%) from Itchayvayam mafic–ultramafic massif (Kamchatka, Russia): 1—this study (Table 1, Table 2, Table 3 and Table 4), 2 and 3—from placer of the Itchayvayam River [36,37]. Phases stable in the Au-Hg-Pd system according to experimental and theoretical data: 4—[27,28]; 5—[26].
According to the IMA “50% rule”, Pd,Hg-bearing gold should include natural solid solutions of the composition Au1-x–yPdxHgy, where x (at. fraction Pd) + y (at. fraction Hg) ≤ 0.5 at. fraction, consequently the Au-Pd-Hg compounds with high contents of Pd and Hg impurities of composition Au0.50Pd0.25Hg0.25 can be called native gold—Pd,Hg-rich gold.
4.3. Structure Study Results: XRD and EBSD
Numerous attempts to obtain mineralogical structural data for Pd,Hg-rich low-fineness gold—Au0.50Pd0.25Hg0.25 or intermetallic Au2PdHg were unsuccessful [37,38,39]. Minerals of a relatively close (though not stable) composition corresponding to Pd-Hg-Au alloy (with (Pd + Au)/Hg = 3/2)) were described for Corrego Bom Sucesso, southern Serra do Espinhaco, Brazil [38,39] as “poorly crystalline” phases.
In the samples studied in the present work, the amount of this phase in the grains was 10%–40% by volume. The diffraction patterns obtained from single-crystal imaging of two grains on a Stoe IPDS-2T diffractometer (MoKα radiation, graphite monochromator) using Gandolfi mode show only lines of gold (Figure 9). The study of 18 grains by the more powerful diffractometer R-Axis Rapid II revealed that all 18 patterns correspond to gold; however, 3 of them also contain additional weak reflections (Figure 10). The interpretation of powder XRD data gave several options: (i) strong reflections correspond to gold, while Au-Pd-Hg alloy is poorly crystalline or X-ray amorphous and does not produce reflections (and weak reflections originate from some other phase); (ii) strong reflections correspond to gold, while weak additional reflections correspond to Au-Pd-Hg alloy or (iii) Au-Pd-Hg alloy is isotypic to gold and their reflections overlap. For the unambiguous assignment of powder XRD data, the EBSD studies of Pd- and Hg-rich areas of Au were undertaken.
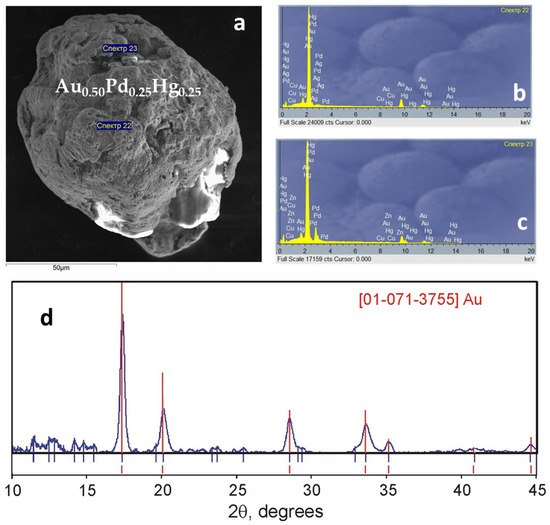
Figure 9.
(a) SEM image of gold grain 4; (b,c) EPMA results; (d) X-ray diffraction patterns. “спектр” (on Russian) = spectra (on a–c).
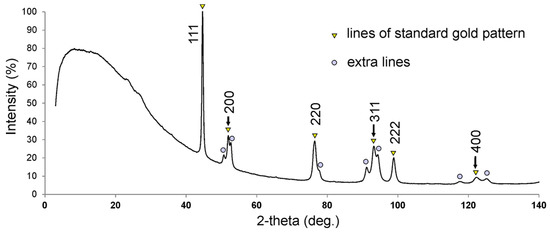
Figure 10.
The powder X-ray diffraction pattern with Pd,Hg-poor and Pd,Hg-rich gold. See details in the text.
EBSD study of gold grain 1 from the heavy concentrate of the Itchayvayam River placer shows that it consists of multiple chaotically oriented crystallites with sizes 1–80 μm (Figure 11a). Areas with elevated Pd and Hg contents do not show any decrease in diffraction contrast and crystallinity (Figure 11b) and generate diffraction patterns (Figure 11c,d) very similar to native gold. The orientation map suggests that the neighboring areas with different compositions in many cases have the same crystallographic orientations, which proves their matching or similar structures. However, pattern indexing for Au-Hg-Pd areas has generally slightly higher mean angle deviation (MAD) than for native gold (Figure 11e). The latter can be caused by unit cell distortion leading to slightly different Kikuchi bands positions. Misorientations analysis shows a high degree of mechanical distortions (Figure 11f) within the grain specified by high ductility of gold and multiple deformations during fluvial transport. Pd-Hg-containing crystallites show a lesser degree of distortion compared to nearby native gold, which can be a sign of a higher hardness of the phase. Closer inspection of the solid solution area within the sample corresponding to Figure 2a shows no miscibility among Pd,Hg-poor gold and Pd,Hg-rich gold. Elemental mapping depicts the existence of two pronounced phases forming intergrowths (Figure 11g–i). Diffraction contrast maps reveal the fine subgranular structure and depict the boundaries between Pd,Hg-poor gold and Pd,Hg-rich gold (Figure 11j). Local misorientation maps show that mainly all the disorientations within the solid solution are concentrated on the subgrain boundaries while in native gold they are distributed evenly (Figure 11k). Three grains have three different and independent orientations, while within the grains, all subgrains despite the composition oriented preferably (Figure 11l,m).
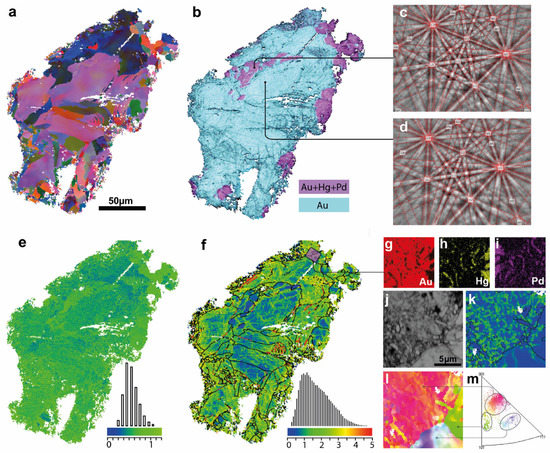
Figure 11.
EBSD maps of gold grain 1 (Figure 3): (a) orientation map in Euler coloring scheme; (b) over-imposed diffraction contrast on EDX map; (c,d) comparison of diffraction patterns corresponding to different compositions and same orientation; (e) EBSD pattern misfit map with mean angle deviation (MAD) chart; (f) local misorientation map with misorientation distribution chart; (g–i) Inset represents magnified elemental maps; (j) diffraction contrast, fine-grained substitution structure; (k) local misorientation shows elevated disorientations at subgrain boundaries within grain; (l) orientation coloring and (m) corresponding orientations distribution inverse pole figure (m) with three circles depicting three distinct grains.
EBSD studies of the grain 2 (Figure 4) display granular structure (Figure 11a) where Pd,Hg-poor gold Au0.90Pd0.04Hg0.05Ag0.01 is represented by a single crystal and probably represents the primary host protograin subsequently replaced by Au0.52Pd0.25Hg0.23 (Figure 11b). The discrepancy between the maps of the distribution of elements and the maps of orientations, namely, the intersection of boundaries of two types, allows us to propose a mechanism for the formation of a phase enriched in palladium and mercury as a result of substitution without loss of structure and not as a result of the decomposition of the protophase with the release of Au0.5Pd0.25Hg0.25 in the form of independent grains. The substitution is also supported by the fact that the enriched phases are formed close to the grain surface and can be considered incomplete rims.
The pattern misfit map shows a slightly higher average MAD for Au0.52Pd0.25Hg0.23, which matches the data described above (Figure 11e) and almost the same values for Au0.90Pd0.04Hg0.05Ag0.01 (Figure 11c). Both Pd-Hg-rich phase is harder than Pd,Hg-poor gold due to higher misorientation accumulation in gold according to the misorientation map (Figure 11d). Since EBSD show that Pd- and Hg-rich areas do not show any decrease in diffraction contrast and crystallinity and generate diffraction patterns very similar to native gold.
Based on that, the appearance of extra reflections in the powder XRD pattern has been interpreted as the cell distortion and the change of the unit cell parameters of Au phase due to admixtures of Pd and Hg. The combination of powder XRD and EBSD data allows to conclude that all reflections at the powder XRD pattern correspond to the structure type of gold, thus these phases are isotypic and some changes in the pattern (appearance of weak split reflections) correspond to the different chemical composition of areas within one grain: Pd,Hg-poor gold and Pd,Hg-rich gold. Despite the fact that our data are interpreted as the presence of only cubic phases with the Au structure, a hypothetical decrease in symmetry in this Au-Pd-Hg system seems possible to us; however, the difference in the unit cell parameters can be small and difficult to detect. The observed increase in pattern fitting error may also be a sign of symmetry lowering.
In other words, the reflection split is due to the appearance of three phases with the same structure type, but different cell dimensions. The calculated unit cell parameters from the positions of split reflections with 200 and 400 indexes are a = 4.03, 4.09, and 4.18 Å.
5. Discussion
5.1. The Composition of Native Gold and Other Phases of the Au-Pd-Hg System
The composition of native gold from the Barany outcrop of the Itchayvayam mafic–ultramafic complex (Kamchatka, Russia) is heterogeneous and unusual. According to EMPA results, it is represented by five varieties:
- (I)
- Pd,Hg-poor gold or high-fineness gold with minor impurities of Pd and Hg (Au0.94–0.90Pd0.02–0.04Hg0.03, 910–960) (Table 1);
- (II)
- Pd,Hg-rich gold or low-fineness gold with major contents of Pd and Hg (Au0.59–0.52Pd0.24–0.25Hg0.17–0.23, 580‰–660‰, ideal formula Au0.5Pd0.25Hg0.25) (Table 1);
- (III)
- usual Ag-poor gold or high-fineness gold with minor contents of Ag (Au0.91Ag0.09, ≈950‰);
- (IV)
- Pd,Ag,Hg-poor gold or high-fineness gold with minor or trace impurities of Ag, Pd, and Hg (Au0.75Ag0.08Pd0.09Hg0.08—Au0.88Ag0.09Pd0.02Hg0.01, 820‰–930‰) (Table 2);
- (V)
- Pd,Hg-rich and Ag,Cd-poor gold or low-fineness gold with major contents of Pd and Hg and low contents of Ag and Cd (Au0.51–0.55Pd0.25–0.22Hg0.21–0.16Ag0.03–0.06Cd0.01, fineness 580‰–630‰) (Table 3).
In ore samples, the native gold III (with only Ag impurity) is intergrown with bornite, cooperate, tenorite in epidote, and prehnite, and in the veinlets with copper sulfate (Cu4SO4(OH)2(H2O)7) in epidote, the native gold IV and V (associated with chalcopyrite) are present in epidote (Figure 5). High- and low-fineness gold (I and II) growing together with each other are found in some gold grains (Figure 2 and Figure 3). The absence of minerals in the intergrowth with Pd,Hg-poor gold I and Pd,Hg-rich gold II makes it difficult to explain their genesis. However, these two phases were previously reported to be in association with cooperate (PtS) and malanite (CuPt2S4) [37]. The Pd,Hg-rich gold forms thin veins in cooperite and precipitates later than other PGE minerals.
Figure 8 shows the compositions of Au-Pd-Hg phases from the Itchayvayam mafic–ultramafic complex (Kamchatka, Russia) obtained in this study and previously published for the Itchayvayam river placers [36,37]: high-fineness gold, low-fineness gold, and Au-bearing potarite. The silver is absent or does not exceed 0.38 wt.% in minute analytical points of some gold grains. According to these data, the maximum content of Pd in high-fineness gold does not exceed 2.9 wt.%, Hg is less than 6.3 wt.%. Low-fineness gold is characterized by variations in Pd and Hg in the ranges of 9.3–15.1 wt.% and 19.4–27 wt.%. The compositions of Pd,Hg-bearing gold in the samples of gabbro-monzonites from the Itchayvayam mafic–ultramafic massif and Itchayvayam river placers have a similarity that indicates that these rocks are the source of gold in placers.
Potarite from the Itchayvayam river contains impurity of Au up to 7.9 wt.% with Pd and Hg content varying from 33.1 to 35.3 wt.% and 54.9 to 65.3 wt.%, respectively. The intergrowths of Pd,Hg-bearing gold and Au-bearing potarite were not observed in the studied samples from the Itchayvayam. However, dendritic and zoned grains of gold enriched in Pd (up to 10 wt.%), Au-potarite (16 wt.% Pd), or Au-bearing potarite (34 wt.% Pd) from Lower Devonian sediments and minor volcanics in the South Hums district of Devon (southwest England) were reported by Leake et al. (1991) [10]. The results of these authors suggest compositional variations in grains with a complex internal growth structure. One such compositional range is around 34 wt.% Pd, 39–60 wt.% Hg and 0–24 wt.% Au (PdHg0.62Au0.38—Pd1.04Hg0.96). Other preferred composition, about 57 wt.% Au, 25 wt.% Hg and 16 wt.% Pd (Au0.51Pd0.27Hg0.22), occurs in Au-bearing potarite. In addition, a potarite is found as separate sub-grains within an Ag-rich grain overgrowth and as tiny inclusions within inter-sub-granular Ag-enriched films in a Pd–enriched gold. The composition of Pd,Hg-rich low-fineness gold and Au-bearing potarite from the Itchayvayam is close to the composition Au,Pd,Hg-phases from Lower Devonian sediments [10].
The ternary diagram (Figure 12) shows literature data on various samples containing minerals of the Au-Pd-Hg system. Native gold, similar in composition to Pd,Hg-rich low-fineness gold, was also found at several locations: Chudnoe (Russia) [56] (p. 113: among the numerous analytical data, only one point is given; it was an ore sample from the surface), River Dart (England) [20], and Corrego Bom Sucesso (Brazil) [38,39] (Table A2). Pd,Hg-poor gold is more common than Pd,Hg-rich gold. It is known that there are more than ten deposits and ore occurrences with Pd,Hg-poor high-fineness gold (Figure 12). Native gold from Yoko-Dovyren intrusion (Russia) [57,58] and depositions Serra Pelada and Gongo Soco (Brazil) [40,59,60] and alluvial placers Mayt and Big Kuonamka Rivers (Russia) [61] Dziwiszow and Zimnik Creek (Poland) [62,63] are examples of objects with Pd,Hg-bearing gold with low and high contents of Pd and low contents of Hg (Table A2). The impurity Ag or (and) Cu is often present in such gold.
Both endogenous and exogenous gold has a wide and similar range of Pd content (Table A2, Figure 12). Most of the data in Figure 12 fall into the field of compositions to 10 wt.% Pd (0.16 at. fractions), the highest concentrations of Pd attain 19 wt.% (0.31 at. fraction). The content of Hg in endogenous gold is normally less than 0.5 wt.%, but occasionally reaches 3.5 wt.% (e.g., at the Chudnoe deposit) [56]. It is known the composition of native gold on surfaces at the Chudnoe deposit is 15,19 wt.% Pd, 35,99 wt.% Hg and 46,82 wt.% Au (Au0.43Pd0.25Hg0.32) (Borisov, 2005 [56], (p. 113)).
Potarite from placers typically contains higher Au concentrations and wide range of variations in the amount of Pd and Hg (for example, Similkameen River (Canada) [64]; Corrego Bom Sucesso (Brazil) [38,39]. The minor impurity Ag or (and) Cu is often present in Au-potarite. Potarite of stoichiometric composition PdHg (Figure 12a) was detected in the sulfide-bearing mafic and ultramafic rocks of the Yoko-Dovyren Intrusion [57,58]. In potarite from placers and weathering crusts, according to literature data, the amount of Au varies in a wide range (Figure 12b). For example, gold content in potarite from the Bom Sucesso stream alluvium, Minas Gerais, Brazil (Fleet et al. 2002 [34], Table 1. (p. 344)) varies from 2.1 to 18 wt.%, which corresponds to the composition from Pd1.26Hg0.70Au0.04 to Pd1.06Hg0.66Au0.28. The widest variations in Au concentrations were observed in potarite from Superior Province, Canada [35] from 0 to 39.7 wt.%, which corresponds to composition from PdHg to Pd0.86Hg0.50Au0.64 (Chapman et al. 2009 [20], Table 3, (p. 569)). For River Dart, Kester Brook noted that both Pd and Hg may occur individually within gold alloys, both up to a concentration of 12 wt.%, but at higher concentrations they exist as discrete phases. The composition of the Au-Ag-Pd-Hg phase is Au2.10Pd1.35Hg0.43Ag0.12 (Chapman et al. 2009 [20], Figure 4f, (p. 571)). Data from [35] show that the content of Hg in potarite (HgPd) varies in a wide range (from 18.4 to 71.2 wt.%). A wide range of variations was revealed for Pd: minimum and maximum calculated values are 21.6 and 78.7 wt.%. Potarite (Au0.80Pd0.68Hg0.52) found in the samples picked in the region of Nunavik (Northern Quebec, Canada) contains the highest concentration of Au (46.7 wt.%), 21.6 wt.% Pd and 31.7 wt.% Hg. It is in association with amalgamated gold and cinnabar.
Intergrowths of Pd(Hg,Au) and (Pd,Au)3Hg2 from Corrego Bom Sucesso are described by Cabral et al. (2009) [39]. Very small potarite grains and a Pd0.7Au0.3Hg0.1 grain occur in pentlandite of chalcopyrite veins in chromitites from the Herbeira ultramafic massif in Cabo Ortegal, NW Spain [65].
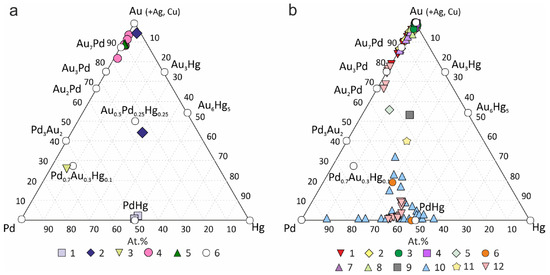

Figure 12.
Composition of native gold and Au-Hg-Pd phases (at.%) from worldwide various deposits and ore occurrences: (a) endogenous: 1. Yoko-Dovyren intrusion, Russia [57,58], 2. Chudnoe, Russia [56], 3. Herbeira massif, Spain [65], 4. Serra Pelada, Brazil [40], 5. Gongo Soco, Brazil [59,60]. 6. minerals and unnamed minerals; (b) exogenous: 1. Mayt River, Russia, 2. Big Kuonamka River, Russia [61], 3. Dziwiszow, Poland [62], 4. Zimnik Creek, Poland [63], 5. River Dart, England [20], 6. The South Hums district of Devon, southwest England [10], 7 Mataganya-Sigiri zone, Guinea [66], 8. Whipsaw Creek, Canada, 9. Similkameen River, Canada [64], 10. Superior Province, Canada [35], 11. Nunavik area, Canada [35], 12. Corrego Bom Sucesso, Brazil [38,39].
Analysis of the above data on the compositions of the mineral phases in the Au-Pd-Hg system for the Itchayvayam and other objects revealed the stable ternary phases and solid solutions of the following compositions: Pd,Hg-poor gold (Au0.94–0.90Pd0.02–0.04Hg0.03), Pd,Hg-rich gold (Au0.59–0.52Pd0.24–0.25Hg0.17–0.23—these compositions are nearly Au0.5Pd0.25Hg0.25), Au-potarite (PdHg0.62Au0.38—Pd1.04Hg0.96—Au0.80Pd0.68Hg0.52), and Au,Hg-bearing palladium (Pd0.7Au0.3Hg0.1) (Figure 12). The compositional variations and phase relations of Au-Pd-Hg compounds deserve more study.
5.2. The Structure of Phases in the Au-Pd-Hg System
The X-ray diffraction experiments of Au-Pd-Hg natural phases include (i) Au-bearing potarite grain from drainage sediment at Brownstone (South Hums district of Devon, southwest England) that gave potarite pattern with a slightly larger cell size (Leake et al. 1991 [10] reference to Nancorrow, 1989, personal communications); (ii) Pd(Hg,Au) and (Pd,Au)3Hg2 compounds did not diffract using the electron-backscattered diffraction (EBSD) and powder X-ray microdiffraction techniques, indicating that they are poorly crystalline [39]. X-ray diffraction also showed that Pd-rich/Ag-rich gold grains belong to gold structure type with decreased/standard unit-cell parameters with a = 4.03–4.06 Å and a = 4.07–4.08 Å, respectively [61].
There are only three natural phases from Au-Pd-Hg system in the Mindat database, and two of those are alloys. However, neither of them has a defined structure and Pd0.7Au0.3Hg0.1 is only published as spot analyses with certain compositions, and (Pd,Au)3Hg2 is reported to give no reasonable EBSD or microX-Ray diffraction (https://www.mindat.org/chesearch.php?inc=Hg%2CAu%2CPd%2C&exc=&class=0&sub=Search+Minerals accessed on 5 August 2022): Pd0.7Au0.3Hg0.1; (Pd,Au)3Hg2. No phases containing all three Hg, Au, and Pd are present in either COD or ICSD catalogues.
When studying the Au grains containing Pd-, Hg-rich fragments by EBSD and powder X-ray diffraction it was found that they belong to the structure type of Au (cubic, space group Fm3m, a ~4.07 Å) [67]. This is because the observed pattern (Figure 10) corresponds to Au, while extra reflections are produced as the result of the splitting of 200, 220, 311, and 400 reflections (Figure 10). Our interpretation of the data obtained is that all Au-Pd-Hg phases studied in this work are cubic, Fm3m, a = 4.03, 4.09, and 4.18 Å. The splitting of reflections is caused by a change in the unit cell parameters due to the incorporation of Pd (larger than Au) and Hg (smaller than Au) impurities into the structure of Au, i.e., Au/Pd/Hg proportion is responsible for cell metric and therefore reflection splitting. We consider the splitting of reflections (that is, a change in the unit cell parameters) as evidence that the diffraction was obtained precisely for Pd- and Hg-rich Au.
In our work, the most Pd and Hg-enriched fragments reached the composition Au0.52Pd0.25Hg0.23 and it is tempting to describe the chemical formula as Au2PdHg. Thus, when we had powder XRD data but did not yet have EBSD data, we searched for metal compounds of the stoichiometry of Au2PdHg to find structural analogues. The most interesting (from a structural point of view) is the description of atomic ordering for Cu2AuPd and Au2CuPd compounds with the symmetry decrease to tetragonal (or D14h-4/mmm) as reported based on electron diffraction data [68,69], although it was argued later [70]. This is important for our work, since the incorporation of Pd and Hg into the Au structure led to fairly wide variations in the unit cell parameters (4.03, 4.09, and 4.18 Å as reported above). If we assume that for certain chemical systems, the ordering of the chemical elements and the stretching and contraction of the cell in one (or two) directions will indeed occur, then this should lead to a decrease in symmetry from cubic to tetragonal (or lower). Despite the fact that our data are interpreted as the presence of only cubic phases with the Au structure, a hypothetical decrease in symmetry in this Au-Pd-Hg system seems possible to us, however, the difference in the unit cell parameters can be small and difficult to detect.
In general, our structural data are consistent with the (limited) literature, which shows that the phases of the Au-Pd-Hg system do not form separate mineral species but are incorporated in the structure as isomorphic impurities in known structure types.
5.3. Deposits with Pd,Hg-Bearing Gold and Genesis of Pd,Hg-Rich Gold
The mechanism of formation of native gold of different chemical compositions is complex and depends on many factors [17,32,44,45]. Native gold can form in different environments—orthomagmatic and hydrothermal systems and exogenous processes [7,32,38,40,60].
Figure 13 shows the locations of the Itchayvayam and some deposits and ore occurrences with Pd,Hg-bearing gold. They are dedicated to different geological and dynamic settings—terranes and orogenic belts and shields. According to age assessments, the processes of formation of Au-Pd mineralization are in Archean, Proterozoic, Paleozoic, and Mesozoic (Table A2).
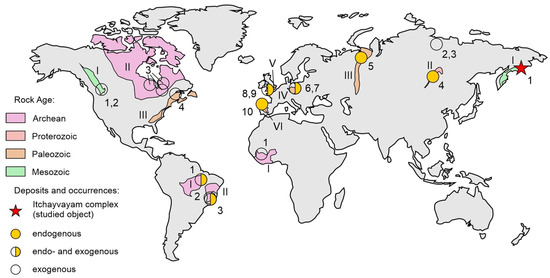
Figure 13.
Locations of deposits and ore occurrences with Au-Pd, Hg-bearing gold, and other Au-Pd-Hg phases (Arabic numerals indicate deposits, Roman numerals indicate the main geological structures; the description is shown below). Eurasia. 1. Itchayvayam complex [37], 2. Mayt River, 3. Big Kuonamka River [61,71], 4. Yoko-Dovyren intrusion (after [72]), 5. Chudnoe [16] (Russia); 6. Dziwiszow [62], 7. Zimnik Creek [63] (Poland); 8. River Dart [20] (England); 9. Devon, southwest England [10]; 10. Herbeira massif [65] (Spain). Structure: I. Olyutorsky arc terrane (after [73]), II. Baikal-Patom fold belt (after [72]), III. Ural Orogenic belt (after [74]), IV. Bohemian Massif (Variscans orogen) (after [75]), V. British Variscans orogen (after [76]), VI. Central-Iberian zone of the Iberian massif (Variscans orogen) (after [65]). Africa. 1. Mataganya-Siguiri zone [77] (Guinea). Structure: I. Kenema-Man shield and Baoule-Mossi domain (West African Craton) (after [77]). North America. 1. Whipsaw Creek, 2. Similkameen River [64], 3. Superior Province [35], 4. Nunavik area [35]. Structure: I. Intermontane terranes of the British Columbia (North American Cordilleran Orogenic belt) (after [64]), II. Canadian Shield (after [35]), III. Appalachian orogen (after [35]). South America. 1. Serra Pelada [40], 2. Corrego Bom Sucesso [38,39], 3. Gongo Soco [59,60]. Structure (after [78]): I. Central Brazil shield, II. Atlantic shield.
The composition of Pd,Hg-bearing gold, associated minerals at some of these deposits and their brief characteristics are represented in Table A2. Pd,Hg-bearing gold has hydrothermal genesis at many deposits (for example, Fe-oxide-Cu Au-Pd Gongo Soco and Au-Pd-Pt Serra Pelada (Brazil)). The Pd-poor gold assemblage possibly formed later than the Au–Pd–Hg alloys. The ore-forming fluids of the Serra Pelada deposit were characterized by a high redox potential and were reduced by the carbonaceous material of metasiltstone, which hosts most of the ore bodies [79]. Subsequent removal of As, Sb, and Se from PGM led to the formation of Pd–O-bearing compounds, either by low-temperature hydrothermal or meteoric waters. The hematite-gypsum-Pd,Hg-bearing gold from the Fe-oxide-Cu-Au deposit Gongo Soco (Brazil) appears to be of low-temperature hydrothermal origin [60].
The Au–Pd ores with Pd,Hg-poor gold and potarite from infiltration U deposits of the “unconformity” type in the South Devon in southwest England [10,41,80] are characterized by the complete absence of sulfides, the presence of selenides and, sometimes, tellurides and arsenides. Au–Pd mineralization is localized in quartz or carbonate veins with hematite and is formed at low temperatures (<100 °C) from oxidized, slightly acidic chloride or soda brines.
Pd,Hg-bearing gold is found in sulfide and low-sulfide Cu-Ni-PGE ores of layered ultramafic–mafic intrusions with complex metasomatic and hydrothermal transformations as well as in Fe-oxide Cu-Au(U) deposits (IOCG) or Au-Pd deposits associated with a redox barrier in stratified volcanic-sedimentary basins of different ages and placers associated with layered mafic–ultramafic trap complex and metasediment, volcanic rocks.
Pd,Hg-rich low-fineness gold is less common than Pd,Hg-poor high-fineness gold. It has been found in several deposits: the Itchayvayam mafic–ultramafic massifs and placers at Itchayvayam river (Russia) ([36,37], present study), Chudnoe (Russia) [56], Lower Devonian sediments (England) [10] and River Dart (England) [20], and Corrego Bom Sucesso (Brazil) [38,39].
At most deposits minerals of the Au-Pd-Hg system are found in the placers (placer rivers of Anabar, (Russia), Dziwiszow (Poland), Dart (England), Whipsaw Creek and Similkameen (Canada)), and weathering crusts (Corrego Bom Sucesso (Brazil), Matagania-Sigiri Zone (Guinea)) are of exogenous origin (Figure 12b).
Pd-rich gold with minor content of Hg, Cu, and Ag in association with Pt minerals is found in placers of the Mayat and Bolshaya Kuonamka river basins (Anabar massif, northeast of the Siberian Platform) [61]. The Pd-rich gold (up to 18 wt.% Pd and minor content of Hg, Cu, Ag, Pt) recovered from the Córrego Bom Sucesso alluvial deposit lacks evidence of long-distance transport and implies a proximal source area adjacent to the alluvial sediments [38].
The compositions of palladian gold from placers and weathering crusts are of higher fineness (770‰–1000‰). Hg is constantly present in exogenous gold, and its content varies in the range of 1–4 wt.%. According to Spiridonov and Yanakieva (2009) [58], almost all gold amalgams found in placers are technogenic formations. This, however, cannot be the case for the studied Itchayvayam complex and related alluvial deposits because they are located in an area extremely remote from any settlements, and no gold exploration has ever been documented there.
The review of literature data showed wider variations in the composition of potarite from PdHg to Au0.80Pd0.68Hg0.52 at placer ore occurrences and deposits of weathering crusts (Figure 12b). The highest content of Au in potarite is 46.7 wt.% [35]. These data indicate the existence of potarite-based solid solutions.
Pd,Hg-bearing low-fineness gold (580‰–660‰) can be a substitution product of Au-Pd-Hg solid solution or crystallize as a separate phase (Figure 5d). Its presence both in the ore samples of rocks and placer ore occurrences of the Itchayvayam suggests its high stability. It occurs in intergrowth with high-fineness gold (Table 3), or as microinclusions in epidote (Table 4).
The discovered substitution structures containing Au0.50Pd0.25Hg0.25 in the intergrowth with Pd,Hg-poor high-fineness gold (940‰–964‰) indicate the exogenous genesis (Figure 3, Figure 4 and Figure 7). Based on the mass balance, the formation of a gold-depleted phase can occur with the introduction of Pd and Hg. However, this phase also forms separate grains in epidote (Figure 5d and Table 3), which contain Ag and Cd impurities. The presence of high-fineness gold (with only Ag impurities) (Table 3, No. 61–63) in intergrowth with copper sulfate indicates oxidative low-temperature deposition conditions in the later stages and the participation of meteoric waters. The metastable thiosulphate ions (S2O32−) can be produced during the oxidation of sulfide minerals, as an intermediate species in the transformation to dissolved sulphate ions and formation of sulphate minerals [81]. Under circum-neutral pH oxidizing conditions, groundwaters interact with sulfides and enrich in metastable thiosulphate ions that can transport Au and Ag to be precipitated later by either oxidation or reduction [81,82]. The associated Ag is also readily complexed and transported by the thiosulphate ions, so that supergene gold retains a significant Ag content. Silver is more readily dissolved by chloride complexes than gold, and this process can lead to the separation of Au from Ag during supergene processes leaving low-Ag gold [82].
The ore samples of the Itchayvayam mafic–ultramafic complex contain minerals of palladium, mercury, copper, and silver (merenskiite PdTe2, mertieite II Pd8(Sb,As)3, potarite PdHg, temagamite Pd3HgTe3, bornite Cu5FeS4, chalcocite Cu2S, and covellite CuS, Cd-bearing acanthite Ag2S; Cd, Se-bearing hessite, Ag2Te; naumannite Ag2Se). We supposed that the dissolution of minerals of palladium and mercury by meteoric waters or low-temperature hydrotherms could lead to the formation of the Pd,Hg-rich low-fineness gold on high-fineness gold and Au-bearing potarite, while silver and copper partition to sulfides, tellurides, and selenides. The higher contents of Hg in placer gold in this instance is not a result of anthropogenic activity using Hg in placer mining operations though this does occur elsewhere.
6. Conclusions
- (1)
- No miscibility among Pd,Hg-poor gold and Pd,Hg-rich gold, two Au,Pd,Hg phases with different contents Pd and Hg in gold were established. XRD and EBSD study results show that the low-fineness gold with high contents of Pd and Hg (Au0.50Pd0.25Hg0.25) is isotypic to gold. This phase has the same structure type, but different cell dimensions.
- (2)
- Similarity of the compositions of among Pd,Hg-poor gold and Pd,Hg-rich gold in the ore samples of gabbro-monzonites from the Itchayvayam mafic–ultramafic massifs and placers at Itchayvayam river indicates that these rocks are the source of placers with Au-Pd-Pt-Ag mineralization.
- (3)
- Based on natural data, stable phases and solid solutions of the following compositions have been identified in the Au-Pd-Hg ternary system: Pd,Hg-poor gold, Pd,Hg-rich gold (this composition is nearly stoichiometric Au2PdHg or Au0.5Pd0.25Hg0.25), Au-potarite (from Pd(Hg,Au) to (Pd,Au)3Hg2), and Au,Hg-rich palladium. The compositional variations and phase relations of Au-Pd-Hg compounds deserve more study.
- (4)
- Pd,Hg-bearing gold is a good indicator of the possible genetic connection of Au and sulfide and low-sulfide Cu-Ni-PGE ores of layered mafic–ultramafic intrusions with complex metasomatic and hydrothermal transformations as well as in Fe-oxide Cu-Au(U) deposits (IOCG) or Au-Pd deposits associated with a redox barrier in stratified volcanic-sedimentary basins of different ages and placers associated with layered mafic–ultramafic trap complex and metasediment, volcanic rocks. Pd,Hg-rich low-fineness gold is less common than Pd,Hg-poor high-fineness gold. Meteoric waters or low-temperature hydrotherms rich in Pd and Hg could lead to the replacement of high-fineness gold by Pd,Hg-rich low-fineness gold.
Author Contributions
Conceptualization, G.P.; methodology, G.P.; formal analysis, T.B., A.K. and P.Z.; investigation, T.B., V.S. and E.Z.; data curation, T.B., A.K. and P.Z.; writing—original draft preparation, G.P., A.K., E.Z., V.S. and Y.S.; writing—review and editing, G.P., A.K., V.S. and E.Z.; visualization, P.Z., V.S., E.Z. and Y.S.; supervision, G.P.; project administration, G.P. All authors have read and agreed to the published version of the manuscript.
Funding
This research was financially supported by the Russian Foundation for Basic Research (project No. 20-05-00393) and within the framework of the state assignment of Sobolev Institute of Geology and Mineralogy of the Siberian Branch of the Russian Academy of Sciences (Novosibirsk, Russia) (No. 122041400237-8). The work of researchers from the Institute of Volcanology and Seismology has been carried out within the state assignment of Ministry of Science and Higher Education of the Russian Federation theme No. AAAA-A0282-2019-0004. The technical support of XRD Research Center and GEOMODEL Research Center of Saint Petersburg State University (SPbU) through the President of Russian Federation Grant Nsh-1462.2022.1.5 is acknowledged.
Data Availability Statement
Not applicable.
Acknowledgments
Authors are grateful to E.G. Sidorov for samples, N.S. Karmanov, M.V. Khlestov (The Analytical Center for Multi-elemental and Isotope Research in the IGM SB RAS (Novosibirsk, Russia), and V.M. Chubarov (The Institute of Volcanology and Seismology, Far East Branch of the Russian Academy of Sciences) for electron microprobe data.
Conflicts of Interest
The authors declare no conflict of interest.
Appendix A

Table A1.
The list of unnamed minerals of system Au-Pd-Hg in the Mindat database.
Table A1.
The list of unnamed minerals of system Au-Pd-Hg in the Mindat database.
| No. | Formula | Locality | Ref. | |
|---|---|---|---|---|
| Unnamed | Au7Pd | Serra Pelada, Carajás, Pará (Brazil) | [40] | [83] |
| UM2008-11-E: AuPd | Au3Pd | Serro, Minas Gerais (Brazil) | [38] | https://www.mindat.org/min-47975.html (accessed on 26 October 2022) |
| Unnamed (Au-Pd Alloy I) | Au2Pd | Serro, Minas Gerais (Brazil) | [38] | https://www.mindat.org/min-47974.html (accessed on 26 October 2022) |
| Unnamed (Pd-Au-Hg Alloy) | (Pd,Au)3Hg2 | Córrego Bom Sucesso placers, Serro, Minas Gerais (Brazil) | [39] | https://www.mindat.org/min-47976.html (accessed on 26 October 2022) |
| UM1999-09-E: AuPd | Pd3Au2 | Timan Range (Russia) | [84,85] | https://www.mindat.org/min-7735.html (accessed on 26 October 2022) |
| UM1999-08-E: AuHgPd | Pd0.7Au0.3Hg0.1 | Herbeira ultramafic massif, A Coruña, Galicia (Spain) | [65] | https://www.mindat.org/locentry-1343331.html (accessed on 26 October 2022) |

Table A2.
The composition of Pd,Hg-bearing gold, associated minerals in endogenous and exogenous deposits, and their brief characteristics.
Table A2.
The composition of Pd,Hg-bearing gold, associated minerals in endogenous and exogenous deposits, and their brief characteristics.
| Deposit Name (Location), Type | NAu ‰/Impurity Concentrations, wt.% | Associated Minerals | Host Rock, Age | References |
|---|---|---|---|---|
| Endogenous deposits | ||||
| Serra Pelada, Brazil, Fe-oxide-Cu-Au-Pd(Pt) | 920–930/Pd 6.9–7.8, Hg < 0.02, Ag 0.2, Cu 0.07–0.13 (Au7Pd) | Pd, Pd-Au-Pt-As phase, Svi, Pds, Pd3As, Pd-oxide, Gth, Au990–996 | Metasedimentary and volcanic-sedimentary sequences (Archean) with granitic intrusion (Paleoproterozoic) | [40,79] |
| 910–960 Pd 3.2–9.8, Hg 0.3–1.5, Ag < 0.3, Cu 0.6–0.7 | Ah, Pd–Hg–Se, Pd–Bi–Se phase | |||
| 980–990/Pd 1.6–2.4, Hg < 0.02, Ag 0.3–0.4, Cu 0.5–0.6 | Au–Pd–Hg, Ism, Mn–Ba oxide | |||
| 990–996/Pd 0.04–0.1, Ag 0.2–0.3, Cu < 0.07 | Au7Pd, Gth (supergene) | |||
| Gongo Soco, Brazil, Fe-oxide-Cu Au-Pd | 880–890/Pd 5.9–6.1, Hg 0.9, Ag 1.96–2.01, Cu 0.1–2.74 | Hem,Gp,Ism,Met, Au-Ptr, (Pd,Cu)O, (Fe,Pd)OOH | Metasediments; Paleoproterozoic | [59,60] |
| exogenous deposits (alluvial placers) | ||||
| Corrego Bom Sucesso, Brazil, Au–Pd(Pt) Supergene | 910–975/Pd 2.4–8.7, Hg < 0.4, Ag 0.1–0.2, Cu 0.1–0.5, Pt < 0.3 | Au3Pd, Au-Ptr | Alluvial placers associated with metasediments rocks; Paleoproterozoic | [38,39] |
| 810–860/Pd 13.6–15.6, Hg 0.39–0.44, Ag 0.1–0.2, Pt < 0.28 (Au3Pd) | Au910–975 | |||
| Au2Pd, 770–790/Pd 17.85–18.82, Hg 2.91–3.43, Ag 0.09–0.16, Pt 0.34–0.68 | ||||
| Anabar river basin, Russia: r.Mayat (a), r.Bolshaya Kuonamka (b), Au-Pt-diamond | a 860–960/Pd 0.8–12.8, Hg 0.01–0.3, Ag 0.9–2.8, Cu < 0.4 | Tpdn, Ktu | Alluvial placers associated with sediments, volcanic rocks (Precembrian-Mesozoic) with intrusion rocks (Paleozoic-Mesozoic) | [61] |
| b 990–960/Pd 0.73–7.5, Hg 0.04–1.7, Ag 0.6–2.2, Cu 0.1–1.5 | Pt | |||
| Dziwiszow, Poland, Au-Pd(Pt) | Centre 960–990/Pd < 0.5, Hg < 2.5, Ag 1.1–3, Cu 0.02–0.1, Pt < 0.04 | Hem, Gth, Kln | Alluvial placers associated with granitic rocks; Paleozoic | [62] |
| Core 975–997/Pd < 1.4, Hg < 1.9, Ag 0.2–1.8, Cu 0.04–0.1, Pt < 0.03 | ||||
| Zimnik Creek, Poland, Au-Pd-Hg | core 980/Pd 0.01–0.95, Hg 0.36–0.96, Ag 0.15–1.93 | Hem, Mag, Ap, Kln, Ms, Qz | Alluvial placers associated with sediments (conglomerates), volcanic rocks; Paleozoic | [63] |
| River Dart, England, Au-Pd-Hg | 630/Pd 22.7, Hg 13.6, Ag 2.2 | Au970–1000, Ausb, Ptr, Skg, Stpdn, Carb | Alluvial placers associated with metasediments, volcanics, granodiorite; Paleozoic | [20] |
| Whipsaw Creek, Canada, Cu-Au(-Ag-PGE) | 910–940/Pd 2.46–2.60, Hg 0.20–2.28, Ag 0.72–2.96, Cu 1.07–3.12 | Stpdn, Cc, Spy | Alluvial placers associated with alkalic porphyry; Mesozoic | [64] |
| Similkameen River, Canada, Cu-Au(-Ag-PGE) | 970/Pd < 2.1, Hg 0.1–0.7, Cu 0.06–1.8, Ag 0.7 | Tem, Bn, Cc, Ccp, Cin, Pd-telluride, Pd-arsenoantimonide | Alluvial placers associated with alkalic porphyry; Mesozoic | [64] |
| 590/Pd 15.2, Hg 22.9, Ag 3.0, Cu 0.03 | ||||
| Matagania-Siguiri Zone, Guinea, Au-Pd(-PGE) | 920–970/Pd 2.3–8.2, Hg 0.07–0.11, Pt 0–0.09, Ag < 1.25 | Spy, Bg | Placers associated with layered mafic–ultramafic trap complex (Mesozoic) and gneiss, supracrustal rocks, greenstone sequences in granite–greenstone terrain (Paleoproterozoic) | [66] |
Mineral abbreviations from the list of IMA–CNMNC approved mineral symbols [86]: native gold (Au), native palladium (Pd), native platinum (Pt), muscovite (Ms), fuchsite (Cr-Ms), kaolinite (Kln), quartz (Qz), apatite (Ap), carbonates (Carb), gypsum (Gp), chalcopyrite (Ccp), bornite (Bn), chalcocite (Cc), pentlandite (Pn), cinnabar (Cin), hematite (Hem), magnetite (Mag), goethite (Gth), tetra-auricupride (Taur), auricupride (Auc), potarite (Ptr), skaergaardite (Skg (PdCu)), aurostibite (Ausb (AuSb2)), atheneite (Ah ((Pd,Hg)3As)), mertieite (Met (Pd8Sb2.5As0.5)), isomertieite (Ism (Pd11Sb2As2)), stibiopalladinite (Stpdn (Pd3Sb)), kotulskite (Ktu (PdTe)), telluropalladinite (Tpdn (Pd9Te4)), temagamite (Tem (Pd3HgTe3)), palladseite (Pds (Pd17Se15)), sperrylite (Spy (PtAs2)), braggite (Bg), sudovikovite (Svi (PtSe2)).
References
- Petrovskaya, N.V. Native Gold; Nauka: Moscow, Russia, 1973; p. 348. (In Russian) [Google Scholar]
- Boyle, R.W. The geochemistry of gold and its deposits. Geol. Surv. Can. Bull. 1979, 280, 584. [Google Scholar]
- Morrison, G.W.; Rose, W.J.; Jaireth, S. Geological and geochemical controls on the silver content (fineness) of gold in gold-silver deposits. Ore Geol. Rev. 1991, 6, 333–364. [Google Scholar] [CrossRef]
- Gammons, C.H.; Williams-Jones, A.E. Hydrothermal geochemistry of electrum; thermodynamic constraints. Econ. Geol. 1995, 90, 420–432. [Google Scholar] [CrossRef]
- Pal’yanova, G.A. Physicochemical modeling of the coupled behavior of gold and silver in hydrothermal processes: Gold fineness, Au/Ag ratios and their possible implications. Chem. Geol. 2008, 255, 399–413. [Google Scholar] [CrossRef]
- Spiridonov, E.; Yanakieva, D. Modern mineralogy of gold: Overview and new data. ArchéoSciences 2009, 33, 67–73. [Google Scholar] [CrossRef]
- Dill, H.G. The “chessboard” classification scheme of mineral deposits: Mineralogy and geology from aluminum to zirconium. Earth Sci. Rev. 2010, 100, 1–420. [Google Scholar] [CrossRef]
- Liang, Y.; Hoshino, K. Thermodynamic calculations of AuxAg1-x fluid equilibria and their applications for ore-forming conditions. Appl. Geochem. 2015, 52, 109–117. [Google Scholar] [CrossRef]
- Savva, N.E.; Kravtsova, R.G.; Anisimova, G.S.; Palyanova, G.A. Typomorphism of Native Gold (Geological-Industrial Types of Gold Deposits in the North-East of Russia). Minerals 2022, 12, 561. [Google Scholar] [CrossRef]
- Leake, R.C.; Bland, D.J.; Styles, M.T.; Cameron, D.G. Internal structure of Au-Pd-Pt grains from South Devon in relation to low-temperature transport and deposition. Trans. Inst. Min. Met. Sect. B Appl. Earth Sci. 1991, 100, 159–178. [Google Scholar]
- Sluzhenikin, S.F.; Mokhov, A.V. Gold and silver in PGE-Cu-Ni and PGE ores of the Noril’sk deposits, Russia. Miner. Depos. 2015, 50, 465–492. [Google Scholar] [CrossRef]
- Gas’kov, I.V. Major impurity elements in native gold and their association with gold mineralization settings in deposits of Asian fold belts. Russ. Geol. Geophys. 2017, 58, 1080–1092. [Google Scholar] [CrossRef]
- Lalomov, A.V.; Chefranov, R.M.; Naumov, V.A.; Naumova, O.B.; Lebarge, W.; Dilly, R.A. Typomorphic features of placer gold of Vagran cluster (the Northern Urals) and search indicators for primary bedrock gold deposits. Ore Geol. Rev. 2017, 85, 321–335. [Google Scholar] [CrossRef]
- Murzin, V.V.; Chudnenko, K.V.; Palyanova, G.A.; Varlamov, D.A.; Naumov, E.A.; Pirajno, F. Physicochemical model for the genesis of Cu-Ag-Au-Hg solid solutions and intermetallics in the rodingites of the Zolotaya Gora gold deposit (Urals, Russia). Ore Geol. Rev. 2018, 93, 81–97. [Google Scholar] [CrossRef]
- Palyanova, G.A. Gold and Silver Minerals in Sulfide Ore. Geol. Ore Depos. 2020, 62, 383–406. [Google Scholar] [CrossRef]
- Palyanova, G.; Murzin, V.; Borovikov, A.; Karmanov, N.; Kuznetsov, S. Native gold in the Chudnoe Au-Pd-REE deposit (Subpolar Urals, Russia): Composition, minerals in intergrowth and genesis. Minerals 2021, 11, 451. [Google Scholar] [CrossRef]
- Chapman, R.J.; Banks, D.A.; Styles, M.T.; Walshaw, R.D.; Piazolo, S.; Morgan, D.J.; Grimshaw, M.R.; Spence-Jones, C.P.; Matthews, T.J.; Borovinskaya, O. Chemical and physical heterogeneity within native gold: Implications for the design of gold particle studies. Miner. Depos. 2021, 56, 1563–1588. [Google Scholar] [CrossRef]
- Chapman, R.; Torvela, T.; Savastano, L. Insights into Regional Metallogeny from Detailed Compositional Studies of Alluvial Gold: An Example from the Loch Tay Area, Central Scotland. Minerals 2023, 13, 140. [Google Scholar] [CrossRef]
- Nikiforova, Z.S.; Kalinin, Y.A.; Makarov, V.A. Evolution of native gold in exogenous conditions. Russ. Geol. Geophys. 2020, 61, 1244–1259. [Google Scholar] [CrossRef]
- Chapman, R.J.; Leake, R.C.; Bond, D.P.G.; Stedra, V.; Fairgrieve, B. Chemical and Mineralogical Signatures of Gold Formed in Oxidizing Chloride Hydrothermal Systems and Their Significance within Populations of Placer Gold Grains Collected during Reconnaissance. Econ. Geol. 2009, 104, 563–585. [Google Scholar] [CrossRef]
- Varajão, C.A.C.; Colin, F.; Vieillard, P.; Melfi, A.J.; Nahon, D. Early Weathering of Palladium Gold under Lateritic Conditions, Maquiné Mine, Minas Gerais, Brazil. Appl. Geochem. 2000, 15, 245–263. [Google Scholar] [CrossRef]
- Olivo, G.R.; Gauthier, M.; Williams-Jones, A.E.; Levesque, M. The Au-Pd Mineralization at the Conceicao Iron Mine, Itabira District, Southern Sao Francisco Craton, Brazil: An Example of a Jacutinga-Type Deposit. Econ. Geol. 2001, 96, 61–74. [Google Scholar] [CrossRef]
- Vasil’ev, V.I. Mineralogy of mercury. In Native Metals and Their Solid Solutions Amalgamides, Arsenides, Antimonides, Tellurides and Selenides. Part 1; Publishing House of SB RAS, Geo Department: Novosibirsk, Russia, 2004; p. 150. (In Russian) [Google Scholar]
- Chudnenko, K.; Pal’yanova, G. Thermodynamic properties of Au-Hg binary solid solution. Thermochim. Acta 2013, 566, 175–180. [Google Scholar] [CrossRef]
- Chudnenko, K.V.; Pal’yanova, G.A.; Anisimova, G.S.; Moskvitin, S.G. Ag-Au-Hg solid solutions and physicochemical models of their formation in nature (Kyuchyus deposit as an example). Appl. Geochem. 2015, 55, 138–151. [Google Scholar] [CrossRef]
- Okamoto, H.; Massalski, T.B. The Au-Pd (gold-palladium) system. Bull. Alloy Phase Diagr. 1985, 6, 229–235. [Google Scholar] [CrossRef]
- Okamoto, H.; Massalski, T.B. The Au-Hg (gold-mercury) system. Bull. Alloy Phase Diagr. 1989, 10, 50–58. [Google Scholar] [CrossRef]
- Guminski, C. The Hg-Pd (mercury-palladium) system. Bull. Alloy Phase Diagr. 1990, 11, 22–26. [Google Scholar] [CrossRef]
- Sluiter, M.H.F.; Colinet, C.; Pasturel, A. Ab initio calculation of the phase stability in Au-Pd and Ag-Pt alloys. Phys. Rev. B 2006, 73, 174204. [Google Scholar] [CrossRef]
- Murzin, V.V.; Kudryavtsev, V.; Berzon, R.; Sustavov, S.; Malyugin, A. New data on the instability of natural solid solutions of the system Ag-Au-Cu at <350 °C. Dokl. Akad. Nauk SSSR 1983, 269, 723–724. (In Russian) [Google Scholar]
- Knipe, S.W.; Fleet, M.E. Gold-copper alloy minerals from the Kerr Mine, Ontario. Can. Miner. 1997, 35, 573–586. [Google Scholar]
- Knight, J.; Leitch, C.H. Phase relations in the system Au-Cu-Ag at low temperatures, based on natural Assemblages. Can. Miner. 2001, 39, 889–905. [Google Scholar] [CrossRef]
- Onishchenko, S.A.; Kuznetsov, S.K. Exsolution in the Au-Ag-Cu System in a Gold-Rich Area. Int. Geochem. 2022, 60, 657–671. [Google Scholar] [CrossRef]
- Fleet, M.E.; de Almeida, C.M.; Angeli, N. Botryoidal platinum, palladium and potarite from the Bom Sucesso stream, Minas Gerais, Brazil: Compositional zoning and origin. Can. Miner. 2002, 40, 341–355. [Google Scholar] [CrossRef]
- Makvandi, S.; Pagé, P.; Tremblay, J.; Girard, R. Exploration for platinum-group minerals in Till: A new approach to the recovery, counting, mineral identification and chemical characterization. Minerals 2021, 11, 264. [Google Scholar] [CrossRef]
- Sidorov, E.G. Platinopossibility of Basic-Hyperbasic Complexes of the Koryak-Kamchatka Region. Ph.D. Thesis, Institute of Volcanology and Seismology FEB RAS, Petropavlovsk-Kamchatsky, Russia, 2009. (In Russian). [Google Scholar]
- Sidorov, E.G.; Kutyrev, A.V.; Zhitova, E.S.; Chubarov, V.M.; Khanin, D.A. Origin of platinum-group mineral assemblages from placers in rivers Draining from the Ural-Alaskan type Itchayvayamsky ultramafics, Far East Russia. Can. Miner. 2019, 57, 91–104. [Google Scholar] [CrossRef]
- Cabral, A.R.; Tupinambá, M.; Lehmann, B.; Kwitko-Ribeiro, R.; Vymazalová, A. Arborescent Palladiferous Gold and Empirical Au2Pd and Au3Pd in Alluvium from Southern Serra Do Espinhaço, Brazil. Neues Jahrb. Mineral. 2008, 184, 329–336. [Google Scholar] [CrossRef] [PubMed]
- Cabral, A.R.; Vymazalová, A.; Lehmann, B.; Tupinambá, M.; Haloda, J.; Laufek, F.; Vlček, V.; Kwitko-Ribeiro, R. Poorly Crystalline Pd-Hg-Au Intermetallic Compounds from Córrego Bom Sucesso, Southern Serra Do Espinhaço, Brazil. Eur. J. Mineral. 2009, 21, 811–816. [Google Scholar] [CrossRef]
- Cabral, A.R.; Lehmann, B.; Kwitko, R.; Costa, C.C. The Serra Pelada Au-Pd-Pt deposit, Carajás mineral province, northern Brazil: Reconnaissance mineralogy and chemistry of very high grade palladian gold mineralization. Econ. Geol. 2002, 97, 1127–1138. [Google Scholar] [CrossRef]
- Shepherd, T.J.; Bouch, J.E.; Gunn, A.G.; McKervey, J.A.; Naden, J.; Scrivener, R.C.; Styles, M.T.; Large, D.E. Permo-Triassic Unconformity-Related Au-Pd Mineralisation, South Devon, UK: New Insights and the European Perspective. Miner. Depos. 2005, 40, 24–44. [Google Scholar] [CrossRef]
- Cai, W.; Gao, T.; Hong, H.; Sun, J. Applications of Gold Nanoparticles in Cancer Nanotechnology. Nanotechnol. Sci. Appl. 2008, 1, 17–32. [Google Scholar] [CrossRef]
- Nugraha, M.; Tsai, M.-C.; Su, W.-N.; Chou, H.-L.; Hwang, B.J. Descriptor Study by Density Functional Theory Analysis for the Direct Synthesis of Hydrogen Peroxide Using Palladium-Gold and Palladium-Mercury Alloy Catalysts. Mol. Syst. Des. Eng. 2018, 3, 896–907. [Google Scholar] [CrossRef]
- Nikolaeva, L.A.; Nekrasova, A.N.; Milyaev, S.A.; Yablokova, S.V.; Gavrilov, A.M. Geochemistry of native gold from deposits of various types. Geol. Ore Deposit. 2013, 55, 176–184. [Google Scholar] [CrossRef]
- Liu, H.; Beaudoin, G. Geochemical signatures in native gold derived from Au-bearing ore deposits. Ore Geol. Rev. 2021, 132, 104066. [Google Scholar] [CrossRef]
- Chapman, R.J.; Moles, N.R.; Bluemel, B.; Walshaw, R.D. Detrital gold as an indicator mineral. In Recent Advances in Understanding Gold Deposits: From Orogeny to Alluvium; Torvela, T.M., Chapman, R.J., Lambert-Smith, J., Eds.; Geological Society Publications: London, UK, 2022; Volume 516, pp. 313–336. [Google Scholar] [CrossRef]
- Nikiforova, Z. Internal Structures of Placer Gold as an Indicator of Endogenous and Exogenous Processes. Minerals 2023, 13, 68. [Google Scholar] [CrossRef]
- McClenaghan, M.B.; Cabri, L.J. Review of gold and platinum group element (PGE) indicator minerals methods for surficial sediment sampling. Geochem. Explor. Environ. Anal. 2011, 11, 251–263. [Google Scholar] [CrossRef]
- Oberthür, T. The Fate of Platinum-Group Minerals in the Exogenic Environment—From Sulfide Ores via Oxidized Ores into Placers: Case Studies Bushveld Complex, South Africa, and Great Dyke, Zimbabwe. Minerals 2018, 8, 581. [Google Scholar] [CrossRef]
- Konstantinovskaia, E.A. Arc-Continent Collision and Subduction Reversal in the Cenozoic Evolution of the Northwest Pacific: An Example from Kamchatka (NE Russia). Tectonophysics 2001, 333, 75–94. [Google Scholar] [CrossRef]
- Batanova, V.G.; Astrakhantsev, O.V. Island arc mafic–ultramafic plutonic complexes of North Kamchatka. In Proceedings of the 29th International Geological Congress, Kyoto, Japan, 24 August–3 September 1992; Ishiwatari, A., Malpas, J., Ishizuka, H., Eds.; CRC Press: Utrecht, The Netherlands, 1994; pp. 129–143. [Google Scholar]
- Batanova, V.G.; Pertsev, A.N.; Kamenetsky, V.S.; Ariskin, A.A.; Mochalov, A.G.; Sobolev, A. V Crustal Evolution of Island-Arc Ultramafic Magma: Galmoenan Pyroxenite-Dunite Plutonic Complex, Koryak Highland (Far East Russia). J. Petrol. 2005, 46, 1345–1366. [Google Scholar] [CrossRef]
- Yakubovich, O.; Kutyrev, A.; Sidorov, E.; Travin, A. 190Pt-4He dating of platinum mineralization in Ural-Alaskan-type complexes in the Kamchatka region: Evidence for remobilization of platinum-group elements. Miner. Depos. 2022, 57, 743–758. [Google Scholar] [CrossRef]
- Razumny, A.V.; Sidorov, E.G.; Sandimirova, E.I. Copper-Gold-Palladuim Mineralization in the Concentric Zoned Massifs of the Koryaksky Upland. Vestn. KRAUNTS Earth Sci. 2004, 1, 75–80. (In Russian) [Google Scholar]
- Britvin, S.N.; Dolivo-Dobrovolsky, D.V.; Krzhizhanovskaya, M.G. Software for processing the X-ray powder diffraction data obtained from the curved image plate detector of Rigaku RAXIS Rapid II diffractometer. Zap. Ross. Mineral. Obs. 2017, 146, 104–107, (In Russian with English abs.). [Google Scholar]
- Borisov, A.V. Geological and Genetic Features of Au-Pd-REE Ore Occurrences in the Maldy-Nyrd Ridge (Subpolar Urals). Ph.D. Thesis, Institute of Geology of Ore Deposits, Petrography, Mineralogy and Geochemistry (IGEM) RAS, Moscow, Russia, 2005. (In Russian). [Google Scholar]
- Orsoev, D.A.; Rudashevsky, N.S.; Kretser, Y.L.; Konnikov, E.G. Precious Metal Mineralization in Low-Sulfide Ores of the Ioko-Dovyren Layered Massif, Northern Baikal Region. Dokl. Earth Sci. 2003, 390, 545–549. [Google Scholar]
- Spiridonov, E.M.; Orsoev, D.A.; Ariskin, A.A.; Nikolaev, G.S.; Kislov, E.V.; Korotaeva, N.N.; Yapaskurt, V.O. Hg-and Cd-Bearing Pd, Pt, Au, and Ag Minerals in Sulfide-Bearing Mafic and Ultramafic Rocks of the Yoko-Dovyren Intrusion in the Baikalides of the Northern Baikal Area. Geochem. Int. 2019, 57, 42–55. [Google Scholar] [CrossRef]
- Cabral, A.R.; Lehmann, B.; Kwitko-Ribeiro, R.; Costa, C.H.C. Palladium and Platinum Minerals from the Serra Pelada Au-Pd-Pt Deposit, Carajás Mineral Province, Northern Brazil. Can. Miner. 2002, 40, 1451–1463. [Google Scholar] [CrossRef]
- Cabral, A.R.; Lehmann, B. A Two-Stage Process of Native Palladium Formation at Low Temperatures: Evidence from a Palladian Gold Nugget (Gongo Soco Iron Ore Mine, Minas Gerais, Brazil). Miner. Mag. 2003, 67, 453–463. [Google Scholar] [CrossRef]
- Okrugin, A.; Gerasimov, B. Paragenetic Association of Platinum and Gold Minerals in Placers of the Anabar River in the Northeast of the Siberian Platform. Minerals 2023, 13, 96. [Google Scholar] [CrossRef]
- Wierchowiec, J.; Mikulski, S.Z.; Zieliński, K. Supergene Gold Mineralization from Exploited Placer Deposits at Dziwiszów in the Sudetes (NE Bohemian Massif, SW Poland). Ore Geol. Rev. 2021, 131, 104049. [Google Scholar] [CrossRef]
- Wierchowiec, J.; Zieliński, K. Origin of Placer Gold and Other Heavy Minerals from Fluvial Cenozoic Sediments in Close Proximity to Rote Fäule-Related Au Mineralisation in the North Sudetic Trough, SW Poland. Geol. Q. 2017, 61, 62–80. [Google Scholar] [CrossRef]
- Chapman, R.J.; Mileham, T.J.; Allan, M.M.; Mortensen, J.K. A distinctive Pd-Hg signature in detrital gold derived from alkali Cu-Au porphyry systems. Ore Geol. Rev. 2017, 83, 84–102. [Google Scholar] [CrossRef]
- Moreno, T.; Prichard, H.M.; Lunar, R.; Monterrubio, S.; Fisher, P. Formation of a Secondary Platinum-Group Mineral Assemblage in Chromitites from the Herbeira Ultramafic Massif in Cabo Ortegal, NW Spain. Eur. J. Mineral. 1999, 11, 363–378. [Google Scholar] [CrossRef]
- Bozhko, E.N. To the question about sources of gold-platinoid mineralization of the structural formational zone Matagania-Sigiri (Guinea, West Africa). Bull. Voronezh Univer. 2005, 1, 193–203. (In Russian) [Google Scholar]
- Davey, W.P. Precision Measurements of the Lattice Constants of Twelve Common Metals. Phys. Rev. 1925, 25, 753. [Google Scholar] [CrossRef]
- Nagasawa, A.; Matsuo, Y.; Kakinoki, J. Ordered Alloys of Gold-Palladium System. I. Electron Diffraction Study of Evaporated Au3Pd Films. J. Phys. Soc. Jpn. 1965, 20, 1881–1885. [Google Scholar] [CrossRef]
- Nagasawa, A. Electron Diffraction Study on Ordered Alloys of the Copper-Gold-Palladium System I. Ordered Alloys of Cu2AuPd and CuAu2Pd. J. Phys. Soc. Jpn. 1966, 21, 955–960. [Google Scholar] [CrossRef]
- Van Sande, M.; van Tendeloo, G.; van Landuyt, J.; Amelinckx, S. A Study by Transmission Electron Microscopy and Diffraction of the Ternary Alloy System Cu2AuPd. Phys. Status Solidi 1978, 45, 553–558. [Google Scholar] [CrossRef]
- Okrugin, A.V.; Mazur, A.B.; Zemnukhov, A.L.; Popkov, P.A.; Sleptsov, S.V. The Palladium Gold-PGM Association in the Anabar River Basin, NE Part of Siberian Platform, Russia. Otechestvennaya Geol. 2009, 5, 3–10. (In Russian) [Google Scholar]
- Polyakov, G.V.; Tolstykh, N.D.; Mekhonoshin, A.E.; Izokh, M.Y.; Podlipskii, D.A.; Orsoev, D.A.; Kolotilina, T.B. Ultramafic-Mafic Igneous Complexes of the Precambrian East Siberian Metallogenic Province (Southern Framing of the Siberian Craton): Age, Composition, Origin, and Ore Potential. Russ. Geol. Geophys. 2013, 54, 1689–1704. [Google Scholar] [CrossRef]
- Hourigan, J.K.; Brandon, M.T.; Soloviev, A.V.; Kirmasov, A.B.; Garver, J.I.; Stevenson, J.; Reiners, P.W. Eocene Arc-Continent Collision and Crustal Consolidation in Kamchatka, Russian Far East. Am. J. Sci. 2009, 309, 333–396. [Google Scholar] [CrossRef]
- Plotinskaya, O.Y.; Grabezhev, A.I.; Tessalina, S.; Seltmann, R.; Groznova, E.O.; Abramov, S.S. Porphyry Deposits of the Urals: Geological Framework and Metallogeny. Ore Geol. Rev. 2017, 85, 153–173. [Google Scholar] [CrossRef]
- Awdankiewicz, M.; Kryza, R.; Szczepara, N. Timing of Post-Collisional Volcanism in the Eastern Part of the Variscan Belt: Constraints from SHRIMP Zircon Dating of Permian Rhyolites in the North-Sudetic Basin (SW Poland). Geol. Mag. 2014, 151, 611–628. [Google Scholar] [CrossRef]
- Oplustil, S.; Cleal, C.J. A Comparative Analysis of Some Late Carboniferous Basins of Variscan Europe. Geol. Mag. 2007, 144, 417–448. [Google Scholar] [CrossRef]
- Markwitz, V.; Hein, K.A.A.; Jessell, M.W.; Miller, J. Metallogenic Portfolio of the West Africa Craton. Ore Geol. Rev. 2016, 78, 558–563. [Google Scholar] [CrossRef]
- Heilbron, M.; Cordani, U.G.; Alkmim, F.F. The São Francisco craton and its margins. In São Francisco Craton 2017, Eastern Brazil; Springer: Cham, Switzerland, 2017; pp. 3–13. [Google Scholar]
- Berni, G.V.; Heinrich, C.A.; Lobato, L.M.; Wall, V. Ore Mineralogy of the Serra Pelada Au-Pd-Pt Deposit, Carajás, Brazil and Implications for Ore-Forming Processes. Miner. Depos. 2016, 51, 781–795. [Google Scholar] [CrossRef]
- Clark, A.M.; Criddle, A.J. Palladium Minerals from Hope’s Nose, Torquay, Devon. Mineral. Mag. 1982, 46, 371–377. [Google Scholar] [CrossRef]
- Craw, D.; MacKenzie, D.; Grieve, P. Supergene Gold Mobility in Orogenic Gold Deposits, Otago Schist, New Zealand. New Zeal. J. Geol. Geophys. 2015, 58, 123–136. [Google Scholar] [CrossRef]
- Webster, J.G. The Solubility of Gold and Silver in the System Au-Ag-S-O2-H2O at 25 °C and 1 Atm. Geochim. Cosmochim. Acta 1986, 50, 1837–1845. [Google Scholar] [CrossRef]
- Atencio, D. Type Mineralogy of Brazil; Clube de Autores: Sao Paulo, Brazil, 2021. [Google Scholar]
- Makeev, A.B.; Filippov, V.N. Metallic films on natural diamond crystals (Ichet’yu Deposit, Middle Timan). Dokl. Earth Sci. 1999, 369, 1161–1165. (In Russian) [Google Scholar]
- Smith, D.G.W.; Nickel, E.H. A System of Codification for Unnamed Minerals: Report of the Subcommittee for Unnamed Minerals of the IMA Commission on New Minerals, Nomenclature and Classification. Can. Mineral. 2007, 45, 983–990. [Google Scholar] [CrossRef]
- Warr, L.N. IMA-CNMNC Approved Mineral Symbols. Mineral. Mag. 2021, 85, 291–320. [Google Scholar] [CrossRef]
Disclaimer/Publisher’s Note: The statements, opinions and data contained in all publications are solely those of the individual author(s) and contributor(s) and not of MDPI and/or the editor(s). MDPI and/or the editor(s) disclaim responsibility for any injury to people or property resulting from any ideas, methods, instructions or products referred to in the content. |
© 2023 by the authors. Licensee MDPI, Basel, Switzerland. This article is an open access article distributed under the terms and conditions of the Creative Commons Attribution (CC BY) license (https://creativecommons.org/licenses/by/4.0/).