Article

Natural Experiment on the Extraction and Quenching of Rapakivi-like Magmas: Traces of Interaction with the Mafic Melts and Their Derivatives, Salmi Batholith (Karelia, Russia)

Institute of Geology, Karelian Research Centre, The Russian Academy of Sciences (IG KarRC RAS), 185910 Petrozavodsk, Russia
Minerals 2023, 13(4), 527; https://doi.org/10.3390/min13040527
Submission received: 13 February 2023 / Revised: 29 March 2023 / Accepted: 4 April 2023 / Published: 8 April 2023

Abstract

:
The origin of the anorthosite-rapakivi granite-bearing rock complexes was a topic of research for geologists for more than a century. Magmatic systems that produce these complexes were widely developed in the Precambrian and have no direct analogues in modern times. The main goal of this study was to characterize the conditions under which primitive granitoids formed and to shed light on the history of ore matter transport during these stages. The object of the research was granite porphyry dikes—a subeffusive analogue of rapakivi granite from the Salmi batholith in the Fennoscandian Shield. Characteristic solid-phase inclusions of a mineral paragenesis of mafic rocks, as well as inclusions of sulfide melts, were found in zircon from this type of rock. These sulfide inclusions were homogenized by heating, and subsequently, the trace element composition was determined by the LA-ICP-MS method. The geochemistry of zircons was studied by the SIMS method, and the temperature of their formation was determined using a Ti-geothermometer. The temperature of the studied zircon grain formation varied from 925 to 765 °C. The values of ƒO2 for the early stages of the rock formation were in the region below the boundary of the FMQ buffer. The presence of two sulfide melts at the time at which the sulfide inclusions were captured by the zircon, pyrrhotite-chalcopyrite, and sphalerite-chalcopyrite compositions was established. The capture of sulfide inclusions from the pyrrhotite-chalcopyrite composition occurred above 841 °C, while in sphalerite-chalcopyrite, they occurred at a lower temperature of 765 °C. The connection between the formation of granite porphyry with mafic melts that form rocks of the gabbro and anorthosite types was established.

1. Introduction

Large anorthosite-rapakivi-granitoid rock complexes (ARG) are stable, magmatic associations that are assumed to be formed from mantle and crustal magmas. Their formation mainly occurred in the Proterozoic epoch (1.8–1.0 Ga) [1], where they were one of the typomorphic characteristics. Although objects of this type are known to occur in the Phanerozoic epoch as well [2,3,4], the scale of their manifestation is insignificant in comparison with that in the Proterozoic period.
ARG complexes include a wide range of rocks: pyroxenites, norites, gabbro, anorthosites, syenites, monzonites, quartz diorites, granites, and rare-metal, and topaz-containing “Li–F” granites. Often, these complexes can also contain mangerite and charnockite (AMCG). However, such rock types were not yet found in the object under study. The characteristic feature of these complexes is granite-rapakivi rocks with abundant round-shaped potassium feldspar crystals (ovoids) that are often covered with a plagioclase border [5]. The mechanisms of formation and the genetic relationships of the listed rocks are not completely clear. It is assumed that the formation of such complexes is associated with the appearance of long-lived mantle plumes under the condition of an abnormally thick continental crust [6]. For example, the duration of the formation of the Wiborg batholith was proposed to be 50 million years [7,8]. The mafic rocks of the ARG complexes were formed from magmas obtained by partial melting of the upper mantle with subsequent contamination by crustal material [9,10,11], while acidic rocks originated from crustal anatexis under the influences of heat and mantle plume material. The mixing of acidic and basic magmas in rapakivi granite containing massifs leading to the formation of hybrid rocks was also noted [12,13]. Further, mingling due to the introduction of hot magma into granite was found [14,15].
Many ore deposits are associated with ARG complexes worldwide, including unique Sn, (W, Ta, Nb, and Be) deposits in the Rondônia province, Brazil [16] and Fe-Ti-apatite deposits in the anorthosites of Lac Tio and Allard Lake in Canada [17].
ARG complexes are widespread within the Baltic Shield: in Ragunda and Nordringra in Sweden; Vehmaa, Latila, and Åland in Finland; and in Wiborg with satellites in Finland and Russia. Of those listed above, the largest and most well-studied ARG complex is the Wiborg batholith [7,8]. Its area, taking into account the part that is hidden under the waters of the Gulf of Finland, is up to 30,000 km2 [18]. Another ARG complex in the Baltic Shield is the Salmi batholith. Associated with this batholith are Sn and Fe scarn deposits that were abandoned in the 19th century to early 20th century [19,20], the “Kitelskoye” Sn field [21], the “Karku” U deposit [22], and potential industrially significant objects with In mineralization [23].
Important questions regarding ARG rocks and the genesis of their related ores concern the source of material, different melt relationships, compositions of parental melts, and physical–chemical parameters associated with their formation.
In large intrusive bodies, a significant portion of the primary information about parent melts is lost due to subsolidus reactions between minerals and as a result of autometasomatosis processes.
However, this information survives in rapidly cooling bodies, i.e., in dikes and veins. The author established that this geological situation exists within the Salmi batholith, which allows us to study the conditions of granite porphyry (geochemical close to rapakivi granite) crystallization. Significant research attention was paid to inclusions in zircon, which is a good container for mineral-forming sources, especially sulfide melt. Zircon has no phase transitions or cleavage, which prevents the depressurization of inclusions during magma cooling. It has high hardness and strength values and relative chemical inertia. In acidic peraluminous rocks, it is an early liquidus phase and carries information about the initial stages of petrogenesis and the compositions of melts. In addition, zircon is a thermometer mineral [24], which allows the temperature interval present at the beginning of crystallization to be determined. In this study, the composition of melt sulfide inclusions in zircon was characterized. To obtain this information, the inclusions were homogenized by heating in an inert (Ar) gas media followed by quenching. The composition of the homogenized inclusions was determined using LA-ICP-MS. To estimate the crystallization temperature of zircon, it is necessary to determine the Ti content in zircon in various zones by cathodoluminescence. Due to the low concentration of Ti, its determination was carried out by the SIMS method. The results of these studies are presented in this article.

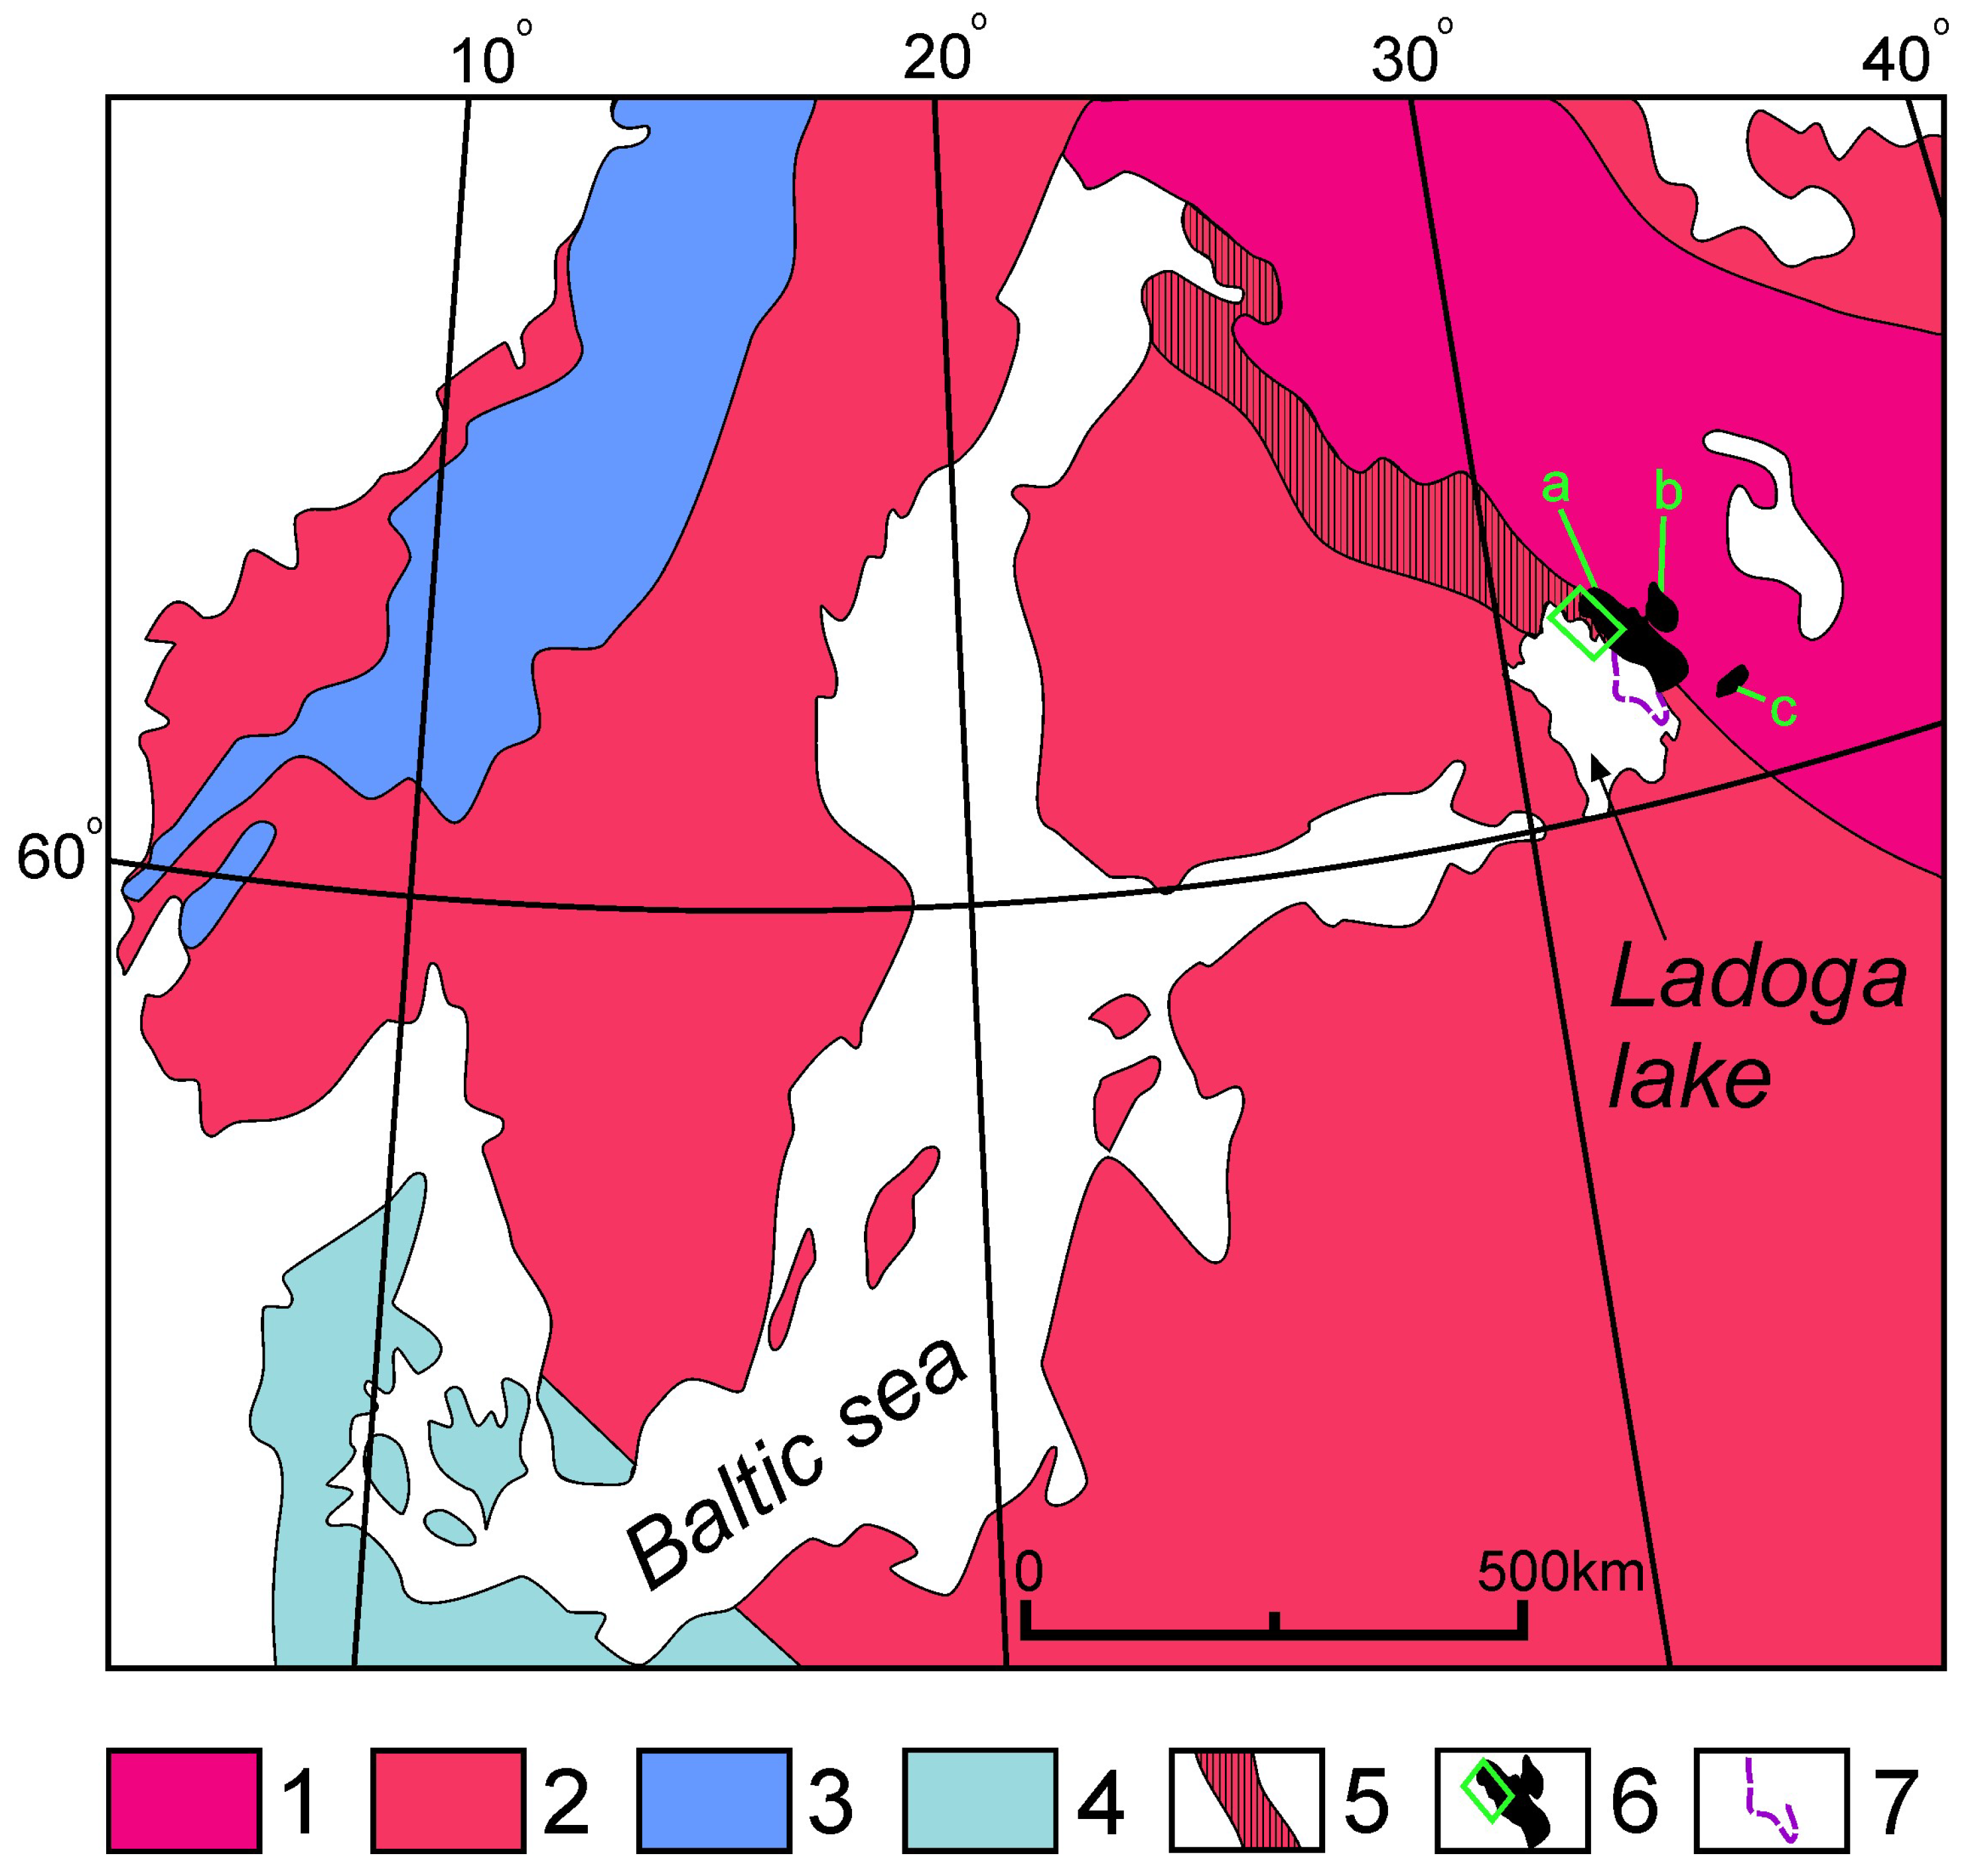
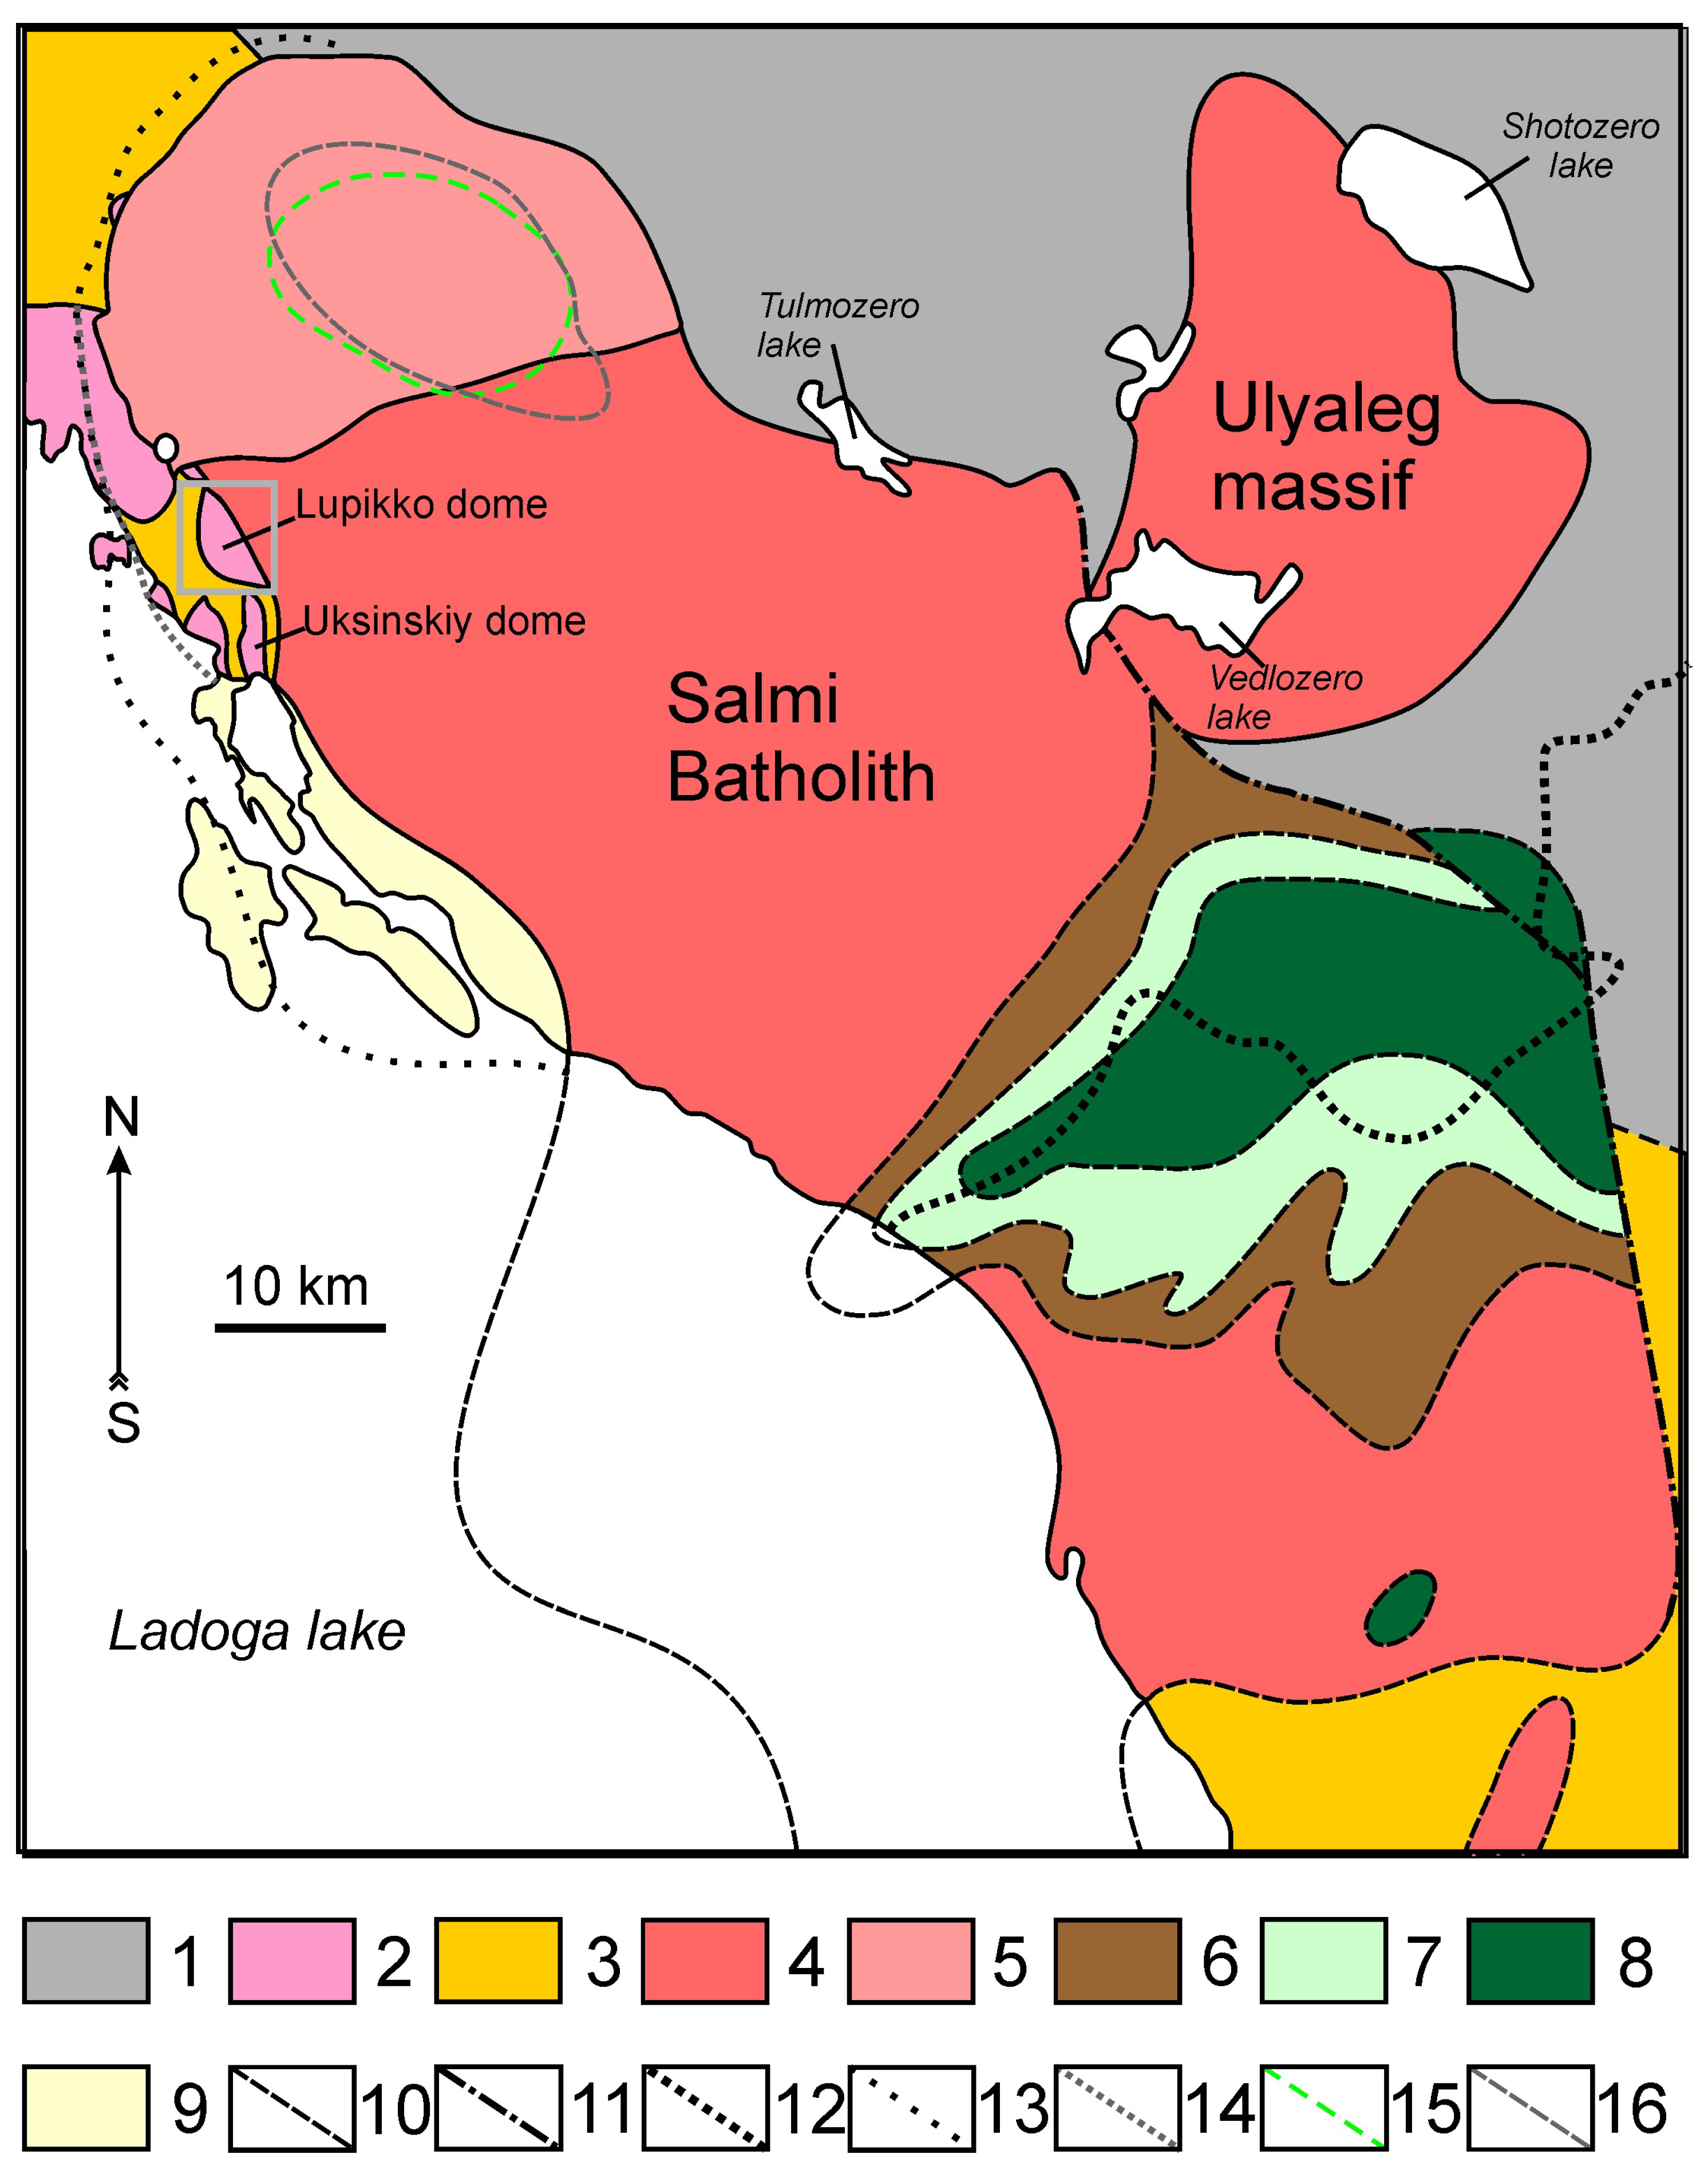
2. Geological Setting

The Salmi batholith is located at the southern tip of the Raakhe-Ladoga zone on the border of the Svekofennian orogen and the Karelian domain on the northeastern shore of Lake Ladoga (Figure 1). It is assumed that this area unites a number of intrusives, such as Salmi, Ulyaleg, and Svirsky (Lodeynopolsky) [25].
The age of the batholith, estimated by the U-Pb system in zircons, is 1547–1530 Ma [9,27]. Biotite-amphibole granite occupies the largest area on the modern surface of the batholith (Figure 2). Biotite granite and rare metal, topaz-bearing granite are present at the northwestern tip of the batholith [21,28,29,30,31,32]. Pyroxenites, gabbro, gabbro-norite, anorthosite, quartz syenite, monzonite, and quartz diorite were discovered by drilling into the southeastern part of the Salmi batholith [33,34].
The data presented in [33] show similarities between the mafic rocks of the batholith and complex of gabbro-norite, labradorite, monzonite, and granite in other plutons, i.e., the Korosten pluton in Ukraine [39]; the Riga batholith in Estonia and Latvia [40]; and the Ahvenisto massif in Finland [41], which are ARG complexes.
A zone containing dike bodies of granite porphyry is located in the southwestern extremity of the gneiss-granite dome Lupikko (Figure 3). Granite porphyry and tuffisite dikes are present within the linear zone, lying in an echelon relative to each other [42,43]. These dikes have a thickness of 20–30 m and a length of up to 150 m [44]. The current author studied these granite porphyry dikes at two points (Figure 3). Igneous rocks of the Salmi batholith are gently submerged under the meta-sedimentary rocks of the upper Archean–lower Proterozoic. According to [35], the roof of the Salmi batholith in the considered area lies at a depth of tens to hundreds of meters from the surface. The angle of the roof inclination changes sharply to subvertical near the shoreline of Lake Ladoga (Figure 2).
An analysis of the literature, as well as the current author’s field observations, allowed the relative positions of the granite porphyry dikes to be established. They were formed after Sortavala series marbles through sulfide mineralization related to scarns, because these rocks break through by dikes and were found to contain xenoliths. Moreover, the dikes became injections after the formation of biotite-amphibole granite (wiborgite) and fine equigranular granite [45].
Granite porphyry is intersected by dikes of extra-differentiated granites that are identical in geochemistry to the dike complex of rare-metal topaz-”zinnwaldite” (siderophyllite-polylithionite) granites [32].
Based on these data, the time at which the granite porphyry dike intrusion formed is limited by its intersection with the polylithionite-siderophyllite granite dikes that are widely developed in the area of the Uksinskiy gneiss-granite dome. The U-Pb age of granite porphyry dikes, as determined by the LA-ICP-MS method, is 1541 ± 9 Ma [45]. This falls within the limits of the interval of formation for different rocks from the Salmi batholith, in which six magmatic pulses were released [27]. It is not possible to attribute the formation of dikes to an isolated magmatic pulse due to the large analytical error involved (±9 Ma).
Figure 3. Geological scheme of the Lupikko gneiss-granite dome and its framing, the position of the object under study, compiled by the current author with consideration of the material presented in [32,42,46]. 1–2 dome “Lupikko” (AR2-PR1): 1—gneiss-granite, 2—intradome bodies of gabbro-amphibolite; 3–4 Sortavala group (PR1, Pitkäranta suite): 3—scarnified marbles, pyroxene and garnet scarns, 4—amphibolized basalts and gabbro-amphibolites with interlayers of graphite-containing amphibole and quartz-feldspar-biotite schists; 5—Ladoga formation (PR1), biotite-quartz and quartz-feldspar-biotite schists; 6–7 svecofennic orogenic complex: 6—migmatites associated with pegmatites from quartz-biotite schists of the Ladoga formation, 7—pegmatites; 8–9 complex of mesoproterozoic anorogenic granites from the Salmi batholith: 8—biotite-amphibole granite (Rapakivi), 9—highly evolved topaz-bearing Lithian-siderophyllite granite; 10–12 complex of mesoproterozoic basic rocks associated with Valaam sill of gabbro-dolerite: 10—fine–medium-grained porphyritic gabbro-dolerites, 11—medium-grained gabbro-dolerites, 12—coarse-grained gabbro-dolerites; 13—main faults, 14—the linear zone to which the granite-porphyry dikes are confined; and 15—sampling points.
Minerals 13 00527 g003

3. Materials and Methods

This study included acidic rocks of the Salmi batholith that were selected during field work from 2017 to 2020. A detailed petrographic study was conducted using optical microscopy with transparent, reflected, and polarized light. The concentrations of major elements in the granite rocks were determined by wet chemistry and XRF, and trace elements were determined by ICP-MS by dissolving the samples in an autoclave. When preparing samples for analysis, xenoliths present in the rocks under study were removed with a diamond circular saw, pre-sawing into plates with a thickness of 5 mm.
Major elements in sample AK270820-1 and the F concentration in all samples were determine by X-ray fluorescence at the Institute of Geology of Ore Deposits, Petrography, Mineralogy, and Geochemistry of the Russian Academy of Sciences (IGEM RAS, Moscow, Russia) by Yakushev A.I., using an WD spectrometer (Axios mAX PANalytical). The specrometer was equipped with an X-ray tube with a 4-kW Rh anode. The maximum rated tube voltage of this equipment is 60 kV with a maximum anode current of 160 mA. For the calibration of the spectrometer, industry and state standard samples of the chemical compositions of rocks and ores were used. Quality control of the analysis results was performed on standard samples of rocks from the US Geological Survey (USGS), Denver, USA. Wet chemistry investigations were also conducted for the major elements at the Institute of Geology of the Karelian Research Centre at the Russian Academy of Sciences (IG KarRC RAS, Petrozavodsk, Russia) by Demeshina L.M.
Trace elements were identified in rocks with the ICP-MS method using an X Series 2 (Thermo Scientific, Bremen, Germany) mass spectrometer. The powdered samples were digested in an acid mixture in IG KarRC RAS by Echova M.V., Utitsyna V.L., and Paramonov A.S., following the standard procedure [47]. The accuracy of the analyses was monitored by analyzing the GSP-2 (USGS), SGD-2A, and SG-4 standards [48]. The results are presented in the Supplementary Materials (Table S1).
Zircon was separated from the rock by dissolving it in hydrofluoric acid (chemical pure, 45%) without additional heating. In order to avoid contamination with xenogenic zircon, before dissolution, the rock was sawed for the subsequent removal of xenoliths of earlier rocks. This was conducted in the same way as when preparing samples for chemical analysis. The internal structure of zircons (66 grains) was studied using monochromatic cathodoluminescence in the range of 185–850 nm on a Tescan MIRA 3 electron microscope at the Vernadsky Institute of Geochemistry and Analytical Chemistry RAS (GEOKHI RAS), by Demidova S.I. and Lorentz C.A. The analyses were conducted at a working distance of 17 mm with carbon coating.
The trace element composition of zircons was determined using secondary ion mass spectrometry (SIMS) (Cameca IMS-4a) at the Yaroslavl branch of the Institute of Physics and Technology of the Russian Academy of Sciences (YB IPT RAS) by Simakin S.G. and Potapov E.V., following the standard procedure. A description of the methodology and an estimate of the measurement error are given in [49]. The results are presented in the Supplementary Materials (Table S2)
Inclusions of mineral-forming media were studied using optical microscopy and were brought to the surface by polishing to clarify the features in their internal structures as well as their phases and elemental compositions. Then, the grains with inclusions were mounted in epoxy resin for further study using a Tescan MIRA 3 electron microscope equipped with an X-MAX energy dispersion spectrometer in GEOKHI RAS by S.I. Demidova.
Zircon grains with optically distinguishable sulfide inclusions were heated to 1000 °C for 6 h using an internally heated gas-media device “UVGD10000” (“gas bomb”) with an argon pressure of 150 MPa in the Institute of Experimental Mineralogy of the Russian Academy of Sciences (IEM RAS) by Terekhin A.A. and Kuznetsov N.I. After heating, quenching was conducted for the homogenization of inclusions. Homogenization was required for the determination of the initial chemical and phase composition. Quenching was performed under isobaric conditions by dumping the heated sample into a cold area. The pressure in the experiment was selected as 100–200 MPa based on previous research on the physical parameters of batholith rock formations [50,51]. Zircon grains with homogenized sulfide inclusions were mounted in epoxy resin and brought to the surface by polishing. The homogenized sulfide inclusions were studied by X-ray spectral microanalysis on a CamScan MV2300 electron microscope with an energy dispersive spectrometer (IEM RAS) by Van K.V. The analyses were conducted with an electron beam at an accelerating voltage of 20 kV at a working distance of 15 mm with carbon coating.
The study of the trace element composition of sulfide melt inclusions was carried out at the IGEM RAS by Abramova V.D. Measurements were made by ablation with an ESI NWR213 laser ablation microprobe coupled to a Thermo X-Series II quadrupole ICP-MS. For all sessions, ablation took place in ultrapure helium flowing at a rate of 600 mL/min. The vaporized material and helium were mixed with Ar (0.8 L/min) before entering the torch. For the external calibration of most elements, the following standard reference material (SRM) was used: MASS-1 [52] polymetal sulfide (USGS) with 33S as the internal standard based on electron probe microanalyzer (EPMA) measurements; plasma RF power, 1200 W; plasma gas flow, 750–800 mL/min Ar; dwell time, 10 ms per analyte; laser type, Nd:YAG; wavelength, 213 nm; repetition rate, 10–20 Hz; spot diameter, 20 μm; and scan speed, 7 μm/s. The concentrations of 59Co, 60Ni, 65Cu, 66Zn, 75As, 77Se, 95Mo, 101Ru 103Rh, 105Pd, 107Ag, 111Cd, 115In, 118Sn, 121Sb, 125Te, 185Re, 193Ir, 195Pt, 197Au, 202Hg, 205Tl, 208Pb, and 209Bi were determined by this method. Seventeen homogenized melt sulfide inclusions and one nonheated substantially sphalerite melt inclusion were studied. The results are presented in the Supplementary Materials (Table S3)
After heating, all sulfide inclusions in zircon became homogeneous in reflected light as well as in back-scattered electron images. It is known that sulfide melt is difficult to quench [53,54]. However, rapid quenching does not lead to significant differentiation of the substance. No significant fluctuations in the proportions of the major elements (Fe-Cu-S) occurred when using EPMA. It was also found that homogenized sulfide inclusions are better when they are polished compared to unheated ones, which are extremely fragile.

4. Results

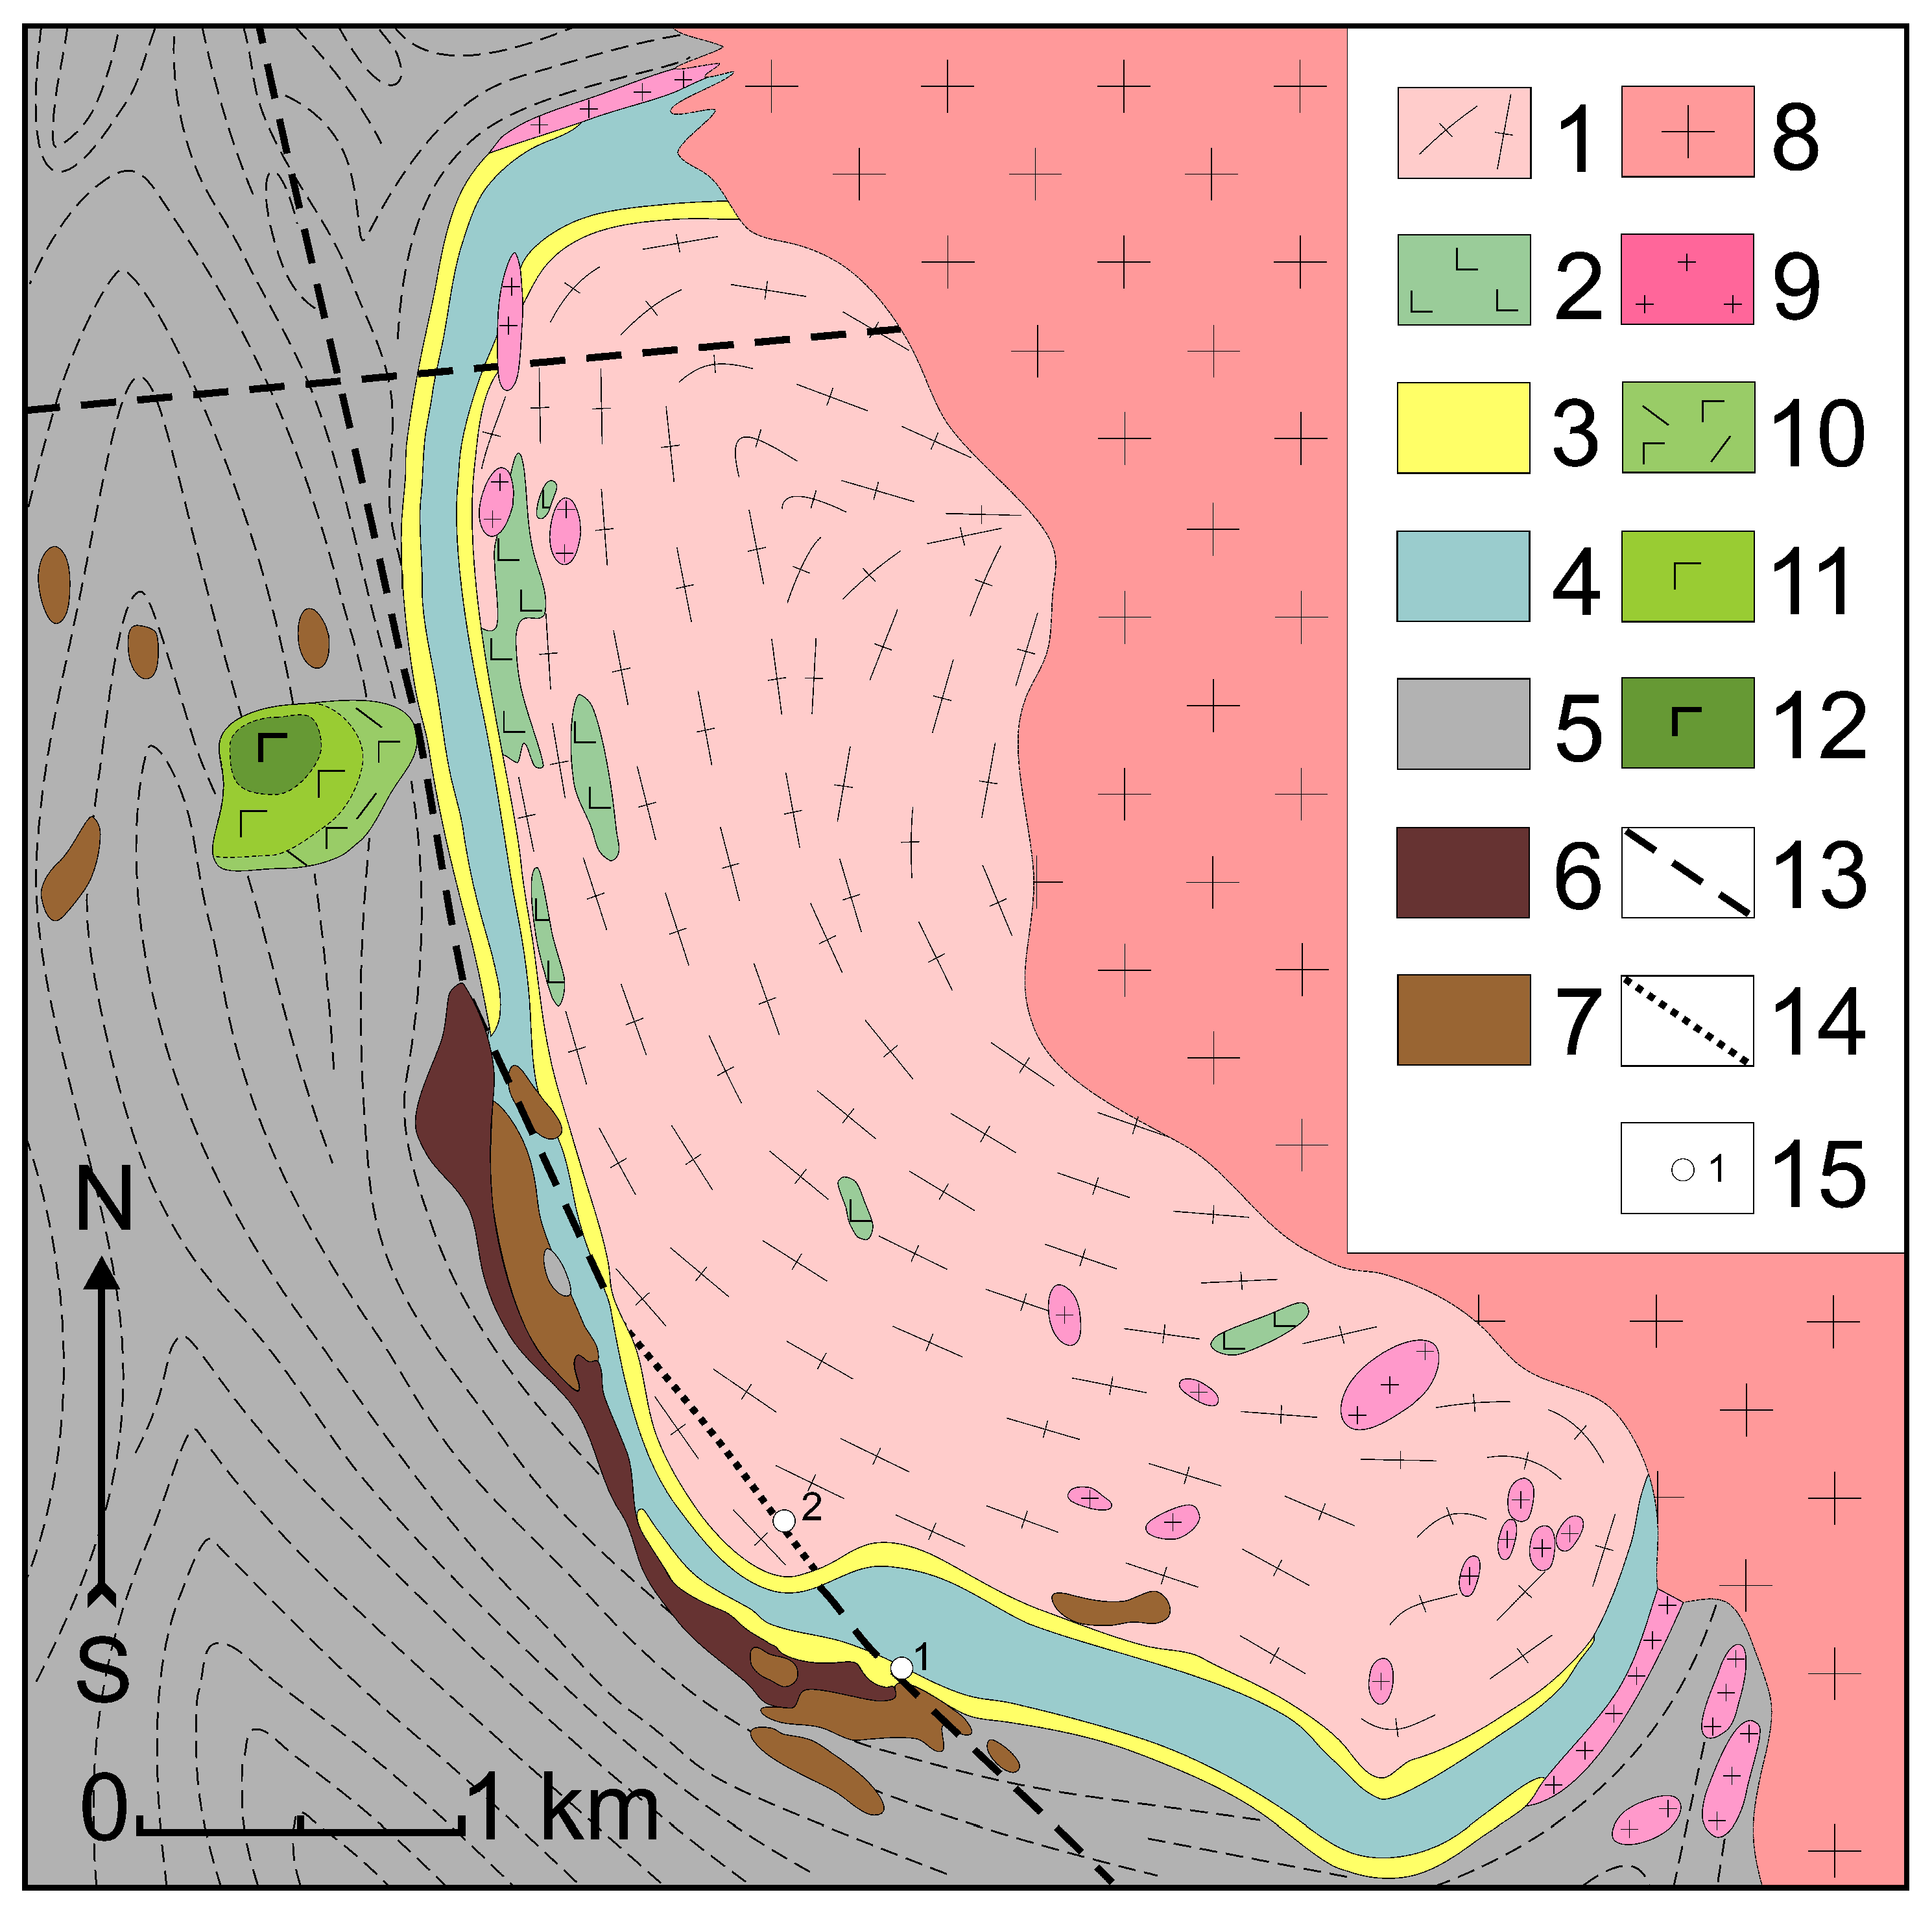
4.1. Brief Characteristics of the Geological Setting of the Granite Porphyry Dikes

The current author studied two dikes of granite porphyry. The first dike (Dike 1) is located in the southeastern part of the extended linear zone described in [42,43,44] on the side of a flooded pegmatite quarry (point 1 in Figure 3). Directly at the water’s edge, there is a radical output of granite porphyry (sample AK220617-1) with brown ground mass, in which xenoliths of rapakivi granite (wiborgite) with characteristic oligoclase edges are located around ovoids of potassium feldspar, quartz-biotite-feldspar gneiss (AR2-PR1), and mica schist of the Ladoga Formation. The distribution of the xenoliths is uneven, from granite porphyry to breccia with granite porphyry cement. The size of the xenoliths is from several mm to 30–40 cm. At 15 m from the exit of the bedrock, there are rock dumps represented by the same granite porphyry with a lighter (fresher) ground mass (sample AK220617-1_2, Figure 4).
Two types of xenolith are present, i.e., host rocks and older granite, namely (I) quartz-biotite-feldspar gneiss (AR2-PR1), amphibolites and mica schists of the Sortavala series and the Ladoga Formation (PR1), scarnified marbles of the Sortavala series with various types of ore and sulfide mineralization, and (II) fragments of granites of earlier phases, such as biotite fine-grained granite (samples X#1 and X#2), (Figure 5, No. 1) and biotite-amphibole granite of rapakivi with the “rapakivi” texture (wiborgite) (Figure 5, No. 2).
The root outlet of the second granite porphyry dike (dike 2, point 2 in Figure 3), measuring 120 m × 20 m, is located 500 m northwest of the first one, within the previously marked linear zone in the granite-gneiss of the Lupikko dome (AR2-PR1) (Figure 3). The rocks also contain xenoliths of quartz-biotite-feldspar gneiss and amphibole-biotite granite, the number of which is greater in the marginal part of the dike. Samples AK230619-3 and AK230619-4 were selected from this outcrop for research. This dike is intersected by a 40 cm width dike of highly evolved rare-metal granite (sample AK230619-1). These samples are characterized in [45].

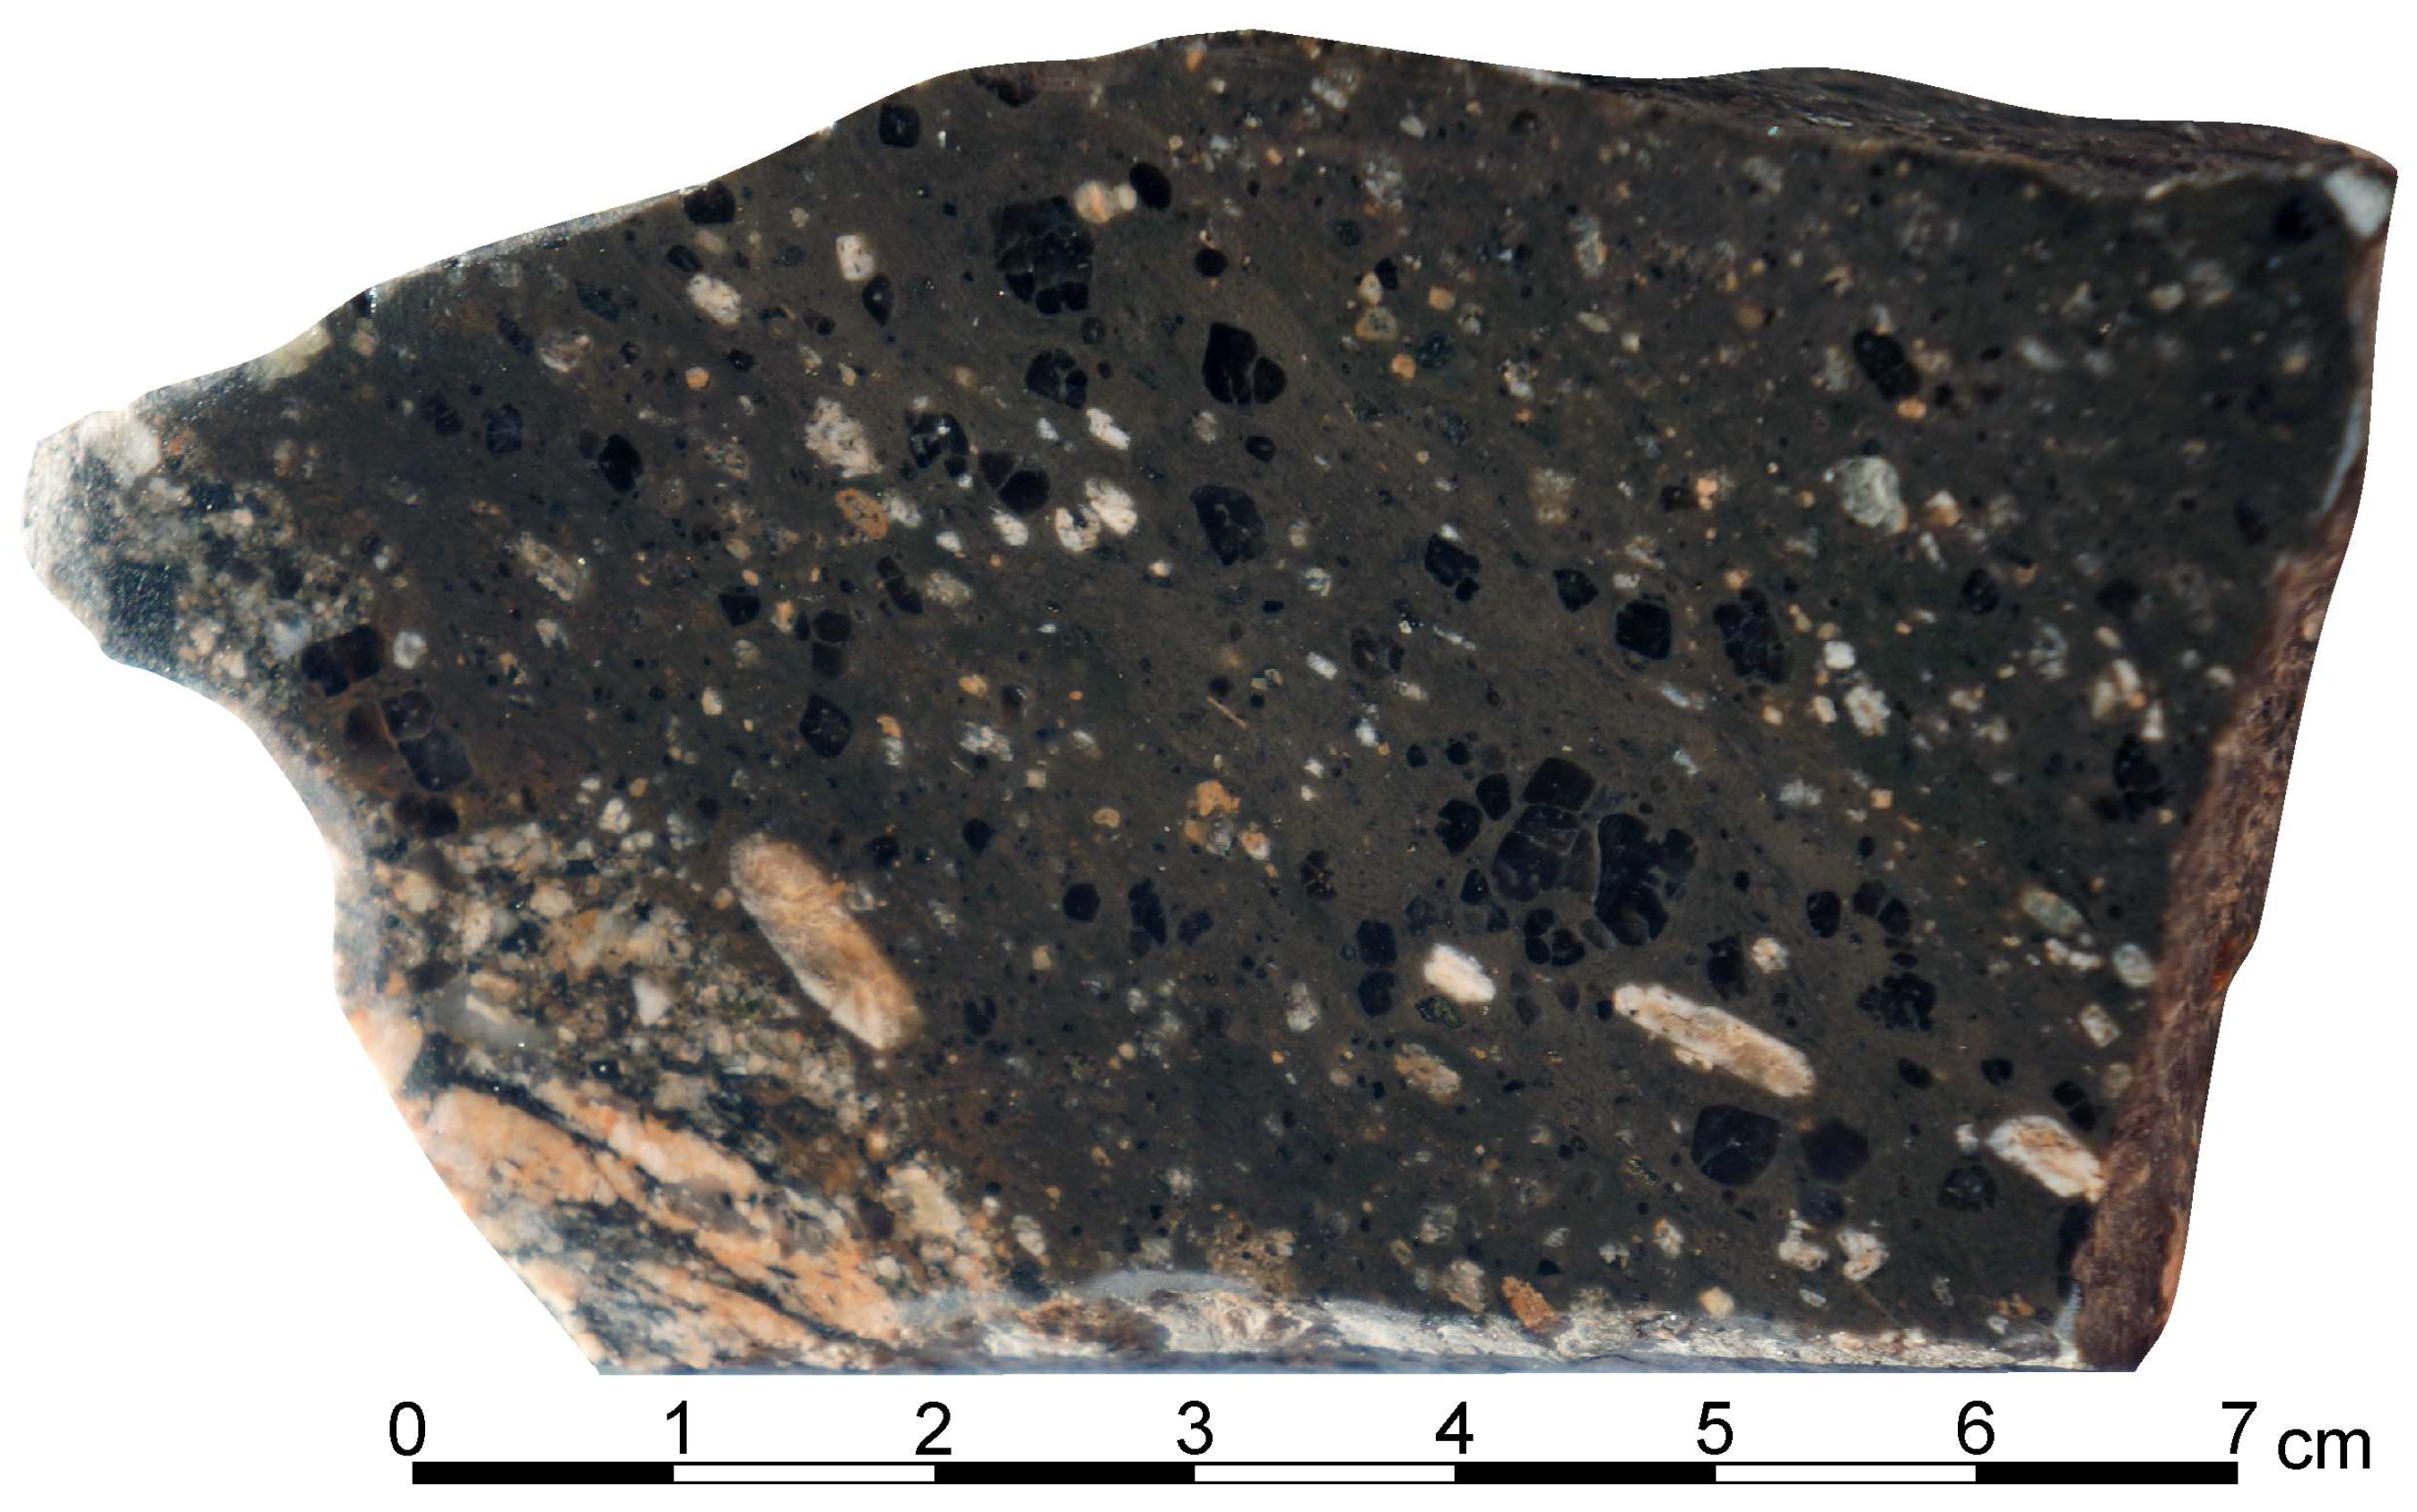
4.2. Petrography of the Granite Porphyry Dikes

Granite porphyry rocks consist of porphyry crystals of quartz, potassium feldspar, less often plagioclase, and a pinkish-gray-brown fine-grained ground mass (>50 vol.%) with the same composition. Fluidity is often in the ground mass, and elongated porphyry crystals form a trachytic texture (Figure 6a,b).
The latter comprise 10–15% to 20–30% of the rock volume. Their size varies from 0.3–1 mm to 2 cm. The porphyries are distributed irregularly in the rock, and the proportions between mineral phases are not constant, i.e., there are zones that almost completely lack feldspar crystals. In this case, the porphyry crystals are mainly represented by quartz. There is no clear correlation between the grain size and idiomorphism.
The main minerals in phenocrysts are quartz (60–70%); subordinate Kfs (20–30%), Pl (10–15%), and rare minerals, such as biotite, ilmenite, and amphibole (not more 5%). Quartz is represented by two generations: 1. large isometric crystals, up to 8 mm in width, with numerous cavities, often with block extinction; 2. smaller isometric, well-faceted dipyramid crystals with widths of up to hundreds of μm. An increase in the amount of potassium feldspar in the ground mass can be observed around quartz crystals. Potassium feldspar is represented by two types of crystal: 1. elongated with rounded edges which, as a rule, were strongly modified by secondary processes (several centimeters in cross-section); and 2. iridescent with bluish tones and slightly elongated skeletal crystals with well-defined external crystallographic shapes up to several millimeters in length. Plagioclase (oligoclase-andesine) is represented by isometric idiomorphic crystals of up to 10 mm in cross-section (An 23–37). Sometimes, a core with a different composition is found inside such crystals, and there is an aggregate corresponding to granite paragenesis in terms of its composition.
Often, there are also xenomorphic amphibole crystals (ferrogastingsite, Mg# 0.02) in rocks. They have pleochroism in greenish-brown tones and are up to several millimeters in cross-section.
The ground mass is represented by quartz, potassium feldspar, plagioclase, biotite, and amphibole. The grain size is from the several to tens of micrometers. The enrichment of potassium feldspar and dark-colored minerals often takes place around porphyry quartz phenocrysts. The accessory minerals include zircon, apatite, ilmenite, pyrrhotite, chalcopyrite, pyrite, sphalerite, rutile, galena, molybdenite, and fluorite.
The accessory minerals are distributed unevenly in the bulk mass. Sometimes, “nodule” separations ranging from hundreds of micrometers to a few millimeters are observed in the groundmass. These contain apatite, ilmenite, zircon, and fluorite with an increasing presence of Mg and Fe by the biotite and amphibole (Figure 7 and Figure 8).
Pyrrhotite forms tabular skeletal crystals of up to 150–200 μm in size in the bulk mass. Very often, they are represented by xenomorphic grains of up to 100 μm in size in “nodules”. Some “nodules” are shown isometrically on chalcopyrite grains in sizes of up to 50 μm. The surfaces of the faces have a skeletal shape. Sphalerite is a rare mineral with an average grain size of 50–70 μm. It is unhedral and is associated with biotite and fluorite clusters. Molybdenite was found in the smashed sample material. It consists of isometric plates that are up to 50 μm in width. Galena is extremely rare and is located in bulk mass forming tiny grains (less than 10 μm). Pyrrhotite, chalcopyrite, and sphalerite are also found as small grains (several micrometers in width) in silicate melt inclusions in minerals.

4.3. Geochemistry of the Rocks
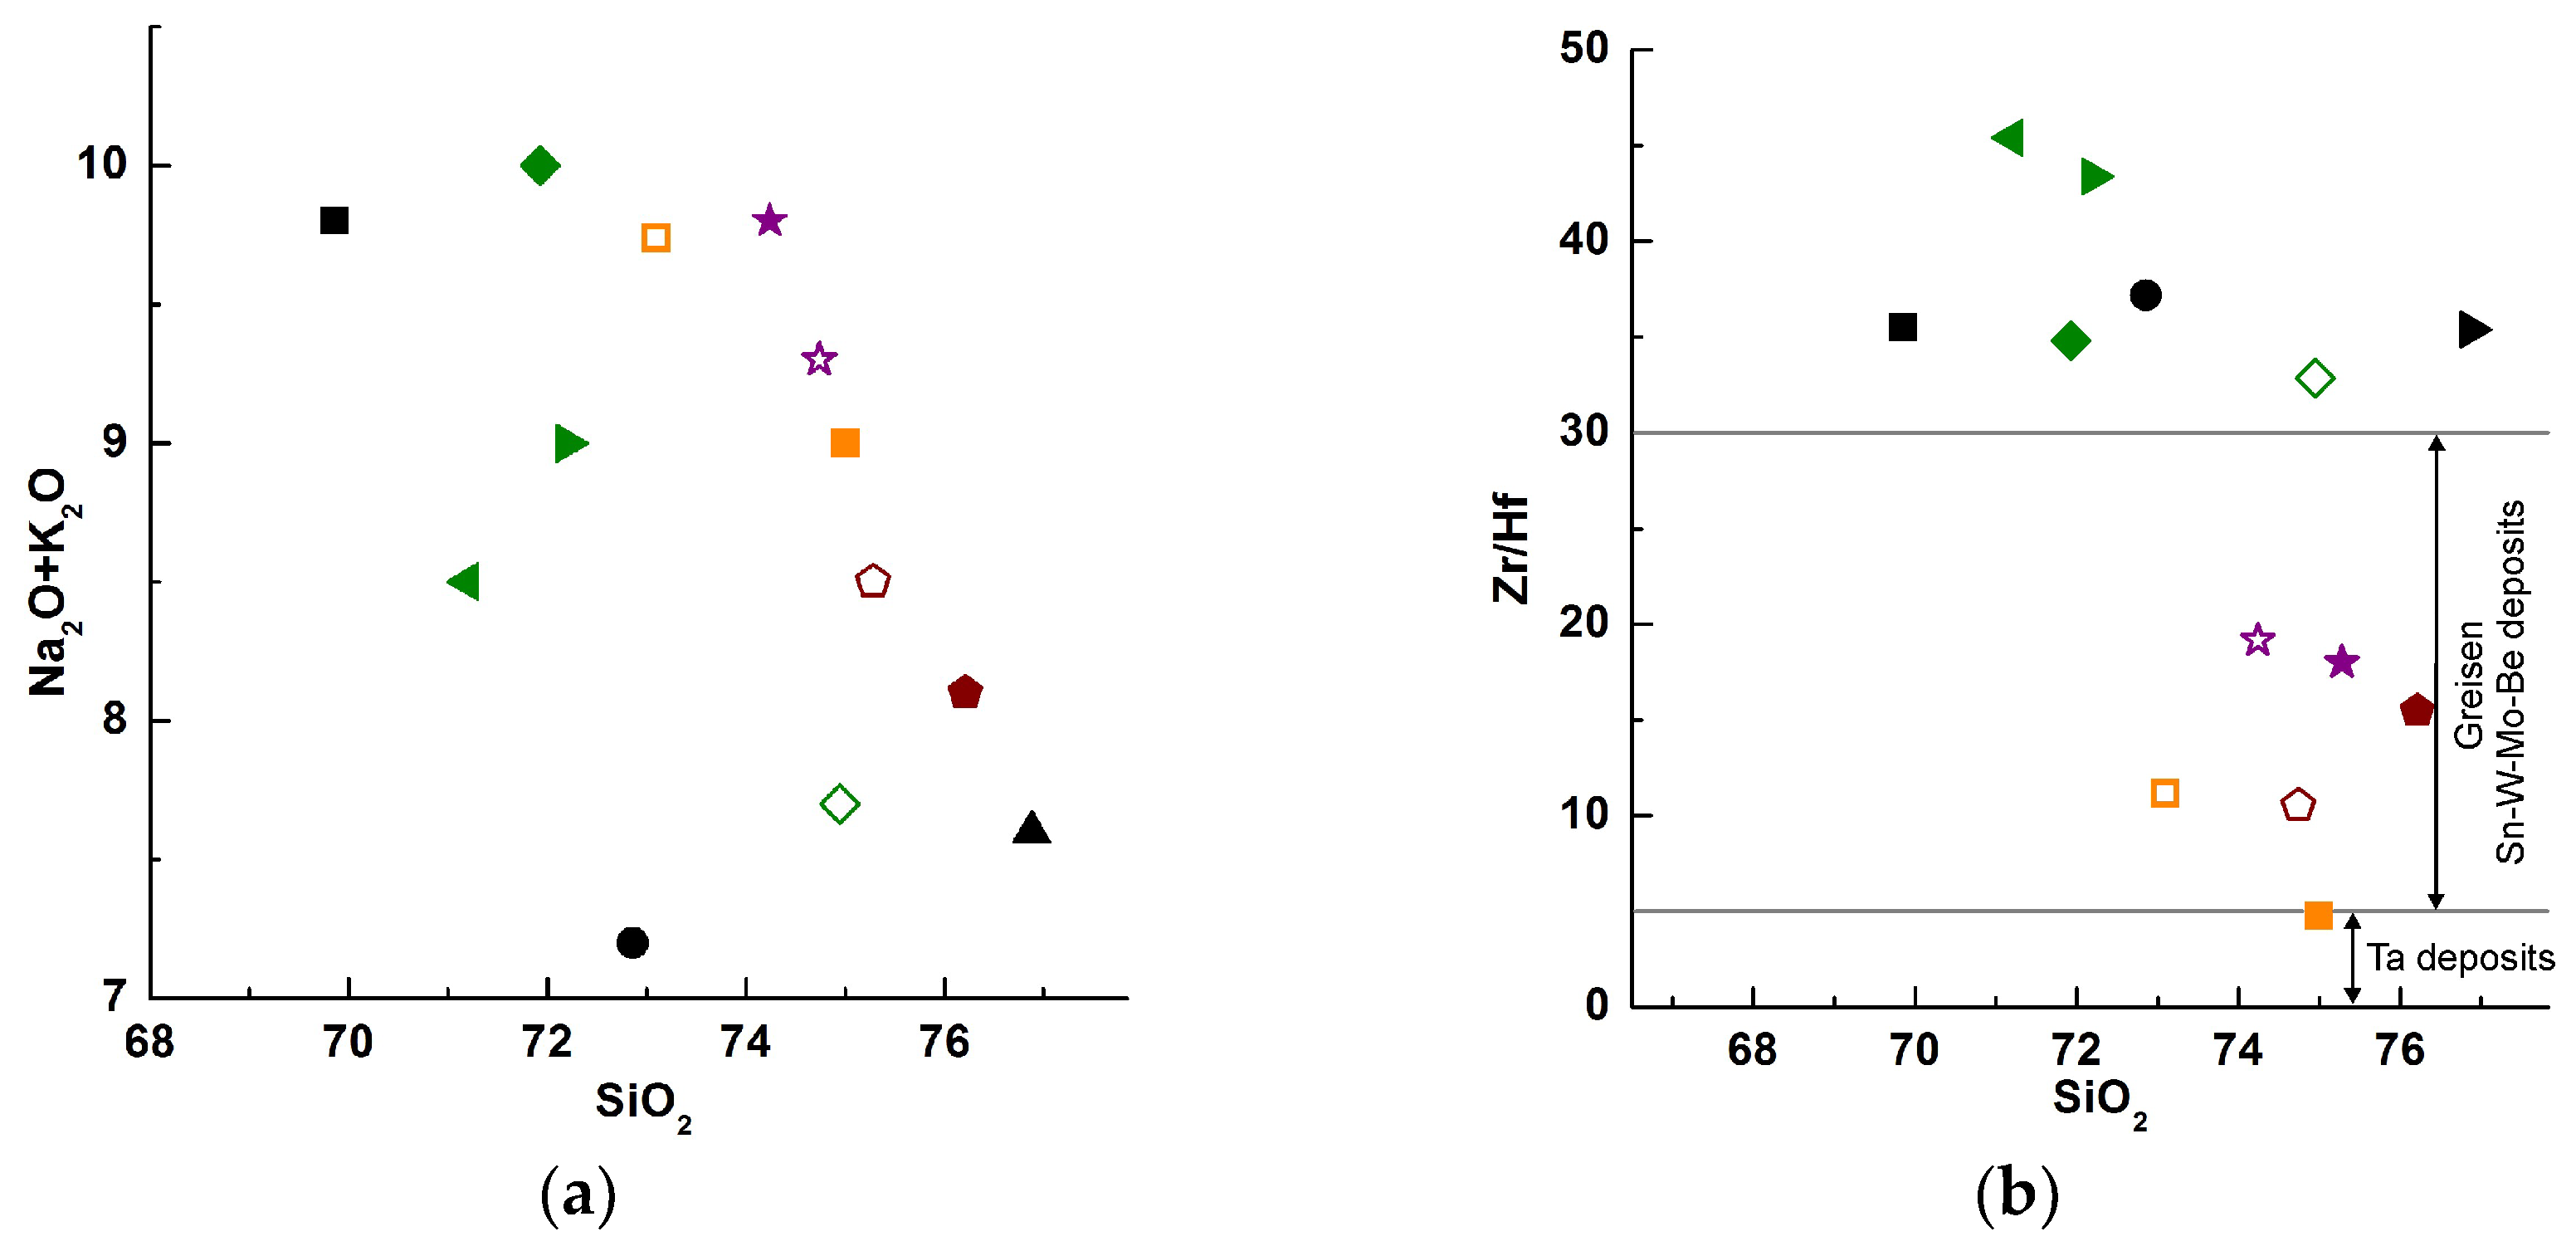
4.3.1. Major Oxides

The compositions of the granite porphyry dikes, as well as the compositions of granite xenoliths and late dikes of rare-metal granite, are presented in the Supplementary Materials (Table S1). Previously, data on rock compositions, including the AK220617-1_2 sample, were published in [32]. Additionally, for comparison, some rocks from the Salmi batholith are shown in figures below. Biotite-amphibole granite is similar to the granite porphyry, and fine-grained granite-to-granite xenolith and rare-metal dike from the Eurajoki stock (Finland) are similar to the rare-metal dike considered in this work. Fine-grained granite, according to [35], occurs in the apical parts of the body of biotite granite lying on top of biotite amphibole granite (rapakivi).
An analysis of the rock compositions in Harker diagrams (SiO2-Al2O3, SiO2-CaO, etc., Figure 9) and SiO2-Na2O + K2O diagrams (Figure 10a) indicates that the studied dikes of granite porphyry are moderately alkaline to normally alkaline granitoids.
In the process of sample preparation, as described above, the removal of obvious xenoliths and xenocrystals took place. However, as some xenoliths are only several millimeters in size, they could potentially remained in the sample. Additionally, it was impossible to confirm the complete removal of xenocrystals of similar sizes. However, in granite porphyry, the uneven distribution of feldspar phenocrystals has a greater influence on the variation in the K2O and CaO contents, as can be observed in Figure 9.
Granite porphyry and biotite-amphibole granite are characterized by increased contents of Fe, Ti, Mn, and little Na. The data presented in the Zr/Hf-SiO2 diagram (Figure 10b) show that granite porphyry is same as rapakivi granite, because the Zr/Hf ratio is higher than 30.
The tectono-magmatic discriminant diagrams [56,57] (Figure 11) show that all rocks are intraplate A-type granite. The diagrams presented by Nelson Eby [58], which usually allow the source of magma for A-type granite (crustal or mantle) to be determined, show ambiguous results in terms of whether this is the A1 or A2 subtype (Figure 12).
Figure 10. Chemical compositions of the rocks considered in the work: (a) petrochemical diagram (Na2O + K2O)–SiO2 in wt%; (b) diagram of the degree of crystallization differentiation (Zr/Hf)–SiO2 wt%, according to [59]. The legend is the same as that shown in Figure 9.
Minerals 13 00527 g010

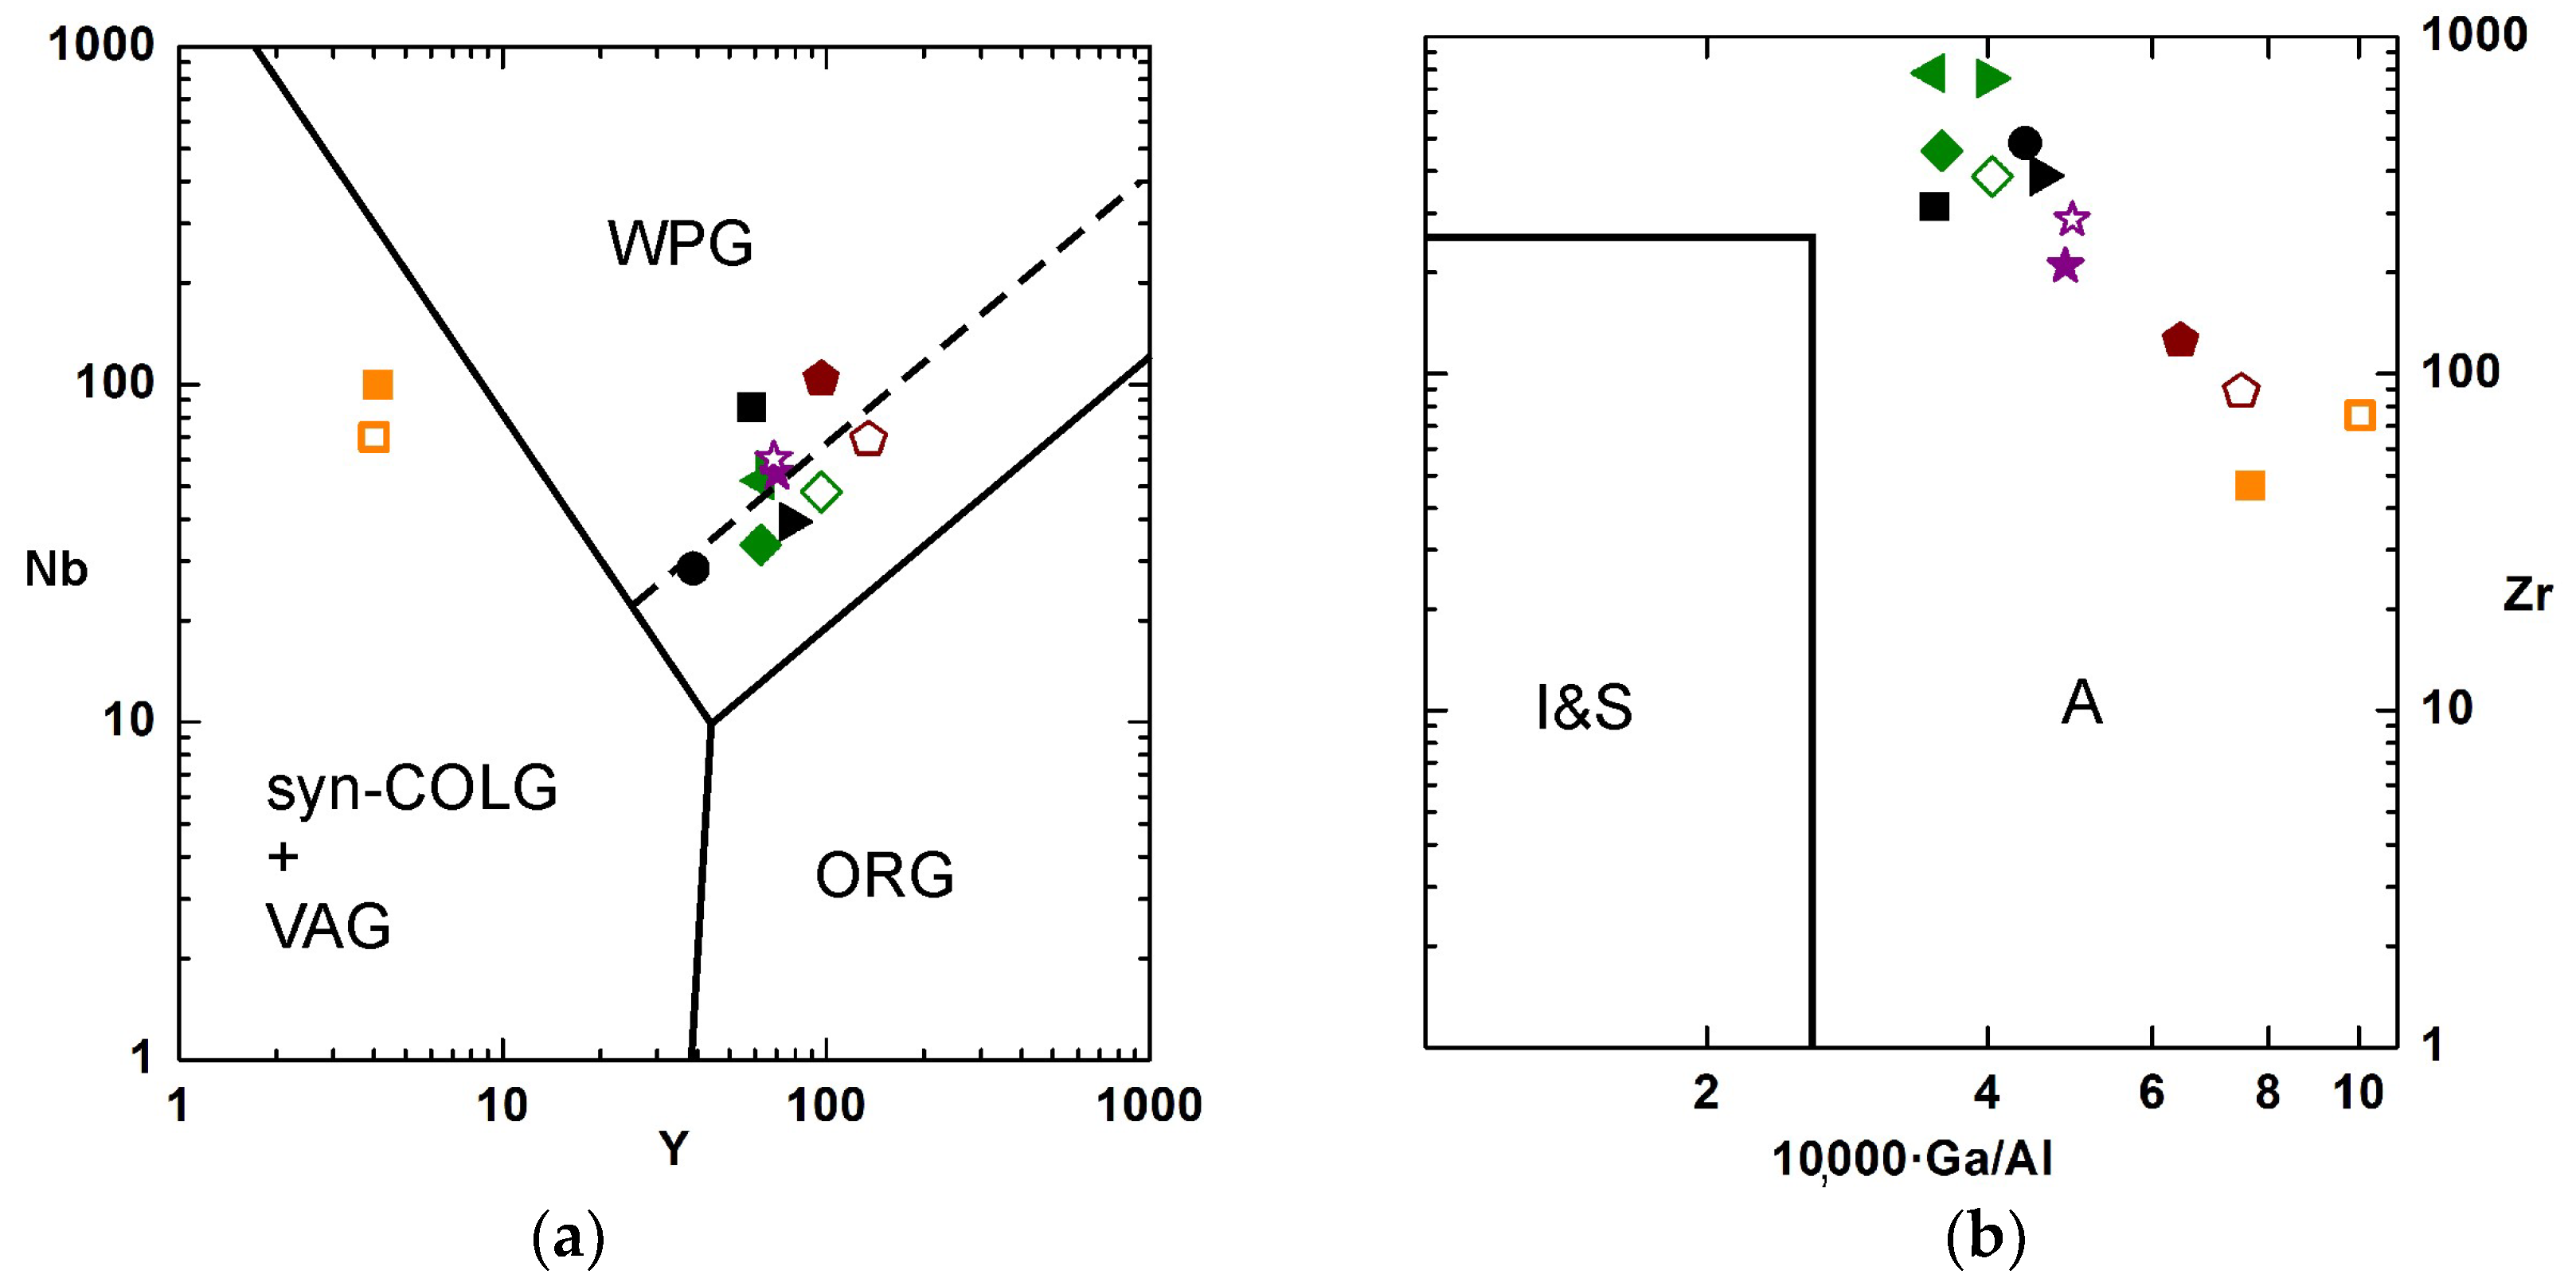
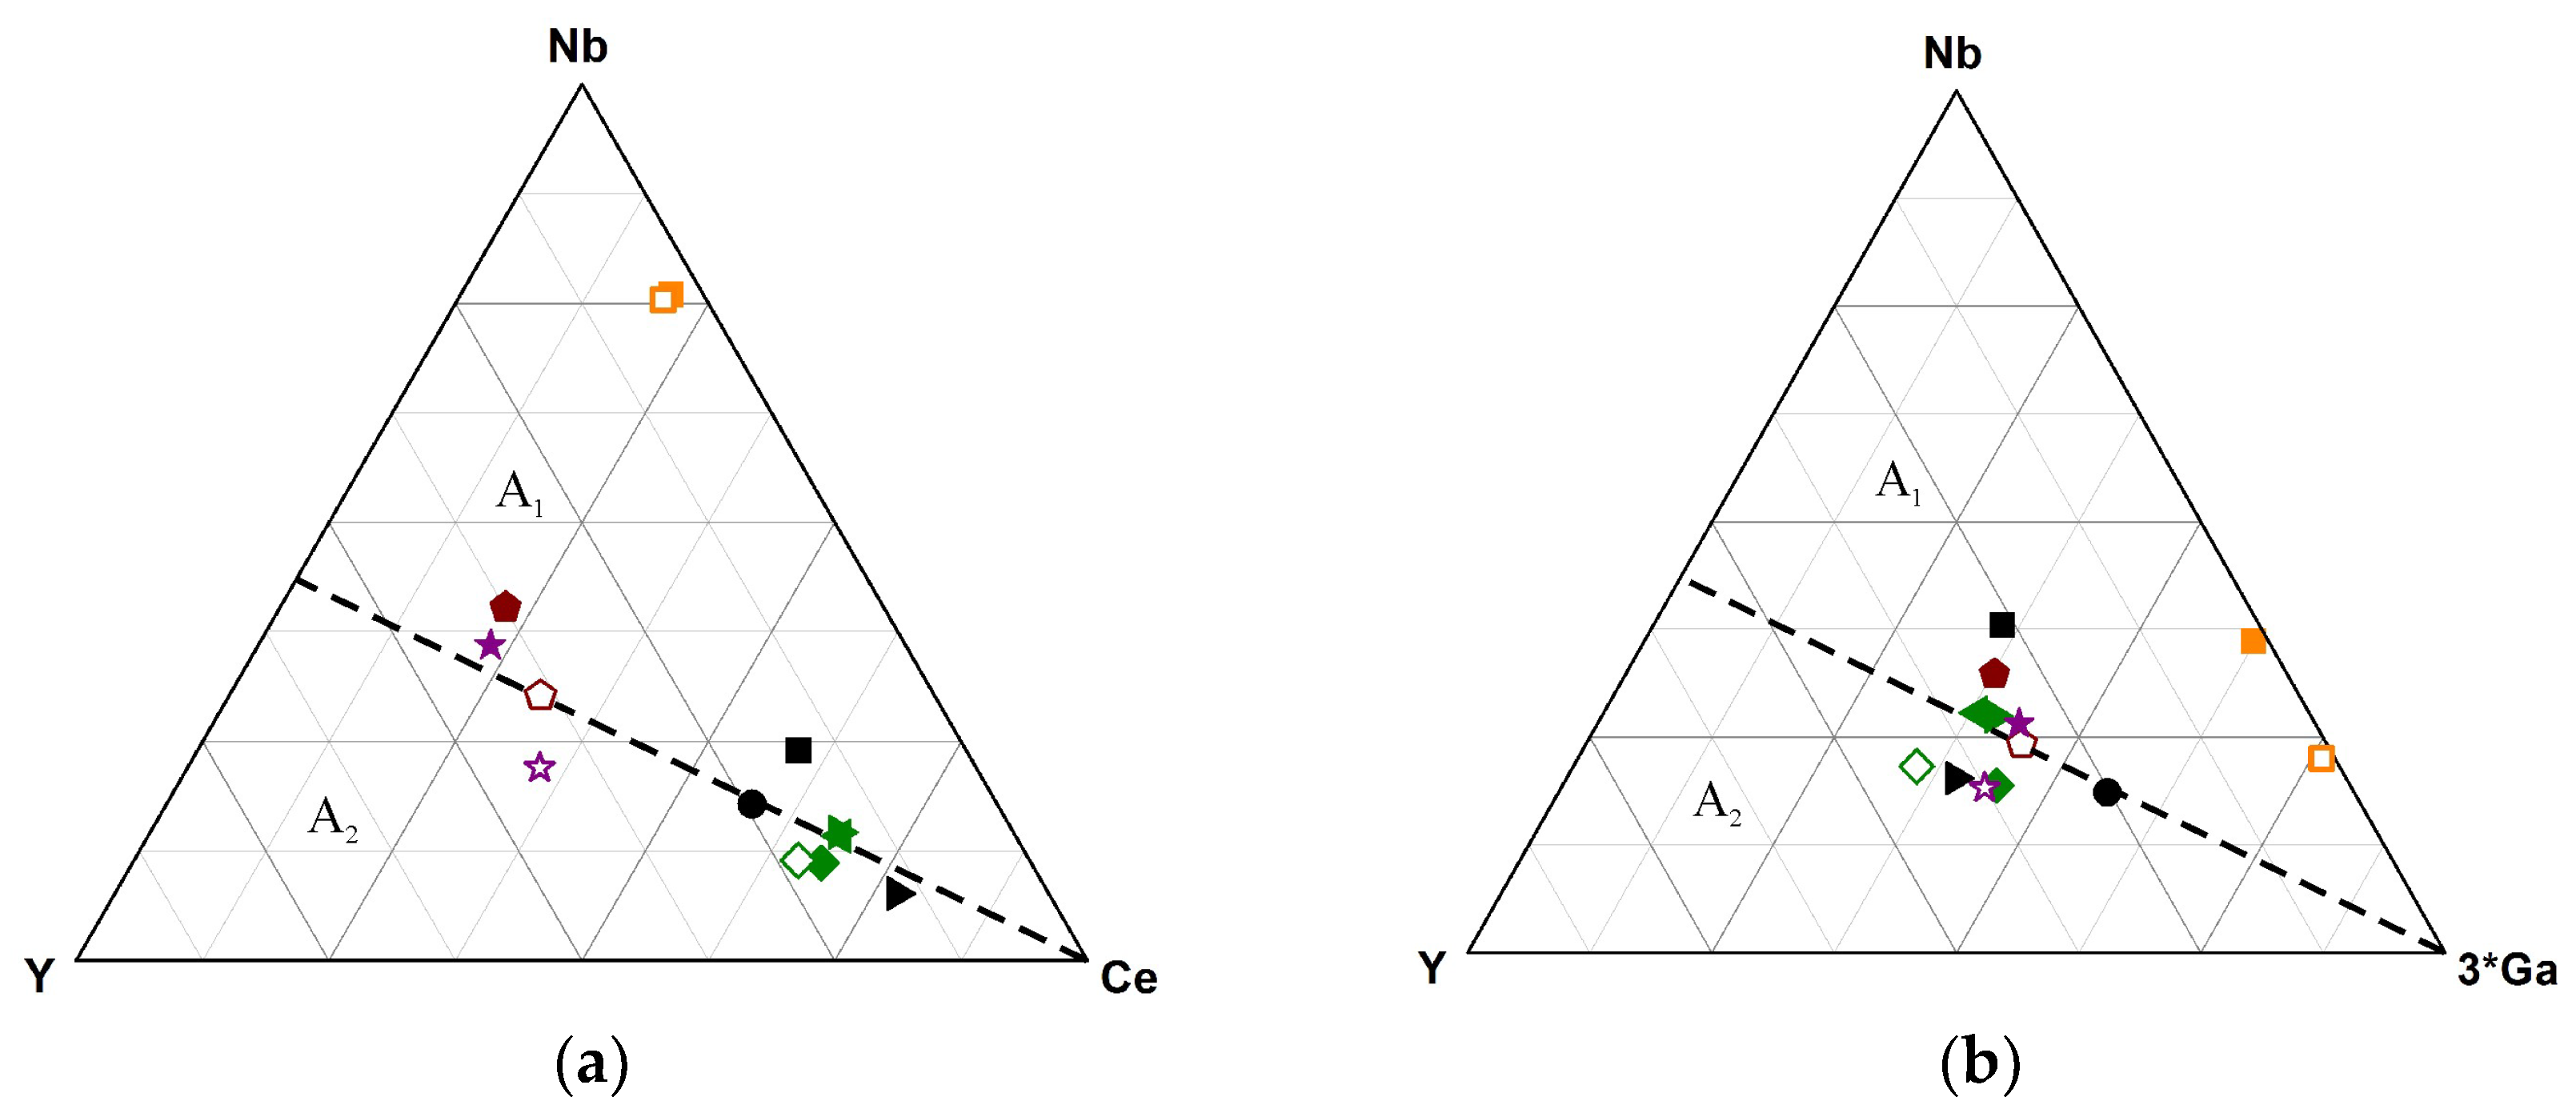
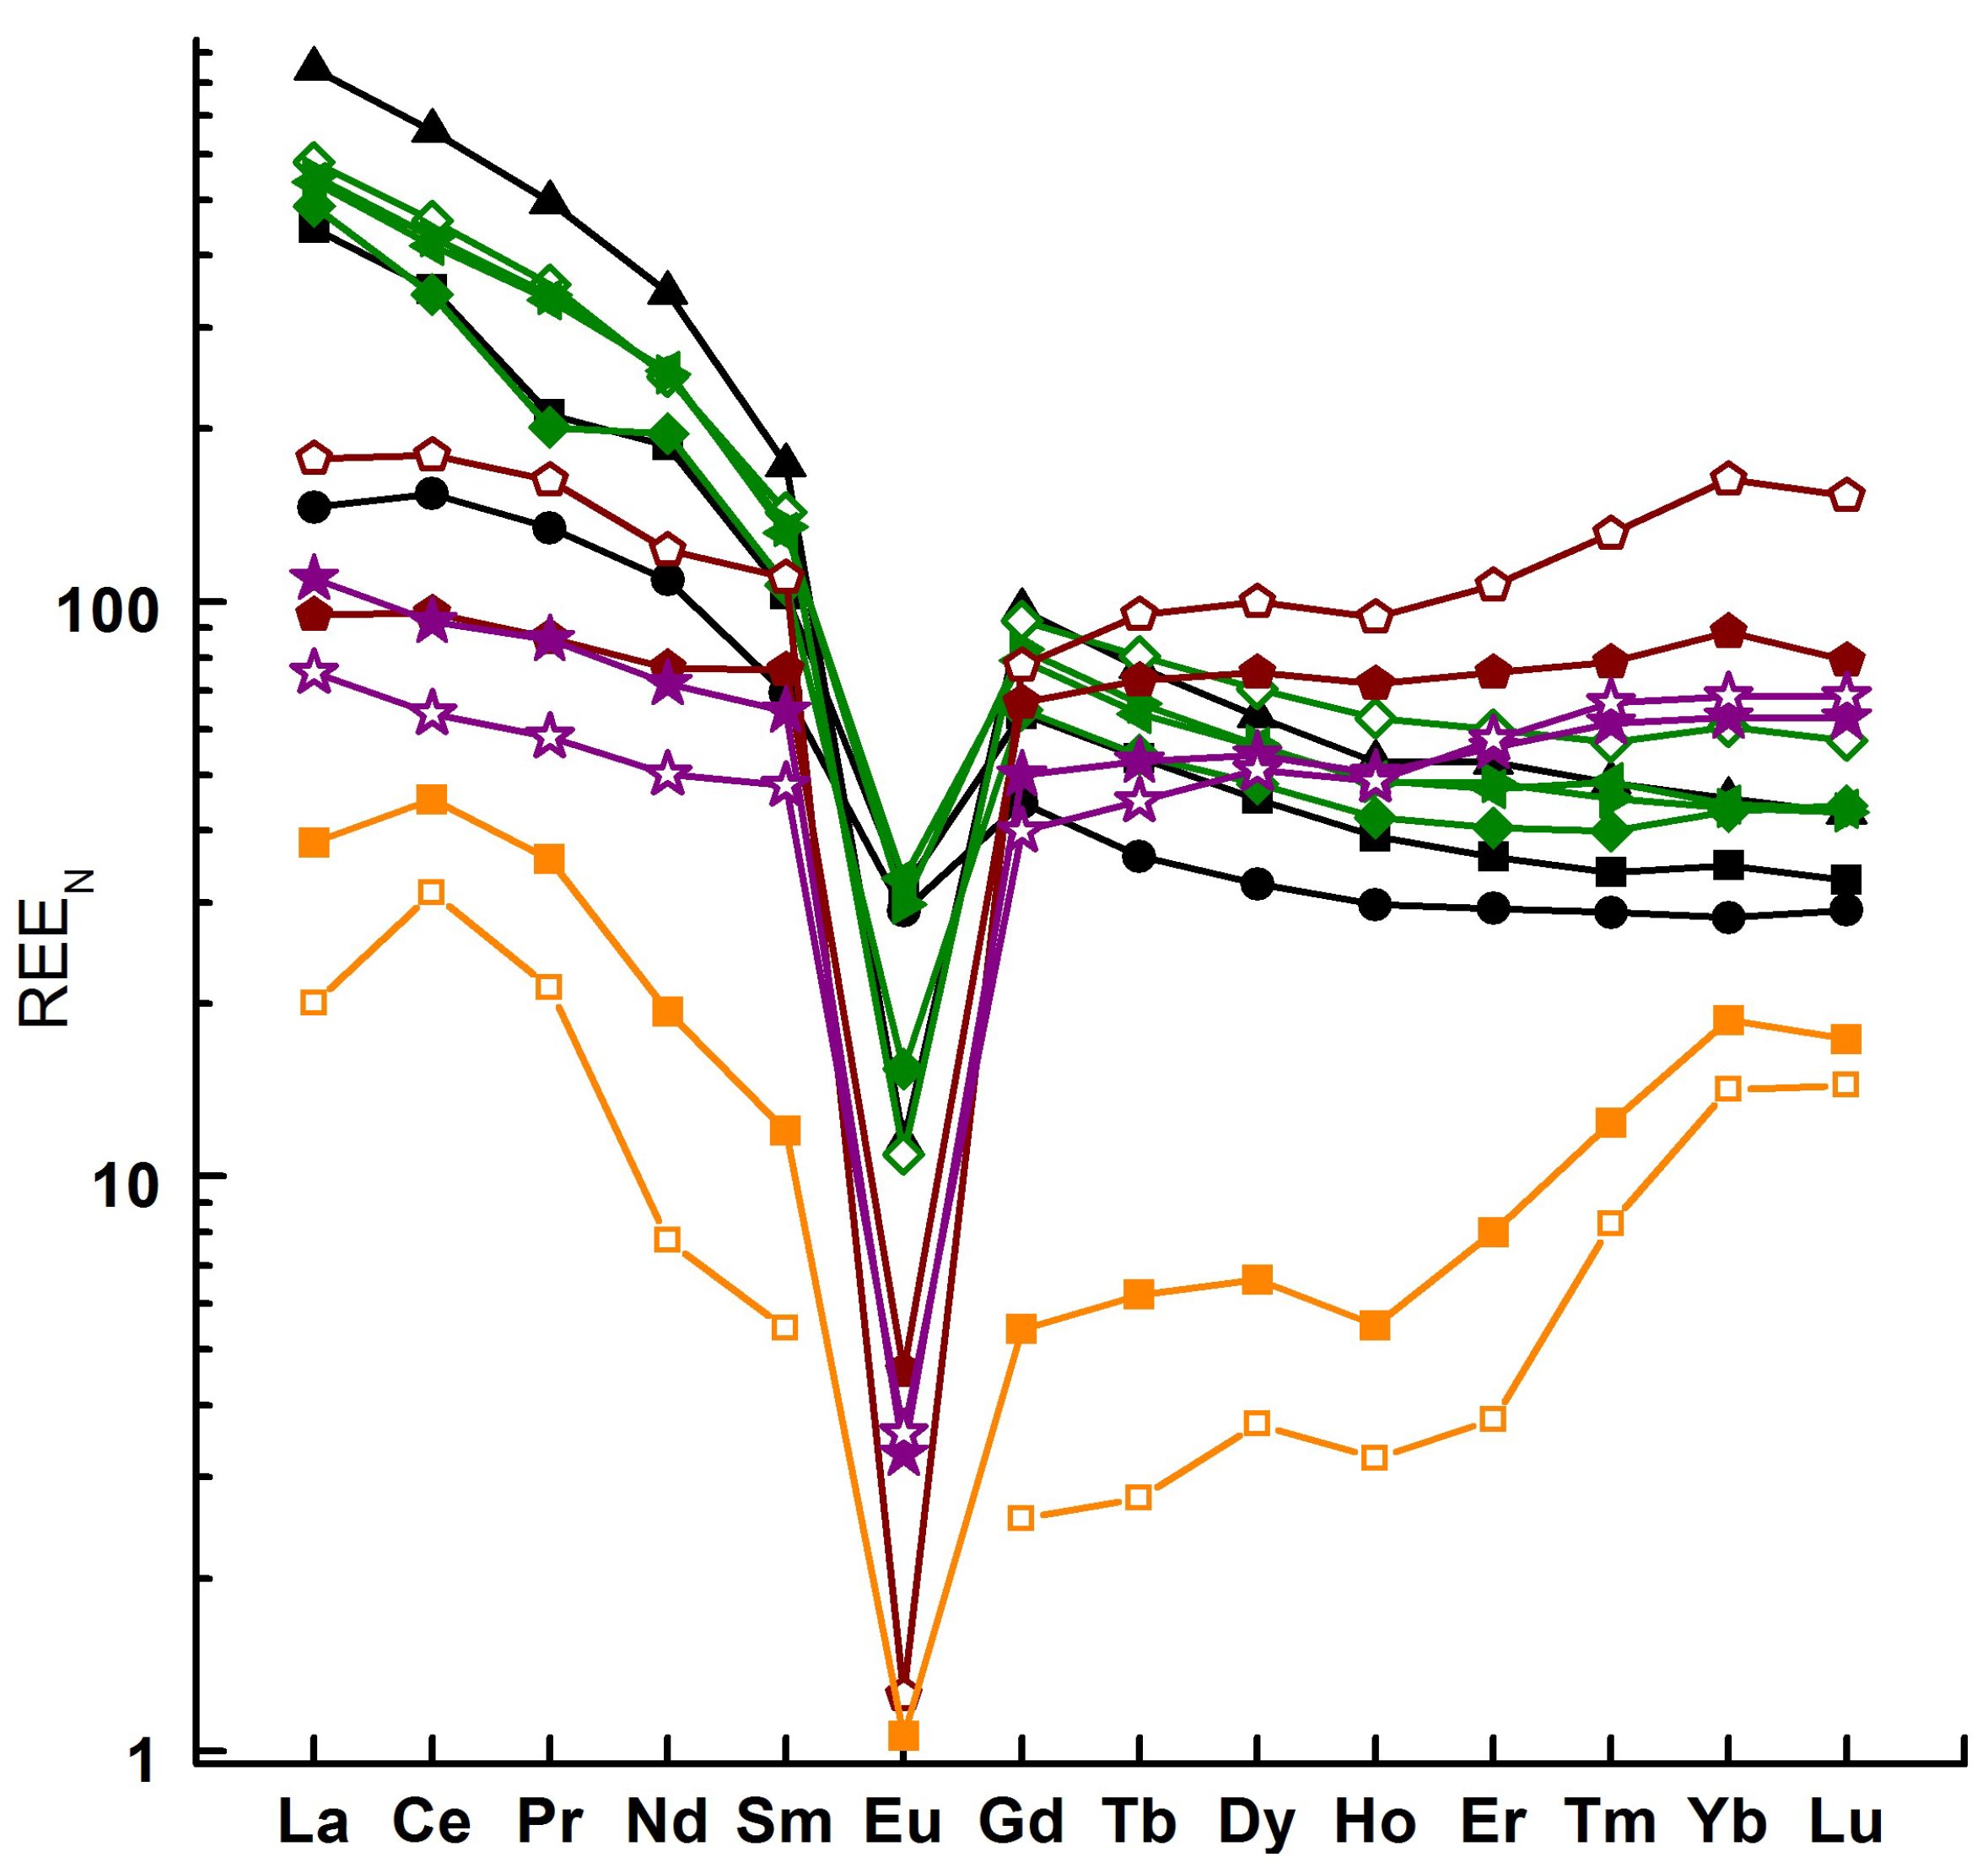
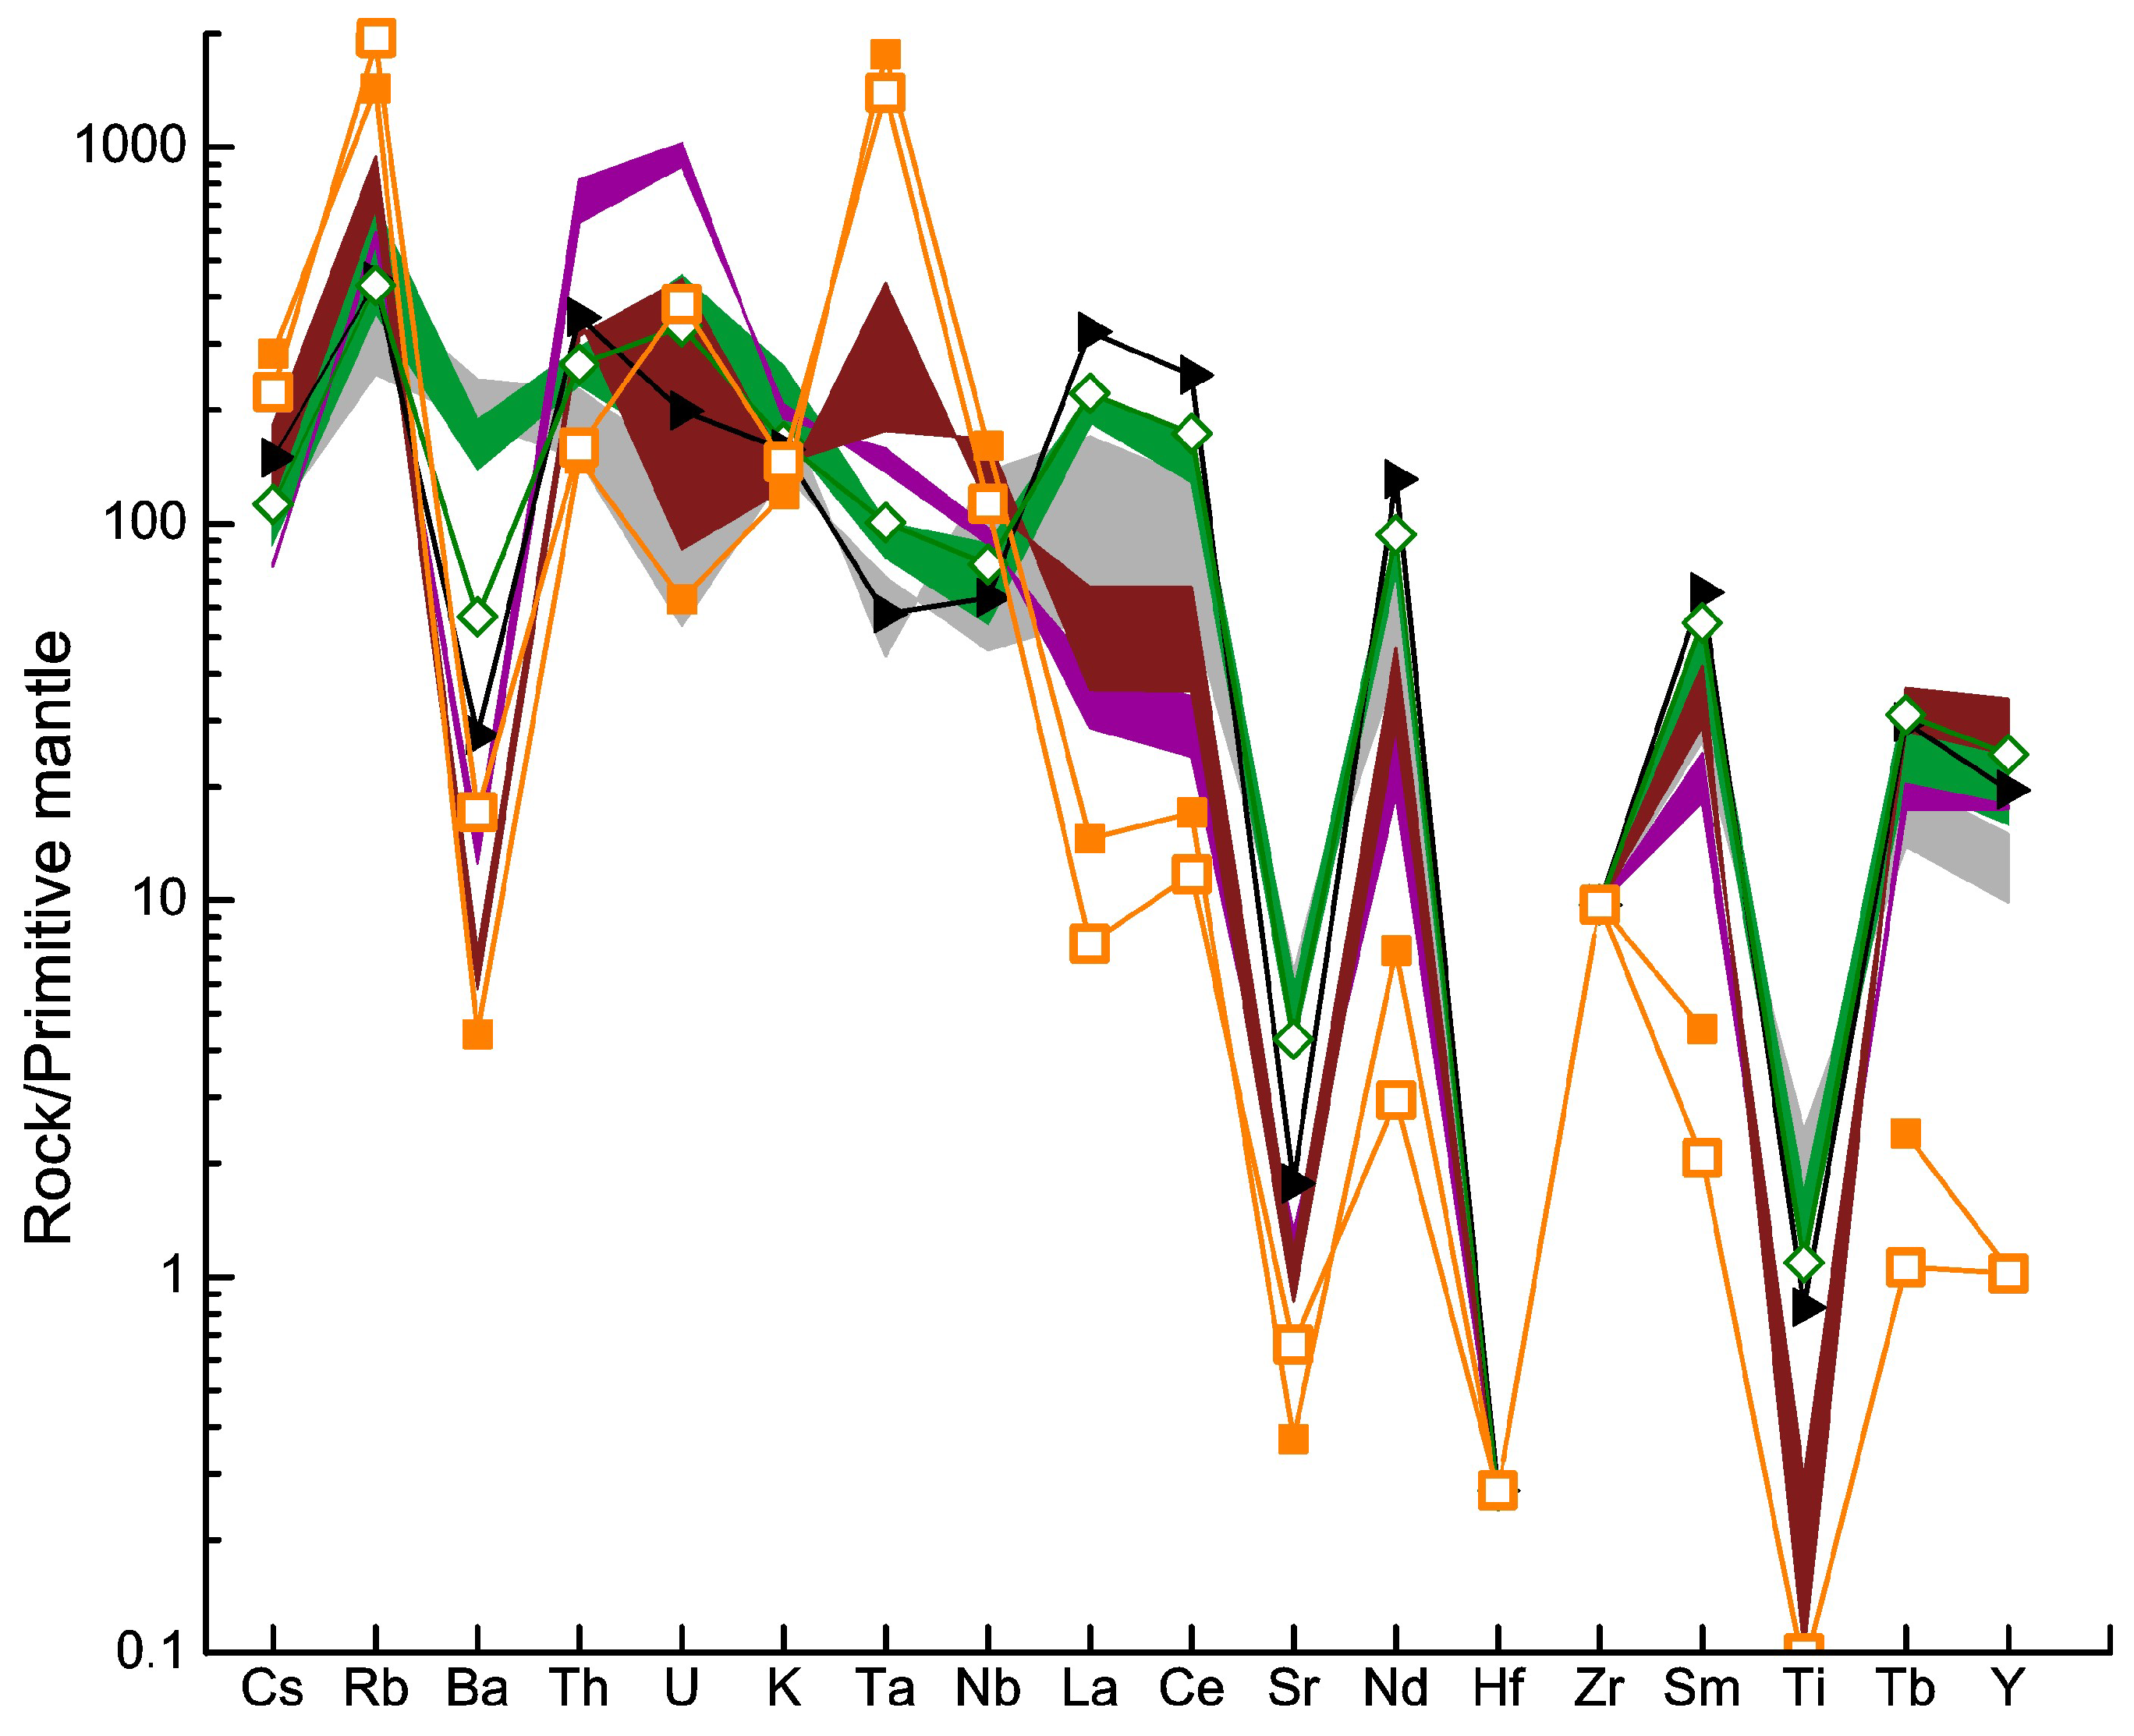
4.3.2. Trace Elements

Figure 13 shows the REE patterns of rocks from the Salmi batholith as well as highly evolved granite [55] from the Eurajoki stock in the satellite of the Laitila batholith in Finland.
The REE patterns of granite porphyry from dike 1 and dike 2 are similar. They are enriched in LREE rather than HREE. The La/Yb ratio varies from 13.86 to 18.11 while the Gd/Yb ratio changes from 1.82 to 2.28. Rapakivi granite and the ground mass of rapakivi granite (sample AK190619-1) have similar spectra topologies with a pronounced Eu minimum.
The xenoliths of fine-grained granite have slightly greater LREE enrichment relative to HREE, and their La/Yb ratio changes from 1.59 to 2.52. Their most characteristic features are enrichment in heavier REE and a low Gd/Yb ratio, varying from 0.96 to 0.7. The topology of their spectra was shown to be that of fine-grained granite AK160617-3 and AK230617-3. The spectra of the last rocks are characterized by a significant tetrad effect (above 1.1) in all tetrads (1, 3, 4), while the zigzag-like distortion of the spectrum in xenoliths and AK160617-3 is not significant according to [61], although the Eu minimum is more clearly pronounced than in the granite. The calculation process used to determine the tetrad effect value is presented in the Supplementary Materials (Table S1).
The youngest granite (sample AK230619-1) was found to be extremely depleted in all REE, while the third tetrad (Gd-Ho) showed lower values in relation to the first (La-Nd) and fourth (Er-Lu) tetrads, which sharply distinguished the spectrum of granite of this type from the previous two.
In terms of the REE patterns of highly evolved granite, as in fine-grained granite, there is slight enrichment with LREE relative to HREE with an La/Yb ratio of 2.95. The Gd/Yb ratio is even less than 0.35. The Europium minimum is most strongly manifested in highly evolved granite. An identical REE spectrum was shown for deeply differentiated topaz-bearing rocks of the Eurajoki stock associated with the Laitila batholith in Finland [55].
Figure 14 shows the trace elements normalized to a primitive mantle [62]. All rocks under consideration were equally severely depleted of Hf with slightly less depletion of Sr and Ti.
In comparison with other rocks, the trace element distribution of the granite porphyry is most similar to that of rapakivi granite, but there are differences. Granite porphyry is enriched with Th, U, Ta, Y, and lanthanides. Similar trends (except for Ta) are present in the bulk of rapakivi granite (sample AK190619-1); however, Ba, Sr, and Ti minima are more significantly manifested in the latter compared to in granite porphyry.
Xenoliths of fine-grained granite are sharply enriched with Th and U compared to all other rocks under consideration. In comparison with rapakivi granite, they are enriched in Rb and Ta and depleted in terms of Cs, Ba, Sr, Y, and lanthanides.
Highly evolved granite is dramatically enriched with Ta and to a lesser extent with Cs, Rb, and Nb. It shows significant depletion of Ti (below the sensitivity of the XRF method), Ba, Sr, and Y, as well as all lanthanides. Highly evolved granite of Eurajoki stock is very similar to Salmi granite with some differences. Sample 97/IH/67 shows contrasting behavior with respect to the U distribution. The remaining elements generally have similar distribution patterns.
The Y/Ho ratio in evolved granite is 13.5, while the other rocks have similar values to the average crust rocks with a ratio of 25.3 [63].
A decrease in this ratio may be a sign of the separation of an alumofluoride melt from a silicate, in favor of which Y is distributed [64].
The depletion of Ba, Sr, and Eu in the considered rocks is associated with the fractionation of feldspar and the depletion of the residual melt in these components.

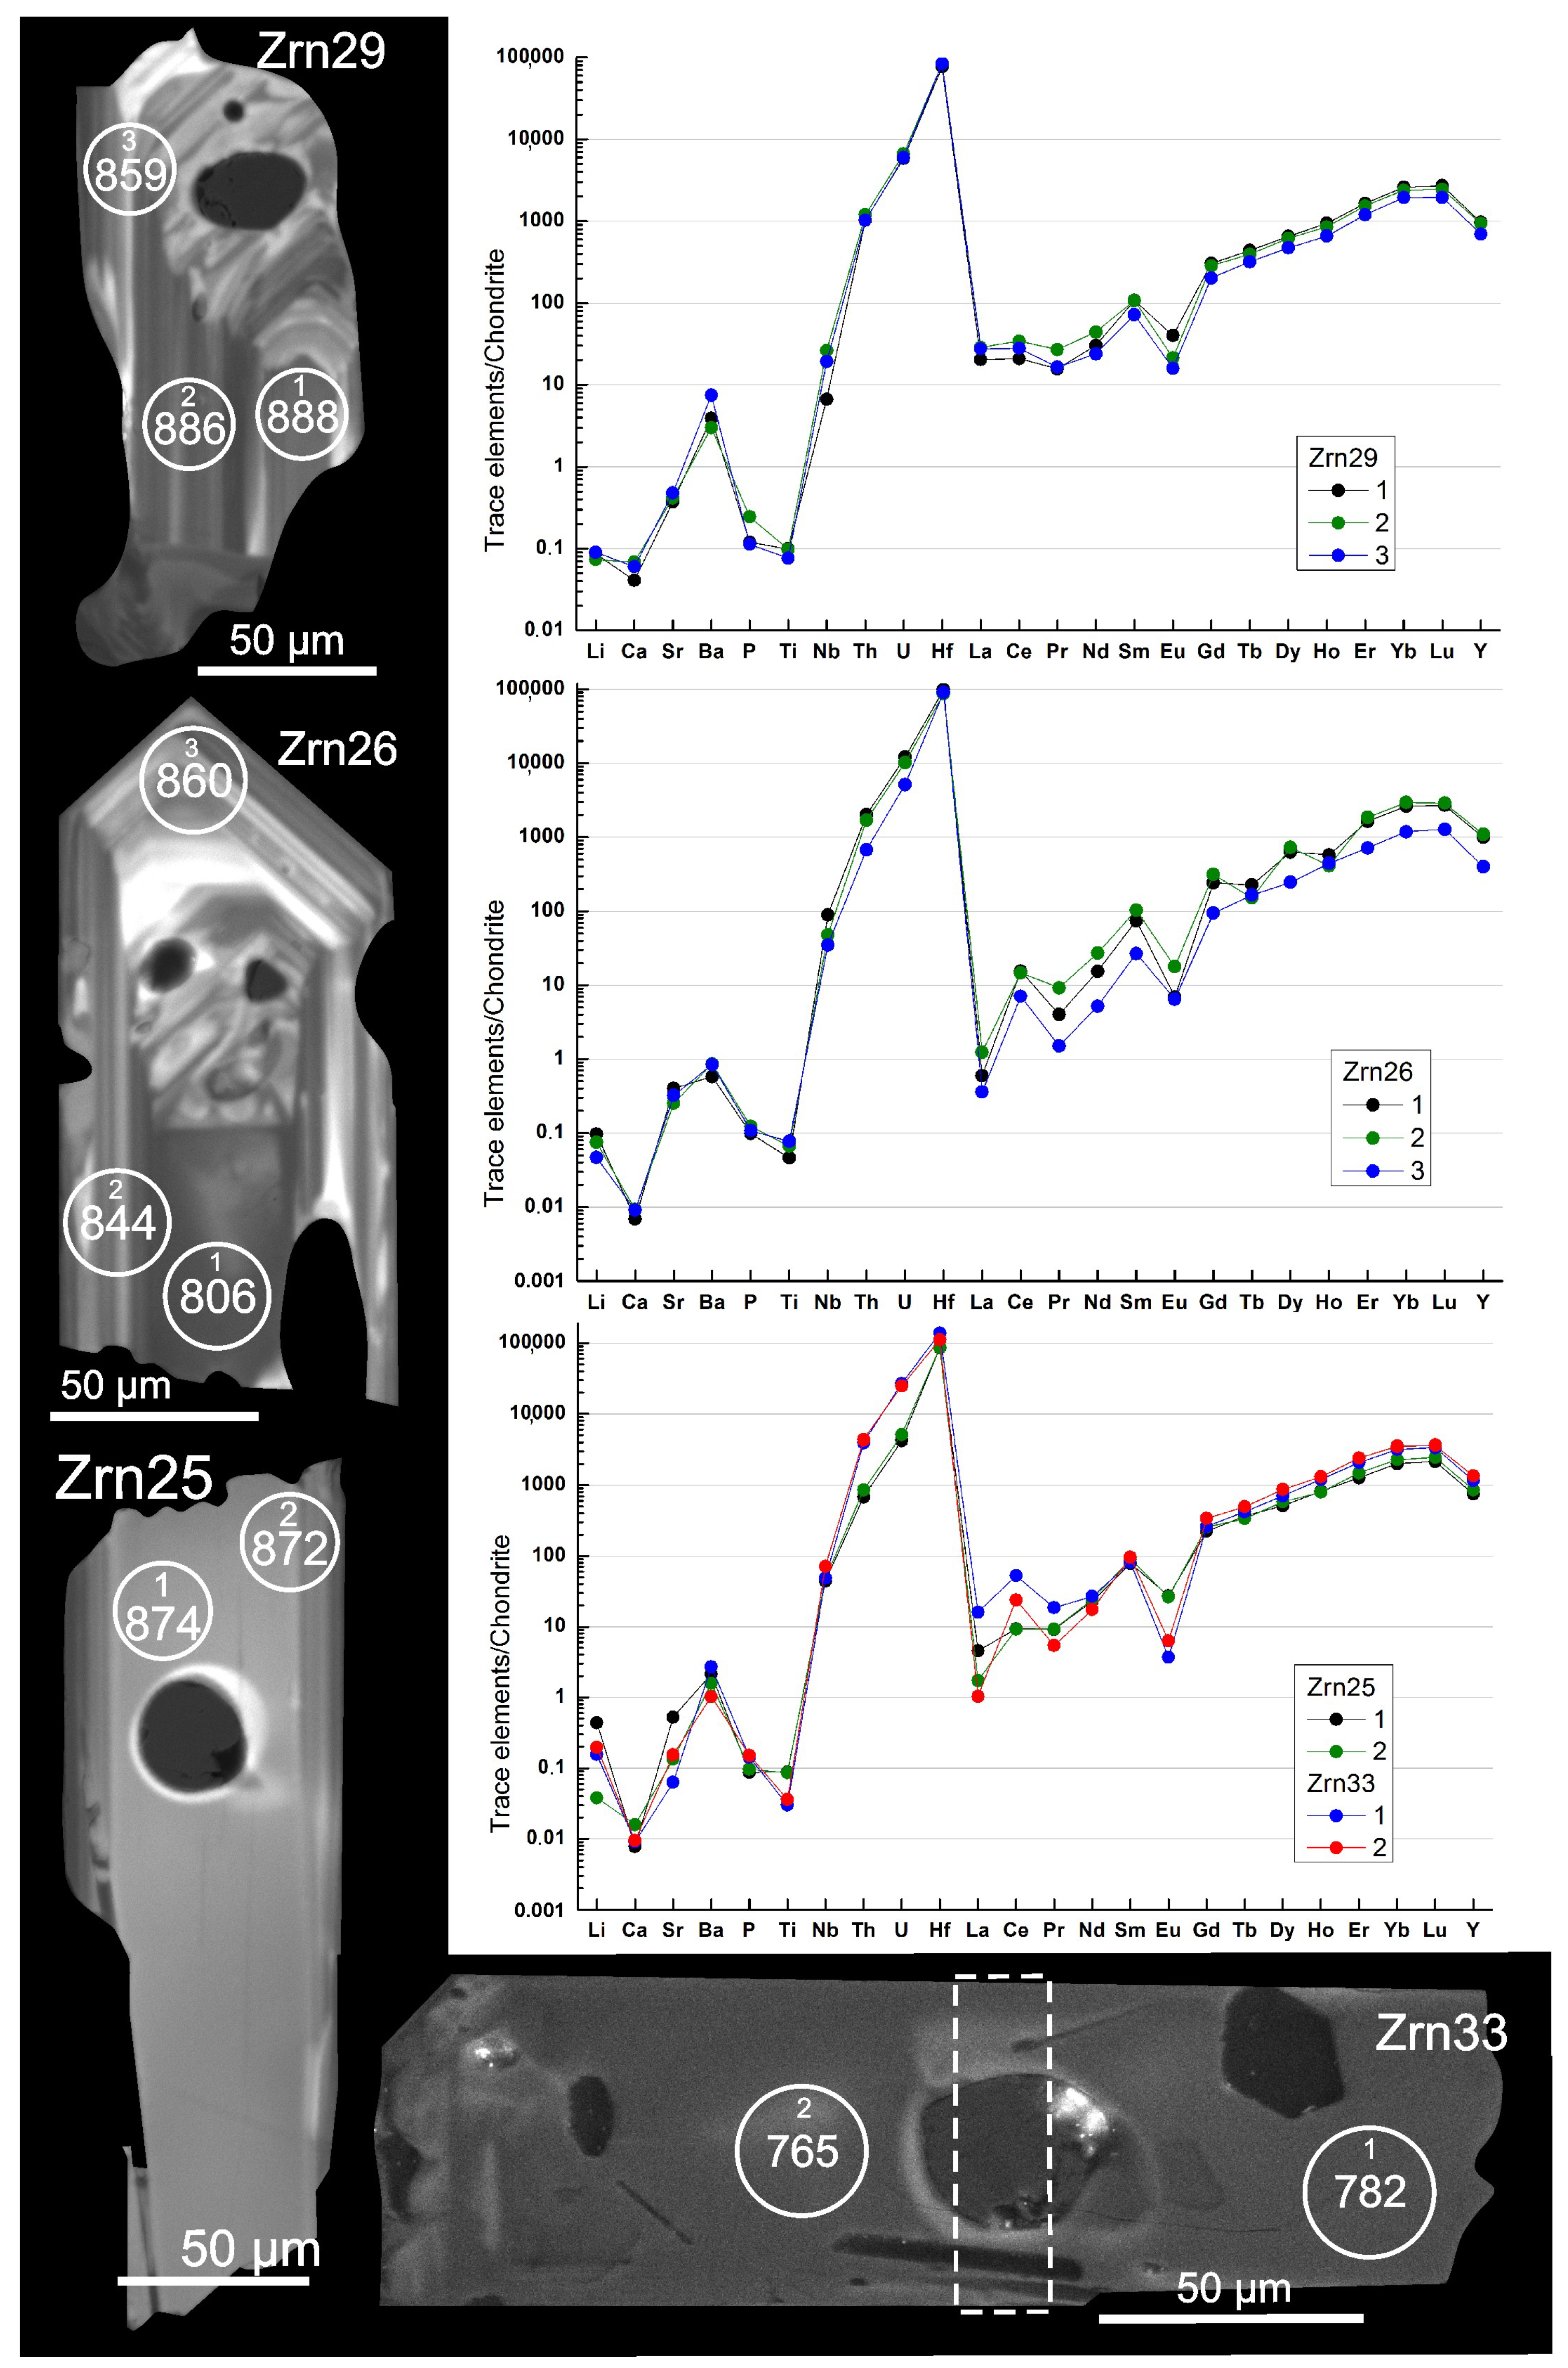
4.4. Zircon: Morphology, Internal Structure, Composition, Ti in Zircon Thermometry, and Inclusions

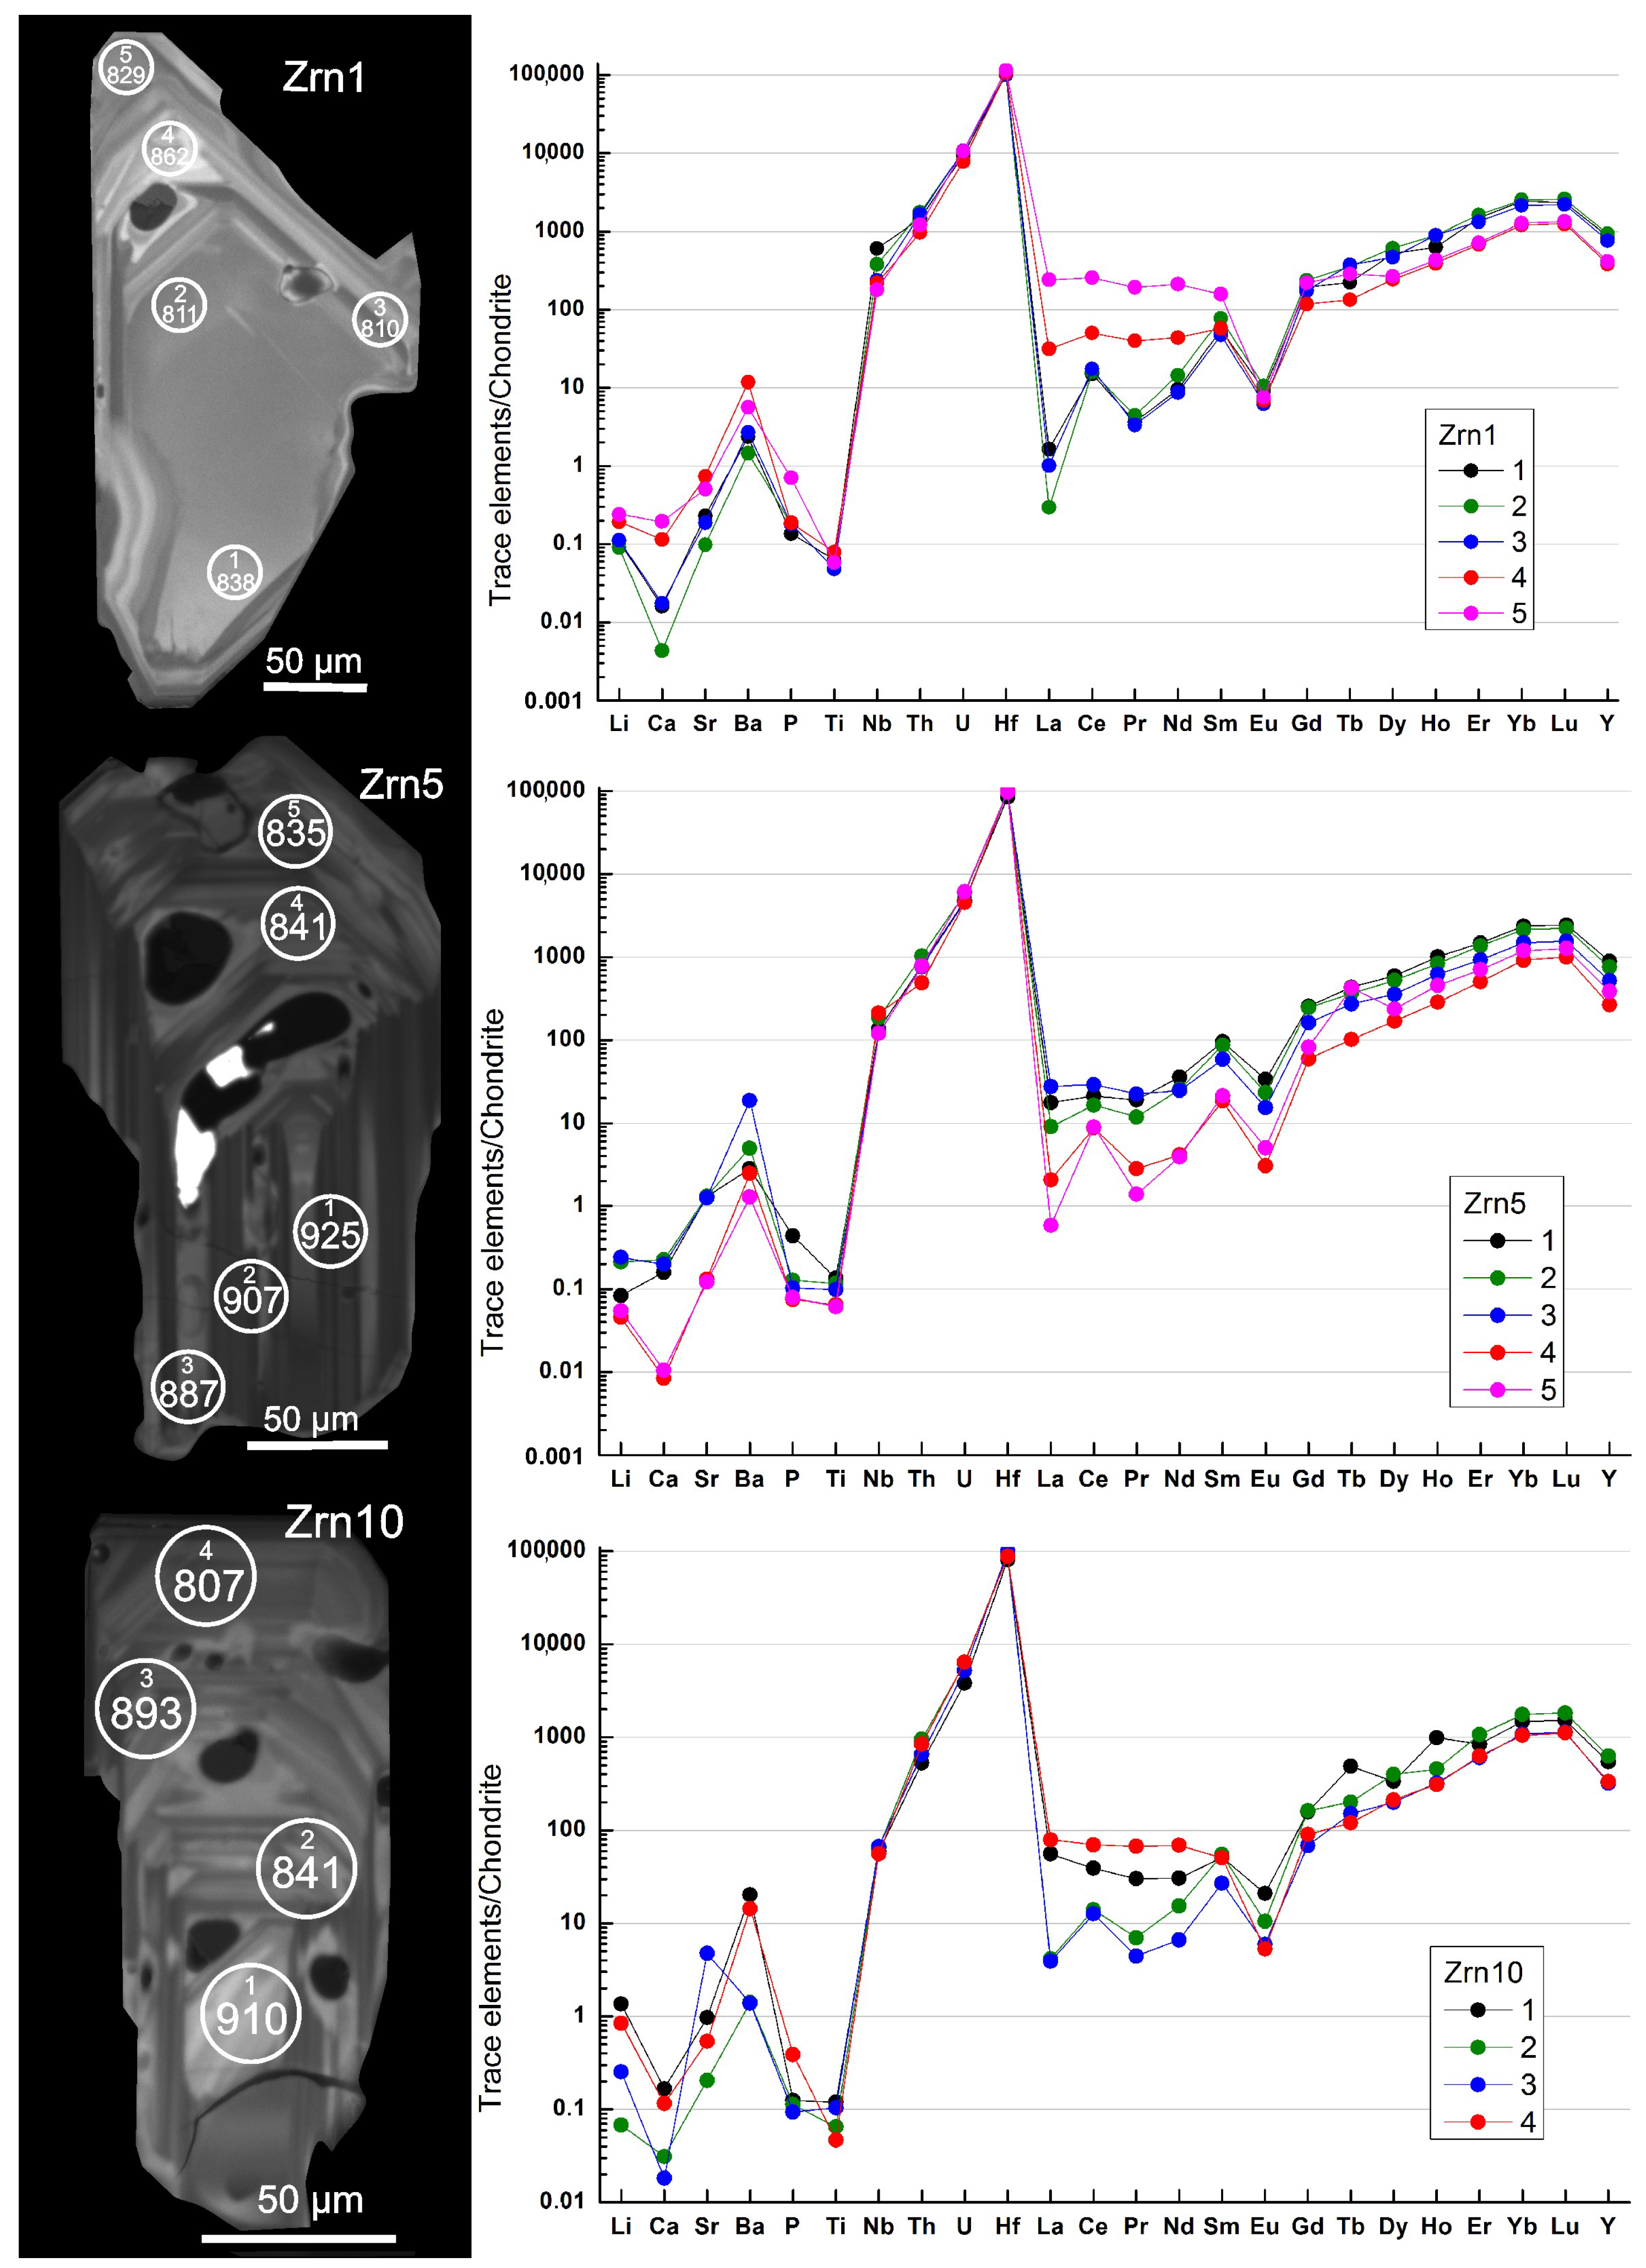
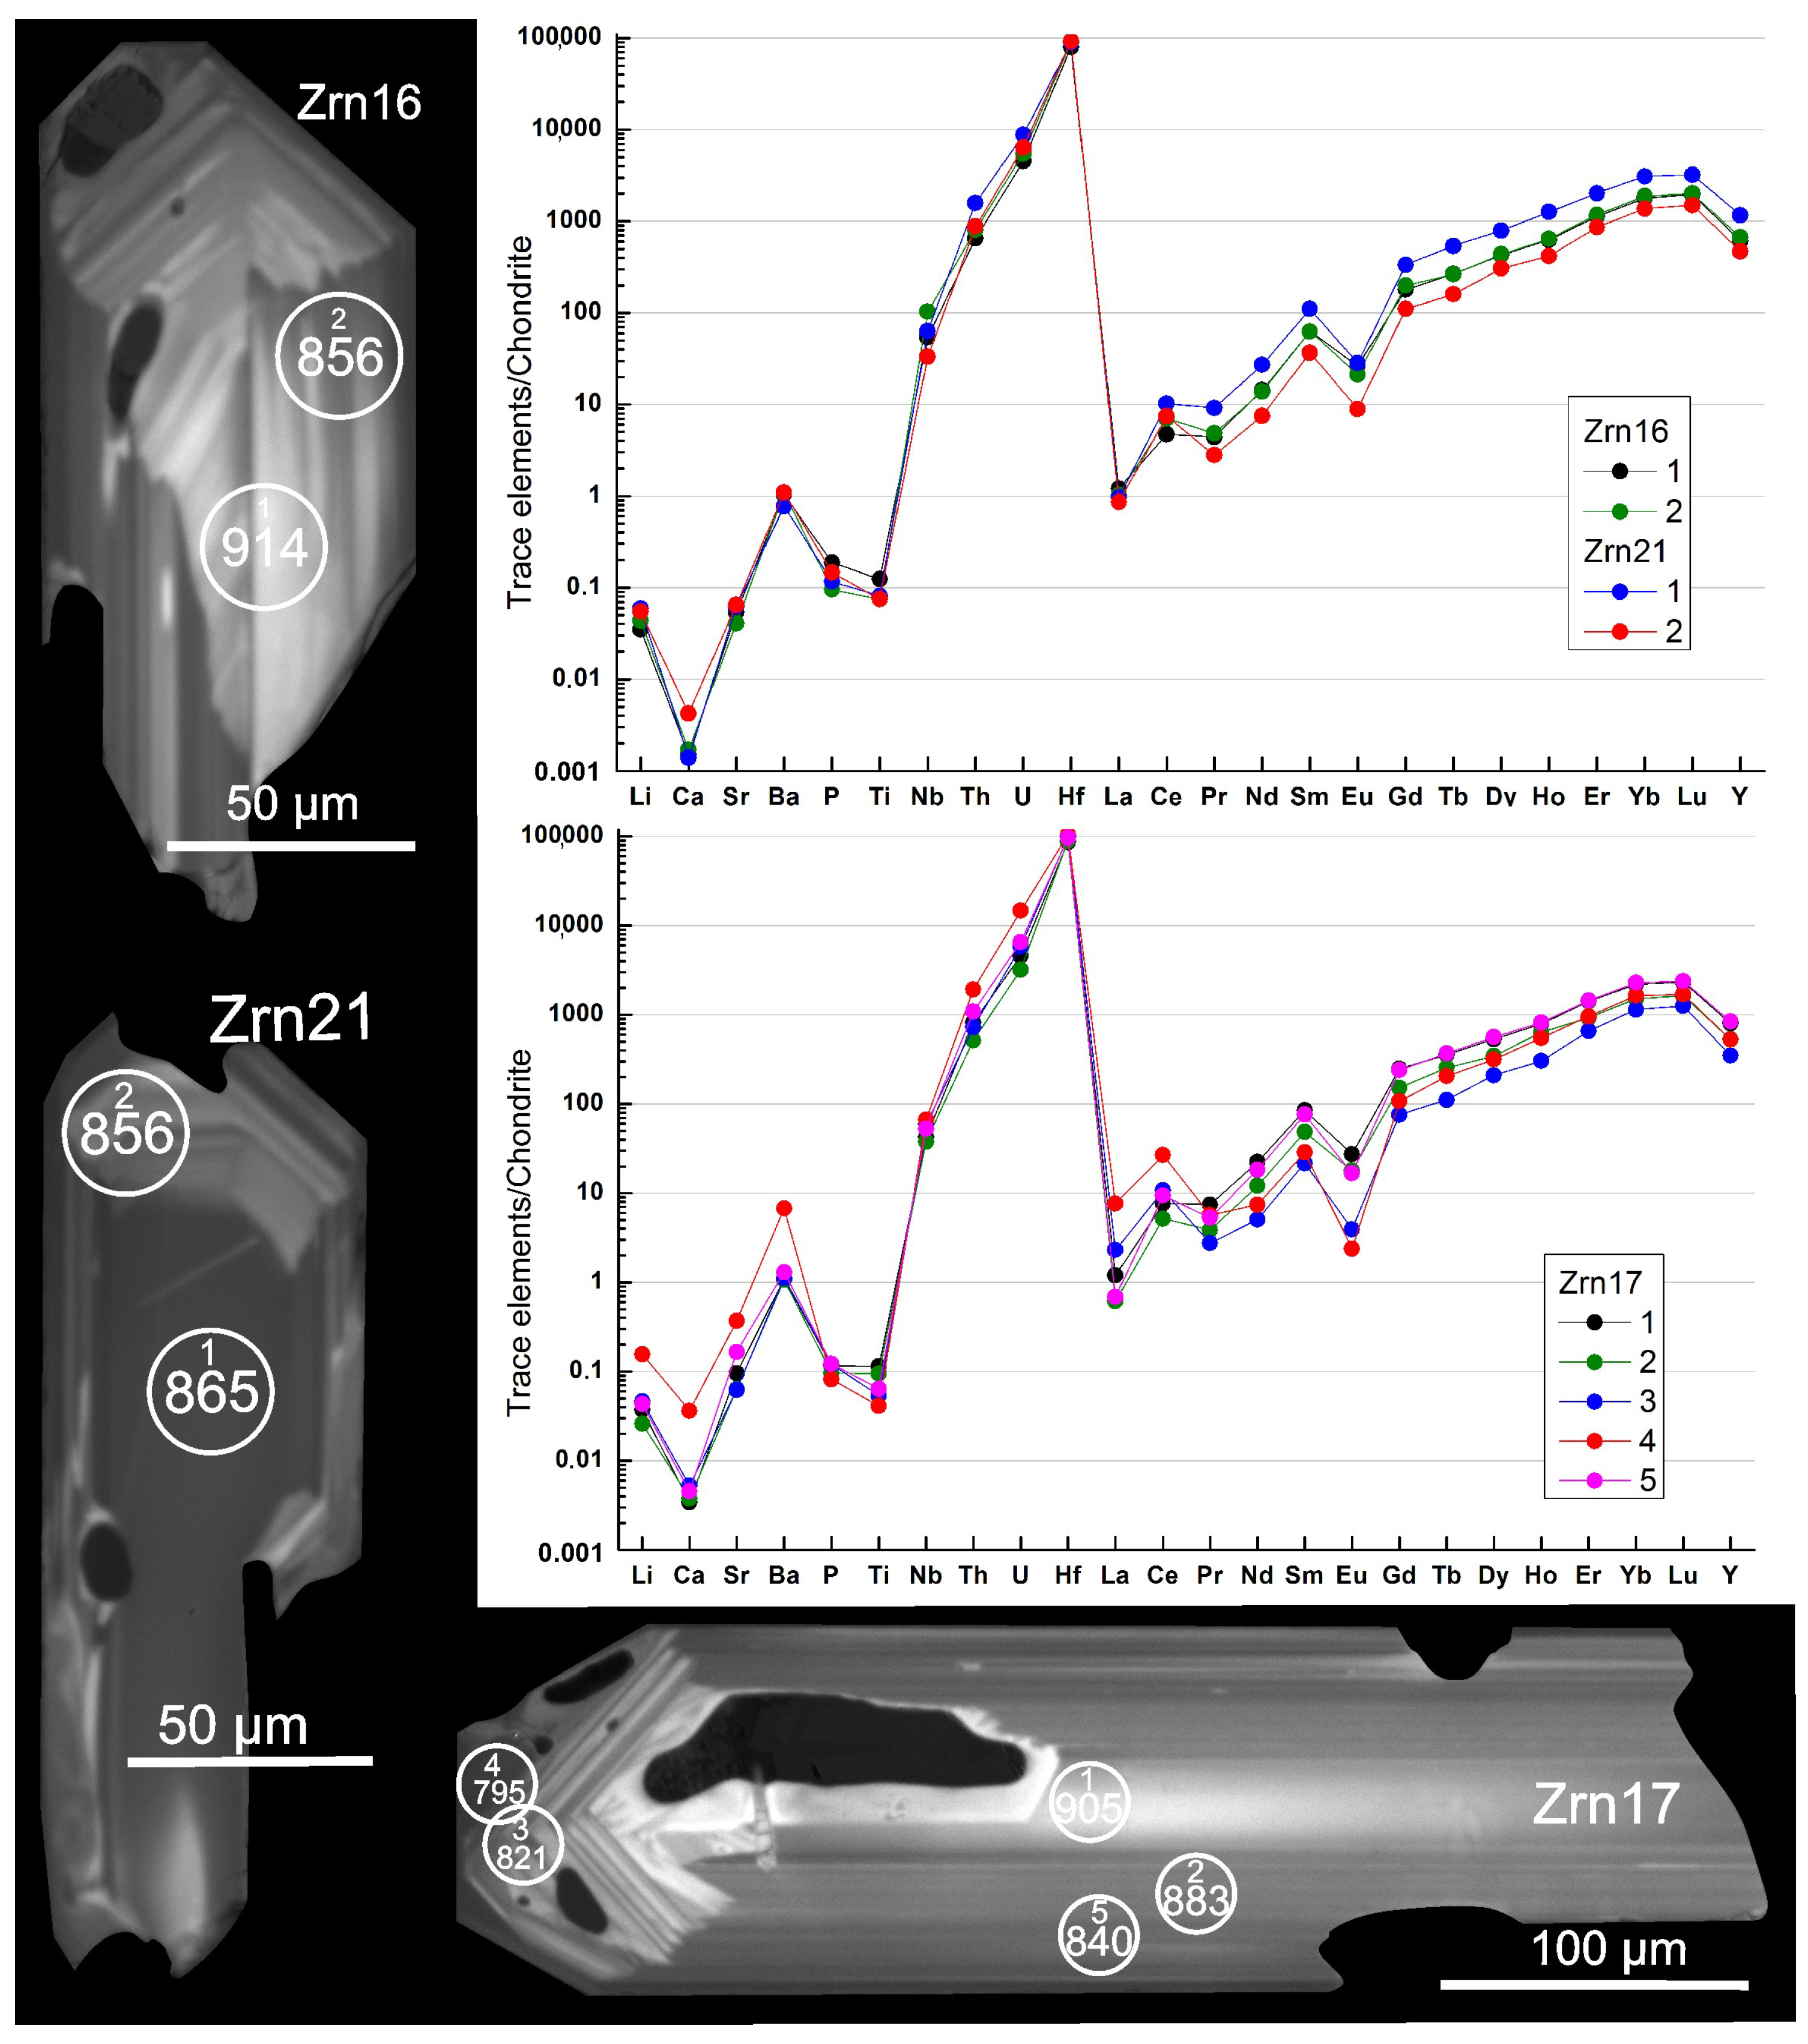
4.4.1. Characteristics of Zircon Grains

In the rock, zircon is represented by elongated crystals with a faint brownish tinge and an average size of (150–200) × (50–80) μm2. Less often, needle-shaped or isometric grains occur. The grains have varying degrees of idiomorphism, from completely euhedral to grains with partially and poorly defined faces. The closer the zircon is to the isometric form, the more euhedral it is. Internal oscillatory zonality is often observed, even with an optical microscope. Images of typical zircon grains obtained by transparent light are shown in Figure 15. Cathodoluminescence is shown in Figure 16, Figure 17 and Figure 18.
Various types of internal zonality are observed in zircon grains during monochromatic cathodoluminescence:
  • Strictly two-zonal crystals with a homogeneous inner part and a thinly zoned outer part (Zrn21 and Zrn25);
  • Crystals with complex combinations of growth zonality expressed in thin layers of dark and light bands (Zrn1, Zrn5, Zrn10, Zrn26);
  • Crystals without a homogeneous central part but with a thinly overlapping growth zonality (Zrn16 and Zrn17). The sectoriality is particularly pronounced in these grains. This is reflected in the difference in color intensity between growth zones on different growth planes.
In all zircon grains studied by the SIMS method, a decrease in the amount of Ti from the central part of the grain to the periphery was observed, except for in the Zrn1, Zrn10, and Zrn26 grains. In these grains, an increase in the Ti content was observed in the intermediate growth zone, followed by a decrease in the marginal parts.
In rare cases, the increase in the Ti content is caused by the appearance of small grains of Ti-containing minerals (probably ulvöspinel, ilmenite, or rutile). At the same time, there is no increase in the Ti content from the center to the periphery (which is typical for Zrn1 and Zrn10), but a local peak in Ti concentrations is established.
The Th/U ratio in all zones of the studied zircon grains is quite stable (0.5–0.6; varies from 0.39 to 0.7), which confirms the magmatic genesis of all studied grains [65,66]. Slightly elevated U and Th contents occur in the marginal zones of Zrn17 (analysis 4) as well as in the inner zones of Zrn26 and Zrn33, but this does not affect the Th/U ratio.
An increase in heavy REE relative to light ones occurs in all zircon grains. Positive Ce and negative Eu anomalies are expressed. The Eu/Eu* ratio is determined by EuN/((SmN + GdN)1/2, where N is normalized to chondrite in accordance with [60]. The Eu/Eu* ratio is greater in the central zones—on average by about 1.5 (1.97 is the maximum in Zrn29), falling to values of 0.5–0.4 in the marginal parts (0.2 is the minimum defined for Zrn17).
The increased content of light REE correlates with increases in Li, Ca, Sr, Ba, and P in the Zrn1, 5, 10, and 29 grains, probably due to the presence of apatite microinclusions.
In general, the content of heavy REE decreases towards the marginal parts of the grains. The Hf content in the marginal zones is slightly greater in relation to that in the internal zones. In general, the Y content decreases towards the marginal parts. The maximum Y content is found in the central parts: Zrn33 and Zrn21-1.

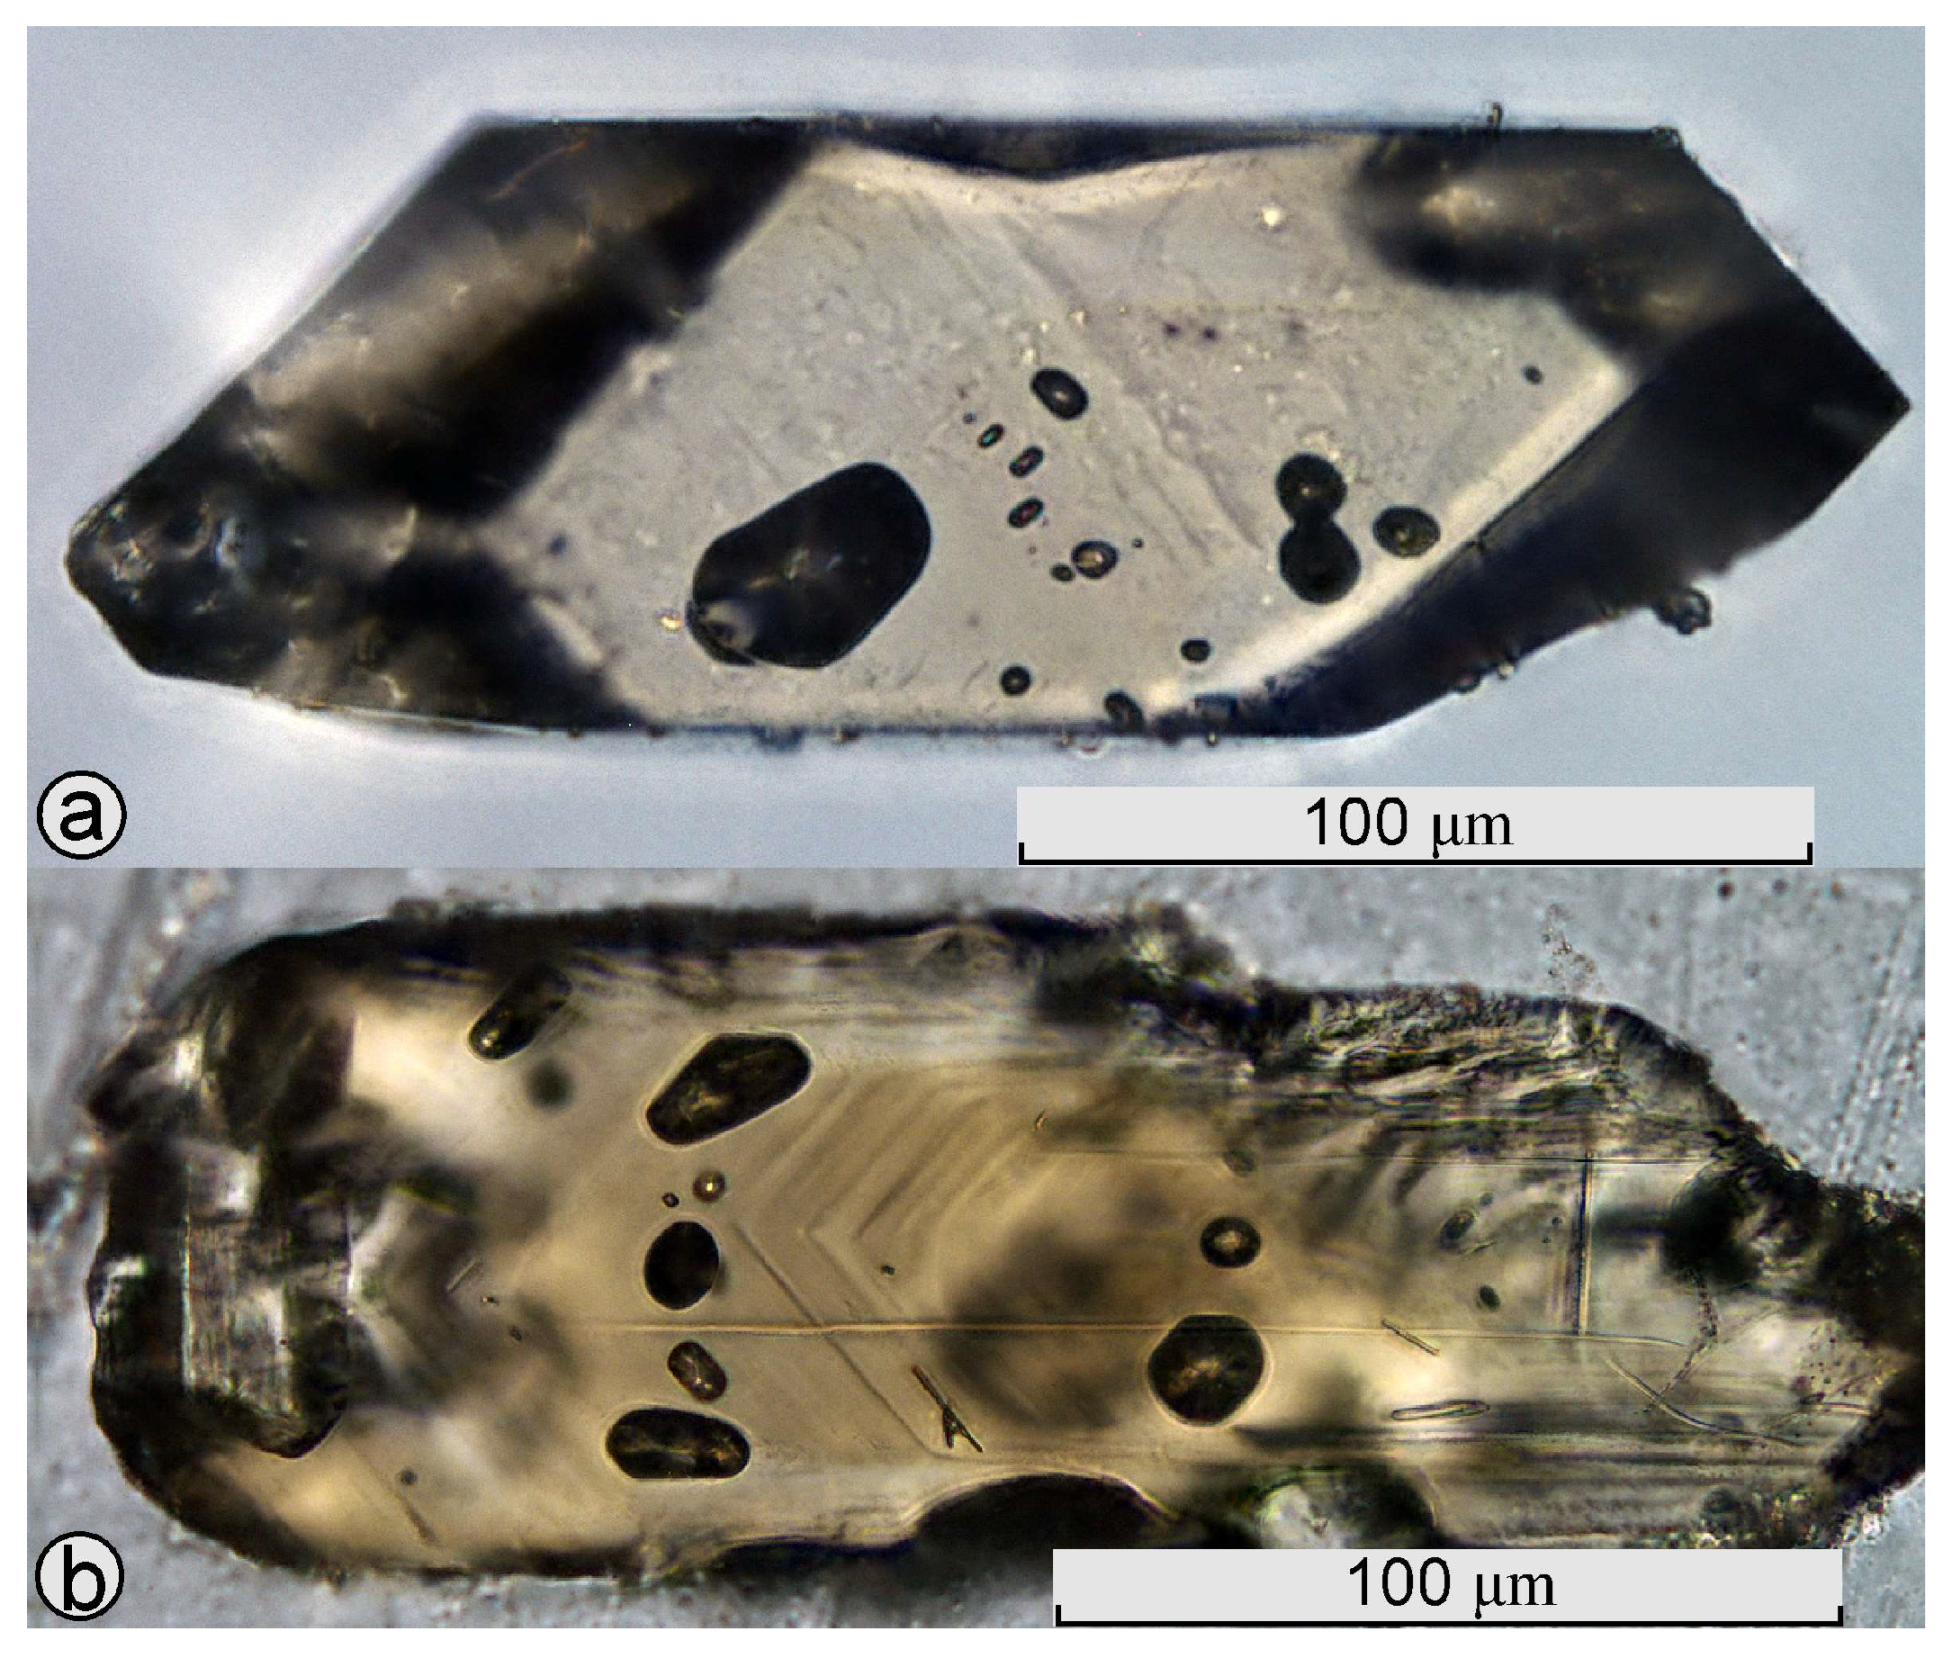
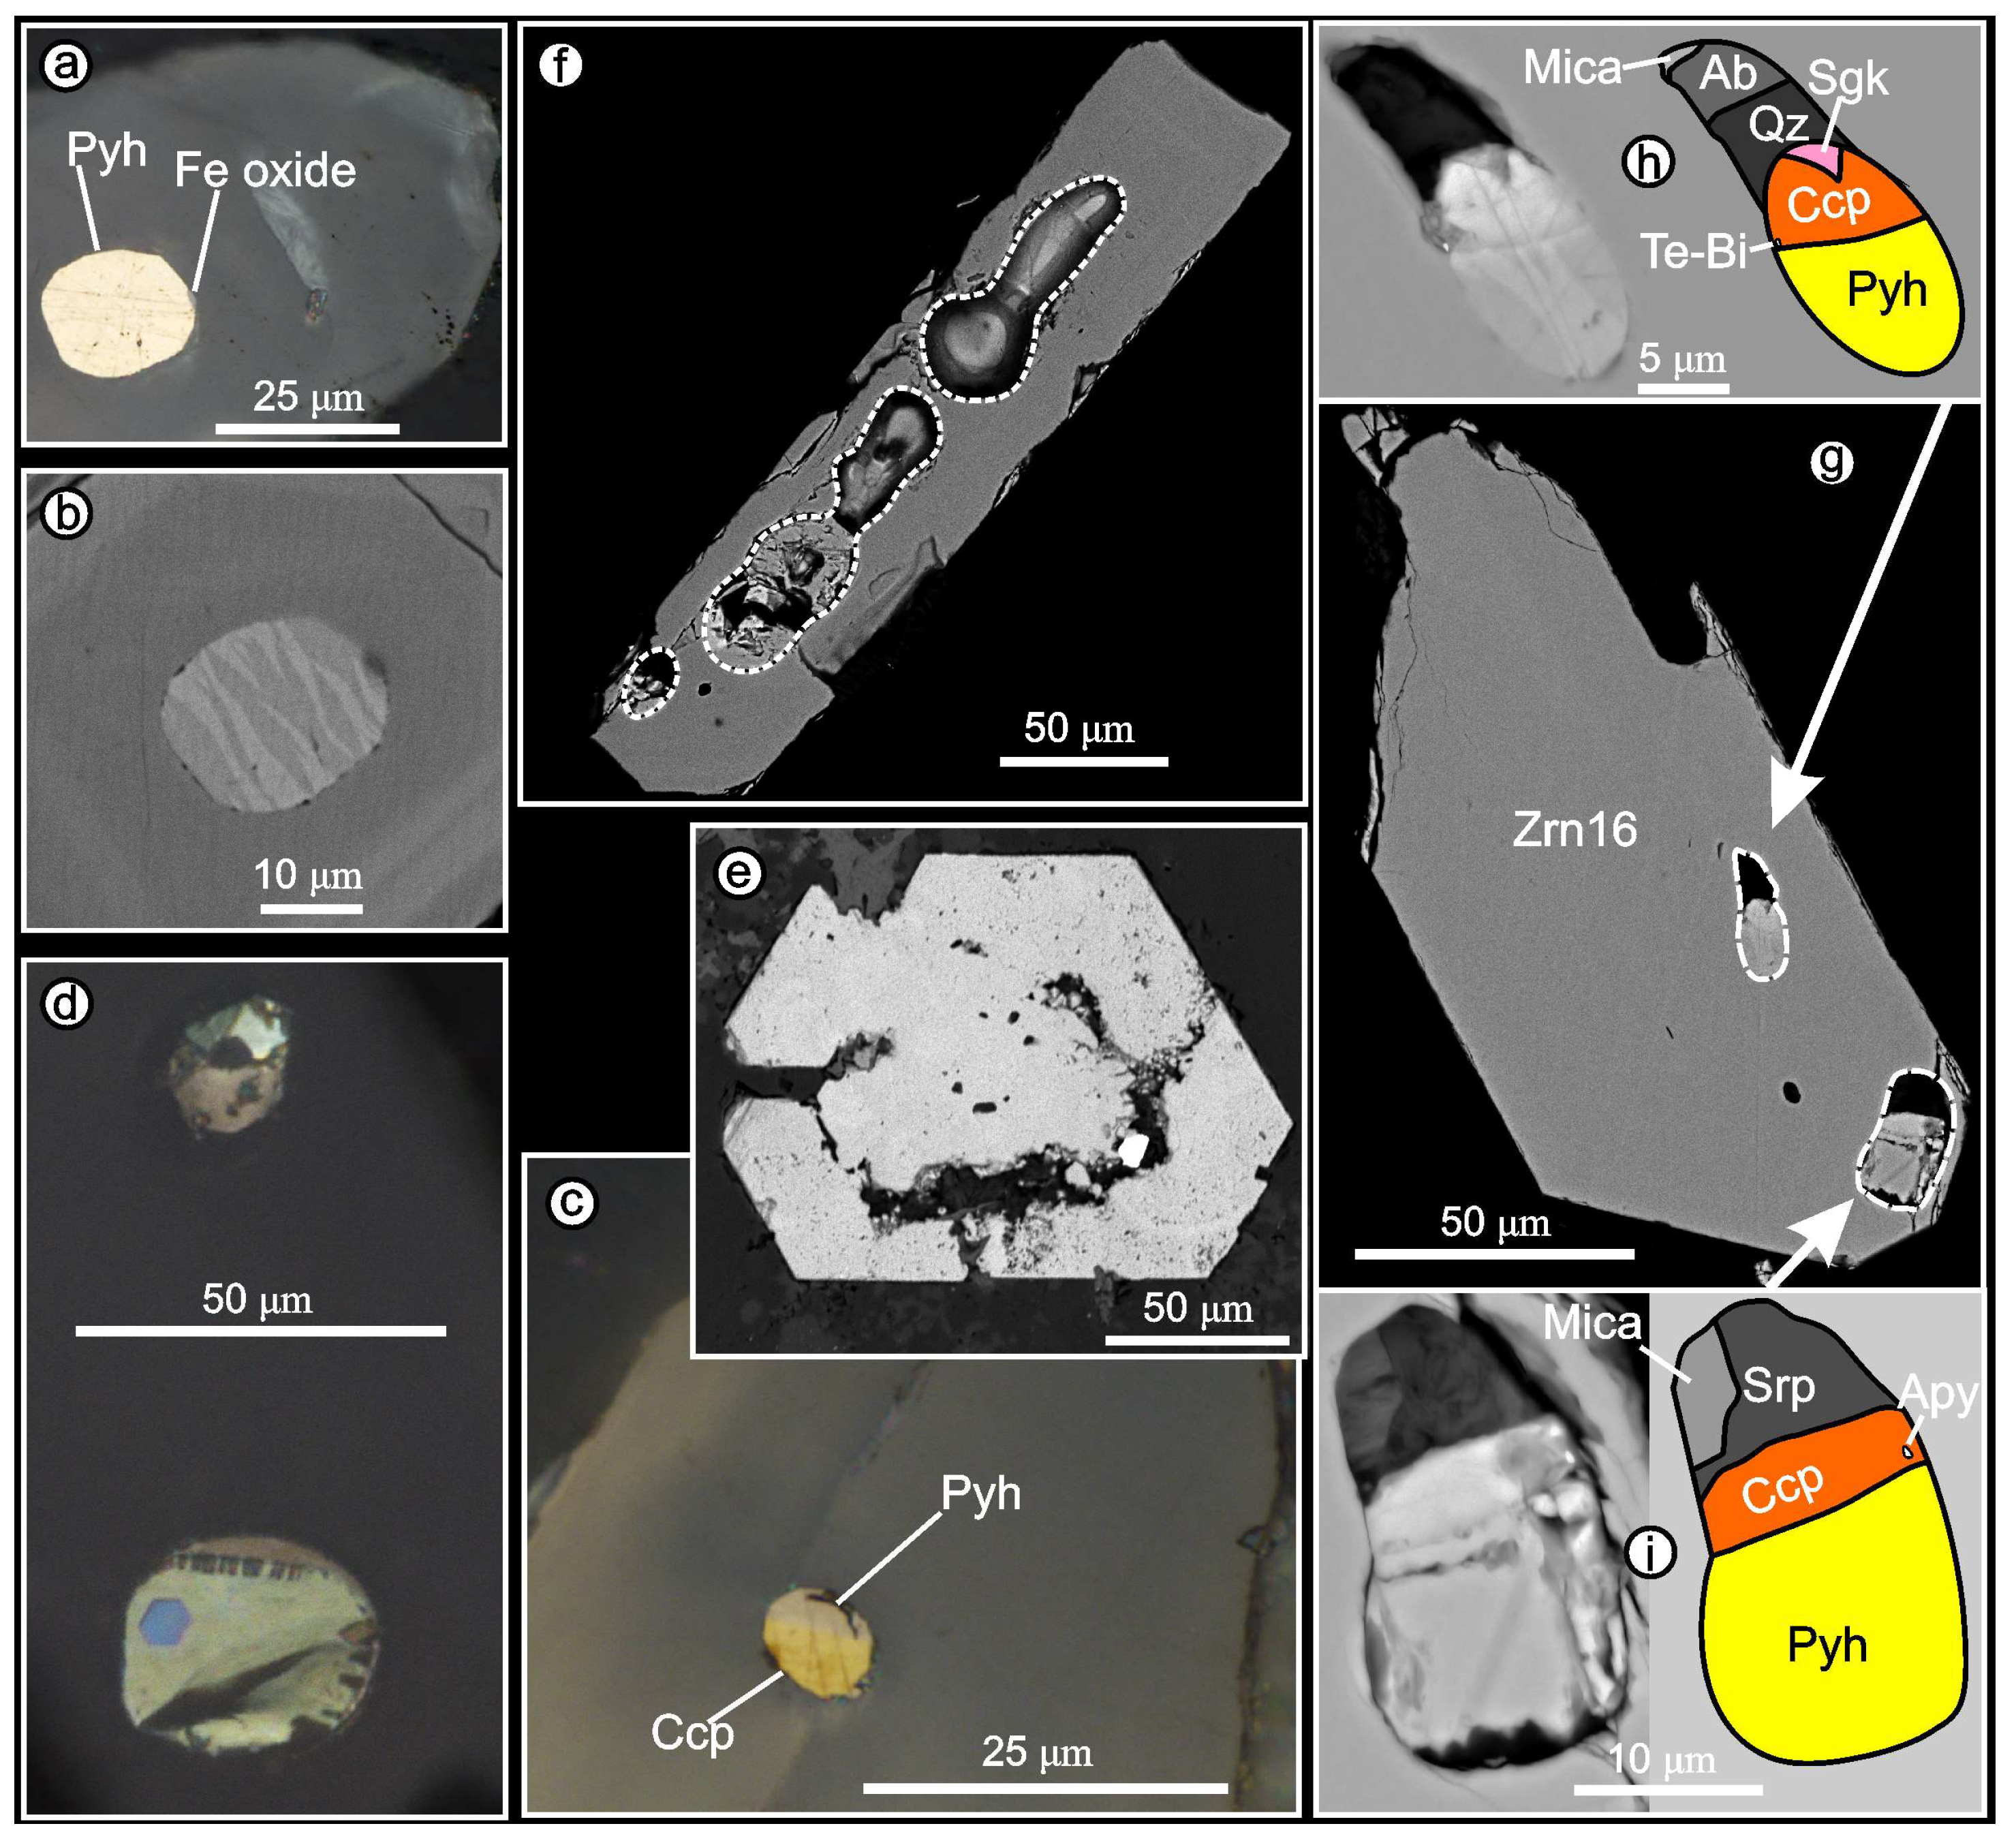
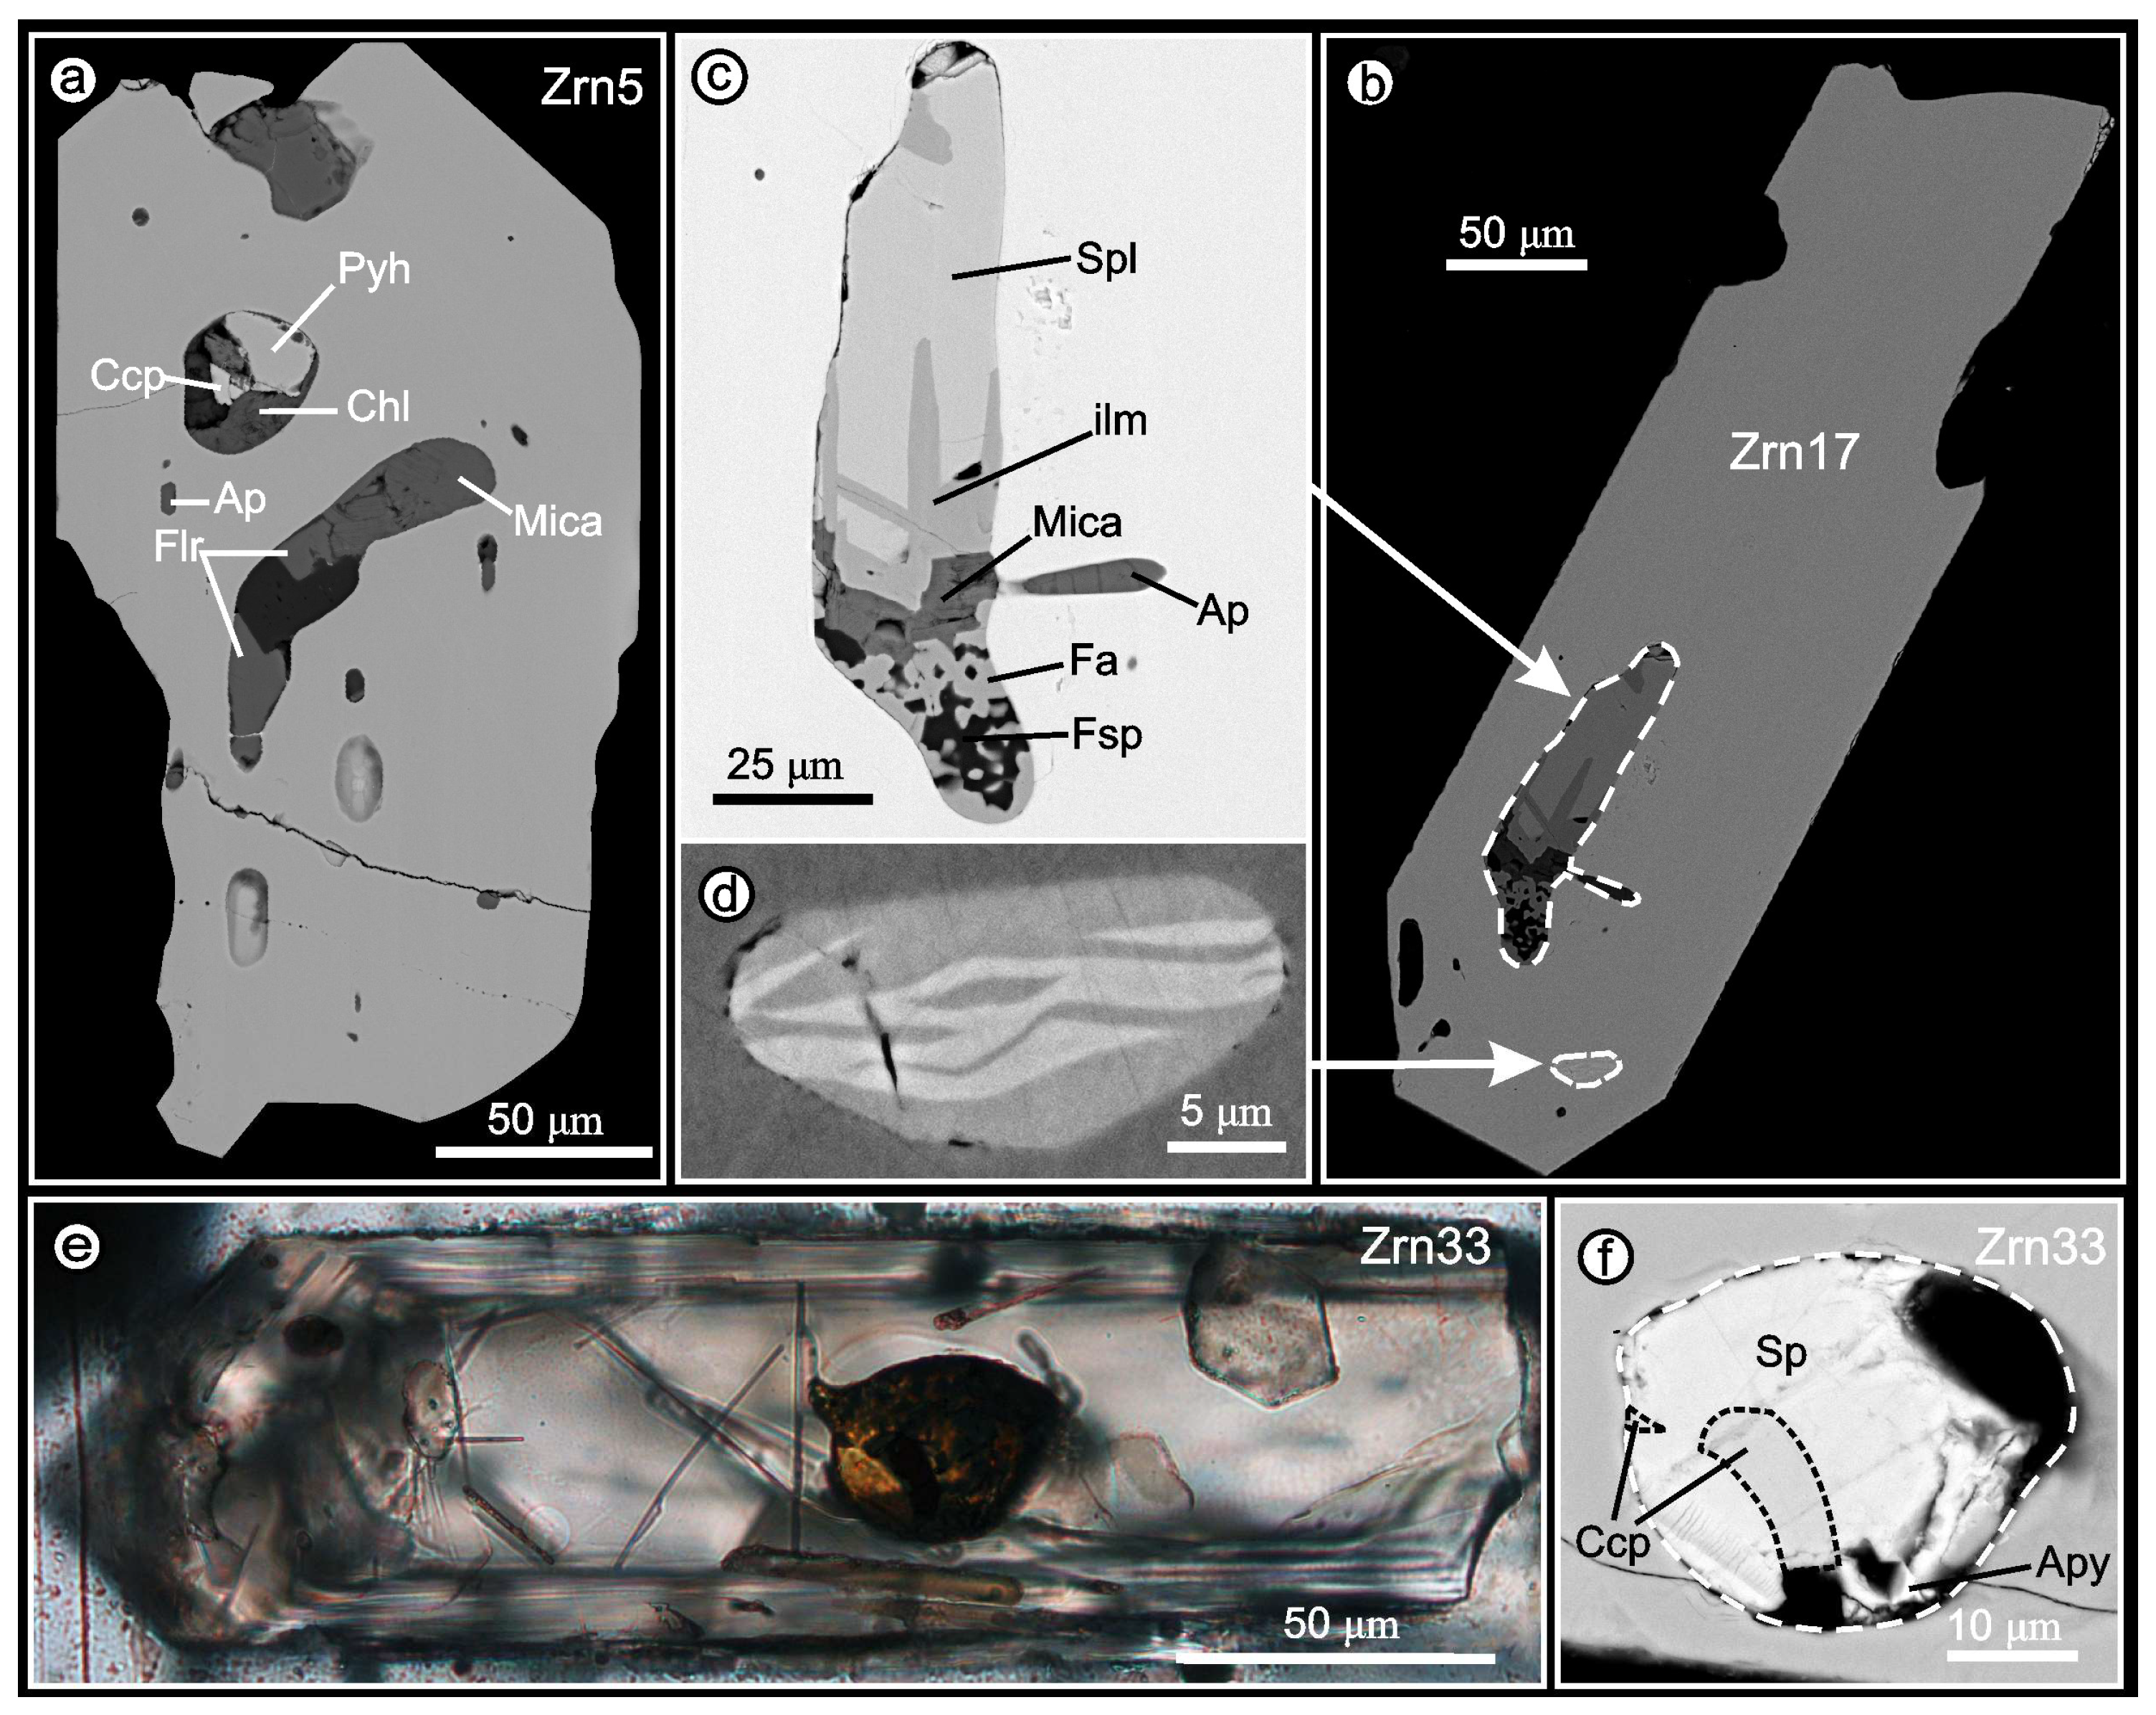
4.4.2. Inclusions in Zircon: Phase Composition, Morphology, and Relationships

There are several types of inclusions in zircon:
Solid-phase (mono- and polymineral) silicate and sulfide melts, as well as inclusions of heterophase capture (silicate melt + sulfide melt) are present. The most significant inclusions included in this work are shown in Figure 19 and Figure 20.

Solid-Phase Inclusions

Monomineral inclusions in zircon are represented by apatite, ilmenite, and pyrrhotite. Apatite is the most common mineral found in the inclusions. It is present as needle-shape crystals, 5 to 20–30 μm in length and 1 to 5–6 μm in width. Ilmenite is present as grains without clear crystallographic boundaries. An admixture of Nb, up to 0.3–0.4 wt%, is also found in ilmenite. Pyrrhotite is the most common sulfide phase in zircon. It forms various shapes, from rounded to elongated, and is often located subparallel to the growth zonality of zircon. Pyrrhotite in inclusions contains solid solution decay structures [67] due to the formation of two phases: one with a small excess of sulfur and one with a decrease (see Supplementary Materials, Table S4). Similar decay textures are shown in Figure 19b,h,i and Figure 20d. Under reflected light, the contrast of the newly formed phases is invisible (Figure 19a). Pyrrhotite from the bulk of the rock contains no decay structures (Figure 19e).
Polymineral inclusions are present as aggregates of various mineral phases of granite paragenesis: quartz, feldspar, biotite, and fluorite. The size of such an inclusion varies from several micrometers to 25 μm in width (Figure 20a). Inclusions with spinel-fayalite-plagioclase phase compositions are also found. An inclusion of this paragenesis is shown in Figure 20c. Fayalite (Fa96.54, Fo1.71, Tep1.75) is found in intergrowths with oligoclase (An20.6) and a mineral of the spinel group (Usp40–43, Mag57–60) with a small admixture of ganite minal and a small excess of Al (Zn 0.5 wt.%, Al 1–1.2 wt.%) with ilmenite developed along it. The detection of the inclusion of this paragenesis makes it possible to assess the redox conditions at the time of its capture.

Melt Inclusions

Melt inclusions are always crystallized with shapes varying from isometric and approaching the ball to elongated when they are located in a sub-parallel growth zonality (Figure 15).
Silicate melt inclusions are transparent and colorless in transmitted light. They are represented by silicate minerals similar to those described in the section “polymineral inclusions”, with some exceptions. Fluorite is present as rare secretions of no more than 1–2 μm in width. The inclusions near the central part sometimes contain anhedral grains of a calcite containing Fe and Mn in variable proportions (Fe up to 0.8 wt%, Mn up to 2.3 wt%). The volume of carbonate grains in the inclusions on the polished plane does not exceed 1%.
The sulfide melt inclusions are crystallized. They are composed of sulfide minerals. Depending on the mineral composition, two varieties can be distinguished: 1, pyrrhotite-chalcopyrite, and 2, sphalerite-chalcopyrite. Sulfide melt inclusions are present under reflected light: those not opened by polishing are shown in Figure 19d, and those opened by polishing are shown in Figure 19a,c.
The sizes of sulfide inclusions vary widely, from several microns to 100 μm (Figure 19f). However, inclusions <10 μm are the most common. The ratio between large (15–20 μm or more) and small (<10 μm) inclusions is, on average, 1:20.
Inclusions of the first variety are composed of pyrrhotite and chalcopyrite. Among the minor minerals are arsenopyrite and molybdenite. Additionally, the presence of a phase close to sugakiite (Figure 19h) was noted in chalcopyrite, as well as Te, Ag, Bi, and Pb phases, which, due to their insignificant sizes, were not identified. All rare sulfide minerals are located in the chalcopyrite part, mainly at its borders.
Inclusions of the second variety are represented by sphalerite and chalcopyrite, which form solid solution decomposition structures. A rounded inclusion of this type is shown in Figure 20e,f. A distinctive feature of inclusions of this type compared with the previous one is the presence of transparent golden-brownish sphalerite, in which chalcopyrite opaque lamellae are located. Of the minor mineral phases, arsenopyrite is noted. Inclusions of this type are extremely rare. Only one large inclusion, >20 μm in diameter, was found, and this was investigated using LA-ICP-MS. It was not homogenized before analysis. The results of the EPMA analysis are presented in the Supplementary Materials (Table S4).

Inclusions of Heterophase Capture: Silicate-Sulfide

The inclusions of heterophase capture are represented by the sulfide and silicate parts. Chalcopyrite is always present at their boundaries (Figure 19g–i).

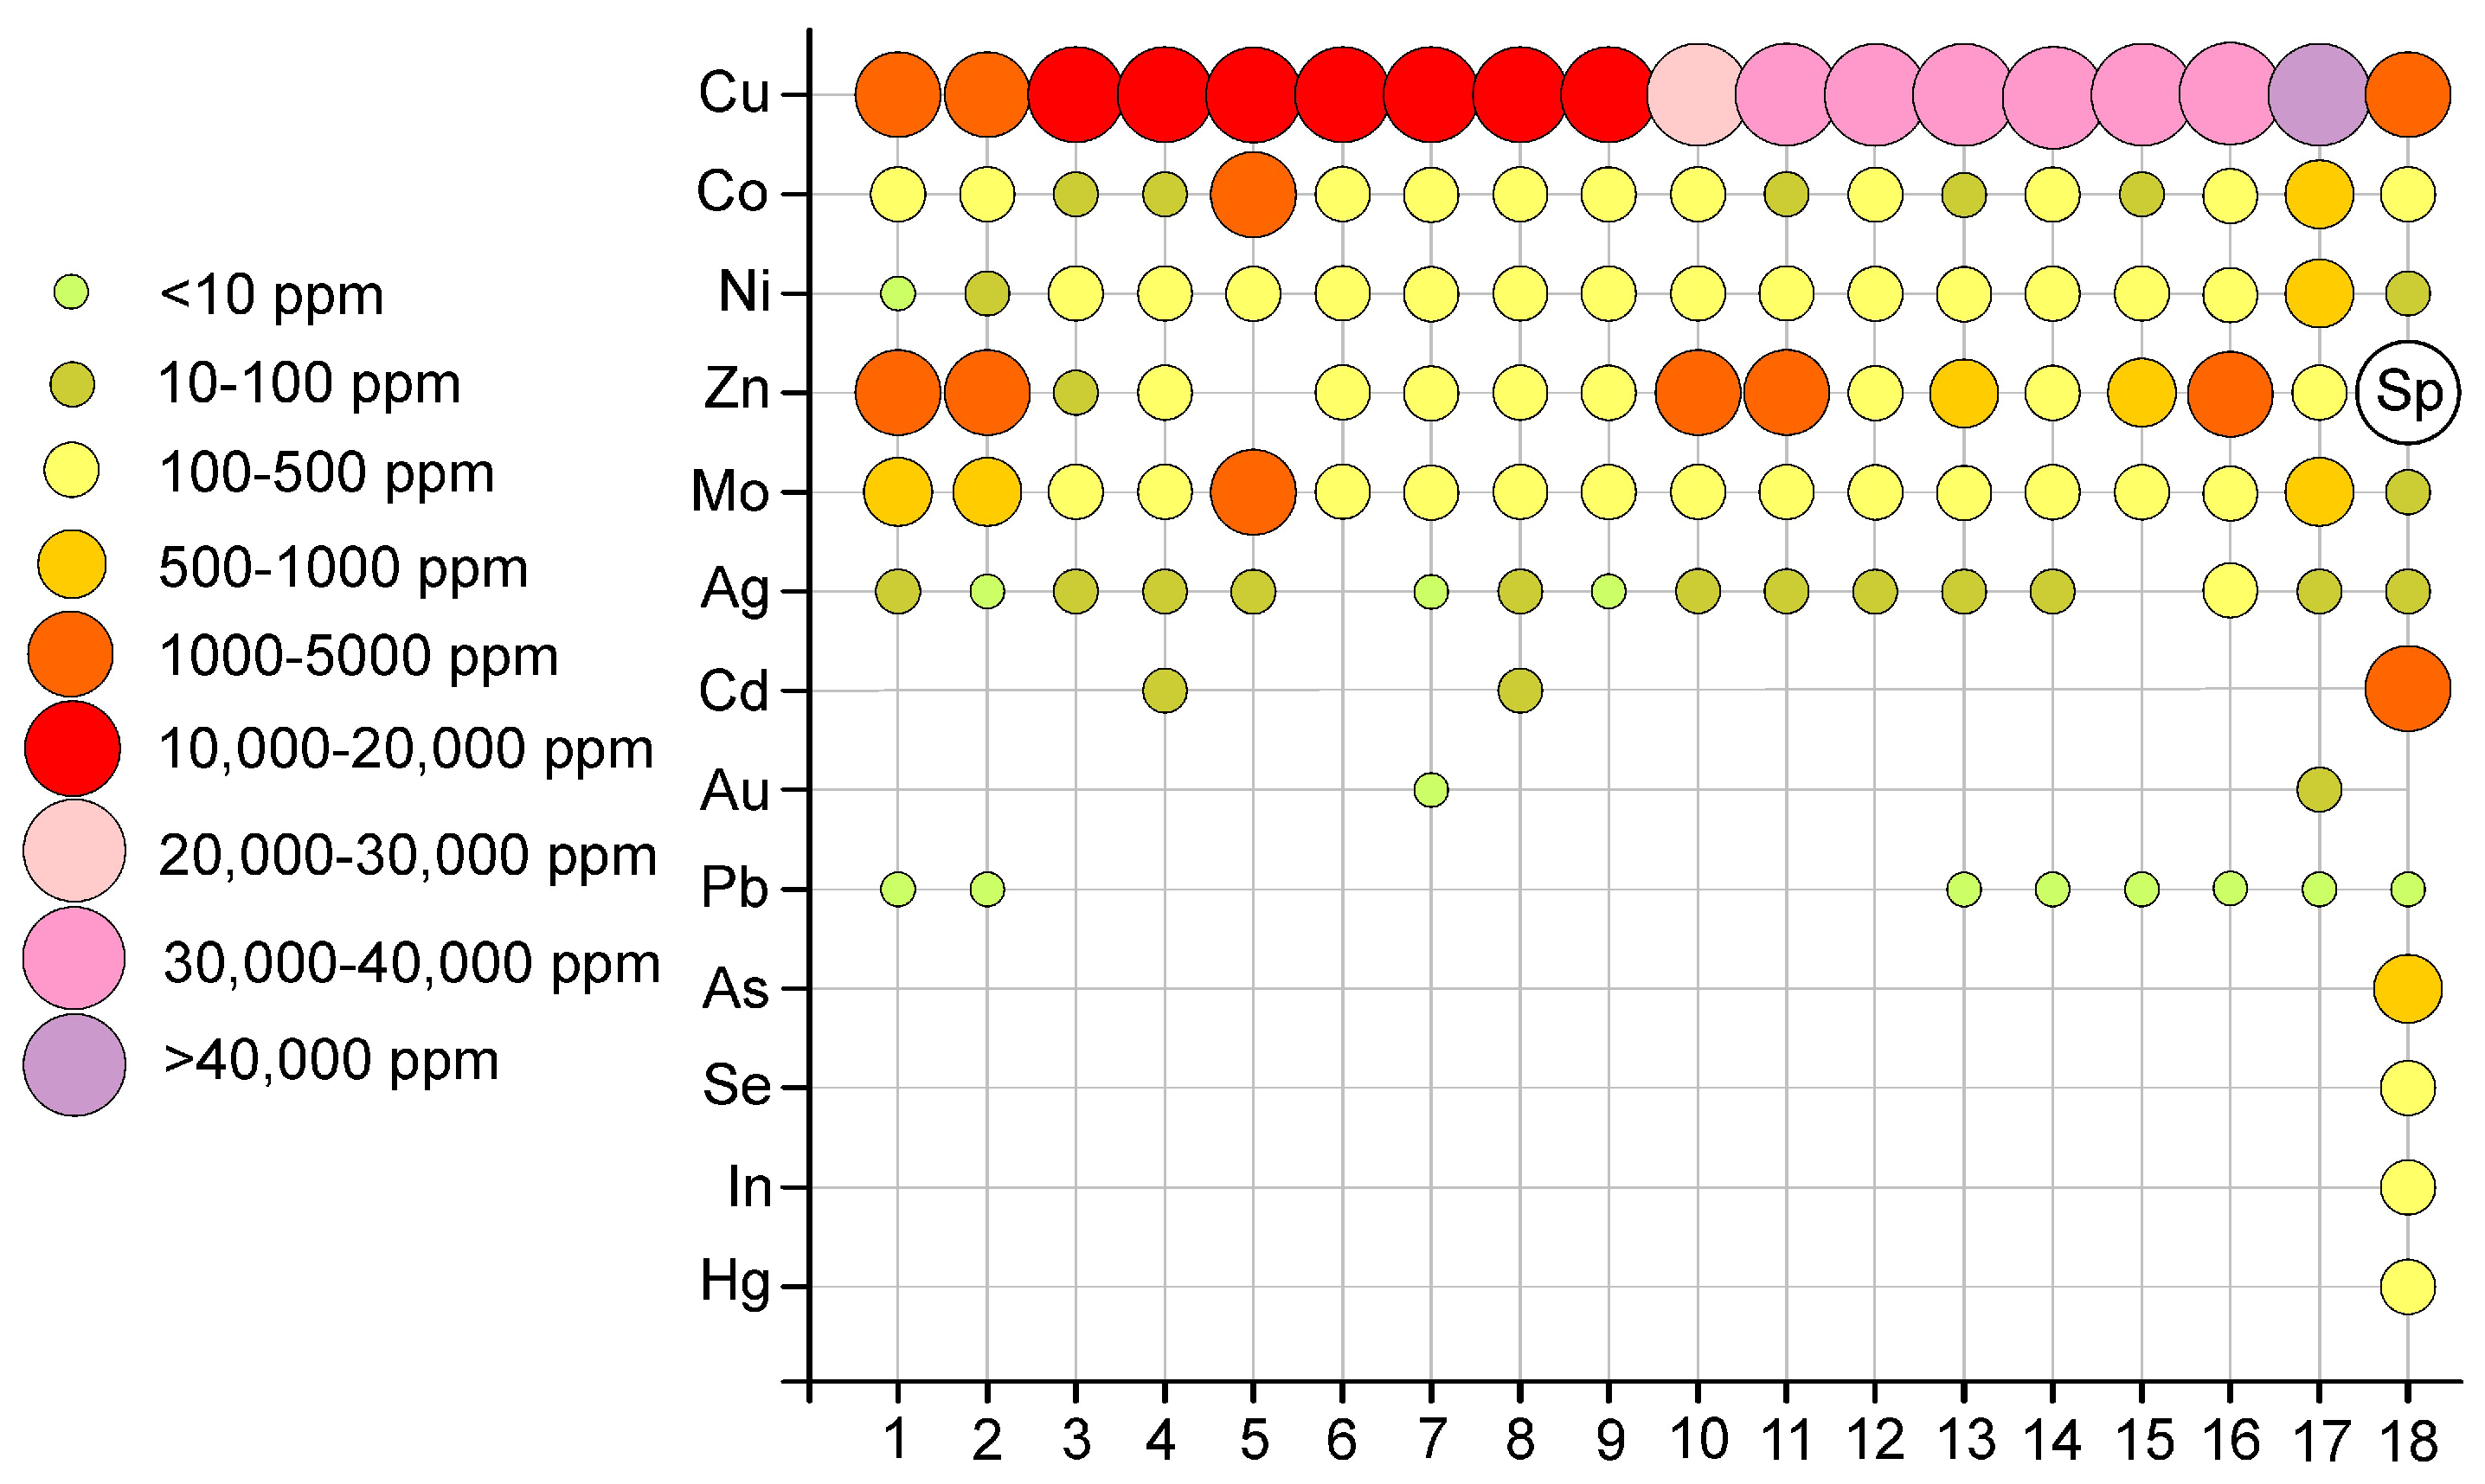
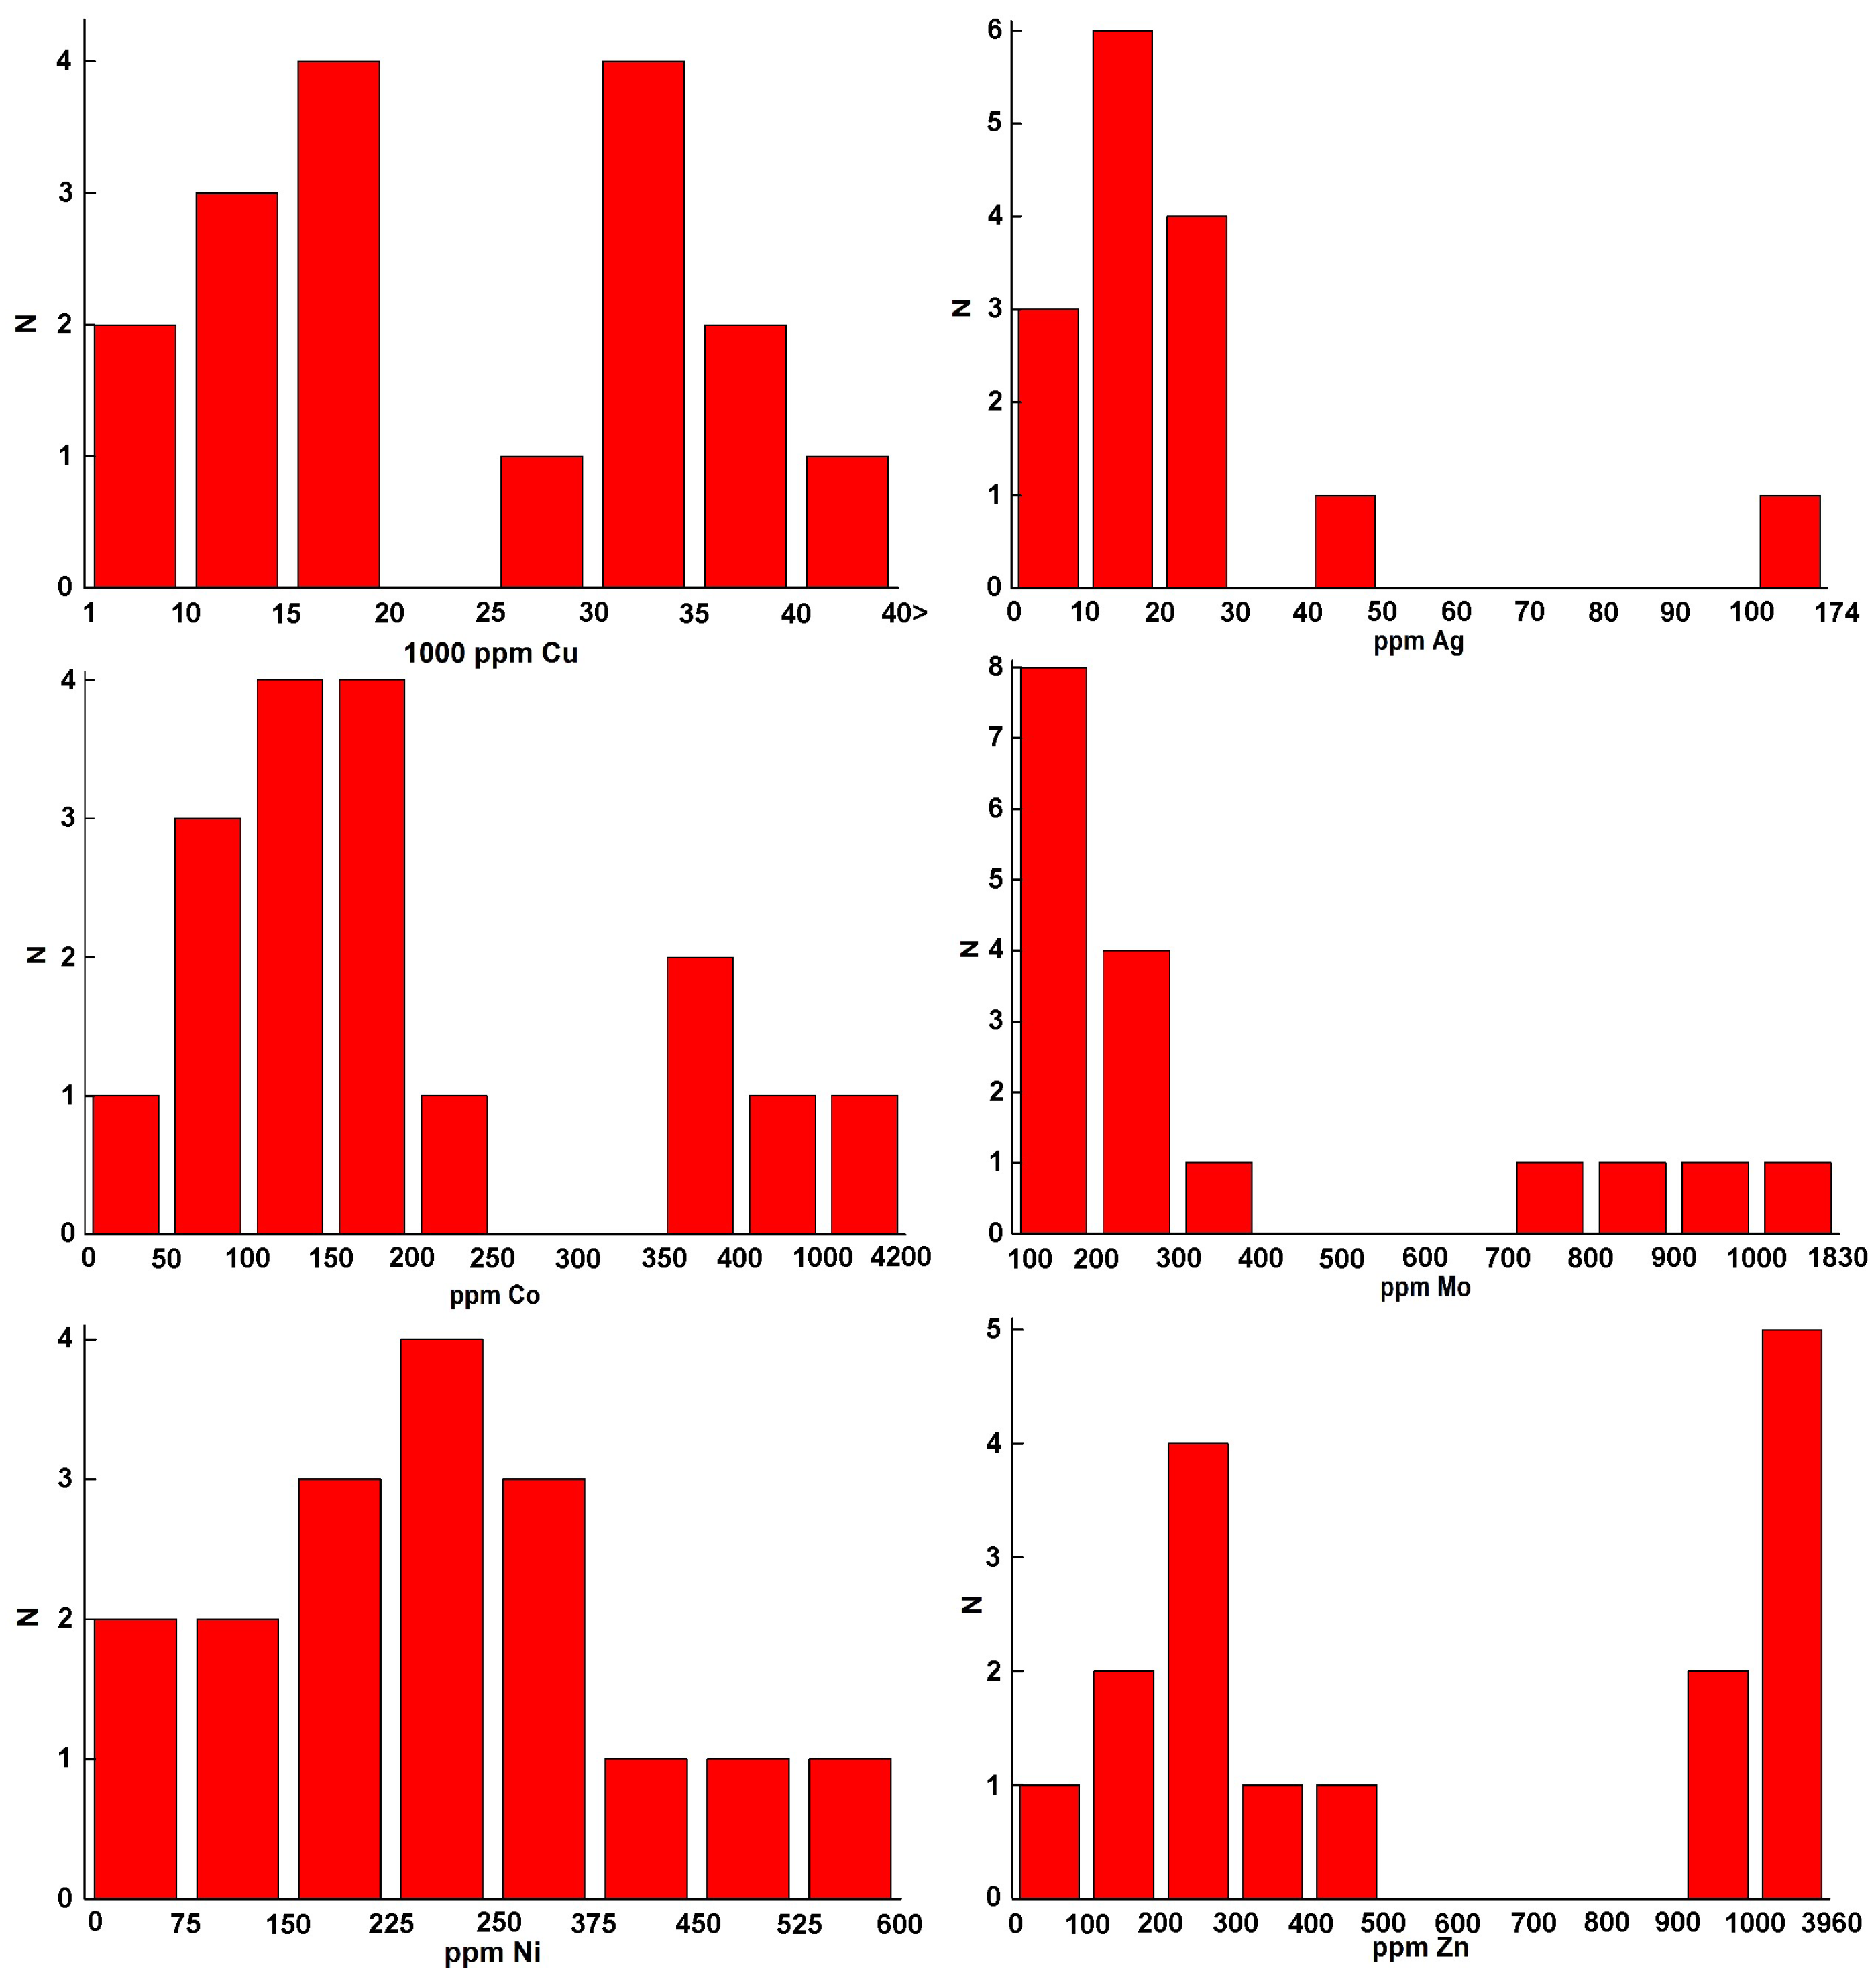
4.4.3. Composition of the Homogenized Sulfide Inclusions

The trace elements compositions of homogenized sulfide melt inclusions identified in LA-ICP-MS studies are presented in the Supplementary Materials (Table S3) and are also shown in Figure 21 and Figure 22.
Based on their content levels, the elements can be classified into the following groups:
The first group is represented only by Cu, which has a concentration of up to 5 wt.%. Correlations of Cu with other chalcophilic elements were not found. The second group consists of Co, Ni, and Mo, for which the average content is hundreds of ppm.
The third group includes Zn, the content of which forms two intervals: about 1000 ppm (7 analyses) and n*100 ppm (9 analyses). There are no intermediate values between these two concentration ranges.
The fourth group of elements (Ag, Cd, Au, and Pb) is characterized by small contents, often below the detection limit (minimum detection limits for measured values: 1.15, 11.05, 0.03, and 0.3 ppm, respectively).
Ag has the most stable distribution at the level of tens of ppm. In one inclusion, its content was 174 ppm. Ag is followed by Pb in terms of its behavior stability, but its concentration did not exceed 10 ppm in any analysis. Cd and Au were only found in quantities above the detection limit in single sulfide inclusions, and their contents did not exceed tens of ppm.

5. Discussion

5.1. Geochemistry and Petrology

This study was conducted to clarify the geological position of granite porphyry during the formation of the Salmi batholith and its genetic relationships with other associated rocks, including biotite-amphibole granite (wiborgite), fine equigranular granite, rare-metal granite, and probably gabbro-anorthosites. The geochemical and petrological features of these rocks were studied. Investigations showed that granite porphyry has similar geochemical features to rapakivi granite (Figure 9, Figure 10, Figure 11 and Figure 12).
Zr/Hf is an indicator of the Ta potential [59]. Hf is distributed in a fluorine-rich residual melt [68,69], but the total amount of Hf in the melt decreases during evolution due to the crystallization of zircon, so the ratio of Hf to Zr is accepted as an indicator. Figure 10b shows that granite porphyry crystallized from the primitive melt with the same degree of differentiation as rapakivi granite. In terms of the set of minerals and texture, these rocks can be compared with rapakivi granite. Specifically, this concerns the presence of fayalite, large phenocrysts of K-fieldspar, and oligoclase rim formation on rounded aggregates of granite paragenesis.
Rapakivi granite and more evolutionarily advanced granite (samples X#1 and X#2) break through by granite porphyry. It can be concluded that the considered granite porphyry was formed at a different time to fine equigranular granite and biotite-amphibole granite (wiborgite). According to [35], fine equigranular granite (samples AK160617-3 and AK230617-6) overlays biotite-amphibolite granite (wiborgite) from above. These fine equigranular granite samples have some similarities to fine equigranular granite in xenoliths (samples X#1 and X#2). Based on these similarities, it can be assumed that granite porphyry, being more primitive rocks, belong to a new magmatic impulse that differs from the wiborgite and fine equigranular granite impulse.
Samples AK230619–1 and 97/IH/67 are highly evolved in nature. These rocks are enriched in Ta due to their accumulation in the residual melt at the final stage of crystallization differentiation; thus, the Ta/Nb ratio increases [70]. The sharp depletion of the REE spectra in highly evolved granites can be associated with fractionation due to the formation of mineral phases containing REE in the form of the main components as well as the removal of fluorine-rich fluids or melts. The significant tetrad effect (>1.1) in sample AK230619–1 also indicates a relationship with the increasing contents of the fluid phase components (H2O, F, B, P, etc.) down to the processes of fluoride-silicate liquid immiscibility with the participation of fluoride melts [71,72,73]. In Figure 12a,b, samples AK230619–1 and 97/IH/67 are shown to be located at a distance from the area of associated rocks due to their highly evolved nature. These highly differentiated rocks were not considered in work on discrimination diagrams for A-type granitoids [56].
The presence of “nodules” in the bulk of granite porphyry enriched with apatite, ilmenite, sulfides, fluorite, zircon, Fe, and Mg with an increasing presence of biotite and amphibole suggests that these are primarily crystallized emulsion droplets from a Fe-enriched melt. A similar situation was observed in the anorthosite-containing Skaergaard intrusion [74]. In general, the association of anorthosites, as noted above, is characteristic of Proterozoic complexes containing rapakivi granite. These rocks were found in the southeastern part of the Salmi batholith [33] (Figure 2), which suggests the presence of anorthosites and associated gabbro in the northwestern tip of the batholith. Rocks of increased density found under the lower surface of Salmi batholith granite (Figure 2), according to the interpretation of the gravimetric data [36], appear to be intrusive bodies with medium–mafic compositions. However, these rocks are located at a depth that was not uncovered by drilling, and there is no information about their age and composition.

5.2. Zircon

The morphology and composition of the studied zircon grains indicate that they are all of magmatic genesis and formed at high temperatures for granites. The temperature at which the studied zircon formed was determined by the Ti content, according to [24], as shown in Figure 16, Figure 17 and Figure 18. During the calculation, it was assumed that aTiO2 = 1. The formation temperature of the studied zircon grains varied from 925 to 765 °C. Such a change in the Ti content can be caused by two factors: either a change in the activity of the component or a change in the temperature in the system during crystallization.
For these points, there is a sharp outburst at temperatures of up to 1236 °C (the maximum defined value). In addition to the growth in the Ti content at these points, there are also increases in the Li content to 3–6 ppm and the Ba content to 70–300 ppm. In connection with the above, these analysis points were rejected as they are deliberately contaminated with the inclusions of mineral phases. Thus, they are not presented in this work. However, to allow a better understanding of the complete set of data obtained and the methods of data rejection employed, they are presented in the Supplementary Materials (Table S2).
In zircons with sulfide inclusions, it was shown that the capture of the sulfide solid phase and melt inclusions of the first variety occurred in the temperature range of 914 to 841 °C. The capture of sulfide melt inclusions of the second type (with sphalerite) probably occurred at lower temperatures of up to 765 °C.
The temperature estimates obtained using a Ti thermometer due to the uncertainty of titanium activity in the system are the maximal values. The Ti-phase ilmenite is widely present in the rock, and single grains of TiO2 were also detected in the bulk by EPMA. However, due to the small sizes of these grains (several micrometers), it is impossible to uniquely determine their source. The real temperatures are probably lower.
These temperatures can be compared with the rock formation temperature estimated according to the solubility of Zr in a silicate melt [75]. For the granite porphyry samples AK220617-1, AK220617-1_2, AK230619-3, and AK230619-4, the temperatures were 936, 914, 993, and 980 °C, respectively. Based on petrographic observations, zircon is considered to be one of the first liquidus phases in these rocks, along with ilmenite and apatite. The maximum temperatures of zircon formation are similar to the estimated rock formation temperatures obtained by another method. However, in general, the latter are somewhat higher. When determining the rock formation temperature, there is uncertainty associated with the content of alkali metal oxides due to the uneven distribution of feldspar phenocrystals. If we consider the fractionation of feldspar phenocrystals, and as a consequence, a decrease in the content of alkali metals in the rock, this will lead to an overestimation of the temperature determined by this method. From the presented estimates, it can be concluded that the early stages of the formation of the studied rocks occurred at relatively high values for acidic magmatism.
The obtained values must be compared with the available temperature estimates for the formation of such rocks. In [76], there is an overview of the T-P conditions for the formation of rocks of ARG complexes defined by various authors. The maximum temperature of the wiborgite formation in the Salmi batholith, determined using mineral thermometers (Amph-Pl, Amph-Bi, Mag-Ilm) is in the range of 750–780 °C [31,77]. The crystallization temperature of zircon from Salmi batholith granitoids [9] estimated by a method based on the solubility of Zr in a silicate melt [75] is in the temperature range of 940–840 °C [27]. The estimated formation temperatures of the Jaala–Iitti hybrid rock complex associated with the Wiborg batholith [15] are as follows: quartz porphyry, 650–850 °C; invasive mafic-hybrid enclaves in granites, 750–900 °C (Px thermometry, micas comparison, Amph thermobarometers).
The investigated zircon grains from Salmi batholith granite porphyry dikes were shown to have similar temperature values for the beginning of zircon crystallization for granitoids of the same batholith.
To compare the geochemical characteristics of zircon with zircon from other rocks from the Salmi batholith, we can use the data published in [27]. The Th/U ratio in granite porphyry zircon is identical to the ratio for granite rocks of the Salmi batholith: 0.4–0.92. The maximum Th/U ratio of 0.6–0.7 occurs in the central parts of zircon grains; however, this ratio is lower than that measured for olivine gabbro: 0.94–2.03. The total content of U in granite porphyry zircon, (on average, less than 100 ppm, single analyses up to 218) is identical to the content in rapakivi granite (piterlites): 8–210. These values fall within the range of the “brown” population of zircons from various granite rocks of the batholith (from 11.5 to 460 ppm).
In general, the content of HREE decreases towards the marginal parts of the grains. This decrease is probably reflecting a decrease in the HREE concentration during the evolution of the melt composition.
Sulfide inclusions of one pyrrhotite phase, or consisting of several sulfide phases, as well as sulfide and silicate phases with a common boundary, were found in the granite porphyry zircon. These inclusions indicate the presence of not only sulfide minerals at the time of capture, but also sulfide melts. This information is extremely important for understanding the metallogenic potential of primitive granitoids associated with ARG complexes as well as determining ways to assess this potential.

5.3. Solid-Phase Inclusions

The analysis of solid-phase inclusion information allowed us to draw some petrological conclusions:
The presence of fayalite inside Zrn17 (Figure 20c) restricts the redox conditions at the time of inclusion entrapment. According to the Ti thermometer, the temperature for this zircon grain near the captured inclusion is 905 °C (Figure 17, Zrn17). The area of fayalite stability at these temperatures is about −12.5 log ƒO2 or lower [78].
The presence of fluorite crystals inside Zrn5 (Figure 20a) allows us to conclude that the capture of fluorite occurred in the field of its stability.
According to the data presented in [79], the composition of magnetite-ulvöshpinel solid solution from the inclusion in zircon (Zrn17) (See Supplementary Materials, Table S3) corresponds to the composition of spinel from alkaline gabbro and anorthosites.

5.4. Inclusions of Heterophase Capture: Silicate-Sulfide
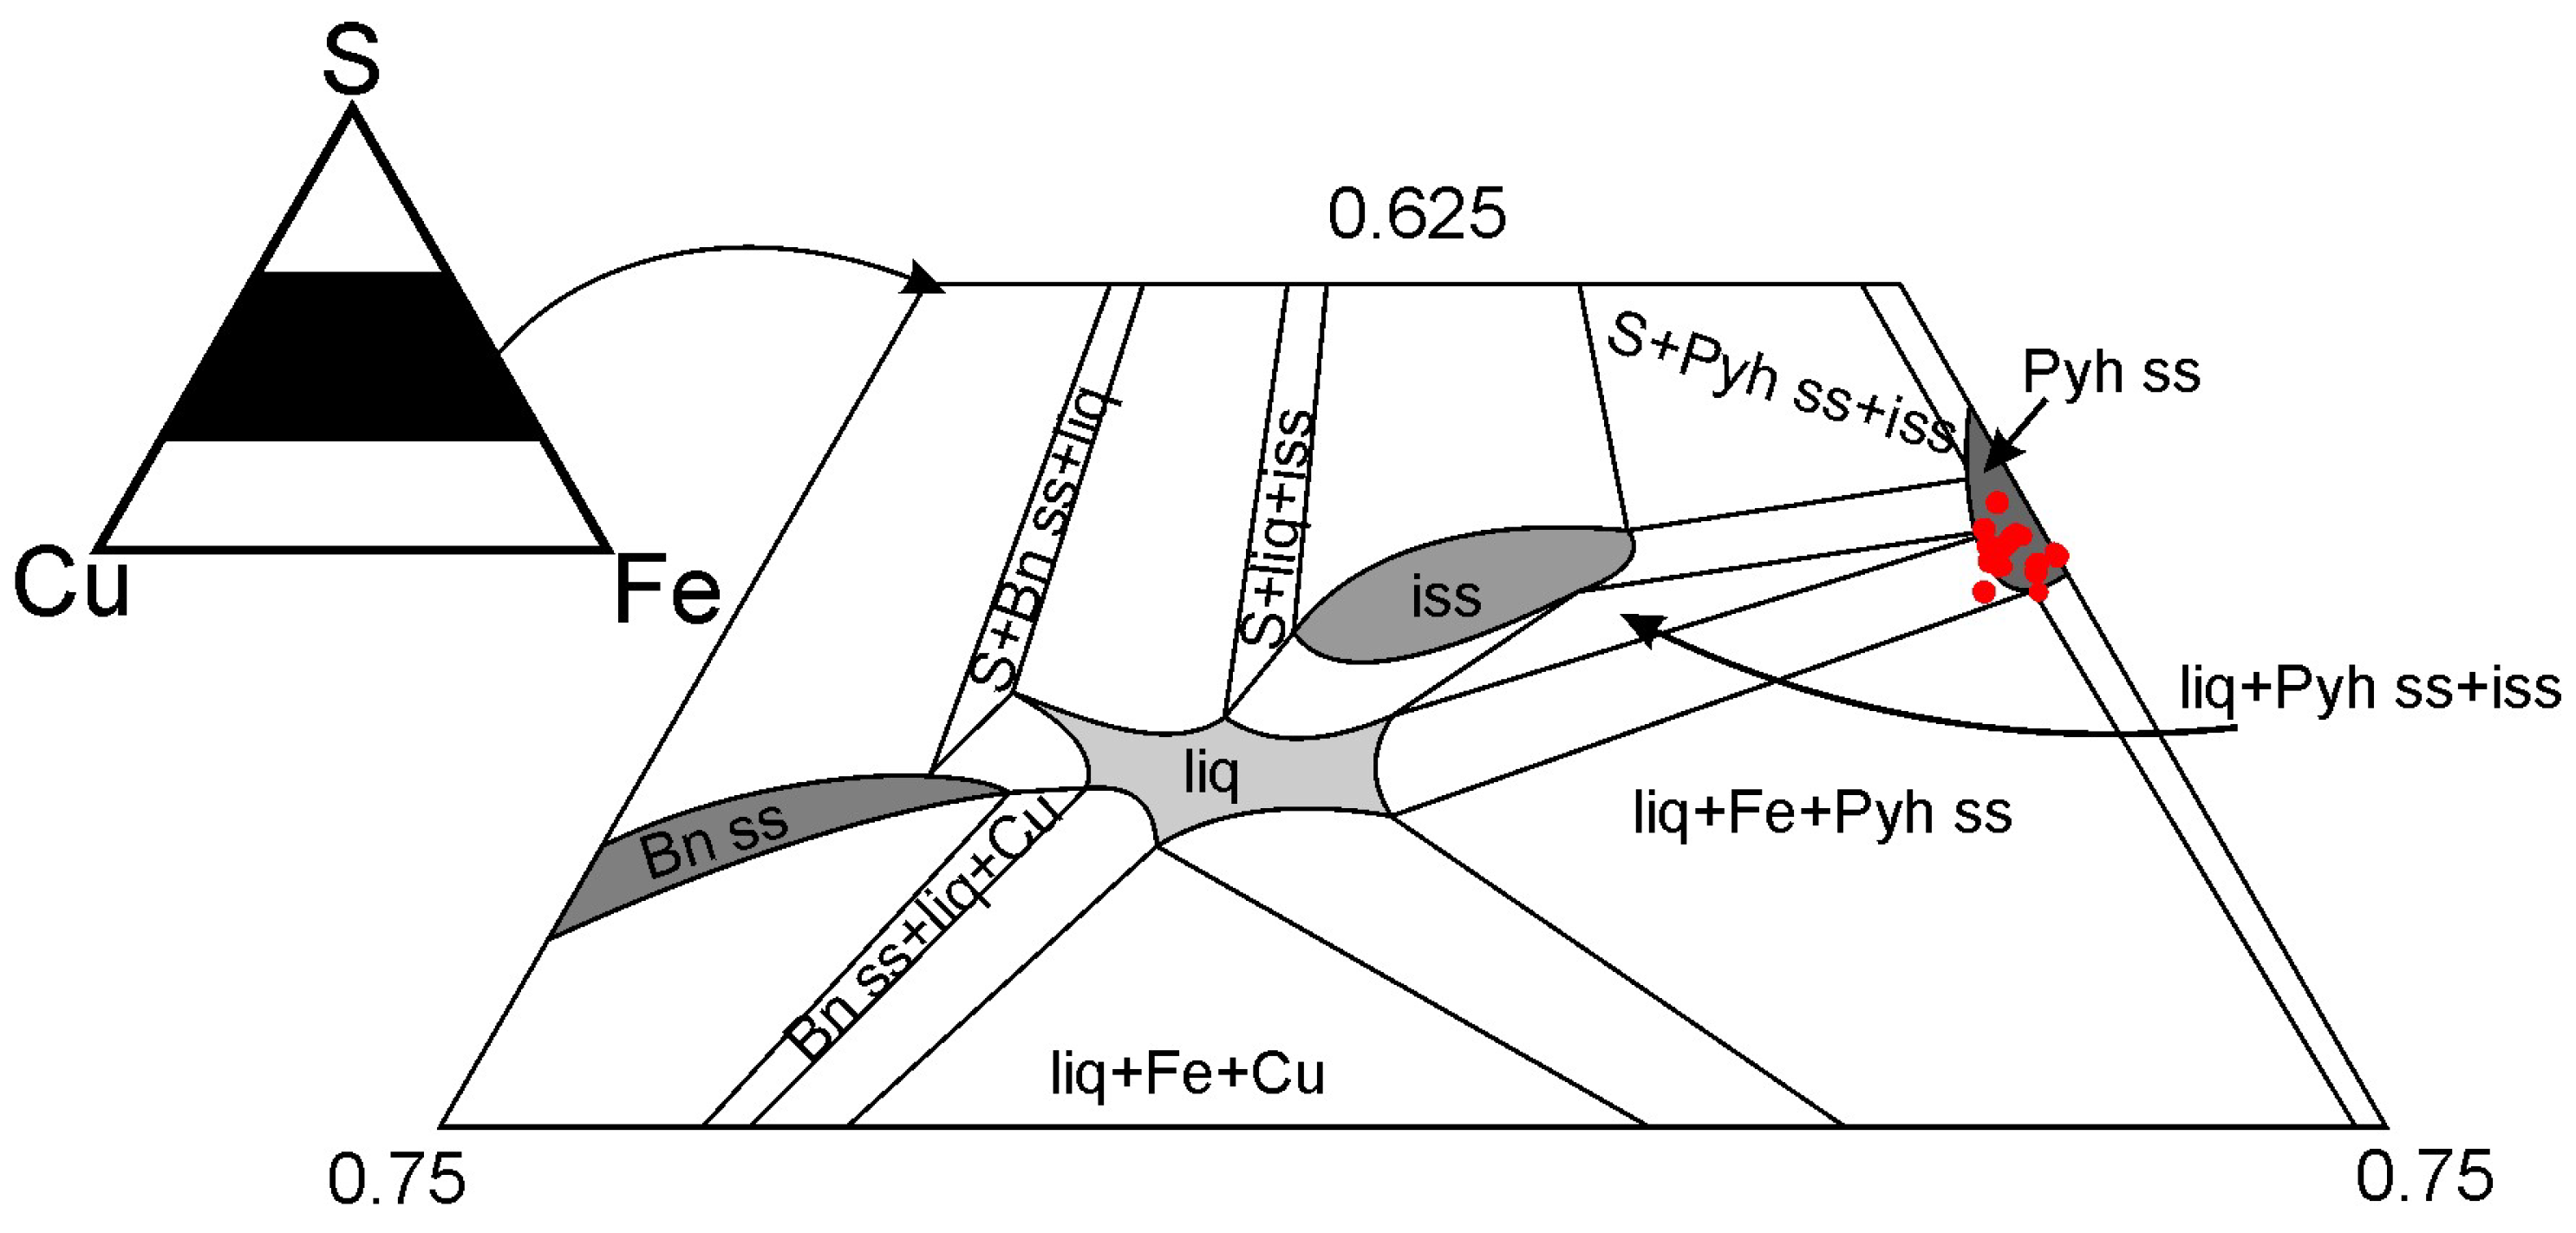
The relative position of chalcopyrite between the pyrrhotite and silicate parts (Figure 19g–i) sheds light on the capture conditions of the inclusion material.
Pyrrhotite has the highest specific gravity (4.6–4.7 g/cm3) and is a higher temperature mineral than chalcopyrite. As pyrrhotite crystallizes, the residual sulfide melt becomes enriched with Cu [80], and during the crystallization of pyrrhotite, it is present on the upper surface of the sulfide droplet. The specific gravity of the silicate melt is less than that of chalcopyrite (4.1–4.3 g/cm3). Under the influence of gravity and crystallization forces, the inclusion of a heterophase capture (silicate and sulfide melt) will undergo stratification with an intermediate phase in terms of the specific gravity located in the center. This can be explained by the capture of the material in the liquid state.

5.5. Sulfides

Available data on the 17 sulfide melt inclusions allowed us to draw the following conclusions: firstly, these sulfides are a crystallized melt with a pyrrhotite-chalcopyrite composition, in which Co, Ni, Zn, Mo, Ag, Cd, Au, and Pb are present in subordinate amounts. All of the obtained compositions of homogenized sulfide inclusions were in the region of a solid solution of pyrrhotite at 800 °C with a slight capture of the Po ss + liq region (Figure 23). However, due to the limitation in terms of the analytical size of laser ablation, only large melt inclusions above 20 μm in diameter were measured in this work, despite many of these inclusions having diameters of less than 10 μm. In smaller melt inclusions, the Cu content may vary greatly. For example, as shown in Figure 19h,i, within one grain of zircon, in various inclusions, the ratio of the area of pyrrhotite to chalcopyrite (chalcopyrite-sugakiite-like) in the polishing plane is 1.6 for the smaller inclusions and 3.5 for the larger inclusions. When the pyrrhotite/chalcopyrite ratio in the melt inclusion is equal to 1.6, the Cu content can reach 13 wt%. According to [81], at the capture temperature of the sulfide inclusions, there is still a melt region in the Fe-Cu-S system, as well as areas of the equilibrium melt + solid phase. The source of melt sulfide inclusions of the first variety could be magma with a mafic composition.
As noted above, significant Zn contents were found in 16 inclusions; of these, 9 inclusions had a Zn content of 0 to 405 ppm, and 7 inclusions had a content of greater than 909 pm. The Zn content in the inclusions increased to such an extent that sphalerite became the main mineral phase in Zrn33. Three variants of the appearance of a Zn-rich melt can be assumed: the evolution of a sulfide melt, contamination of a sulfide melt with sphalerite, and sulfide anatexis.
In order to bring some clarity about the genesis of this Zn-bearing melt, it is necessary to consider the possible sources and mechanisms of its occurrence. The concentration of Zn in the melt during the crystallization differentiation of the initial sulfide melt suggests that a melt with low Zn contents will not be present in parallel with it. As a source of a Zn-rich sulfide melt, it can be assumed that the contamination of Zn-bearing sulfide mineralization already existed before the intrusion of granite porphyry. A Zn-rich sulfide melt, theoretically, potentially appeared due to the assimilation of a certain number of skarns with sphalerite, located at the level of the modern erosion section. However, xenoliths of skarns with sulfide mineralization do not bear traces of assimilation, as previously mentioned for the studied rocks [45,82]. Zircon is one of the early liquidus phases, so its inclusions should reflect earlier stages of rock formation. The source of a Zn-rich melt could also be located at deeper horizons.
In order to assess the probable sources of sulfide melt during the anatexis of a sulfide substance, it is necessary to consider the existing experimental work on the melting of various mineral associations of sulfides. According to [81], under the melting of the pyrite-pyrrhotite-chalcopyrite association (Fe-Cu-S system), at 800 °C, the melt should be significantly enriched with Cu. As the temperature increases, the region of existence of the melt in the Cu-Fe-S system expands [83]. However, the measured compositions of the sulfide melt inclusions lie close to the region of existence of a solid pyrrhotite solution, which contradicts the idea that the Fe-Cu-S melt is significantly enriched with Cu as a result of the anatexis process.
The melting of the pure phases of sphalerite and pyrrhotite occurs at 1680 and 1195 °C [84], and the melting of chalcopyrite occurs at 850 °C [85]. The melting point of the pyrrhotite-sphalerite mixture is 1180 °C [84]. Melting temperatures in more complex systems are significantly lower: pyrrhotite-galena-sphalerite, 800 °C [86]; pyrite-galena-chalcopyrite-sphalerite, about 730 °C at 200 MPa [87].
In the Fe-Cu-Pb-Zn-S system, Zn has the lowest solubility in the newly formed melt of the above components [87]. Its concentration increases slightly as the temperature increases, reaching 1.8 wt% in the melt at 1000 °C (9000–17,000 ppm estimated for quartz-porphyry formation temperatures). Based on data on the composition of anatectic melts in the Fe-Cu-Pb-Zn-S system, it is impossible to obtain a melt in which a component identical in composition to sphalerite is the main one.
If we take these data into account, the assimilation of sphalerite grains by this sulfide melt may explain the presence of elevated Zn up to thousands of ppm. However, this mechanism cannot explain the formation of an inclusion in which sphalerite is the main phase (Zrn33). The melting point of pure sphalerite is too high for magmas to form rocks associated with ARG complexes. However, there are predominantly round-shaped inclusions with a common outer boundary of the sphalerite phase and chalcopyrite decay lammels. This favors the capture of inclusions in the liquid state before decay. This is a documented fact that was observed in zircon Zrn33 (Figure 20e,f).
In the Zn-rich sulfide inclusion in Zrn33, arsenopyrite was also identified from the mineral phases. Arsenopyrite melts at 670 °C [88], and in a mixture of pyrite-arsenopyrite, it melts at 491 °C [89]. Since this mainly “sphalerite” inclusion in Zrn33 was not homogenized and about one-third of its volume was destroyed during polishing, its trace element composition does not adequately reflect its real composition. The presence of components, such as As, Se, Hg, and Cd, as well as volatile ones, can lower the melting point. The influence of volatile components in a sulfide melt on the phase equilibria and their quantitative presence is rarely studied. This is due to the complexity of quenching the sulfide melt [53,54]. Based on natural observations regarding the presence of rims of water-containing minerals around magmatogenic sulfide separations and the internal structure of hardened sulfide melt droplets, some authors concluded that the sulfide melt can dissolve volatile components itself [90,91,92,93,94,95,96]. In the pyrrhotite-water system, at 100 MPa and 1000–1160 °C, water dissolves well in the sulfide melt (up to 10 wt.%) with a simultaneous decrease in the solidus temperature, as experimentally established by [97]. In the pyrrhotite-galena-sphalerite system, a decrease in the melting temperature was detected in the presence of water [98]. Cl accumulates in the residual sulfide melt after the crystallization of MSS (monosulfide solid solution), while the melting point of MSS in the Fe–Cu–Ni–S system decreases in the presence of Cl, as experimentally established by [99].
From the above information, it can be concluded that the presence of volatile components, as well as, probably, As, Se, Hg, and Cd, can have a positive effect by reducing the melting point in the Zn-Cu-S system. However, the source of the Zn-rich sulfide melt remains unclear.

5.6. Dynamic Aspects of Implementation

In order to understand the transportation process of sulfide liquids by acidic silicate melt, it is necessary to consider some dynamic aspects of the formation of dikes and the genetic relationships of the rocks belonging to the ARG complexes.
When cracks open and are infilled by the granite porphyry magma, due to its lower viscosity, the sulfide melt rushes into the zone of reduced pressure [100]. During the filling of cracks by acidic magma, owing to its high viscosity, it is able to transport sulfide droplets up to 500 μm without precipitation [100]. Achieving an equilibrium in the composition between two sulfide melts in the form of an emulsion in a highly viscous acidic melt is difficult. Given the abundance of sulfide melt inclusions in zircon, zircon should have a surface with good wettability with sulfide liquids.

6. Conclusions

  • The relative time position of the studied granite porphyry dikes relative to other rocks associated with the Salmi batholith, an ARG complex, was clarified in this paper. Granite porphyry dikes were formed after amphibole-biotite granite (rapakivi) and fine equigranular granite, but before the introduction of rare-metal granite dikes;
  • The physical–chemical parameters of zircon formation from granite-porphyry dikes were determined for the first time. According to the Ti-zircon thermometer [24], the maximum temperature was 925 °C. The ƒO2 values for the early stages of rock formation were in the region below the boundary of the FMQ buffer. It was qualitatively determined that the formation occurred in the field of fluorite stability in the presence of CO2-forming carbonates during the crystallization of silicate melt inclusions;
  • The composition of a sulfide melt coexisting with magma of granite porphyry based on the melt inclusions of sulfide melts in zircon was characterized for the first time. The presence of two sulfide melts at the time of capture for the sulfide inclusions by the zircon, pyrrhotite-chalcopyrite, and sphalerite-chalcopyrite compositions was established;
  • The connection between the formation of granite porphyry with mafic melts that formed rocks of the gabbro and anorthosite types was established. It is likely that the injection area of the material was an acidic magmatic chamber connected with a magmatic melt with a mafic composition.

Supplementary Materials

The following supporting information can be downloaded at: https://www.mdpi.com/article/10.3390/min13040527/s1, Table S1: Rock geochemistry.xls, Table S2: Zrn geochemistry.xls, Table S3: EPMA data.xls, Table S4: LA-ICP-MS data.xls.

Funding

This research was funded by a state assignment to the Institute of Geology Karelian Research Centre RAS. At the early stages, this work was supported by RFBR grants: 15-05-03393 and 18-05-01101.

Data Availability Statement

All data are contained within the article and Supplementary Materials.

Acknowledgments

I am grateful to the following people: M.E. Zelensky for the introduction to the world of sulfide melt inclusions; N.A. Krivolutskaya for comments made during the preparation of the manuscript, Yu.A. Kostitsyn, A.E. Marfin, N.A. Nekrylov, V.I. Ivashchenko, and N.S. Gorbachev for discussing certain issues; A.M. Larin and A.M. Belyaev for consultation on the geology of the Salmi batholith; N.A. Nekrasov, D.Varlamov, K.Van, S.I. Demidova, K.A. Lorentz, V.D. Abramova, S.G. Simakin, E.V.Potapov, A.I.Yakushev, and V.K. Karandashev for their analytical research; A.A. Terekhin and N.I. Kuznetsov for conducting the experimental work, and two anonymous reviewers for helping to make this manuscript better.

Conflicts of Interest

The author declares no conflict of interest.

References

  1. Larin, A.M. Rapakivi Granites and Associated Rocks; Nauka: St. Petersburg, Russia, 2011; p. 410. (In Russian) [Google Scholar]
  2. Rämö, O.T.; Haapala, I. One hundred years of Rapakivi Granite. Mineral. Petrol. 1995, 52, 129–185. [Google Scholar] [CrossRef]
  3. Liverton, T.; Botelho, N.F. Fractionated alkaline rare-metal granites: Two examples. J. Asian Earth Sci. 2001, 19, 399–412. [Google Scholar] [CrossRef]
  4. Konopelko, D.; Biske, G.; Belyatsky, B.; Eklund, O.; Seltmann, R. Hercynian post-collisional magmatism of the SE Tien Shan, Kyrgyzstan: Timing and metallogenic potential. In Proceedings of the International Field Symposium “Paleozoic Geodynamic Processes and Metallogeny of Chinese Altay and Tianshan”, Urumqi, China, 9–21 August 2003; pp. 10–15. [Google Scholar]
  5. Vorma, A. On the petrochemistry of rapakivi granites with special reference to the Laitila massif, southwestern Finland. Geol. Surv. Finland Bull. 1976, 285, 98. [Google Scholar]
  6. Sharkov, E.V. Middle-Proterozoic anorthosite–rapakivi granite complexes: An example of within-plate magmatism in abnormally thick crust: Evidence from the East European Craton. Precambr. Res. 2010, 183, 689–700. [Google Scholar] [CrossRef]
  7. Vaasjoki, M.; Rämö, O.T.; Sakko, M. New U-Pb ages from the Wiborg rapakivi area: Constraints on the temporal evolution of the rapakivi granite-anorthosite-diabase dyke association of southeastern Finland. Precambr. Res. 1991, 51, 227–243. [Google Scholar] [CrossRef]
  8. Rämö, O.T.; Nironen, M.; Kosunen, P.; Elliot, B.A. Proterozoic Granites of South-Central Finland—Travel Across a Paleoproterozoic Terrane Boundary. Field Trip Guide; Helsinki University Press: Helsinki, Finland, 1999; p. 106. [Google Scholar]
  9. Neymark, L.A.; Amelin, Y.V.; Larin, A.M. Pb-Nd-Sr isotopic and geochemical constraints on the origin of the 1.54–1.56 Ga Salmi rapakivi granite–Anorthosite batholith (Karelia, Russia). Contrib. Mineral. Petrol. 1994, 50, 173–193. [Google Scholar] [CrossRef]
  10. Rämö, O.T. Petrogenesis of the Proterozoic rapakivi granites and basic rocks of Southeastern Fennoscandia Nd and Pb isotopic and general geochemical constraints. Geol. Surv. Finland Bull. 1991, 355, 161. [Google Scholar]
  11. Larin, A.M.; Amelin, Y.; Neymark, L.; Krymsky, R.; Ovchinnikova, G.; Belyaev, A.; Shebanov, A. The origin of Salmi and Uljalegi anorthosite rapakivi granite massifs. Constraints from precise U-Pb geochronology and Pb-Sr-Nd isotopic data. In Proceedings of the 7th International Symposium on Rapakivi Granites and Related Rocks, Helsinki, Finland, 24–26 July 1996; p. 47. [Google Scholar]
  12. Eklund, O.; Frojdo, S.; Lindberg, B. Magma mixing, the petrogenetic link between anorthositic suites and rapakivi granites, Aland, SW Finland. Mineral. Petrol. 1994, 50, 3–19. [Google Scholar] [CrossRef]
  13. Andersson, U. Petrogenesis of Some Proterozoic Granitoid Suites and Associated Basic Rocks in Sweden (Geochemistry and Isotope Geology). Doctor Dissertation, SGU, Uppsala, Sweeden, 1997; p. 217. [Google Scholar]
  14. Boyd, W.W.; Rämö, O.T. Mixing and mingling in the late stages of the evolution and emplacement of the Wiborg rapakivi batholith SE Finland. In Proceedings of the 7th International Symposium on Rapakivi Granites and Related Rocks, Helsinki, Finland, 24–26 July 1996; p. 10. [Google Scholar]
  15. Salonsaari, P.T. Hybridization in the subvolcanic Jaala-Iitti complex and its petrogenetic relation to rapakivi granites and associated mafic rocks of southern Finland. Bull. Geol. Soc. Finland 1995, 67, 104. [Google Scholar] [CrossRef]
  16. Dall’Agnol, R.; Teixeira, N.P.; Rämö, O.T.; Candido, M.A.V.; Macambira, M.J.B.; Oliveira, D.C. Petrogenesis of the Paleoproterozoic rapakivi A-type granites of the Archean Carajas metallogenic province, Brazil. Lithos 2005, 80, 101–129. [Google Scholar] [CrossRef]
  17. Charlier, B.; Namur, O.; Malpas, S.; Marneffe, C.; Duchesne, J.-C.; Auwera, J.V.; Bolle, O. Origin of the giant Allard Lake ilmenite ore deposit (Canada) by fractional crystallization, multiple magma pulses and mixing. Lithos 2010, 117, 119–134. [Google Scholar] [CrossRef]
  18. Sharkov, E.V. Intraplate magmatic systems of the Mesoproterozoic by the example of anorthosite rapakivi granite complexes of baltic and ukrainian shields. Russ. J. Earth Sci. 1999, 1, 311–337. (In Russian) [Google Scholar] [CrossRef]
  19. Valkama, M.; Sundblad, K.; Cook, N.J.; Ivashchenko, V.I. Geochemistry and petrology of the indium-bearing polymetallic skarn ores at Pitkäranta, Ladoga Karelia, Russia. Miner. Depos. 2016, 51, 823–839. [Google Scholar] [CrossRef]
  20. Trüstedt, O. Die Erzlagerstätten von Pitkäranta am Ladoga-See. Bull. Comm. Géol. Finlande 1907, 19. (In German) [Google Scholar]
  21. Khazov, R.A. Geological Features of tin ore Mineralization of Northern Ladoga Region; Trudy of Geological Instute Karelian Branch of USSR Akademy of Science: Leningrad, Russia, 1973; p. 87. (In Russian) [Google Scholar]
  22. Velichkin, V.I.; Tarasov, N.N.; Andreeva, O.V.; Kiseleva, G.D.; Krylova, T.L.; Doinikova, O.A.; Golubev, V.N.; Golovin, V.A.; Kushnerenko, V.K. Geology and formation conditions of the Karku unconformity-type deposit in the northern Ladoga region (Russia). Geol. Ore Depos. 2005, 47, 87–112. [Google Scholar]
  23. Ivashchenko, V. Geology, geochemistry and mineralogy of indium resources at Pitkäranta Mining District, Ladoga Karelia, Russia. J. Geochem. Explor. 2022, 240, 107046. [Google Scholar] [CrossRef]
  24. Watson, E.B.; Wark, D.A.; Thomas, J.B. Crystallization thermometers for zircon and rutile. Contrib. Mineral. Petrol. 2006, 151, 413–433. [Google Scholar] [CrossRef]
  25. Levkovskiy, R.Z. Geological geological structure and mechanism of rapakivi massifs formation in the northwestern part of the Kola peninsula. In Petrography of the Precambrian of the Russian Platform; Naukova dumka: Kiev, Ukraine, 1970; pp. 135–143. (In Russian) [Google Scholar]
  26. Gorokhov, I.M.; Kuznetsov, A.B.; Azimov, P.Y.; Dubinina, E.O.; Vasilieva, I.M.; Rizvanova, N.G. Sr and C Isotope Chemostratigraphy of the Paleoproterozoic Metacarbonate Rocks of the Sortavala Group: Fennoscandian Shield, Northern Ladoga Area. Stratigr. Geol. Correl. 2021, 29, 121–139. [Google Scholar] [CrossRef]
  27. Amelin, Y.V.; Larin, A.M.; Tucker, R.D. Chronology of multiphase emplacement of the Salmi rapakivi granite-anorthosite complex, Baltic Shield: Implications for magmatic evolution. Contrib. Mineral. Petrol. 1997, 127, 353–368. [Google Scholar] [CrossRef]
  28. Sahama, T.G. On the chemistry of the East Fennoscandian Rapakivi Granites. Bull. Comm. Geol. Finlande 1945, 136, 15–67. [Google Scholar]
  29. Sviridenko, L.P. Petrology of Salmi Rapakivi Granite Massif (in Karelia); Trudy of Geological Instute Karelian Branch of USSR Akademy of Science, Karelian Book Publishing House: Petrozavodsk, Russia, 1968; 116p. (In Russian) [Google Scholar]
  30. Nikolskaya, Z.D. New data about geology and metallogeny of Salmi rapakivi massif (Karelia). Tr. VSEGEI New Ser. 1975, 230, 52–57. (In Russian) [Google Scholar]
  31. Velikoslavinsky, D.A.; Birkis, A.P.; Bogatikov, O.A. Anorthosite-Rapakivi Granite Formation of the East European Platform; Mitrofanov, F.P., Ed.; Nauka: Leningrad, Russia, 1978; p. 296. (In Russian) [Google Scholar]
  32. Konyshev, A.A.; Chevychelov, V.Y.; Shapovalov, Y.B. Two Types of Highly Differentiated Topaz-Bearing Granites of the Salmi Batholith, Southern Karelia. Geochem. Int. 2020, 58, 11–26. [Google Scholar] [CrossRef]
  33. Shinkarev, A.F.; Anishchenkova, O.N. New data about composition and structure of Salmi complex. Izv. Akad. Nauk. USSR Geol. Ser. 1973, 140–144. (In Russian) [Google Scholar]
  34. Bantova, M.A.; Levkovskiy, R.Z.; Sharkov, E.V. Geology, material composition and age of rocks of the Salmi omplex of rapakivi granites and gabbro-anorthosites. Sov. Geol. 1975, 74–86. (In Russian) [Google Scholar]
  35. Larin, A. Ore mineralization. In Salmi Batholith and Pitkaranta ore Field in Soviet Karelia; Haapala, I., Rämö, O.T., Salonsaari, P.T., Eds.; University of Helsinki: Helsinki, Finland, 1991; pp. 19–34. [Google Scholar]
  36. Dukhovskiy, A.A.; Artamonova, N.A.; Ivanova, E.I.; Nikiforov, I.O. A volumetric model of the Salmi rapakivi granite massif and the regularities of mineralization placement. Otechestvennaya Geol. 1994, 4, 24–32. (In Russian) [Google Scholar]
  37. Beskin, S.M.; Lishnevskii, E.N.; Didenko, M.I. Structure of the Pitkyaranta granite massif in the Northern Ladoga region, Karelia. Izv. Akad. Nauk USSR Ser.Geol. 1983, 19–26. (In Russian) [Google Scholar]
  38. Bogdanov, Y.B.; Yakobson, K.E.; Guseva, E.A.; Petrov, B.V.; Amantov, A.V. Gosudarstvennaya Geological Map of the Russian Federation Scale 1:1000000 (Third Generation), Sheet P-(35),36, Map of Pre-Quaternary Formations; VSEGEI: St. Petersburg, Russia, 2015. [Google Scholar]
  39. Amelin, Y.V.; Heaman, L.M.; Verchogliad, M.V.; Skobelev, V.M. Geochronological constraints on the emplacement history of an anorthosite- rapakivi granite suite: U-Pb zircon and baddeleyite study of the Korosten complex, Ukraine. Contrib. Mineral. Petrol. 1994, 116, 411–419. [Google Scholar] [CrossRef]
  40. Bogatikov, O.A.; Birkis, A.P. Gabbro-norite-anorthosite complex of west Latvia. Izv. Akad. Nauk. USRR Geol. Ser. 1970, 23–34. (In Russian) [Google Scholar]
  41. Savolahti, A. On the Petrology of the Ahvenisto Massif. Bull. Comm. Geol. Finlande 1956, 174, 79. [Google Scholar]
  42. Sviridenko, L.P.; Svetov, A.P.; Golubev, A.I.; Rybakov, S.I.; Gor`kovets, V.Y.; Lavrov, M.M.; Heiskanen, K.I.; Stepanov, V.S.; Svetova, A.I.; Rayevskaya, M.B.; et al. Precambrian Magmatism Evolution (on Karelia Example); Kulikov, V.S., Voinov, A.S., Eds.; Nauka: Leningrad, Russia, 1985; p. 256. (In Russian) [Google Scholar]
  43. Svetov, A.P.; Sviridenko, L.P. Riphean Volcanoplutonism of the Fennoscandian Shield; Russian Academy of Sciences, Karel. Science. Center, Institute of Geology: Petrozavodsk, Russia, 1995; p. 211. (In Russian) [Google Scholar]
  44. Sviridenko, L.P.; Svetov, A.P.; Golubev, A.I.; Pavlov, G.M. Topaz-containing tuffisites of the southern margin of the Baltic Shield. Dokl. USSR Acad. Sci. 1984, 276, 1449–1552. (In Russian) [Google Scholar]
  45. Konyshev, A.A.; Anosova, M.O.; Rusak, A.A.; Alekseev, I.A.; Yakushev, A.I.; Shapovalov, Y.B. Dikes of Quartz Porphyry and Their Role in the Formation of the Salmi Batholith (South Karelia). Dokl. Earth Sci. 2020, 491, 127–130. [Google Scholar] [CrossRef]
  46. Khazov, R.A. Metallogeny of the Ladoga-Bothnian Geoblock of the Baltic Shield; Nauka: Leningrad, Russia, 1982; p. 192. [Google Scholar]
  47. Svetov, S.A.; Stepanova, A.V.; Chazhengina, S.Y.; Svetova, E.N.; Rybnikova, Z.P.; Mikhailova, A.I.; Paramonov, A.S.; Utitsyna, V.L.; Ekhova, M.V.; Kolodey, B.S. Precision geochemical (ICP–MS, LA–ICP–MS) analysis of rock and mineral composition: The method and accuracy estimation in the case study of Early Precambrian mafic complexes. Tr. KarRC RAS 2015, 7, 54–73. [Google Scholar] [CrossRef]
  48. Vasil’eva, I.E.; Shabanova, E.V. Catalogue of Certified Reference Materials of Natural and Man-made Media Compositions; Vinogradov Institute of Geochemistry SB RAS: Irkutsk, Russia, 2017; p. 79. Available online: http://www.igc.irk.ru/images/Innovation/Standarts-obr/2015/CATALOGUE_OF_CRMs_IGC_SB_RAS_-2017.pdf (accessed on 6 April 2023).
  49. Fedotova, A.A.; Bibikova, E.V.; Simakin, S.G. Ion-microprobe geochemistry as an indicator of mineral genesis during geochronologocal studies. Geochem. Int. 2008, 46, 912–927. [Google Scholar] [CrossRef]
  50. Poutiainen, M.; Scherbakova, T.F. Fluid and melt inclusion evidence for the origin of idiomorphic quartz crystals in topaz–bearing granite from the Salmi batholith, Karelia, Russia. Lithos 1998, 44, 141–151. [Google Scholar] [CrossRef]
  51. Rub, M.G.; Hetchikov, L.N.; Kotelnikova, Z.A.; Rub, A.K. Inclusions of mineral-forming media in minerals of Precambrian tin-bearing granites of the Northern Ladoga region. Izv. Akad. Nauk USSR Ser. Geol. 1986, 30–36. (In Russian) [Google Scholar]
  52. Wilson, S.A.; Ridley, W.I.; Koenig, A.E. Development of sulfide calibration standards for the laser ablation inductively-coupled plasma mass spectrometry technique. J. Anal. At. Spectrom. 2002, 17, 406–409. [Google Scholar] [CrossRef]
  53. Fleet, M.E.; Pan, Y. Fractional crystallization of anhydrous sulfide liquid in the system Fe–Ni–S, with application to magmatic sulfide deposits. Geochim. Cosmochim. Acta 1994, 58, 3369–3377. [Google Scholar] [CrossRef]
  54. Kress, V. Thermochemistry of sulfide liquids I. The system O–S–Fe at 1 bar. Contr. Mineral. Petrol. 1997, 127, 176–186. [Google Scholar] [CrossRef]
  55. Haapala, I. Magmatic and Postmagmatic Processes in Tin-mineralized Granites: Topaz-bearing Leucogranite in the Eurajoki Rapakivi Granite Stock, Finland. J. Petrol. 1997, 38, 1645–1659. [Google Scholar] [CrossRef]
  56. Pearce, J.A.; Harris, N.B.W.; Tindle, A.G. Trace Element Distribution Diagramms for the Tectonic Interpretation of Granitic Rocks. J. Petrol. 1984, 25, 956–983. [Google Scholar] [CrossRef] [Green Version]
  57. Whalen, J.B.; Currie, K.L.; Chappell, B.W. A-type granites: Geochemical characteristics, discrimination and petrogenesis. Contrib. Mineral. Petrol. 1987, 95, 407–419. [Google Scholar] [CrossRef]
  58. Eby, G.N. Chemical subdivision of A-type granitoids: Petrogenetic and tectonic implications. Geology 1992, 20, 641–644. [Google Scholar] [CrossRef]
  59. Zaraisky, G.P.; Aksyuk, A.M.; Devyatova, V.N.; Udoratina, O.V.; Chevychelov, V.Y. Zr/Hf ratio as an indicator of fractionation of rare-metal granites by the example of the Kukulbei complex, eastern Transbaikalia. Petrology 2008, 16, 710–736. [Google Scholar] [CrossRef]
  60. Anders, E.; Grevesse, N. Abundances of the elements: Meteoritic and solar. Geochim. Cosmochim. Acta 1989, 53, 197–214. [Google Scholar] [CrossRef]
  61. Irber, W. The lanthanide tetrad effect and its correlation with K/Rb, Eu/Eu*, Sr/Eu, Y/Ho, and Zr/Hf of evolving peraluminous granite suites. Geochim. Comochim. Acta 1999, 63, 489–508. [Google Scholar] [CrossRef]
  62. Hofman, A.W. Chemical differentiation of the Earth: The relationship between mantle, continental crust, and oceanic crust. Earth Planet. Sci. Lett. 1988, 90, 297–314. [Google Scholar] [CrossRef] [Green Version]
  63. Rudnick, R.L.; Gao, S. The Composition of the Continental Crust. In Treatise on Geochemistry; Holland, H.D., Turekian, K.K., Eds.; Elsevier-Pergamon: Oxford, UK, 2003; Volume 3, pp. 1–64. [Google Scholar] [CrossRef]
  64. Veksler, V.I.; Dorfman, A.M.; Kamenetsky, M.; Dulski, P.; Dingwell, D.B. Partitioning of lanthanides and Y between immiscible silicate and fluoride melts, fluorite and cryolite and the origin of the lanthanide tetrad effect in igneous rocks. Geochim. Cosmochim. Acta 2005, 69, 2847–2860. [Google Scholar] [CrossRef]
  65. Corfu, F.; Hanchar, J.M.; Hoskin, P.W.O.; Kinny, P. Atlas of Zircon Textures. Rev. Mineral. Geochem. 2003, 53, 468–500. [Google Scholar] [CrossRef]
  66. Hoskin, P.W.O.; Schaltegger, U. The Composition of zircon and igneous and metamorphic petrogenesis. Rev. Mineral. Geochem. 2003, 53, 27–62. [Google Scholar] [CrossRef]
  67. Grønvold, F.; Stølen, S.J. Thermodynamics of iron sulfides II. Heat capacity and thermodynamic properties of FeS and of Fe0.875S at temperatures from 298.15 K to 1000 K, of Fe0.98S from 298.15 K to 800 K, and of Fe0.89S from 298.15 K to about 650 K. Thermodynamics of formation. J. Chem. Thermodyn. 1992, 24, 913–936. [Google Scholar] [CrossRef]
  68. Linnen, R.L. The solubility of Nb-Ta-Zr-Hf-W in granitic melt with Li and Li + F: Constrains for mineralization in rare metal granite and pegmatite. Econ. Geol. 1998, 93, 1013–1025. [Google Scholar] [CrossRef]
  69. Aseri, A. Effects of Fluorine on the Solubilities of Nb, Ta, Zr and Hf Minerals in Highly Fluxed Water-Saturated Haplogranitic Melts. Ph.D. Thesis, University of Waterloo, Waterloo, ON, Canada, 2012. [Google Scholar]
  70. Alferyeva, Y.O.; Gramenitskii, E.N.; Shchekina, T.I. Changes in the Ta/Nb Ratio in Successively Formed Differentiates of Granite Melt (Calculations Based on Experimental Data). Russ. Geol. Geophys. 2020, 61, 26–35. [Google Scholar] [CrossRef]
  71. Peretyazhko, I.S.; Savina, E.A. Tetrad Effects in the Rare Earth Element Patterns of Granitoid Rocks as an Indicator of Fluoride-Silicate Liquid Immiscibility in Magmatic Systems. Petrology 2010, 18, 514–543. [Google Scholar] [CrossRef]
  72. Takahashi, Y.; Yoshida, H.; Sato, N.; Hama, K.; Yusa, Y.; Shimizu, H. W- and M- type tetrad effect in REE patterns for water-rock systems in the Tono uranium deposit, central Japan. Chem. Geol. 2002, 184, 311–335. [Google Scholar] [CrossRef]
  73. Jahn, B.; Wu, F.; Capdevila, R.; Martineau, F.; Zhenhua, Z.; Wang, Y. Highly evolved juvenile granites with tetrad REE patterns: The Woule and Baerzhe granites from the Great Xing’an Mountains in NE China. Lithos 2001, 59, 171–198. [Google Scholar] [CrossRef]
  74. Jakobsen, J.K.; Veksler, I.V.; Tegner, C.; Brooks, C.K. Crystallization of the Skaergaard Intrusion from an Emulsion of Immiscible Iron- and Silica-rich Liquids: Evidence from Melt Inclusions in Plagioclase. J. Petrol. 2011, 52, 345–373. [Google Scholar] [CrossRef]
  75. Watson, E.B.; Harrison, T.M. Zircon saturation revisited: Temperature and composition effects in a variety of crustal magma types. Earth Planet. Sci. Lett. 1983, 64, 295–304. [Google Scholar] [CrossRef]
  76. Eklund, O.; Shebanov, A.D. The origin of rapakivi texture by sub-isothermal decompression. Precam. Res. 1999, 95, 129–146. [Google Scholar] [CrossRef]
  77. Shebanov, A.D.; Belyaev, A.M.; Savatenkov, V.M. The signicance of residual source material (restite) in rapakivi granite petrogenesis: An example from the Salmi batholith, Russian Karelia (abstract). In Proceedings of the 7th International Conference Rapakivi Granites Related Rocks, Helsinki, Finland, 24–26 July 1996. [Google Scholar]
  78. Frost, B.R. Introduction to oxygen fugacity and its petrologic importance. In Oxide Minerals: Petrologic and Magnetic Significance, Reviews in Mineralogy; Lindsley, D.H., Ed.; Stony Brook: New York, NY, USA, 1991; Volume 25, pp. 1–10. [Google Scholar]
  79. Buddington, A.F.; Lindsley, D.H. Iron-titanium oxide minerals and synthetic equivalents. J. Petrol. 1964, 5, 310–357. [Google Scholar] [CrossRef]
  80. Schlegel, H.; Schüller, A. Das Zustandsbild Kupfer-Eisen-Schwefel. Int. J. Mater. Res. 1952, 43, 421–428. [Google Scholar] [CrossRef]
  81. Tsujimura, T.; Kitakaze, A. New phase relations in the Cu-Fe-S system at 800°C; constraint of fractional crystallization of a sulfide liquid. Neues Jahrb. Mineral. Mon. 2004, 10, 433–444. [Google Scholar] [CrossRef]
  82. Belyaev, A.M. Regularities of the distribution of ore elements in pegmatites, pegmatoid granites and granitogneisses of the Northern Ladoga region. In Patterns of Concentration of Ore Elements in Granitoid Formations of the Karelian–Kola Region; USSR Academy of Sciences, Kirov Kola Branch, Geological Institute: Apatity, Russia, 1985; pp. 89–96. (In Russian) [Google Scholar]
  83. Kullerud, G.; Yund, R.A.; Moh, G.H. Phase relations in the Cu-Fe-S, Cu-Ni-S and Fe-Ni-S systems. In Magmatic Ore Deposits; Wilson, H.D.B., Ed.; Society of Economic Geologists: Stanford, UK, 1969; Volume 4, pp. 323–343. [Google Scholar] [CrossRef]
  84. Craig, J.R.; Kullerud, G. The Cu-Fe-Pb-S system. Year Book Carnegie Inst. Wash. 1967, 65, 344–352. [Google Scholar]
  85. Freidrich, K. The binary systems FeS-ZnS and FeS-PbS. Metallurgie 1907, 4, 479–485. [Google Scholar]
  86. Mavrogenes, J.A.; MacIntosh, I.W.; Ellis, D.J. Partial melting of the Broken Hill galena-sphalerite ore experimental studies in the system PbS-FeS-ZnS-(Ag2S). Econ. Geol. 2001, 96, 205–210. [Google Scholar] [CrossRef]
  87. Stevens, G.; Pinz, S.; Rozendaal, A. Partial melting of the assemblage sphalerite + galena + pyrrhotite + chalcopyrite + sulfur: Implications for high-grade metamorphosed massive sulfide deposits. Econ. Geol. 2005, 100, 781–786. [Google Scholar] [CrossRef]
  88. Clark, L.A. The Fe-As-S system: Phase relations and applications. Econ. Geol. 1960, 55, 1345–1381. [Google Scholar] [CrossRef]
  89. Barton, P.B., Jr. Thermochemical study of the system Fe-As-S. Geochim. Cosmochim. Acta 1969, 33, 841–857. [Google Scholar] [CrossRef]
  90. Botcharnikov, R.E.; Holtz, F.; Mungall, J.E.; Beermann, O.; Linnen, R.L.; Garbe-Schönberg, D. Behavior of gold in a magma at sulfide-sulfate transition: Revisited. Am. Miner. 2013, 98, 1459–1464. [Google Scholar] [CrossRef]
  91. Polferov, D.V. On the relationships of sulfides and silicates in copper-nickel ores. Geol. Ore Depos. 1996, 36, 49–62. (In Russian) [Google Scholar]
  92. Robinson, D.J.; Hutchinson, R.W. Evidence for a volcanogenic-exhalative origin of a massive nickel sulphide deposit at Redstone, Timmins, Ontario. In Precambrian Sulphide Deposits; Geological Association of Canada Special Paper: St. Johns, NL, Canada, 1982; pp. 211–254. [Google Scholar]
  93. Li, C.; Naldrett, A.J.; Coats, C.J.C.; Johannessen, P. Platinum, palladium, gold, and copper-rich stringers at the Strathcona mine, Sudbmy: Their enrichment by fractionation of a sulfide liquid. Econ. Geol. 1992, 87, 1584–1598. [Google Scholar] [CrossRef]
  94. Farrow, C.E.G.; Watkinson, D.H. Alteration and the role of fluids in Ni, Cu and platinum-group element deposition, Sudbury Igneous Complex contact, Onaping-Levack area, Ontario. Mineral. Petrol. 1992, 46, 67–83. [Google Scholar] [CrossRef]
  95. Li, C.; Naldrett, A.J. High chlorine alteration minerals and calcium rich brines in fluid inclusions from the Strathcona Deep Copper zone, Sudbury, Ontario. Econ. Geol. 1993, 88, 1780–1796. [Google Scholar] [CrossRef]
  96. Zelenski, M.; Kamenetsky, V.S.; Nekrylov, N.; Abersteiner, A.; Ehrig, K.; Khanin, D. Textural, morphological and compositional varieties of modern arc sulfide melts: A case study of the Tolbachik volcano, Kamchatka. Lithos 2018, 318–319, 14–29. [Google Scholar] [CrossRef]
  97. Konnikov, E.G. Experimental studies of the melting processes in a pyrrhotine-water system. Geol. Ore Depos. 1997, 39, 474–479. (In Russian) [Google Scholar]
  98. Wykes, J.L.; Mavrogenes, J.A. Hydrous sulfide melting: Experimental evidence for the solubility oh H2O in sulfide melts. Econ. Geol. 2005, 100, 157–164. [Google Scholar] [CrossRef] [Green Version]
  99. Mungall, J.E.; Brenan, J.M. Experimental evidence for the chalcophile behavior of the halogens. Can. Mineral. 2003, 41, 207–220. [Google Scholar] [CrossRef]
  100. Tomkins, A.G.; Mavrogenes, J.A. Generation of metal-rich felsic magmas during crustal anatexis. Geology 2003, 31, 765–768. [Google Scholar] [CrossRef]
Figure 1. Schematic geological map of the location of the Salmi batholith, compiled by the author taking into account the material presented in [1,6,26]. 1, Arhean foundament; 2, area of the Svecofennian orogen; 3, area of the Kaledonian orogen; 4, rocks beyond the East European craton; 5, Raahe-Ladoga zone; 6, Anortosite-rapakivi granite-bearing complex (ARG) with the area of interest (green frame); and 7, boundaries of the ARG complex rocks under the Ladoga lake. The green letters indicate a—the Salmi batolith, b—the Ulaleg massif, and c—the Lodeinopolskiy massif.
Minerals 13 00527 g001
Figure 2. Simplified geological scheme of the Salmi batholith structure, compiled by the current author with consideration of the materials presented in [6,30,33,34,35,36,37]. Grey rectangle—area of the Lupikko dome, as shown in Figure 3. Rocks of the Karelian domain (AR2): 1. granite and migmatite-granite, greenstone belts, TTG association, supracrustal complex. Rocks of the Svecofennian orogen: 2. the AR2-PR1 domes are mainly gneissogranite; 3. metavulcanogenic-sedimentary rocks PR1 (micaceous and amphibole schist of the Ladoga and Sortavala series). Intrusive rocks of the Salmi batholith: 4. pink biotite-amphibole granite; 5. pink biotite granite; 6. green biotite-amphibole granite; 7. monzonite, quartz monzonite, diorite, quartz diorite; 8. gabbro, norite, anorthosite. Sedimentary-volcanogenic rocks of the Mesoproterozoic: 9. Salminskaya series (cover basalts, tuffites, and tuff sandstones). Other: 10. assumed geological boundaries; 11. tectonic contacts; 12. the boundary of the prequaternary platform cover [38]; 13. The external contour of granite according to gravimetric data [37]; 14. line showing a sharp change in the slope of the granite roof from gentle to subvertical [35]; 15. contour of high-density rocks (probability: gabbro, gabbro-pyroxenite, peridotite) located at depths of about 1.5 km and below according to gravimetric data [36]; and 16. contour of the highest elevations of the granite intrusion’s lower surface, according to gravimetric data [37].
Minerals 13 00527 g002
Figure 4. Polished cut of the granite porphyry considered in this work. Sample AK220617-1_2.
Minerals 13 00527 g004
Figure 5. Polished cut of breccia with granite porphyry cement. The numbers indicate the following: 1—xenolith of fine-grained biotite granite (similar samples X#1 and X#2), 2—xenolith of biotite-amphibole granite with a characteristic “rapakivi”—K-feldspar ovoid in an oligoclase rim.
Minerals 13 00527 g005
Figure 6. Thin sections of sample AK220617-1_2. (a)—transmitted light, (b)—crossed nicols.
Minerals 13 00527 g006
Figure 7. Element map of “nodule”–mineral separation in the ground mass. (a)—BSE. Characteristic X-ray map displaying the distribution: S, F, Si, P—(b); Mg, Ca, K, Na—(c); and Cu, Zn, Fe—(d). Abbreviations: Qz, quartz; Flr, fluorite; Ap, apatite; Sp, sphalerite; Ccp, chalcopyrite; and Pyh, pyrhotite.
Minerals 13 00527 g007
Figure 8. Element map of the “nodule”–mineral separation in the ground mass. (a)—BSE. Characteristic X-ray map displaying the distribution: S, Si, P—(b); Mg, Ca, K, Na—(c); and Fe, Ti, Zn, Zr—(d). Abbreviations: Ap, apatite; Ilm, ilmenite; Zrn, zircon; and Pyh, pyrhotite.
Minerals 13 00527 g008
Figure 9. Harker diagrams for the major elements (in wt%). * Rocks from the Salmi batholith (data taken from [32]), ** Eurajoki stock, related to the Laitila batolith (ARG) (taken from [55]).
Minerals 13 00527 g009
Figure 11. Tectonic-magmatic discrimination diagrams: (a) Nb-Y [56] and (b) Zr-10,000 Ga/Al [57]. All values are presented in ppm. WPG, within plate granite; ORG, ocean ridge granite; syn-COLG, syn-collision granite; and VAG, volcanic arc granite. The dashed line represents the upper compositional boundary for ORG from the anomalous ridge segments. A, I, S: type of granitoids. The legend is the same as that presented in Figure 9.
Minerals 13 00527 g011
Figure 12. A1-A2 type discrimination diagrams for A-type granitoids, according to [58]. (a) Y-Nb-Ce, (b) Y-Nb-3 Ga. The legend is the same as that presented in Figure 9.
Minerals 13 00527 g012
Figure 13. REE patterns of acidic rocks from the Salmi batholith. REEN: rare earth element content normalized to chondrite [60]. The legend is the same as that presented in Figure 9.
Minerals 13 00527 g013
Figure 14. Trace elements of Salmi batholith rocks normalized to the primitive mantle [62]. Green field–field of granite porphyry, gray field–field of rapakivi granite, violet field–field of granite xenolites, and brown field–field of biotite granite. The legend is the same as that presented in Figure 9.
Minerals 13 00527 g014
Figure 15. Typical zircon crystals from the studied rock under transmitted light. (a)—euhedral; (b)—not completely idiomorphic, with oscillatory zonality visible in an optical microscope. Presented in polished form, in epoxy resin. The images show melt silicate crystallized inclusions (transparent) and opaque inclusions of oxides (spinel group minerals, ilmenite) or sulfides (pyrrhotite or sulfide melt inclusions). Elongated transparent or needle-like inclusions with parallel faces are usually represented by apatite.
Minerals 13 00527 g015
Figure 16. Images of zircons obtained by cathodoluminescence and trace elements normalized to chondrite [60]. Circle—the area analyzed by the SIMS method (diameter: 25 μm). Numbers in a circle: top—the sequence number of the analysis (see Supplementary Materials, Table S2); bottom—temperature in °C determined using a Ti thermometer [24]. Taking into account the findings of single rutile grains, it was assumed that aTi = 1. Zrn: the sequence number of an individual grain. The sequence numbers presented in the diagram and in the image are equal.
Minerals 13 00527 g016
Figure 17. The legend is the same as that presented in Figure 16.
Minerals 13 00527 g017
Figure 18. The legend is the same as that presented in Figure 16. The dotted line is the area of analysis used for the LA-ICP-MS method.
Minerals 13 00527 g018
Figure 19. Mineral paragenesis of inclusions in zircon and mineral features. Abbreviations: Ccp—chalcopyrite, Pyh—pyrrhotite, Sp—sphalerite, Apy—arsenopyrite, Zrn—zircon, Sgk—presumably, sugakiite phase (in wt. %: S 32.8, Fe 43, Co 3, Ni 2.3, Cu 8), Qz—quartz, Ab—albite, Srp—serpentine group minerals, Mica—biotite, Fsp—feldspar, Fa—fayalite, ilm—ilmenite, Spl—spinel group mineral, Ap—apatite, Chl—chlorite group minerals, Flr—fluorite, and Te-Bi—tellur-bismuth mineralization. The letters in the white circles represent the following: a—sulfide inclusion in zircon (in the plane of polished Pyh and Fe oxide) under reflected light; (b)—the same inclusion (a), BSE; (c)—sulfide inclusion in zircon (in the plane of polished Po and Ccp) under reflected light; (d)—outer morphology of two sulfide inclusions in zircon that were not opened by polishing under reflected light; (e)—features of the internal structure of Pyh from the bulk mass of the rock, BSE; (f)—the largest sulfide inclusions found in zircon (Pyh-Ccp) (the dotted line represents the boundaries of inclusions (partially crumbled)), BSE; g—zircon with two inclusions of heterophase capture (sulfide + silicate), BSE; and (h,i)—inclusions from (g) on a larger scale (on the left—BSE, on the right is a schematic sketch).
Minerals 13 00527 g019
Figure 20. Mineral paragenesis of inclusions in zircon, and mineral features. Abbreviations—see the abbreviations presented in Figure 19. The letters in the white circles represent the following: (a)—inclusion with big crystals of fluorite; (b)—zircon with inclusion of Spl-Ilm-Fa-Fsp paragenesis (c) and Pyh inclusion (d), BSE; (e)—zircon with sulfide inclusion with a Sp-Ccp composition under transmitted light; and (f)—inclusion of Sp-Ccp from (e) on a larger scale, BSE.
Minerals 13 00527 g020
Figure 21. Visualization of the contents of chalcophilic elements in sulfide melt inclusions from zircon by LA-ICP-MS. The homogenized inclusions are represented by 1–17. Nonhomogenized inclusion of sphalerite-chalcopyrite composition—18. Sp in circle—mean sphalerite, high content of Zn, oversized in scale.
Minerals 13 00527 g021
Figure 22. Histograms of the distributions of the Cu-Co-Ni-Ag-Mo-Zn contents by frequency of occurrence based on analyses of homogenized melt sulfide inclusions.
Minerals 13 00527 g022
Figure 23. Composition of homogenized sulfide melt inclusions (red dots) on the phase diagram of the Cu-Fe-S system at 800 °C [81]. Abbreviations: Bn, bornite; Pyh, pyrrhotite; ss, solid solution; iss, intermediate solid solution; and liq, liqua.
Minerals 13 00527 g023
Disclaimer/Publisher’s Note: The statements, opinions and data contained in all publications are solely those of the individual author(s) and contributor(s) and not of MDPI and/or the editor(s). MDPI and/or the editor(s) disclaim responsibility for any injury to people or property resulting from any ideas, methods, instructions or products referred to in the content.

