Abstract
The compound collector, composed of polar and nonpolar parts, is a current research hotspot in low-rank coal (LRC) flotation because of its outstanding flotation efficiency and cost-effectiveness. However, the selection of compound proportions lacks theoretical guidance. In this study, we comprehensively investigate the internal mechanism underlying the influence of the compound proportion (oleic acid (OA):dodecane (DD)) on LRC flotation. The molecular dynamics (MD) simulation between bubble and oil film was simultaneously employed to study the surface interactions between three phases in contact. The compound proportion of OA:DD = 1:3 was found to be the most conductive for Zhuanlongwan coal flotation, which provides a robust collecting capacity while minimizing excessive interaction with water. Thus, the spreading area is the largest and the interaction energy between collectors and LRC is the highest. Additionally, the oil film formed at this ratio has the best hydrophobicity, resulting in the fastest adhesion speed of the bubble and the most stable bubble adhesion. Proportions of OA:DD above 1:3 promote self-aggregation of polar collectors, leading to a worsened spreading of the oil film. Conversely, proportions below 1:3 result in weak interaction with LRC, leading to a smaller spreading area and reduced hydrophobicity. Ultimately, we propose the LRC–compound collector matching principle, which suggests that the best proportion of compound collectors fits well with the oxygen-containing sites on the LRC surface.
1. Introduction
Flotation is an effective method for separation and beneficiation of fine coal slime [1,2,3,4,5]. For low-rank coal (LRC) flotation, the selection of an efficient collector is crucial to improve the flotation effect [6,7,8,9,10]. At present, a large number of studies have shown that compound collectors (composed of polar and nonpolar collectors) have excellent flotation effect and low cost, which has become a research hotspot in the field of LRC flotation [11,12,13,14,15,16].
Chang et al. [11] put forward that the higher performance of a compound collector of Triton X-100 and diesel in oxidized coal flotation could be attributed to Triton X-100’s ability to emulsify the diesel and cover the hydrophilic site via “head-on” adsorption. Zhu et al. [13] employed a compound collector of fossil oil and an oxygen-containing chemical to improve LRC flotation. The results showed that compound collectors produced higher yields than diesel. Compared with diesel, the compound collector was easier to attach to and distribute throughout the coal surface. Zhang et al. [17] mixed dodecane and tetraethylene glycol monododecyl ether surfactant as compound collectors to improve the flotation performance of LRC. Meanwhile, they concluded that the flotation effect is the best when the ratio of surfactant to dodecane is 1:3. Bao et al. [18] studied the effect of oleic acid and methyl oleate on the LRC flotation and combined them with diesel to enhance the flotation. It was found that the flotation effect was best when the ratio of oleic acid or methyl oleate to diesel also was 1:3. Liao et al. [19] used three kinds of mixed alkane–ester collectors including dodecane–ethyl butyrate mixture, dodecane–ethyl caprylate mixture, and dodecane–ethyl laurate mixture (dodecane:ethyl = 4:1) to enhance LRC flotation and investigate the interfacial interaction between these oil drops and coal particles. Xue et al. [20] applied compound collectors of naphthenic acid and kerosene to enhance the coal gasification of fine slag flotation. They concluded that when the molar ratio of naphthenic acid to kerosene was 4:6, the tailings ash content and combustible recovery reached a peak. This study also reflects that the compound collectors are also successfully used for coal gasification fine slag flotation and that the proportion selection is also essential.
Interestingly, in their study, the optimal compound proportion of polar and nonpolar collectors often exists. However, the mechanism is not clear. So far, there is no theoretical guidance for the selection of the proportion of compound collectors. In this paper, the influence of the compound ratio of polar and nonpolar collectors on flotation is studied in detail. From the large-scale MD simulation point of view, this paper presents a thorough study of the influence of compound ratio on the spreading effect of the compound collector on the surface of LRC, the merging time of bubble and oil film, and the adhesion of bubbles on the surface of LRC. The existence of collector adsorption was verified through Fourier-transform infrared spectroscopy (FTIR) and a scanning electron microscope (SEM) with an energy dispersive spectrometer (EDS). The adsorption state of the compound collector was studied through zeta potential analysis. The molecular action mechanism of the optimal compound ratio is clarified through molecular dynamics (MD) simulations. The molecular action mechanism of the optimal compound ratio is clarified. It provides theoretical guidance for the proportion selection of compound collectors, which opens avenues for further research and practical application of compound collectors.
2. Materials and Methods
2.1. X-ray Photoelectron Spectroscopy (XPS) Tests
In the experiments, XPS (Thermo Fisher Scientific, Waltham, MA, USA) tests in an ultrahigh vacuum system at room temperature were used to analyze the surface chemistry of coal samples to investigate their floatability. Coal samples with particle sizes less than 0.074 mm were used, and the electron binding energy and photoelectron absorption peak positions were determined using wide and narrow scanning modes. The XPS data were fitted using Avantage software (version 5.948). The binding energy 284.80 eV of C1s was used to calibrate the binding energy of orbitals measured to correct the effect of physical shift.
2.2. LRC Properties
2.2.1. Proximate Analyses
LRC samples were collected from Ordos Zhuanlongwan Coal Co., Ltd., Ordos, China. LRC samples were obtained with particle sizes less than 0.5 mm and used as flotation feed. The ash content of this LRC is 17.68%, the volatile content is 24.81%, and the fixed carbon content is 46.04%. The fixed carbon content of this coal is low. Therefore, this coal is a typical LRC. The proximate analyses of the coal samples are shown in Table 1.

Table 1.
Proximate analyses of the coal (ad: air dry basis).
2.2.2. Particle Size Distribution
The particle size distribution of the LRC used in the experiment is shown in Table 2. Analysis shows that the samples with particle sizes above 0.125 mm have the highest proportion, with a yield of 56.34% and lower ash content. The middle particle size range of 0.125–0.045 mm has the lowest proportion. Furthermore, the proportion of particle sizes below 0.045 mm is 28.23%, and the ash content is higher at 31.53%, which is the main source of ash content in the flotation clean coal.
Table 2.
Particle size distribution of the LRC sample.
2.2.3. Surface Property Analysis of the LRC
The surface properties of LRC were studied by XPS. The XPS analysis result is shown in Figure 1. The semi-quantitative analysis of the wide sweep element content shows that the oxygen element content is 37.61% (atomic percentage), which indicates that the surface oxygen content of the coal sample is high. The electron binding energies of the groups C-C/C-H, C-O, C=O, and O-C=O are 284.60 eV, 285.60 eV, 286.60 eV, and 289.10 eV, respectively [21]. The ratios of C-C/C-H, C-O, C=O, and O-C=O are 73.36%, 14.94%, 8.56%, and 3.14%, respectively, which denotes that C-O is the main oxygen-containing group on the LRC surface. Water molecules can form hydrogen bonds with these oxygen-containing groups, reducing the hydrophobicity of coal samples [22,23]. This makes the hydrophobicity of the LRC surface worse.
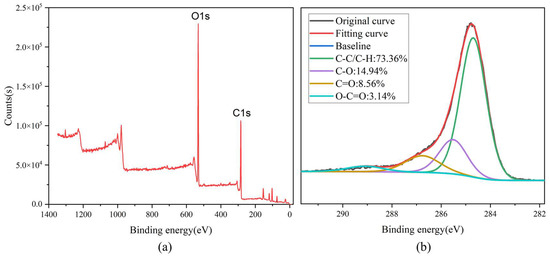
Figure 1.
(a) XPS wide sweep spectra of the LRC sample, (b) C1s peak of the LRC sample.
2.3. Flotation Tests
The flotation test was performed on an XFD-1L flotation machine. In the experiment, DD (C12H26), OA (C18H34O2), and 2-octanol (C8H18O) were used as flotation agents and 2-octanol was used as the foaming agent. They were purchased from Aladdin Co., Ltd, Shanghai, China. The dosage of the foaming agent is fixed at 500 g/t. All compound collectors were mixed by stirring with a magnetic rotor for 5 min. The following was the test procedure: 80 g of coal was placed in the flotation tank with 1 L water for 2 min to wet the slurry thoroughly because the typical pulp concentration was 80 g/L [15,23,24,25]; after the coal sample was thoroughly wetted, the collector was added, and the conditioning process lasted 2 min. Before weighing the sample, we conducted rigorous sample reduction and grid sampling to ensure sample uniformity. After adding the frother to the pulp, the conditioning process was repeated for another 30 s. After that, the aeration was turned on to begin flotation, which lasted 2.5 min. During the test, the impeller speed was 1850 r/min, and the airflow rate was 0.10 m3/h. Following the completion of the flotation, the clean coal and tailings were filtered through a vacuum filter and dried separately. Finally, the combustible recovery was calculated to evaluate the flotation effect.
where AC is the ash content of the clean coal (%), is the yield of the clean coal, and AF is the ash content of the feed (%).
2.4. FTIR Tests
In order to confirm the adsorption of compound collectors on LRC surfaces, FTIR tests were performed on coal samples treated with an OA:DD = 1:3 compound collector and on raw coal. To prepare the samples, the flotation mixing process was repeated. As a control, the raw coal was also subjected to the flotation mixing process. The total compound dosage was fixed at 1000 g/t. The slurry was filtered and placed in a well-ventilated area to air dry for 24 h to ensure the coal sample was dry.
The chemical composition of the LRC surface was analyzed using Fourier-transform infrared spectroscopy (FTIR, Nicolet iS5, Thermo Scientific, Waltham, MA, USA) to detect variations in chemical groups. To prepare the tests samples, a mixture of 2 mg coal and 200 mg dried KBr was ground into a fine powder using an agate mortar. The resulting powder was compressed into thin circular plates with a pressure of 10 MPa. Spectra were recorded using a 4000–400 cm−1 measuring range, 4 cm−1 resolution, and 64 scan times. All spectra were corrected for baseline variations.
2.5. SEM/EDS Tests
A scanning electron microscope (SEM, COXEMEM-30, Daejeon, Korea), outfitted with an energy dispersive spectrometer (EDS, Oxford Xplore Compact 30, Elemental Diagnostics Solutions, Oxford, United Kingdom), was employed to examine the surface of low-rank coal. The sample used was the same as for the FTIR tests. EDS analysis enables semi-quantitative determination of the elemental composition on the coal surface within 1 μm. The morphology of the coal surface and the modes of occurrence of minerals were identified using a high-energy electron beam. Prior to the examination, the coal sample was coated with gold ions utilizing an ion-sputtering device to improve electrical conductivity.
2.6. Zeta Potential Measurements
A potentiometric analyzer (ZetaPALS, Brookhaven Instruments, Holtsville, NY, USA) was utilized for measuring the zeta potential. To prepare the samples for zeta potential measurements, the flotation mixing process was repeated with ten various compound proportions using deionized water. Raw coal was treated using the same steps as a control. The total compound dosage was fixed at 1000 g/t. After the mixing process, 50 mL of the mineral slurry was taken and placed in a settling tube, and the stable supernatant was collected after 24 h of settling. Afterward, 1.5 mL of supernatant was collected for zeta potential analysis. The purpose of standing the mixture for 24 h was to allow the large particles to settle down and enable the formation of a colloid system with the fine particles remaining in suspension. The tests were conducted five times at a temperature of 20 °C, and the average value was considered as the final result to ensure the reliability of the experimental data.
2.7. Molecular Simulations Details
2.7.1. Molecules Parameters
The LRC model is determined according to the LRC surface properties. It is known that the oxygen content on the surface is 37.61%, so it can be considered that the hydrophilic point on the surface of LRC accounts for about 1/3 of the total surface. Considering the steric hindrance effect and the difference in roughness between the real coal surface and the coal model in the MD simulation, the three benzene ring structures covered by an oxygen-containing functional group are regarded as hydrophilic sites. The repeated unit on the surface structure of the LRC model, as shown in Figure 2a, was established by Materials Studio 8.0 software developed by Accelrys, Inc, San Diego, CA, USA. Then, we used the supercell function of Materials Studio to expand the repeated unit into a complete LRC surface model. A total of 120 hydroxyl functional groups were grafted at fixed intervals on the top of the four-layer graphite structure as an LRC model. The complete LRC model is spliced by the LRC surface model and the directly established three-layer graphite structure. This is a simplified model of LRC, which is treated as such in many papers to facilitate the study of the interaction between LRC and collectors [17,26,27,28,29,30].
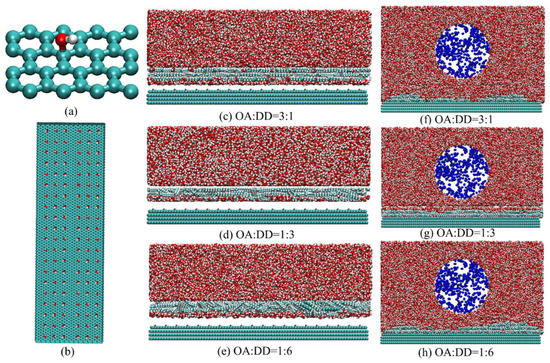
Figure 2.
Initial configuration of (a) LRC surface repeating unit, (b) LRC model (top view), (c–e) oil film adsorption simulation systems, and (f–h) bubble adsorption on oil film surface simulation systems. Red atoms are oxygen atoms, green atoms are carbon atoms, white atoms are hydrogen atoms, and blue atoms are nitrogen atoms.
The OPC3 water model was used for simulation, which is better than SPCE and others in many aspects [31]. Using nitrogen molecules as gas molecules, the parameters refer to Luo’s [32] and Su’s [33] studies. Other molecules were described with the general AMBER force field [34] (GAFF), and MD simulations were all completed by GROMACS 2019.6 software package [35]. MD simulations were carried out when force field parameters were assigned to each atom in a molecule. The geometry of OA and DD was optimized by ORCA [36] software (version 5.0.2) at the B97-3c [37] level. The average of the restrained electrostatic potential (RESP) charges of the LRC surface repeating unit, OA, and DD were computed in the liquid and gas phases by ORCA, which is called RESP20.5 [38]. The RESP20.5 charges were calculated by Multiwfn (version 3.7), which is more suitable for water environment simulations [39]. The topology file simulations were prepared by Sobtop [40]. In the LRC model, the hydroxyl functional group atoms are charged, and all other atoms are regarded as uncharged [41].
2.7.2. Establishment of the Simulation System
All the initial model completed by GROMACS and PACKMOL [42] is shown in Figure 2. Firstly, the model of compound collector spreading on the surface of LRC is established. To highlight the comparability of simulation results, three proportions of compound collectors are selected, which are oleic acid(OA):dodecane (DD) = 3:1, 1:3, and 1:6, corresponding to the number of OA molecules:DD molecules = 124:69, 36:179, and 20:205, respectively. (In the equation below, “N” denotes the number of molecules; “M”, relative molecular mass; “m”, mass; “V”, volume; “”, density; and “”, Avogadro constant.) Because the total mass fraction is the same among all groups, the total relative molecular weight of the composite collector is the same as that of the single collector (NM = mNa) and the proportion calculation formula is . The reason for choosing these molecular numbers, which is calculated by , is to form an oil film of 1 nm thickness. The compound collector molecules were filled in a box of 20 × 6 × 1.5 nm3 at 1 nm above the surface of the LRC model. Then, the box was filled with water molecules according to the density of water above and below the compound collector. The final initial configuration size is 20 × 6 × 8 nm3.
The cylindrical bubble with a radius along the X axis of 3.5 nm and a depth of 6 nm in the Y direction is established using PACKMOL. Its radius in the Y direction is equivalent to infinity so that the Y direction is as close to the macro bubble as possible in the simulation system with a finite size, which is set up in many papers [43,44,45]. The top view of the bubble is shown in the Supplementary Data Figure S1. The formula for calculating the number of gas molecules is the real gas state equation as follows. The calculation process refers to Zhang et al. [46].
After the compound collector spreading simulation reached equilibrium, the stable oil film formed. Then, the bubble model is used to replace the water molecules above the oil film. In the three configurations, the distance from the top of the oil film to the bubble is controlled at 1 nm. Finally, the initial configuration with a size of 20 × 6 × 12 nm3 of the interaction between the bubble and the oil film is obtained. A vacuum layer of 20 nm is added above all systems to avoid unnecessary interaction between the system and its mirror system.
Currently, the scale of flotation simulation is generally small, mostly within 5 nm [17,26,27,28,29,30]. Because of the simulation scale and other reasons, the phenomenon of bubbles in the flotation system is rarely studied. In this paper, the simulation scale reaches 20 nm, and the direct interaction between the bubble and oil film is simulated.
2.7.3. MD Simulation Parameters
The steepest descent method [47] was used to minimize the energy of initial configurations. MD simulation with a time step of 2 fs at 298 K in the NVT ensemble was performed. The v-rescale thermostat [48] was used to control the temperature, with a relaxation time constant of 0.1 ps. The LINCS method [49] was used to restrict the h-bond lengths. Periodic boundary conditions are utilized for the X, Y, and Z directions. The LRC model is frozen except for the hydroxyl groups. The cut-off approach was used to compute Van der Waals interactions using a cut-off distance of 1.0 nm, whereas the PME [50] (particle mesh Ewald) method was used to calculate electrostatic interactions. The simulation results were visualized using VMD 1.9.3 [51]. This same type of MD simulation was used in other investigations [52,53].
3. Results
3.1. Flotation Results
The ten proportions of compound collectors that consist of OA and DD are 1:0, 3:1, 2:1, 1:1, 1:2, 1:3, 1:4, 1:5, 1:6, and 0:1, respectively. The total dosage of collectors used are 500, 1000, and 2000 g/t, respectively. The collector dosage used in our study is consistent with the dosage range reported in the literature for LRC flotation [54,55,56]. They are thoroughly mixed and then used as compound collectors for flotation. The combustible recovery was calculated to evaluate the flotation effect, which can also well evaluate the collecting ability of the collector [57,58].
The combustible recovery results are shown in Figure 3. Obviously, when OA:DD = 1:3, the combustible recovery is the highest and the flotation result is optimal regardless of the dosage of compound collectors. Furthermore, the combustible recovery increases with the increase in DD proportion when the ratio of OA:DD is less than 1:3 and decreases when it is larger than 1:3. This indicates that the OA:DD = 1:3 compound collector has the best effectiveness to enhance the flotation process.
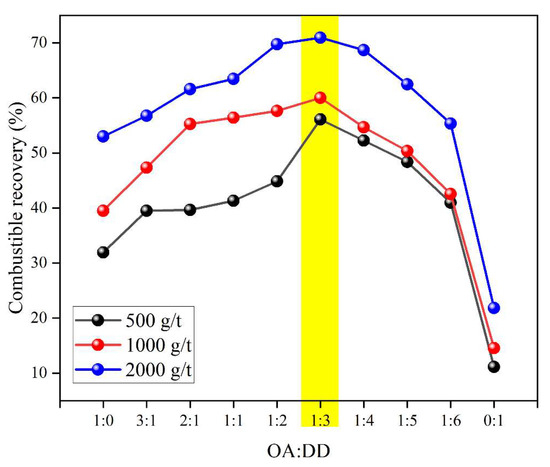
Figure 3.
Effect of different compound proportions on combustible recovery. The yellow band indicates the optimal combustible recovery.
In An’s study [56], the effects of compound collectors of DD and OA on the flotation of LRC were also investigated. In their research, the ratio of OA to DD was fixed at 1:4. The results indicated that the compound collectors of DD and OA could significantly improve the LRC flotation. When the collector dosage was 1000 g/t, the combustible recovery increased by approximately 34% and 9% compared with using DD and OA individually. In our study, the compound collectors for DD and OA achieved similar effects. L. Zhang et al. [17] explored the influence of the mixing ratio of dodecane and non-ionic surfactant tetraethylene glycol monododecyl ether on LRC flotation. They conducted flotation tests using five different ratios of compound collectors. Consistent with our study, the maximum combustible recovery rate was achieved when the ratio of tetraethylene glycol monododecyl ether to dodecane was 1:3. R. Zhang et al. [59] investigated the effects of five mixing ratios of dodecyl trimethylammonium bromide (DTAB) and diesel (0:1 (emulsified diesel), 1:10, 1:5, 1:2, and 1:0 (pure DTAB)) on LRC flotation. The results demonstrated that the highest flotation yield was achieved for all dosages when the DTAB to diesel ratio was 1:2. It is close to the optimal ratio obtained in our study.
3.2. FTIR Results
In order to confirm the adsorption of compound collectors on LRC surfaces, FTIR tests were performed on coal samples treated with the OA:DD = 1:3 compound collector and on raw coal. As a control, the raw coal was also subjected to the flotation mixing process. The FTIR test results are shown in Figure 4. According to the literature on coal FTIR studies, peaks in the region of 2849–2954 wavenumbers represent alkyl groups. The wavenumber 2849 represents symmetric -CH2- stretching, 2921 represents asymmetric -CH2- stretching, and 2954 represents asymmetric -CH3 stretching [60]. According to the literature, semi-quantitative analysis of the same functional group among different samples can be performed by analyzing the proportion of a certain functional group’s infrared peak area [61,62]. Analysis of this coal sample’s infrared spectrum reveals that the proportion of alkyl groups on the surface of the coal sample significantly increases after the action of the compound collector. The changes in the peak values of the oxygen-containing functional group fingerprint region are weak; as the proportion of alkanes increases significantly, the proportion of oxygen-containing functional groups will decrease accordingly. This is sufficient to prove the existence of collector adsorption.
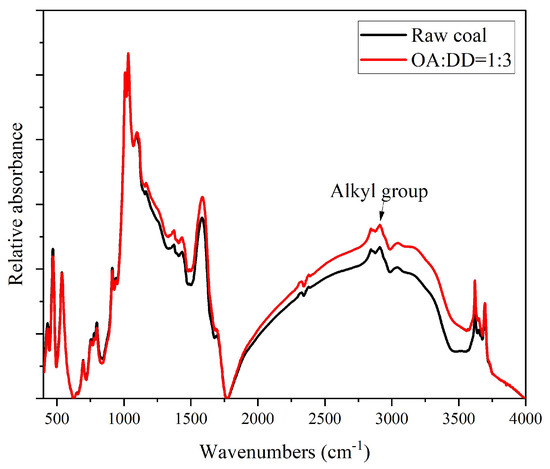
Figure 4.
FTIR results of coal samples treated with OA:DD = 1:3 compound collector and raw coal.
3.3. SEM Results
For the purpose of further verifying the existence of adsorption of compound collectors on low-rank coal surfaces, SEM and EDS analyses were carried out, and the results are shown in Figure 5. The agglomeration process between the particles will show the presence of adsorption. Observing the SEM results, it can be seen that some particles adhere to the surface of the coal sample after the action of the compound collector. Combined with EDS analysis, these particles are also coal particles. In contrast, raw coal without the action of the compound collector presents a cleaner surface without particle agglomeration. The agglomeration process between the particles demonstrates the presence of adsorption.
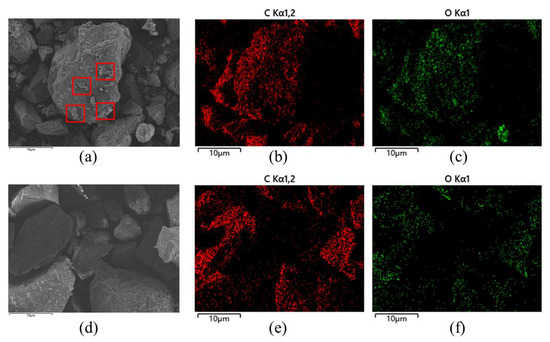
Figure 5.
(a) SEM images of coal samples after treatment with OA:DD = 1:3 compound collector, as well as their (b) C and (c) O EDS images (red boxes represent the agglomeration process between particles). (d) SEM images of the raw coal, as well as their (e) C and (f) O EDS images.
3.4. Zeta Potential Results
The zeta potential at flotation is an important parameter. Since the zeta potential of coal particles varies after the action of different collectors, the zeta potential value can reflect the adsorption state of the collector to some extent [62]. In the test, the average value from five sets of data is taken in a single test, and the standard deviation is calculated as the error bar. The average zeta potential of raw coal is −40.55 mV, and the negative charge on the surface of LRC mainly comes from the large amount of oxygen-containing functional groups on its surface. As can be seen from Figure 6, when the OA and DD compound proportion is greater than 2:1, the zeta potential is lower than the zeta potential of raw coal. At this time, the proportion of OA is larger and OA molecules may form a double-layer adsorption on the surface of LRC, leading to more oxygen-containing functional groups exposed on the surface that ultimately reduce the zeta potential of coal particles. Similar results were obtained in the study by Ren et al. [63]. When the OA and DD compound proportion is less than 2:1, the zeta potential is higher than the zeta potential of raw coal. At OA:DD = 1:3, the zeta potential reaches its maximum value and the absolute value is the smallest. At this time, the compound collector can achieve the best synergistic effect, with OA covering the oxygen-containing sites on the surface of LRC and DD further spreading on it to form an oil film [18]. When the OA and DD compound proportion is less than 1:3, the zeta potential gradually decreases. This is because when the proportion of OA is lower, the spreading of the compound collector on the LRC surface becomes worse and therefore the ability of the compound collector to cover the oxygen-containing sites on the LRC surface decreases. The zeta potential results correspond well with the flotation results.
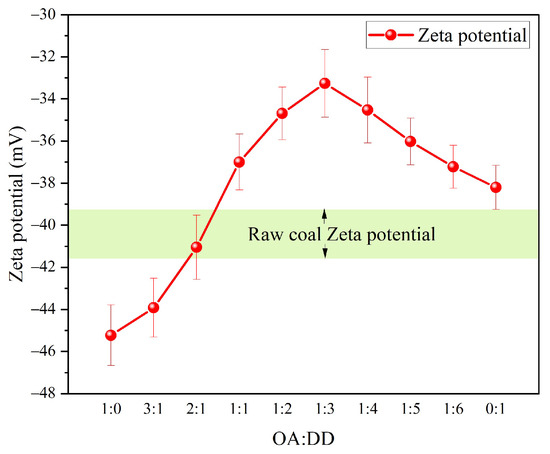
Figure 6.
Zeta potential of the LRC after treatment with different compound collectors at different compound proportions. The green area represents the zeta potential of the raw coal.
3.5. Results of Compound Collector Spreading on the Surface of LRC
3.5.1. Spreading Dynamics of Compound Collectors
The spreading area of the collectors in the simulation process is analyzed by SASA, the analysis program of GROMACS, and the spreading area variation curves of the compound collectors with the three different proportions is shown in the Figure 7a. The analysis shows that the spreading area of the three ratios of compound collectors increases gradually with time. The spreading area increased rapidly in the first 1000 ps and remained almost unchanged after 3000 ps, indicating that the system basically reached equilibrium after 3000 ps.
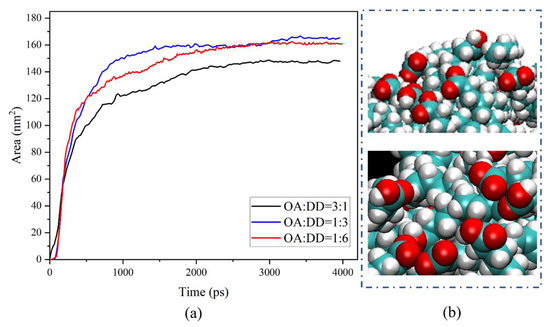
Figure 7.
(a) Spreading area variation curves of the compound collectors with three proportions. (b) Self-aggregation of some OA molecules. Red atoms are oxygen atoms, green atoms are carbon atoms, and white atoms are hydrogen atoms.
From the spreading area variation curves, it can be seen that in the initial stage of adsorption, the adsorption speed is the fastest with an OA to DD ratio of 3:1 and that the adsorption speed of the other two kinds of compound collectors is close. This indicates that with the proportion of polar content in the compound collectors increasing and the interaction between the compound collectors and LRC is gradually strengthened, that is, the collecting capacity of the compound collectors is stronger. After achieving system stability, the spreading area was observed to be largest at an OA:DD ratio of 1:3 and smallest at a ratio of 3:1. This implies that an increased proportion of polar collectors enhances adsorption speed while decreasing spreading capacity. After detailed observation of the equilibrium spreading structure of the OA:DD = 3:1 compound collector, it is found that some OA molecules self-aggregate in the oil film, as shown in the Figure 7b. This indicates that attractive interaction among OA molecules takes place primarily at high OA contents, thereby reducing OA adsorption on the LRC surface. Consequently, several polar groups of OA orient towards the water phase, and the hydrophobicity of the oil film is reduced.
3.5.2. Adsorption Configurations of Compound Collectors
Figure 8 shows the spreading equilibrium structure at 4000 ps. The three kinds of compound collectors can form an oil film. Next, the average 2D numerical density of the oil film along the z-axis is calculated by using the DENSMAP program of GROMACS, as shown in the Figure 9. The trajectory time range is 3000 ps to 4000 ps, and the lattice size is 0.02 nm. It is known that when OA:DD = 1:3, the spreading area of the oil film is the largest. Analysis of Figure 9 shows that when OA:DD = 1:3, the red area is the most evenly distributed. The collector molecules are concentrated in some areas in the other two proportions. It shows that the collector molecules spread most evenly on the surface of LRC when OA:DD = 1:3. Therefore, the spreading of the compound collector with a ratio proportion of OA:DD = 1:3 is the best.
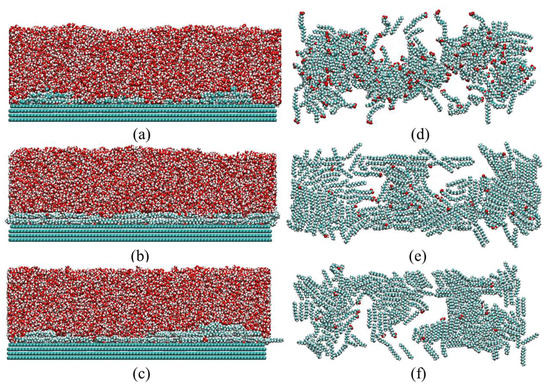
Figure 8.
Equilibrium adsorption configuration of the compound collectors of (a) OA:DD = 3:1, (b) OA:DD = 1:3, and (c) OA:DD = 1:6, and top view of the spread oil film of the compound collectors of (d) OA:DD = 3:1, (e) OA:DD = 1:3, and (f) OA:DD = 1:6.
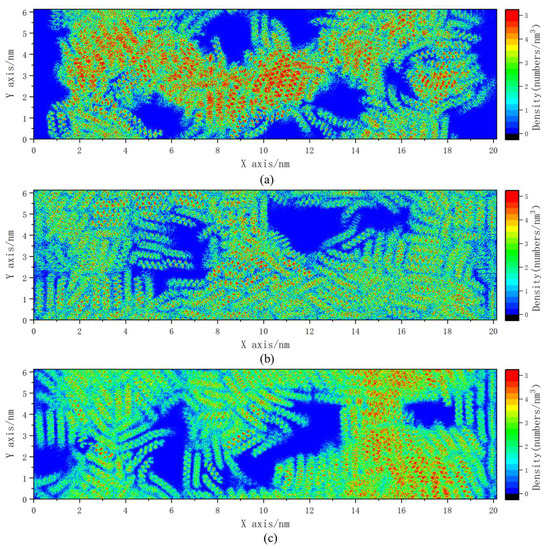
Figure 9.
Average 2D numerical density of the oil film of the compound collectors of (a) OA:DD = 3:1, (b) OA:DD = 1:3, and (c) OA:DD = 1:6 along the z-axis.
In summary, when OA:DD = 3:1, the overall polarity of the compound collector is strong, and there is a partial self-aggregation inside, which leads to many polar groups in the oil film facing the aqueous phase, making the oil film spread worse. When OA:DD = 1:6, the overall polarity is weak and its interaction with LRC is weak, so that part of the surface area of LRC is still occupied by water and the ultimate spreading area is smaller than that when OA:DD = 1:3. When the polarity is moderate, as in OA:DD = 1:3, it not only avoids interacting with water excessively but also ensures a strong collecting capacity, so the spreading effect is the best.
3.5.3. Interaction Energy
To further analyze the oil film spreading effect of different proportions of compound collectors, the change in interaction energy between collectors and LRC with time was analyzed, as shown in Figure 10. It is found that the curve is extremely similar to the curve for collector spreading area. Therefore, it can be considered that the spreading area is proportional to the interaction energy between collectors and LRC.
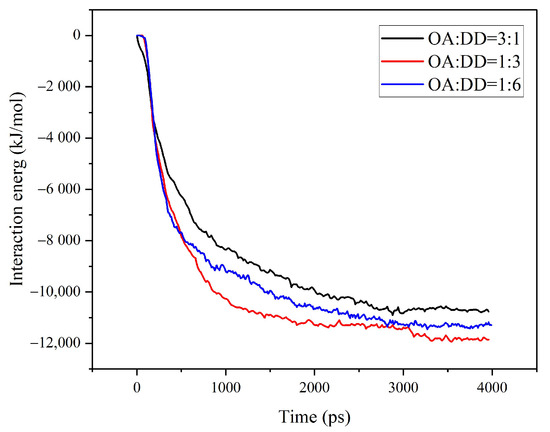
Figure 10.
The change of interaction energy between collectors and LRC with time.
The interaction energy between collectors and both water and the LRC model after equilibrium was subsequently calculated. The results are shown in Table 3. The larger the negative value, the greater the interaction energy. For an OA:DD ratio of 1:3, the interaction energy between collectors and LRC is the largest and is greater than that between the collector and water, resulting in optimal spreading.
Table 3.
The interaction energy between collectors and water and between collectors and the LRC model after equilibrium.
In the case of OA:DD = 1:6, the interaction energy is lower than that when OA:DD = 1:3, indicating that the composite collector spreads poorly on the surface of LRC when its polarity is low. However, the interaction energy between the collector and LRC is still larger than that between the collector and water with the ratio of OA:DD at 1:6. Although the polarity of the complex collector is the strongest when OA:DD = 3:1, the interaction energy between the collector and LRC is the smallest. Because of the strongest polarity, the interaction with water will also be enhanced. According to the data in the Table 3, for OA:DD = 3:1 the interaction energy between the collector and water is much larger than that between the collector and LRC, leading to poor spreading and weaker interaction with LRC. This shows that excessive polarity is not conducive to the spread of the collector on the surface of LRC because the excess polar collector will increase the interaction between the compound collector and water, which worsens the spreading effect.
3.6. Results of Interaction between Oil Film and Bubbles
3.6.1. Adsorption Configurations of the Bubble on the Surface of the Oil Film
In these three simulations, the bubbles were all placed 1 nm above the top of the oil film. The results were analyzed after 2 ns of simulation. It was observed that bubbles were adsorbed on the surface of the oil film on LRC. At this time, the total energy of the three systems is almost unchanged, so a comparative analysis of the three systems can be carried out. The total energy variation curves are shown in the Supplementary data Figure S2. The adsorption configurations of bubbles on the surface of the oil film and the top view and main view structure are shown in Figure 11.
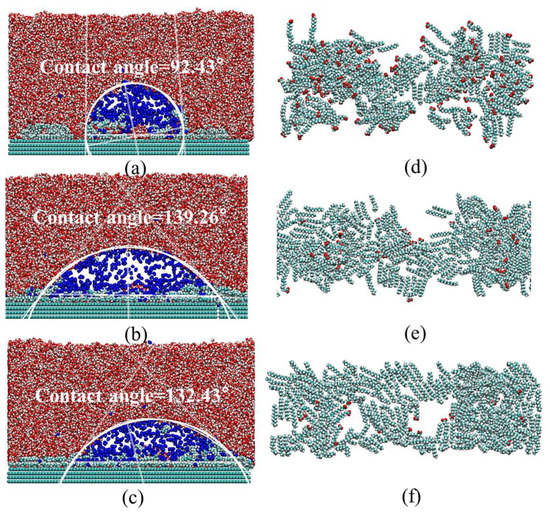
Figure 11.
Adsorption configurations of bubbles on the surface of the oil film of the compound collectors (a) OA:DD = 3:1, (b) OA:DD = 1:3, and (c) OA:DD = 1:6. Top views of the oil film structures of the compound collectors (d) OA:DD = 3:1, (e) OA:DD = 1:3, and (f) OA:DD = 1:6. In order to intercept the complete bubble structure, the structure in (b) extends to the right for a period, and the total length remains unchanged. The white auxiliary line in (a–c) is the Image-J contact angle fitting curve.
It can be found that in the process of bubble adhesion, several collector molecules migrate to the gas–liquid interface. The compound collector molecules form an oil ring at the gas–liquid–oil three-phase contact line (the oil film forms two rows of protrusions on the three-phase contact line in the case of cylindrical bubbles; inferred from this, in the case of spherical bubbles, the bulge will be connected into a ring, which can be called an oil ring). All three proportions of compound collectors can form an oil ring. Furthermore, it is found that a small fraction of OA molecules (some polar groups of collectors face outward, and most OA molecules spread on the surface of LRC) at the gas–oil interface migrate to the oil ring comparing Figure 8 with Figure 11. This is because the gas–liquid–oil three-phase line continues to move outward from the middle in the process of bubble adhesion. The adsorption of OA molecules in the oil film is more stable at the gas–liquid interface, so OA molecules will move outward following the three-phase line.
The concentration distribution of nitrogen molecules along the X axis in the adsorption configuration of bubbles on the oil film surface is shown in Figure 12. To facilitate comparison, we move the peak position of the curve to the middle position. The length of nitrogen spreading can represent the bubble adhesion area, which positively correlates to the stability of bubble adhesion to a certain extent. It can be seen that the bubble adhesion area is the largest when OA:DD = 1:3 and the smallest when OA:DD = 3:1, indicating that the bubble adhesion is the most stable when OA:DD = 1:3.
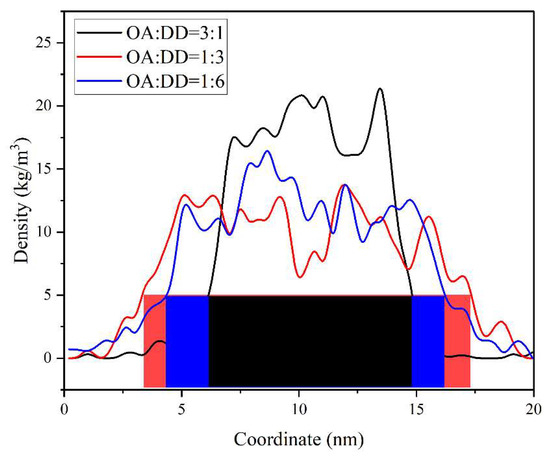
Figure 12.
The concentration distribution of nitrogen molecules along the X axis in the adsorption configuration of bubbles on the oil film surface. To facilitate comparison, we moved the curve peak position to the middle position. The range of the color block is about equal to the maximum width of the bubble body, and the gas molecules outside it have separated from the main body.
3.6.2. Contact Angles of the Oil Film Surface
The contact angles of the oil film surface after bubble adsorption of the three models are measured using the contact angle plug-in in the software ‘Image-J’ (version 2.0). Meanwhile, the bubble is used as the reference for contact angle measurement. The results are shown in Table 4. The measurement details are shown in Figure S3. A larger contact angle indicates better hydrophobicity of the oil film surface and a more stable oil ring. The contact angle is the largest when OA:DD = 1:3 and smallest when OA:DD = 3:1, demonstrating that the oil film has the best hydrophobicity when OA:DD = 1:3 and the increase in OA proportion will reduce the hydrophobicity of the oil film. The contact angle when OA:DD = 1:6, in which the proportion of OA is the lowest, is smaller than that when OA:DD = 1:3. On the one hand, when OA:DD = 1:3, the largest spreading area of the oil film facilitates the coverage of oxygen-containing functional groups on the surface of LRC, so the hydrophobicity of the LRC surface is the best at this ratio. On the other hand, it also reveals that the appropriate OA content is conducive to the adhesion of bubble and oil film, which is conducive to bubble mineralization. The analysis indicates that the migration of oleic acid molecules to the gas–liquid interface (oil ring) is beneficial to the adhesion of bubbles and oil film, thus improving the flotation process.
Table 4.
Contact angle of the oil film surface after bubble adsorption.
In An’s studies [56,64], the influence of compound collectors composed of DD and OA on the surface contact angle of LRC was investigated. In both of their studies, the compound proportion of OA to DD was fixed at 1:4. The results indicated that the surface contact angle of LRC could be significantly improved when the compound collector was spread on the LRC surface. Zhang et al. [59] also studied the effect of compound collectors on the wettability of LRC surfaces. They investigated the influence of the DTAB:diesel compound proportion on the contact angle, and the results showed that the contact angle reached its maximum value when DTAB:diesel was 1:2, which is consistent with the findings of our study. However, the contact angle simulated in this study is larger than that measured in their experiments. Due to the scale limitations of MD simulations, the contact angle simulated in this study is a nanoscale microscopic contact angle. At the microscopic scale, the contact angle of the LRC surface covered by compound collectors is equivalent to the contact angle of the oil film surface. Due to scale limitations, the adsorption of the collector at the gas–liquid interface, i.e., the formation of an oil ring, has a significant effect on the MD contact angle measurement. Moreover, the smaller experimental contact angle could be attributed to unavoidable surface contamination. Therefore, the contact angle measured in the simulation is larger than that measured in their experiments. This phenomenon has also been observed in similar MD simulation studies [65,66]. Although the MD simulation has some limitations, comparing the contact angle results under identical simulation conditions can provide supporting evidence for our analysis.
3.6.3. Merger Time of Bubble and Oil Film
A new MD analysis method for bubble–oil film adhesion, called the merger time of bubble and oil film, which occurs from the initial contact between the bubble and the oil film until the water molecules between the bubble and the oil film are not connected at all, is presented. The method could evaluate the adhesion speed of bubbles and oil film at the initial stage of adhesion, which reflects the force between the bubbles and the oil film. The shortest merger time is 410 ps when OA:DD = 1:3, as shown in Figure 13. The longest merger time is 590 ps when OA:DD = 3:1; the merger time is 465 ps when OA:DD = 1:6. It is indicated that when OA:DD = 1:3, the adhesion speed between the bubbles and oil film reaches the maximum at the initial stage of adhesion, which indirectly reflects that the force between bubbles and oil film is the maximum at this ratio. Furthermore, it indicates that the compound collector with a ratio of OA:DD = 1:3 has the best hydrophobicity on the surface of LRC.
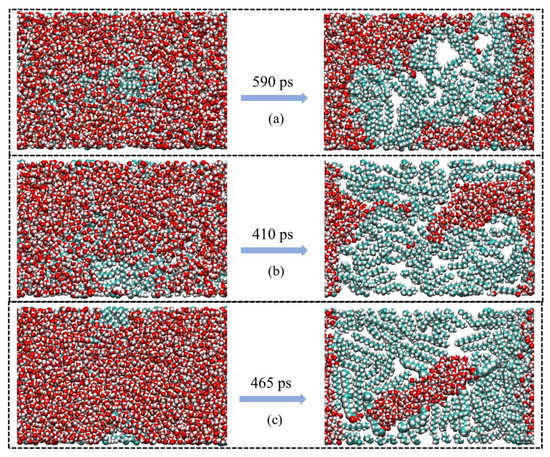
Figure 13.
Structure of three-phase contact line of gas–liquid collector (gas is hidden) and merger time during the process of bubble and oil film merger of (a) OA:DD = 3:1, (b) OA:DD = 1:3, and (c) OA:DD = 1:6 (definition of the merger process: from the initial contact between the bubble and the oil film until the water molecules between the bubble and the oil film are not connected at all).
4. Discussion
Most of the polar collectors for LRC flotation are similar. They all rely on the head polar functional groups to attract the oxygen-containing functional groups on the surface of LRC. Therefore, the action mechanism of polar collectors has a certain similarity, and it is universal to use OA as a representative polar collector in this paper.
The polarity is moderate when OA:DD = 1:3, which not only ensures a strong collecting capacity but avoids interacting with water excessively. Thus, the spreading area and interaction energy between the collector and LRC is the largest. The oil film formed at this ratio has the largest contact angle, that is, it has the best hydrophobicity, making it easier to adhere to the bubbles. In this interaction process between oil film and bubbles, the adhesion speed is the fastest and the force between bubbles and oil film is the greatest. Conversely, for OA:DD = 3:1, the overall polarity of the compound collector is strong and partial self-aggregation occurs, leading to many polar groups in the oil film facing the aqueous phase and worsening oil film spread. In the process of oil film and bubbles interaction, the bubble adhesion is poor and the bubble spreading area is small due to the strong interaction between oil film and water. When OA:DD = 1:6, the overall polarity is weak and its interaction with LRC is weak, so that part of the surface area of LRC is still occupied by water and the ultimate spreading area is smaller than that when OA:DD = 1:3. Therefore, the hydrophobicity is worse than that when OA:DD = 1:3 in the process of oil film and bubbles interaction, which results in worse bubble adhesion.
According to XPS results, flotation results, and simulation results, it is found that there is a certain correspondence between the oxygen content on the LRC surface and the optimal proportion. The flotation results indicate that the OA:DD = 1:3 compound collector has the best effectiveness to enhance the flotation process. The LRC surface model is established according to the XPS results, and its hydrophilic point accounts for one-third of the total surface. The flotation results are verified using the model to simulate the flotation process. The MD simulation results are consistent with the flotation results. The LRC model used in the MD simulation is based on the oxygen content on the LRC surface, indicating a corresponding relationship between the coal surface properties and the optimal compound proportion. The best proportion of compound collectors (polar collector ratio) fits well with the oxygen-containing sites on the LRC surface, which can be called the LRC–compound collector matching principle, as shown in Figure 14. In the future, our research focus will be on the improvement of this principle for LRC with different surface oxygen contents or coals with different metamorphic degrees, which will be a considerable workload and also important work in the field of flotation.
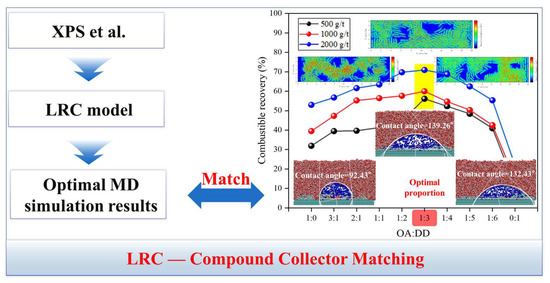
Figure 14.
The schematic diagram of LRC–compound collector matching principle.
5. Conclusions
The XPS results demonstrate that the surface of the studied coal samples has a high concentration of oxygen-containing functional groups, which worsens the hydrophobicity of the LRC surface. Obviously, in flotation tests when OA:DD = 1:3, the combustible recovery is the highest and the flotation result is optimal regardless of the dosage of compound collectors, indicating that the OA:DD = 1:3 compound collector has the best effectiveness to enhance the flotation process. The adsorption state of the compound collector was studied through zeta potential analysis. The molecular action mechanism of the optimal compound ratio is clarified through MD simulations. The mechanism is as follows: The compound collector of OA:DD = 1:3 not only ensures a strong collecting capacity but avoids interacting with water excessively. Thus, the spreading area is the largest and the interaction energy between collectors and LRC is the highest. The oil film formed at this ratio has the best hydrophobicity; therefore, the adhesion speed of the bubble is the fastest and the bubble adhesion is the most stable. With a proportion of OA: DD higher than 1:3, the self-aggregation of polar collectors worsens the spreading of the oil film. Additionally, when a proportion of OA: DD is lower than 1:3, its interaction with LRC is weak and the ultimate spreading area is small. These two effects reduce the hydrophobicity of the LRC surface, resulting in worse bubble adhesion.
This paves the way for further research and the engineering application of compound collectors. Meanwhile, this paper directly studied the interaction between bubbles and oil film on the surface of LRC, providing a new perspective to study the interaction between bubbles and coal particles in a flotation system. In the field of flotation, the direct interaction between bubbles and collectors should be emphasized in the future.
Supplementary Materials
The following supporting information can be downloaded at: https://www.mdpi.com/article/10.3390/min13040524/s1, Figure S1: The top view of the bubble, Figure S2: Total energy variation curves (since the total energy varies with the number of molecules in the initial system, it is normal to have a difference in the total energy between the systems, which is very small compared to the total energy value.), Figure S3: Image J contact angle fitting of the oil film surface after bubble adsorption.
Author Contributions
Conceptualization, Y.C.; Data curation, R.Z.; Formal analysis, X.B.; Funding acquisition, X.G.; Investigation, J.L. (Junling Liu) and Y.H.; Methodology, J.L. (Junling Liu), X.B. and Y.H.; Resources, J.L. (Jihui Li); Software, J.L. (Jincheng Liu); Validation, R.Z. and Y.X.; Visualization, X.B., J.L. (Jincheng Liu) and Y.C.; Writing—original draft, J.L. (Junling Liu) and X.B.; Writing–review and editing, Y.X., X.G. and B.A. All authors have read and agreed to the published version of the manuscript.
Funding
This research was funded by the National Natural Science Foundation of China (Grant no. 21978318, 52274278).
Data Availability Statement
Data is contained within the article and Supplementary Material.
Conflicts of Interest
The authors declare no conflict of interest.
References
- Yao, N.; Liu, J.; Sun, X.; Liu, Y.; Chen, S.; Wang, G. A Rational Interpretation of the Role of Turbulence in Particle-Bubble Interactions. Minerals 2021, 11, 1006. [Google Scholar] [CrossRef]
- Zhang, H.; Xi, P.; Zhuo, Q.; Liu, W. Construction of Molecular Model and Adsorption of Collectors on Bulianta Coal. Molecules 2020, 25, 4030. [Google Scholar] [CrossRef] [PubMed]
- Xing, Y.; Xu, M.; Gui, X.; Cao, Y.; Babel, B.; Rudolph, M.; Weber, S.; Kappl, M.; Butt, H.-J. The application of atomic force microscopy in mineral flotation. Adv. Colloid Interface Sci. 2018, 256, 373–392. [Google Scholar] [CrossRef]
- Zeng, W.; Zhang, G.; Shi, Q.; Ou, L. Effects and Mechanism of Fe3+ on Flotation Separation of Feldspar and Epidote with Sodium Oleate at Natural pH. Separations 2022, 9, 110. [Google Scholar] [CrossRef]
- Wu, D.; Wang, M.; Zeng, J.; Yao, J.; Jia, C.; Zhang, H.; Li, J. Preparation and Characterization of Graphene from Refined Benzene Extracted from Low-Rank Coal: Based on the CVD Technology. Molecules 2021, 26, 1900. [Google Scholar] [CrossRef] [PubMed]
- Huang, G.; Xu, J.; Geng, P.; Li, J. Carrier Flotation of Low-Rank Coal with Polystyrene. Minerals 2020, 10, 452. [Google Scholar] [CrossRef]
- Yang, A.; Liao, Y.; An, M.; Cao, Y.; Yang, Z.; Ren, H.; Su, H.; Zou, Q.; Chen, L. Effect of Ultrasonic Pretreatment on Flocculation Filtration of Low-Rank Coal Slurry. Molecules 2022, 27, 6460. [Google Scholar] [CrossRef]
- Zhang, Q.; Niu, C.; Bu, X.; Bilal, M.; Ni, C.; Peng, Y. Enhancement of Flotation Performance of Oxidized Coal by the Mixture of Laurylamine Dipropylene Diamine and Kerosene. Minerals 2021, 11, 1271. [Google Scholar] [CrossRef]
- Han, H.; Liu, A.; Wang, H. Effect of Hydrodynamic Cavitation Assistance on Different Stages of Coal Flotation. Minerals 2020, 10, 221. [Google Scholar] [CrossRef]
- Liao, Y.; Song, X.; An, M.; Yang, Z.; Hao, X.; Ren, H. Effect of Dodecane-Oleic Acid Collector Mixture on the Evolution of Wetting Film between Air Bubble and Low-Rank Coal. Minerals 2021, 11, 58. [Google Scholar] [CrossRef]
- Chang, Z.; Chen, X.; Peng, Y. The interaction between diesel and surfactant Triton X-100 and their adsorption on coal surfaces with different degrees of oxidation. Powder Technol. 2019, 342, 840–847. [Google Scholar] [CrossRef]
- Wang, Y.; Zhou, Y.; He, Q.; Xing, Y.; Bao, X.; Gui, X.; Wang, L. Research on Mechanisms of Improving Flotation Selectivity of Coal Slime by Adding Sodium Polyphosphate. Minerals 2022, 12, 1392. [Google Scholar] [CrossRef]
- Zhu, C.; Xing, Y.; Xia, Y.; Wang, Y.; Li, G.; Gui, X. Flotation intensification of low-rank coal using a new compound collector. Powder Technol. 2020, 370, 197–205. [Google Scholar] [CrossRef]
- Zhou, W.; Wang, S.; Wang, L.; Cai, C.; Li, J.; Liu, L.; Zhu, J.; Min, F. Study on Dispersion and Mixing Mechanism of Coal Slime Particles in Jet Mixing Flow Field. Minerals 2023, 13, 13. [Google Scholar] [CrossRef]
- Xia, Y.; Fang, D.; Qu, P.; Li, Y. Interfacial Adhesion between Fatty Acid Collectors and Hydrophilic Surfaces: Implications for Low-Rank Coal Flotation. Molecules 2022, 27, 4392. [Google Scholar] [CrossRef] [PubMed]
- Hu, X.; Tong, Z.; Sha, J.; Bilal, M.; Sun, Y.; Gu, R.; Ni, C.; Li, C.; Deng, Y. Effects of Flotation Reagents on Flotation Kinetics of Aphanitic (Microcrystalline) Graphite. Separations 2022, 9, 416. [Google Scholar] [CrossRef]
- Zhang, L.; Sun, X.; Li, B.; Xie, Z.; Guo, J.; Liu, S. Experimental and molecular dynamics simulation study on the enhancement of low rank coal flotation by mixed collector. Fuel 2020, 266, 117046. [Google Scholar] [CrossRef]
- Bao, X.; Xing, Y.; Liu, Q.; Liu, J.; Dai, S.; Gui, X.; Li, J.; Yang, Z. Investigation on mechanism of the oleic acid/methyl oleate/diesel ternary compound collector in low-rank coal flotation. Fuel 2022, 320, 123894. [Google Scholar] [CrossRef]
- Liao, Y.; Yang, Z.; An, M.; Ma, L.; Yang, A.; Cao, Y.; Chen, L.; Ren, H. Alkanes-esters mixed collector enhanced low rank coal flotation: Interfacial interaction between oil drop and coal particle. Fuel 2022, 321, 124045. [Google Scholar] [CrossRef]
- Xue, Z.; Dong, L.; Li, H.; Fan, M.; Ren, Z.; Liu, A.; Fan, P.; Bao, W. Study on the mechanism of flotation of coal gasification fine slag reinforced with naphthenic acids. Fuel 2022, 324, 124557. [Google Scholar] [CrossRef]
- Grzybek, T.; Pietrzak, R.; Wachowska, H. X-ray photoelectron spectroscopy study of oxidized coals with different sulphur content. Fuel Process. Technol. 2002, 77–78, 1–7. [Google Scholar] [CrossRef]
- Xing, Y.; Zhang, Y.; Liu, M.; Xu, M.; Guo, F.; Han, H.; Gao, Z.; Cao, Y.; Gui, X. Improving the floatability of coal with varying surface roughness through hypobaric treatment. Powder Technol. 2019, 345, 643–648. [Google Scholar] [CrossRef]
- Xing, Y.; Gui, X.; Cao, Y.; Wang, Y.; Xu, M.; Wang, D.; Li, C. Effect of compound collector and blending frother on froth stability and flotation performance of oxidized coal. Powder Technol. 2017, 305, 166–173. [Google Scholar] [CrossRef]
- Yang, Z.; Liao, Y.; An, M.; Ren, H.; Hao, X.; Song, X.; Liu, Z. Composition characteristics of siloxane derived waste lubricating oil and its effect on low-rank coal flotation. Fuel 2021, 305, 121555. [Google Scholar] [CrossRef]
- Yang, Z.; Xia, Y.; Li, M.; Ma, Z.; Xing, Y.; Gui, X. Effects of pore compression pretreatment on the flotation of low-rank coal. Fuel 2019, 239, 63–69. [Google Scholar] [CrossRef]
- Xia, Y.; Zhang, R.; Cao, Y.; Xing, Y.; Gui, X. Role of molecular simulation in understanding the mechanism of low-rank coal flotation: A review. Fuel 2020, 262, 116535. [Google Scholar] [CrossRef]
- Xia, Y.; Rong, G.; Xing, Y.; Gui, X. Synergistic adsorption of polar and nonpolar reagents on oxygen-containing graphite surfaces: Implications for low-rank coal flotation. J. Colloid Interface Sci. 2019, 557, 276–281. [Google Scholar] [CrossRef]
- Liu, Z.; Ren, H.; Yang, Z.; Liao, Y.; Cao, Y. Effect of mixed collector addition sequence on the adsorption behavior of low-rank coal surface: Experimental and molecular dynamics simulation study. Powder Technol. 2022, 397, 117119. [Google Scholar] [CrossRef]
- Xia, Y.; Xing, Y.; Li, M.; Liu, M.; Tan, J.; Cao, Y.; Gui, X. Studying interactions between undecane and graphite surfaces by chemical force microscopy and molecular dynamics simulations. Fuel 2020, 269, 117367. [Google Scholar] [CrossRef]
- Zhong, J.; Wang, X.; Du, J.; Wang, L.; Yan, Y.; Zhang, J. Combined Molecular Dynamics and Quantum Mechanics Study of Oil Droplet Adsorption on Different Self-Assembly Monolayers in Aqueous Solution. J. Phys. Chem. C 2013, 117, 12510–12519. [Google Scholar] [CrossRef]
- Vassetti, D.; Pagliai, M.; Procacci, P. Assessment of GAFF2 and OPLS-AA General Force Fields in Combination with the Water Models TIP3P, SPCE, and OPC3 for the Solvation Free Energy of Druglike Organic Molecules. J. Chem. Theory Comput. 2019, 15, 1983–1995. [Google Scholar] [CrossRef] [PubMed]
- Luo, Q.-Q.; Yang, J.-M. Gas adsorption and accumulation on hydrophobic surfaces: Molecular dynamics simulations*. Chin. Phys. B 2015, 24, 96801. [Google Scholar] [CrossRef]
- Su, D.; Zhang, L.; Guo, J.; Liu, S.; Li, B. Adsorption and accumulation mechanism of N2 on groove-type rough surfaces: A molecular simulation study. J. Mol. Liq. 2022, 366, 120260. [Google Scholar] [CrossRef]
- Wang, J.; Wolf, R.M.; Caldwell, J.W.; Kollman, P.A.; Case, D.A. Development and testing of a general amber force field. J. Comput. Chem. 2004, 25, 1157–1174. [Google Scholar] [CrossRef] [PubMed]
- Abraham, M.J.; Murtola, T.; Schulz, R.; Páll, S.; Smith, J.C.; Hess, B.; Lindahl, E. GROMACS: High performance molecular simulations through multi-level parallelism from laptops to supercomputers. SoftwareX 2015, 1–2, 19–25. [Google Scholar] [CrossRef]
- Neese, F.; Wennmohs, F.; Becker, U.; Riplinger, C. The ORCA quantum chemistry program package. J. Chem. Phys. 2020, 152, 224108. [Google Scholar] [CrossRef] [PubMed]
- Brandenburg, J.G.; Bannwarth, C.; Hansen, A.; Grimme, S. B97-3c: A revised low-cost variant of the B97-D density functional method. J. Chem. Phys. 2018, 148, 64104. [Google Scholar] [CrossRef]
- Schauperl, M.; Nerenberg, P.S.; Jang, H.; Wang, L.-P.; Bayly, C.I.; Mobley, D.L.; Gilson, M.K. Non-bonded force field model with advanced restrained electrostatic potential charges (RESP2). Commun. Chem. 2020, 3, 44. [Google Scholar] [CrossRef]
- Lu, T.; Chen, F. Multiwfn: A multifunctional wavefunction analyzer. J. Comput. Chem. 2012, 33, 580–592. [Google Scholar] [CrossRef]
- Lu, T. Sobtop, Version 1.0(dev3). Available online: https://sobereva.com/soft/Sobtop (accessed on 26 March 2022).
- Pandit, S.; Maroli, N.; Naskar, S.; Khatri, B.; Maiti, P.K.; De, M. Graphene oxide as a dual template for induced helicity of peptides. Nanoscale 2022, 14, 7881–7890. [Google Scholar] [CrossRef]
- Martínez, L.; Andrade, R.; Birgin, E.G.; Martínez, J.M. PACKMOL: A package for building initial configurations for molecular dynamics simulations. J. Comput. Chem. 2009, 30, 2157–2164. [Google Scholar] [CrossRef] [PubMed]
- Yang, H.; Zhang, F.; Xing, Y.; Gui, X.; Cao, Y. Influence of Surface Heterogeneity on Morphology of Interfacial Nanobubble. Front. Mater. 2022, 8, 644. [Google Scholar] [CrossRef]
- Yang, H.; Xing, Y.; Zhang, F.; Gui, X.; Cao, Y. Contact angle and stability of interfacial nanobubble supported by gas monolayer. Fundam. Res. 2022, in press. [Google Scholar] [CrossRef]
- Giri, A.K.; Malgaretti, P.; Peschka, D.; Sega, M. Resolving the microscopic hydrodynamics at the moving contact line. Phys. Rev. Fluids 2022, 7, L102001. [Google Scholar] [CrossRef]
- Zhang, R.; Xing, Y.; Luo, J.; Xia, Y.; Xu, M.; Wang, X.; Tan, J.; Gui, X. Molecular Dynamics Simulation Study of Bubble Attachment at the Coal Surface with Varying Coalification Degrees. ACS Omega 2020, 5, 20134–20140. [Google Scholar] [CrossRef]
- Zimmermann, K. ORAL: All purpose molecular mechanics simulator and energy minimizer. J. Comput. Chem. 1991, 12, 310–319. [Google Scholar] [CrossRef]
- Bussi, G.; Donadio, D.; Parrinello, M. Canonical sampling through velocity rescaling. J. Chem. Phys. 2007, 126, 14101. [Google Scholar] [CrossRef] [PubMed]
- Hess, B.; Bekker, H.; Berendsen, H.J.C.; Fraaije, J.G.E.M. LINCS: A linear constraint solver for molecular simulations. J. Comput. Chem. 1997, 18, 1463–1472. [Google Scholar] [CrossRef]
- Essmann, U.; Perera, L.; Berkowitz, M.L.; Darden, T.; Lee, H.; Pedersen, L.G. A smooth particle mesh Ewald method. J. Chem. Phys. 1995, 103, 8577–8593. [Google Scholar] [CrossRef]
- Humphrey, W.; Dalke, A.; Schulten, K. VMD: Visual molecular dynamics. J Mol. Graph. 1996, 14, 33–38. [Google Scholar] [CrossRef]
- Baryiames, C.P.; Garrett, P.; Baiz, C.R. Bursting the bubble: A molecular understanding of surfactant-water interfaces. J. Chem. Phys. 2021, 154, 170901. [Google Scholar] [CrossRef] [PubMed]
- Xu, C.; Wang, H.; Wang, D.; Zhu, X.; Zhu, Y.; Bai, X.; Yang, Q. Improvement of Foaming Ability of Surfactant Solutions by Water-Soluble Polymers: Experiment and Molecular Dynamics Simulation. Polymers 2020, 12, 571. [Google Scholar] [CrossRef] [PubMed]
- Zhang, L.; Guo, J.; Xie, Z.; Li, B.; Liu, S. Micro-mechanism of improving low-rank coal flotation by using carboxylic acid collector: A DFT calculation and MD simulation study. Colloids Surf. A 2021, 622, 126696. [Google Scholar] [CrossRef]
- Wang, S.; Xia, Q.; Xu, F. Investigation of collector mixtures on the flotation dynamics of low-rank coal. Fuel 2022, 327, 125171. [Google Scholar] [CrossRef]
- An, M.; Liao, Y.; Cao, Y.; Hao, X.; Ma, L. Improving Low Rank Coal Flotation Using a Mixture of Oleic Acid and Dodecane as Collector: A New Perspective on Synergetic Effect. Processes 2021, 9, 404. [Google Scholar] [CrossRef]
- Liao, Y.; Hao, X.; An, M.; Yang, Z.; Ma, L.; Ren, H. Enhancing low-rank coal flotation using mixed collector of dodecane and oleic acid: Effect of droplet dispersion and its interaction with coal particle. Fuel 2020, 280, 118634. [Google Scholar] [CrossRef]
- Vilasó-Cadre, J.E.; Ávila-Márquez, D.M.; Reyes-Domínguez, I.A.; Blanco-Flores, A.; Gutiérrez-Castañeda, E.J. Coal flotation in a low-rank carbonaceous mineral using 3-phenyl-1-propanol as a collector reagent. Fuel 2021, 304, 121363. [Google Scholar] [CrossRef]
- Zhang, R.; Xia, Y.; Guo, F.; Sun, W.; Cheng, H.; Xing, Y.; Gui, X. Effect of microemulsion on low-rank coal flotation by mixing DTAB and diesel oil. Fuel 2020, 260, 116321. [Google Scholar] [CrossRef]
- Ibarra, J.; Muñoz, E.; Moliner, R. FTIR study of the evolution of coal structure during the coalification process. Org. Geochem. 1996, 24, 725–735. [Google Scholar] [CrossRef]
- Liu, J.; Zhang, R.; Bao, X.; Hao, Y.; Gui, X.; Xing, Y. New insight into the role of the emulsified diesel droplet size in low rank coal flotation. Fuel 2023, 338, 127388. [Google Scholar] [CrossRef]
- Xia, Y.; Yang, Z.; Zhang, R.; Xing, Y.; Gui, X. Performance of used lubricating oil as flotation collector for the recovery of clean low-rank coal. Fuel 2019, 239, 717–725. [Google Scholar] [CrossRef]
- Ren, H.; Liao, Y.; Yang, Z.; An, M.; Hao, X.; Song, X.; Liu, Z. Effect of Fe2+ on low rank coal flotation using oleic acid as collector. Powder Technol. 2021, 393, 250–256. [Google Scholar] [CrossRef]
- An, M.; Liao, Y.; Yang, Z.; Cao, Y.; Hao, X.; Song, X.; Ren, H.; Yang, A.; Chen, L. Energy Feature of Air Bubble Detachment from a Low-Rank Coal Surface in the Presence of a Dodecane-Oleic Acid Collector Mixture. ACS Omega 2022, 7, 18315–18322. [Google Scholar] [CrossRef] [PubMed]
- Xu, K.; Zhang, J.; Hao, X.; Zhang, C.; Wei, N.; Zhang, C. Wetting Properties of Defective Graphene Oxide: A Molecular Simulation Study. Molecules 2018, 23, 1439. [Google Scholar] [CrossRef] [PubMed]
- Chen, C.; Wan, J.; Li, W.; Song, Y. Water contact angles on quartz surfaces under supercritical CO2 sequestration conditions: Experimental and molecular dynamics simulation studies. Int. J. Greenh. Gas Control 2015, 42, 655–665. [Google Scholar] [CrossRef]


Disclaimer/Publisher’s Note: The statements, opinions and data contained in all publications are solely those of the individual author(s) and contributor(s) and not of MDPI and/or the editor(s). MDPI and/or the editor(s) disclaim responsibility for any injury to people or property resulting from any ideas, methods, instructions or products referred to in the content. |
© 2023 by the authors. Licensee MDPI, Basel, Switzerland. This article is an open access article distributed under the terms and conditions of the Creative Commons Attribution (CC BY) license (https://creativecommons.org/licenses/by/4.0/).