Abstract
Graphite tailings were used as the raw materials for the preparation of foamed ceramics via a high-temperature self-foaming method. The residual carbon in the tailings acted as the foaming agent and no additional foaming agents were required. The residual carbon reacted with Fe2O3 and produced gas that was wrapped by the liquid phase to form a porous structure. The effects of sintering temperature, holding time, carbon content, flux on the bulk density, water absorption, and mean pore size of the foamed ceramics were investigated. The bulk density, compressive strength, thermal conductivity, and water absorption of the foamed ceramic prepared using the optimal sample D100 (100 wt% graphite tailings) and sintered at 1200 °C for 20 min were 1.36 g/cm3, 0.35%, 12.03 MPa, and 0.51 W/(m·K), respectively. The raw material contained CaO, Fe2O3, and SiO2, which formed augite with a low fusibility point. In contrast, the molten decomposition products of potassium feldspar and CaSiO3 ions formed anorthite, which has a high fusibility point. Therefore, potassium feldspar is not recommended for use as a flux in tailing systems with high calcium content. Foamed ceramics were prepared using up to 100 wt% graphite tailings. This is a new approach for the economical disposal of graphite tailings.
1. Introduction
As the most common anode material of lithium-ion and other batteries used in electric vehicles, graphite is in increasing demand with the rapid development of the electric automobile industry [1]. According to the statistics of the United States Geological Survey, China is the largest graphite producer in the world (about 66%) [2,3], and the graphite output reached 779,000 tons in 2022. Graphite tailings are waste from the processing of graphite ore or beneficiation. Graphite tailing storage occupies a large amount of land, pollutes the surrounding environment [4,5], and carries serious potential safety hazards [6,7]. Therefore, the utilization of graphite tailings is of great significance for resource conservation and environmental ecology.
Currently, the main direction of the utilization of graphite tailings is the combined utilization of solid waste and high-value-added constituents, focusing on the recovery of valuable components and the application of subgrade and construction materials [8]. For example, Yu et al. [9]. used a chemical process to reach up to 95.5% of the vanadium from graphite tailings and obtained potassium alum and ammonium alum from graphite tailings with yields of 9.2% and 23.2%, respectively. Fang et al. [10] developed the subgrade materials using graphite tailings with 6% cement that had good compressive strength and temperature shrinkage resistance. The subgrade materials have potential use as a highway roadbed. Peng et al. [6] used 60% graphite tailings instead of silica to produce autoclaved aerated concrete and successfully obtained a bulk density of 0.666 g/cm3 and compressive strength of 5.0 MPa. Wu et al. [11] used 60.87% graphite tailings to prepare ceramic tiles with low water absorption of 0.22–0.48% and high flexural strength of 88–93.54 MPa. Although a certain amount of resource recovery could be achieved through valuable components from graphite tailings, it did not solve the problem of massive accumulation. It could achieve large-scale tailings elimination when making highway roadbeds. However, the transportation distance and economics of highway construction need to be considered. Construction materials represented the use of tailings in materials with high added value. At present, the low utilization rate combined with the high potential value of materials make graphite tailings an urgent resource to be developed.
The main chemical components of graphite tailings are SiO2, Al2O3, and CaO [12,13,14]. Silicate is the main component of foamed ceramics, which are porous ceramic materials produced via high-temperature sintering [15]. Thus, graphite tailings can be used to produce foam ceramics. Carbon residues in the tailings can be used as the foaming agent [16], which reduces the need for additional foaming agents, reduces costs, and simplifies the production process. Therefore, the use of graphite tailings to produce foam ceramics could overcome the limitations of the previously described applications.
In comparison with conventional insulation materials, foamed ceramics have high porosity, corrosion resistance, and temperature resistance. Moreover, they are environmentally benign materials with a broad range of potential applications in the metallurgical, chemical, environmental, and energy industries [17]. High-temperature foaming can be used to prepare foamed ceramics with stable properties. Moreover, solid waste can be used as the raw material, which realizes the utilization of solid waste. Recently, many studies have attempted to produce foamed ceramics from solid waste using high-temperature foaming methods. For example, a foamed ceramic with a bulk density of 0.33 g/cm3 and water absorption of 22.79% was prepared using 60 wt% electrolytic manganese residue [18] as the raw material and 1 wt% SiC as the foaming agent, and sintered at 1170 °C. Moreover, a foamed ceramic with a low bulk density and high compressive strength was prepared from 85 wt% granite waste [19] and 1 wt% SiC. However, these processes required the addition of foaming agents or fluxes, which increased the relative cost and complexity of the process. Reducing the cost of producing foamed ceramics from solid waste is a major consideration for industrial operations.
This study aims to prepare foamed ceramics using graphite tailings via a high-temperature self-foaming method. The process conditions required to prepare foamed ceramics with desirable properties were determined. Carbon was used as the foaming agent and the foaming mechanism was investigated. The effects of the composition on the physical properties, pore structure, phase composition, and fusibility temperature were studied in detail. The results of this paper have great significance of theoretical guidance in the application of graphite tailings in foamed ceramics.
2. Materials and Methods
2.1. Materials
The graphite tailings and carbon used in this study were obtained from Heilongjiang, China. The potassium feldspar used in this study was obtained from Hunan, China. The polyvinyl alcohol (PVA 24-88) used in this study was obtained from Shanghai, China. The chemical and phase compositions of the raw material, carbon, and potassium feldspar were analyzed using X-ray fluorescence (XRF, APL Perform’X4200, USA) and X-ray diffraction (XRD, Smart Lab SE, Rigaku, Japan), respectively. The results of the analysis are shown in Table 1 and Figure 1. The graphite tailings consisted of 54.52% silica and 11.95% alumina. The main phases included were quartz, muscovite-3t, calcite, microcline, cordierite, and carbon. The carbon content in the raw materials was determined to be 3.65% using a carbon/sulfur analyzer (CSA, Horiba Jobin Yvon, Japan).

Table 1.
Chemical composition of graphite tailings and potassium feldspar (wt%).
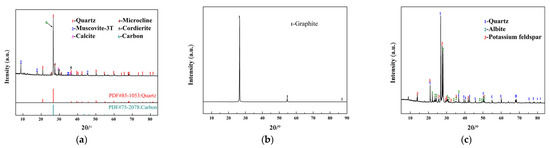
Figure 1.
XRD pattern of (a) graphite tailings, (b) carbon, and (c) potassium feldspar.
2.2. Sample Preparation
Graphite tailings (D50 = 124.0901 μm) were used as the main raw material in this study. They were dried at 110 °C to a constant weight and ground in a vibrating mill (RK/X ZM-100 D50 = 19.4406 μm), and the sample preparation process is shown in Figure 2. Graphite tailings and potassium feldspar were mixed in amounts varying from 100 to 60 wt% and 0 to 40 wt%, respectively. The selected mixture was mixed with additional additives (Fe2O3 and carbon) and 2 wt% powder binder polyvinyl alcohol (specific proportion and formula are shown in Table 2), and ball milled in the porcelain jar of a planetary ball mill (QM QX 2L) for 30 min at 200 rpm in the absence of water. The sample (D50 = 18.3691 μm) was then dry pressed to form a cylindrical sample (Φ20 mm × 20 mm) at a pressure of 15 MPa.
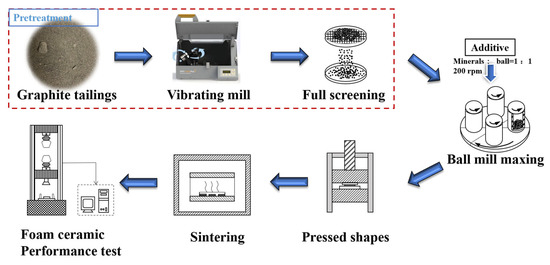
Figure 2.
Preparation process of foamed ceramic.
Table 2.
Composition of sample ingredients (wt%) (2% polyvinyl alcohol was added as powder binder).
The samples were heated to 1140–1260 °C at a rate of 5 °C/min in a muffle furnace (HY-1400-4). They were held at the target temperature for 10–40 min, and then cooled in the furnace to ambient temperature (Figure 2). Hereinafter, the samples are labeled with T—temperatures (1140 °C, 1160 °C, 1180 °C, 1200 °C, 1220 °C, 1240 °C, and 1260 °C) and t—time based on the sintering temperature and holding time (10 min, 20 min, 30 min, and 40 min).
2.3. Characterization Techniques
The sample bulk density ρ was measured using Archimedes’ method, whereas the water absorption of the sample was determined using the impregnation method.
The crystalline phases of the raw materials and various samples were investigated using XRD analysis. When heated, the sample gradually transitioned from a solid to a liquid phase, which was measured using an ash fusibility tester (AFT, 5E-AF3000, Changsha, China). Table 3 shows the deformation temperatures (DTs), softening temperatures (STs), hemispherical temperatures (HTs), and flow temperatures (FTs) of the materials, which were considered to be fusibility characteristic temperatures. The microstructures and cross-sectional morphologies of the sample were observed using a camera (Canon 850D) and biomicroscope (BX53, Olympus, Japan). The pore sizes in two dimensions were analyzed using Nano Measure 1.2 (Fudan University). Macroscopic images of 200 adjacent pores were obtained, the pore diameter distribution was divided according to the pore diameter, and the mean pore diameter (d) was calculated. According to ASTM D3576-98 [20], the three-dimensional mean pore diameter (D) was calculated using Equation (1).
D = d/0.785
Table 3.
Sample fusibility analysis (insert figure: characteristic points at different temperatures).
CSA with a high-frequency combustion furnace was used to accurately determine the residual carbon content of the tailings. The weight changes and thermal behaviors of the samples were analyzed using thermogravimetry differential scanning calorimetry (TG-DSC, Labys Evo, Setaram Labsys, France). An electronic universal testing machine (CMT4304, US) was used to test the compressive strength (the average of the five samples tested). A Hot Disk (TPS 2500S, Sweden) was used to obtain the thermal conductivity values of the foamed ceramics.
3. Results and Discussion
3.1. Sintering Process Conditions
3.1.1. Effect of the Sintering Temperature
Samples of C10-D90 were held at different temperatures for 20 min and the effects on the bulk density and water absorption were investigated. The results are shown in Figure 3a. The bulk density decreases with an increase in temperature. However, the bulk density of T1260 was higher than that of T1240. This is because small bubbles of CO and CO2 converged and floated up through the material [21]. At 1240 °C, the liquid phase wrapped the bubbles. However, at 1260 °C, the viscosity of the liquid phase was lower; hence, it was less able to wrap the bubbles and more bubbles broke through the surface into the air [22]. Thus, the glass phase remained in the T1240 sample, as shown in Figure 4. The water absorption of samples decreases first and then increases with an increase in temperature. Samples T1140 and T1160 had high water absorption because the temperatures were below the softening range of the material. Hence, there was little liquid phase on the surfaces of the samples; there were many gaps between the particles. Consequently, water was able to enter the samples during the soaking process. The water absorption began to increase when the temperature reached 1220 °C, owing to the presence of the pores and pore-to-pore connectivity which absorbed water via the capillary effect [23].
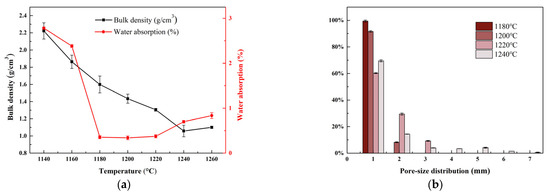
Figure 3.
(a) Bulk density and water absorption and (b) pore size distribution of samples sintered at different temperatures for 20 min.
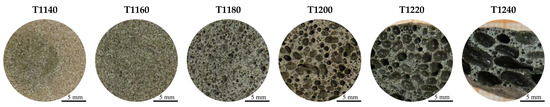
Figure 4.
Cross-sectional images of samples sintered at different temperatures for 20 min.
Figure 3b shows the pore diameter distributions of the samples, with the pore diameter distribution being wide. As the temperature increased, the mean pore size and porosity of C10-D90 samples increased (see Figure 5). The mean pore size ranges from 0.39 mm to 1.64 mm and the porosity ranges from 37.2% to 63.8%. The mean pore size increased significantly. Sample T1240 had large pores (the mean pore size was approximately 1.64 mm and porosity reached 63.8%) with irregular size distribution and shape. This is because the bubbles expanded rapidly and ruptured easily at high temperatures, which resulted in the gas escaping [24].
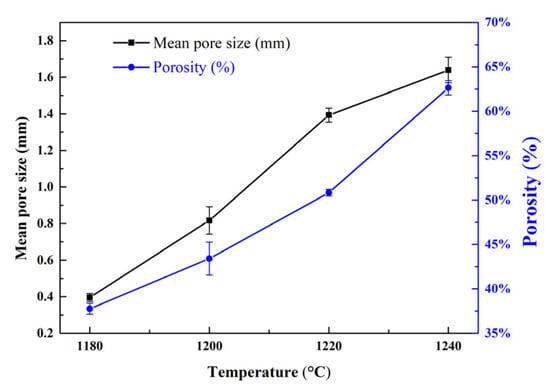
Figure 5.
Mean pore size and porosity of samples sintered at different temperatures for 20 min.
Therefore, the experiments showed that foamed ceramics could be produced from graphite tailings by self-foaming under high temperature conditions. Based on the aforementioned results, a temperature below 1240 °C was selected for the subsequent experiments.
3.1.2. Effect of the Holding Time
Samples of C10-D90 were sintered at 1200 °C with different holding times and the effects on the pore structure were investigated. As shown in Figure 6a, the bulk density decreased to 1.27 g/cm3 as the holding time increased; due to the pores being formed, the diameter of the pores increased, and pores merged [25], causing the bulk density to reduce.
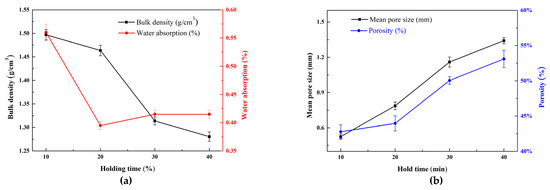
Figure 6.
(a) Bulk density and water absorption and (b) mean pore size and porosity of samples sintered at 1200 °C for different holding times.
The water absorption changed slightly, decreasing at first and then increasing, and Sample t20 had a minimum water absorption of 0.4%. As the holding time increased from 10 to 20 min, the water absorption decreased owing to greater consistency in the pore size and good pore sealing. When the holding time exceeded 20 min, the pores expanded excessively and the walls between them became thin (as shown in Figure 7). Owing to this, the pore size became less consistent, pores were unsealed, and the water absorption increased.
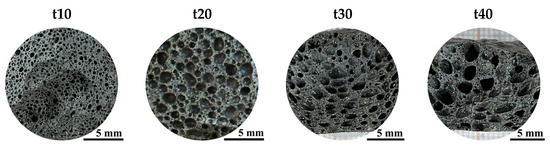
Figure 7.
Cross-sectional images of samples sintered at 1200 °C for different holding times.
Figure 6b shows the mean pore size and porosity of C10-D90 samples; the mean pore sizes and porosity in Sample t10 were 0.54 mm in diameter and 42.8%, respectively. The difference between the mean pore sizes of Samples t10 and t40 was 0.78 mm. The difference between the porosity of Samples t10 and t40 was 10.3%. When the pore distribution is uneven and the mean pore size is relatively large, the physical properties of the sample will be affected [22]. Therefore, an optimum holding time of 20 min was selected for the subsequent tests.
3.2. Effect of Raw Material Composition
3.2.1. Effect of Carbon
The effect that the carbon content had on the foaming effect of the samples was investigated. High-temperature decarbonization of the raw material was conducted according to GB/T3521-2008 without considering the effects of secondary sintering, and then different carbon contents were added to the samples. As shown in Figure 8a, the bulk density decreased because the reaction between carbon and Fe2O3 produced pores.
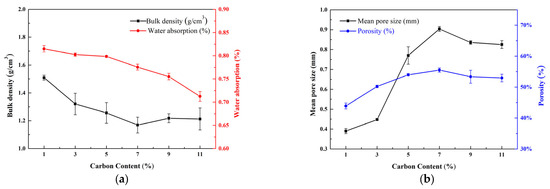
Figure 8.
(a) Bulk density and water absorption and (b) mean pore size and porosity with different carbon contents at 1200 °C for 20 min.
Figure 8b shows that the difference between the mean pore sizes and the porosity of A9-D90 and A11-D90 was 0.003 mm and 0.4%, respectively, which indicated that few new pores were generated (as shown in Figure 9).
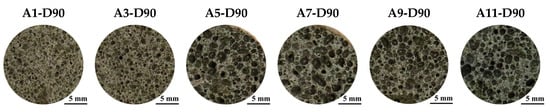
Figure 9.
Cross-sectional images of samples with different carbon contents at 1200 °C for 20 min.
These results show that carbon can be used as a foaming agent and that the proper carbon content determines the improvement in the performance of the resulting foamed ceramics.
3.2.2. Effect of Fe2O3 Content
Figure 10a shows the effect of the Fe2O3 content on the fusibility temperature. As the Fe2O3 content increased, the fusibility temperature decreased. The addition of Fe2O3 produced a fluxing effect because Fe2O3 promoted the fusibility of quartz in the green body, accelerated the fusibility flow, and reduced the viscosity of the liquid [26].
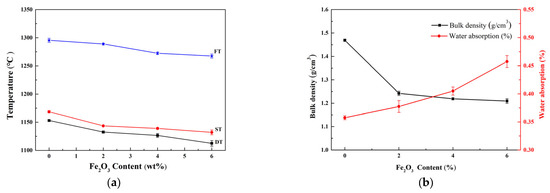
Figure 10.
(a) Fusibility characteristic temperature, and (b) bulk density and water absorption of samples with different Fe2O3 contents at 1200 °C for 20 min.
Figure 10b shows the bulk density and water absorption of the samples with different Fe2O3 contents. The bulk density decreased as the Fe2O3 content increased. The water absorption mainly depended on the amount of water absorbed via the wetting effect when the sample surface was in contact with water [27]. The water absorption increased as the Fe2O3 content increased because when the samples were sintered at 1200 °C, according to the described characteristics in Table 3, the temperature was between the ST and FT, at which time the liquid phase exceeded the solid phase. As the liquid phase increased, the viscosity of the sample decreased, and the resistance to pore growth decreased [28]. As the viscosity decreased, the sample was less resistant to bubble growth, which made it easier for large pores to form [29,30] (see Figure 11). Consequently, the pores were less independent and the water absorption increased. This corresponds to the trends in the mean pore size and porosity shown in Figure 12.
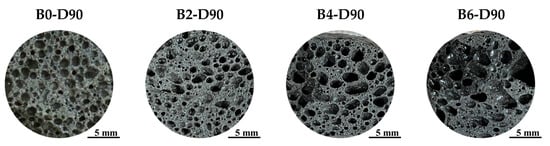
Figure 11.
Cross-sectional images of samples with different Fe2O3 contents at 1200 °C for 20 min.
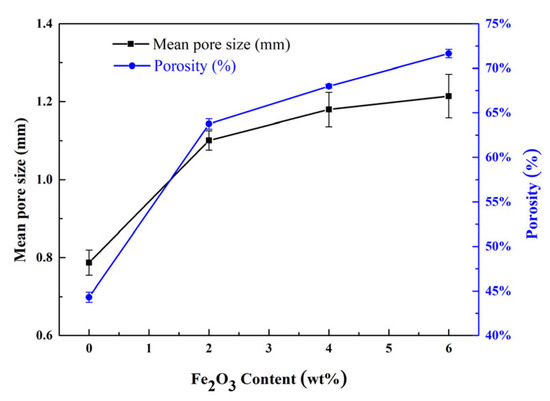
Figure 12.
Mean pore size and porosity of samples with different Fe2O3 contents at 1200 °C for 20 min.
3.2.3. Effect of Flux Potassium Feldspar
The effect of potassium feldspar was investigated to consider a range of applications of graphite tailings. As shown in Figure 13a, as the potassium feldspar content of the samples increased, the fusibility temperature increased. This is because the tailings and potassium feldspar consisted of 22.34% and 10.09% alkaline earth metals, as shown in Table 1, respectively. As the potassium feldspar content of the samples increased and the tailings content decreased, the amount of fluxing components and carbon (the foaming agent) decreased, leading to an increase in the softening temperature of the green body, a decrease in the liquid phase, a decrease in the rate at which gas was generated by the foaming agent [24], the pores becoming more independent (see Figure 14), and a reduction in the mean pore size and porosity, as shown in Figure 15.
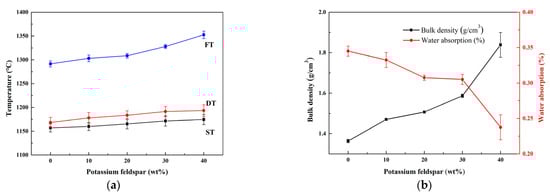
Figure 13.
(a) Fusibility characteristic temperature, and (b) bulk density and water absorption of samples with different potassium feldspar contents at 1200 °C for 20 min.
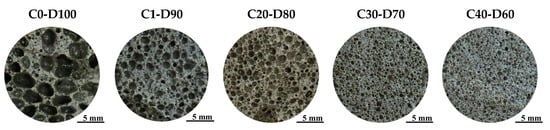
Figure 14.
Cross-sectional images of samples with different potassium feldspar at 1200 °C for 20 min.
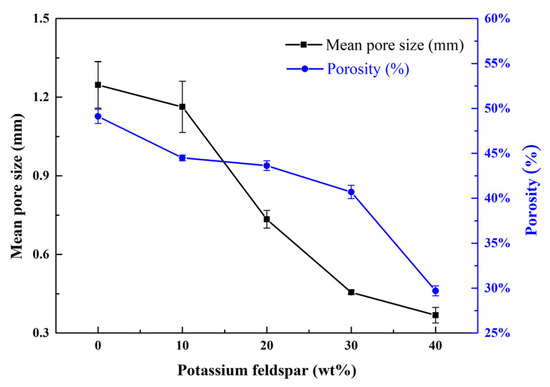
Figure 15.
Mean pore size and porosity of samples with different potassium feldspar contents at 1200 °C for 20 min.
Therefore, the bulk density increased owing to the decrease in the gas production rate, and the water absorption decreased owing to the good pore independence, as shown in Figure 13b.
3.2.4. Study on the Effect of Flux
Samples with different Fe2O3 contents were sintered to 1200 °C for 20 min. Figure 16a shows the effect of the Fe2O3 content on the phase composition. All of the samples contained quartz, as shown in Figure 16a, and the intensity of the quartz diffraction peak gradually decreased as the Fe2O3 content increased. In contrast, the intensity of the augite and hematite peaks gradually increased. This may be because Fe2O3 reacts with CO to form Fe3O4, which reacts with CO to form FeO, which reacts with CaO and SiO2 to form calcium–iron augite (CaFeSi2O6), according to Equation (2):
FeO + 2SiO2 + CaO = CaFeSi2O6 (augite)
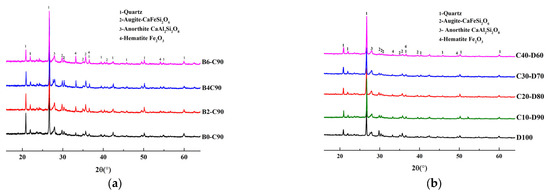
Figure 16.
XRD patterns of samples with different (a) Fe2O3 contents and (b) potassium feldspar contents.
The CaFeSi2O6 is difficult to be reduced and the liquid phase formation temperature can be as low as 1070 °C. However, some of the Fe2O3 that was not involved in this reaction remained in the samples as hematite once the carbon was completely consumed.
A sample with different potassium feldspar content was held at 1200 °C for 20 min; Figure 16b shows the effect of the potassium feldspar content on the phase composition. It mainly contained quartz, augite, anorthite, and hematite phases. The potassium feldspar (KAlSi3O8) decomposed into leucite (KAlSi2O6) and (silica) SiO2 at 1150 °C [31], as per Equation (3):
2KAlSi3O8 (potassium feldspar) → KAlSi2O6 (leucite) + SiO2
Moreover, leucite decomposed into kaliophilite (KAlSiO4) and silica, as per Equation (4):
KAlSi2O6 (leucite) → KAlSiO4 (kaliophilite) + SiO2
The potassium feldspar, leucite, and kaliophilite formed a low eutectic [32,33]. However, the highly active CaO in the tailings disrupted the Si-O network structure. In the molten state, the molten decomposition products of potassium feldspar further reacted with Ca2+ to form anorthite (CaAl2Si2O8) [34], which has a melting point of 1550 °C.
Consequently, the formation of the augite phase increased, and the formation of the liquid phase formation temperature decreased after adding Fe2O3; on the contrary, it was easy to form anorthite with a high melting point leading to the formation of the liquid phase, creating a temperature increase after adding potassium feldspar.
3.3. Foaming Mechanism of Carbon
The TG-DSC curves of the C10-D90 sample in air are shown in Figure 17. The weight loss of C10-D90 was up to 13.4%, owing to the removal of adsorbed water, crystal water, organic components, and other volatile components.
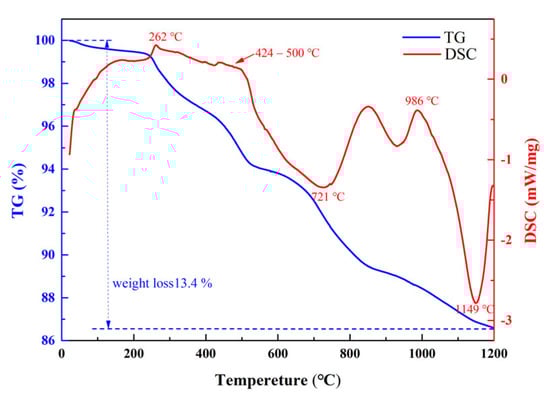
Figure 17.
TG-DSC curve of C10-D90 sample.
An exothermic peak appeared at 262 °C, which corresponded to the volatilization of polyvinyl alcohol. There was a broad exothermic peak at 424–500 °C, with an obvious mass loss effect because muscovite removed some of the crystal water [35]. During the sintering process, volatile carbon (CO) was produced, as per Equation (5):
2C + O2 = 2CO
The CO reacted with the surrounding Fe2O3 to produce CO2 gas, as per Equation (6):
3Fe2O3 + CO = 2Fe3O4 + CO2
As the temperature increased and the reaction continued, the high-valency iron in Fe3O4 was reduced to FeO [36], as per Equation (7):
Fe3O4 + CO = 3FeO + CO2
This corresponded to the endothermic peaks at 721 °C and 930 °C in Figure 17. At the same time, it was sintered in a muffle furnace to 1100 °C, and the carbon content was measured with a carbon and sulfur analyzer at the center of the sample. The test results show that the carbon residue was 0.6620%.
There was a large endothermic peak at 1150 °C, but no obvious mass loss. This indicated the fusibility of potassium feldspar. The potassium feldspar decomposed into leucite and SiO2 [31].
The reaction between carbon and Fe2O3 proceeds all the way to form gaseous components, such as CO and CO2. Once the temperature reached 1150 °C, fusibility began to occur and a liquid phase was generated.
Figure 18 shows the morphology of the sample at different temperatures, which was used to evaluate the fusibility. Combined with the TG-DSC analysis, this shows that the DT of the sample was 1154 °C. When the temperature was greater than 1150 °C, the sample achieved a certain viscosity and it could wrap the gas.
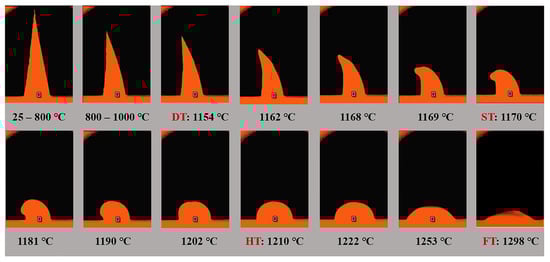
Figure 18.
Discrimination of the ash fusibility of the sample.
As shown in Figure 19, from 1140 °C to 1160 °C, there were gaps between the particles. This was likely due to the fusible temperature of the sample being relatively high, and so the fusibility temperature of the sample was not achieved. Combined with the previous analysis, this indicates that gas was generated, but this is the main reason as to why no pore structure was formed.
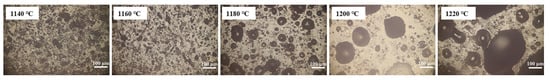
Figure 19.
Microscope images of the samples sintered at different temperatures for 20 min.
When sintering began at 1150 °C, the liquid phase appeared, the viscosity decreased, and the liquid phase wrapped the gas to form pores. Thus, carbon can be used as a foaming agent.
4. Conclusions
In this study, the foamed ceramic made using 100% graphite tailings sintered at 1200 °C for 20 min exhibited a bulk density of 1.36 g/cm3, a water absorption of 0.35%, a compressive strength of 12.03 MPa, and a thermal conductivity of 0.51 W/(m·K). The fabrication of building materials via traditional processes could be simplified by using the self-foaming and self-melting characteristics of graphite tailings.
Carbon can be used as a foaming agent and can react with Fe2O3 to generate CO and CO2. Additionally, it is not suitable to add conventional potassium feldspar as a flux in graphite tailings. The addition of potassium feldspar causes fusibility temperature rises and forms a high melting phase of anorthite. However, the addition of Fe2O3 effectively reduces the fusibility temperature and forms a low melting phase of Augite.
The foamed ceramics prepared using the advantages of graphite tailings have the potential advantage of saving costs due to the fabrication of building insulation materials.
Author Contributions
Conceptualization, S.H. and Y.L.; Investigation, L.Z.; Resources, D.L.; Writing-Review & Editing, H.L.; Project Administration, D.T.; Funding Acquisition, Q.G. All authors have read and agreed to the published version of the manuscript.
Funding
This work was financially supported by the National Key R&D Program of China (No. 2020YFC1909601; No. 2020YFC1909603), Industrial Technology Innovation Project of Inner Mongolia Academy of Science and Technology (No. 2022CYCX05002), Strategic Priority Science and Technology Project of Chinese Academy of Sciences (No. XDA21040600), and Natural Science Foundation of Hebei Province (No. E2020111205).
Data Availability Statement
Data available on request from the authors. The data that support the findings of this study are available from the corresponding author, Y.L., upon reasonable request.
Conflicts of Interest
The authors declare no conflict of interest.
References
- Made Joni, I.; Vanitha, M.; Camellia, P.; Balasubramanian, N. Augmentation of graphite purity from mineral resources and enhancing % graphitization using microwave irradiation: XRD and Raman studies. Diam. Relat. Mater. 2018, 88, 129–136. [Google Scholar]
- Wang, X.X.; Li, H.J.; Yao, H.J.; Chen, Z.H.; Guan, Q. Network feature and influence factors of global nature graphite trade competition. Resour. Policy. 2019, 60, 153–161. [Google Scholar] [CrossRef]
- Cui, N.; Sun, L.; Bagas, L.; Xiao, K.; Xia, J.S. Geological characteristics and analysis of known and undiscovered graphite resources of China. Ore Geol. Rev. 2017, 91, 1119–1129. [Google Scholar] [CrossRef]
- Sharma, R.S.; Al-Busaidi, T. Groundwater pollution due to a tailings dam. Eng. Geol. 2001, 60, 235–244. [Google Scholar] [CrossRef]
- Rico, M.; Benito, G.; Salgueiro, A.R.; Díez-Herrero, A.; Pereira, H.G. Reported tailings dam failures: A review of the European incidents in the worldwide context. J. Hazard. Mater. 2008, 152, 846–852. [Google Scholar] [CrossRef] [PubMed]
- Peng, Y.Z.; Liu, Y.J.; Zhan, B.H.; Xu, G. Preparation of autoclaved aerated concrete by using graphite tailings as an alternative silica source. Constr. Build. Mater. 2021, 267, 121792. [Google Scholar] [CrossRef]
- Bai, C.P.; Gong, W.Q.; Feng, D.X.; Xian, M.; Zhou, Q.; Chen, S.H.; Ge, Z.X.; Zhou, Y.S. Natural graphite tailings as heterogeneous Fenton catalyst for the decolorization of rhodamine B. Chem. Eng. J. 2012, 197, 306–313. [Google Scholar]
- Huo, W.L.; Zhang, X.Y.; Chen, Y.G.; Lu, Y.J.; Liu, J.J.; Yan, S.; Wu, J.M.; Yang, J.L. Novel mullite ceramic foams with high porosity and strength using only fly ash hollow spheres as raw material. J. Eur. Ceram. Soc. 2018, 38, 2035–2042. [Google Scholar] [CrossRef]
- Yu, Z.W.; Xing, L.H. Study on the Vanadium extraction from Graphite Tailings. J. Metal Mine. 2008, 8, 142. [Google Scholar]
- Fang, J.G.; Yao, Z.Y.; Su, G.C.; Mao, H.L.; Liu, W.M. Kish slag using as highway subbase course. J. Shandong Univ. 2003, 33, 562–567. [Google Scholar]
- Wu, J.F.; Tian, K.Z.; Wu, C.H.; Yu, J.Q.; Wang, H.L.; Song, J.; Zhang, Q.K.; Xu, X.H. Effect of talc on microstructure and properties of the graphite tailing stoneware tiles. Constr. Build. Mater. 2021, 311, 125314. [Google Scholar] [CrossRef]
- Kathirvel, P.; Kwon, S.J.; Lee, H.S.; Karthick, S.; Saraswathy, V. Graphite ore tailings as partial replacement of sand in concrete. ACI Mater. J. 2018, 115, 481–492. [Google Scholar] [CrossRef]
- Hai, Y.; Liao, L.B.; Lv, G.C.; Qin, F.X.; Mei, L.F.; Wei, Y.Z. Application of Composite Powders Recycled from Graphite Tailings in Styrene-Butadiene Rubber. JOM 2015, 67, 2733–2738. [Google Scholar] [CrossRef]
- Wu, J.; Jin, H.; Xu, X.; Zhang, Q.; Zhou, S.; Zhu, G. Preparation of Ceramic Rustic from Graphite Tailings. J. Chin. Ceram. Soc. 2019, 47, 1760–1767. (In Chinese) [Google Scholar] [CrossRef]
- Li, X.M.; Zheng, M.Y.; Li, R.; Yuan, G.J.; Zhou, G.Y.; Zhu, X.T.; Ren, G.N. Preparation, microstructure, properties and foaming mechanism of a foamed ceramics with high closed porosity. Ceram. Int. 2019, 45, 11982–11988. [Google Scholar] [CrossRef]
- Yang, Z.; Wang, H.; Wang, Y.Z. Preparation of Close Pore Foamed Ceramics through Complex Foaming Method by Porcelain Tile Residues. Mater. Lett. 2017, 31, 119–123. (In Chinese) [Google Scholar] [CrossRef]
- Dong, Y.R.; Jiang, C.C.; Zhang, L.; Wang, D.; Huang, S.F.; Cheng, X. Waste-bearing foamed ceramic from granite scrap and red mud. Int. J. Appl. Ceram. Technol. 2022, 19, 2686–2700. [Google Scholar] [CrossRef]
- He, S.C.; Jiang, D.Y.; Hong, M.H.; Liu, Z.H. Hazard-free treatment and resource utilisation of electrolytic manganese residue: A review. J. Clean. Prod. 2021, 306, 127224. [Google Scholar] [CrossRef]
- Li, X.; Pan, M.P.; Wu, X.P.; Ma, C.L. Effect of waste B4C addition on high closed-pore porosity foamed ceramics. Ceram. Int. 2022, 48, 10311–10317. [Google Scholar] [CrossRef]
- Liang, B.; Zhang, M.X.; Li, H.; Zhao, M.; Xu, P.F.; Deng, L.B. Preparation of ceramic foams from ceramic tile polishing waste and fly ash without added foaming agent. Ceram. Int. 2021, 47, 23338–23349. [Google Scholar] [CrossRef]
- Ueda, S.; Watanabe, K.; Yanagiya, K.; Inoue, R.; Ariyama, T. Improvement of Reactivity of Carbon Iron Ore Composite with Biomass Char for Blast Furnace. ISIJ Int. 2009, 49, 1505–1512. [Google Scholar] [CrossRef]
- Chen, Z.W.; Wang, H.; Ji, R.; Liu, L.L.; Cheeseman, C.; Wang, X.D. Reuse of mineral wool waste and recycled glass in ceramic foams. Ceram. Int. 2019, 45, 15057–15064. [Google Scholar] [CrossRef]
- Mao, X.; Shimai, S.; Wang, S. Gelcasting of alumina foams consolidated by epoxy resin. J. Eur. Ceram. Soc. 2008, 28, 217–222. [Google Scholar] [CrossRef]
- Zhou, M.K.; Peng, L.F.; Wang, H.D. Influence of Iron Oxide and Foaming Agent on the Performance of Coal Gangue Closed Porosity Ceramics. China Ceram. 2015, 51, 77–80. [Google Scholar] [CrossRef]
- Li, X.M.; Sun, D.Y.; Yang, Q.; Lv, C.C. Foaming mechanism and performance of closed–pore foamed ceramics prepared using calcium carbonate as a foaming agent. Ceram. Int. 2021, 47, 29162–29173. [Google Scholar] [CrossRef]
- Ottonello, G.; Moretti, R.; Marini, L.; Zuccolini, M.V. Oxidation state of iron in silicate glasses and melts: A thermochemical model. Chem. Geol. 2001, 174, 157–179. [Google Scholar] [CrossRef]
- Guo, H.W.; Gong, Y.X.; Gao, S.Y. Preparation of high strength foam glass-ceramics from waste cathode ray tube. Mater. Lett. 2010, 64, 997–999. [Google Scholar] [CrossRef]
- Tang, Z.H.; Zhang, M.X.; Zhang, X.F.; He, J.L.; Jia, X.L.; Deng, L.B. Effect of SiC content on viscosity and thermal properties of foam ceramic prepared from molybdenum tailings. J. Non-Cryst. Solids 2019, 513, 15–23. [Google Scholar] [CrossRef]
- Xi, X.A.; Xu, L.F.; Shui, A.; Wang, Y.M.; Naito, M. Effect of silicon carbide particle size and CaO content on foaming properties during firing and microstructure of porcelain ceramics. Ceram. Int. 2014, 40, 12931–12938. [Google Scholar] [CrossRef]
- Xi, X.A.; Shui, A.; Li, Y.F.; Wang, Y.M.; Abe, H.Y.; Naito, M. Effects of magnesium oxychloride and silicon carbide additives on the foaming property during firing for porcelain ceramics and their microstructure. J. Eur. Ceram. Soc. 2012, 32, 3035–3041. [Google Scholar] [CrossRef]
- Levin, E.M.; Robbins, C.R.; McMurdie, H.F. Phase Diagrams for Ceramists. Nucl. Sci. Eng. 1965, 22, 275–276. [Google Scholar]
- Yin, L.I.; Xia, J.P.; Chen, Z.J.; Liu, H.L.; Yang, J.; Cao, R.F.; Han, Y.W. Feasibility Study on Potassium Feldspar as Flux to Reduce Phosphate Ore. Bull. Chin. Ceram. Soc. 2017, 8, 2737–2742. [Google Scholar]
- Liu, J.; Xia, J.P.; Chen, Z.J.; Luo, Z.Q.; Geng, R.X. Yellow Phosphorus Production in Electric Furnace Using Potassium Feldspar to Replace Silica as Flux. J. Chem. Eng. Chin. Univ. 2017, 31, 1419–1425. [Google Scholar]
- Yuan, B.; Li, C.; Liang, B.; Lü, L.; Yue, H.R.; Sheng, H.Y.; Ye, L.P.; Xie, H.P. Extraction of potassium from K-feldspar via the CaCl2 calcination route. Chin. J. Chem. Eng. 2015, 23, 1557–1564. [Google Scholar] [CrossRef]
- Yu, H.L.; Xu, Y.; Shi, P.J.; Wang, H.M.; Zhang, W.; Xu, B.S. Effect of thermal activation on the tribological behaviours of serpentine ultrafine powders as an additive in liquid paraffin. Tribol. Int. 2011, 44, 1736–1741. [Google Scholar] [CrossRef]
- Tang, X.; Hu, J.; Gao, W.; Zhang, T.; Wang, H. Strengthen recovery characteristics of copper smelting slag with biochar. J. Cent. South Univ. 2018, 49, 1598–1604. [Google Scholar]


Disclaimer/Publisher’s Note: The statements, opinions and data contained in all publications are solely those of the individual author(s) and contributor(s) and not of MDPI and/or the editor(s). MDPI and/or the editor(s) disclaim responsibility for any injury to people or property resulting from any ideas, methods, instructions or products referred to in the content. |
© 2023 by the authors. Licensee MDPI, Basel, Switzerland. This article is an open access article distributed under the terms and conditions of the Creative Commons Attribution (CC BY) license (https://creativecommons.org/licenses/by/4.0/).