Abstract
Surface movement under the combined mining of open-pit and underground caving is the main problem affecting safe and efficient mining. Taking the combined mining of Dahongshan Iron Mine as an example, a mechanical model for calculating surface movement range was established to reveal the movement mechanism. The topography, the caving zone, the gravel filling of the caving zone and mining depth were considered, and the surface principal stress was calculated. Based on the mechanical model, the mechanical relationship between the subsidence angle and the surface cracking range was established and the definition of subsidence angle was supplemented: the subsidence angle is the angle measured from the horizontal of the moving boundary line, a straight line with zero displacement from the edge of the deepest extraction level to the surface and the largest surface cracking range. A trial calculation method for calculating the subsidence angle was proposed: by presetting different subsidence angles, the subsidence angle corresponding to the maximum surface prone cracking range calculated by mechanical model was found as the real subsidence angle. The subsidence angle calculated by the mechanical model was 60°, consistent with the observed subsidence angle of 64° in the Dahongshan Iron Mine, which verifies the reliability of the model.
1. Introduction
The combined mining method of open-pit and underground caving can be divided in two ways. One is the transformation from open-pit to underground caving mining, and the other is open-pit and underground caving combined mining [1,2,3,4,5]. The transformation from open-pit to underground mining is mainly a combined mining method in chronological order, and is the only way to extend the service life of mines and improve the recovery rate. In the early stage, open-pit mining is adopted, and in the later stage, underground mining is mainly used. At present, research on the transformation from open-pit to underground caving mining is relatively mature, including the maintenance of the open-pit slope, the management and control of ground pressure in the underground stope, the structural parameters of stope, the development and mining method in the transition period, and the thickness of overburden and roof pillar [6,7,8,9,10,11,12]. However, some mines are affected by the occurrence of ore bodies, and there can be many ore veins or ore belts in the deep and shallow at the same time, and they can be at a certain distance in the horizontal direction. In order to maximize the efficient mining of mineral resources and avoid a large amount of waste of resources caused by the destruction of the mineability of adjacent ore bodies due to the separate mining of an ore body, shallow ore bodies have been mined by the open-pit method and the deep ore bodies have been mined by the underground caving method through optimized design. Therefore, efficient open-pit and underground caving combined mining modes, mainly reflected in spatial coordination, have been formed, such as the combined mining of the upper and lower ore belts in the southeast of Gongchangling Iron Mine in China, and the combined mining of Dahongshan Iron Mine in Yuxi in China [5,13,14]. It is clearly stipulated in the “Safety regulation for metal and nonmetal mines” that, within the range of surface movement caused by underground caving mining, open-pit mining shall not be carried out at the same time unless effective technical measures are taken [15]. Therefore, the study of surface movement under the combined mining of open-pit and underground caving in metal mines has important practical significance for safe and efficient mining.
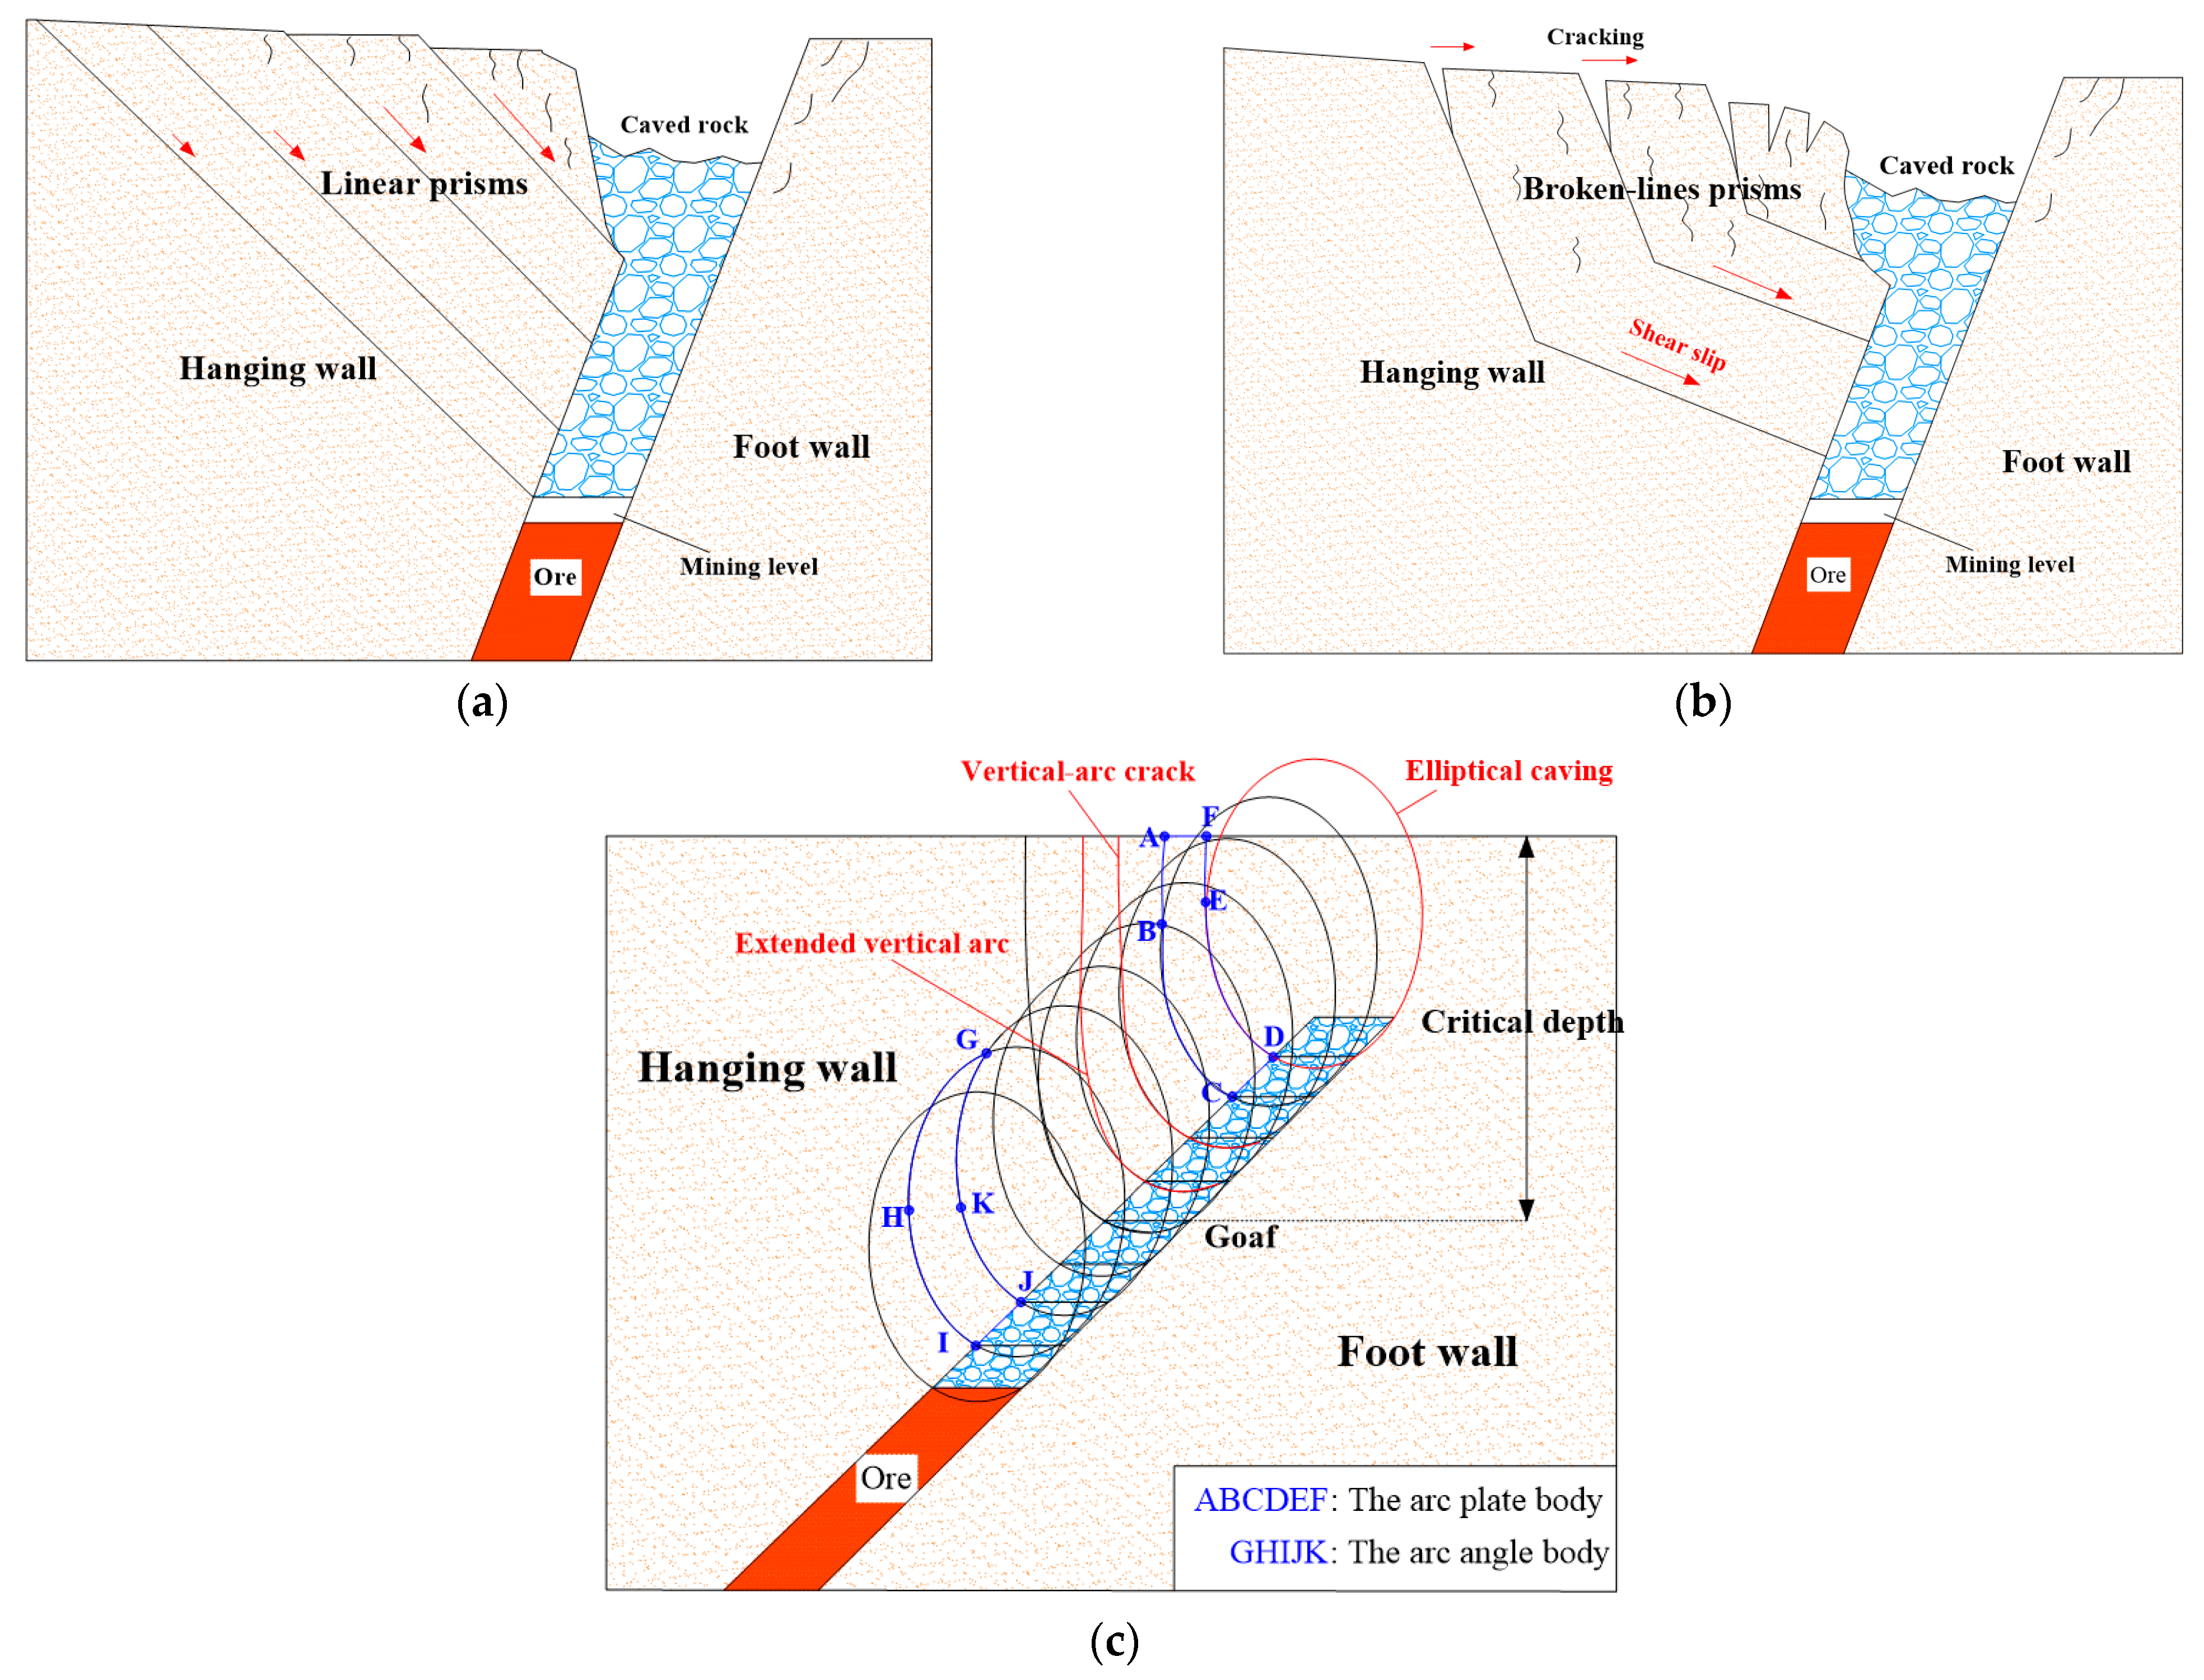
Research on the mechanisms of rock strata movement caused by coal mining is relatively mature, and many theoretical models with practical application value have been proposed, including the theory of voussoiring beams, the theory of transferring rock beams, the theory of key stratum and the theory of plate model [16,17,18,19,20]. However, these theoretical models are not suitable for describing the rock movement mechanisms in metal mines because of the great difference between the geological conditions and mining methods. In order to better understand the mechanisms and more accurately estimate the range of surface subsidence, researchers have also proposed some classic models and methods for the rock movement in metal mines. The arch theory has been widely recognized in the study of describing the caving mechanism of metal ore caving mining. It is believed that after the ore body is mined, the overlying rock mass continues to cave upward in an arched shape. Under the condition of large mining depth, the caving arch is in a natural balance state before the caving reaches the surface. After caving to the surface, due to the different mining and geological conditions, the surface has different degrees of deformation, fracture or no obvious deformation [21]. In addition to arch caving, rock caving in some mines also shows other forms, including cylindrical shapes and plunger shapes [22]. There are two types of “prism models” for the collapse of rock mass: straight line (Figure 1a) and broken line (Figure 1b) [23]. According to on-site mine observations, the broken-lines prism model is more appropriate for describing the fracture and shear slip processes of the rock mass. Based on the stress analysis of surrounding rock, the “arc plate model” considers that the boundary between the stress-reduced area and stress-increased area around the goaf is elliptical (Figure 1c). The stress-reduced area corresponds to the caving zone, and the stress-increased area corresponds to the fracture zone and the bending deformation zone. The model preliminarily considers the stress distribution and rock mass strength, and has been verified from centrifugal simulation tests, which is consistent with many mine cases [23]. Hoek regarded the hanging wall as a slope, and proposed a limit equilibrium method to predict the surface subsidence range, which has been widely applied [24,25]. However, most of these models are descriptive and fail to effectively reveal the essential mechanism of surface subsidence, and there are still significant discrepancies in predicting surface subsidence. In addition, these models fail to effectively consider the impact of open-pit mining on surface subsidence under combined mining.
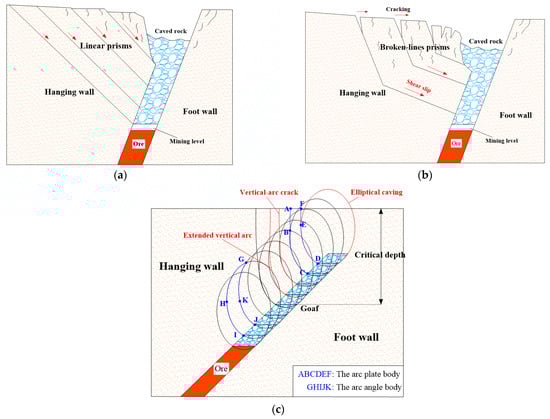
Figure 1.
Several theoretical models of rock mass collapse. (a) Linear prism model; (b) broken-lines prism model; (c) arc plate model.
With the development of numerical simulation technology, scholars have also adopted different numerical methods to study the strata movement and surface subsidence caused by underground mining [26]. Li et al. [27] reproduced the entire process of strata movement and surface deformation caused by underground caving mining using the RFPA numerical method. Zhang et al. [28] further analyzed the fracture development characteristics during rock mass movement using RFPA. Parmar et al. [29] explored the impact of ground surface subsidence due to underground mining on surface infrastructure. Takhanov et al. [30] analyzed the possible zones of the mass deformation under combined mining based on the Phase2 software. Imashev et al. [31] studied the stress–strain state of the mass under an open pit with a change in the open-pit bottom width using a numerical simulation method. Ghazdali et al. [32] used RS2 software to analyze the stability of the underground mining method used in shallow-dip vein deposits hosted in poor quality rock. It is generally believed that numerical simulation methods are low-cost and time-saving. However, in order to obtain reliable calculation results, numerical calculations must be combined with on-site monitoring data to repeatedly verify and correct parameters. Thus, it inevitably takes a long time to ensure prediction accuracy.
Many research works and engineering practices have shown that topography is an major factor affecting surface movement range caused by underground caving mining in metal mines. The range of surface movement is often different under different topography features [23,33,34]. For open-pit and underground caving combined mining, under static conditions, continuous open-pit mining essentially affects the range of surface movement by changing the original topography features. Thus, in order to reveal the surface movement mechanism under the open-pit and underground caving combined mining, it is necessary to establish a mechanical model that can consider the topography. In this study, taking Dahongshan Iron Mine as the background, a mechanical model was established to calculate the surface subsidence range under combined mining. The change of topography caused by open-pit mining, the shape of the caving zone, the gravel filling of caving zone and mining depth were considered in the model. The definition of the subsidence angle was supplemented, and the calculating method was proposed by the mechanical model. The reliability of the mechanical model was verified by the field measured data, which can provide a new theoretical method for calculating surface movement range for metal mines used for open-pit and underground caving combined mining.
2. Engineering Background
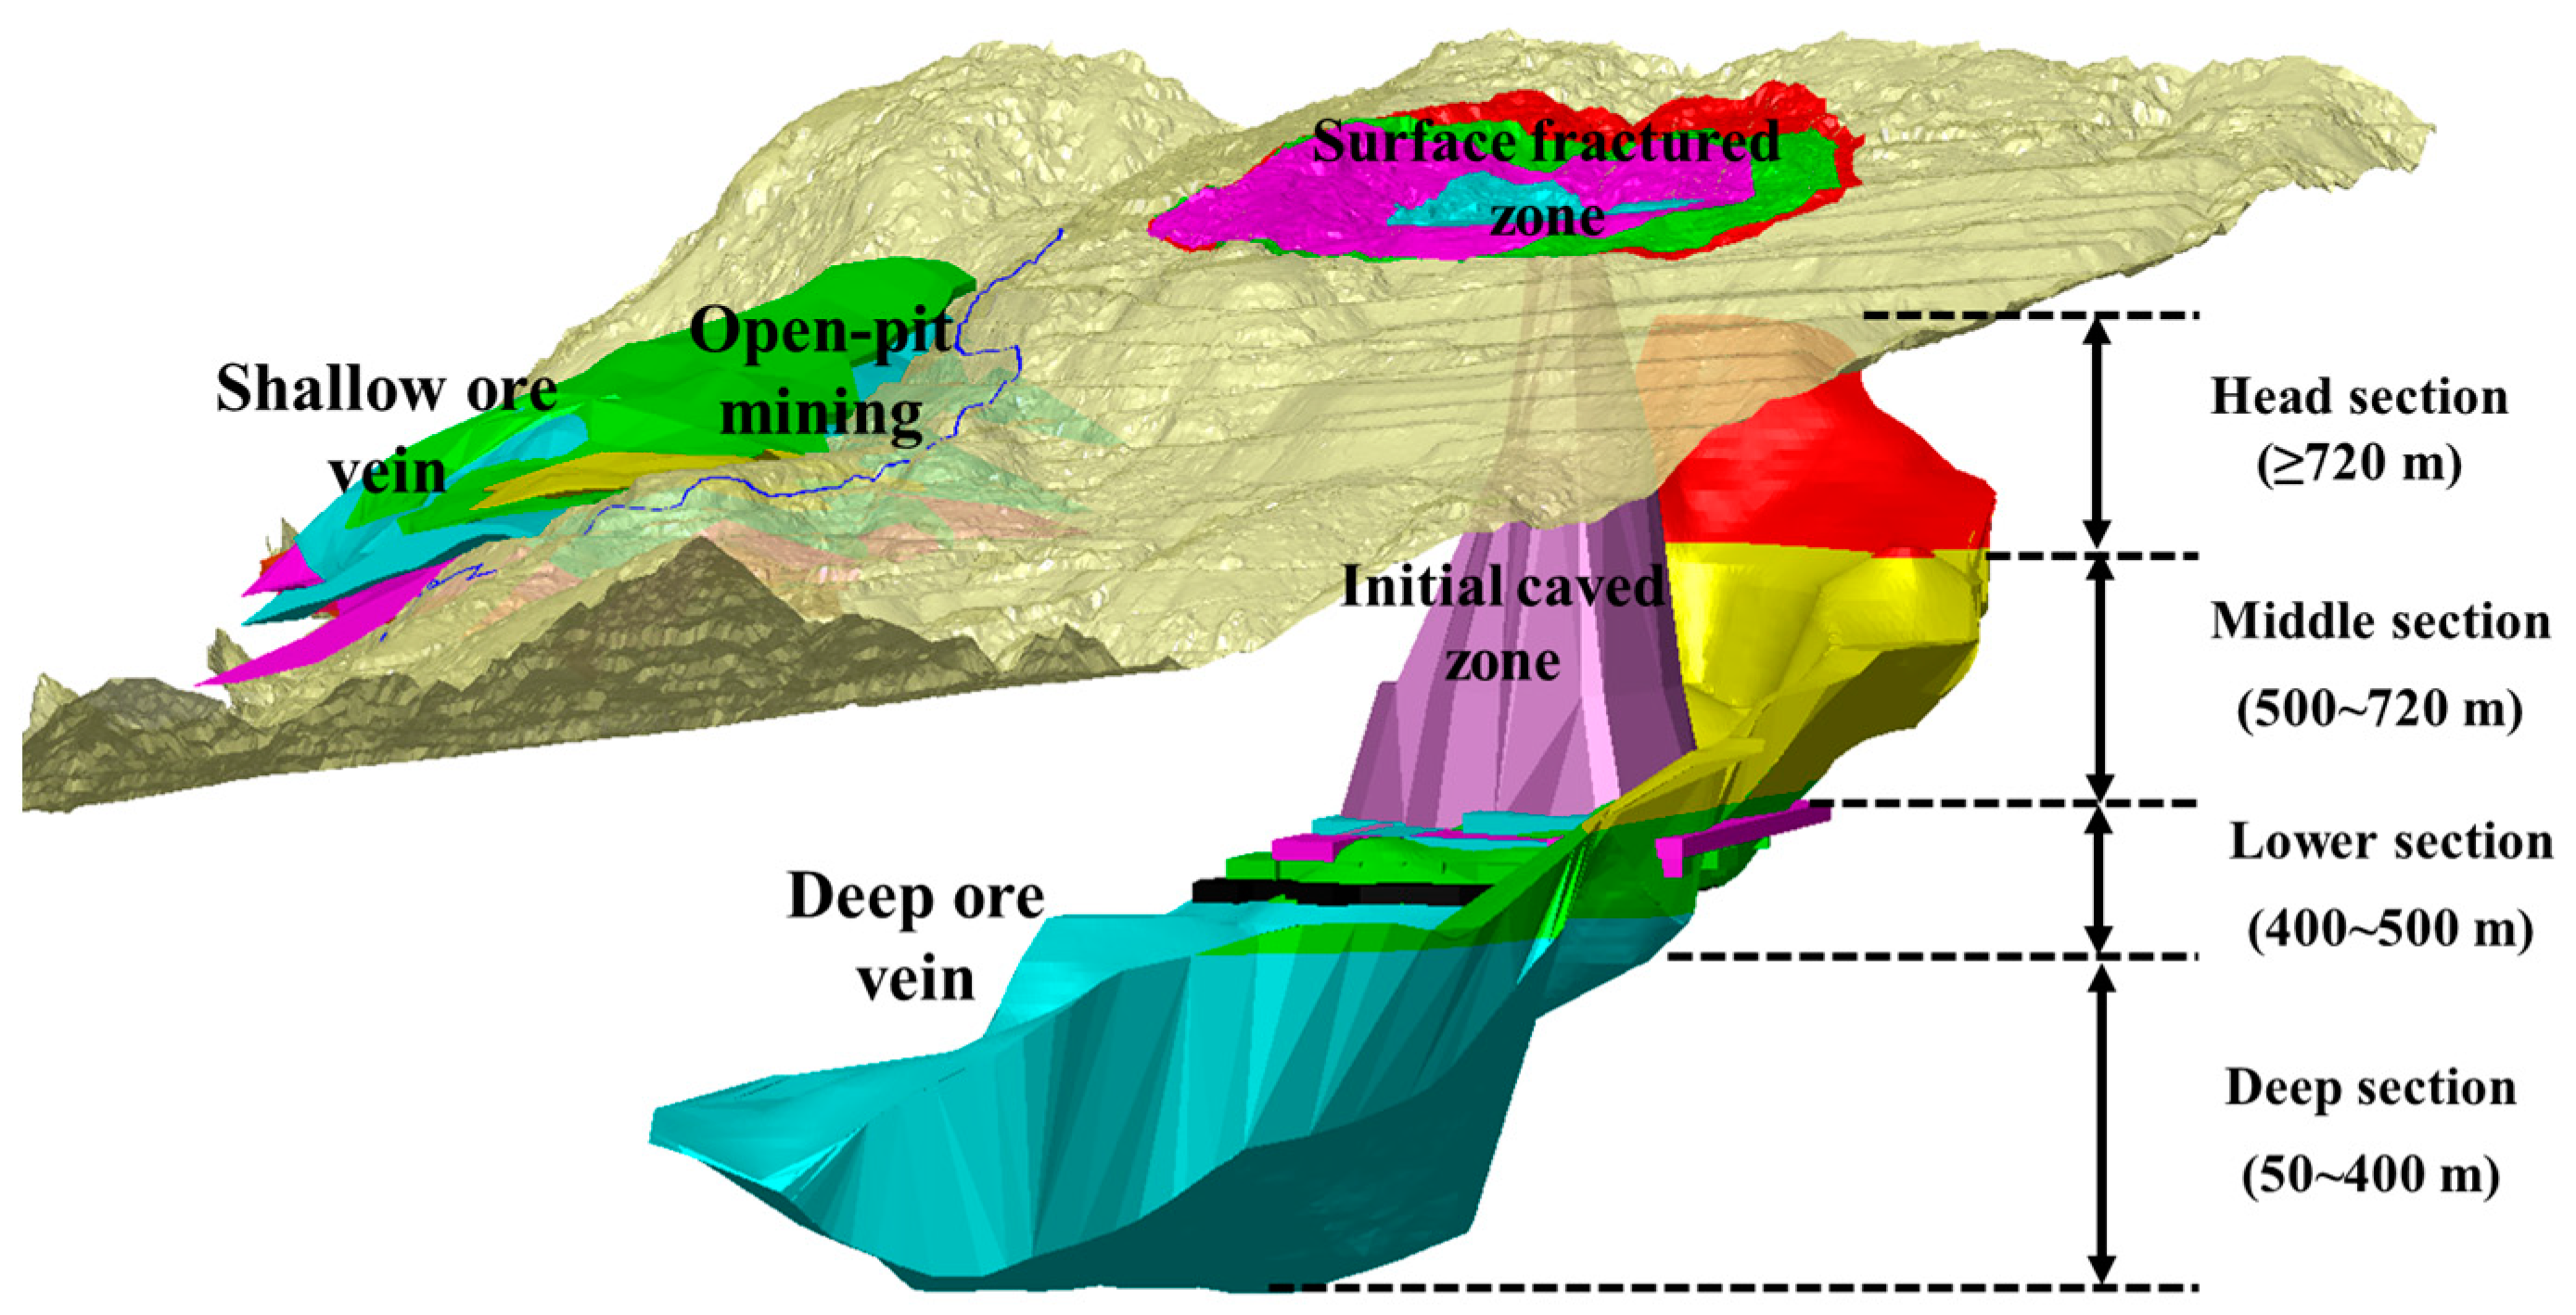
Dahongshan Iron Mine is located in Yuxi City, Yunnan Province, China. There are two ore veins in the mining area, shallow and deep, which are mined simultaneously by open-pit mining and underground block caving, separately. The strike of the underground ore body is almost east–west. The shape of the underground ore body is high in the east and low in the west, thick in the middle, thin at the edges, and upturned in the north and south, generally resembling a ship shape. The deep ore vein is 1969 m from east to west, 440~640 m wide from north to south and 362.48~988.31 m deep, and the occurrence elevation is 25.72~945.00 m. The occurrence elevation of the shallow ore vein is 680~1012 m, the strike is northwest, the dip is southwest, and the average thickness is 11~18 m. The shallow vein is open-pit mined by the process of “steep slope stripping and slow slope mining”. The upper dimension of the stope is 1130 m long and 724 m wide, and the bottom dimension is 523 m long and 172 m wide. The production capacity of open-pit mining after optimized design is 5.5 million t/a. The production capacity of the underground mining is 4 million t/a, and it is divided into four sections according to the elevation, namely the head section, the middle section, the lower section and the deep section. Except for the head section, which is mined by the open-stope method, the other sections are mined by block caving, as shown in Figure 2.

Figure 2.
The open-pit and underground caving combined mining in Dahongshan Iron Mine.
The main problem restricting safe and efficient mining in Dahongshan Iron Mine is the mutual influence between open-pit and underground caving mining. The minimum plane distance between the open-pit final boundary and the underground main mining area is only about 250 m. With the continuous increase of the caving scope and the depth of the underground ore body, the range of surface subsidence will continue to expand, which will have an important impact on the stability of the open-pit slope. In addition, since the grade of the deep ore body is twice that of the shallow ore body, it is difficult to slow down the underground mining plan to ensure the productivity and economic benefits. However, there are still about 30 million tons of ore bodies in a shallow ore vein. The shutdown of the open pit would cause a huge waste of resources. Therefore, determining the range of surface movement is the key to evaluate whether open-pit and underground caving combined mining can be used.
3. Characteristics and Angle of Rock Movement
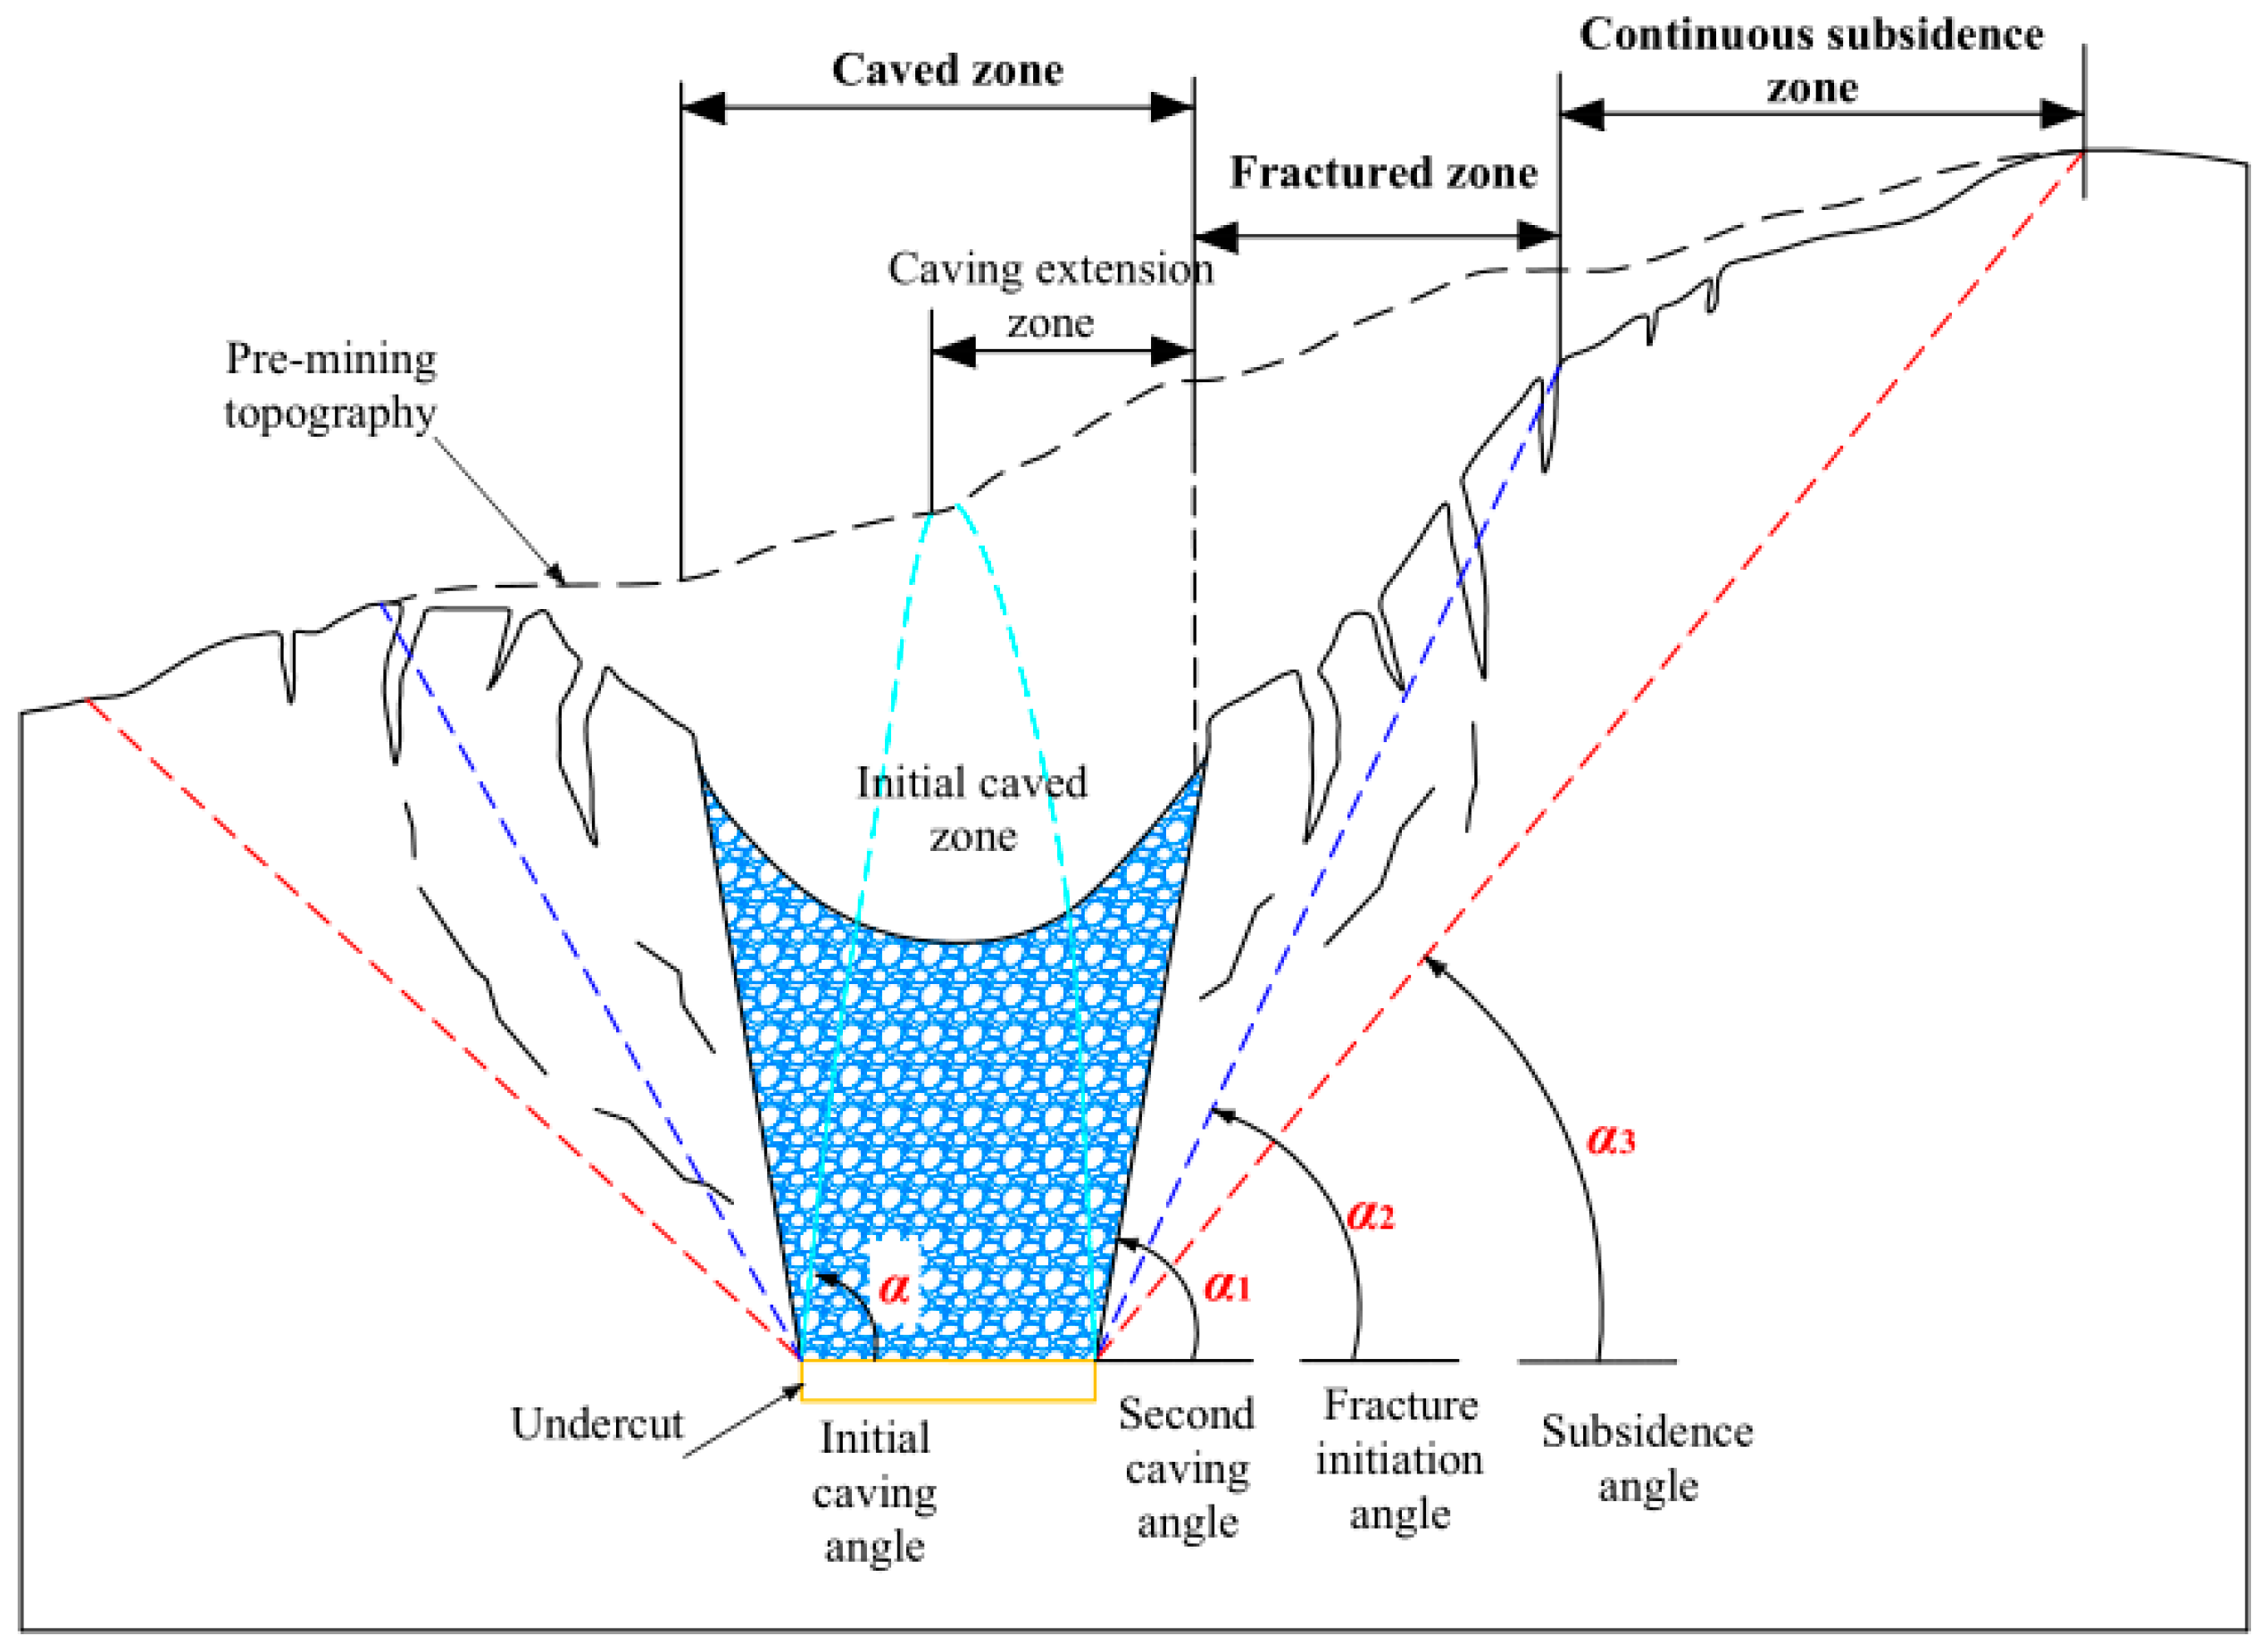
The rock strata movement process caused by metal mine caving mining can be summarized as follows: with underground caving mining, when the span and volume of the goaf reach the limit, the overlying rock mass will collapse. Under continuous mining, the caving of the rock mass will develop to the surface, causing surface collapse and deformation. Cheng et al. [35] divided the surface deformation process into two temporal stages, the chimney caving development stage and the post-chimney deformation stage, based on the type of driving force. Van As [36] subdivided the mining-induced surface influence area into a caved zone, fractured zone and continuous subsidence zone. Combining these two methods, the division of surface movement caused by underground caving mining is shown in Figure 3. The surface influence area is also generally divided into caved zone, fractured zone and continuous subsidence zone. However, the caved zone is subdivided into the initial caved zone and the caving extension zone. When the rock caving reaches the surface, the initial caved zone will be formed. After caving to the surface, due to the loss of support, the surrounding rock mass will fully collapse to form the caving extension zone. In the surface within a certain range from the edge of the caving extension zone, only different lengths of tension cracks occur, forming the fractured zone. No cracking occurs for the surface within a certain range outside the fractured zone, but it presents continuous subsidence, which is the continuous subsidence zone.
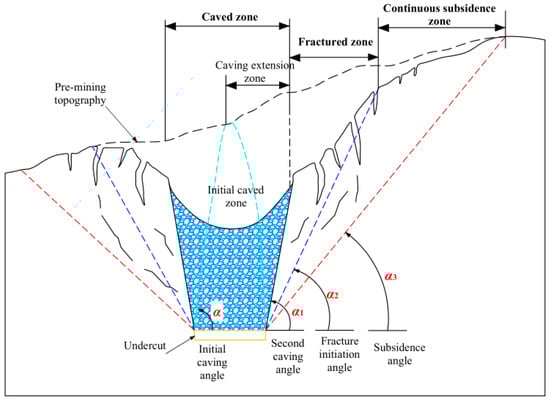
Figure 3.
Definition of the surface influence area caused by caving mining.
According to Figure 3, the initial caving angle is the angle measured from the horizontal of the line extending from the edge of the deepest extraction level to the position where the initial caved zone developed to the surface, which is set as α. The second caving angle is the angle measured from the horizontal of the line extending from the edge of the deepest extraction level to the edge of the caving extension zone, which is set as α1. The fracture initiation angle is the angle measured from the horizontal of the line extending from the edge of the deepest extraction level to the edge of the fractured zone, which is set as α2. The subsidence angle is the angle measured from the horizontal of the line extending from the edge of the deepest extraction level to the edge of the continuous subsidence zone, which is set as α3, as shown in Figure 3.
4. Establishment of the Mechanical Model
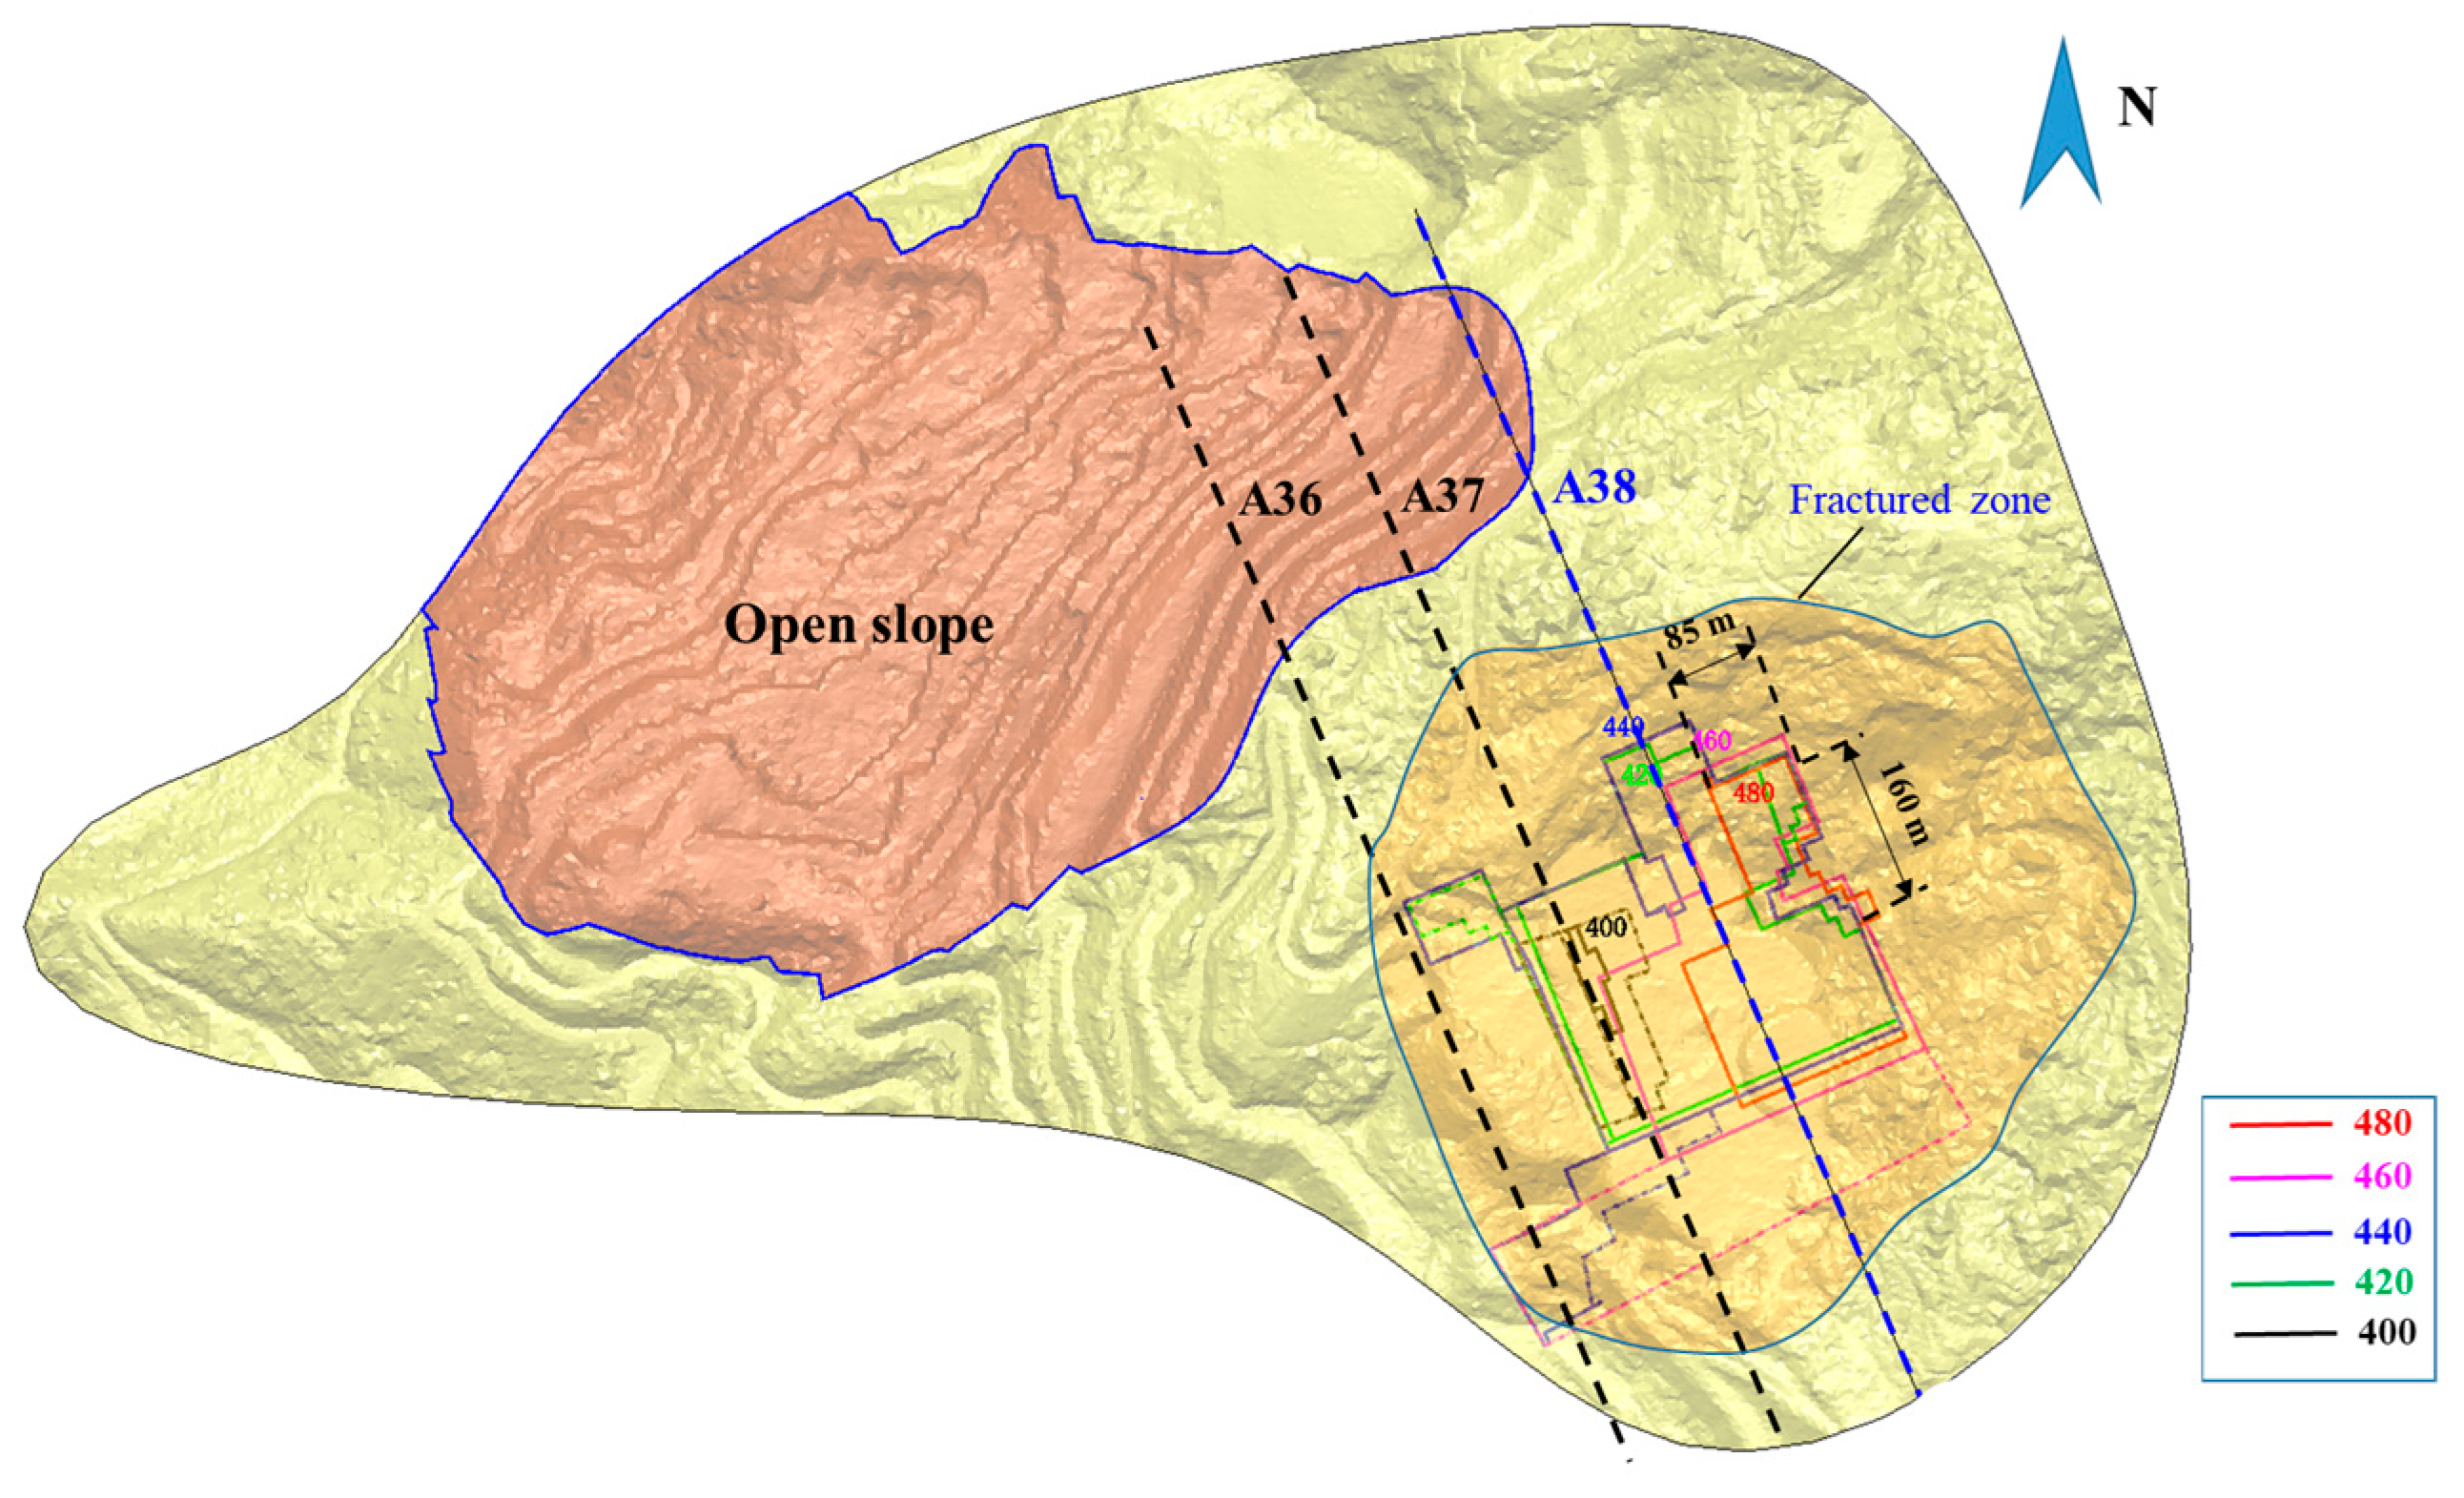
Caving mining of the lower section (elevation 400~500 m) in the deep ore vein has the greatest impact on the surface subsidence in Dahongshan Iron Mine. The lower section is divided into several subsections with a mining height of 20 m, named 480, 460, 440, 420 and 400 subsections according to the elevation of the floor of each subsection, and caving mining is carried out from top to bottom successively. The initial mining subsection was the 480 subsection. By the end of 2013, the 420 subsection had been mined, and then the 400 subsection was mainly mined, as shown in Figure 4. In reference [14], the shape of the initial caved zone is determined based on the field monitoring data; it is roughly “arched”, as shown in Figure 2.
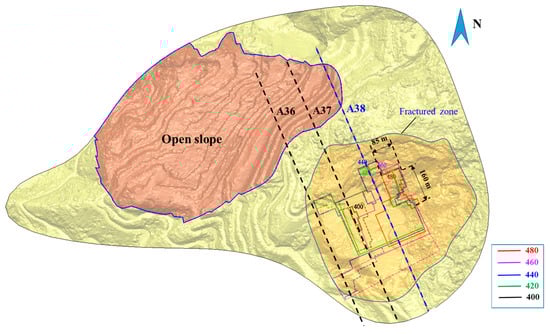
Figure 4.
Plan of the open-pit and underground caving combined mining in Dahongshan Iron Mine.
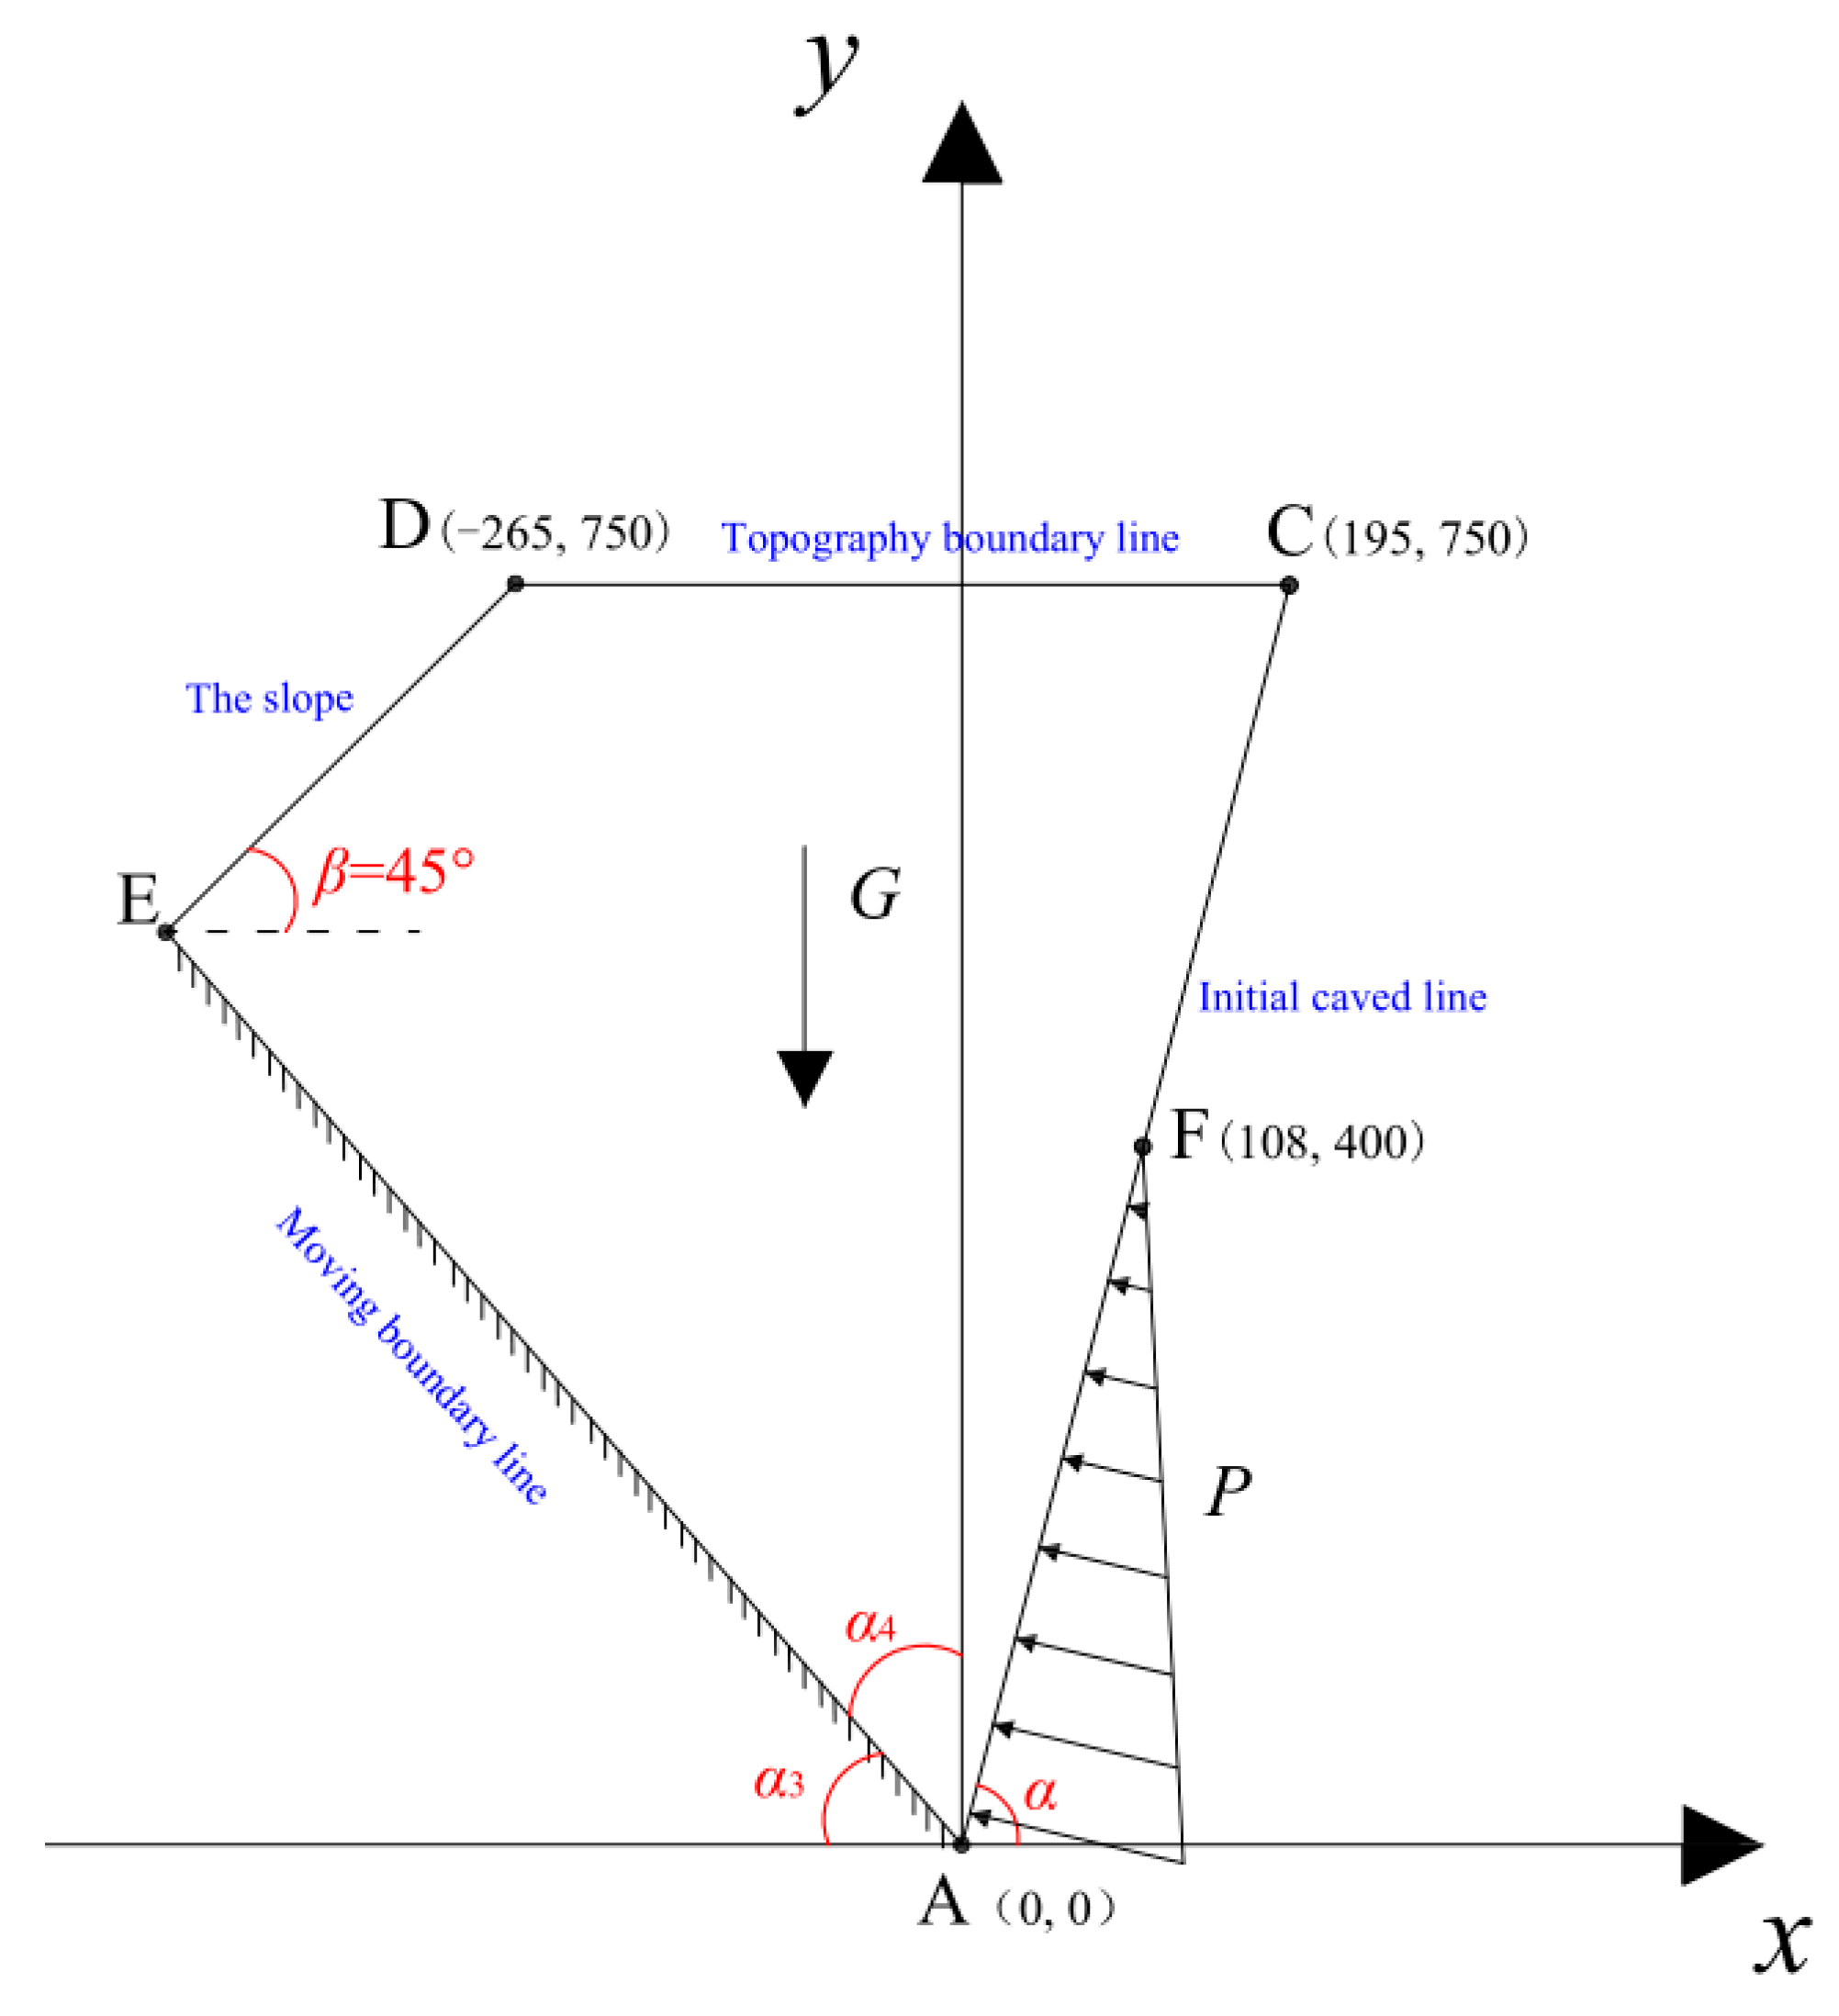
The open-pit in Dahongshan Iron Mine is a hillside open pit. Among the geological profiles of Dahongshan Iron Mine, the A38 profile passes through both the open-pit and the center of the underground caving mining at the same time, and can be used as the main profile to determine the surface movement. Therefore, the A38 exploration profile was selected to establish a two-dimensional mechanical model, as shown in Figure 5. The average slope angle on the A38 section is β = 45°, the elevation of the bottom of the slope is about 800 m, and the top of the slope is a near-horizontal topography with an elevation of 1170 m. The initial caving point C on the surface is basically located in the middle of the surface projection of the 420 subsection. For the convenience of calculation on the A38 profile, it is assumed that the shape of the initial caved zone is approximately an isosceles triangle. The horizontal distance from point C to point D is 460 m, and the maximum elevation of the initial mining subsection (480 subsection) is 500 m. The model adopts the rectangular coordinate system, and takes the boundary point A of the 420 subsection as the origin. The span of the 420 subsection is 390 m (2l = 390 m), and the depth is 750 m (H2 = 750 m). Thus, the initial caving angle (α) is 75°.
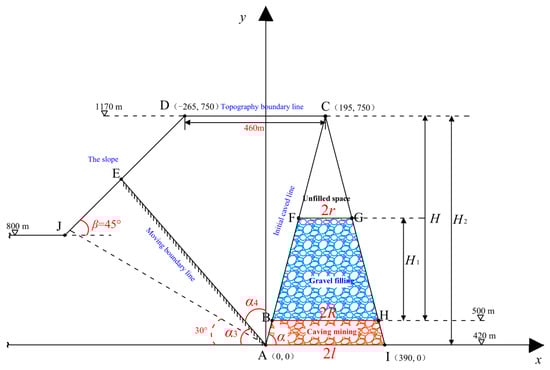
Figure 5.
Two-dimensional geometric model of the open-pit and underground caving combined mining based on A38 in the Dahongshan Iron Mine.
With the mining of the ore body at the elevation of 420~500 m, the overburden continued to fall, and the caving gravel continued to fill the initial caved zone. After the goaf was filled with the caving gravel, the initial caved zone was not fully filled, and the unfilled space (CFG) is shown in Figure 5. In the model, the coordinate of point F at the maximum elevation of gravel filling in the initial caved zone can be estimated from the initial caved zone volume and the mined ore volume based on triangle similarity. Assuming that the initial caved zone is a cone formed by the rotation of the isosceles triangle ACI around the central axis, the total volume of the filled gravel can be set as V1 in consideration of the crushing expansion of the rock mass. The mined volume of the ore body was set as V2. The volume of the cone formed by rotating the isosceles triangle BCH around the central axis in Figure 5 was set as V3. Assuming BH = 2R and FG = 2r, the following similarity relationship can be obtained.
It is assumed that the goaf is completely filled by caving gravel. Since Formula (1) does not involve the size of the goaf, it is applicable to any irregular goaf formed by caving mining. According to the field data, V2 = 5,790,000 m3. Thus, R, V1 and V3 can be calculated with the following formula.
where Ks is the crushing expansion coefficient (Ks = 1.15). Thus, the coordinate of point F is calculated to be (108, 400); that is, the filling height of the initial caved zone is 400 m.
In Figure 5, the rock mass outside the moving boundary line (AE) will not move, so the AE line can be set as a fixed boundary. Therefore, considering the gravity G, the normal support force P, the topography (CDE), the moving boundary line (AE), and the initial caved line (AC), a mechanical model was established with the quadrangle (ACDE) as the research object, as shown in Figure 6. In the mechanical model, the moving boundary line was preset and the moving angle α3 was unknown. The equations of straight lines AC, CD and DE, the coordinates of point E and the normal support force P can be expressed as [37]:
where γ1 is the average bulk density of the filling gravel, and θ is the maximum slope angle of the gravel bulk structure. From field experience, θ ≈ 55°.

Figure 6.
Two-dimensional mechanical model of the open-pit and underground caving combined mining.
5. The Solution of the Mechanical Model
5.1. Coordinate Transformation
The mechanical model (Figure 6) can be regarded as a cantilevered beam model with variable cross-sections placed at an angle (α3). To facilitate the solution, the rectangular coordinate system was rotated counterclockwise around point A by an angle (α4), and α4 = π/2 − α3, as shown in Figure 7. The coordinates of each point after transformation were obtained by the following formula:
where x1 is the abscissa of any point after transformation, y1 is the ordinate of any point after transformation, x is the original abscissa of any point, and y is the original ordinate of any point.
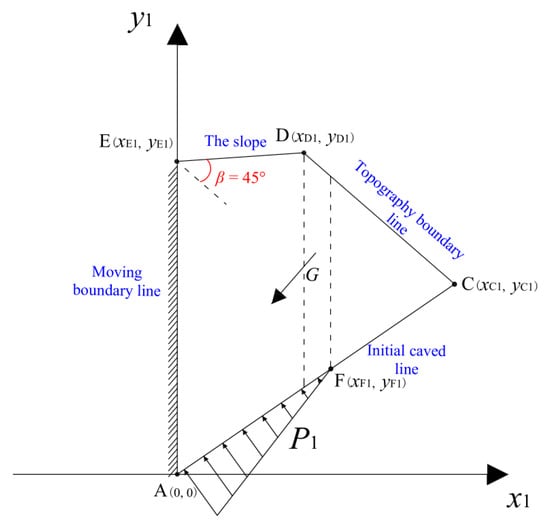
Figure 7.
The mechanical model after coordinate transformation.
The equations of straight lines and the normal support force P1 after coordinate transformation are expressed as:
5.2. Piecewise Solution
The mechanical model (Figure 7) can be regarded as a cantilevered beam model with variable cross-sections. According to the mechanics of materials, the stress distribution on any section parallel to AE can be solved in three parts. The first part is the FC-segment, which cannot act towards the normal support force P1; that is, xF1 ≤ x1 ≤ xC1. The second part is the DF-segment that acted by P1; that is, xD1 ≤ x1 < xF1. The third part is the ED-segment that acted by P1; that is, 0 ≤ x1 < xD1.
5.2.1. Solving the First Part (xF1 ≤ x1 ≤ xC1)
When xF1 ≤ x1 ≤ xC1, the shear force Fs generated by gravity G on any section parallel to AE can be calculated by the following formula:
where γ2 is the average bulk density of the rock mass.
The mechanical model is a two-dimensional mechanical model with unit thickness, and any section is a rectangle with thickness b = 1. Thus, the shear stress τx1y1 can be calculated.
where h2 is the height of the rectangular section.
The axial force Fn generated by gravity G on any section parallel to AE can be calculated.
The bending moment M generated by gravity G on any section parallel to AE can be calculated.
where xG is the abscissa of the gravity center of the right rock mass cut by calculated section. For the triangular, it can be calculated as:
Thus, the normal stress σx1 on the section is as follows:
According to the “Code for the design of concrete structures” [38], the continuous variable cross-section beam can use material mechanics to calculate the principal tensile stress.
where σy1 is the longitudinal normal stress. According to the assumption of no extrusion of longitudinal fibers in material mechanics, σy1 = 0.
In order to evaluate the surface cracking, it is necessary to calculate the principal stress σ1CD on the surface (CD). It is specified that tension is positive and pressure is negative. Thus, σ1CD can be calculated.
Surface cracking is usually manifested as tensile failure. Therefore, the place where σ1CD is tensile stress and exceeds the tensile strength of rock mass σt, namely |σ1CD| > |σt|, will crack.
5.2.2. Solving the Second Part (xD1 ≤ x1 < xF1)
When xD1 ≤ x1 < xF1, the shear force Fs2 generated by the normal support force P1 on any section parallel to AE can be calculated.
The axial force Fn2 generated by P1 on any section parallel to AE can be calculated.
From the resultant moment theorem of linear load, the bending moment M2 generated by P1 on any section parallel to AE can be obtained.
Similarly, when xD1 ≤ x1 < xF1, the principal stress σ1CD2 on the surface (CD) can be calculated.
5.2.3. Solving the Third Part (0 ≤ x1 < xD1)
When 0 ≤ x1 < xD1, the shear force Fs generated by gravity G on any section parallel to AE can be calculated.
The axial force Fn generated by gravity G on any section parallel to AE can be calculated.
The bending moment M generated by gravity G on any section parallel to AE can be calculated.
where xG can be calculated by the following formula under the quadrilateral condition.
When 0 ≤ x1 < xD1, the shear force, axial force and bending moment generated by P1 on any section parallel to AE can be calculated by Formulas (14)–(16), respectively. Additionally, the principal stress σ1DE on the surface (DE) can be calculated by Formula (17).
In the above calculation of surface tensile stress, the gravity, the topography, initial caved zone and the filling lateral support force were considered. In addition, the influence of mining depth and span could also be considered by geometric boundary Equation (3) in the model. Although the calculation of the variable section deep cantilever beam using material mechanics will produce an error, it ensures the calculability of the model and facilitates engineering application. According to mechanical research [39], the maximum error range of the stress solution of cantilever deep beam calculated by material mechanics is about 7%~14%. For mining engineering, such an error is acceptable.
6. The Solution of the Subsidence Angle
6.1. Supplementary Definition and Calculation Method of the Subsidence Angle
In the traditional definition, the subsidence angle and the fracture initiation angle are only determined according to the characteristics of surface movement, and they are independent of each other. Previous studies have shown that in the development time of surface movement, the surface cracking will go through the continuous deformation stage [35]. In terms of development space, the fractured zone is adjacent to the continuous subsidence zone (Figure 3). This indicates that the subsidence angle is related to the surface cracking range. In the mechanical model, the subsidence angle (α3) is unknown. Thus, the surface principal stress and cracking range obtained by taking different subsidence angles are different. In fact, the moving boundary line determined by the subsidence angle is not only a fixed boundary with a displacement of 0, but also a supporting boundary for rock movement under the action of gravity.
Two exceptional cases can be analyzed by the mechanical model (α3 = 0° and α3 = 90°), as shown in Figure 8. When α3 = 0°, the gravity action line is perpendicular to the moving boundary line, so the principal stress on the surface is all compressive stress, without cracking. When α3 = 90°, the gravity action line is parallel to the moving boundary line, so tensile stress will only occur in the surface corresponding to the underground caving mining range, resulting in cracking. These two kinds of surface cracking are not consistent with the actual situation of most sites, and the surface cracking range often exceeds the underground mining scope [33]. Therefore, between 0° and 90°, there must be a critical subsidence angle which makes the surface cracking range the largest. The critical subsidence angle should be the true subsidence angle for the actual situation on site. Therefore, based on the mechanical model, the supplementary definition of the subsidence angle is that the subsidence angle is the angle measured from the horizontal of the moving boundary line, a straight line with zero displacement from the edge of the deepest extraction level to the surface and the largest surface cracking range. In this definition, the surface cracking range is the horizontal span of the fractured zone.
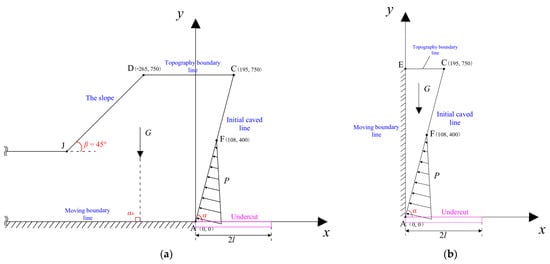
Figure 8.
Mechanical models under two exceptional cases. (a) The mechanical model with α3 = 0°; (b) the mechanical model with α3 = 90°.
Based on the supplementary definition of the subsidence angle, the actual subsidence angle can be calculated by the mechanical model. Because the calculation formula for directly deriving the subsidence angle has a large amount of calculation and many high-order terms will appear, the trial calculation method can be used. First, by presetting different subsidence angles such as α3 = 30°, α3 = 45°, α3 = 60° and α3 = 75°, different mechanical models are established. Then, the surface tensile stress zone of each model is calculated, and the surface prone cracking range is determined by the tensile strength of rock mass. Finally, by comparing the surface prone cracking range of each model, the preset subsidence angle corresponding to the maximum surface prone cracking range is found as the real subsidence angle.
6.2. Calculation Result of the Subsidence Angle
Under the open-pit and underground caving combined mining, the impact of surface movement on the stability of the slope is the main problem, so point J is the boundary point of the mechanical model in Figure 5. Therefore, when the trial calculation method is used, the preset minimum subsidence angle α3 is 30° (Figure 5). To ensure the calculation accuracy, the preset subsidence angle of each model is increased by 10° (α3 = 30°, 40°, 50°, 60°, 70°, 80°). The parameters required for the calculation are indicated in Table 1.

Table 1.
The parameters of the mechanical model under open-pit and underground caving combined mining in the Dahongshan Iron Mine.
The trial calculation results of the surface principal stress distribution of mechanical models with different preset subsidence angles are shown in Figure 9. The surface principal stress increases from point C to point D. The principal stress will jump at point D, the compressive stress will increase significantly (Figure 9a,b), and the tensile stress will suddenly decrease (Figure 9c,d). From point D to point E, the compressive stress decreases rapidly and the tensile stress increases rapidly. When α3 = 30°, the tensile stress zone is distributed on the slope. When α3 = 40°, the surface principal stress changes into tensile stress, and the tensile stress area on the slope becomes larger, while the compressive stress area decreases. When α3 ≥ 50°, the surface and slope are all in tension. The average tensile strength of the rock mass is σt = 0.6 MPa, from the Hoek–Brown criterion [40]. The critical point with the tensile stress of 0.6 MPa was set as the cracking point K. With the increase of α3, the boundary point E continued to move to C, and the cracking point K also moved to C. The movement speed of point E was higher than that of point C, so the horizontal distance between two points changed from 654 m (α3 = 30°) to 55 m (α3 = 80°). The surface prone cracking range L2 under different α3 is calculated in Figure 9. When α3 = 50°, the maximum surface prone cracking range is 497 m. When α3 = 60°, the surface prone cracking range is 487 m, which is close to the maximum value—only 10 m smaller. According to the supplementary definition of the subsidence angle, the true subsidence angle is about 50°. However, compared with the subsidence angle of 50°, the moving boundary line of α3 = 60° can produce effective support for the rock movement and prevent the subsidence of the rock mass outside the boundary line. Thus, the true subsidence angle should be taken to be 60°.

Figure 9.
The calculation results of mechanical models. (a) α3 = 30°; (b) α3 = 40°; (c) α3 = 50°; (d) α3 = 60°; (e) α3 = 70°; (f) α3 = 80°.
7. Analysis of On-Site Monitoring Data
In document [14], the initial caved zone in Dahongshan Iron Mine was determined according to the monitoring data (drilling data, laneway observation data and microseismic monitoring data). Its spatial shape was roughly a cone (Figure 10), consistent with the assumptions of the mechanical model. In addition, the microseismic monitoring system and the surface total station displacement monitoring system were arranged. Additionally, the development range of surface cracking was regularly observed, annually. The surface cracking range over the years and the cumulative surface subsidence distribution in 2021 on the A38 profile are shown in Figure 10.
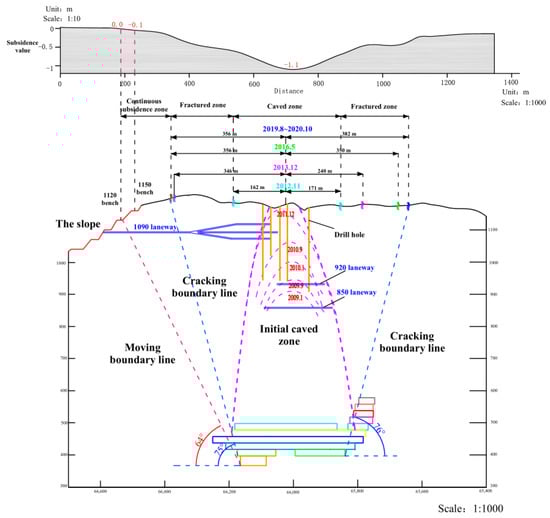
Figure 10.
The surface cracking range over the years and the cumulative surface subsidence distribution in 2021 on the A38 profile.
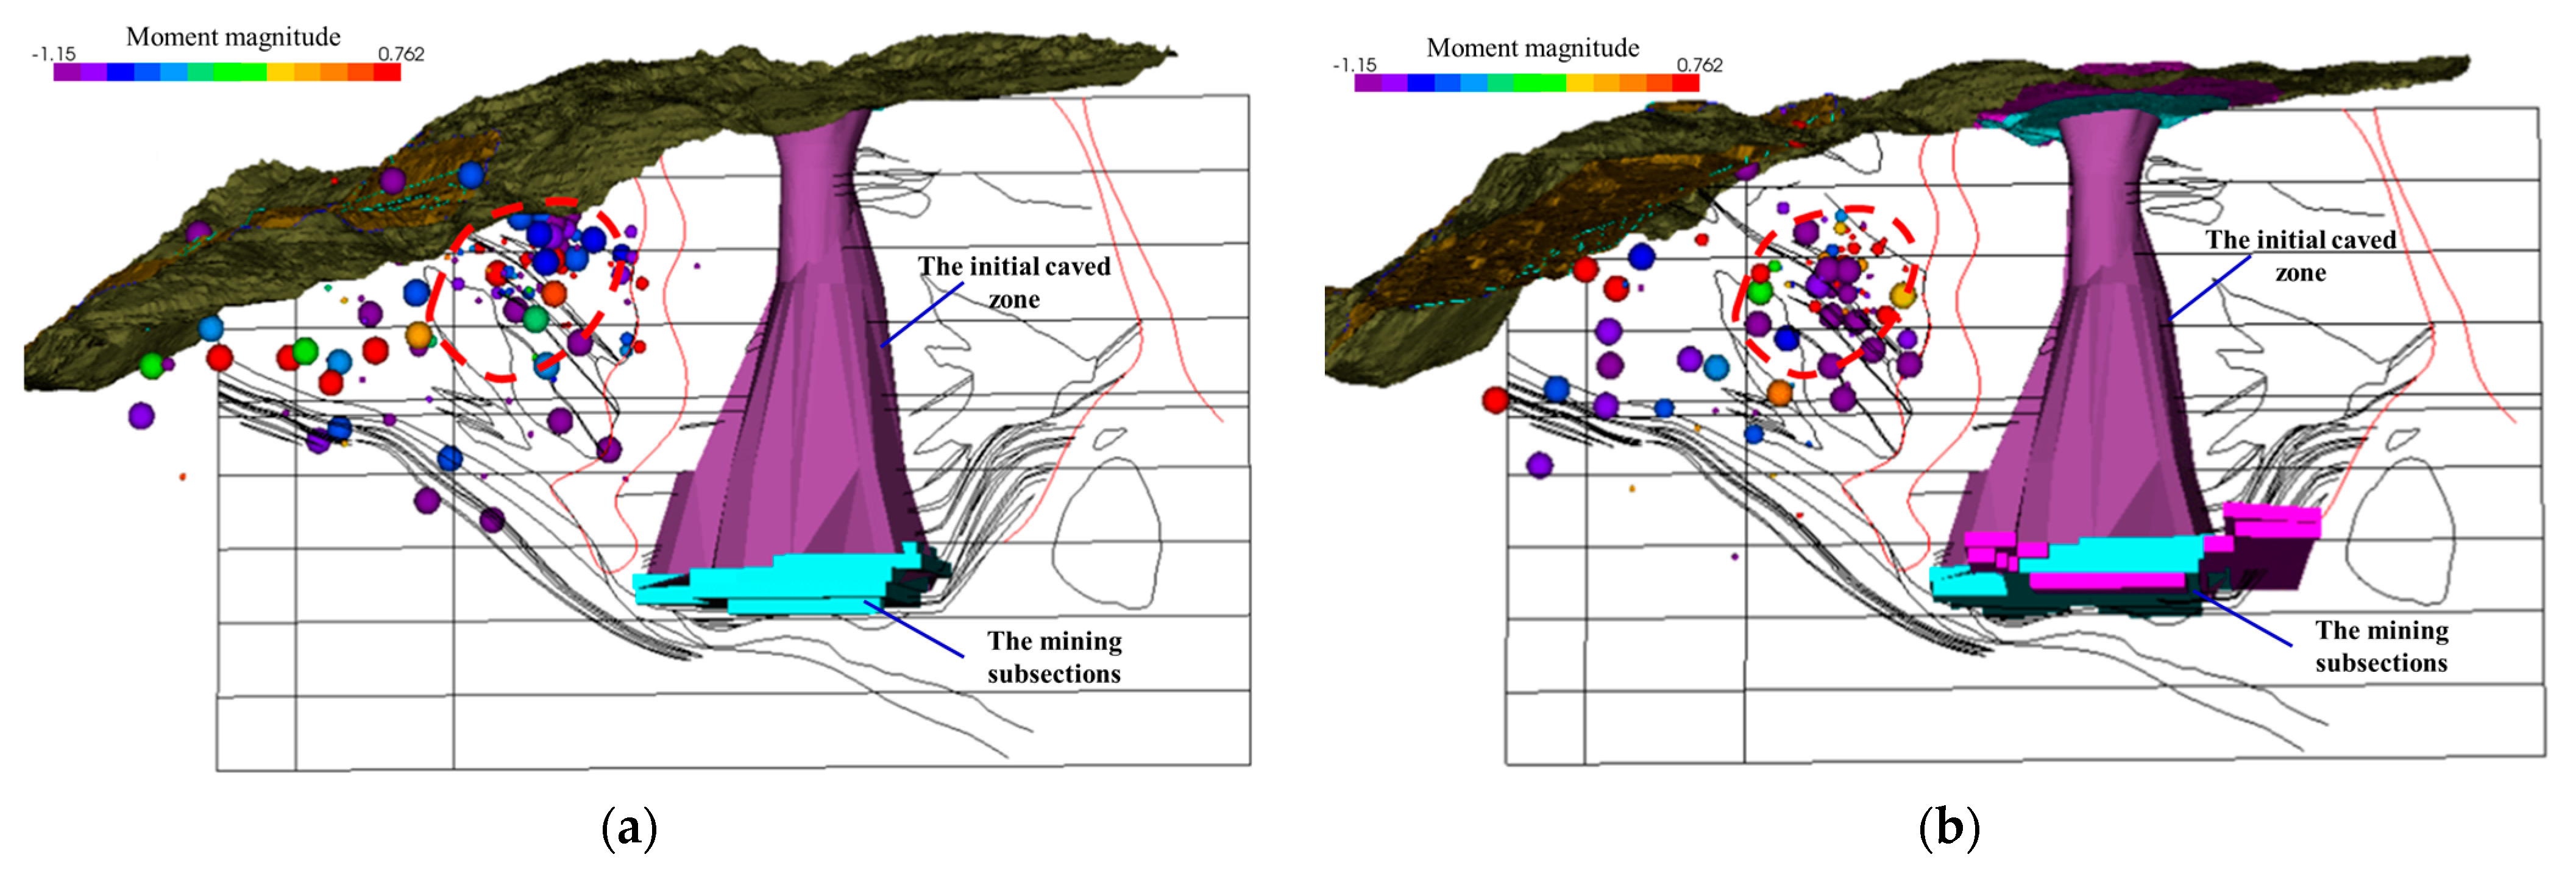
In order to analyze the impact of surface movement on the open-pit slope and to maintain consistency with the mechanical model, the rock mass on the same side as the open pit was taken as the research object. Microseismic data reflecting rock mass damage near the A38 profile in 2012 and 2013 were extracted, respectively, as shown in Figure 11. There were frequent microseismic events in the rock mass at one side of the open pit, and there was obvious microseismic concentration in some parts. This shows that this part of the rock mass was in the influence range of combined mining and had damage and fracture. The rock mass with many microseismic events was within the range delineated by the subsidence angle of 60°. In addition, it can be seen that since the crack initiation point appeared on the surface in 2012, the surface cracking range continued to expand to the outside. Then, the surface cracking range increased by about 184 m on one side of the open pit in 2013, with the largest expansion seen (Figure 10). Until 2016, the cracking range only slightly expanded by 10 m on one side of the open pit, indicating that the expansion of surface cracking was sufficient in 2013. From 2013 to 2021, the 400 subsection was mined. The mining depth of the 400 subsection increased by 20 m, but the mining area was smaller than the 420 subsection (Figure 10). However, on the open-pit side, the surface fractured zone in 2021 remained within the scope of 2016 and had not expanded. This shows that when the mining area does not expand outward, the increase of the mining depth has little impact on the surface movement. The fracture initiation angle was maintained at 75° (Figure 10). This also shows that from 2013 to 2021, the surface deformation was always in the state of full expansion. From the surface subsidence distribution curve of the A38 profile in 2021 (Figure 10), the subsidence value in the center of the caved zone was the largest, reaching 1.1 m. In the continuous subsidence zone, the subsidence value at the 1150 bench of the slope was 0.1 m, and the subsidence value at the 1120 bench was close to 0.0 m. Therefore, in the A38 profile, the measured subsidence angle was 64°. This is consistent with the actual subsidence angle calculated by the mechanical model, which verifies the reliability of the established mechanical model.

Figure 11.
Microseismic data near the A38 profile. (a) Monitoring data in 2012; (b) monitoring data in 2013.
8. Conclusions
- (1)
- Taking the combined mining of the Dahongshan Iron Mine as an example, a mechanical model for calculating the surface movement range was established according to the zoning characteristics of surface movement to reveal the movement mechanism. The change in topography caused by open-pit mining, the shape of the caving zone, the gravel filling of the caving zone and the mining depth were considered in the model.
- (2)
- Based on the mechanical model, the definition of the subsidence angle was supplemented: the subsidence angle is the angle measured from the horizontal of the moving boundary line, a straight line with zero displacement from the edge of the deepest extraction level to the surface and the largest surface cracking range.
- (3)
- According to the supplementary definition of the subsidence angle, a trial calculation method for calculating the subsidence angle was proposed: by presetting different subsidence angles, the subsidence angle corresponding to the maximum surface prone cracking range calculated by mechanical model can be found as the real subsidence angle.
- (4)
- The subsidence angle calculated by the mechanical model was 60°, consistent with the observed subsidence angle of 64° in Dahongshan Iron Mine. The mechanical model provides a new method for calculating the surface movement range for metal mines used for open-pit and underground caving combined mining.
Author Contributions
Conceptualization, K.M. and T.Y.; methodology, K.M.; software, Y.Z.; validation, K.M. and Y.G.; formal analysis, R.H. and Y.L.; investigation, J.H. and J.L.; data curation, K.M. and Y.G.; writing—original draft preparation, K.M.; writing—review and editing, K.M.; visualization, Y.G.; supervision, Y.Z.; project administration, T.Y. All authors have read and agreed to the published version of the manuscript.
Funding
This research was funded by the Fundamental Research Funds for the Central Universities (N2201003) and the National Natural Science Foundation of China (52004052, U1903216 and 52274113).
Data Availability Statement
The data used to support this study are included within the article.
Conflicts of Interest
The authors declare no conflict of interest.
References
- Zhao, X.D.; Li, L.C.; Tang, C.A.; Zhang, H.X. Stability of boundary pillars in transition from open pit to underground mining. J. Cent. South Univ. 2012, 19, 3256–3265. [Google Scholar] [CrossRef]
- Afum, B.O.; Ben-Awuah, E.; Askari-Nasab, H. A mixed integer linear programming framework for optimising the extraction strategy of open pit—Underground mining options and transitions. Int. J. Min. Reclam. Environ. 2019, 34, 700–724. [Google Scholar] [CrossRef]
- Ren, F.Y.; Sow, T.A.M.; He, R.X.; Liu, X.R. Optimization and application of blasting parameters based on the “pushing-wall” mechanism. Int. J. Miner. Metall. Mater. 2012, 19, 879–885. [Google Scholar] [CrossRef]
- Elantseva, L.A.; Fomenko, S.V. Drainage Efficiency Enhancement for Watered Sludge in Aikhal Open Pit Mine. J. Min. Sci. 2021, 57, 249–255. [Google Scholar] [CrossRef]
- Bakhtavar, E.; Shahriar, K.; Mirhassani, A. Optimization of the transition from open-pit to underground operation in combined mining using (0-1) integer programming. J. South Afr. Inst. Min. Metall. 2012, 112, 1059–1064. [Google Scholar]
- Fan, X.M.; Ren, F.Y.; Xiao, D.; Mao, Y.C. Opencast to underground iron ore mining method. J. Cent. South Univ. 2018, 25, 1813–1824. [Google Scholar] [CrossRef]
- Chen, J.H.; Gu, D.S.; Li, J.X. Optimization principle of combined surface and underground mining and its applications. J. Cent. South Univ. Technol. 2003, 10, 222–225. [Google Scholar] [CrossRef]
- Reza, B.A.; Vojtech, G. 3D numerical parametric study of the influence of open-pit mining sequence on existing tunnels. Int. J. Min. Sci. Technol. 2017, 27, 459–466. [Google Scholar] [CrossRef]
- MacNeil, J.A.L.; Dimitrakopoulos, R.G. A stochastic optimization formulation for the transition from open pit to underground mining. Optim. Eng. 2017, 18, 793–813. [Google Scholar] [CrossRef]
- Epstein, R.; Goic, M.; Weintraub, A.; Catalan, J.; Santibanez, P.; Urrutia, R.; Cancino, R.; Gaete, S.; Aguayo, A.; Caro, F. Optimizing Long-Term Production Plans in Underground and Open-Pit Copper Mines. Oper. Res. 2012, 60, 4–17. [Google Scholar] [CrossRef]
- Zhao, Y.; Yang, T.H.; Bohnhoff, M.; Zhang, P.H.; Yu, Q.L.; Zhou, J.R.; Liu, F.Y. Study of the rock mass failure process and mechanisms during the transformation from open-pit to underground mining based on microseismic monitoring. Rock. Mech. Rock. Eng. 2018, 51, 1473–1493. [Google Scholar] [CrossRef]
- Zhao, Y.; Yang, T.H.; Yu, Q.L.; Zhang, P.H. Dynamic reduction of rock mass mechanical parameters based on numerical simulation and microseismic data—A case study. Tunn. Undergr. Space Technol. 2019, 83, 437–451. [Google Scholar] [CrossRef]
- He, R.X.; Fu, Y.; Ren, F.Y.; Song, D.L.; Liu, Y.; Tan, B.H. Strata movement law of subsequent mining of collapse pit in southeast mining area of Gongchangling iron mine. J. Mining. Saf. Eng. 2019, 36, 527–534. (In Chinese) [Google Scholar]
- Li, S.L.; Hu, J.Y.; Zhou, A.M.; Lin, F.; Yu, Z.F. Comprehensive research on character of collapse and fracture of thick and large overburden rock in cave mining. Chin. J. Rock Mech. Eng. 2016, 35, 1729–1739. (In Chinese) [Google Scholar]
- Ministry of Emergency Management, PRC. Safety Regulation for Metal and Nonmetal Mines (GB 16423-2020); Emergency Management Press: Beijing, China, 2020. (In Chinese)
- Cheng, G.W.; Yang, T.H.; Liu, H.Y.; Wei, L.K.; Zhao, Y.; Liu, Y.L.; Qian, J.W. Characteristics of stratum movement induced by downward longwall mining activities in middle-distance multi-seam. Int. J. Rock. Mech. Min. Sci. 2020, 136, 104517. [Google Scholar] [CrossRef]
- Song, Z.Q. Utility Mine Pressure and Control; China University of mining and Technology Press: Xuzhou, China, 1988. (In Chinese) [Google Scholar]
- Ju, J.F.; Xu, J.L. Structural characteristics of key strata and strata behaviour of a fully mechanized longwall face with 7.0 m height chocks. Int. J. Rock. Mech. Min. Sci. 2013, 58, 46–54. [Google Scholar] [CrossRef]
- Yin, L.M.; Ma, K.; Chen, J.T.; Xue, Y.C.; Wang, Z.Q.; Cui, B.Q. Mechanical model on water inrush assessment related to deep mining above multiple aquifers. Mine. Water. Environ. 2019, 38, 827–836. [Google Scholar] [CrossRef]
- Ma, K.; Yang, T.H.; Deng, W.X.; Hou, X.G.; Li, Z.S.; Zhao, Y.; Liu, Y.L.; Gao, Y.; Sun, D.D.; Hou, J.X. Analysis of water inrush at Dongyu coal mine in China from an old water-logged goaf associated with a syncline fractured zone. Hydrogeol. J. 2023, 31, 417–433. [Google Scholar] [CrossRef]
- Castro, R.; Lopez, S.; Gomez, R.; Ortiz, S.; Carreno, N. Experimental study of the influence of drawbell geometry on hang-ups in cave mine applications. Rock. Mech. Rock. Eng. 2020, 54, 1–10. [Google Scholar] [CrossRef]
- Brady, B.H.G.; Brown, E.T.D. Rock Mechanics for Underground Mine; George Allen Unwin: London, UK, 1985. [Google Scholar]
- Zhen, J.M.; Ren, F.Y.; Tang, L.X. Critical depth prediction and surface subsidence range controlling based on Xishimen mine. J. Min. Saf. Eng. 2014, 31, 631–634. (In Chinese) [Google Scholar]
- Hoek, E. Progressive caving induced by mining an inclined orebody. Trans. Instn. Min. Metall. 1974, 83, A133–A139. [Google Scholar]
- Villegas, T.; Nordlund, E.; Dahner-Lindqvist, C. Hangingwall surface subsidence at the Kiirunavaara Mine, Sweden. Eng. Geol. 2011, 121, 18–27. [Google Scholar] [CrossRef]
- Ma, K.; Yang, T.H.; Zhao, Y.; Hou, X.G.; Liu, Y.L.; Hou, J.X.; Zheng, W.X.; Ye, Q. Mechanical model for analyzing the water-resisting key stratum to evaluate water inrush from goaf in roof. Geomech. Eng. 2022, 28, 299–311. [Google Scholar] [CrossRef]
- Li, L.C.; Tang, C.A.; Zhao, X.D.; Cai, M. Block caving-induced strata movement and associated surface subsidence: A numerical study based on a demonstration model. Bull. Eng. Geol. Environ. 2014, 73, 1165–1182. [Google Scholar] [CrossRef]
- Zhang, D.J.; Wang, J.D.; Guo, S.; Cao, J.L. Numerical simulation of crack evolution mechanism and subsidence characteristics effected by rock mass structure in block caving mining. Geotech. Geol. Eng. 2022, 40, 5377–5395. [Google Scholar] [CrossRef]
- Parmar, H.; Bafghi, A.Y.; Najafi, M. Impact of ground surface subsidence due to underground mining on surface infrastructure: The case of the Anomaly No. 12 Sechahun, Iran. Environ. Earth. Sci. 2019, 78, 409. [Google Scholar] [CrossRef]
- Takhanov, D.; Muratuly, B.; Rashid, Z.; Kydrashov, A. Geomechanics substantiation of pillars development parameters in case of combined mining the contiguous steep ore bodies. Min. Min. Dep. 2021, 15, 50–58. [Google Scholar] [CrossRef]
- Imashev, A.; Suimbayeva, A.; Zhunusbekova, G.; Zeitinova, S.; Kuttybayev, A.; Mussin, A. Research into stress-strain state of the mass under open pit with a change in the open-pit bottom width. Min. Min. Dep. 2022, 16, 61–66. [Google Scholar] [CrossRef]
- Ghazdali, O.; Moustadraf, J.; Tagma, T.; Alabjah, B.; Amraoui, F. Study and evaluation of the stability of underground mining method used in shallow-dip vein deposits hosted in poor quality rock. Min. Min. Dep. 2021, 15, 31–38. [Google Scholar] [CrossRef]
- Woo, K.S.; Eberhardt, E.; Elmo, D.; Stead, D. Empirical investigation and characterization of surface subsidence related to block cave mining. Int. J. Rock. Mech. Min. Sci. 2013, 61, 31–42. [Google Scholar] [CrossRef]
- Bruneau, G.; Hudyma, M.R.; Hadjigeorgiou, J.; Potvin, Y. Influence of faulting on a mine shaft—A case study: Part II—Numerical modelling. Int. J. Rock. Mech. Min. Sci. 2003, 40, 113–125. [Google Scholar] [CrossRef]
- Cheng, G.W.; Chen, C.X.; Li, L.C.; Zhu, W.C.; Yang, T.H.; Dai, F.; Ren, B. Numerical modelling of strata movement at footwall induced by underground mining. Int. J. Rock. Mech. Min. Sci. 2018, 108, 142–156. [Google Scholar] [CrossRef]
- Van, A.A. Subsidence Definitions for Block Caving Mines; Rio Tinto Technical Services: Melbourne, Australia, 2003; p. 59. [Google Scholar]
- Li, H.Y.; Ren, F.Y.; Chen, X.Y.; Gong, G.H. The method for predicting and controlling the range of surface subsidence during deep ore-body mining. J. Northeast. Univ. 2012, 33, 1624–1627. (In Chinese) [Google Scholar]
- Ministry of Housing and Urban-Rural Development, PRC. Code for Design of Concrete Structures; China Architecture and Building Press: Beijing, China, 2015. (In Chinese)
- Liu, J.L.; Wang, Z.Z.; Chen, L.J.; Han, Y.B.; Liu, X.D. Stress calculation method for a cantilever deep beam subjected to a uniform load. Tsinghua Sci. Technol. 2010, 50, 316–320. (In Chinese) [Google Scholar]
- Hoek, E.; Brown, E.T. Practical estimates of rock mass strength. Int. J. Rock. Mech. Min. Sci. 1997, 34, 1165–1186. [Google Scholar] [CrossRef]

Disclaimer/Publisher’s Note: The statements, opinions and data contained in all publications are solely those of the individual author(s) and contributor(s) and not of MDPI and/or the editor(s). MDPI and/or the editor(s) disclaim responsibility for any injury to people or property resulting from any ideas, methods, instructions or products referred to in the content. |
© 2023 by the authors. Licensee MDPI, Basel, Switzerland. This article is an open access article distributed under the terms and conditions of the Creative Commons Attribution (CC BY) license (https://creativecommons.org/licenses/by/4.0/).