Abstract
An optimization model for the fuel distribution of the material layer with mechanism models and algorithms is presented, which can reduce the fuel ratio of ore blending and enhance the fuel content in the upper layer to improve the homogeneity of the sinter quality. The actual fuel distribution of the material layer is analyzed through the granulation model and the theoretical fuel distribution for each unit is obtained using the numerical model. Then, the fuel particle size composition and segregation characteristics are optimized via the particle swarm optimization algorithm to bring fuel distribution close to the theoretical value, with a sum of their absolute values of 0.025. In comparison with the initial conditions, the fuel particle size composition conforms to a normal distribution with increased coarse particles, and the deviation of the granules from the vertical direction of the sinter layer decreases. Through this optimization method, the sinter bed with the ideal thermal profile can be achieved, namely uniform sintering along with a reduced coke ratio.
1. Introduction
As reported in the Global Climate Status 2021, the greenhouse gas CO2 is one of the main causes of global warming, and it has become a global consensus to reduce carbon emissions [1]. The steel industry is fundamental to modern society, and its robust and healthy development is important for the economy. Steel manufacturing is CO2- and energy-intensive and is dominated by the blast furnace-converter process in China [2]. Sintering, as the first high-temperature process, comprises about 15% of CO2 emissions and 10% of energy consumption [3,4,5]. In terms of energy-saving and emission-reducing technologies for sintering, there is a room between the current technologies with those developed by the European Coal and Steel Research Fund (RFCS), such as carbon reduction, flue gas circulation, and biomass fuel substitution [6,7,8], which are significant for low-carbon development in the sintering industry.
Methods to reduce the solid fuel for sintering include supplement external heat and the adjustment of the internal heat. The heat of the sinter layer from the top to the bottom gradually increases due to the thermal storage, especially in the thick-bed sintering technology. If the fuel is homogeneously dispersed in the bed, there will be a situation where the temperature in the upper layer is insufficient and the heat is too high at the bottom, which will increase the level of return and fuel consumption and cause an uneven sinter quality in the material layer. Thus, it is important to optimize fuel distribution based on the thermal field of the material layer. There is already technical support for fuel refinement utilization in a sintering plant in the form of a jaw crusher. Some scholars have studied the effect of fuel conditions on the thermal state by means of numerical models [9,10,11,12,13]. Won [14] studied the effect of fuel characteristics on the thermal state, demonstrating that the better the combustion characteristics, the faster the spread of the burning zone. Shrestha [15] established a numerical simulation of fuel-layered distribution iron ore sintering, which was able to improve the quality indices of the sinter. Hou [16,17] investigated the effect of the internal temperature and oxygen concentration on the heat and mass transfer for three typical fuel structures and proposed a fuel addition technology in the form of granulation to improve the combustion efficiency of fuel in the material layer. Pahlevaninezhad [18] studied the fuel particle size on the sinter quality and concluded that it was detrimental to the coarser fuel particles. Ohno [19] investigated the coke combustion rate on the temperature field of iron ore sintering process. Zhao [20] integrated the combustion model into the sintering simulation to improve the prediction accuracy. However, most of the above numerical models consider the fuel to be uniformly distributed in the material layer. If we consider a fuel segregation state in the material layer in the numerical model, it requires giving the fuel distribution priority in the granules. Then, according to the ore blending structure and segregation conditions, the fuel distribution in the sinter layer is obtained from the model used in the previous study [21]. Furthermore, the fuel distribution is optimized through the numerical model and algorithms.
Some scholars have studied the optimization of the fuel distribution of the material layer using mathematical models and experiments. Huang [22] developed a heat balance equation for the sintering process to obtain a reasonable fuel distribution. Some scholars [11] proposed a reasonable fuel proportion for each unit of the material layer based on the maximum temperature. Others suggested a suitable particle size composition of the fuel through experiments. For example, some [23,24,25] argued that the ratio of −3 mm for coke breeze is 80%, while others [26] suggested that 90% coke powder have the better sintering quality. Mathematical algorithms, as essential tools for parameter optimization, can search globally for optimal conditions for various objectives. The particle swarm optimization algorithm (PSO) [27,28] has a fairly fast search speed and cannot easily find the local optimum through the deterministic local search algorithm. Nath [29] optimized the fuel ratio and negative pressure conditions for the two sintering layers using a genetic algorithm so as to obtain the optimal sintering quality. However, there have been few studies on the thermal state of the bed that consider the whole sintering process, and fuel conditions are mostly determined experimentally according to the sinter quality, rather than optimized for the thermal state of the material layer. In this paper, we combine the mechanism model and the intelligent algorithm to obtain suitable fuel conditions based on the temperature of the material layer, which can provide a theoretical basis for the optimization of the fuel conditions during actual production.
Based on the granulation model and the numerical simulation model, considering the ore blending structure and the segregation conditions, a simulation was carried out to calculate the fuel theoretical proportion for each unit of the material layer and the accuracy of the model was verified via experiments. Then, with the target of a theoretical fuel proportion in each unit of the bed, the particle swarm algorithm was used to optimize the fuel particle size composition and segregation conditions, which provides a certain theoretical basis for controlling fuel conditions in the sintering process.
2. Process Description
Sintering includes the main steps of blending, mixing, and granulation; segregation and ignition; and sintering under suction [30]. Blending is utilized to mix iron ore, flux, fuel, and return at a certain ratio. Granulation is the thorough mixing of raw materials to obtain the sinter mixture through water wetting. Ignition and segregation are used to unload the pelleted mixture into the sintering trolley and to cause the fuel on the surface layer to start burning. Sintering under suction is a series of changes, such as the decomposition, oxidation, reduction, and melting of oxides from fuel combustion to bring the bed to a temperature of 1200–1400 °C and then cool it in order to form the sinter [31]. A typical flow of the process is shown in Figure 1.
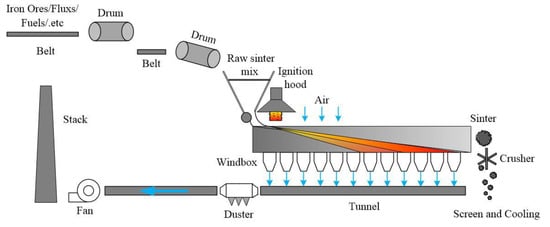
Figure 1.
The sintering process.
The distribution of the fuel in the granules, as a raw material, is determined by the ore blending structure and the granulation process [32]. Segregation determines the fuel distribution in the sinter layer and the temperature profile of the sintering process, which in turn affects the sinter quality [33]. It is essential to match the fuel distribution to its temperature field to improve fuel utilization efficiency.
3. Optimization Strategies and Models
This section describes the general framework of the proposed optimization strategy. The models applied in this framework are presented in Section 3.1, Section 3.2 and Section 3.3. Figure 2 shows the general strategy framework, which involves the following steps.
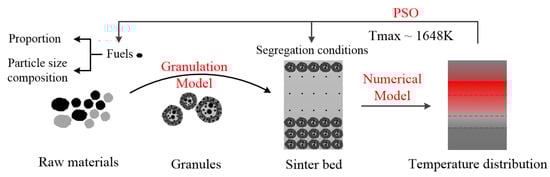
Figure 2.
The general strategy framework.
- (1)
- According to the ore blending scheme and the segregation conditions, i.e., the size distribution of the granules of each grain size in the vertical direction of the material layer, the initial fuel distribution in the material layer is calculated by the granulation model for the sinter mixture.
- (2)
- Based on the numerical model, it calculates the temperature field of fuel inhomogeneous distribution in the sinter layer and calculates the fuel theoretical proportion for each unit of the layer based on its maximum temperature.
- (3)
- Based on the optimization model for the fuel distribution, the fuel conditions, such as particle size composition and segregation characteristics, are found to match the theoretical coke content of each unit.
3.1. Granulation Model for the Sinter Mixture
The initial fuel distribution in the material layer can be obtained based on a model from a previous study [21]. Based on the one-dimensional particle number balance equation, it is possible to predict the characteristics of the quasi-particles after granulation through the physical properties of the raw materials, the amount of water, and the ore blending scheme. Then, the distribution of fuel particles in each size granules, i.e., the content of the fuel with J particle size in granules with I particle size, is analyzed according to the three cases of raw material grain size, as shown in Equation (1). The fuel fraction of each particle size in the granules is calculated according to Equation (2). The above method can be used to study the effect of the fuel ratio and its particle size composition on the fuel distribution of granules.
Based on the particle size distribution characteristics of the granules in the vertical direction of the material layer, combined with the fuel distribution of granules, the coke breeze content for each unit of the material layer can be obtained as shown in Equation (3), and a more detailed description of the equation is provided [21].
3.2. Numerical Model
The fuel initial distribution of the material layer is obtained based on the granulation model as one of the boundary conditions of the numerical model. The sintering process involves heat transfer, gas flow, and component transport, using the energy conservation equations, component conservation equations, gas momentum equations, and basic governing equations, as listed in Table 1 [11].

Table 1.
Summary of the control equations of the numerical model.
The reactions that produce thermal changes during sintering mainly include water evaporation and condensation, fuel combustion, carbonate decomposition, and liquid phase formation and solidification, which are given in Table 2.
Table 2.
The reaction rate equations of the sintering process.
The solution process of the numerical simulation model. First, the partial differential equations are discretized using the difference method, and then, according to the initial boundary conditions, we are able to solve the equations through the tri-diagonal matrix algorithm (TDMA) [34] with the spatial and time steps of 0.67 mm and 1 s, respectively, which are enough to capture the physical-chemical changes of the sintering process. The model is validated using the sinter pot test, as detailed in Section 4.1.
3.3. Optimization Model for the Fuel Distribution
For the fuel-appropriate distribution of the material layer, the sum of the absolute values of the actual and theoretical fuel ratios of each unit is used as the objective function, and the fuel distribution can be controlled using the fuel conditions to meet the theoretical requirements. Firstly, the theoretical fuel ratios for each unit of the layer are calculated via the numerical model. The overall layer is divided into nine units, which are defined as unit 1, unit 2, etc. According to the heat content of each unit and its reasonable value of the maximum temperature, as defined via the numerical model, we can obtain the fuel content of each unit with a 0.1 m thickness as a theoretical value. The calculation steps are as follows.
- The target temperature of the unit is determined, which is generally from 1573 to 1723 K. In this paper, 1648 K was taken.
- The heat is used to achieve the target temperature of the bed.
- The heat is used to reach the actual temperature of the unit through the numerical model.
- The fuel ratio in the ore blending scheme is used as a benchmark to calculate the fuel theoretical ratios for each unit, as shown in the following equation.
Then, the fuel conditions are optimized, in terms of fuel proportion, particle size composition, and segregation in the sinter bed. Fuel consists of six grain classes: +8 mm, 5–8 mm, 3–5 mm, 1–3 mm, 0.5–1 mm, and −0.5 mm. Assuming a fixed material segregation in the vertical direction of the material layer, the initial fuel fraction for each unit of the material layer is predicted based on the granulation model, and its absolute error with the theoretical value is used as the objective function, as seen in Equation (14). With the mass fraction of fuel in each particle size as a constraint, see Equation (15), the fuel size composition is optimized to achieve the theoretical fuel distribution. If it cannot meet the demand, the fuel segregation in the vertical direction in the three regions of the sinter layer is further optimized. The optimized fuel size composition is taken as one of the initial conditions for the granulation model. With the minimum absolute error of fuel proportion in each region as the objective function and fuel segregation in three regions as the constraint, see Equation (16), the deviation of the granules in three regions is optimized. In this way, the multi-constrained particle swarm optimization algorithm (PSO) is proposed in order to find the fuel conditions that satisfy the fuel proportioning requirement of each unit.
As an objective function for the optimization of the fuel particle size composition, Equation (14) is as follows.
The penalty function method is used to bring the data close to the constraint, and the fraction range of fuel particle size composition is set through the literature, as well as the 100% sum as the constraint.
According to the segregation of the sintering, there is a clear deviation for the +8 mm and −0.5 mm granules, while the others are uniformly dispersed. In addition, the granules in the material layer are summed to 100%. The constraints are as follows:
The PSO is used to solve the constructive equations. The main steps are as follows:
- Initialization parameters. The total population is set to 500, the maximum number of iterations is set to 300, and adaptive parameters, such as the inertia weight critical ; the learning factor critical ; and the chaos parameter , are used.
- Since the constraints exist in equation forms, the conditions can be simplified to generate more populations satisfying the conditions, and the population is initialized using a logistic chaotic distribution, assigning a single optimal value and a population optimal value.
- The corresponding multi-constraint conditions can be set using the above multi-constraint principle, i.e., Equations (15) and (16), and the fitness function is Equation (14).
- The generation value for each particle can be calculated, and if it is smaller than the individual optimum, it should be updated to that value.
- If the generation value is less than the population optimum, it should be updated to that value.
- The velocity and position should be adaptively updated for each particle in the population, according to Equation (20), in the next search round.
- If the fuel distribution of the material layer meets the theoretical values of each unit, the iteration should be exited and the result output; otherwise, the number of iterations added one, and the process should return to step (3).
4. Results and Discussion
4.1. Model Validation
The accuracy of the numerical model in Section 3.2 is verified through the sinter pot test, and the ore blending scheme is shown in Table 3. The experimental apparatus is shown in Figure 3. The mixture was poured into a 900 mm sinter pot, and five S-type thermocouples measured the material temperature at different positions. Experimental parameters were the ignition temperature at 1100 ± 50 °C for 1 min, the holding temperature of 900 °C for 30 s, and sintering by suction at −12 kPa. The sinter was discharged after cooling for 3 min. As seen from Figure 4, there is a clear segregation of coarse-grained granules of the sinter bed, and these accumulate at the bottom layer, especially the +8 mm granules, while the fine-grained granules are more uniformly dispersed. The parameters of the material properties for the numerical model are shown in Table 4.
Table 3.
Ore mixing scheme.
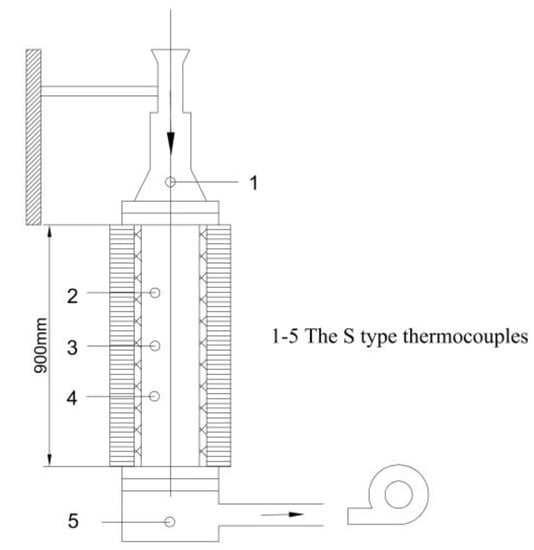
Figure 3.
Schematic of experimental design.
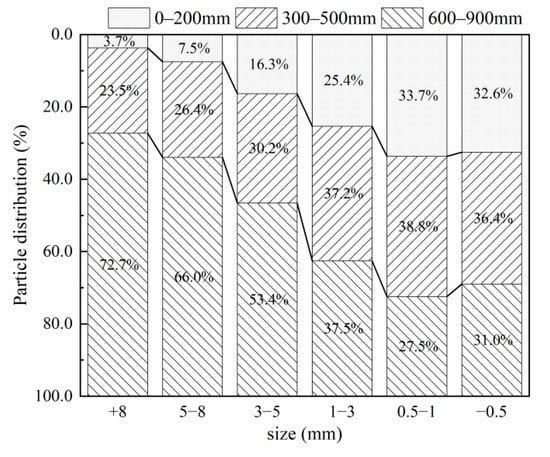
Figure 4.
The actual size distribution of granules in the vertical direction of the bed.
Table 4.
Dimensions and parameter values used for the numerical model.
The experiment results were obtained from the layer with three R-type thermocouples at 250 mm, 450 mm, and 650 mm, respectively. The simulation and experiment of the layer temperature is shown in Figure 5. The temperature curves are broadened and the maximum temperature gradually increases, in accordance with the increase in the height of the material layer. Due to the insufficient preheating of the burning gas in the middle and upper layers, the temperature was lower when it reached the burning zone, which allowed the fuel to burn at a lower temperature. In the bottom layer, it was well preheated by the combustion gas, which created a higher combustion temperature and a higher heat in the material layer. Yet there is a slight difference in the time of the initial temperature increase, which is larger at 650 mm. This could be caused by a shift in the actual thermocouple measurement point in the experiment.
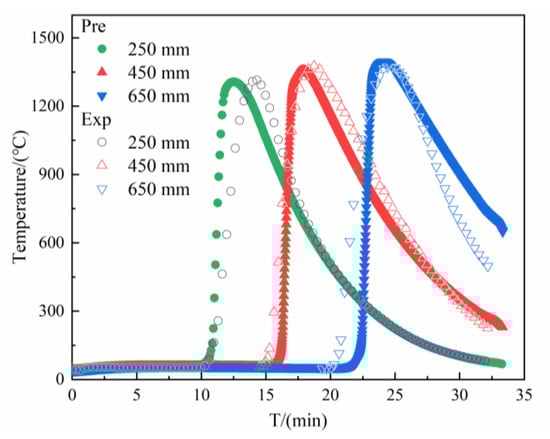
Figure 5.
The comparison of the simulation and experiment of the temperature.
The combustion characteristic parameters during sintering include the maximum temperature (MaxT), the duration time of the high temperature zone above 1100 °C (DTHTZ), and the flame front speed (FFS), as shown in Table 5.
Table 5.
The simulation and experiment of combustion characteristics parameters.
It can be seen that the simulation results are in good agreement with experiments, and the relative error of MaxT is <4% and that of DTHTZ is <5%, which validates the accuracy of the model.
4.2. Optimization of Fuel Distribution
This paper aims to optimize the fuel size composition and its segregation state to achieve an appropriate fuel distribution that meets the temperature requirements of the material layer. According to the ore blending scheme in Table 3, the fuel-appropriate distribution for each unit are calculated using the numerical model, as shown in Table 6. The results show that the fuel proportion of the ore blending is 4.95%, which is lower than the actual proportion by 0.05%. As can be seen, the units 1 and 2 have higher fuel ratios, and the differences to the others are also larger, due to the inlet gas temperature from the ignition temperature to ambient conditions and the low heat storage capacity. The units 3, 4, and 5 are closer to each other, and as the depth of the bed increases, the fuel ratio shows a steady decrease due to the gradual increase in heat storage. So, it is possible to divide units 1–2, 3–5, and 6–9 into three parts for the subsequent solutions.
Table 6.
The theoretical values of fuel content per unit.
4.2.1. Fuel Particle Size Composition
According to the scheme of Table 3, the initial fuel distribution of each unit can be calculated by Equation (3) based on the granulation model and compared with that of the theoretical one, as shown in Figure 6. It can be seen that the initial fuel content of each unit is 10%–12%, is lower at both sides and higher in the middle, and is different to the theoretical value, which is not conducive to the uniform sintering of the material layer and may affect the sinter quality.
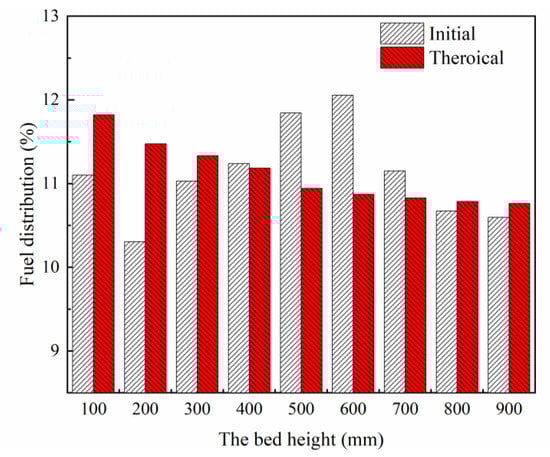
Figure 6.
The initial fuel distribution in the material layer and the theoretical values.
The optimization model for the fuel distribution based on Section 3.3 assumes that the material segregation is fixed to optimize the fuel size composition. The fuel proportion of each layer can be obtained using the granulation model. The suitable fuel size composition is obtained based on the optimization model, as shown in Figure 7. It can be observed that the initial condition of the fuel for +5 mm content is about 10%, for 0.5–3 mm about 40%, and for −0.5 mm about 33%, and its distribution is relatively uneven and fine, while the optimized size composition is more in line with the normal distribution, with the highest content of 0.5–3 mm about 60% and the −0.5 mm content reduced to 12.5%.
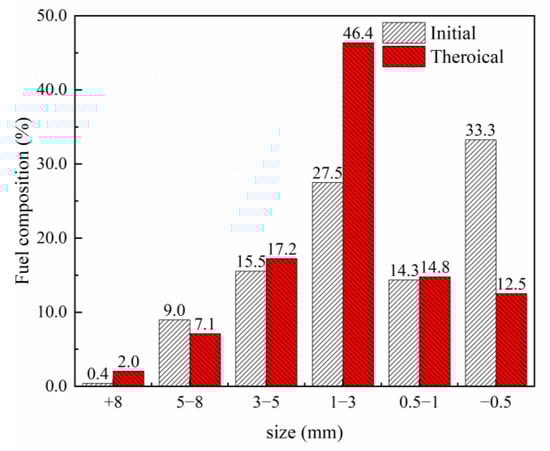
Figure 7.
The comparison between the suitable fuel size composition and the initial fuel size composition.
The fuel content of each layer with a 0.1 m thickness as a unit for the optimum scheme can be calculated via the granulation model. Compared to the initial fuel content of the sinter bed in Figure 6, the variations from top to bottom are 0.06%, 0.02%, 0.05%, −0.01%, −0.07%, −0.15%, −0.1%, 0.01%, and 0.19%, respectively. This indicates that through the optimization of fuel particle size, the discrepancy between the upper and lower layers of the fuel content and that of theoretical values can be reduced. The coarser fuel particles are beneficial for reducing the combustion reaction rate, prolonging the reaction time, and increasing the duration time of the high temperature zone in the material layer. Although the optimization of fuel particle size composition can improve its distribution in the bed, it is not sufficient to meet the theoretical requirements and the fuel segregation characteristics need further discussion.
4.2.2. Segregation Characteristics
Furthermore, the effect of the segregation properties of granules on the fuel distribution is discussed. When the sum of the absolute errors between the calculated and the theoretical values of the fuel ratio is equal to 0.025, the distribution of granules in the vertical direction of the layer is obtained, as shown in Figure 8. It appears that the coarse granules gradually increase, the medium granules are more evenly distributed, and the fine granules decrease. In comparison to the actual segregation of granules in the material layer from Figure 4, the optimized segregation of coarse particles is reduced while that of the fine particles is increased. Hence, in the actual sintering process, the inclination angle of the discharge plate should be reduced in order to slow down the discharge speed, so that the medium and fine granules are distributed as uniformly as possible.
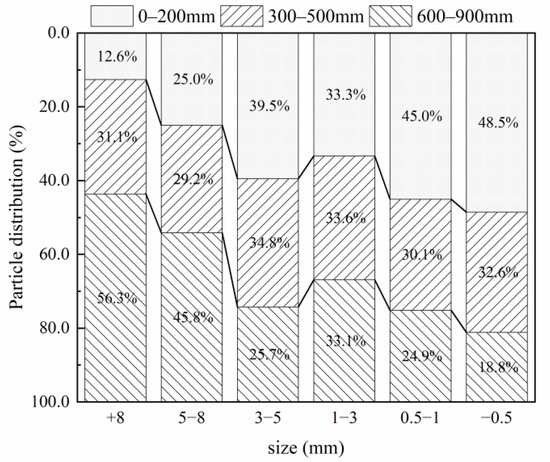
Figure 8.
The particle size distribution of granules in the vertical direction of the bed.
Compared with the simulation of the initial condition in Table 5, the results for the optimal conditions reveal that MaxT varies from 5.49 °C, 0.33 °C, and −8.21 °C at the heights of 250 mm, 450 mm, and 650 mm in the material layer. MaxT is not only affected by heat and mass transfer but also by reactions such as fuel combustion, the decomposition of the fluxes, and the water evaporation and condensation. This represents the state of melting and mineral crystallization conditions at different heights of the material layer, and the higher MaxT, the higher melting rate and better mineral crystallization conditions. In addition, the variation of the DTHZ at 250 mm, 450 mm, and 650 mm height in the material layer is about 3 s, 0 s, and −3 s, which is due to the higher fuel content in the upper layer for the optimized conditions. In this way, it enhances the reductive atmosphere of the material layer and prolongs the fuel combustion reaction and also increases the DTHTZ and MaxT, which improves the thermal state of the sintering process. While the DTHTZ is lower at the bottom of the material layer because of the insufficient heat storage of the bed with the lower fuel ratio, the flame front speed of the sintering process before and after optimization remains unchanged at 26.89 mm/min, which means that there is no significant effect on the burn-through point. The optimization of the fuel conditions can improve the thermal state of the middle and upper material layers, which is beneficial to the crystallization and growth of calcium ferrate as well as the sinter quality index. Some sintering plants are now able to control the fuel particle size composition through crushers, but there is room for development regarding the control of the material segregation of sintering bed. This model can provide a theoretical basis to optimize the fuel particle size composition of the sintering process, but there is still some way to go in regard to practical industrial applications.
5. Conclusions
For a certain fuel conditions and the segregation characteristics, the temperature field of the material layer is obtained through the granulation model and numerical model. The optimization of the fuel distribution in the sinter bed via the particle swarm algorithm is shown to meet the theoretical distribution, and the main conclusions are as follows.
- (1)
- Considering the granulation and the sintering process, the effect of the fuel conditions on the distribution and temperature field of the sinter bed were investigated. The fuel distribution of the material layer for a given ore blending condition was obtained via the granulation model. Based on the numerical model, the temperature field of the layer can be obtained. The accuracy of the model is verified using the sinter pot test, with relative errors within 5%. Based on the highest temperature of the bed, the fuel theoretical distribution was obtained; however, there was a discrepancy to that of the actual distribution via the granulation model, especially in the middle and upper layers, which could damage the sinter quality.
- (2)
- Taking the sum of the absolute errors of the actual fuel distribution and the theoretical fuel distribution for each unit as the objective function, the optimization model for fuel distribution was adopted to obtain suitable fuel particle size composition and segregation properties, respectively. The optimization results show that the +5 mm content of the fuel is less than 10%, 3–5 mm content is 17%, 0.5–3 mm content is 60%, and −0.5 mm content is 13%, and the segregation of coarse particles decreases while that of the fine granules increases, which can extend the burning time of the fuel and improve the thermal state of the top layer. It can also provide theoretical support for uniform sintering in actual production.
Author Contributions
Conceptualization, F.D., X.F., X.H., X.C., M.G., Z.J. and Z.S.; methodology, F.D., X.H. and X.C.; validation, F.D. and X.H.; formal analysis, F.D.; investigation, X.C. and Z.S.; resources, X.F. and M.G.; data curation, F.D.; writing—original draft preparation, F.D.; writing—review and editing, F.D., X.F. and X.H.; supervision, X.F. and Z.S.; project administration, Z.J. All authors have read and agreed to the published version of the manuscript.
Funding
This work was supported the National Natural Science Foundation of China under Grant 51804347.
Data Availability Statement
The data that support the findings of this study are available from the corresponding author, Fan, upon reasonable request.
Conflicts of Interest
No potential conflict of interest are reported by the authors.
Nomenclature
| Mass fraction, % | |
| Fuel content of the granules, % | |
| Fuel ratio for each unit of the material layer, % | |
| porosity | |
| Density of gas or solid phases, kg/m3 | |
| Mass fraction of gas or solid phases, % | |
| Gas velocity, m/s | |
| Reaction rate, mol/m3/s | |
| Time, s | |
| Spatial coordinates in the height direction of the material layer, m | |
| Temperature of solid phase or gas phase, k | |
| Thermal conductivity of solid phase or gas phase, W/m/K | |
| Constant pressure specific heat capacity of the solid or gas phase, J/kg/K | |
| Reaction heat, J/kg | |
| Convection heat transfer coefficient, W/m2/K | |
| Specific surface area, m2/m3 | |
| Pressure drop, kg/m2 | |
| Height of sinter bed, m | |
| Gas dynamic viscosity, kg/m/s | |
| Particle shape factor | |
| Particle equivalent diameter, m | |
| Distribution factor | |
| Molar mass, kg/mol | |
| Molar concentration of gas, mol/m3 | |
| Reaction rate constant, m/s | |
| Pressure, Pa | |
| Diffusion coefficient, m2/s | |
| Thickness of ash layer, m | |
| Fuel proportion in ore blending, % | |
| Chaotic variables | |
| Chaos parameters | |
| The iteration | |
| Inertia weight | |
| Learning Factor | |
| N | Maximum number of iterations |
| Update volume | |
| Subscripts and Superscripts | |
| The grain level | |
| n | Total number of particle size classes |
| The unit layer | |
| Gas phase | |
| Solid phase | |
| The gas phase component | |
| The solid phase component | |
| The chemical reaction | |
| Ash layer | |
| Adhesive layer | |
| Gas phase boundary layer | |
| Core particles | |
| Equilibrium state | |
| Temperature of mixture start melting, K | |
| m | Total number of units in the material layer |
| Theoretical value | |
| Individual historical best solution | |
| Population best solution | |
References
- World Meteorological Organization. The State of the Global Climate 2021; World Meteorological Organization: Geneva, Switzerland, 2021. [Google Scholar] [CrossRef]
- Zhang, Q.; Zhao, X.; Lu, H.; Ni, T.; Li, Y. Waste energy recovery and energy efficiency improvement in China’s iron and steel industry. Appl. Energy 2017, 191, 502–520. [Google Scholar] [CrossRef]
- Cang, D. Misunderstandings and realistic path of carbon peak, carbon neutrality and low carbon technology in iron and steel industry. China Metall. 2021, 31, 3–8. [Google Scholar]
- Wang, Y.; Wen, Z.; Cao, X.; Zheng, Z.; Xu, J. Environmental efficiency evaluation of China’s iron and steel industry: A process-level data envelopment analysis. Sci. Total Environ. 2020, 707, 135903. [Google Scholar] [CrossRef] [PubMed]
- Wen, Z.; Wang, Y.; Li, H.; Tao, Y.; De Clercq, D. Quantitative analysis of the precise energy conservation and emission reduction path in China’s iron and steel industry. J. Environ. Manag. 2019, 246, 717–729. [Google Scholar] [CrossRef] [PubMed]
- Pahlevaninezhad, M.; Emanmi, M.D.; Panjepour, M. The effects of kinetic parameters on combustion characteristics in a sintering bed. Energy 2014, 73, 160–176. [Google Scholar] [CrossRef]
- Shen, X.; Chen, L.; Xia, S.; Xie, Z.; Qin, X. Burdening proportion and new energy-saving technologies analysis and optimization for iron and steel production system. J. Clean. Prod. 2018, 172, 2153–2166. [Google Scholar] [CrossRef]
- Wu, M.; Chen, X.; Cao, W.; She, J.; Wang, C. An intelligent integrated optimization system for the proportioning of iron ore in a sintering process. J. Process Control. 2014, 24, 182–202. [Google Scholar] [CrossRef]
- Ramos, M.V.; Kasai, E. Numerical Simulation Model of the Iron Ore Sintering Process Directly Describing the Agglomeration Phenomenon of Granules in the Packed Bed. ISIJ Int. 2000, 40, 40. [Google Scholar] [CrossRef]
- Wang, G.; Wen, Z.; Zhang, S. Progress of numerical simulation of heat and mass transfer in sintering process. Energy Metall. Ind. 2018, 37, 14–19. [Google Scholar] [CrossRef]
- Huang, X.X.; Fan, X.H.; Chen, X.L.; Zhao, X.Z.; Gan, M. Optimisation model of fuel distribution in materials bed of iron ore sintering process. Ironmak. Steelmak. 2018, 46, 1–7. [Google Scholar] [CrossRef]
- Cheng, Z.; Fu, P.; Guo, Z.; Yang, J.; Wang, Q. CFD prediction of heat/mass transfer in multi-layer sintering process assisted with gaseous fuel injection. Int. Commun. Heat Mass Transfer. 2021, 128, 105654. [Google Scholar] [CrossRef]
- Liang, X.; Liu, X.J.; Xia, D. Numerical investigation of the gas–solid heat transfer characteristics of packed multi-size particles. Int. J. Heat Mass Transfer. 2020, 149, 119237. [Google Scholar] [CrossRef]
- Yang, W.; Choi, S.; Choi, E.S.; Ri, D.W.; Kim, S. Combustion characteristics in an iron ore sintering bed—Evaluation of fuel substitution. Combust. Flame 2006, 145, 447–463. [Google Scholar] [CrossRef]
- Shrestha, S.; Xu, J.; Yu, A.B.; Zhou, Z.Y. Numerical simulation of fuel layered distribution iron ore sintering technology. Ironmak. Steelmak. 2022, 49, 83–100. [Google Scholar] [CrossRef]
- Hou, P.; Choi, S.; Yang, W.; Choi, E.; Kang, H. Application of Intra-Particle Combustion Model for Iron Ore Sintering Bed. Mater. Sci. Appl. 2011, 2, 370–380. [Google Scholar] [CrossRef]
- Hou, P.; Choi, S.; Choi, E. Improved distribution of fuel particles in iron ore sintering process. Ironmak. Steelmak. Prod. Applications. 2011, 38, 379–385. [Google Scholar] [CrossRef]
- Pahlevaninezhad, M.; Davazdah Emami, M.; Panjepour, M. Identifying major zones of an iron ore sintering bed. Appl. Math. Modell. 2016, 40, 8475–8492. [Google Scholar] [CrossRef]
- Ohno, K.; Noda, K.; Nishioka, K.; Maeda, T.; Shimizu, M. Combustion Rate of Coke in Quasi-particle at Iron Ore Sintering Process. ISIJ Int. 2013, 53, 1588–1593. [Google Scholar] [CrossRef]
- Zhao, J.P.; Loo, C.E.; Dukino, R.D. Modelling fuel combustion in iron ore sintering. Combust. Flame 2015, 162, 1019–1034. [Google Scholar] [CrossRef]
- Dai, F.; Huang, X.; Fan, X.; Chen, X.; Gan, M.; Ji, Z.; Sun, Z.; Zhao, G. Mathematical modeling and distribution characteristics evaluation of fuel particles in iron ore sintering process. Adv. Powder Technol. 2022, 33, 103688. [Google Scholar] [CrossRef]
- Huang, Z.; Jiang, Y.; Mao, X.; Xu, B.; Guo, Y.; Jiang, T. Fuel appropriate distribution in iron ore sintering. J. Cent. South Univ. (Sci. Technol.) 2006, 37, 884–890. [Google Scholar] [CrossRef]
- Han, S.; Zhou, M.; Xia, T.; Liu, J.; Zhai, L.; Zhang, H. Study on Optimal Particle Size of Sintering Solid Fuels. Sinter. Pelletizing 2013, 38, 20–24 + 55. [Google Scholar] [CrossRef]
- Wang, Z.; Ruan, Z.; Zhu, M.; Xie, Y.; Chun, T. Influence of fuel characteristics on NO emission behavior in the burning process. Sinter. Pelletizing 2018, 43, 19–23. [Google Scholar] [CrossRef]
- Liu, T.; Zhang, Q.; Sheng, J.; Jiang, Y.; Wang, B.; Song, Y. Effect of fuel grain structure changes on sintering production. Sinter. Pelletizing 2020, 43, 5. [Google Scholar]
- Umadevi, T.; Deodhar, A.V.; Kumar, S.; Gururaj Prasad, C.S.; Ranjan, M. Influence of coke breeze particle size on quality of sinter. Ironmak. Steelmak. 2008, 35, 567–574. [Google Scholar] [CrossRef]
- Guan, X.; Liu, S. Particle swarm algorithm based on simulated annealing to solve constrained optimization. J. Jilin Univ. (Eng. Technol. Ed.) 2007, 37, 136–140. [Google Scholar] [CrossRef]
- Li, Y.; Wu, M.; Cao, W.; Lai, X.; Wang, C. PSO-BP Control Algorithm of Granulation Process Based on Evaluation and Optimization of Granularity Distribution. Acta Autom. Sin. 2012, 38, 1007. [Google Scholar] [CrossRef]
- Nath, N.K.; Mitra, K. Mathematical Modeling and Optimization of Two-Layer Sintering Process for Sinter Quality and Fuel Efficiency Using Genetic Algorithm. Mater. Manuf. Process. 2005, 20, 335–349. [Google Scholar] [CrossRef]
- Fan, X. Principle and Technology of Iron Ore Matching; Metallurgical Industry Press: Beijing, China, 2013. [Google Scholar]
- Fu, J.; Jiang, T. Sintering Pelletology; Central South University of Technology Press: Changsha, China, 1996. [Google Scholar]
- Chen, H.; Forbes, E.G.A.; Archer, J.; De Priall, O.; Allen, M.; Johnston, C.; Rooney, D. Production and characterization of granules from agricultural wastes and comparison of combustion and emission results with wood based fuels. Fuel 2019, 256, 115897. [Google Scholar] [CrossRef]
- Shen, X.; Chen, L.; Xia, S.; Qin, X.; Xie, Z. Iron ores matching analysis and optimization for iron-making system by taking energy consumption, COemission or cost minimization as the objective. Sci. China Technol. Sci. 2017, 60, 1625–1637. [Google Scholar] [CrossRef]
- Li, R. Foundation of Limited Volume Law; National Defense Industry Press: Beijing, China, 2005. [Google Scholar]


Disclaimer/Publisher’s Note: The statements, opinions and data contained in all publications are solely those of the individual author(s) and contributor(s) and not of MDPI and/or the editor(s). MDPI and/or the editor(s) disclaim responsibility for any injury to people or property resulting from any ideas, methods, instructions or products referred to in the content. |
© 2023 by the authors. Licensee MDPI, Basel, Switzerland. This article is an open access article distributed under the terms and conditions of the Creative Commons Attribution (CC BY) license (https://creativecommons.org/licenses/by/4.0/).