Article

A Model Linking Compressive Strength and Porosity in Ternary System: Metakaolin, Limestone, Cement

1
Omya AG, Froschackerstrasse 6, 4622 Egerkingen, Switzerland
2
Sika Technology AG, Tuffenwies 16, 8048 Zurich, Switzerland
*
Author to whom correspondence should be addressed.
Minerals 2023, 13(4), 454; https://doi.org/10.3390/min13040454
Submission received: 31 January 2023 / Revised: 28 February 2023 / Accepted: 16 March 2023 / Published: 23 March 2023
(This article belongs to the Special Issue Blended Cements Incorporating Calcined Clay and Limestone)

Abstract

:
The replacement of traditional cement with high clinker content should be achieved quickly to lower the carbon footprint of mortar and concrete. Cement is responsible for about 70% of the carbon footprint of cementitious materials. Current research suggests that the use of limestone and metakaolin or calcined clay could replace the current four gigatons of clinker produced. Here, binary systems composed of limestone/cement and metakaolin/cement are first studied to determine the individual impact of fine limestone and diverse fine metakaolins on the flow and compressive strength of the material. The flow properties are correlated with the surface areas of clinker and metakaolin and are almost independent of the limestone content. A model based on a linear relationship between compressive strength and porosity is used to estimate the reactivity of cement, limestone and metakaolin. An excellent correlation is obtained with the two binary systems and confirmed with the ternary systems using the same reactivity factors. The presented model allows the determination of the impact of each of the three components on compressive strength development. Limestone and metakaolin accelerate the hydration of clinker, leading to higher early strength, proportionally to their surface area. The reactivity of metakaolin is also found to be directly related to its mean size or surface area.

1. Introduction

Building operation and construction are responsible for 40% of direct and indirect greenhouse gas (GHG) emissions [1]. The type of building materials, as well as building designs, significantly impacts the energy needed and, consequently, the generation of carbon dioxide. Carbon footprint reduction in construction requires an improvement in the energy efficiency of the building and reduction in the quantity of carbon emissions associated with the materials used [2,3]. Material consumption in construction is estimated at 40 GT, which could double by 2050 [4]. This number can be analyzed with the share of the main materials used, as shown in Table 1. The primary construction material families are concrete, mortar, brick, steel, wood, plastic and aluminum, already accounting for 38 GT, more than 95% of the total construction materials. The global carbon footprint of these materials can be approximated in kg of CO2 generated per t of material produced, as shown in the second row of Table 1. These materials’ global carbon footprint can be estimated at about 10 GT [5]. Concrete and mortar represent almost 80% of the materials used but less than 45% of the total CO2 produced, as their carbon factor is relatively low compared to that of steel, plastic and aluminum, as shown in Table 1.
Wood and other renewable resources currently represent less than 5% of the total weight in the construction industry, meaning that replacing 95% of the current materials used in construction with wood, hemp and algae would not be possible. The quantity of construction waste represents less than 5% of the total volume required, with about 2 GT generated [9,10]. Either with recycling or renewable resources, the quantities are insufficient to replace all non-renewable raw materials. It is therefore necessary to limit the quantity needed and its carbon footprint, meaning having more with less!
It is necessary to improve the carbon footprint of concrete and mortar, which should be reduced by a factor of two before 2030 to reach the first step of the Paris climate agreement. There are several solutions to reduce the carbon footprint of concrete and mortar, such as the optimization of Portland cement (PC) production process with more efficient grinding, the use of alternative bio-based fuels, the use of low-carbon cement, such as calcium sulfoaluminate cement, or CO2 capture from cement kilns [11]. Another solution is to reduce the carbon footprint by replacing a portion of clinker with reactive supplementary cementitious materials (SCMs), mainly slag, activated clay, fly ash and silica fume, the quantities and approximate carbon footprints of which are shown in Table 2 [12]. As they are linked to the production of coal power plants or metals, slag, fly ash and silica fume are currently used at almost the maximum of their production, leading to serious shortage and a mean replacement capacity of about 30% for clinker [13].
The average carbon footprint of both concrete and mortar is 120 and 400 kg CO2/t of materials, respectively. Pure clinker is almost never used in mortar and concrete, and an average of 30% substitution is achieved with a series of SCMs [16]. The carbon footprint of each SCM is also not neutral, ranging from 50 kg CO2/t of material for natural material to 500 kg CO2/t for manufactured one [17]. Pure clinker has a carbon footprint of 800 kg CO2/t, whereas typical cement is around 650 kg/t. This reduction of about 22% was achieved a couple of decades ago with the growing diversity of cement types (CEM I to VI in Europe). GCC is not as reactive as other pozzolans (contributing to carboaluminate formation) but chiefly influences cement’s reactivity, as its surface acts as an active site for the nucleation and growth of cement hydration products [18]. One of the most recently developed cements is the so-called LC3 [19], further reducing the carbon footprint of pure clinker by 40%, as shown in Table 3. The reduction regarding typical cement is around 20%. Further reductions could be achieved by substituting more clinker with limestone/metakaolin.
Taking the example of concrete using 350 kg/m3 of cement made with an average 76% of clinker [20], 150 kg/m3 of water, 1900 kg/m3 of aggregates (sand, powders and coarse aggregate) and 2 L of plasticizer, we obtain an average carbon footprint of concrete of about 130 kg/t of concrete, as shown in Table 4.
Cement is responsible for about 70% of the total carbon footprint of concrete. The remaining 30% is due to the large amount of sand and aggregates used. The 50% clinker reduction target can be reached [22], and standard concrete could be formulated with it, reducing about 33% of the carbon. This substitution is achieved with a ternary system composed of clinker, ground calcium carbonate and either pozzolan [23] or slag [24], involving the addition of chemical admixtures.
The strength development of Portland cement is generated by the hydration processes, which mainly involve the formation of calcium silicate hydrate (C-S-H) and calcium hydroxide or portlandite Ca(OH)2. The hydration of Portland cement is mainly controlled by two phases, Tri-calcium Silicate C3S (3CaSiO2) and Di-calcium silicate C2S (2CaSiO2), leading to the complementary formation of calcium silicate hydrate (C3S2H4) and portlandite (CaOH2) at a volumetric ratio of about 4 to 1 [25]. Whereas C-S-H is responsible for strength, portlandite has a weaker strength contribution [26], and it is often responsible for durability issues, such as efflorescence. The addition or substitution of clinker with pozzolan materials, such as silica fume, fly ash or metakaolin, allows the chemical reaction with portlandite to contribute additional C-S-H and then increase the strength by up to 50% [27,28] with a better durability of the matrix [29]. The current quantity of SCMs needs to be increased, and the demand is much higher than the resources [30]. The resources available for fly ash, silica fume or slag are limited locally, as shown in Table 2, so that only metakaolin and locally available natural pozzolan can be used as sustainable SCMs. Metakaolin is the most promising SCM with a carbon footprint of about 300 kg/t, offering an excellent alternative binder to replace a large amount of clinker. Metakaolin is a dehydroxylated form of kaolinite clay, which has been used for decades as SCM to reduce the permeability and porosity [31], shrinkage, efflorescence, bleeding of water and alkali silica reaction and, at the same time, increase the chemical resistance and durability of concrete [32]. All these improvements are mainly due to the pozzolanic reaction resulting from the progressive consumption of calcium hydroxide by metakaolin. Depending on the size, metakaolin can act both as a physical and chemical filler. Physical nucleation sites and chemical pozzolanic reaction with portlandite [33] improve the material strength with formation of hydrates, such as C-S-H, Tetracalcium aluminate hydrate C4AH13, C3AH6, also called Katoite, or Stratlingite C2ASH8 [34]. After being hydrated for 28 days, the consumption of portlandite is proportional to the addition of metakaolin. The critical pore size decreased, and total porosity decreased as the incorporation of metakaolin increased [35]. This improvement in the structure’s density is the other reason for improving mortar strength [36,37].
The individual impacts of limestone and metakaolin on both rheological and mechanical properties should be well understood to optimize their contents and decrease the carbon footprint of mortar and concrete. Clinker substitutions with fine limestone, also called ground calcium carbonate (GCC), and diverse sources of metakaolin with different sizes, chemical reactivities and whiteness are performed in this study. Clinker substitution with limestone is first studied to quantify its impact on the flow properties and reactivity of clinker at different ages. Taking a linear relationship between compressive strength and material porosity as the hypothesis, a model is built to determine the reactivity factor of limestone and its interactions with the hydration of clinker. In a similar way, the impact of the flow properties is studied with the substitutions of metakaolins with different physical properties. The equivalent cement concentration is first used to compare the reactivity of different metakaolins and link them with their mean particle size. The same linear relationship between compressive strength and porosity is used to quantify the reactivity of metakaolins and study their interaction with clinker. The ternary system composed of cement/GGC/metakaolin is finally analyzed by implementing the results obtained with the binary systems. The impact on the flow properties is studied in terms of the surface area of clinker and metakaolin. The same linear relationship between compressive strength and porosity is used to estimate each component’s reactivity, as well as their mutual interactions and the impact of the addition of fine particles on the reactivities of cement and metakaolin.

2. Materials and Methods

2.1. Materials

The cement used is from Holcim, CEM I 52,5 N, certified by the norm SN EN 197-1 [38]. The fine ground calcium carbonate (GCC) is from Omya, Betocarb UF OM (Omya SAS, Omey, France), with 97.6% of calcium carbonate, a mean size of 0.9 µm with a corresponding calculated surface area of 8 m2/g and a density of 2700 kg/m3. Non-commercial water reducing admixture (polycarboxylate superplasticizer) was used. The sand used is the CEN Standard Sand in a size range from 0.08 to 2.00 mm with a maximum moisture content of 0.2%. Some of the physical and chemical properties of the metakaolin used in this work are summarized in Table 5. A series of six metakaolins named M1 to M6, classified as a CLASS N pozzolan under ASTM C-618, with different whiteness, size, surface area, Chapelle test and density, as listed in Table 5, are used in this study. The Chapelle test values extracted from the data sheet allow the quantification of portlandite fixed by the metakaolin sample and thus indirectly provide a quantification of metakaolin reactivity [39]. The powders have a Hunter L whiteness value in between 66 and 96%, with 0% denoting black powder and 100% denoting maximum whiteness, which mostly depends on the oxidation state of the iron oxide present in the original clay [40]. They have different specific gravities ranging from 2200 to 2600 kg/m3, specific surface areas from 14 to 2 m2/g and average particle sizes ( d 50 ) from 1.3 to 8 µm.

2.2. Test Methods

Mortar prisms for compressive strength testing are produced with a mixture of 450 g cement, 225 g water and 1350 g sand according to the EN 196-1:2016 standard [41]. Variations in the quantity of cement (CEM), sand (S) and water (W) are attained with the addition of metakaolin (MK) and GCC (L). The concentrations of the different components are given in weight percentage, so that S + CEM + L+ MK + W = 1. The consistency of the mortar is measured on the flow table following the EN 1015 standard [42]. Depending on the consistency, either a series of 10, 13 and 16 strokes or none is applied to fresh mortar. The density of each series of samples is measured with the ratio between the sample mass and its volume. The mortars’ compressive strengths are measured on prisms with standard dimensions of 4 × 4 × 16 cm. The prisms are stored in a chamber with controlled curing conditions of 68% relative humidity and 23 °C before testing the compressive strength evaluated in conformity with EN 196-1:2016 [41] at 1, 7, 28 and 90 days.

2.3. Mix Designs

The first binary system is composed of a mix of clinker with fine GCC. A series of 16 formulations, presented in Table 6, with four different substitutions of clinker with GCC and four different water-to-cement ratios were prepared to study the impact of fine GCC addition on the flow. The powders are mixed with water for 3 min with a Hobart mixer before being tested in the flow table tests performed at 10, 13 and 16 strokes. The paste is then poured in the 40 × 40 × 160 mm prisms. The compressive strengths are measured on all prisms at 1 and 28 days, and on half of them, at 7 and 90 days.
The binary system composed of clinker with diverse concentrations of one of the six different metakaolins was performed to study the impact of the type and content of metakaolin on rheological and compressive strengths. The formulations used along with the measured flow, density and compressive strength at 7 and 28 days are presented in Table 7. Cement is substituted from 10 to 50% with different metakaolins at different water ratios to study their impact on the flow and strength.
As the final system, the ternary blend of cement/GCC and metakaolin was examined with a series of tests listed in Table 8. In all the MX-X tests, the water, cement and GCC content was kept constant with variations of metakaolin concentration and type in sand replacement. One series of measurements were performed without metakaolin at different water-to-cement ratios with and without GCC (C1-1 to C1-6). The content of metakaolin is much lower than that in the former binary system, as part of the reactivity is compensated by the addition of fine GCC.

2.4. Calculated Surface Area

The surface areas of clinker S C , GCC S L and metakaolin S M K are calculated from their mean particle diameters ( d 50 ) and densities D with the following equation:
S = 4 π d 50 2 2 4 / 3 π d 50 2 3 D
We are not considering the surface of sand, which is negligible compared to the other surface areas.

2.5. Reactivity Factor

The final strength of the resulting mortar can quantify the impact quantification of the substitution of GCC and metakaolin. The concept of the equivalent cement ratio is a way of quantifying the reactivity of SCMs. The compressive strength evolution as a function of the water-to-cement ratio demonstrates that adding ground calcium carbonate and metakaolin increases the strength even at the same w/c ratio. Limestone is not reacting significantly but represents a nucleation surface for the precipitation of C-S-H, the main hydration product responsible for strength. The aluminum content in metakaolin influences limestone reactivity, resulting in the formation of hemi- and mono-carboaluminate CO3–AFM [43]. It is therefore common to represent the evolution of compressive strength by considering the cement equivalent factor (CEF) or concentration [Ceq], which can be attributed to any physical performance, such as workability or strength [44]. The cement equivalent factor reflects the strength contribution of SCMs with an equivalent weight of Portland cement [45,46]. The cement equivalent factor can be written as a function of cement concentration [C] with a ratio of GCC concentrations [L] and metakaolin [K] pondered with the corresponding reactivity factor XL and XK, as shown in Equation (2):
[Ceq] = [C] + XL[L] + XK[K]
The two factors XL and XK are determined experimentally with the superposition of compressive strength into a master curve by a minimization routine. The analysis of the results determined the reactivity factor, which is also the cement substituting factor equal to 1 when complete. As this analysis is performed with mass, the lower density metakaolin and GCC already reduced porosity and hence boosted the strength of the binary systems, as their density is lower than clinker.

2.6. Link between Porosity and Strength

The second model used in this paper links the calculated porosity with mortar strength. Several models, reviewed by Rössler et al. [47], link compressive strength evolution and material porosity. Such models are also used for foamed concrete, giving a general relation to compressive strength and material porosity [48]. Among all the equations, a simple one by Hasselman creates a linear relationship between compressive strength σ and matrix porosity ϕ :
σ = σ 0 1 ϕ ϕ m
where σ 0 is the maximum compressive strength at zero porosity, and ϕ m is the critical porosity where the compressive strength is first non-zero. This equation is suitable for strengths higher than 5 MPa and consequently applicable for most concretes, mortars and pastes [49]. A graphical representation of Equation (3) is given in Figure 1. The value of critical porosity mainly depends on the powder’s nature, and the maximum strength at zero porosity depends on the strength of the aggregates or sand. The formation of hydrates reduces porosity simultaneously rather than increasing material strength. The linear evolution of compressive strength with paste porosity allows an indirect determination of porosity, and then, of the different components’ reactivity.
The maximum strength and critical porosities are determined from the experimental data of the compressive strength measured here: 130 MPa and 51% for the paste. The values of the critical porosity of concrete and mortar are much lower. Porosity is estimated with the quantity of water left and air contained in the sample. In this way, we are ignoring the empty porosity created via chemical shrinkage from the hydration reactions, which would be a refinement of this model. Air quantity is directly calculated from the density difference between the theoretical density of the sample and the measured one. Water left in the sample is calculated by considering its partial consumption due to hydrates’ formation due to the reactivity of clinker, GCC and metakaolin. The resulting porosity ϕ of the constitutive paste of the mortar can be calculated with Equation (4), where   V W is the volume of water and liquid admixture, V A is the volume of air, V T is the total volume of the paste, M c and M k are the mass fraction of clinker and metakaolin, respectively:
ϕ t =   V W + V A n t + l t + k t M c m t M k V T
Considering only the matrix composed of powder and water, sand is not considered when calculating porosity. Water consumption due to clinker and metakaolin hydration is proportional to their mass with factors n t and m t . These two factors are proportional to binder reactivity, which depends on time. Finally, metakaolin and GCC also contribute to clinker hydration, acting as seeding agents [21,32], increasing water consumption due to the acceleration of hydrate formation. Their impacts on porosity are taken into consideration with two factors l t and k t , decoupling the natural hydration of clinker from its acceleration due to the seeding effect of SCMs.
In this work, the critical porosity ϕ m is different for GCC, which has no pozzolan activity, and clinker and metakaolin. During the cement hydration processes, the material changes from liquid to paste to porous solid, and the interaction between the particles drives these transitions. As an extension of Equation (2), Equation (5) considers that the three types of particles participating in the paste have the same maximum compressive strengths σ 0 but different critical porosities ϕ m C for clinker and metakaolin and ϕ m L for GCC:
σ t = σ 0 M C + M k 1 ϕ t ϕ m C + M L 1 ϕ t ϕ m L
where M C , M L and M k are the mass fraction of clinker, GCC and metakaolin. ϕ m C , ϕ m L and σ 0 are taken as the constant with values of 51%, 61% and 130 MPa for all calculations presented in this work. The different masses M C , M L , M k ,   V W ,   V T are the variables, depending on the formulations.   V A is calculated from the difference between the systems’ theoretical density and the measured one. Only n t , m t , l t and k t are taken into account in this study, depending on the estimated reactivity of clinker and metakaolin and acceleration due to the seeding effect of GCC particles at a given time.

3. Results

The impact of the addition of fine GCC and metakaolin on the flow properties and strength evolution is first studied individually with clinker. This binary clinker/GCC system allows the determination of factors n t and l t of Equation (4). The impact of fine GCC on water demand and flow properties is also studied with this first binary system. The second binary system involves the substitution of clinker with different metakaolins, which allows a determination of the chemical activity of each metakaolin and its acceleration impact on clinker from the strength measurement. The water and superplasticizer demands are used to determine the theoretical surface area of metakaolin responsible for the modification of rheological properties. Finally, the ternary system composed of clinker, metakaolin and GCC is examined to study the impact of GCC on the reactivity of the mix of metakaolin with clinker.

3.1. Binary Clinker/GCC System

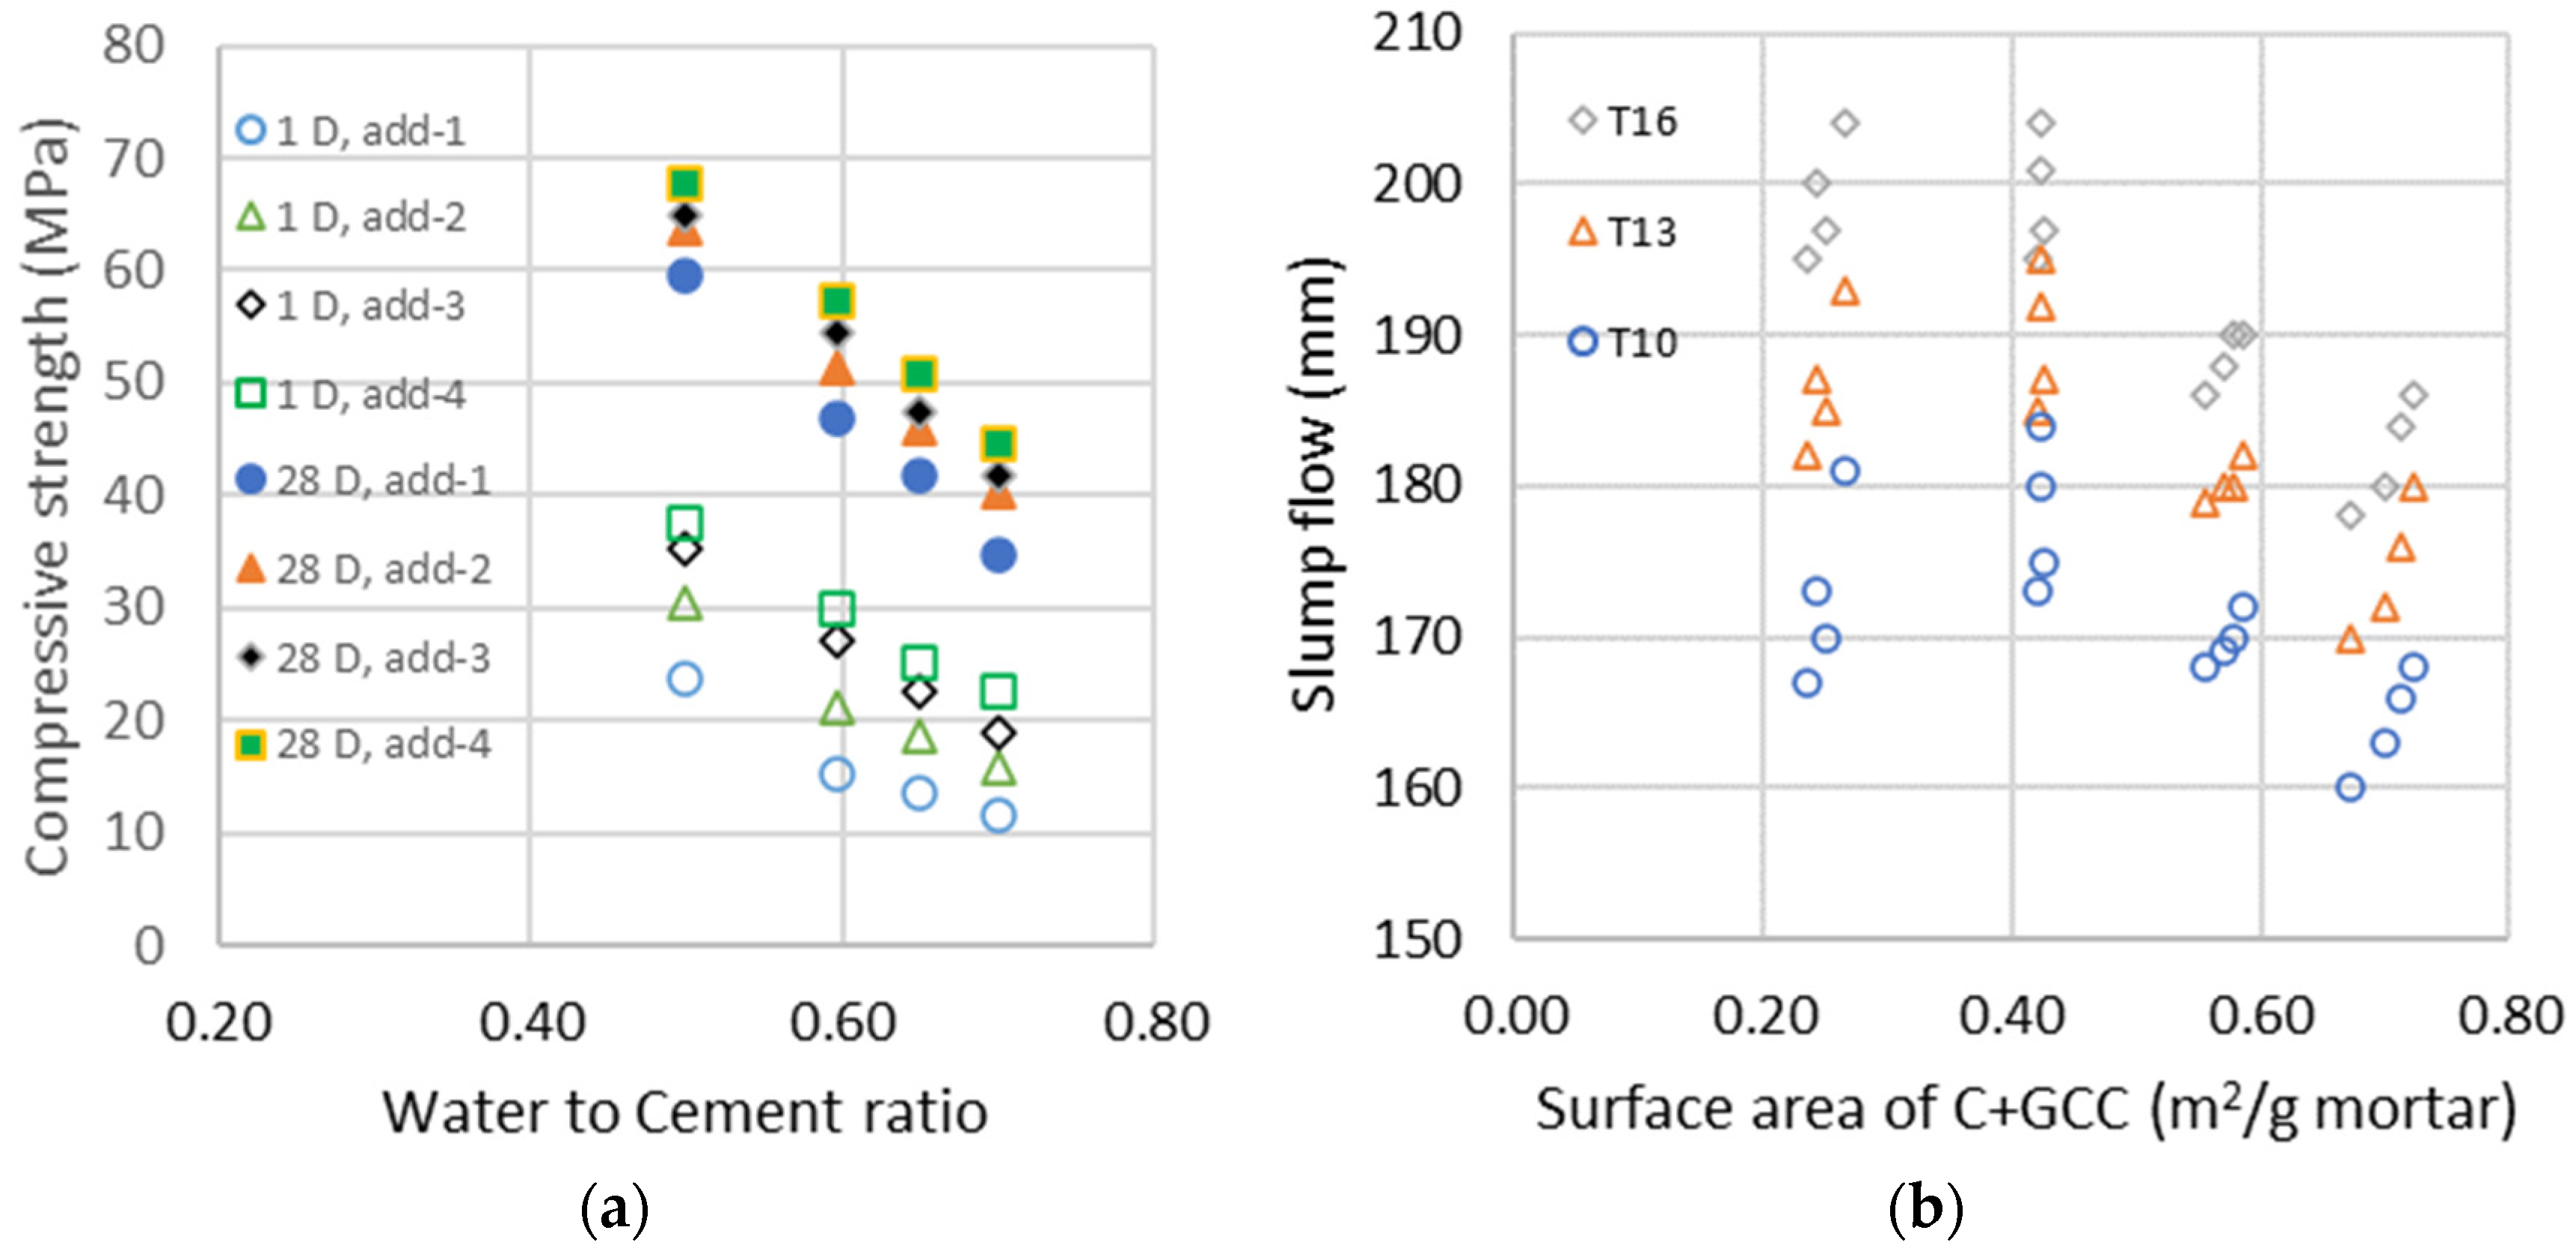
The evolutions of compressive strengths at 1 and 28 days as a function of the water-to-cement ratio for the four different additions of GCC are represented in the left graphic of Figure 2. The addition of fine GCC increases compressive strength due to the seeding acceleration of the hydration process [50] and a significant reduction in system porosity due to the replacement of clinker with lower density limestone powder, as can be seen in the initial porosity calculated. The seeding acceleration of fine GCC is in the same range for all water-to-cement ratios studied and has a high impact on early strength up to 28 days, but a lower impact is seen at 90 days, as the hydration process is almost complete. These results are similar to those found in the literature [51,52], where fine limestone doubles hydration at 1 day and increases it by 25 to 20% at 7 and 28 days. The flow properties in the right graphic of Figure 2 are a function of the calculated mean surface area S A , which is a function of the calculated surface area from Equation (1) of cement S C and GCC S L : S A = M C S C + M L S L . We can see a fluidifying effect in all w/c, and GCC particles have no flocculating effect on clinker particles. With a surface area almost ten times higher than clinker, adding fine GCC requires less or the same amount of water to obtain the same consistency. Fine limestones fill the gaps in the size distribution of the particles and then increase the compactness and decrease the viscosity. Generally, the yield stress decreases [53] or stays the same with higher limestone addition, while plastic viscosity drops [54] or does not change [55]. The addition of a limestone filler within a certain range did not affect fluidity [56].
The acceleration of fine GCC in hydrates’ formation is quantified with factor l t , which is a function of the ratio between the clinker and GCC concentration, as shown in Equation (6):
l t = A t M c M l
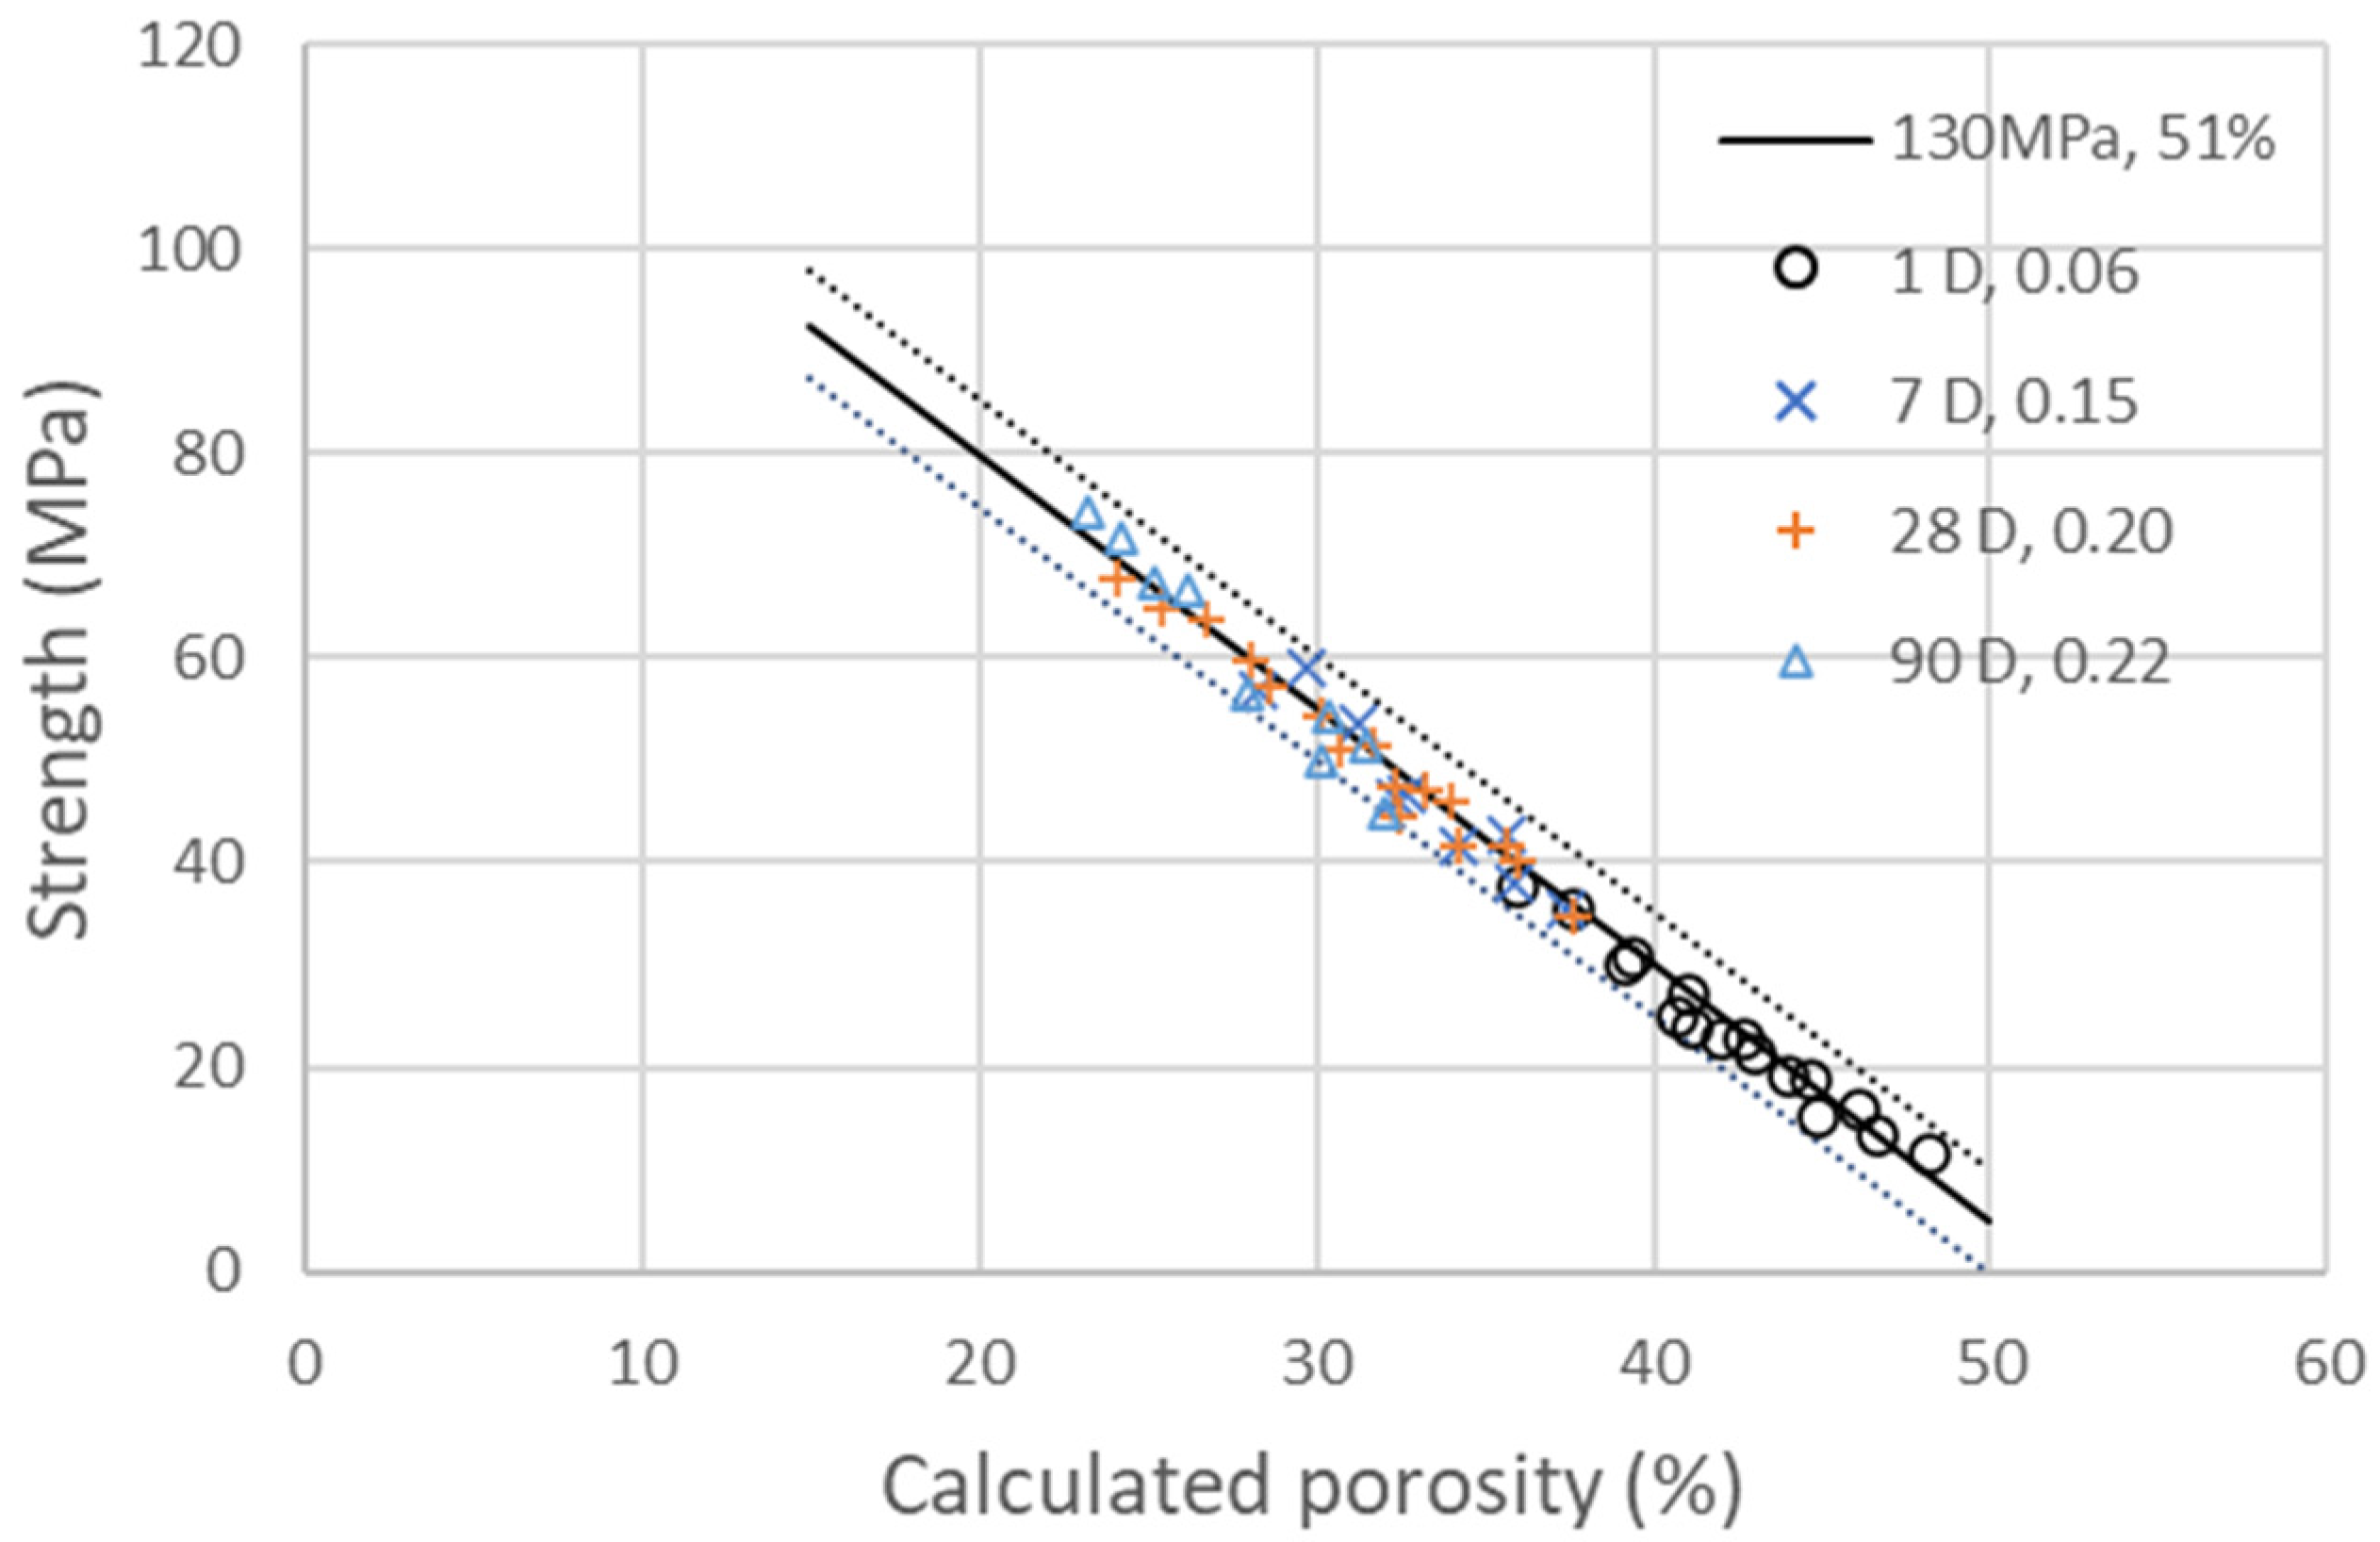
with A t as the coefficient of activity of GCC, which is found to be 0.05 at 1, 7 and 28 days and 0.01 at 90 days in the experimental data. The coefficient n t is equal to 0.06, 0.16, 0.2, 0.22, corresponding to a degree of hydration of 25, 62, 82 and 91% at 1, 7, 28 and 90 days, respectively [13]. With those values, a decent correlation with an interval of confidence of less than ±4% in between the compressive strengths measured at 1, 7, 28 and 90 days and the calculated porosity is found, as shown in Figure 3. GCC fine particles act as seeding accelerators, doubling the hydration at 1 day and increasing it by 25 to 20% at 7 and 28 days.

3.2. Binary Clinker/Metakaolin System

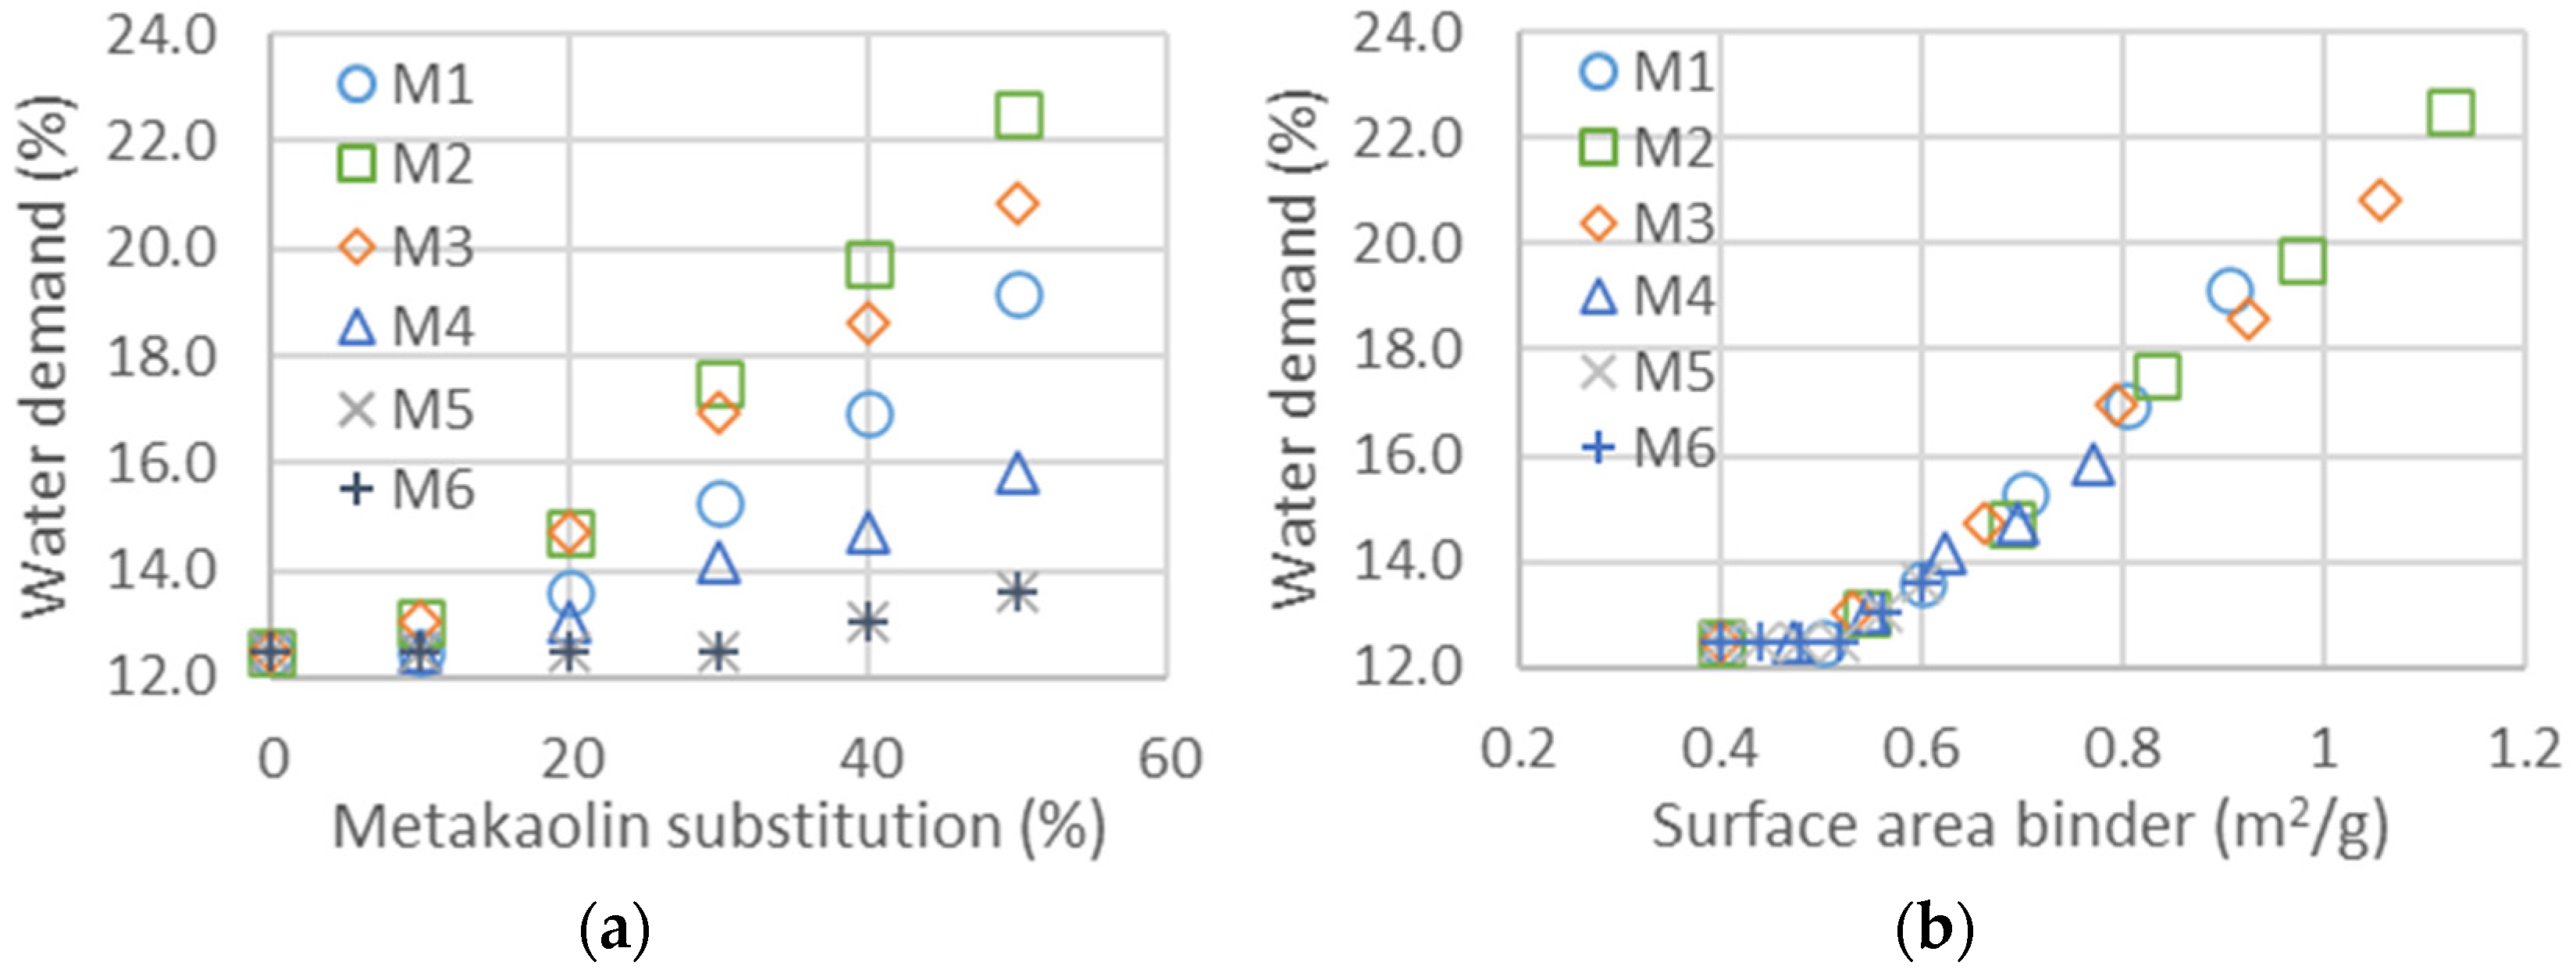
The impact of metakaolin on the slump flow and compressive strength is studied in this part from the values in Table 7. The evolution of water added to maintain the same flow properties in the shock table is represented in Figure 4a for all metakaolin types and as a function of cement substitution as a percentage. The type of metakaolin significantly impacts water demand [57]: with a maximum cement substitution of 50%, the extra water demand ranges from less than 2% to more than 10%. Contrary to the addition of fine GCC, which had a limited impact on rheological properties, the addition of metakaolin increased the flocculation and required more water to keep the mortar flow properties constant, indirectly measured with the slump flow [58,59]. If the flocculation is proportional to the surface area of the metakaolin S M K added, the evolution of water demand should be on a master curve as a function of the total surface area of the mix of metakaolin and cement, following the equation: S A = M C S C + M M K S M K . Figure 4b is obtained through the estimation of the binder surface area, composed of the diverse metakaolins and clinker. The clinker surface area S C is equal to 0.4 m2/g, and those of the metakaolins are estimated with the constitution of master curves. The values of the surface areas of all metakaolins obtained from the shifts in Figure 4b,f are listed in Table 9. The mean particle size and D_flow (water demand), calculated from Equation (1), obtained for metakaolins M1, M2, M3 and M5 are well correlated, whereas those obtained from rheological measurements are much smaller for M4 and M6. This could be explained, since the particles are agglomerated before being mixed in the mortar and dispersed into smaller particles, leading to a larger surface area after the mixing procedure. The surface area calculated from the mean size of the particles is much smaller—a factor of 10 less than the measurements given in the data sheet—meaning that the surface Blaine measured is not characteristic for the rheological properties.
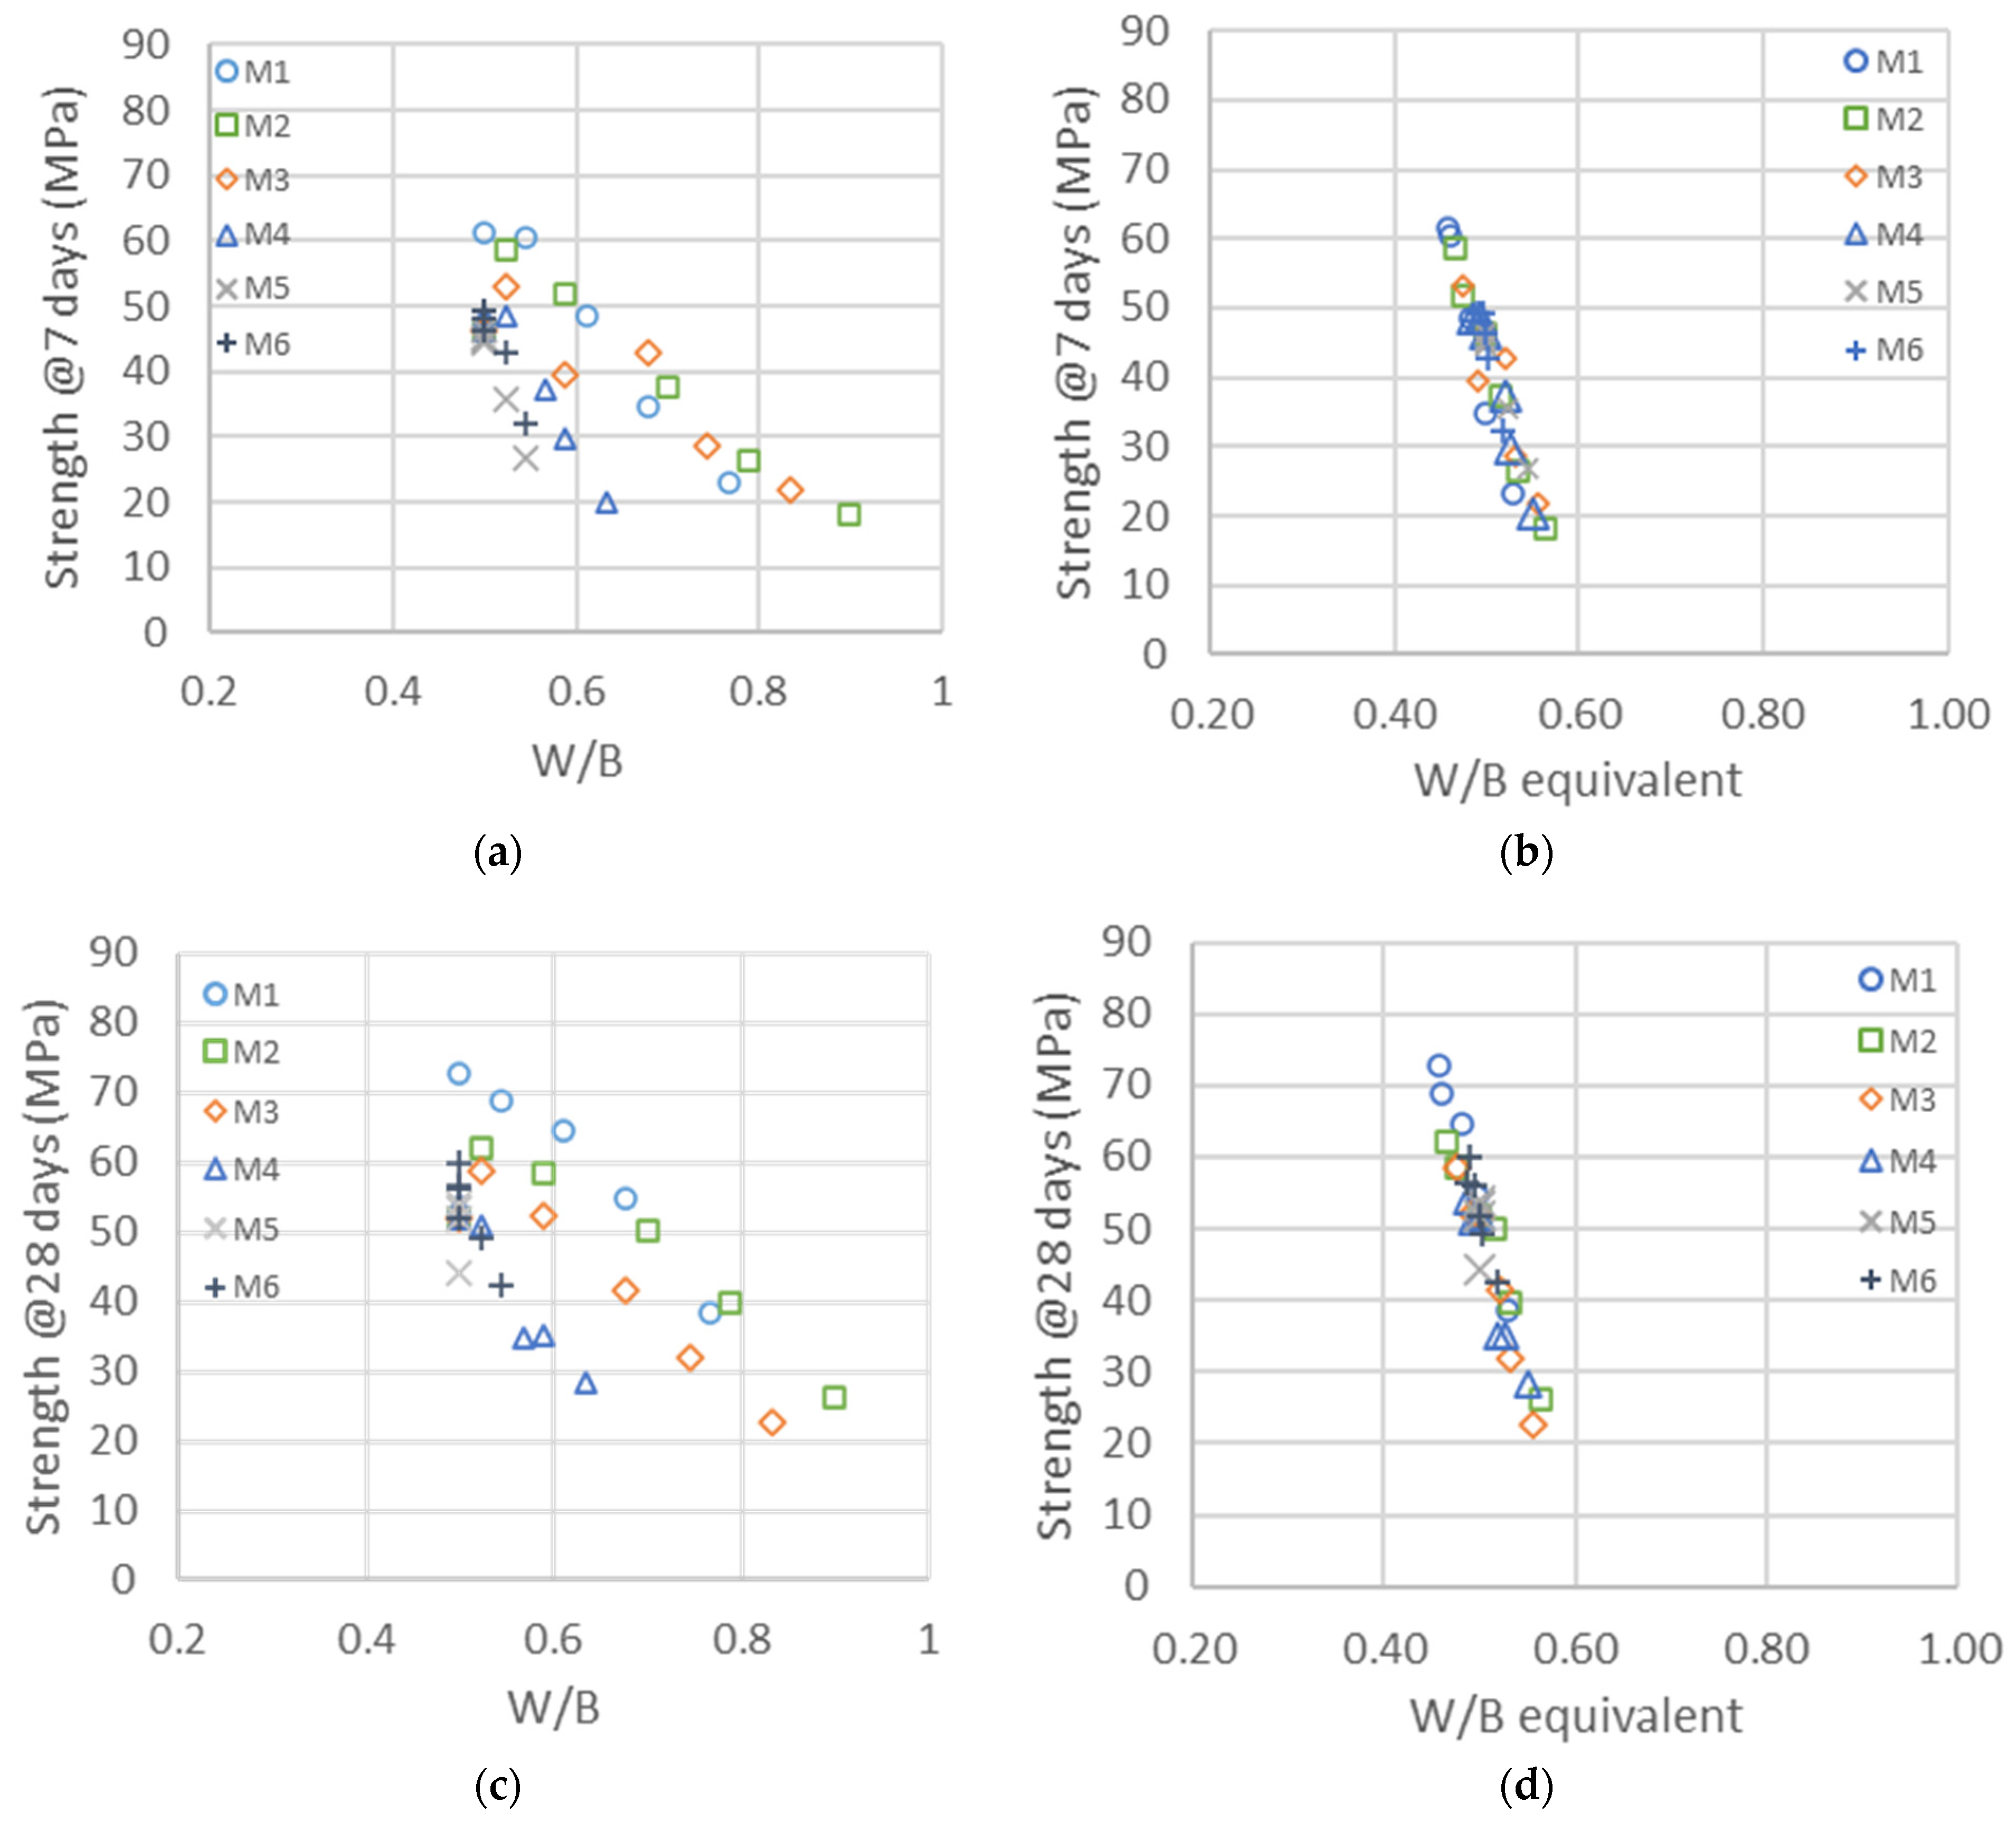
The compressive strengths at 7 and 28 days are represented in the left graphics of Figure 5a,c as a function of the water-to-binder ratio, where the binder is the sum of cement and metakaolin content. The impact of metakaolin on compressive strength highly depends on the particles’ size and structure, whereas the larger metakaolins M4, M5 and M6 are substituted one to one for cement up to 30%; the finest M1, M2 and M3 lead to larger strengths and have a higher impact than cement on strength development [57]. As a first quantitative analysis of the reactivity of metakaolin, a horizontal shift of the curves was calculated, following Equation (2), in order to estimate the reactivity factor X k . The resulting master curves are represented in the right graphics of Figure 5b,d. The X k for the binary system given in the first row of Table 10 clearly demonstrates the impact of metakaolins’ size on their reactivity, which is in the range of a factor of two, in contrast with the smaller to larger particles. An X k value of one means that metakaolin is replacing the cement one to one, whereas a factor of two means that we need half as much metakaolin to replace the cement to obtain the same strength. These factors are the values for all substitutions of cement with metakaolin, ranging from 10 to 50%.
The reactivity factors X k are the same at 7 and 28 days, meaning that the shifts used in the two right graphics in Figure 5 are the same and that the impacts of the different metakaolins on strength at 7 and 28 days are in the same range.
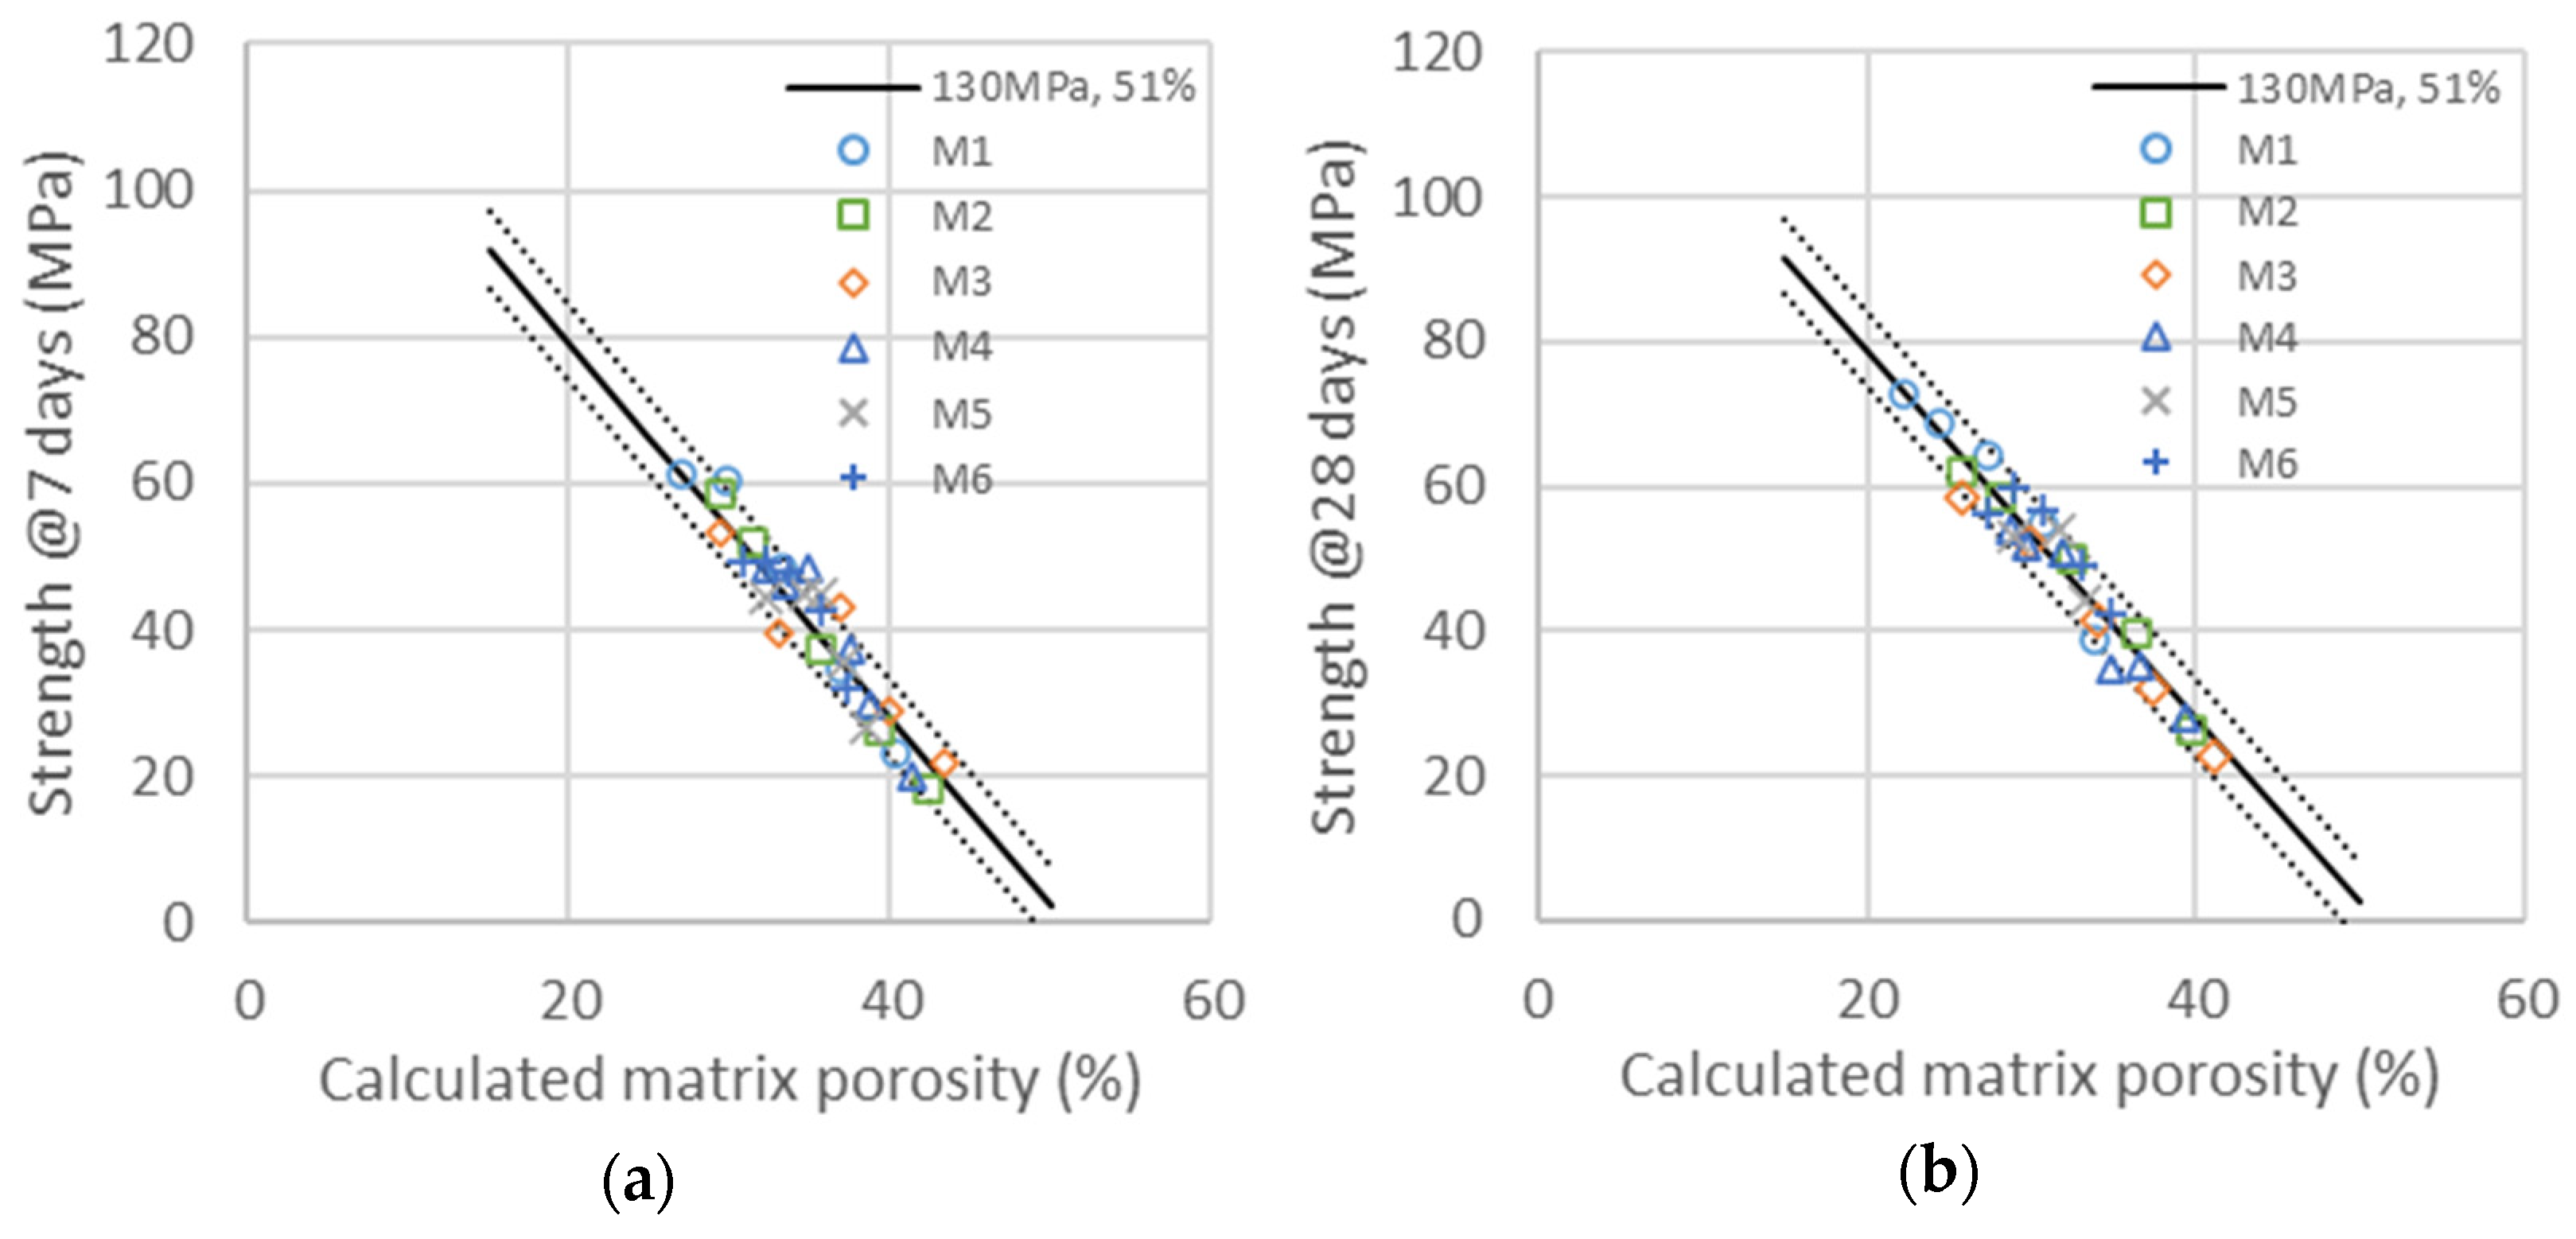
Compressive strength evolution as a function of the calculated porosity is obtained with the same factor n ( t ) as those obtained in the binary system of GCC and cement. Compressive strengths as a function of the calculated porosity for the binary system of cement with metakaolin at 7 and 28 days are represented in the graphics of Figure 6. The master curves obtained with the determination of reactivity factors n t , m t and k t are all in the range of ±4% confidence in the same evolution of strength as a function of porosity as that used in the binary system of cement/GCC. The activity factor n ( t ) is the same as those obtained in the binary system of GCC and cement (0.16 at 7 days and 0.2 at 28 days). It is therefore independent of the type and concentration of metakaolin. The values of the m t and k t activation factors are obtained with the best superposition of the series given in Table 10. Whereas the values of m(t) depend on age and metakaolin type, the value of k t , meaning the acceleration effect of metakaolin on cement hydration, is found to be the same at 7 and 28 days. This would imply that acceleration only depends on metakaolin type. This result is similar to those obtained with GCC, accelerating cement hydration at 7 and 28 days by the same amplitude. Metakaolin acceleration depends on the mean particle size, which is higher for smaller particles. The direct reactivity of metakaolin, quantified with factor m(t), strongly depends on particle size but also slightly on the chemical nature and density of metakaolin. The reactivity of metakaolin can reach or even exceed the reactivity of cement (M1), also mainly depending on the mean particle size. The fact that metakaolin particles have the same or higher reactivity than cement, as quantified with the shifts proceeding in compressive strength as a function of the water-to-binder ratio, can be explained, as they are chemically active and accelerate cement hydration at the same time.
In the same way as fine GCC, we obtain an acceleration of clinker hydration on the surface of metakaolin, so that, as for Equation (6), we can express factor k t as a function of the ratio between the clinker and metakaolin concentration, as shown in Equation (7):
k t = B t M k M c
where B t is the coefficient of activity of metakaolin, which depends on its chemical and physical properties. The values of B t obtained for each metakaolin are given in Table 10. The values should be compared to the one obtained with fine GCC, of about 0.05, so either in the same range (M5) or up to 8 times smaller than for metakaolins M1, M2, M3. This difference can be explained in terms of chemical reactivity of the surfaces of metakaolins, which are like C-S-H nanoparticles, and thus much more reactive as nucleation sites [60]. The ultrafine mineral additives have a direct impact on early age hydration, accelerating the chemical activities of clinker and metakaolin toward pozzolanic reaction and leading to a denser microstructure and higher final strength [61,62].
The representation of strength as a function of the calculated porosity is a way of splitting the chemicals’ contribution to metakaolins’ physical acceleration of cement hydration.

3.3. Cement/GCC/Metakaolin Ternary System

In the ternary system composed of different ratios of clinker, fine GCC and metakaolin, as shown in Table 8, the concentration of the superplasticizer was adapted in each mix to maintain a constant flow in the range of 355 to 400 mm, which corresponds to self-leveling mortar. In a similar way as in the binary system with water dosage, the superplasticizer concentration is represented as a function of the total percentage content of metakaolin and cement. The graphics in Figure 7 demonstrate that the dosage of superplasticizer does not depend on the total content of the binder but rather on its surface area. The surface area is the same as in the binary system, calculated from the mean particle size of cement and with addition of diverse metakaolins, as listed in Table 9. The conclusion is the same as for the binary system, where the flocculation is controlled by the mean surface area S A of each binder, as calculated in Equation (1): S A = M C S C + M M K S M K . The obtained values of the surface area are similar to those obtained with water demand, leading to the same mean particles, as can be seen in the results of Table 9. These results lead to the conclusion that the superplasticizer has the same absorbing potential on cement as on metakaolin surfaces. As the specific surface of metakaolin is higher than the cement particles, the demand for polymer is thus increased with increased replacement with metakaolin.
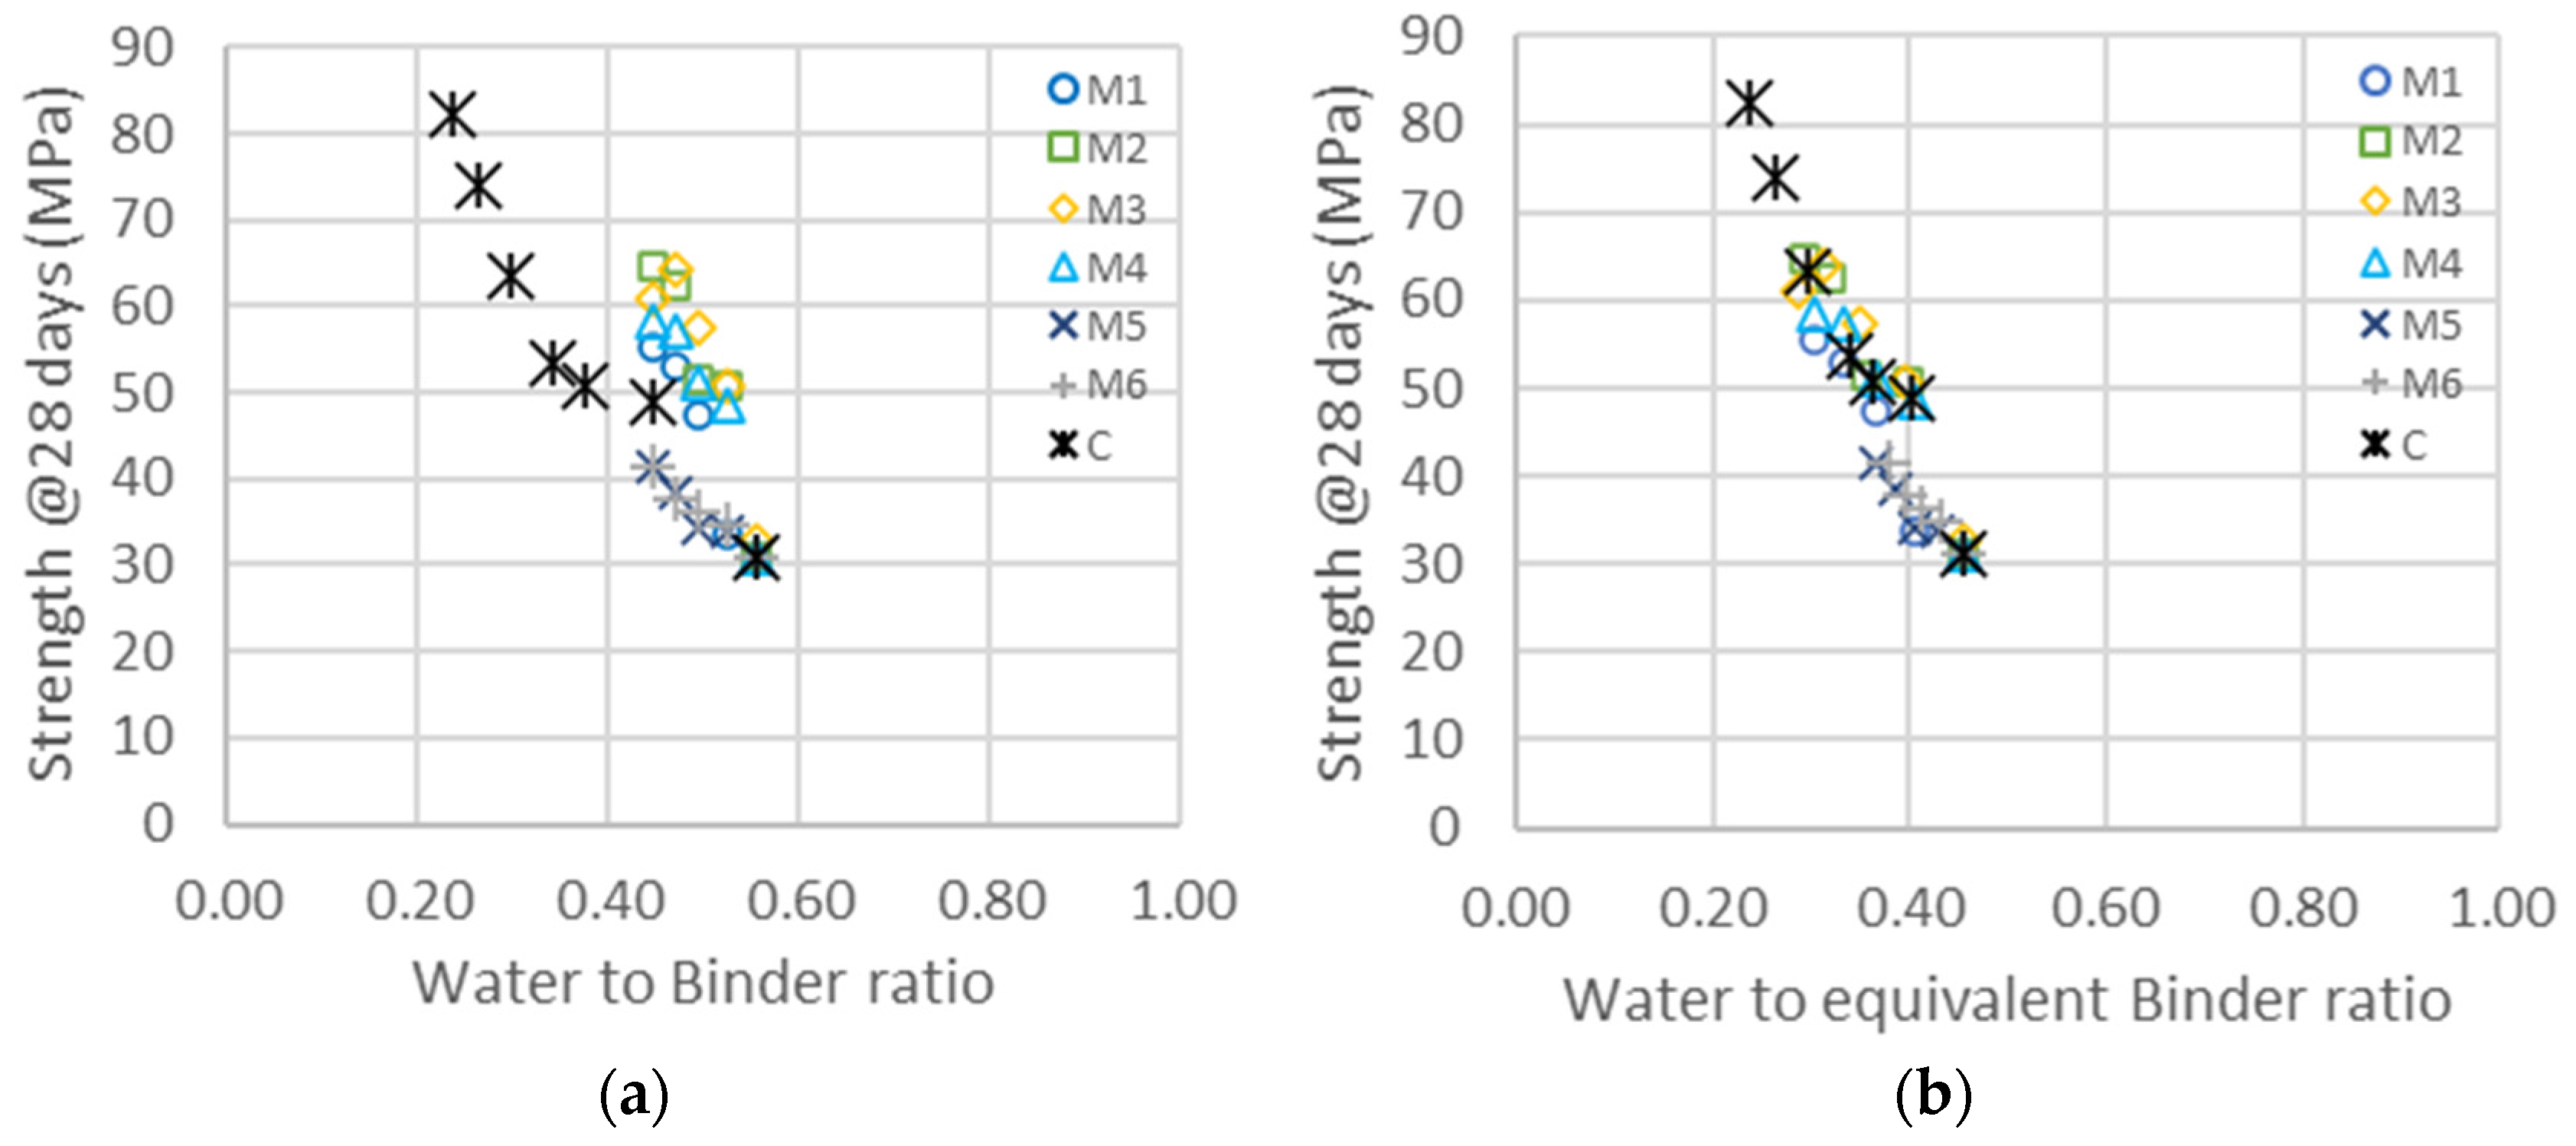
The evolutions of compressive strengths as a function of the water-to-binder ratio and equivalent binder-to-water ratio are represented in Figure 8. In a similar way as in Figure 5, the construction of master curves allows a determination of the activity factors X k given in Table 11. Fine GCC has an impact on the shift factor, which is not taken into account here. The apparent X l factor should be around 0.3 according to the analysis of the binary system of GGC/cement, but as fine GCC does not hydrate but rather primarily accelerates the kinetics, this factor has no real physical meaning.
The activity factors X k of the ternary system are higher than those obtained in the binary system. In the case of M1 and M3, the increase is significant, but it is much larger in the case of M4, where the factor almost doubles from 1.3 to 2.5. The surface area of M4, determined from rheological measurements, is also higher with the addition of the superplasticizer, which may be explained with an increase in the dispersion of particles, leading to fewer agglomerates and more surface available for hydration and acceleration. The mean sizes of the M4 particles therefore decrease from 1.9 to 1.5 µ m , as shown in Table 9, and in the same range as for M2.
X k n   28   d m   28   d The compressive strength evolution as a function of the calculated porosity for the ternary system is given in Figure 9. Once again, the experimental points are all in the range of ±4% outside C1-6, which is the mix of cement with a w/c of only 0.24. The low water concentration of the sample, with the additional impact of water evaporation during sample curing, may justify a lower hydration than expected, meaning that the activity factor n 28   d could be lower than in the other samples. The cement n t activity factor is similar to the two binary systems, with a value of 0.2 at 28 days. The other two factors k t and l t are also similar to those obtained in the binary system. The activity factor m t given in Table 11 is therefore the only one adapted for each metakaolin to obtain the master curve in Figure 9. Except for M1, which has a lower coefficient of activity, all metakaolins have similar or higher activity in the presence of fine GCC. A more significant improvement was obtained with M4 in correlation with the increase in the specific surface area obtained with the addition of the superplasticizer. The introduction of fine GCC impacts both the hydration of cement and metakaolin, accelerating and involving a reduction in porosity, with the resulting increase in strength. In the same way that fine GCC accelerates the hydration of cement, it also accelerates the pozzolanic reaction, involving an increase in the reactivity index m(t). Additionally, the cement’s acceleration reaches a limit by adding a large quantity of fine GCC, meaning that the synergy is optimal for a given ratio of cement/GCC/metakaolin.

4. Conclusions

The improvement of the carbon footprint of mortar and concrete required the substitution of clinker with SCMs. In order to optimize the substitution, it is important to understand the impact of the substitution on the flow properties and compressive strength. The impact of the substitution of cement with fine ground calcium carbonate and metakaolin in binary and ternary systems was studied in this work. Fine GCC has a limited impact on rheological properties, whereas metakaolin modifies these properties proportionally to their surface area. Determining the equivalent surface area based on water demand or the superplasticizer dosage required leads to values much smaller than the one obtained with the Blaine measurement, but it is also more characteristic of their reactivity. Fine GCC has a limited impact on the flow properties and does not require more water or more superplasticizer for a given slump flow, whereas the water and superplasticizer demand of metakaolin is directly proportional to its surface area.
Fine GCC acts as a seeding accelerator for both clinker and metakaolin, directly proportional to their surface area. Based on the hypothesis of a linear relationship between compressive strength and material porosity, it was possible to quantify the reactivity factors of fine GCC. Fine GCC accelerates the clinker and metakaolin hydration, increasing early age compressive strength up to 28 days and exerting a limited impact on strength at 90 days. The reactivity of the different metakaolins studied in terms of equivalent binders demonstrated that all metakaolins have a similar or higher reactivity than clinker, increasing the compressive strength. The lower density of metakaolin contributes to this increase, as well as its size: the finer the metakaolin, the higher its impact on strength development. The increase in strength up to 28 days is also due to the seeding impact of metakaolin on clinker hydration. In a similar way to fine GCC, metakaolin acts as a nucleation site, which accelerates the process of dissolution/precipitation occurring during clinker hydration. These phenomena explain the impact of metakaolin on strength development, acting both as a chemical binder and physical accelerator for clinker. The analysis of compressive strength as a linear function of porosity was used to split the chemical reactivity of metakaolin via reactivity factor m t from the physical acceleration with factor k t of Equation (4). Reactivity factors are mainly proportional to the surface area and therefore to the mean size of particles. Adding fine GCC similarly accelerates metakaolin hydration for clinker. This work demonstrates that the synergy effect of fine ground calcium carbonate and metakaolin can be deduced from the rheological point of view, with the limited impact of fine GCC on water and superplasticizer demand and the physical acceleration of the cement and metakaolin hydration processes with the addition of extra surface provided by both fine GCC and metakaolin. Metakaolin acts as a chemical binder and accelerator for clinker, leading to a decrease in porosity and an improvement in compressive strength at an early age. The proposed model demonstrates the importance of the surface area of SCMs for either highly chemically active substances, such as metakaolin, or for less chemically active substances, such as fine GCC. The finer the SCM, the higher its impact on compressive strength and, as a consequence, its clinker substitution capacity. It is possible to further increase the substitution of clinker and therefore decrease the carbon footprint of the most used construction materials by reducing the materials’ porosity with a combination of fine GCC and fine metakaolin.

Author Contributions

Conceptualization, D.L. and P.G.; methodology, P.G.; validation, D.L. and P.G.; formal analysis, D.L.; investigation, P.G.; resources, P.G.; writing—original draft preparation, D.L.; writing—review and editing, D.L. and P.G.; visualization, D.L.; supervision, D.L.; project administration, P.G. All authors have read and agreed to the published version of the manuscript.

Funding

This research received no external funding.

Conflicts of Interest

The authors declare no conflict of interest.

References

  1. IEA International Energy Agency. Buildings—A Source of Enormous Untapped Efficiency Potential. 2021. Available online: https://www.iea.org/topics/buildings (accessed on 1 January 2023).
  2. Shi, C.; Jiménez, A.F.; Palomo, A. New cements for the 21st century: The pursuit of an alternative to Portland cement. Cem. Concr. Res. 2011, 41, 750–763. [Google Scholar] [CrossRef]
  3. Ijaz, N.; Ye, W.; ur Rehman, Z.; Ijaz, Z. Novel application of low carbon limestone calcined clay cement (LC3) in expansive soil stabilization: An eco-efficient approach. J. Clean. Prod. 2022, 371, 133492. [Google Scholar] [CrossRef]
  4. Hajer, M.; Swilling, M.; Suh, S.; Ramaswami, A.; Baynes, T.; Bergesen, J.; Labbé, F.; Musango, J.; Robinson, B.; Salat, S. The Weight of Cities: Resource Requirements of Future Urbanization. 2018. Available online: https://www.resourcepanel.org/reports/weight-cities (accessed on 1 May 2017).
  5. Miller, S.A.; Van Roijen, E.; Cunningham, P.; Kim, A. Opportunities and challenges for engineering construction materials as carbon sinks. RILEM Tech. Lett. 2021, 6, 105–118. [Google Scholar] [CrossRef]
  6. Ashby, M.F. Materials and the Environment: Eco-Informed Material Choice, 3rd ed.; Elsevier: Amsterdam, The Netherlands, 2019. [Google Scholar]
  7. Xi, F.; Davis, S.J.; Ciais, P.; Crawford-Brown, D.; Guan, D.; Pade, C.; Shi, F.X.T.; Syddall, D.C.-B.M.; Lv, J.; Liu, Z. Substantial global carbon uptake by cement carbonation. Nat. Geosci. 2016, 9, 880–883. [Google Scholar] [CrossRef] [Green Version]
  8. Rehman, Z.U.; Khalid, U. Optimization of COVID-19 face mask waste fibers and silica fume as a balanced mechanical ameliorator of fat clay using response surface methodology. Environ. Sci. Pollut. Res. 2022, 29, 17001–17016. [Google Scholar] [CrossRef]
  9. Tisserant, A.; Pauliuk, S.; Merciai, S.; Schmidt, J.; Fry, J.; Wood, R.; Tukker, A. Solid waste and the circular economy: A global analysis of waste treatment and waste footprints. J. Ind. Ecol. 2017, 21, 628–640. [Google Scholar] [CrossRef] [Green Version]
  10. Kaza, S.; Yao, L.; Bhada-Tata, P.; Van Woerden, F. What a Waste 2.0: A Global Snapshot of Solid Waste Management to 2050; World Bank Publications: Washington, DC, USA, 2018. [Google Scholar]
  11. Antunes, M.; Santos, R.L.; Pereira, J.; Rocha, P.; Horta, R.B.; Colaço, R. Alternative clinker technologies for reducing carbon emissions in cement industry: A critical review. Materials 2022, 15, 209. [Google Scholar] [CrossRef]
  12. Muzenda, T.R.; Hou, P.; Kawashima, S.; Sui, T.; Cheng, X. The role of limestone and calcined clay on the rheological properties of LC3. Cem. Concr. Compos. 2020, 107, 103516. [Google Scholar] [CrossRef]
  13. Hosseinzadeh Zaribaf, B. Metakaolin-Portland Limestone Cements: Evaluating the Effects of Chemical Admixtures on Early and Late Age Behavior. Doctoral Dissertation, Georgia Institute of Technology, Atlanta, GA, USA, 2017. Available online: http://hdl.handle.net/1853/60123 (accessed on 9 August 2017).
  14. Juenger, M.C.; Snellings, R.; Bernal, S.A. Supplementary cementitious materials: New sources, characterization, and performance insights. Cem. Concr. Res. 2019, 122, 257–273. [Google Scholar] [CrossRef]
  15. Buttiens, K.; Leroy, J.; Negro, P.; Thomas, J.S.; Edwards, K.; De Lassat, Y. The carbon cost of slag production in the blast furnace: A scientific approach. J. Sustain. Metall. 2016, 2, 62–72. [Google Scholar] [CrossRef] [Green Version]
  16. Obrist, M.D.; Kannan, R.; Schmidt, T.J.; Kober, T. Decarbonization pathways of the Swiss cement industry towards net zero emissions. J. Clean. Prod. 2021, 288, 125413. [Google Scholar] [CrossRef]
  17. Junaid, M.F.; ur Rehman, Z.; Kuruc, M.; Medved’, I.; Bačinskas, D.; Čurpek, J.; Čekon, M.; Ijaz, N.; Ansari, W.S. Lightweight concrete from a perspective of sustainable reuse of waste byproducts. Constr. Build. Mater. 2022, 319, 126061. [Google Scholar] [CrossRef]
  18. Bentz, D.P.; Ferraris, C.F.; Jones, S.Z.; Lootens, D.; Zunino, F. Limestone and silica powder replacements for cement: Early-age performance. Cem. Concr. Compos. 2017, 78, 43–56. [Google Scholar] [CrossRef] [PubMed] [Green Version]
  19. Scrivener, K.; Favier, A. Calcined clays for sustainable concrete. In Calcined Clays for Sustainable Concrete: Proceedings of the 1st International Conference on Calcined Clays for Sustainable Concrete (RILEM 2015), Ecublens, Switzerland, 23–25 June 2015; Springer: Dordrecht, The Netherlands, 2015. [Google Scholar] [CrossRef]
  20. Dekeukelaere, A. Evaluation of a New Low CO2 Cement Introduction within the European Emission Trading System. Doctoral Dissertation, Harvard University, Cambridge, MA, USA, 2020. Available online: https://nrs.harvard.edu/URN-3:HUL.INSTREPOS:37365064 (accessed on 12 December 2022).
  21. Benghida, D. CO2 reduction from cement industry. In Advanced Materials, Mechanical and Structural Engineering, Proceedings of the 2nd International Conference of Advanced Materials, Mechanical and Structural Engineering (AMMSE), Jeju Island, Republic of Korea, 18–20 September 2015; Routledge: London, UK, 2015; pp. 127–130. Available online: https://www.taylorfrancis.com/chapters/edit/10.1201/b19934-29/co2-reduction-cement-industry-benghida (accessed on 10 November 2022).
  22. Proske, T.; Hainer, S.; Rezvani, M.; Graubner, C.A. Eco-friendly concretes with reduced water and cement contents—Mix design principles and laboratory tests. Cem. Concr. Res. 2013, 51, 38–46. [Google Scholar] [CrossRef]
  23. Nie, Y.; Shi, J.; He, Z.; Zhang, B.; Peng, Y.; Lu, J. Evaluation of high-volume fly ash (HVFA) concrete modified by metakaolin: Technical, economic and environmental analysis. Powder Technol. 2022, 397, 117121. [Google Scholar] [CrossRef]
  24. Juhart, J.; Autischer, M.; Sakoparnig, M.; Krüger, M. The Realization of Clinker-Reduced, Performance-Based Sustainable Concrete by the Micro-Filler, Eco-Filler Concept. Materials 2021, 14, 4958. [Google Scholar] [CrossRef]
  25. Aïtcin, P.C. Portland cement. In Science and Technology of Concrete Admixtures; Woodhead Publishing: Sawston, UK, 2016; pp. 27–51. [Google Scholar] [CrossRef]
  26. Hassannezhad, K.; Akyol, Y.; Dursun, M.C.; Ow-Yang, C.W.; Gulgun, M.A. Effect of Metakaolin and Lime on Strength Development of Blended Cement Paste. Constr. Mater. 2022, 2, 297–313. [Google Scholar] [CrossRef]
  27. Badogiannis, E.; Papadakis, V.G.; Chaniotakis, E.; Tsivilis, S. Exploitation of poor Greek kaolins: Strength development of metakaolin concrete and evaluation by means of k-value. Cem. Concr. Res. 2004, 34, 1035–1041. [Google Scholar] [CrossRef]
  28. Busari, A.; Akinmusuru, J.; Dahunsi, B. Strength and durability properties of concrete using metakaolin as a sustainable material: Review of literature. Int. J. Civil Eng. Technol. 2019, 10, 1893–1902. [Google Scholar]
  29. Siddique, R.; Klaus, J. Influence of metakaolin on the properties of mortar and concrete: A review. Appl. Clay Sci. 2009, 43, 392–400. [Google Scholar] [CrossRef]
  30. Juenger, M.C.; Won, M.C.; Fowler, D.W.; Suh, C.; Edson, A. Effects of Supplementary Cementing Materials on the Setting Time and Early Strength of Concrete; No. FHWA/TC-08/0-5550-1. 2008. Available online: https://ctr.utexas.edu/wp-content/uploads/pubs/0_5550_1.pdf (accessed on 10 September 2015).
  31. Badogiannis, E.; Tsivilis, S.; Papadakis, V.; Chaniotakis, E. The effect of metakaolin on concrete properties. International Congress: Challenges of Concrete Construction. 2002, pp. 81–89. Available online: https://www.icevirtuallibrary.com/doi/abs/10.1680/iadicmac.31791.0008 (accessed on 7 July 2015).
  32. Güneyisi, E.; Gesoğlu, M.; Mermerdaş, K. Improving strength, drying shrinkage, and pore structure of concrete using metakaolin. Mater. Struct. 2008, 41, 937–949. [Google Scholar] [CrossRef]
  33. Wild, S.; Khatib, J.M.; Jones, A. Relative strength, pozzolanic activity and cement hydration in superplasticised metakaolin concrete. Cem. Concr. Res. 1996, 26, 1537–1544. [Google Scholar] [CrossRef]
  34. Changling, H.; Osbaeck, B.; Makovicky, E. Pozzolanic reaction of six principal clay minerals: Activation reactivity assessments and technological effects. Cem. Concr. Res. 1995, 25, 1691–1702. [Google Scholar] [CrossRef]
  35. Kuzielová, E.; Žemlička, M.; Bartoničková, E.; Palou, M.T. The correlation between porosity and mechanical properties of multicomponent systems consisting of Portland cement–slag–silica fume–metakaolin. Constr. Build. Mater. 2017, 135, 306–314. [Google Scholar] [CrossRef]
  36. Tang, J.; Wei, S.; Li, W.; Ma, S.; Ji, P.; Shen, X. Synergistic effect of metakaolin and limestone on the hydration properties of Portland cement. Constr. Build. Mater. 2019, 223, 177–184. [Google Scholar] [CrossRef]
  37. Dinakar, P.; Sahoo, P.K.; Sriram, G. Effect of metakaolin content on the properties of high strength concrete. Int. J. Concr. Struct. Mater. 2013, 7, 215–223. [Google Scholar] [CrossRef] [Green Version]
  38. EN 197-1:2011; Cement–Part 1: Composition, Specifications and Conformity Criteria for Common Cements. European Committee for Standardisation, British Standard: London, UK, 2011. Available online: http://168.101.26.37/notific_otros_miembros/mwi40_t.pdf (accessed on 6 January 2021).
  39. Ferraz, E.; Andrejkovicova, S.; Hajjaji, W.; Velosa, A.L.; Silva, A.S.; Rocha, F. Pozzolanic activity of metakaolins by the French standard of the modified Chapelle test: A direct methology. Acta Geodyn. Geomater. 2015, 12, 289–298. Available online: http://hdl.handle.net/10400.26/38418 (accessed on 20 January 2016). [CrossRef] [Green Version]
  40. Hernández, J.F.M.; Almenares-Reyes, R.; Zunino, F.; Alujas-Diaz, A.; Scrivener, K.L. Color control in industrial clay calcination. RILEM Tech. Lett. 2020, 5, 1–7. [Google Scholar] [CrossRef]
  41. EN 196-1:2016; CEN European Committee for Standardization, Methods of Testing of Cement: Part 1. Determination of Strength, The European Standard. CEN: Brussels, Belgium, 2016.
  42. EN 1015-3:1999; Methods of Test for Mortar for Masonry—Part 3: Determination of Consistence of Fresh Mortar (by Flow Table). CEN: Brussels, Belgium, 1999.
  43. Puerta-Falla, G.; Balonis, M.; Le Saout, G.; Neithalath, N.; Sant, G. The influence of metakaolin on limestone reactivity in cementitious materials. In Calcined Clays for Sustainable Concrete: Proceedings of the 1st International Conference on Calcined Clays for Sustainable Concrete (RILEM 2015), Ecublens, Switzerland, 23–25 June 2015; Springer: Dordrecht, The Netherlands, 2015; pp. 11–19. [Google Scholar] [CrossRef]
  44. Chen, J.J.; Li, Q.H.; Ng, P.L.; Li, L.G.; Kwan, A.K.H. Cement equivalence of metakaolin for workability, cohesiveness, strength and sorptivity of concrete. Materials 2020, 13, 1646. [Google Scholar] [CrossRef] [Green Version]
  45. Smith, I.A. The design of fly-ash concretes. Proc. Inst. Civ. Eng. 1967, 36, 769–790. [Google Scholar] [CrossRef]
  46. Yu, J.; Wu, H.L.; Mishra, D.K.; Li, G.; Leung, C.K. Compressive strength and environmental impact of sustainable blended cement with high-dosage Limestone and Calcined Clay (LC2). J. Clean. Prod. 2021, 278, 123616. [Google Scholar] [CrossRef]
  47. Rössler, M.; Odler, I. Investigations on the relationship between porosity, structure, and strength of hydrated portland cement pastes I. Effect of porosity. Cem. Concr. Res. 1985, 15, 320–330. [Google Scholar] [CrossRef]
  48. Kearsley, E.P.; Wainwright, P.J. The effect of porosity on the strength of foamed concrete. Cem. Concr. Res. 2002, 32, 233–239. [Google Scholar] [CrossRef]
  49. Lootens, D.; Bentz, D.P. On the relation of setting and early-age strength development to porosity and hydration in cement-based materials. Cem. Concr. Compos. 2016, 68, 9–14. [Google Scholar] [CrossRef] [PubMed] [Green Version]
  50. Bentz, D.P.; Zunino, F.; Lootens, D. Chemical vs. physical acceleration of cement hydration. Concr. Int. Des. Constr. 2016, 38, 37. [Google Scholar]
  51. Briendl, L.G.; Mittermayr, F.; Baldermann, A.; Steindl, F.R.; Sakoparnig, M.; Letofsky-Papst, I.; Galan, I. Early hydration of cementitious systems accelerated by aluminium sulphate: Effect of fine limestone. Cem. Concr. Res. 2020, 134, 106069. [Google Scholar] [CrossRef]
  52. Wyrzykowski, M.; Assmann, A.; Hesse, C.; Lura, P. Microstructure development and autogenous shrinkage of mortars with CSH seeding and internal curing. Cem. Concr. Res. 2020, 129, 105967. [Google Scholar] [CrossRef]
  53. Neto, C.S.; Campiteli, V.C. The influence of limestone additions on the rheological properties and water retention value of Portland cement slurries. Carbonate Addit. Cem. 1990, 100, 24–29. [Google Scholar]
  54. Jiang, D.; Li, X.; Lv, Y.; Zhou, M.; He, C.; Jiang, W.; Liu, Z.; Li, C. Utilization of limestone powder and fly ash in blended cement: Rheology, strength and hydration characteristics. Constr. Build. Mater. 2020, 232, 117228. [Google Scholar] [CrossRef]
  55. Gotaszewska, M.; Giergiczny, Z. Influence of limestone addition to cement on rheological properties of mortars. In Proceedings of the 12th Fib International Ph.D. Symposium in Civil Engineering, Prague, Czech Republic, 29–31 August 2018; pp. 59–64. [Google Scholar]
  56. Yahia, A.; Tanimura, M.; Shimoyama, Y. Rheological properties of highly flowable mortar containing limestone filler-effect of powder content and W/C ratio. Cem. Concr. Res. 2005, 35, 532–539. [Google Scholar] [CrossRef]
  57. Khatib, J.M.; Negim, E.M.; Gjonbalaj, E. High volume metakaolin as cement replacement in mortar. World J. Chem. 2012, 7, 7–10. Available online: https://www.idosi.org/wjc/7(1)12/2.pdf (accessed on 27 August 2015).
  58. Cassagnabère, F.; Diederich, P.; Mouret, M.; Escadeillas, G.; Lachemi, M. Impact of metakaolin characteristics on the rheological properties of mortar in the fresh state. Cem. Concr. Compos. 2013, 37, 95–107. [Google Scholar] [CrossRef]
  59. Badogiannis, E.; Kakali, G.; Dimopoulou, G.; Chaniotakis, E.; Tsivilis, S. Metakaolin as a main cement constituent. Exploitation of poor Greek kaolins. Cem. Concr. Compos. 2005, 27, 197–203. [Google Scholar] [CrossRef]
  60. Kropyvnytska, T.; Rucinska, T.; Ivashchyshyn, H.; Kotiv, R. Development of eco-efficient composite cements with high early strength. In Proceedings of the CEE 2019: Advances in Resource-Saving Technologies and Materials in Civil and Environmental Engineering, Kyiv, Ukraine, 22–23 April 2020; Volume 18, pp. 211–218. [Google Scholar] [CrossRef]
  61. Zhao, D.; Khoshnazar, R. Hydration and microstructural development of calcined clay cement paste in the presence of calcium-silicate-hydrate (C–S–H) seed. Cem. Concr. Compos. 2021, 122, 104162. [Google Scholar] [CrossRef]
  62. Redondo-Soto, C.; Morales-Cantero, A.; Cuesta, A.; Santacruz, I.; Gastaldi, D.; Canonico, F.; Aranda, M.A. Limestone calcined clay binders based on a Belite-rich cement. Cem. Concr. Res. 2023, 163, 107018. [Google Scholar] [CrossRef]
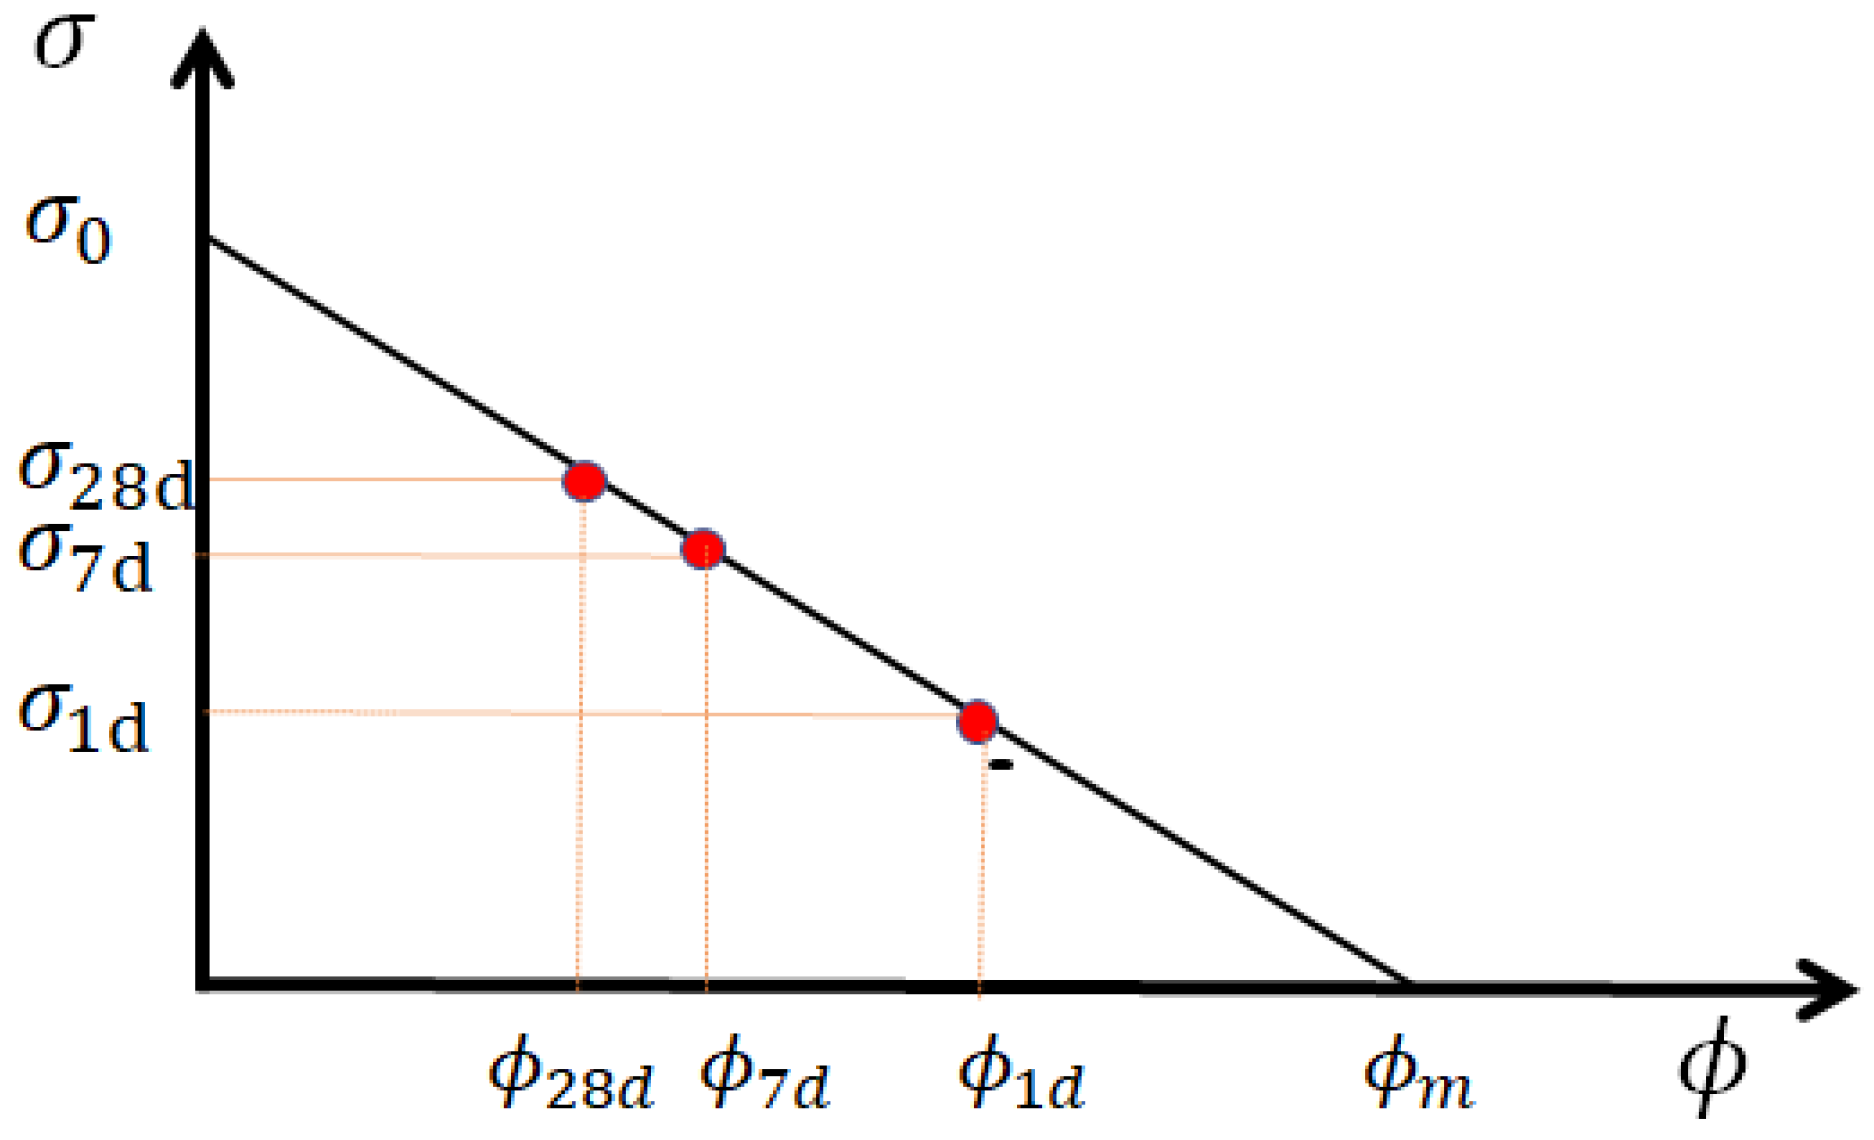
Figure 1. Schematic representation of compressive strength as a function of porosity. ϕ m is the critical (lowest) porosity at zero strength, whereas ϕ 1 d ,   ϕ 7 d   , and ϕ 28 d are porosities at 1, 7 and 28 days, giving, respectively, the compressive strengths σ 1 d , σ 7 d , σ 28 d in a linear relation. The maximum compressive strength σ 0 is obtained when porosity reaches zero (if possible).
Minerals 13 00454 g001
Figure 2. (a) Compressive strength of the different additions at days 1 and 28 as a function of the water-to-cement ratio; (b) Evolution of the slump flows measured with the shock table after 10, 13 and 16 shocks as a function of the surface area of cement and GCC (C + GCC).
Minerals 13 00454 g002
Figure 3. Compressive strengths of the four different additions of GCC presented in Table 6 at 1, 7, 28 and 90 days as a function of the calculated porosity. The line corresponds to the linear evolution of compressive strength with porosity, as explained in Equation (3), with σ 0 = 130   MPa ,   ϕ m C = 51 % . The dotted lines on the side represent a deviation of σ 0 and ϕ m C of ±4%.
Minerals 13 00454 g003
Figure 4. (a) Water demand as a function of metakaolin substitution and thus for the six different metakaolins. (b) Water demand as a function of surface area calculated for the two binders. The surface area of cement is taken as 0.4 m2/g, whereas those of metakaolin are obtained from the shifts to obtain the master curves. Values of the surface areas obtained from the shifts are given in Table 9.
Minerals 13 00454 g004
Figure 5. Left: Compressive strengths as a function of the water-to-binder ratio (W/B) with different types of metakaolin at 7 (a) and 28 days (c). Right: Same compressive strengths represented as a function of the equivalent binder-to-water ratio (CEM + MK) at 7 (b) and 28 days (d). The shifts used for the right graphics are given in the first row of Table 10.
Minerals 13 00454 g005
Figure 6. Compressive strengths for the six different additions of metakaolin are presented in Table 7 at 7 (a) and 28 days (b) as a function of the calculated porosity. The continuous line is the same as that in Figure 3, corresponding to the linear evolution of compressive strength with porosity, as explained in Equation (3) with σ 0 = 130   MPa and ϕ m = 51 % . The dotted lines are a variation with ±4% of both σ 0 and ϕ m .
Minerals 13 00454 g006
Figure 7. (a) Concentration of added superplasticizer needed to maintain the same flow as a function of added cement and metakaolin for different types of metakaolin. (b) Superplasticizer added to maintain a constant flow as a function of the calculated surface area of the two binders (from Table 9).
Minerals 13 00454 g007
Figure 8. (a) Compressive strength as a function of the water-to-binder ratio for the different types of metakaolin (M1–M6) and cement addition (C). (b) Same data represented as a function of the equivalent binder-to-water ratio, following Equation (2), and considering only cement and metakaolin. The shift factors for each series are given in Table 11 ( X k ternary system).
Minerals 13 00454 g008
Figure 9. Compressive strengths as a function of the calculated porosity for the diverse substitutions of the six metakaolins (M1–M6) and cement (C) presented in Table 10 at 28 days. The continuous line corresponds to the linear evolution of compressive strength with porosity, as explained in Equation (3) with σ 0 = 130   MPa and ϕ m = 51 % . The dotted lines are a variation with ±4% of both σ 0 and ϕ m .
Minerals 13 00454 g009
Table 1. Global quantity and equivalent carbon embodiment of the primary construction materials [6,7,8].
MaterialsConcreteMortarBrickSteelWoodPlasticAlTotal
Quantity (GT)25551.910.0650.0338
Weight ratio (%)65.813.113.152.6>0.2>0.1100
CO2 factor (kg/t)1204002501850300300010,000
Quantity CO2 (GT)3.002.001.503.520.300.200.3010.8
CO2 ratio (%)27.7518.5013.8832.522.781.802.78100
Table 2. Clinker and some of the major SCMs with their available or produced quantity, along with their typical carbon footprint [6,14]. The carbon footprint of slag is no longer considered waste at 50 kg CO2/t but a consumed product at 500 kg CO2/t [15].
TypesClinkerMKSlagFly AshSilica FumeLimestoneSand
Aggregate
Carbon footprint (kg/t)8003005005050>5030
Quantity GT4Large0.40.40.4LargeLarge
Table 3. Carbon footprint and reduction (C_red) of different kinds of cement made from clinker, limestone and calcined clay (metakaolin) [20,21]. The values of the carbon footprints from Table 2 are used for these calculations.
Cement TypeClinker
%
Limestone
%
Pozzolan
%
CO2
kg/t
C_Red
%
Pure clinker100008000
Average cement70201065022
LC350302052540
Cement/limestone 50%5050047547
Table 4. CO2 expressed in kg/t and as percentage for mortar and concrete made with different kinds of binders.
ClinkerCement *LC3C-50%C-75%
Concrete CO2 (kg/t)1601301049765
Mortar CO2 (kg/t)378300228208123
Concrete reduction (%)190−21−25−50
Mortar reduction (%)210−25−30−59
* The reference is based on average cement made from 70% clinker generating 650 kg of CO2/t of cement.
Table 5. Composition, physical properties and reactivity of the different types of metakaolin used. Data extracted from various product data sheets.
M1M2M3M4M5M6
WhitenessYellowness10.68.6414.917.349.944.7
L96.695.5991.790.472.366.3
Size d 50 µm1.31.41.563.58
Surface aream2/g14.217.9252015.65-
Chapelle testmg/g1146156014001100773.9-
SiO2 + Al2O3%>97>939495>92>92
Densitykg/m3260022002400240025502550
Table 6. Formulations of the pastes prepared with different contents as mass percentage of the total paste mix for the cement (CEM), GGC (L) and water (W) given as mass percentage. The mixes are prepared at four different water-to-cement ratios. The initial porosity calculated ϕ 0 is given for each mix. Corresponding slump tests after 10, 13, 16 shocks (T10, T13 and T16), the medium density (D) and compressive strength at 1, 7, 28 and 90 days (Rc1d, Rc7d, Rc28d and Rc90d).
TestCEMLWW/C ϕ 0 T10T13T16DRc1dRc7dRc28dRc90d
Unit%%% %mmmmmmkg/LMPaMPaMPaMPa
A-1a670330.5046.81811932042.2724476067
A-3a5813290.5045.31681791862.2735596572
A-4a5518270.5043.91601701782.2838576874
A-1b630370.6042.51701851972.2515364751
A-2b588350.6049.91801922012.2521435254
A-3b5414320.6048.41691801882.2427-54-
A-3d5020300.6046.81631721802.2630465756
A-1c610390.6545.31731872002.2514-42-
A-2c568360.6551.41841952042.2419-46-
A-3c5215340.6549.91701801902.2423-48-
A-4c4821310.6548.21661761842.2525425150
A-1d590410.7046.61671821952.2512-35-
A-2d548380.7052.71751871972.2216-40-
A-3d5015350.7051.11721821902.2119-42-
A-4d4622320.7049.41681801862.2423384545
Table 7. Formulations of the mortars prepared with different contents of sand, cement (CEM), metakaolin (MK) and water (W) given as mass percentage, with the corresponding slump tests after 16 shocks (T16), the medium density and compressive strength at 7 and 28 days (Rc7D and Rc28D). The initial porosity calculated ϕ 0 is given for each mix.
TestSandCEMMKWW/B ϕ 0 T16DensityRc7DRc28D
%%%%-%mmkg/LMPaMPa
Ref-b67220110.5048.42182.284652
M1-167202110.5050.01922.256173
M1-266184120.5450.31922.226169
M1-365157130.6151.11882.184965
M1-464139140.6852.51852.143555
M1-5631010160.7753.81852.092339
M2-166202120.5250.52032.235962
M2-265174130.5951.41882.185259
M2-364156150.7052.61972.123850
M2-463138160.7954.41872.062640
M2-5611010180.9055.51852.011826
M3-166202120.5250.22002.245359
M3-265174130.5951.51952.194052
M3-364156140.6852.81962.144342
M3-463138160.7454.11822.092932
M3-5621010170.8355.91802.032223
M4-167202110.5048.21952.275254
M4-266184120.5248.91892.245251
M4-366157120.5749.21932.214035
M4-465139130.5948.71842.193235
M4-5651111140.6349.41922.162228
M5-167202110.5048.42102.274553
M5-267184110.5049.51962.244554
M5-367167110.5049.21822.234544
M5-466139120.5248.81842.213647
M5-5661111120.5448.51952.202753
M6-167202110.5049.22092.264956
M6-267184110.5049.21972.244960
M6-367167110.5049.51852.224857
M6-466139120.5249.91882.204349
Table 8. Formulations of the mortars prepared with different contents as weight percentage of sand, cement (CEM), GCC (L), metakaolin (MK) and water (W) given as mass percentage. The calculated water-to-binder ratio (CEM + MK), superplasticizer dosage (% of the total mix) (SP) and corresponding surface area (A) values are presented, as well as the slump tests without shock (Flow), the medium density and compressive strength at 28 days (Rc28d).
TestSandCEMLMKWw/bSPAFlowDensityRc28d
%%%%% %m2/gmmkg/LMPa
Ref-c6018120100.550.080.083822.2531
M1-65918121100.520.080.103802.2734
M1-75818122100.490.130.123902.2847
M1-85718123100.470.190.143982.2753
M1-95518124100.450.220.163762.2555
M2-65918121100.520.130.104022.3051
M2-75818122100.490.170.133652.2652
M2-85718123100.470.240.153902.2663
M2-95518124100.450.320.173952.2765
M3-65918121100.520.120.103802.2848
M3-75818122100.490.170.124002.2655
M3-85718123100.470.230.143982.2661
M3-95518124100.450.300.163802.2658
M4-65918121100.520.120.103802.2849
M4-75818122100.490.180.123902.2851
M4-85718123100.470.240.143982.2757
M4-95518124100.450.310.153822.2658
M5-65918121100.520.100.093962.2834
M5-75818122100.490.120.103802.2734
M5-85718123100.470.160.104002.2639
M5-95518124100.450.190.113682.2742
M6-65918121100.520.100.093922.2835
M6-75818122100.490.120.103722.2736
M6-85718123100.470.150.103942.2838
M6-95518124100.450.180.113902.2842
C1-1602370100.450.120.103942.3149
C1-2602730100.370.180.123682.3251
C1-3603000100.340.250.133552.3354
C1-4553400100.300.320.153782.3563
C1-5513900100.260.350.173532.3674
C1-6474300100.240.450.193642.3982
Table 9. Comparison of the mean size diameters from the data sheet and those obtained from measurements of water demand (Figure 4) and superplasticizer dosage. The surface areas are either taken from the product data sheet (data sheet) or obtained from the water demand shift (calculated). The d 50   F l o w (water demand) is calculated from the surface area using Equation (1). The d 50   p o l y m e r is obtained from the surface area calculated with Equation (1).
Metakaolin M1M2M3M4M5M6
d 50 (data sheet)µm1.31.41.563.58
d 50   F l o w (water demand)µm1.71.31.41.933
d 50   p o l y m e r (superplasticizer dosage)µm1.91.31.41.533
Surface area (data sheet)m2/g14.217.9252015.7-
Surface area (calculated)m2/g1.411.841.711.140.80.8
Table 10. Reactivity factors used to obtain both the equivalent binder concentration (Equation (2)) and the master curves in Figure 5. The reactivity factor n is the same as that for the GCC/cement binary system, and the two factors m and k are obtained from the calculated porosity (Equations (4) and (5)) and from the master curves in Figure 3 and Figure 6.
MetakaolinM1M2M3M4M5M6
X k binary system (7 and 28 d)1.92.221.311.15
n   7   d 0.160.160.160.160.160.16
n   28   d 0.200.200.200.200.200.20
m   7   d 0.150.150.150.020.060.10
m   28   d 0.300.200.180.040.060.13
B   7   d and B   28   d 0.350.400.350.120.050.10
Table 11. Reactivity factors used to obtain both the equivalent binder concentration (Equation (2)) and the master curves in Figure 8. Reactivity factors n , m , k , l are obtained from the calculated porosity (Equations (4) and (5)) and the master curves in Figure 9.
MetakaolinM1M2M3M4M5M6
X k ternary system (28 d)2.52.832.51.21
n   28   d 0.200.200.200.200.200.20
m   28   d 0.250.350.350.350.100.13
Disclaimer/Publisher’s Note: The statements, opinions and data contained in all publications are solely those of the individual author(s) and contributor(s) and not of MDPI and/or the editor(s). MDPI and/or the editor(s) disclaim responsibility for any injury to people or property resulting from any ideas, methods, instructions or products referred to in the content.