Abstract
With changes in mining depth, the dynamic mechanical characteristics of the same type of rock also change, so that the blasting excavation process must be constantly adjusted and optimized to meet the requirements of safe and efficient mining. To study the energy evolution law and fractal characteristics of deep marble during the destruction process, dynamic impact tests under different strain rates were carried out on a deep marble sample using the three-axis dynamic combination Hopkinson pressure bar system. The experimental results show that the larger the incident energy is, the more energy is transmitted. The proportion of absorbed energy does not increase with the increase in the incident energy. Only 30%–38% of the incident energy is absorbed by the impacted rock. With an increase in the strain rate, the energy consumption density gradually increases, the fragmentation degree is intensified, the fractal dimension gradually increases, and the failure mode changes from compression–shear failure to crushing failure.
1. Introduction
With the rapid development of the economy, shallow mineral resources are gradually being exhausted, and the resource exploitation process is being extended to greater depths [1,2,3,4,5]. Human activities (such as blasting excavation) or natural disasters (such as earthquakes) produce different degrees of disturbance in deep rocks, inducing rock instability and failure [6,7] and resulting in huge losses of personnel or property. As a result, research on the dynamic characteristics of deep rock under different intensities of disturbance is of great importance for the exploitation of mines and the protection of life and property. In this paper, the stress characteristics of deep rock are simplified, and the split Hopkinson pressure bar (SHPB) system is used to simulate the stress situation of deep rock with a triaxial static–dynamic coupling load [8]. The confining and axial pressures are selected in accordance with the in situ stress environment [9] to study the stress–strain relationship, energy regularity, and broken fractal features of deep rock under different load excitations [10,11,12,13].
Many researchers have performed high-strain rate characterization of rocks using the split Hopkinson pressure bar (SHPB). Wang et al. (2021) conducted a series of triaxial repetitive impact tests using SHPB to reveal the dynamic stress–strain characteristics of sandstones under perimeter pressure [14]. Zhu et al. (2021) used a modified SHPB to conduct dynamic triaxial compression tests for a series of incident energies, confining pressures, and shock times to study the mechanical behavior and permeability evolution of sandstones under realistic dynamic loading [15]. Feng et al. (2020) used the SHPB system to study the failure behavior of coal under uniaxial dynamic compressive loading. They pointed out that the transverse fracture of the specimen was caused by the tensile stress wave reflected from the interface between the coal sample and the transmission rod [16]. Bing et al. (2022) carried out cyclic impact tests on granite samples with circular holes under different axial pressures using a split Hopkinson pressure bar (SHPB) and established a damage value criterion based on energy dissipation [17]. Fakhimi et al. (2018) evaluated the strength characteristics of sandstone under uniaxial compressive loading using SHPB testing [18]. Li et al. (2022) conducted compression experiments on deep marble at different strain rates and high temperatures [19]. Wang et al. (2021) provide a useful reference for the analysis of the dynamic crushing mechanism, crushing block size distribution, and crushing energy consumption in roadway-surrounding rock [20].
In response to the statistical self-similarity characteristics of rock fracture processes, Zuo et al. (2022) introduced fractal theory into the research field of rock fracture and fragmentation [21]. Sanchidrián et al. (2014) analyzed a large number of rock chips and obtained an optimal two-parameter function describing the scale distribution of the chips [22]. Frenelus et al. (2022) combined the SHPB test system and DIC technology to analyze the dynamic compression failure process of a coal sample and to quantitatively analyze, by the box fractal dimension, the dynamic change in the coal sample crack under impact by conducting simulation studies on deep rock mass [23]. Feng et al. (2022) indicated that failure behavior should be the integrated response of the excavation unloading effect, geological conditions, and external dynamic disturbances [24]. Li et al. (2022) fully clarified the deformation and failure mechanisms of a deep composite-roof roadway, with cable bolts as the primary support, under particularly extreme geological conditions, and put forward reasonable control measures for the surrounding rock [25]. Zhao et al. (2019) studied the evolution law of rock damage and permeability using acoustic emission (AE) seepage experiment on deep roof sandstone with cyclic loading [26]. Saeidi et al. (2022) pointed out that the energy consumption density of rock samples increases with an increase in fractal dimension [27]. Wang et al. (2019) used fractal dimension to quantify the energy consumption characteristics of rock crushing under impact loading [28].
Research on rock dynamics has been very fruitful, but the complexity of deeper fossil conditions, with their changing physical and mechanical properties, and the consequent change in the dynamic form of damage to the rock mass, directly affects the efficiency of blasting breakage. Based on the background of optimizing the blasting parameters for the roadway excavation of the 400-level copper mine at Dahongshan, this paper investigates the stress–strain relationship, energy evolution law, and fractal characteristics of deeply buried submarine marble with the aid of a triaxial dynamic–static combination test device to provide a certain reference for optimizing the blasting parameters for roadway excavation at Yuxi Mining.
2. Test Material and Device
2.1. Sample Preparation
Rock blocks with good homogeneity and integrity were selected as the test objects from the rock surrounding the 400 horizontal roadways in Dahongshan Copper Mine. Cylindrical rock samples with a size of Φ 50 mm × 50 mm were processed according to the test requirements recommended by the International Standard Rock Mechanics (ISRM) [29,30]. The 2S-200 vertical coring machine and the SHM-200 double-end grinder were used to grind the end face, and the end face roughness was controlled within ±0.02 mm to meet the uniformity assumption of the test requirements. Finally, an acoustic test was carried out on the rock samples, and rock samples with roughly the same wave velocity were selected. Some of the rock samples are shown in Figure 1. The same loading test was repeated three times, and the basic mechanical parameters of the rock samples were obtained, as shown in Table 1.
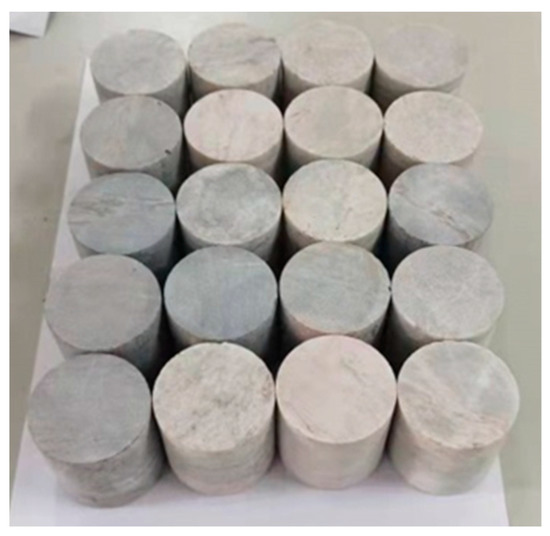
Figure 1.
Part of the rock specimen.

Table 1.
Static mechanical parameters of marble.
2.2. SHPB Test System
As shown in Figure 2, the SHPB system is mainly composed of a launching device, a speed device, a pressure bar system (made up of spindle bullets, an incident bar, and a transmission bar), axial pressure, a peripheral loading device, and a data acquisition device. The compressive bar has a diameter of 50 mm, the lengths of the incident bar and transmission bar are 2000 mm and 1200 mm, respectively, the elastic modulus is 210 GPa, and the compressional wave velocity is 5196.5 m/s. The rock sample (Figure 2) is located between the transmission bar and the incident bar. When the bullet strikes the incident bar, an incident pulse is formed in the incident bar. In turn, when the incident pulse propagates forward to the rock sample, a reflected pulse and a transmitted pulse are formed at the heterogeneous interface, that is, the contact surface between the incident rod, the transmission rod, and the rock sample. Due to the difference in wave impedance and the incident pulse, the reflected pulse and the transmitted pulse are captured by strain gauges [31].
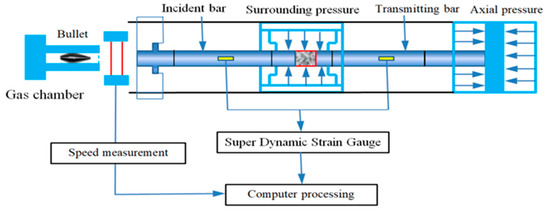
Figure 2.
SHPB test system.
2.3. Dynamic Stress Balance Verification
The SHPB test system is based on one-dimensional assumptions and stress uniformity assumptions: when the spindle-shaped bullet hits the incident rod with different impact velocities, it generates half-sine waves with different impact velocities [32], which can better satisfy the one-dimensional stress wave assumption. The stress balance curve at both ends of the specimen during the impact process, when the strain rate was 50.57 s−1, is shown in Figure 3. It can be seen that the incident stress and the reflected stress are equal to the transmission stress after superposition, which satisfies the assumption of stress balance at both ends of the specimen, indicating that the test results are reliable. The specimen is placed between the incident rod and the transmission rod. To reduce the end friction effect, both ends of the specimen should be evenly smeared with Vaseline in advance, to ensure close contact between the specimen and the device [33]. The voltage signal can be processed using the two-wave method to obtain the (stress), (strain rate), and (strain) during the impact [34].
where E is the elastic modulus of the bar, GPa; C is the elastic wave velocity of the bar, m/s; LS is the length of the rock sample, mm; A is the cross-sectional area of the bar, m2; and AS is the cross-sectional area of the specimen, m2.
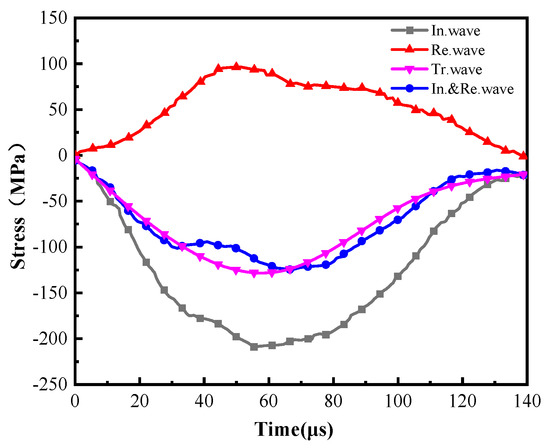
Figure 3.
Stress time history curve.
2.4. Dynamic Impact Test Results
The variation law of the in situ stress field in the Dahongshan copper mine is shown in Equation (2).
where is the maximum horizontal principal stress, MPa; is the minimum horizontal principal stress value, MPa; and H is the depth of burial, m.
The maximum principal stress in the 400-level roadway at the Dahongshan Copper Mine is 25 MPa, the minimum principal stress is 20 MPa, and the vertical principal stress value is 10 MPa. Therefore, an axial pressure of 25 MPa and a circumferential pressure of 10 MPa were set in this test. To study the kinetic characteristics of deep marines, the rock sample was taken at a 0.5 MPa impact pressure, and the rock sample was cracked. Therefore, the impact pressures for the rock samples were selected as 0.5 MPa, 0.6 MPa, 0.7 MPa, 0.8 MPa, and 0.9 MPa. To improve the accuracy of the test results, three replicate tests were conducted for each impact pressure, and the average value was taken for each set of replicate tests. The experimental results are shown in Table 2. Among them, the dynamic compressive strength represents the peak stress on the rock sample, reflecting the strength indicator of the rock sample. The dynamic strength growth factor (DIF) is the ratio of the dynamic strength to the static strength of rock samples and is an index that reflects the increase in the compressive strength of rock samples under impact compression. It is expressed as follows: DIF = fcd/fcs, where fcd and fcs are the static compressive strength and dynamic compressive strength of the rock samples, respectively.
Table 2.
Impact test results.
3. Analysis of Test Results
3.1. Stress–Strain Curve Analysis
The dynamic stress–strain curves of the rock samples under different strains are shown in Figure 4.
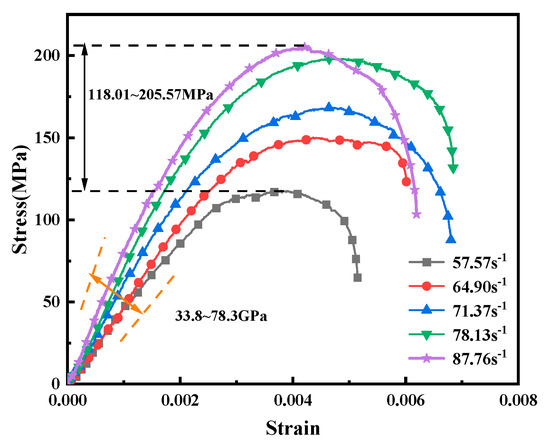
Figure 4.
Stress–strain curves.
As can be seen from Figure 4, the shape of the stress–strain curves are similar for all groups of rock samples. The stress–strain curves of the rock samples enter the phase of elasticity from the beginning. The slope of the linear elasticity of the stress–strain curve is defined as the dynamic elasticity modulus (E) of the specimen. The dynamic modulus of elasticity increases with the increasing strain rate over the range of test impacts. The dynamic modulus of elasticity of the rock samples increases from 33.8 GPa to 78.3 GPa for strain rates of 50.57 s−1~87.76 s−1. The strength growth factor increases with the increasing strain rate, and the dynamic strength growth factors are 1.94, 2.47, 2.77, 3.26, and 3.38, indicating that the strain-rate-strengthening effect of the rock samples is significant. To quantify the relationship between the strain rate and the dynamic compressive strength of the rock samples, a scatter plot between the dynamic compressive strength and the strain rate of the rock samples was fitted using a multiplicative power function [35]. It can be seen from Figure 5, there is a close fit between the dynamic compressive strength and the strain rate. As the strain rate increases, the dynamic compressive strength of the rock samples gradually increases, with a maximum increase of 74.2%.
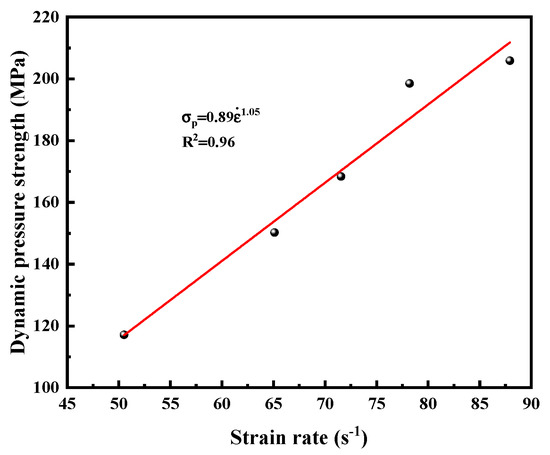
Figure 5.
The relationship between the dynamic pressure strength and strain rate.
3.2. Energy Dissipation Analysis
Under the action of a dynamic load, the deformation and damage of rock samples are accompanied by energy conversion. As a result, it is very important to analyze the fragmentation characteristics of rock samples from the perspective of energy conversion [36].
During the impact process, the total incident energy transferred from the incident rod passes through the rock sample and undergoes energy conversion. Part of the energy is absorbed by the rock sample and transformed into absorbed energy, part of the energy is transmitted and transformed into transmitted energy, and the rest is reflected in the incident bar. According to the principle of energy conservation, and neglecting the energy lost during the impact, the incident energy, reflected energy, transmitted energy, and absorbed energy of the rock sample during impact are calculated using Equation (3) [37].
where , , are the incident, reflected, and transmitted pulses, respectively, MPa; EI, ER, ET, and ES are the incident, reflected, transmitted, and absorbed energies, respectively, J; Ab is the cross-sectional area of the bar, m2; Cb is the elastic wave velocity of the bar, m/s; Eb is the elastic modulus of the bar, GPa.
To eliminate the influence of the volume factor on the test results, the energy consumption density () was introduced to quantify the energy absorbed by the fragmentation of the rock sample [38]. is calculated as follows:
where ES indicates the energy absorbed by the rock sample, J, and V is the volume of the rock sample, cm3.
The above energy values for the strain rate are shown in Figure 6. Within the test range, the incident, transmitted, and absorbed energies of the rock samples all show a clear increase with the increasing strain rate, while the reflected energy increases at a lower rate. This is due to a better match between the rock sample and the pressure bar wave impedance, resulting in a higher transmitted energy and lower absorbed energy. The fitted relationship between each energy and strain rate is shown in Equation (5).
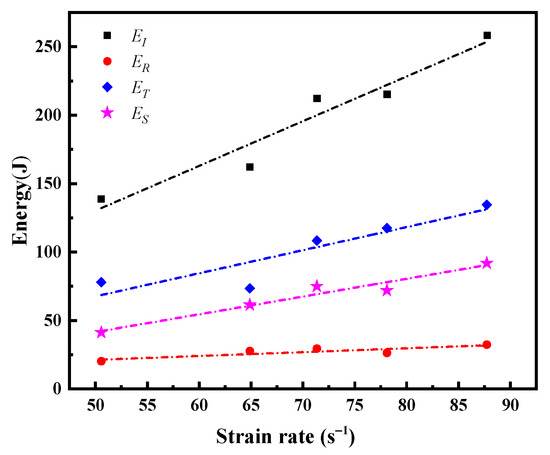
Figure 6.
The relationship between the energy and strain rate.
Figure 7 shows the absorbed energy, transmitted energy, and reflected energy of the rock samples as a percentage of the total incident energy, respectively. It can be seen that the relationship between the three types of energy under different incident energies is ET > ES > ER. As the incident energy increases, the percentages of transmitted energy, absorbed energy, and reflected energy in the incident energy remain roughly the same, being 45%–56%, 30%–38%, and 12%–17%, respectively. It can be assumed that the larger the incident energy is, the more energy is transmitted. More than half the energy is transmitted, and less than 40% of the incident energy is absorbed by the rock sample.
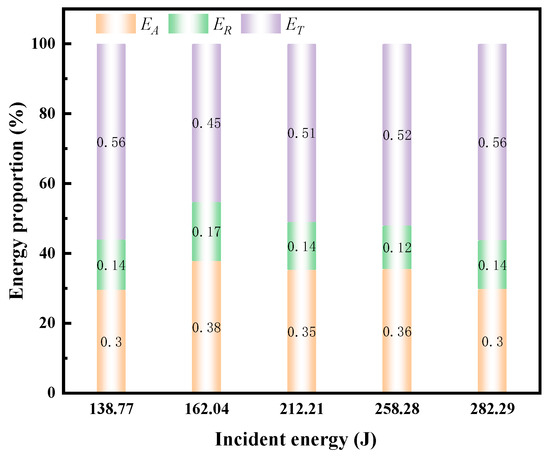
Figure 7.
Percentages of absorbed energy, transmitted energy, and reflected energy.
The energy densities of the rock samples during impact were calculated according to Equation (4). Figure 8 shows the quantitative relationship between the energy consumption density and strain rate of the rock samples. It can be seen that the energy consumption density increases linearly with the strain rate over the range of test impacts. Combined with the damage patterns of the rock samples after impact, it is concluded that when the energy consumption density is less than 0.85 J/cm3, the primary fractures are not fully developed under the impact, and, therefore, the rock samples still have a certain load-bearing capacity. As the strain rate increases, the energy consumption density increases from 0.89 J/cm3 to 1.07 J/cm3, and more energy is consumed on the sprouting, expansion, and penetration of new internal fractures, and the primary fractures and fully developed new fractures gradually transform from a coarse-grained to a fine-grained state [39].
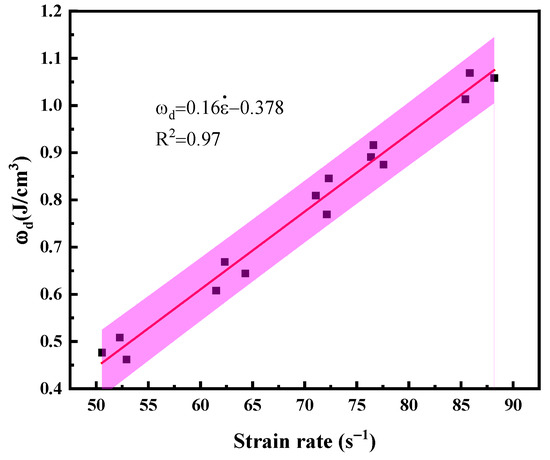
Figure 8.
The relationship between the consumption energy density and strain rate.
3.3. Distribution Patterns of Fracture Particle Size
Through dynamic loading tests at different strain rates, crushed rock chips from each rock sample were collected, screened, and classified to obtain the morphological characteristics of the rock samples at different strain rates, as shown in Figure 9.
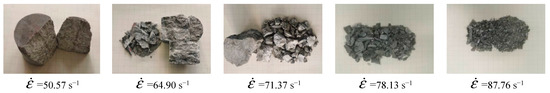
Figure 9.
Fragmentation patterns.
The nature of rock sample failure is such that many internal cracks and pores continue to sprout, expand, and converge under the driving action of a dynamic load, which finally leads to the macro-crushing process. The damage patterns and the sizes of the fragments reflect the degree of breakage and the initial damage characteristics of the rock samples [40]. In terms of fragmentation patterns, the rock samples underwent compression–shear damage and became two large pieces when the strain rate was 50.57 s−1. When the strain rate was 64.90 s−1, the rock samples were broken into three large blocks with some small blocks. When the strain rate was 71.37 s−1, core failure occurred in the rock samples, producing a large quantity of debris. When the strain rate was 78.13 s−1, rock crushing damage occurred. Crushing damage also occurred in the rock samples when the strain rate was 87.76 s−1. In terms of fragment size, with the increase in the strain rate, the average scale of rock sample failure changed from coarse to fine. The fragmentation of the rock samples gradually deepened, and the proportion of fine grains gradually increased. This is because at strain rates of 50.57 s−1~71.37 s−1, the energy carried by the incident waves was not large enough to destroy the primary fractures within the rock samples, resulting in a low dissipation density of the samples. When the strain rate was greater than 78.13 s−1, the energy carried by the incident waves increased, and the primary cracks and new microcracks were stably developed and fully destroyed, resulting in the increasing degree of rock sample fragmentation and the decreasing fragment size [41].
To quantify the variation rules of the crystallization size under different strain rates, the fragments were sieved according to the size of the cuttings. The quality of each level of screening was determined with a high-sensitivity electronic scale, and the test data were recorded. The particle size corresponding to 50% of the mass percentage is represented as d50. The particle size distributions of the rock samples at different strain rates are shown in Figure 10.
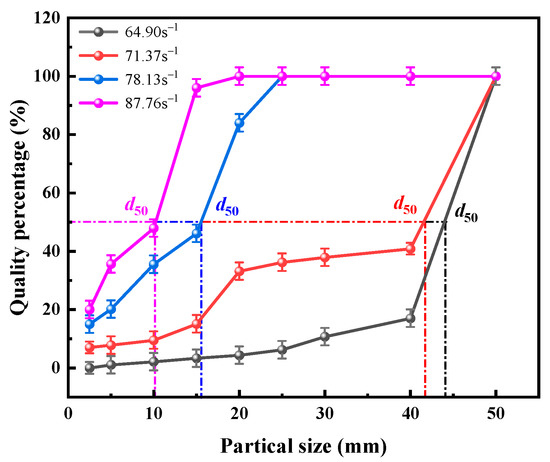
Figure 10.
The passing rate of the specimen block degree.
It can be seen from Figure 10 that when the strain rate is 87.76s−1, the d50 is 10.9 mm, indicating that the sample is crushed. The sample is seriously broken. At strain rates of 64.90 s−1 to 71.37 s−1, the d50 of the specimen debris ranges from 40 to 50 mm, indicating a low level of damage to the rock samples. This is because the higher the strain rate is, the higher the total dissipated energy density of the rock sample is, the more energy the specimen absorbs, and the smaller the size of the particle fragments is.
Regarding the relationship between the crushed rock particle size and quantity, a fractal model that uses particle mass distribution to describe the fractal characteristics of rocks has been proposed [42]. In this paper, a fractal model of the mass distribution is used to calculate the fractal dimension of the specimens at different strain rates. The fractal dimension D can be obtained according to the mass-frequency relationship of the screening test, and the distribution equation of rock fragments generated under an impact load is [43,44,45]:
where Md is the mass of particles in a fractured rock sample with a particle size less than d, g; Ms is the total mass of the fractured rock sample, g; d indicates the size of the particle, mm; dm is the minimum particle size, mm; dM is the maximum particle size, mm; and D is the fractal dimension of the rock chip.
Assuming that the minimum particle size (dm) among the fractured specimen particles is 0, Equation (7) can be written as:
taking the logarithm of both sides of Equation (7), it can be expressed as:
According to Equation (8), if is taken as the vertical coordinate, with as the horizontal coordinate and (3 − D) as the slope, the fractal dimension D can be obtained from the screening data of the specimen [46,47,48].
After the dynamic impact experiments, we obtained a linear fit to the particle size classification data screened for each specimen. From the fitting results shown in Figure 11, it can be seen that D gradually increased as the strain rate increased. This illustrates that as the strain rate increases, the degree of fragmentation and the proportion of fine particles in the rock samples gradually increases. It also shows that the distribution of the fragmentation mass of the rock samples under impact loading conforms to the fractal law.
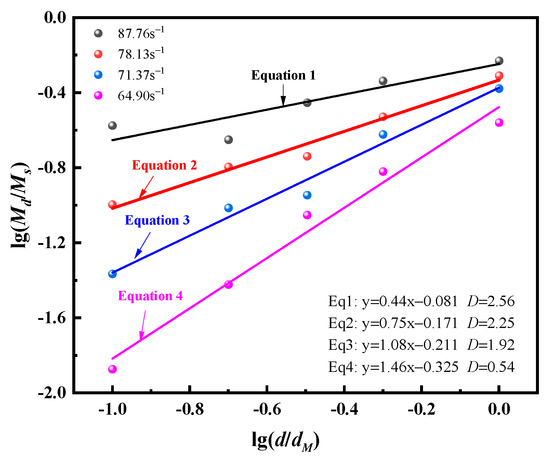
Figure 11.
curves of fragmentation distribution.
3.4. Relationship between the Energy Consumption Density and Fractal Dimension
According to the theory of rock fracture mechanics, particle breakage and frictional sliding are the main forms of energy dissipation in granular materials, both of which have a decisive influence on the macroscopic mechanical properties of granular materials [49,50]. The entire process of rock deformation and damage is accompanied by energy evolution [51,52,53]. It is thus clear that energy and fragmentation are closely related. To quantitatively describe the relationship between the crushing of rock samples and energy, the relationship between the crushing fractal dimension of the samples and the energy consumption density was plotted. As can be seen from Figure 12, D grew gradually as the energy consumption density value of the rock samples increased. This shows that as the energy density value increases, the degree of fragmentation of the rock sample is increased, the size of the fragmentation particles decreases, and the block distribution gradually tends to become uniform.
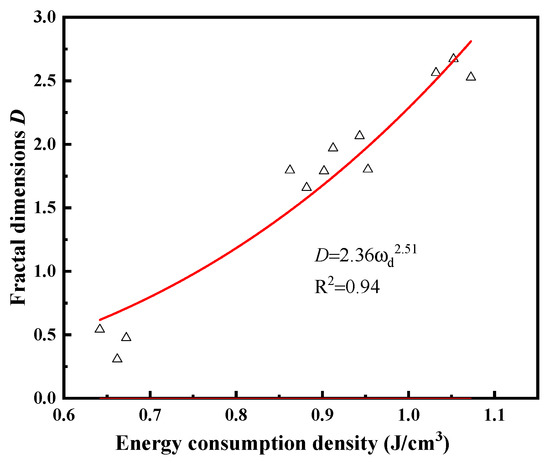
Figure 12.
The relationship between the energy consumption density and fractal dimensions.
4. Conclusions
By simulating the stress state of marble in the deep part of an underground mine and carrying out a dynamic impact experiment under the conditions of a three-dimensional dynamic and static combination, we can observe the following characteristics of deep marble:
- (1)
- The overall law of incident energy (EI), transmission energy (ET), absorption energy (ES), and reflection energy (ER) is shown as EI > ET > ES > ER. In the impact process, only 30%–38% of the incident energy is absorbed by the marble sample for the development of cracks, and more than half of the energy is transmitted.
- (2)
- As the strain rate increases, the energy consumption gradually increases, and the fractal dimension (D) gradually increases. The damaged state of the marble sample is transformed from the crimped destruction to the pulverized state, and the crushing scale gradually decreases and stabilizes.
- (3)
- There is a power function relationship between the fractal dimension and the energy consumption density. As the energy density increases, the fragmentation degree of the marble sample increases, the size of the fragmentation particles decreases, and the block distribution gradually tend to become uniform. However, the rock samples showed obvious excessive comminution.
Author Contributions
Conceptualization, methodology, validation, data curation, visualization, and writing—original draft preparation, L.L. and Y.L.; experimental guidance and data analysis, J.W.; theoretical analysis, Y.Y. and Y.H.; formal analysis and writing—review and editing, all authors. All authors have read and agreed to the published version of the manuscript.
Funding
This research was funded by the National Natural Science Foundation of China (No. 52164009), the Surface Project of Basic Research Program of Yunnan Province (No. 202201AT070178), and the National-Local Joint Engineering Laboratory of Building Health Monitoring and Disaster Prevention Technology Open Foundation (No. GG19KF002).
Data Availability Statement
The data used to support the findings of this study are included in the article.
Conflicts of Interest
The authors declare that they have no conflict of interest.
References
- Feng, X.; Ding, Z.; Hu, Q.; Zhao, X.; Ali, M.; Banquando, J.T. Orthogonal Numerical Analysis of Deformation and Failure Characteristics of Deep Roadway in Coal Mines: A Case Study. Minerals 2022, 12, 185. [Google Scholar] [CrossRef]
- Xie, H.; Lu, J.; Li, C.; Li, M.; Gao, M. Experimental study on the mechanical and failure behaviors of deep rock subjected to true triaxial stress: A review. Int. J. Min. Sci. Technol. 2022, 32, 915–950. [Google Scholar] [CrossRef]
- Yu, M.; Zuo, J.; Sun, Y.; Mi, C.; Li, Z. Investigation on fracture models and ground pressure distribution of thick hard rock strata including weak interlayer. Int. J. Min. Sci. Technol. 2022, 32, 137–153. [Google Scholar] [CrossRef]
- Xiao, P.; Li, D.; Zhu, Q. Strain Energy Release and Deep Rock Failure Due to Excavation in Pre-Stressed Rock. Minerals 2022, 12, 488. [Google Scholar] [CrossRef]
- He, M.; Sui, Q.; Li, M.; Wang, Z.; Tao, Z. Compensation excavation method control for large deformation disaster of mountain soft rock tunnel. Int. J. Min. Sci. Technol. 2022, 32, 951–963. [Google Scholar] [CrossRef]
- Daniliev, S.; Danilieva, N.; Mulev, S.; Frid, V. Integration of Seismic Refraction and Fracture-Induced Electromagnetic Radiation Methods to Assess the Stability of the Roof in Mine-Workings. Minerals 2022, 12, 609. [Google Scholar] [CrossRef]
- Tan, L.; Ren, T.; Yang, X.; He, X. A numerical simulation study on mechanical behaviour of coal with bedding planes under coupled static and dynamic load. Int. J. Min. Sci. Technol. 2018, 28, 791–797. [Google Scholar] [CrossRef]
- Han, Z.; Li, D.; Li, X. Dynamic mechanical properties and wave propagation of composite rock-mortar specimens based on SHPB tests. Int. J. Min. Sci. Technol. 2022, 32, 793–806. [Google Scholar] [CrossRef]
- Gomah, M.; Li, G.; Bader, S.; Elkarmoty, M.; Ismael, M. Damage Evolution of Granodiorite after Heating and Cooling Treatments. Minerals 2021, 11, 779. [Google Scholar] [CrossRef]
- Oladele, T.; Bbosa, L.; Weatherley, D. Textural and Mineralogical Controls on Rock Strength Elucidated Using a Discrete Element Method Numerical Laboratory. Minerals 2021, 11, 1015. [Google Scholar] [CrossRef]
- Sengani, F. The use of ground Penetrating Radar to distinguish between seismic and non-seismic hazards in hard rock mining. Tunn. Undergr. Space Technol. 2020, 103, 103470. [Google Scholar] [CrossRef]
- Pavičić, I.; Briševac, Z.; Vrbaški, A.; Grgasović, T.; Duić, Ž.; Šijak, D.; Dragičević, I. Geometric and Fractal Characterization of Pore Systems in the Upper Triassic Dolomites Based on Image Processing Techniques (Example from Žumberak Mts, NW Croatia). Sustainability 2021, 13, 7668. [Google Scholar] [CrossRef]
- Wang, S.; Sun, L.; Li, X.; Wang, S.; Du, K.; Li, X.; Feng, F. Experimental Investigation of Cuttability Improvement for Hard Rock Fragmentation Using Conical Cutter. Int. J. Géoméch. 2021, 21, 06020039. [Google Scholar] [CrossRef]
- Wang, S.; Xiong, X.; Liu, Y.; Zhou, J.; Du, K.; Cui, Y.; Khandelwal, M. Stress–strain relationship of sandstone under confining pressure with repetitive impact. Geomech. Geophys. Geo-Energy Geo-Resour. 2021, 7, 39. [Google Scholar] [CrossRef]
- Zhu, Q.; Li, D.; Wang, W. Mechanical behavior and permeability evolution of sandstone with confining pressure after dynamic loading. Geomech. Geophys. Geo-Energy Geo-Resour. 2021, 7, 81. [Google Scholar] [CrossRef]
- Feng, J.; Wang, E.; Huang, Q.; Ding, H.; Zhang, X. Experimental and numerical study of failure behavior and mechanism of coal under dynamic compressive loads. Int. J. Min. Sci. Technol. 2020, 30, 613–621. [Google Scholar] [CrossRef]
- Dai, B.; Shan, Q.W.; Chen, Y.; Luo, X.Y. Mechanical and energy dissipation characteristics of granite under cyclic impact loading. J. Cent. South Univ. 2022, 29, 116–128. [Google Scholar] [CrossRef]
- Fakhimi, A.; Azhdari, P.; Kimberley, J. Physical and numerical evaluation of rock strength in Split Hopkinson Pressure Bar testing. Comput. Geotech. 2018, 102, 1–11. [Google Scholar] [CrossRef]
- Li, X.; Wu, Y.; He, L.; Zhang, X.; Wang, J. Research on Dynamic Properties of Deep Marble Influenced by High Temperature. Mathematics 2022, 10, 2603. [Google Scholar] [CrossRef]
- Wang, J.; Zuo, T.; Li, X.; Tao, Z.; Ma, J. Study on the Fractal Characteristics of the Pomegranate Biotite Schist under Impact Loading. Geofluids 2021, 2021, 1570160. [Google Scholar] [CrossRef]
- Zuo, J.; Yang, R.; Gong, M.; Ma, X.; Wang, Y. Fracture characteristics of iron ore under uncoupled blast loading. Int. J. Min. Sci. Technol. 2022, 32, 657–667. [Google Scholar] [CrossRef]
- Sanchidrián, J.A.; Ouchterlony, F.; Segarra, P.; Moser, P. Size distribution functions for rock fragments. Int. J. Rock Mech. Min. Sci. 2014, 71, 381–394. [Google Scholar] [CrossRef]
- Frenelus, W.; Peng, H.; Zhang, J. Creep Behavior of Rocks and Its Application to the Long-Term Stability of Deep Rock Tunnels. Appl. Sci. 2022, 12, 8451. [Google Scholar] [CrossRef]
- Feng, F.; Chen, S.; Zhao, X.; Li, D.; Wang, X.; Cui, J. Effects of external dynamic disturbances and structural plane on rock fracturing around deep underground cavern. Int. J. Coal Sci. Technol. 2022, 9, 15. [Google Scholar] [CrossRef]
- Li, Y.; Yang, R.; Fang, S.; Lin, H.; Lu, S.; Zhu, Y.; Wang, M. Failure analysis and control measures of deep roadway with composite roof: A case study. Int. J. Coal Sci. Technol. 2022, 9, 2. [Google Scholar] [CrossRef]
- Zhao, Y.; Zhou, H.; Zhong, J.; Liu, D. Study on the relation between damage and permeability of sandstone at depth under cyclic loading. Int. J. Coal Sci. Technol. 2019, 6, 479–492. [Google Scholar] [CrossRef]
- Saeidi, A.; Cloutier, C.; Kamalibandpey, A.; Shahbazi, A. Evaluation of the Effect of Geomechanical Parameters and In Situ Stress on Tunnel Response Using Equivalent Mohr-Coulomb and Generalized Hoek-Brown Criteria. Geosciences 2022, 12, 262. [Google Scholar] [CrossRef]
- Wang, S.; Li, X.; Yao, J.; Gong, F.; Li, X.; Du, K.; Tao, M.; Huang, L.; Du, S. Experimental investigation of rock breakage by a conical pick and its application to non-explosive mechanized mining in deep hard rock. Int. J. Rock Mech. Min. Sci. 2019, 122, 104063. [Google Scholar] [CrossRef]
- International Society for Rock Mechanics(ISRM). Suggested methods for determing tensile strength of rock materials. Int. J. Rock Mech. Min. Sci. Geomech. Abstr. 1978, 15, 99–103. [Google Scholar] [CrossRef]
- T/CSRME 00-2019; Chinese Society of Rock Mechanics and Engineering. Test Procedure for Dynamic Properties of Rocks. China Standards Press: Beijing, China, 2019.
- Yao, W.; Li, X.; Xia, K.; Hokka, M. Dynamic flexural failure of rocks under hydrostatic pressure: Laboratory test and theoretical modeling. Int. J. Impact Eng. 2021, 156, 103946. [Google Scholar] [CrossRef]
- Xiao, P.; Li, D.Y.; Zhao, G.Y.; Zhu, Q.Q.; Liu, H.X.; Zhang, C.S. Mechanical properties and failure behavior of rock with different flaw inclinations under coupled static and dynamic loads. J. Cent. South Univ. 2020, 2, 2945–2958. [Google Scholar] [CrossRef]
- Gao, W.; Zhu, Z.; Wang, M.; Ying, P.; Wang, F.; Niu, C.; Zhang, X. Influence of the interlaced holes on crack propagation behavior under impact loads. Int. J. Impact Eng. 2022, 163, 104178. [Google Scholar] [CrossRef]
- Li, J.; Sun, W.; Li, Q.; Chen, S.; Yuan, M.; Xia, H. Influence of Layered Angle on Dynamic Characteristics of Backfill under Impact Loading. Minerals 2022, 12, 511. [Google Scholar] [CrossRef]
- Zhang, Z.; Qian, Q.; Wang, H.; Huang, Y.; Wang, J.; Liu, H. Study on the Dynamic Mechanical Properties of Metamorphic Limestone under Impact Loading. Lithosphere 2021, 2021, 8403502. [Google Scholar] [CrossRef]
- Zhao, K.; Yu, X.; Zhou, Y.; Wang, Q.; Wang, J.; Hao, J. Energy evolution of brittle granite under different loading rates. Int. J. Rock Mech. Min. Sci. 2020, 132, 104392. [Google Scholar] [CrossRef]
- Peng, K.; Liu, Z.; Zou, Q.; Wu, Q.; Zhou, J. Mechanical property of granite from different buried depths under uniaxial compression and dynamic impact: An energy-based investigation. Powder Technol. 2020, 362, 729–744. [Google Scholar] [CrossRef]
- Zuo, T.; Zhao, Z.; Wang, J.; Li, X.; Tao, Z.; Yang, C. Analysis of Dynamic Damage Fractal and Energy Consumption Characteristics of Dolomite Marble. Shock Vib. 2022, 2022, 9440222. [Google Scholar] [CrossRef]
- Jendryś, M.; Duży, S.; Dyduch, G. Analysis of Stress-Strain States in the Vicinity of Mining Excavations in a Rock Mass with Variable Mechanical Properties. Energies 2020, 13, 5567. [Google Scholar] [CrossRef]
- Zhu, X.; Liu, W. The rock fragmentation mechanism and plastic energy dissipation analysis of rock indentation. Geomech. Eng. 2018, 16, 195–204. [Google Scholar]
- Nadi, B.; Tavasoli, O.; Kontoni, D.P.N.; Tadayon, A. Investigation of rock slope stability under pore-water pressure and structural anisotropy by the discrete element method. Geomech. Geoengin. 2019, 5, 452–464. [Google Scholar] [CrossRef]
- Wang, Y.; Yang, R. Study of the dynamic fracture characteristics of coal with a bedding structure based on the NSCB impact test. Eng. Fract. Mech. 2017, 184, 319–338. [Google Scholar] [CrossRef]
- Dou, L.; Yang, K.; Chi, X. Fracture behavior and acoustic emission characteristics of sandstone samples with inclined precracks. Int. J. Coal Sci. Technol. 2021, 8, 77–87. [Google Scholar] [CrossRef]
- Baranowski, P.; Kucewicz, M.; Gieleta, R.; Stankiewicz, M.; Konarzewski, M.; Bogusz, P.; Pytlik, M.; Małachowski, J. Fracture and fragmentation of dolomite rock using the JH-2 constitutive model: Parameter determination, experiments and simulations. Int. J. Impact Eng. 2020, 140, 103543. [Google Scholar] [CrossRef]
- Dong, P.; Wu, B.; Xia, K.; Wang, Q. Fracture modes of single-flawed rock-like material plates subjected to dynamic compression. Int. J. Geomech. 2020, 20, 04020145. [Google Scholar] [CrossRef]
- Hu, X.; Zhang, M.; Xu, W.; Tu, M.; Yin, Z.; Zhang, X. A Dynamic Coupled Elastoplastic Damage Model for Rock-like Materials Considering Tension-Compression Damage and Pressure-Dependent Behavior. Minerals 2022, 12, 851. [Google Scholar] [CrossRef]
- Yang, Y.; Zhang, N.; Wang, J. A Study on the Dynamic Strength Deterioration Mechanism of Frozen Red Sandstone at Low Temperatures. Minerals 2021, 11, 1300. [Google Scholar] [CrossRef]
- Zhang, P.; Pu, C.; Shi, X.; Xu, Z.; Ye, Z. The Numerical Simulation and Characterization of Complex Fracture Network Propagation in Multistage Fracturing with Fractal Theory. Minerals 2022, 12, 955. [Google Scholar] [CrossRef]
- Azarafza, M.; Bonab, M.H.; Derakhshani, R. A Deep Learning Method for the Prediction of the Index Mechanical Properties and Strength Parameters of Marlstone. Materials 2022, 15, 6899. [Google Scholar] [CrossRef]
- Mader, T.; Schreter, M.; Hofstetter, G. On the Influence of Direction-Dependent Behavior of Rock Mass in Simulations of Deep Tunneling Using a Novel Gradient-Enhanced Transversely Isotropic Damage–Plasticity Model. Appl. Sci. 2022, 12, 8532. [Google Scholar] [CrossRef]
- Li, X.; Fang, C.; Wang, J. Effect of charge coefficient on directional fracture of slotted charge. J. Vib. Control 2022, 10775463221125383. [Google Scholar] [CrossRef]
- Wang, Y.; Wen, Z.; Liu, G.; Wang, J.; Bao, Z.; Lu, K.; Wang, B. Explosion propagation and characteristics of rock damage in decoupled charge blasting based on computed tomography scanning. Int. J. Rock Mech. Min. Sci. 2020, 136, 104540. [Google Scholar] [CrossRef]
- Liang, W.; Li, K.; Luo, J.; Zhe, Y.; Xu, M.; Feng, F. Experimental Study on the Interaction between Backfill and Surrounding Rock in the Overhand Cut-and-Fill Method. Minerals 2022, 12, 1017. [Google Scholar] [CrossRef]


Disclaimer/Publisher’s Note: The statements, opinions and data contained in all publications are solely those of the individual author(s) and contributor(s) and not of MDPI and/or the editor(s). MDPI and/or the editor(s) disclaim responsibility for any injury to people or property resulting from any ideas, methods, instructions or products referred to in the content. |
© 2023 by the authors. Licensee MDPI, Basel, Switzerland. This article is an open access article distributed under the terms and conditions of the Creative Commons Attribution (CC BY) license (https://creativecommons.org/licenses/by/4.0/).