Article

Periodic Characteristics of the Paleogene Tectonic Activity and Sedimentation Responses in the Deep-Water of Qiongdongnan Basin, South China Sea

1
No. 1 Institute of Geology and Mineral Resources of Shandong Province, Shandong Provincial Bureau of Geology & Mineral Resources, Jinan 250014, China
2
School of Water Conservancy and Environment, University of Jinan, Jinan 250022, China
3
College of Earth Science and Engineering, Shandong University of Science and Technology, Qingdao 266590, China
4
Beijing Research Center, CNOOC (China) Co., Ltd., Beijing 100010, China
*
Author to whom correspondence should be addressed.
Minerals 2023, 13(2), 262; https://doi.org/10.3390/min13020262
Submission received: 28 November 2022 / Revised: 28 January 2023 / Accepted: 8 February 2023 / Published: 13 February 2023

Abstract

:
In this study, the periodic evolution and characteristics of the Palaeogene tectonic activity in the deep-water area of the Qiongdongnan Basin were revealed through the identification and analysis of the regional angular unconformity and the characteristics of the periodic fault activity. In addition to a comprehensive analysis of the controls on sedimentary paleogeomorphologic background, sedimentary characteristics and evolution by periodic rifting are systematically discussed. The studies have shown that the tectonic activity of the Paleogene Qiongdongnan Basin underwent three separate rifting phases: Phase-I (T100–T80), Phase-II (T80–T70), and Phase-III (T70–T60). The early phase of rifting was dominated by strong differential block-fault settlement, while the later phase was gradually replaced by homogeneous settlement controlled by regional depressions and a small amount of fault activity, characterized by a weak-strong-weak evolution. From Phase-I to Phase-III, the paleo-geomorphology margin changed from a large gradient to a gentle gradient, the subsidence center moved from the initial basin margin to the later basin center, and the basin-marginal fans extended finitely before developing on a large lateral scale in the later Phase-III. Analyzing the characteristics of periodic tectonic evolution and sedimentation response is important for petroleum exploration in marine basins, such as locating economic reservoirs.

1. Introduction

Research regarding the formation and evolution of rift basins and their filling characteristics remains one of the leading fields and hot topics in contemporary petroleum geology [1,2,3]. In previous investigations, a large number of basin examples have shown that rift basins develop under the general extensional background of the continental lithosphere [4,5]. The formation and evolution of rift basins are generally periodic or intermittent and are characterized by multi-phase rifting processes [6,7,8,9]. Periodic tectonic cycles and multi-phase tectonic evolution have profound impacts on syn-depositional faulting activities, tectonic patterns, and sedimentation, as well as the burial and thermal evolution of sediment, thereby controlling the generation conditions and accumulation laws of hydrocarbons within basins [10,11,12,13]. From the past to recent years, episodic tectonism and its influence on sedimentation have been hot topics in basin research [14,15,16].
As the demand for petroleum resources has increased and the exploration of land and shallow-water areas has become more excessive, deep-sea water areas have become increasingly important for hydrocarbon exploration [17,18]. In the South China Sea, the deep-water areas, particularly those of the Qiongdongnan (QDN) Basin, have attracted increasing attention in China during the past several years [19,20]. However, in contrast to onshore basins, deep-water areas lack boreholes, and the buried strata and potential sedimentary facies are only revealed by seismic studies, which leads to high-stakes risks in petroleum prospection in deep-water areas [21]. Furthermore, fundamental geological research concerning sedimentation responses to tectonic evolution using scientific approaches has been astonishingly rare.
Selecting the deep-water area of the Paleogene QDN Basin as an example, this study aims to analyze the fault activity characteristics and subsidence evolution history, recognize the types of sedimentation in the basin, and finally discuss the characteristics of tectonic evolution and sedimentation response. The results obtained in this research would not only help future predictions of favorable sedimentary facies (such as potential reservoirs) but also contribute to reducing the high-stakes risks related to the exploration of basins similar to the QDN Basin.

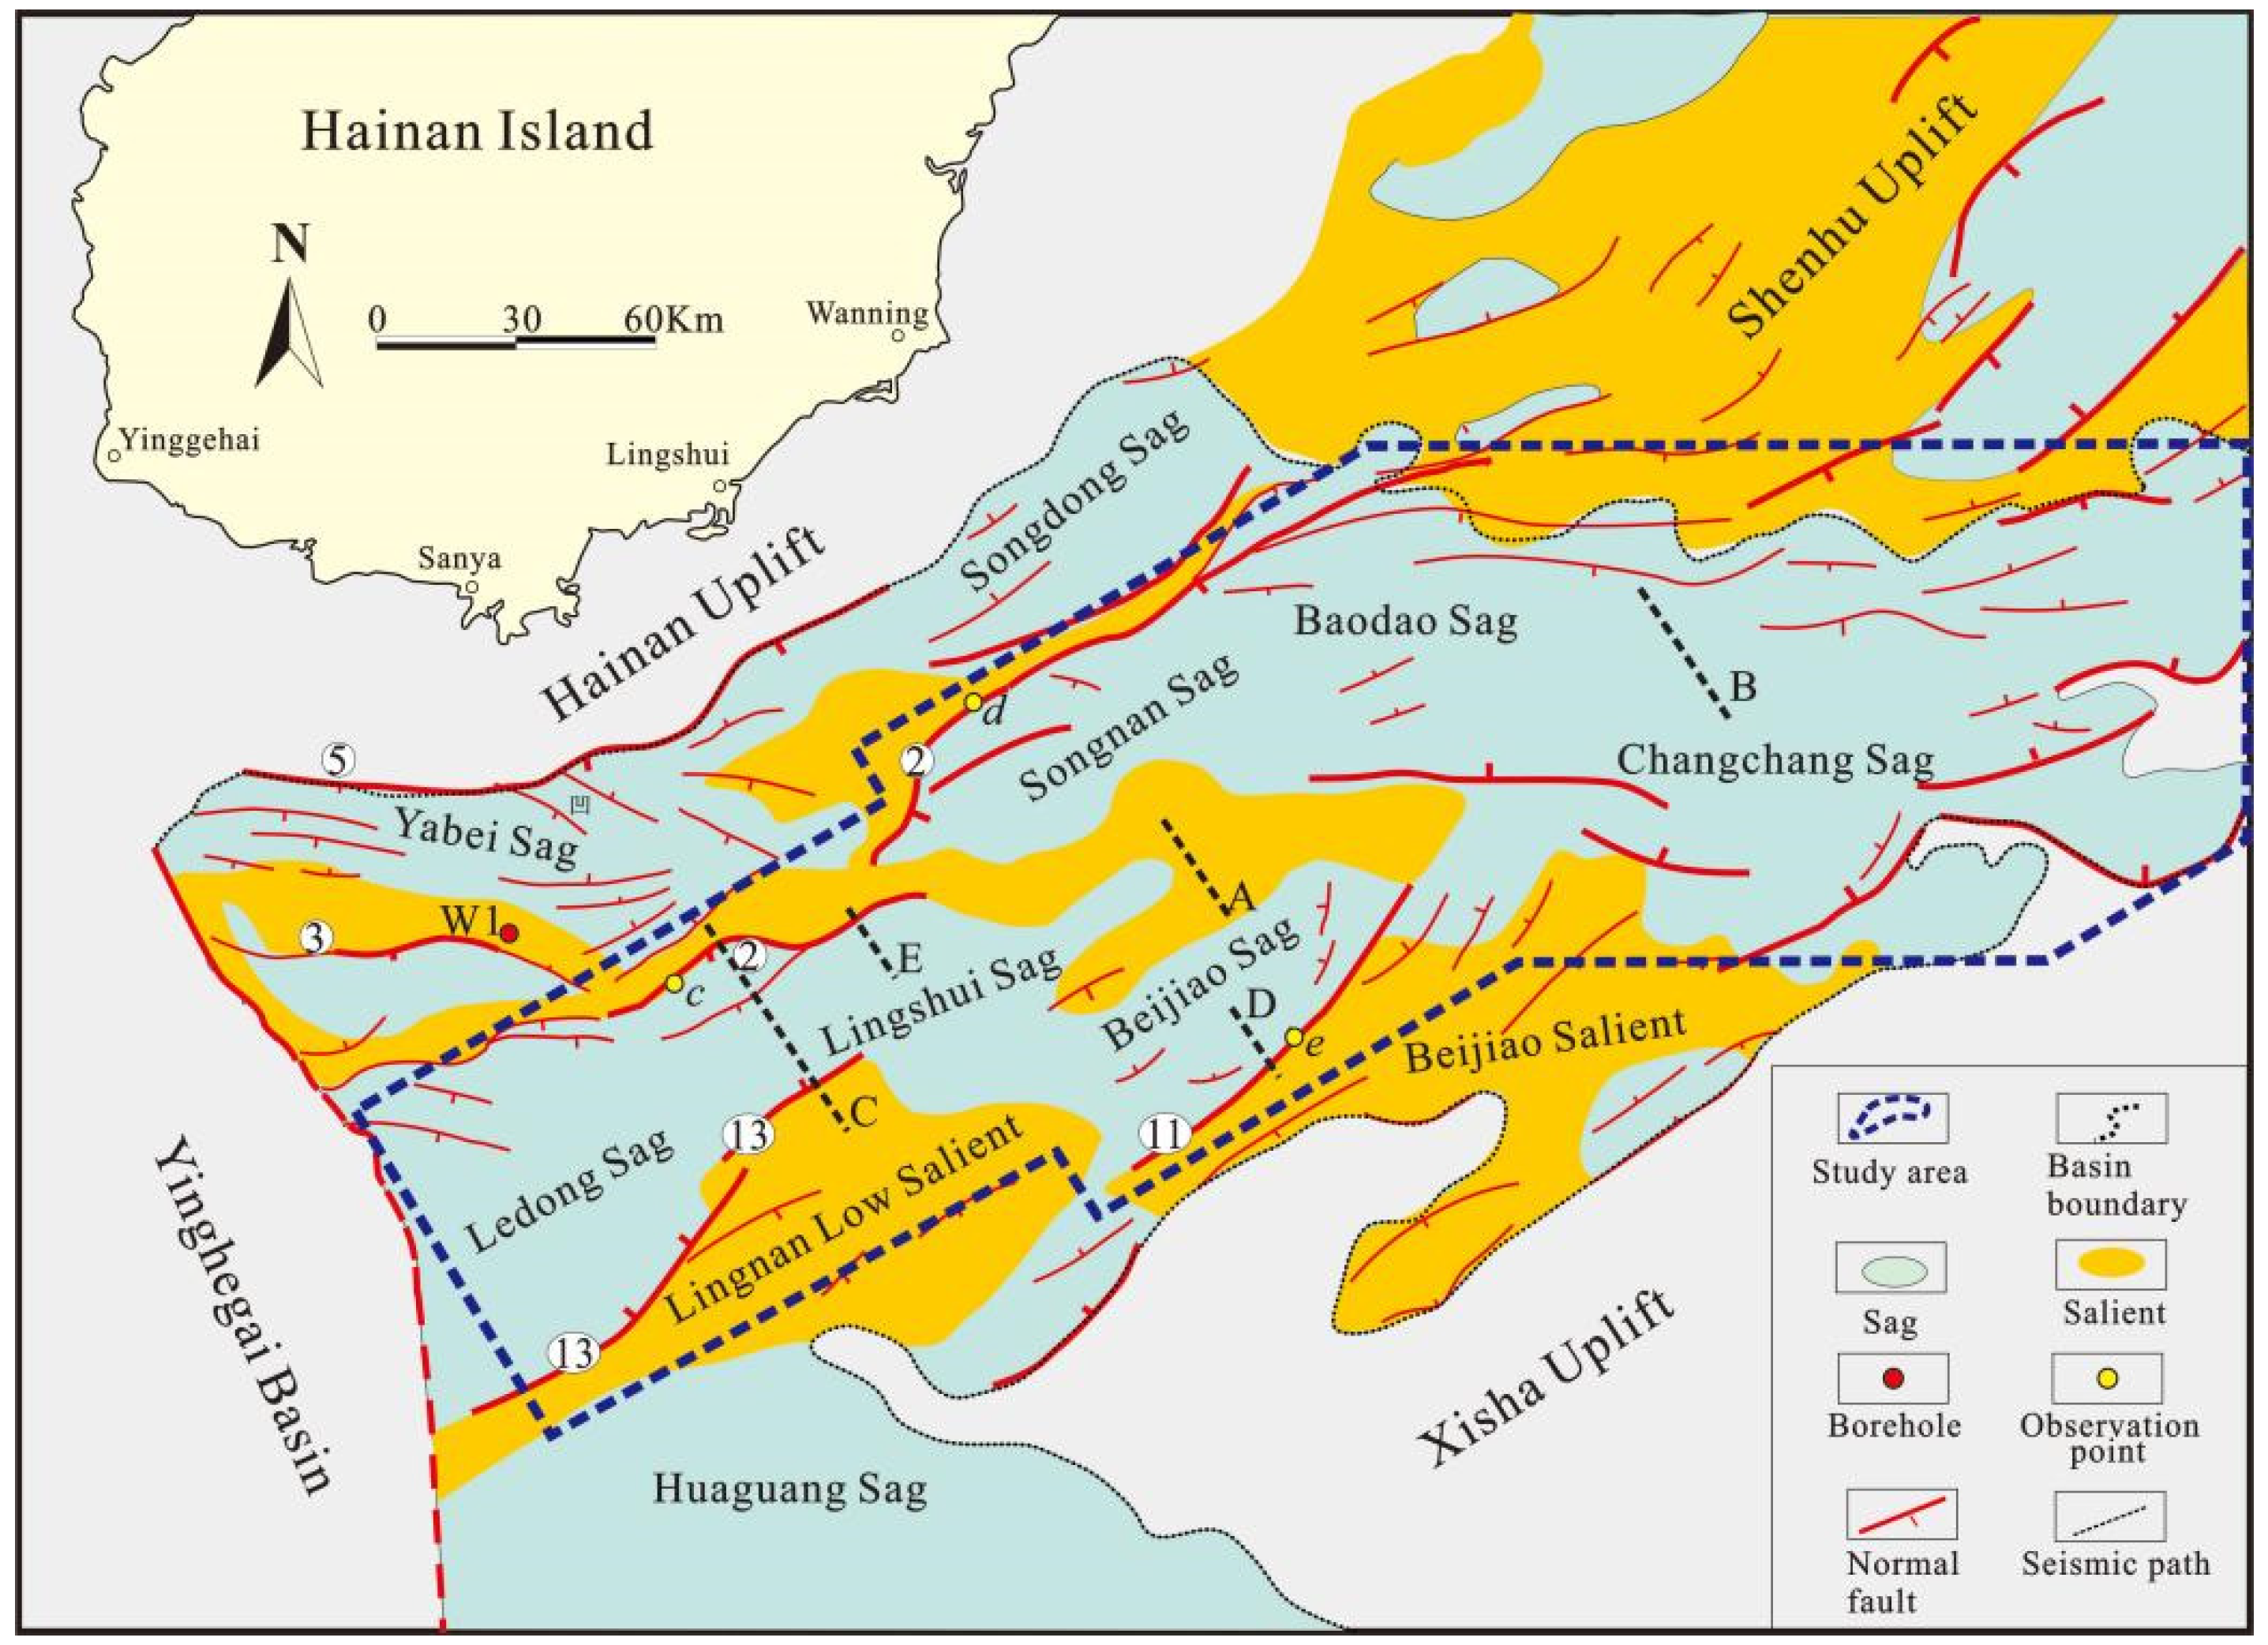
2. Geologic Settings

The QDN Basin is a NE-trending Cenozoic epicontinental extensional petroliferous basin located in the western section of the northwestern South China Sea in the NE direction [22]. It is adjacent to the Yinggehai Basin in the west, the Shenhu Uplift in the east, the Hainan Uplift in the north, and the Yongle Uplift in the south, as detailed in Figure 1. Similar to many Meso-Cenozoic faulted basins in eastern China, the QDN Basin has undergone two major tectonic evolution phases: Paleogene rifting and Neogene depression. The basin has a typical “lower fault-upper depression” two-layer structure, among which the unconformable boundary T60 developed [23]. It was observed that, from north to south, the basin could be divided into the following four first-level tectonic units: the northern depression zone, central uplift zone, central depression zone, and southern uplift zone. The northern depression zone includes the Yabei Sag, Songxi Sag, Songdong Sag, and Songdong Salient. The central depression zone includes the Yanan Sag, Ledong Sag, Lingshui Sag, Beijiao Sag, Songnan Sag, Baodao Sag, and Changchang Sag, as well as secondary structural units such as the Lingnan Low Salient and Songnan Low Salient (SLS), which constitute the deep-water areas of the QDN Basin. The sedimentary filling sequences of the Paleogene were determined to be, from bottom to top, as follows: Eocene, Lower Oligocene Yacheng Formation, and Upper Oligocene Lingshui Formation [24] (Table 1). It was found that large-scale ENE-trending faults had developed in the study area, which mainly included the No. 2 Fault, No. 2-1 Fault, No. 14 Fault, and No. 11 Fault. The fault locations are detailed in Figure 1.

3. Materials and Methods

In this research investigation, the basic documents were composed of boreholes, well logs, and seismic profiles provided by the China National Offshore Oil Corporation (CNOOC). The QDN basin has been covered with two-dimensional seismic profiles that have a spacing of around 2 km. Some previous research results were also referred to in this paper. These data provided the basis for further research and allowed this study to focus on its objectives.

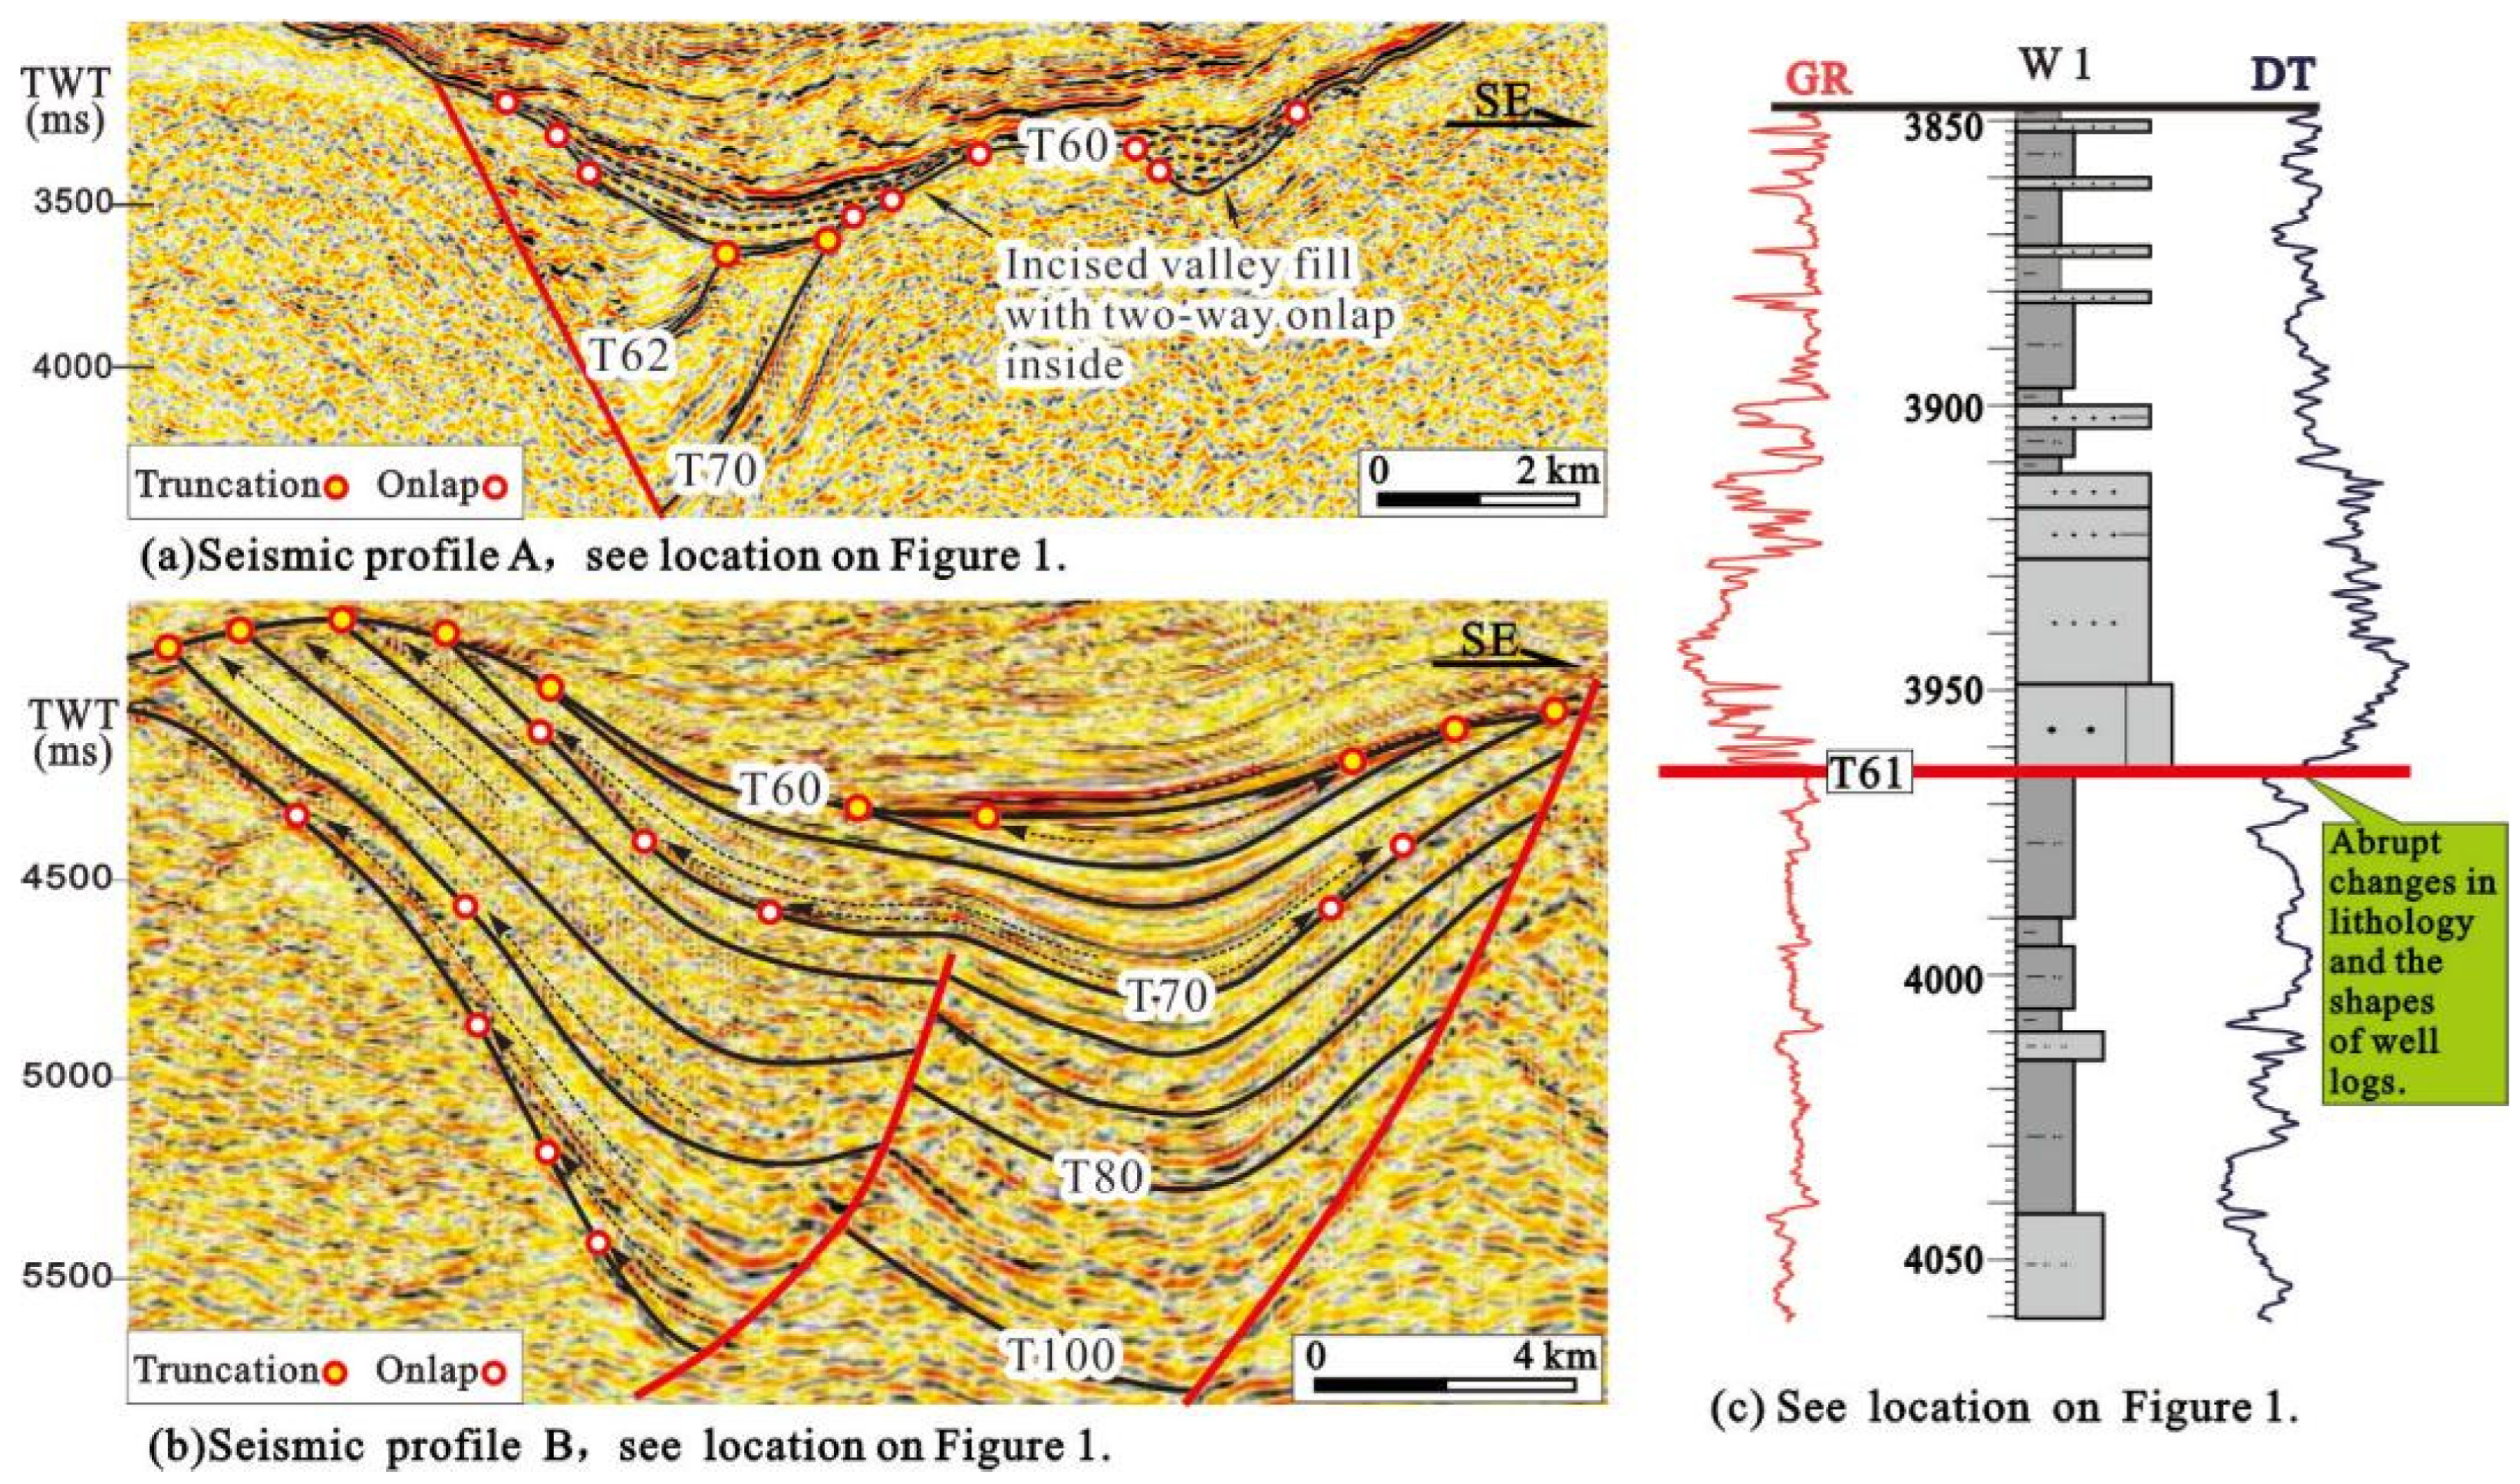
3.1. Recognition of the Sequence Boundaries

Initially, the sequence boundaries were recognized through the analysis of the seismic data, boreholes, and well logs. For example, as shown in Figure 2, the incised valley fills, the onlap and truncation points, or the sudden change of the logging curves could all indicate the sequence boundary. These criteria were put forward and used by previous scholars [25,26,27]. The obtained results provided the basis for conducting this study’s examinations of the periodic tectonic activities and sedimentation responses in the region.

3.2. Calculation of Fault Activity Rate

It is known that fault activity is one of the manifestations of tectonic activity [28,29,30,31,32]. In the present investigation, for the deep-water areas of the Paleogene QDN Basin, the evolution of the fault activity was analyzed in order to examine the tectonic activity according to the existing data and previous research findings.
At present, the research methods for fault activity mainly include the fault growth index method, the fault throw method, and the fault activity rate method [32]. After the fault growth index method and drop method were used to study the activity of syndepositional faults, they were widely used. However, both methods have disadvantages. Sometimes the same fault growth index or drop can be calculated from different sedimentary results, resulting in a wrong understanding of fault activity, such as 200 m/100 m = 20 m/10 m = 2. Especially with the fault growth index method, when the down wall is missing, the result will even appear infinite, which makes it impossible to judge and analyze the fault activity. The fault activity rate refers to the ratio of the fault throw formed by fault activity to the corresponding deposition time in a certain period of a stratigraphic unit (Figure 3), representing the fault throw of the fault in unit time. By comparing its value, the fault activity can be represented, which has more practical significance [32].

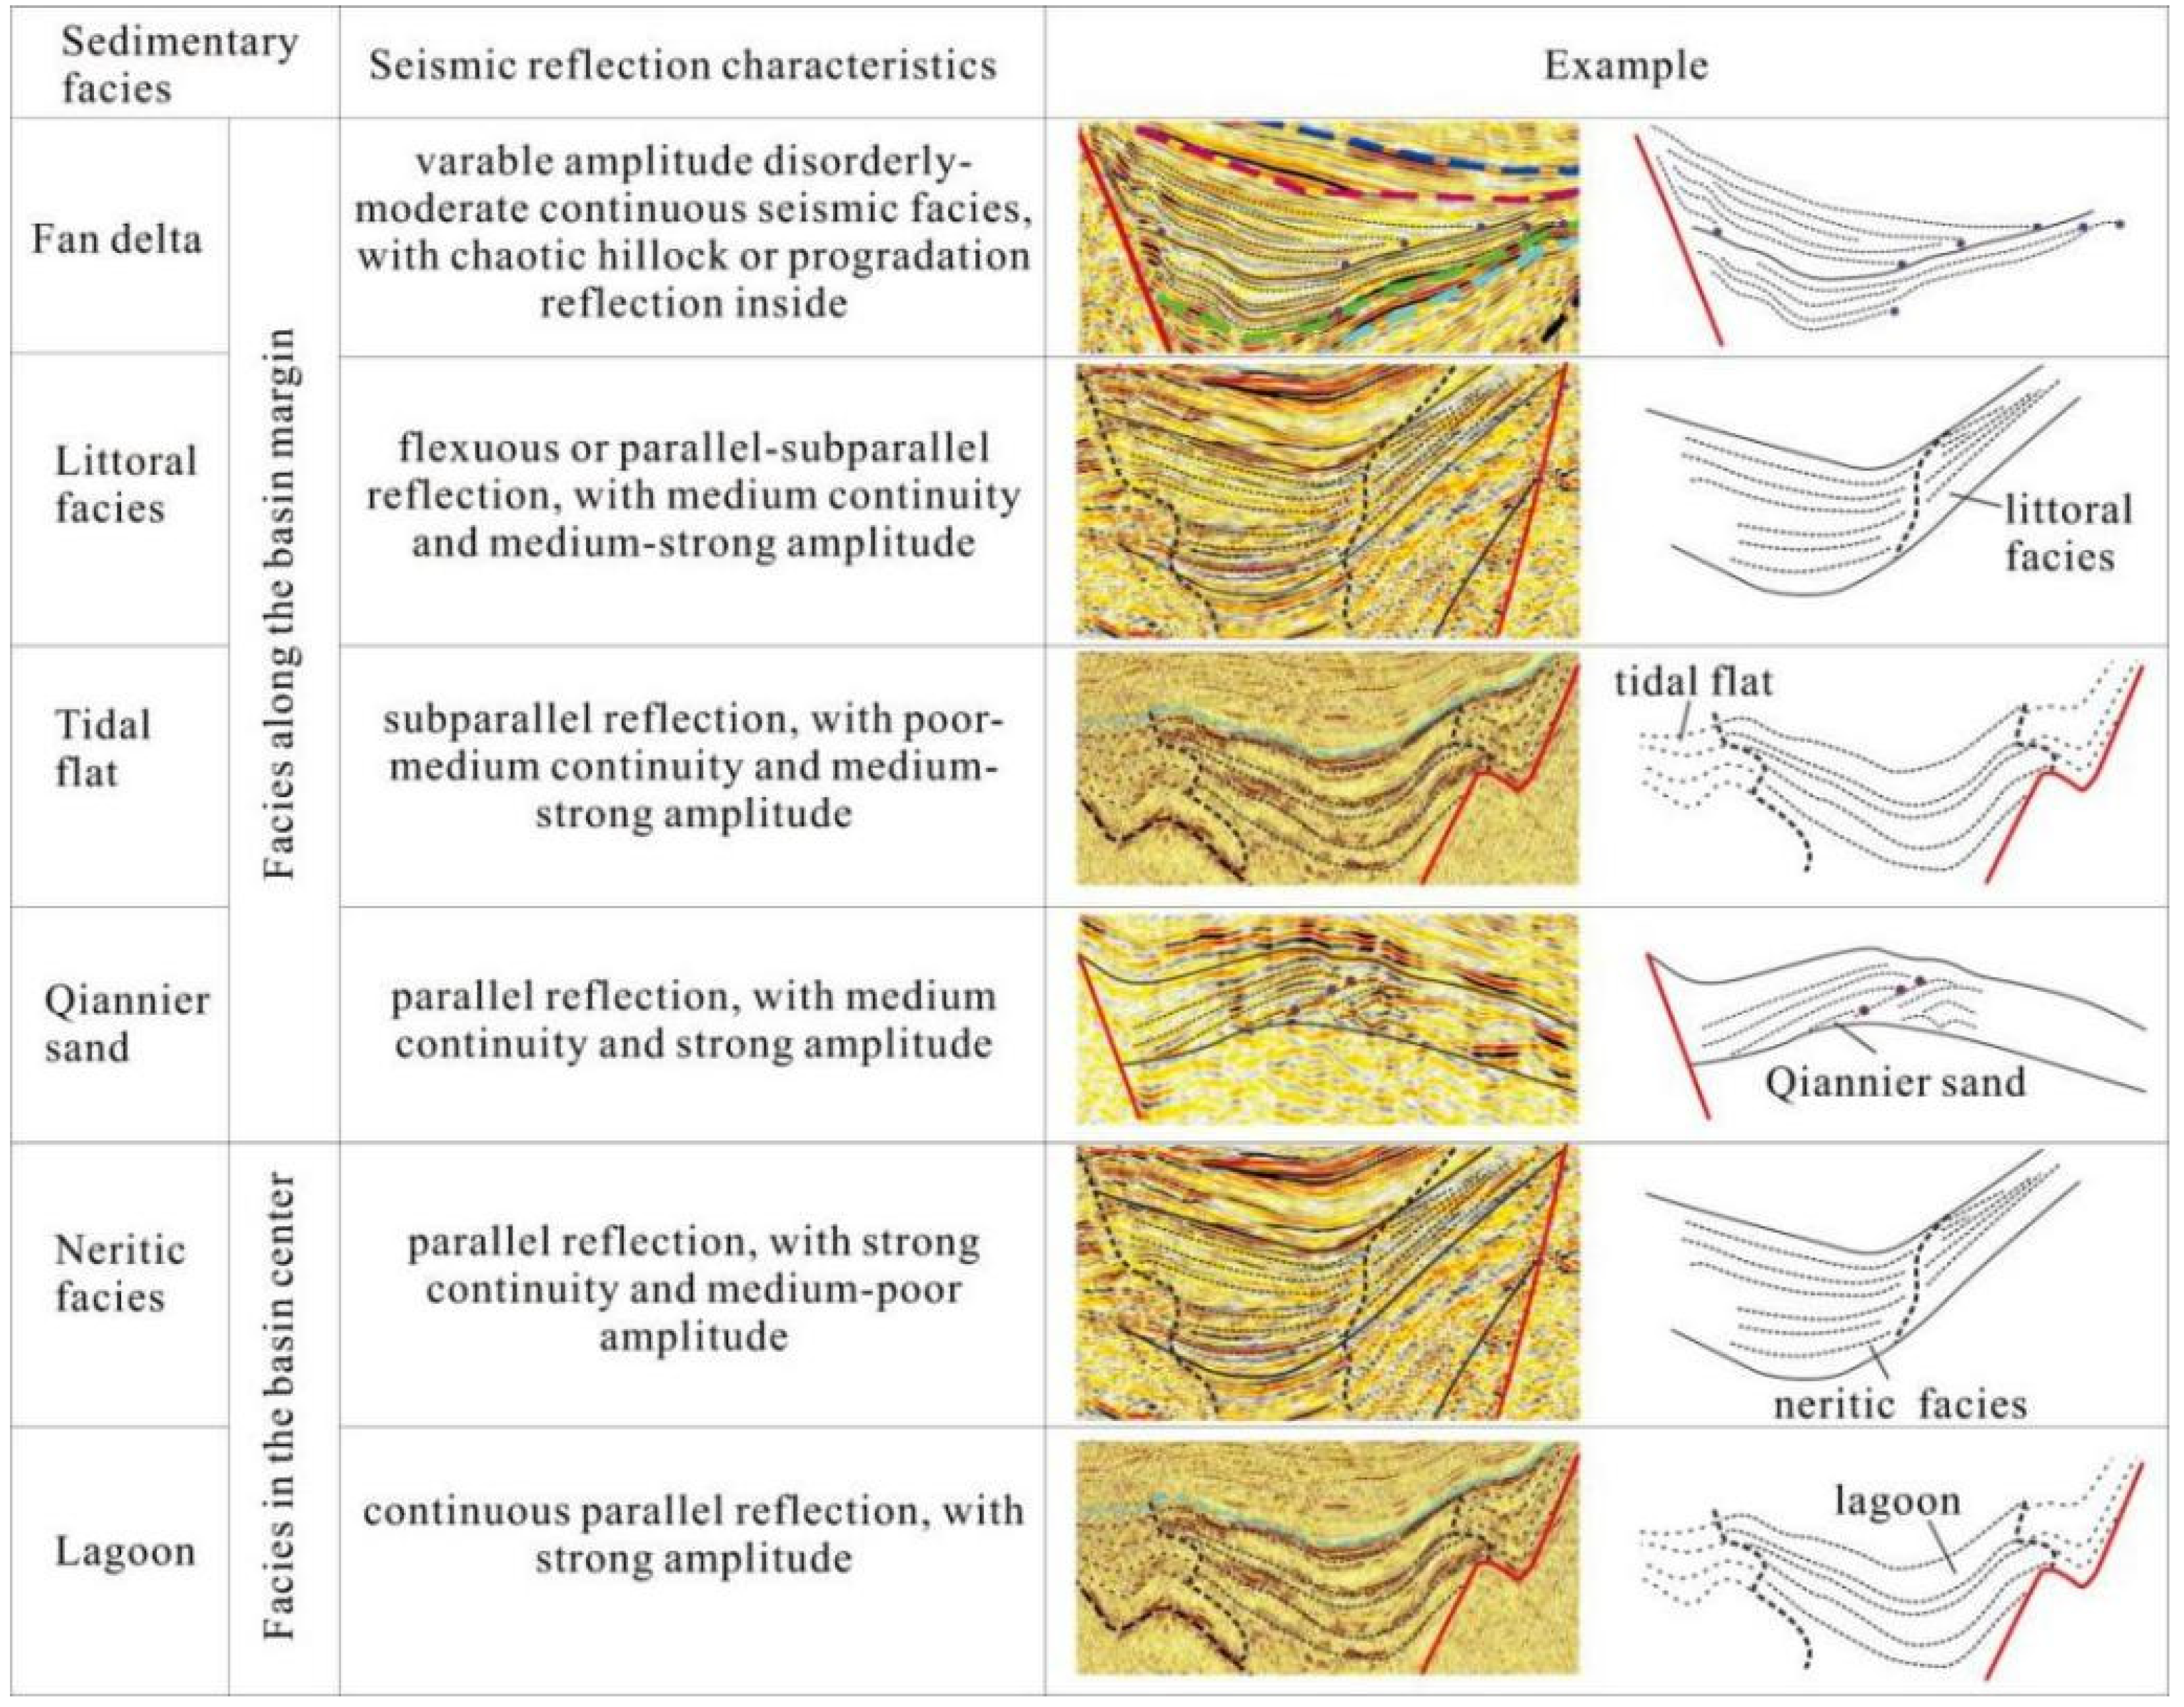
3.3. The Methods for Researching Sedimentation

Tectonic activity could influence the sedimentation. In this study, the paleo-geomorphological background of the sedimentation, the subsidence center migration, and the characteristics of basin-marginal fans were researched to discuss the sedimentation response to the tectonic activity.
Based on recognizing the sequence boundaries, the seismic survey lines passing through significant structural units were selected to continue the backstripping procedure, which was also widely used by previous researchers (e.g., Zhao et al., 2021 [33]; Li and Aschoff, 2022 [34]), to simulate the subsidence history with EBM software. Then the paleo-geomorphological background of the sedimentation was analyzed using the simulated subsidence history.
In the study area, the seismic facies characteristics of the developed sedimentary facies, especially the basin-marginal fans, were concluded (Figure 4), based on which the plane sedimentary facies of the study area could be delineated for analyzing the responses of the basin-marginal fans to the tectonic activity.
The gradient of the paleo-geomorphology and the basin-marginal fans were chosen in this investigation in order to delineate the characteristics and scales of the fan deposits. Formulas (1) and (2) were used to calculate the two types of slopes, respectively. The aforementioned formulas have been widely accepted and used by previous scholars (e.g., Zhao et al., 2001 [35]; Song et al., 2020a [36]).
Tan θ = (d2d1)/s
where θ represents the slope gradient of the paleo-geomorphology; d1 and d2 denote two points perpendicular to the stratum trend; (d2d1) indicates the difference in thickness value; and s is the horizontal distance between those two points.
tan x = A/B
where x indicates the slope gradient of the deltas developing along the basin margin; and A and B represent the vertical distance and horizontal distance between the front edge of the pro-delta and the front edge of the delta front, respectively.

4. Results

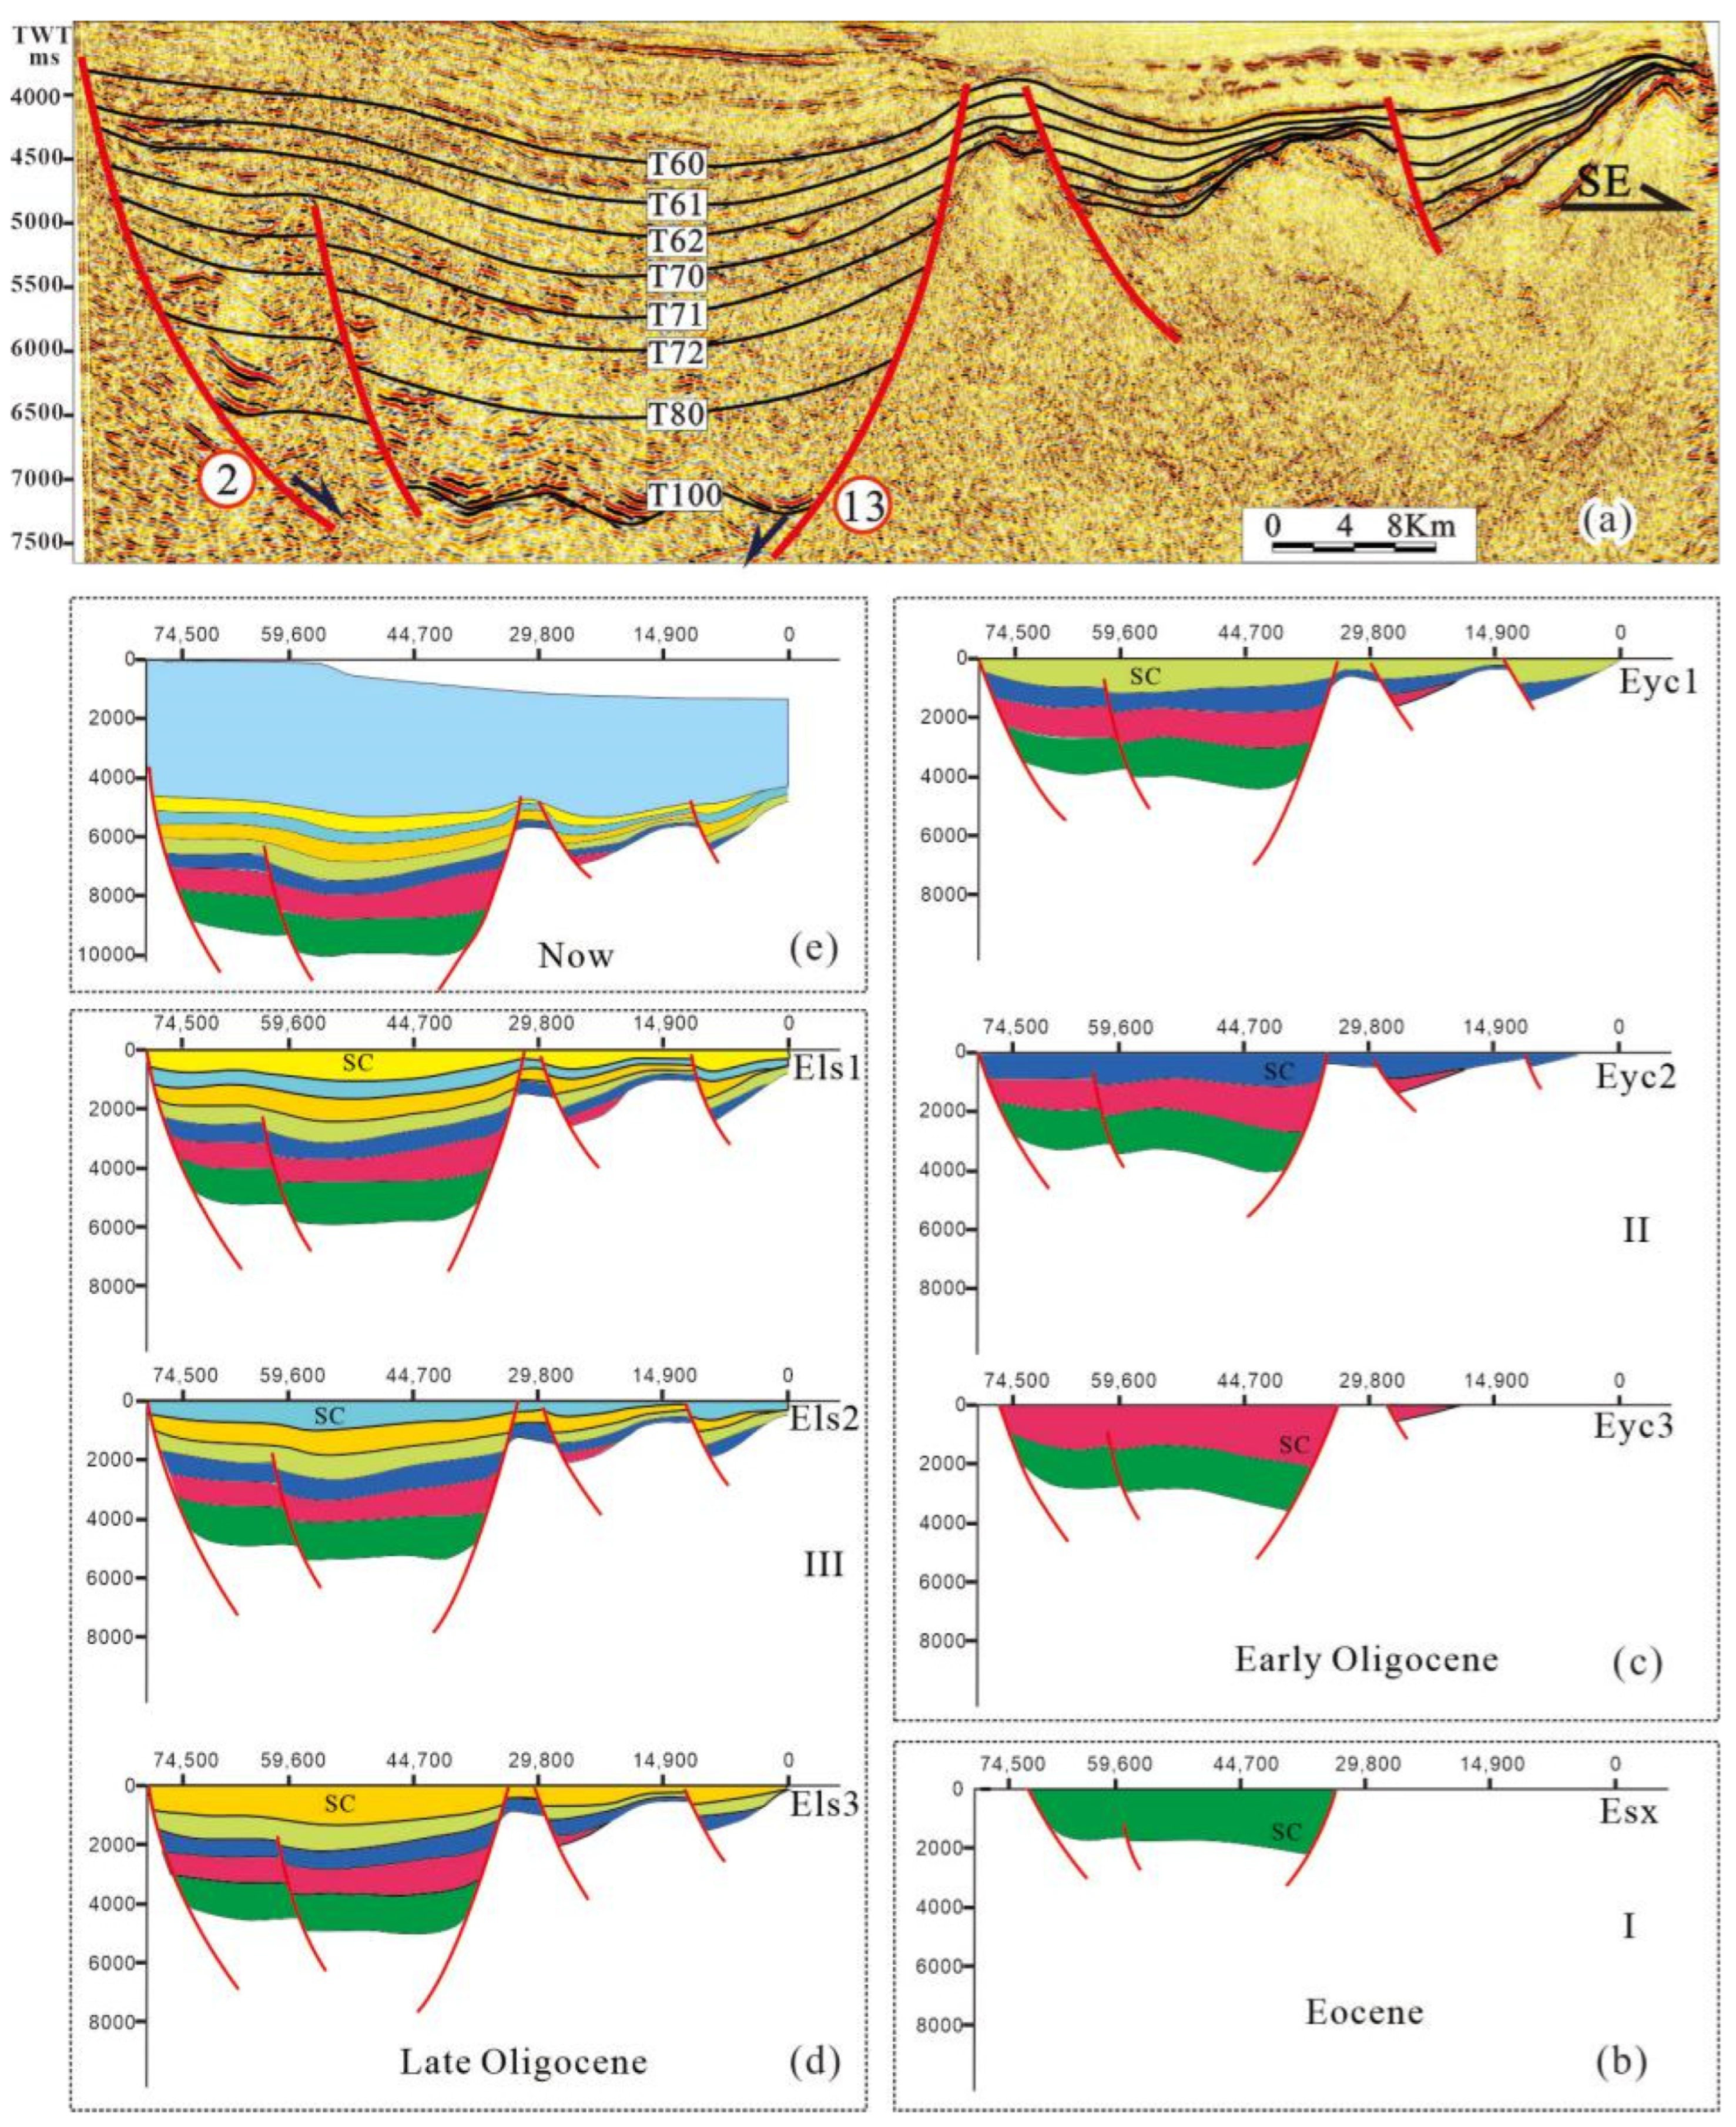
4.1. Sequence Boundaries

This study recognized eight sequence boundaries in total, including T100, T80, T72, T71, T70, T62, T61, and T60 from bottom to top (Table 2), and established the Paleogene sequence framework (Figure 2b).
Of the eight recognized surfaces, T100, T80, T70, and T60 represented the four large unconformity surfaces, which are angular unconformities that developed extensively and universally along the whole basin. The property and scale of those surfaces, as well as the lithology, occurrence, contact relationships, and amount of loss in the upper and lower strata, were observed to have distinct characteristics. The detailed analysis of those unconformity surfaces was thought to be helpful for studying the tectonic evolution characteristics of the basin.
T100 was determined to be the boundary between the Cenozoic and pre-Cenozoic epochs, and it represented the beginning of Cenozoic evolution within the basin. Continuous and strong amplitude dual-track reflections were generally found on the sloped edges of the depression, as well as on the low uplifts (T100). However, towards the center of the basin, the boundary shows a variable amplitude reflection. T100 covered all the structural units of the basin and acted as the sedimentary basement region of the basin. The surface acted as the first-order sequence boundary.
T80 was confirmed as the boundary between the Eocene and Oligocene. In the seismic profiles, it was characterized by medium-strong amplitudes and relatively continuous reflections. It can mainly be identified in the deeper depressions, and its distribution is limited. In addition, the interface was a transition surface that extended from the continental lake basin to a semi-enclosed shallow sea and then onward toward the coastal plain. This represented a major change in the sea-land environment [27]. The surface basically acted as a second-order sequence boundary.
T70 was the boundary between the Early Oligocene and the Late Oligocene. It was observed that around the positive structures this boundary displayed onlapping above the basement, and its distribution range was greatly expanded when compared to the T80. It was found to be the largest angular unconformity surface in the Paleogene system. In addition, within the slope belt along the edge of each depression, the upper and lower strata of this interface often presented a “fish-bone” contact relationship, as shown in Figure 2c. In other words, the unconformity of the mid-low angle erosion was located below the interface, while the onlapping was found to be significantly developed above the interface. The surface acted as a second-order sequence boundary.
T60 was determined to be the boundary between the Paleogene and Neogene and acted as the post-rift unconformity between the rifting and depression stages. Moreover, at the positive structures, it was found to overlap with the basement, and its development scale covered the entire deep-water area of the QDN Basin. This surface was a regional breakup unconformity, which could be traced throughout the entire basin and separates the “two-layered” structure. The surface acted as a first-order sequence boundary.

4.2. Evolution of the Fault Activity

The activities on the main faults were examined using the fault activity rate analysis method, as detailed in Figure 5. The results revealed that the Paleogene fault activities could be equated to the following three secondary processes: the Eocene active phase (Phase-I, T100-T80), the Early Oligocene active phase (Phase-II, T80-T70), and the Late Oligocene active phase (Phase-III, T70-T60). The activity rates of the faults were observed to vary greatly during the different phases. The activity rate of point c on the No. 2 fault was 56.42 m/Ma at the Eocene active phase, 113.2–435.4 m/Ma at the early Oligocene active phase, and about 96.3–127.5 m/Ma at the late Oligocene active phase. Similarly, the fault activity rate at point d on the No. 2 fault was 135 m/Ma, 296–136 m/Ma, and 151–62 m/Ma for Phases I-III, respectively, and the fault activity rate at point e on the No. 11 fault was 20.15 m/Ma, 202.4–417.5 m/Ma, and 93.2–217.6 m/Ma for Phases I-III, respectively. Inside each phase, the fault activity first rose rapidly to a peak value and then reduced gradually to a minimum value. Taking the entire phase as the research object, the fault activity of point c on the No. 2 fault was 56.42 m/Ma at the Eocene active phase, 248.3 m/Ma at the early Oligocene active phase, and about 121.4 m/Ma at the late Oligocene phase. Similarly, the fault activity of point d on the No. 2 fault was 57.13 m/Ma, 174.7 m/Ma, and 75.1 m/Ma, respectively, and the fault activity of point e on the No. 11 fault was 20.15 m/Ma, 299.6 m/Ma, and 173.1 m/Ma, respectively, showing a small-large-small evolution trend.
The fault activity mainly caused the tectonic subsidence, which was important but not the only component of the total subsidence. Previous researchers have simulated the total subsidence rate around the d point, based on which the ratio of the fault activity rate (tectonic subsidence rate) to the total subsidence rate was calculated in terms of third-order sequences (Table 2), which shows that the ratio value decreased gradually from bottom to top.
In the present investigation, from the analysis results of the unconformity surfaces and fault activities, it was concluded that the deep-water areas of the Paleogene QDN Basin showed periodic characteristics that may have influenced the sedimentation, such as the paleo-geomorphological background of the sedimentation, the subsidence center migration, and the characteristics of basin-marginal fans.

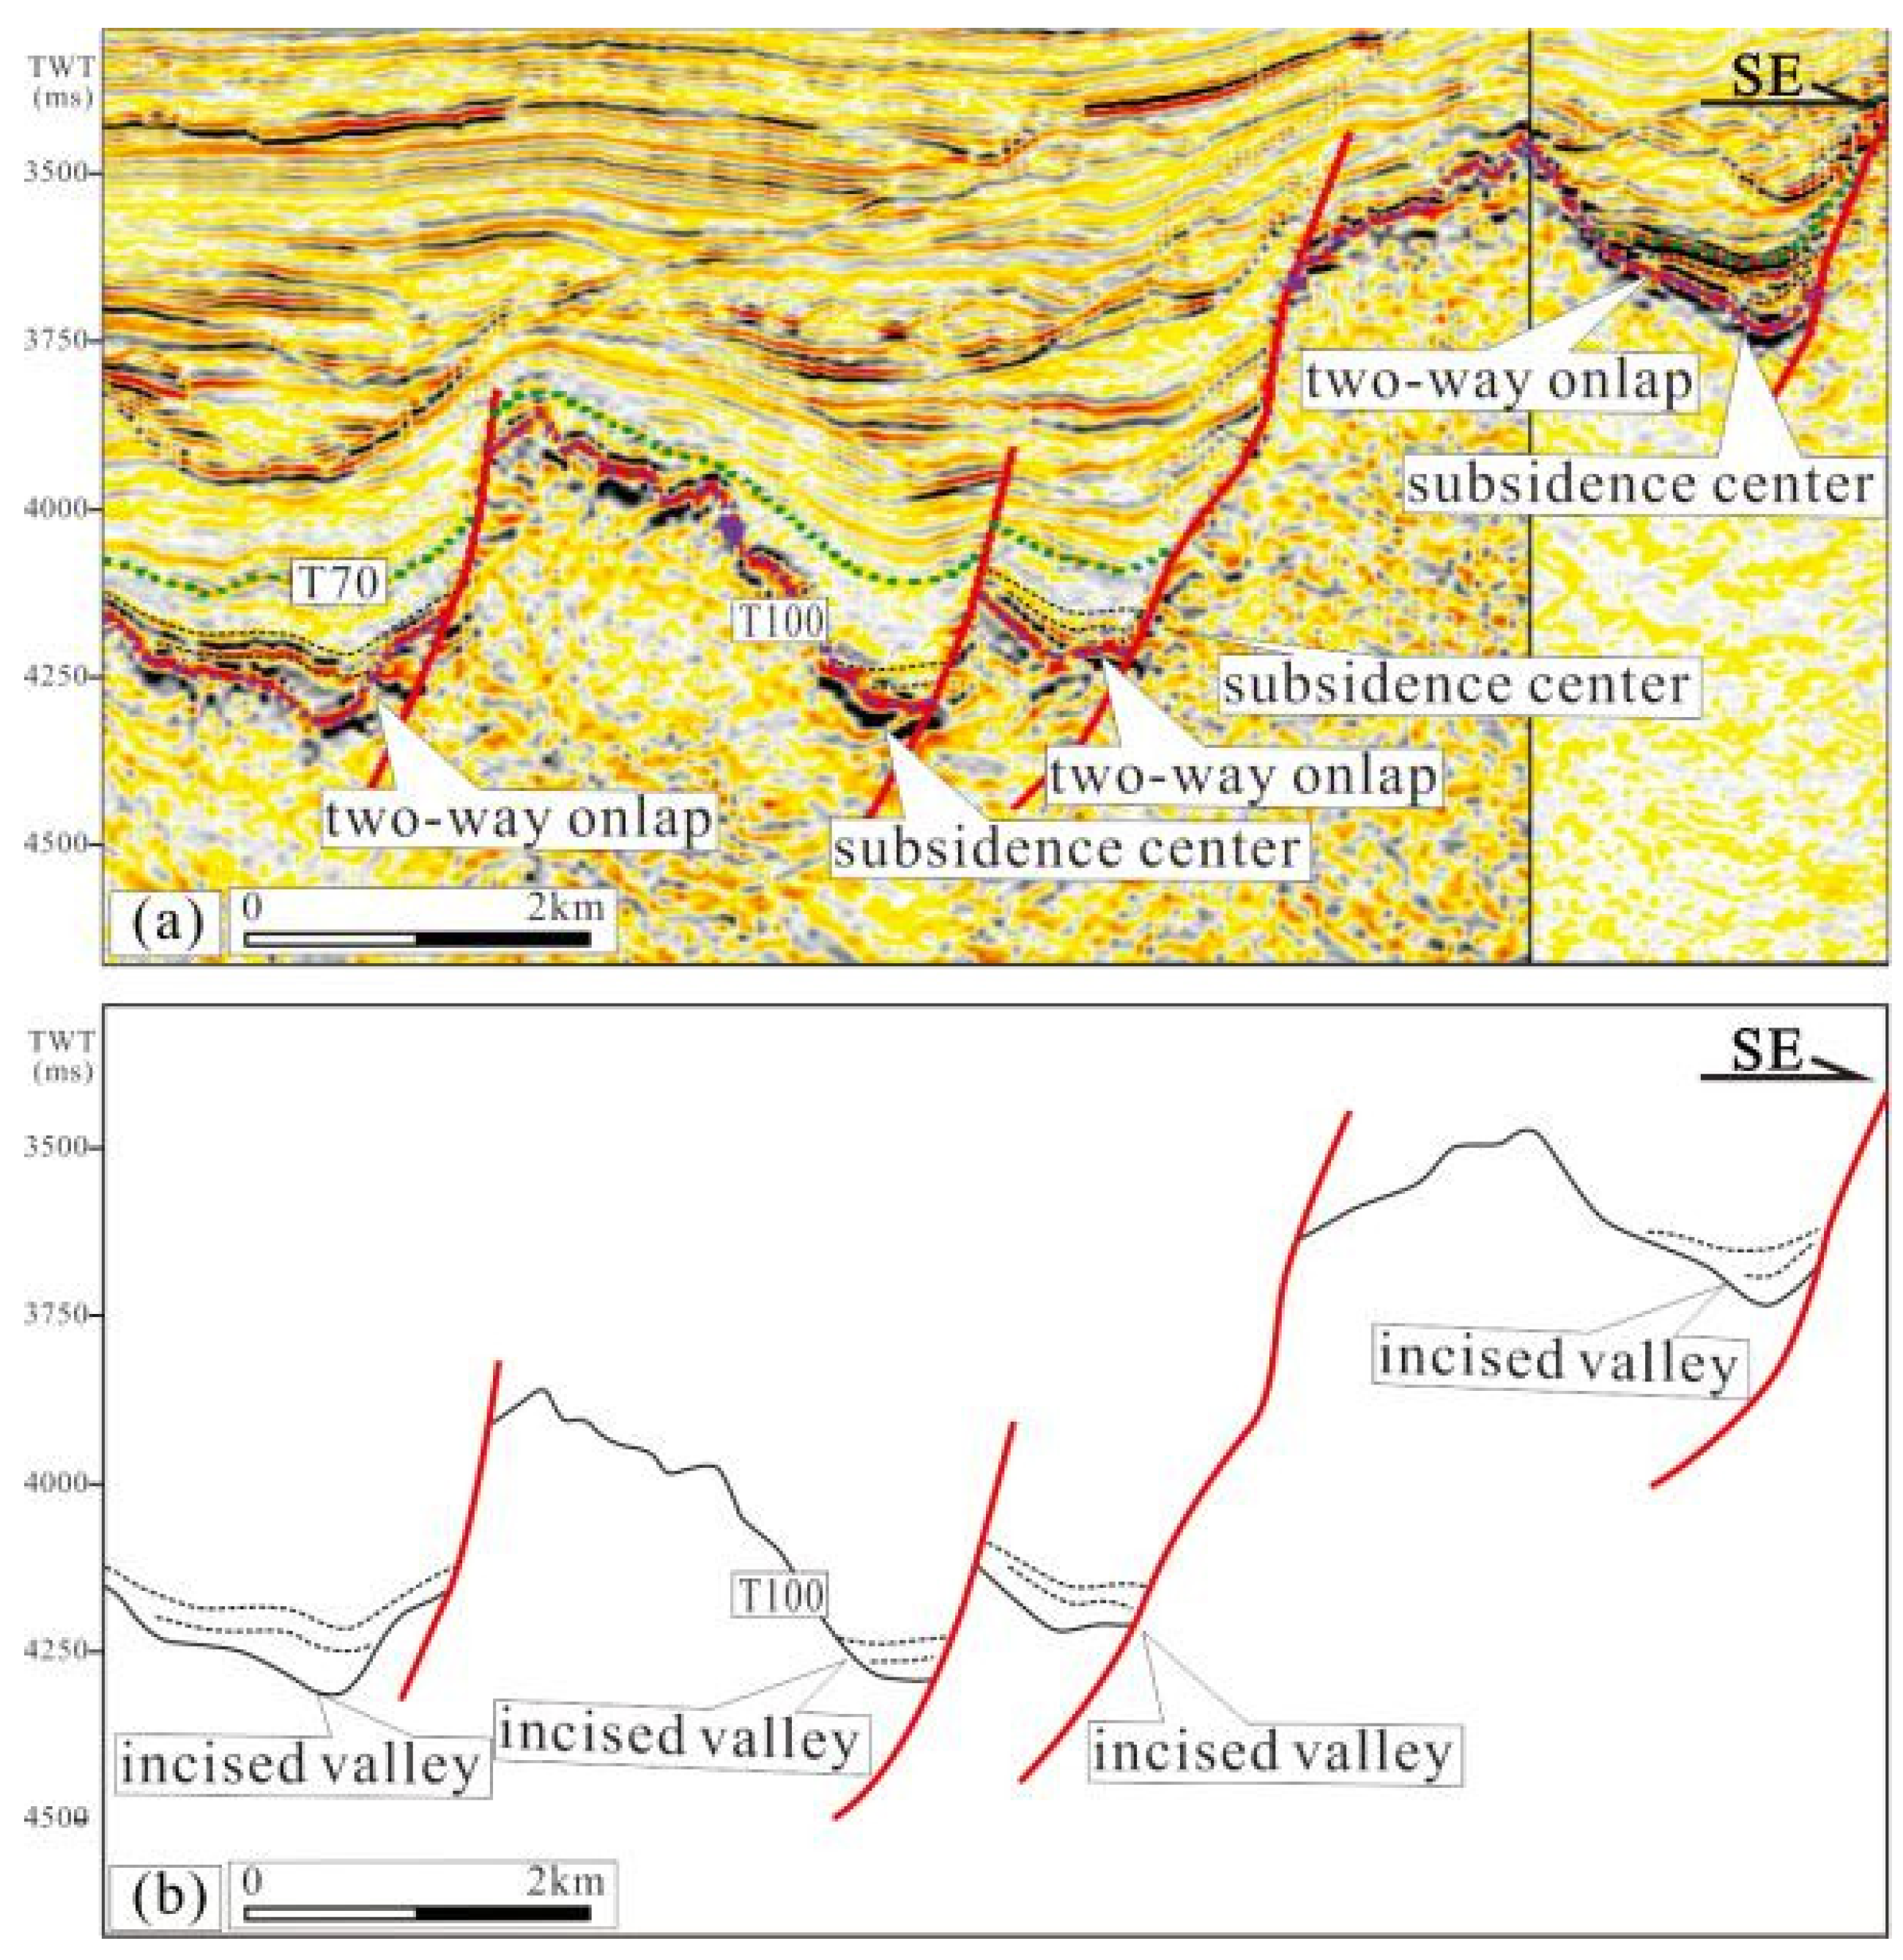
4.3. Responses of Paleo-Geomorphological Background

Through a backstripping procedure, the subsidence history of the study area has been recovered, including the two-dimensional backstripping section shown in Figure 6 and the paleo-geomorphology of the deep-water area of the Paleogene QDN Basin (Figure 7).
Figure 6 indicates that small, faulted basins developed partly during the Eocene Phase-I, and the subsidence centers developed at the roots of the faults along the basin margins. In Phase-II, the faulted basins became larger, but the subsidence center had started to migrate toward the center of the QDN Basin. During the Late Oligocene Phase-III, the basin was dominated by uniform subsidence, and the boundary faults no longer controlled the subsidence centers. From Phase-I to Phase-III, the subsidence centers gradually migrated toward the basin center from the basin margin, which was in good accordance with the conclusion that the ratio of the fault activity rate to the total subsidence rate has decreased over time (Table 2).
The characteristics of the paleo-morphology of the study area also showed three phases, as detailed in Figure 7. The Eocene Phase-I was the initial rifting period of the depression, during which the tectonic activities were relatively strong. The paleo-geomorphic form was controlled by the movements of the basin-controlling faults. The subsidence centers were located adjacent to the boundary. In addition, the patterns of the uplifts and depressions were obvious, showing the features of “three uplifts surrounding one depression.” The uplift areas are exposed at the surface and suffer from denudation, and the provenance was found to be diffused overall. The characteristics of multi-provenance near-source derivations were observed, and the slopes of the basin margins were steep.
The Early Oligocene Phase-II was the rapid rifting period of the depression. The tectonic activities were strong, the paleo-geomorphic form was still controlled by the inherited syn-sedimentary fault, and the uplift and depression patterns were obvious. Due to the occurrence of the transgressions, the uplift areas around the depressions had gradually narrowed. The areas of the sources decreased, and the sag areas gradually expanded. The subsidence centers migrated visually toward the basin center from the boundary, as shown in Figure 6. The slopes of the basin margins remained steep.
The Late Oligocene Phase-III was thought to be the decreasing rifting period. The tectonic actions weakened and the depressions strengthened. The controlling effects of the fault activities on the paleo-geomorphology were also obviously weakened, and the subsidence center moved to the central depression. The depression scope further expanded, and the uplift pattern became fuzzy. The low salients around the depressions were submerged below the water surface during this period, and the provenance area became further reduced, with the slopes of the basin margins becoming gentle.

4.4. Responses of Subsidence Center

During the tectonic Phase-I and early Phase-II, the syn-sedimentary boundary faults controlled the formation of the regional subsidence centers, which were distributed at the roots of the faults with newly-forming fault ditches.
In addition, during the tectonic Phase-I and early Phase-II, the surrounding positive structures were mainly exposed to serve as provenance areas, where fault ditches were developed as drainage systems to transport clastic detritus and develop incised valley fill deposits, which developed two-way onlap inside with strong amplitude reflection and truncating of the underlying strata (Figure 8). The above-mentioned features indicated that the faults had controlled the subsidence centers to act as the source channels.

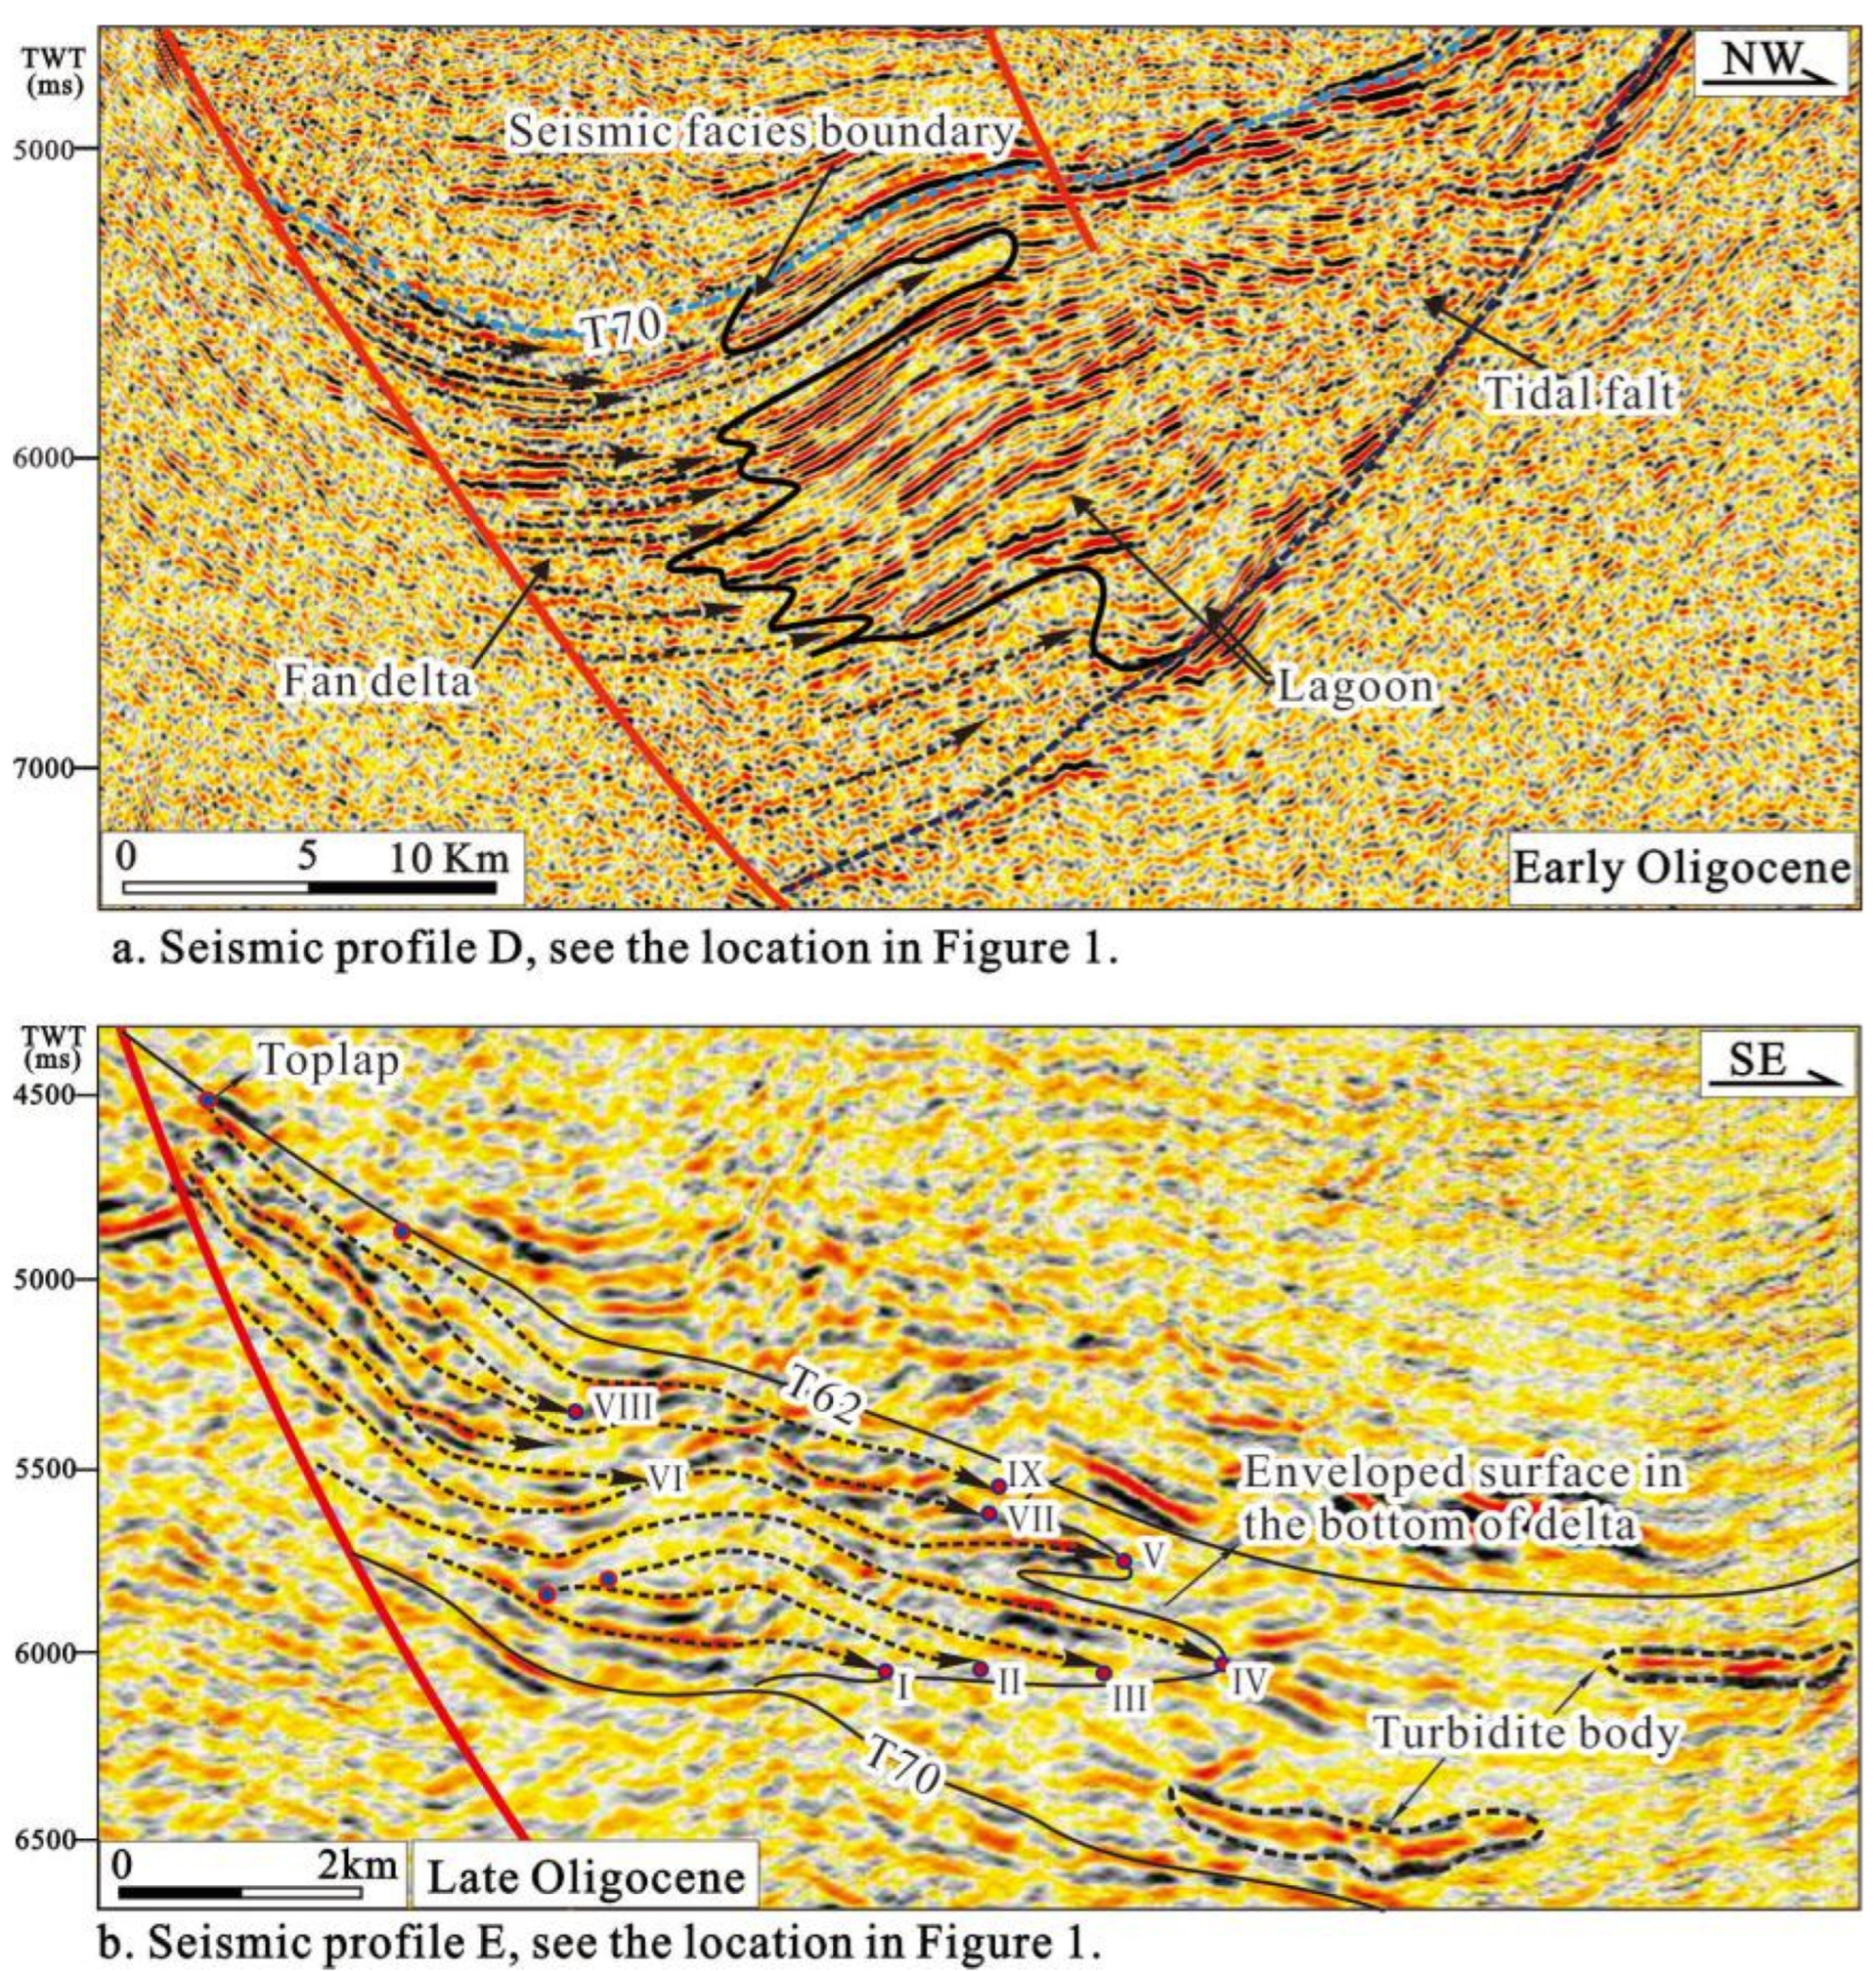
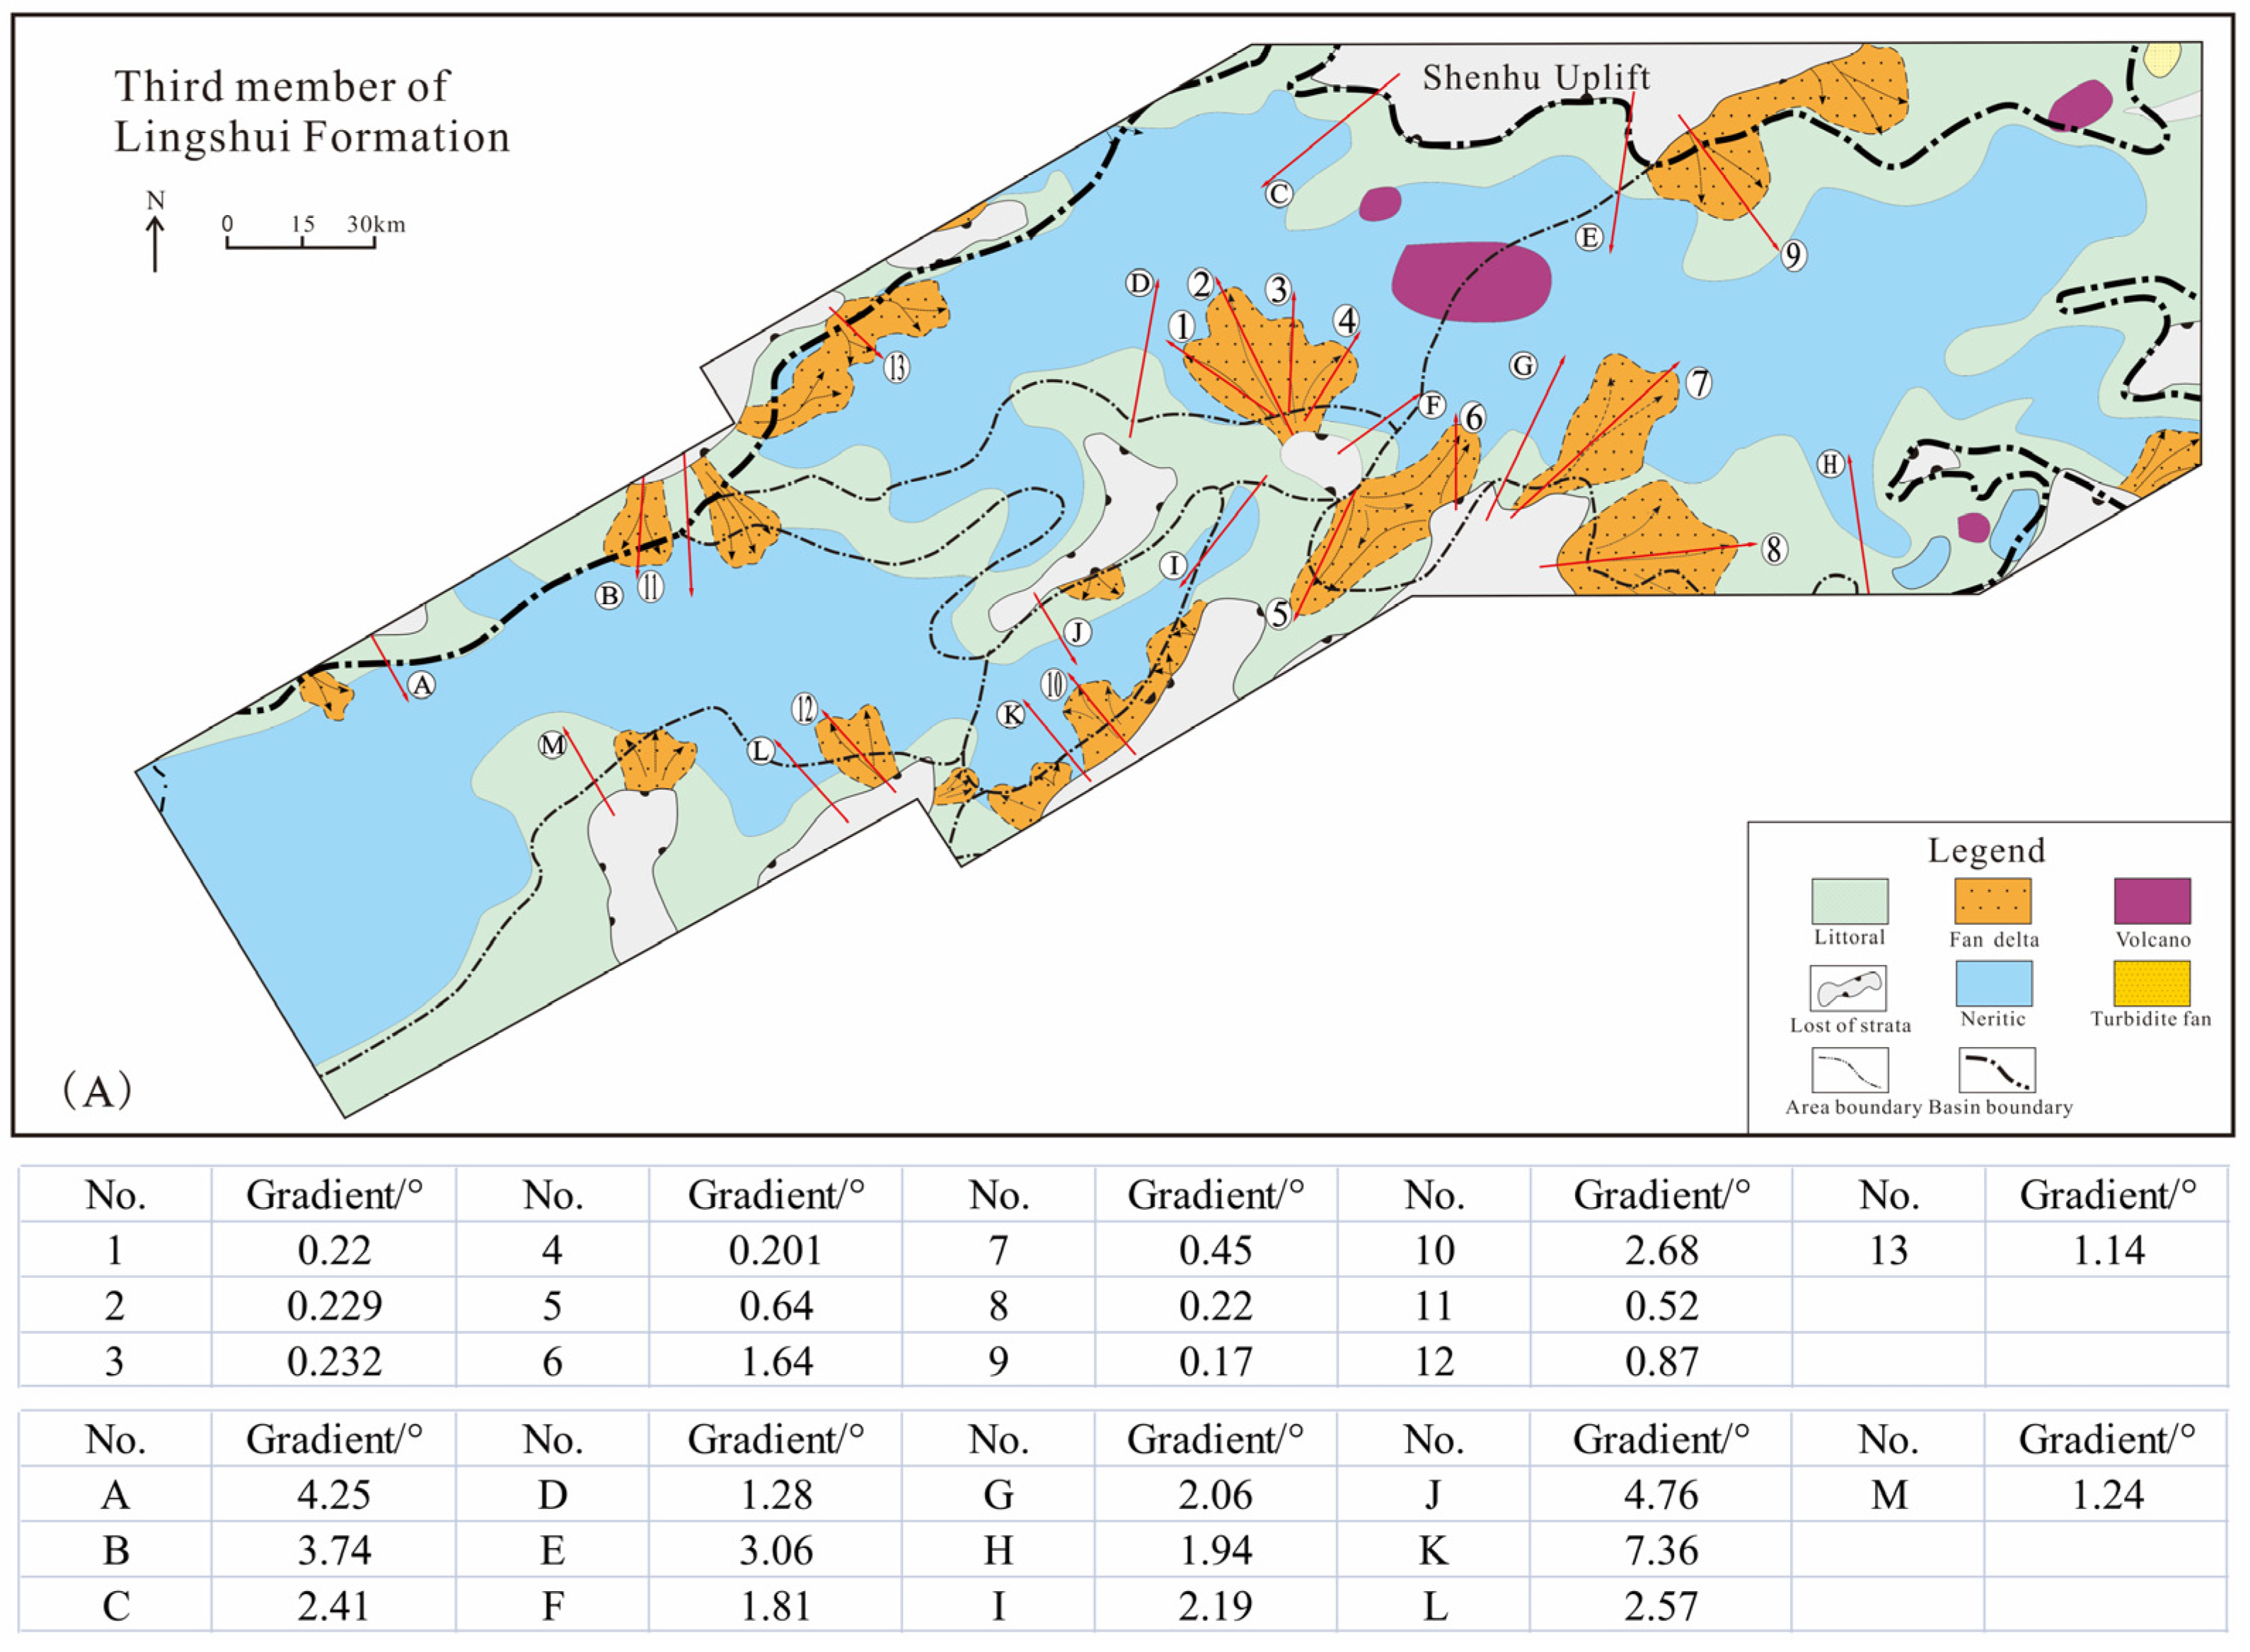
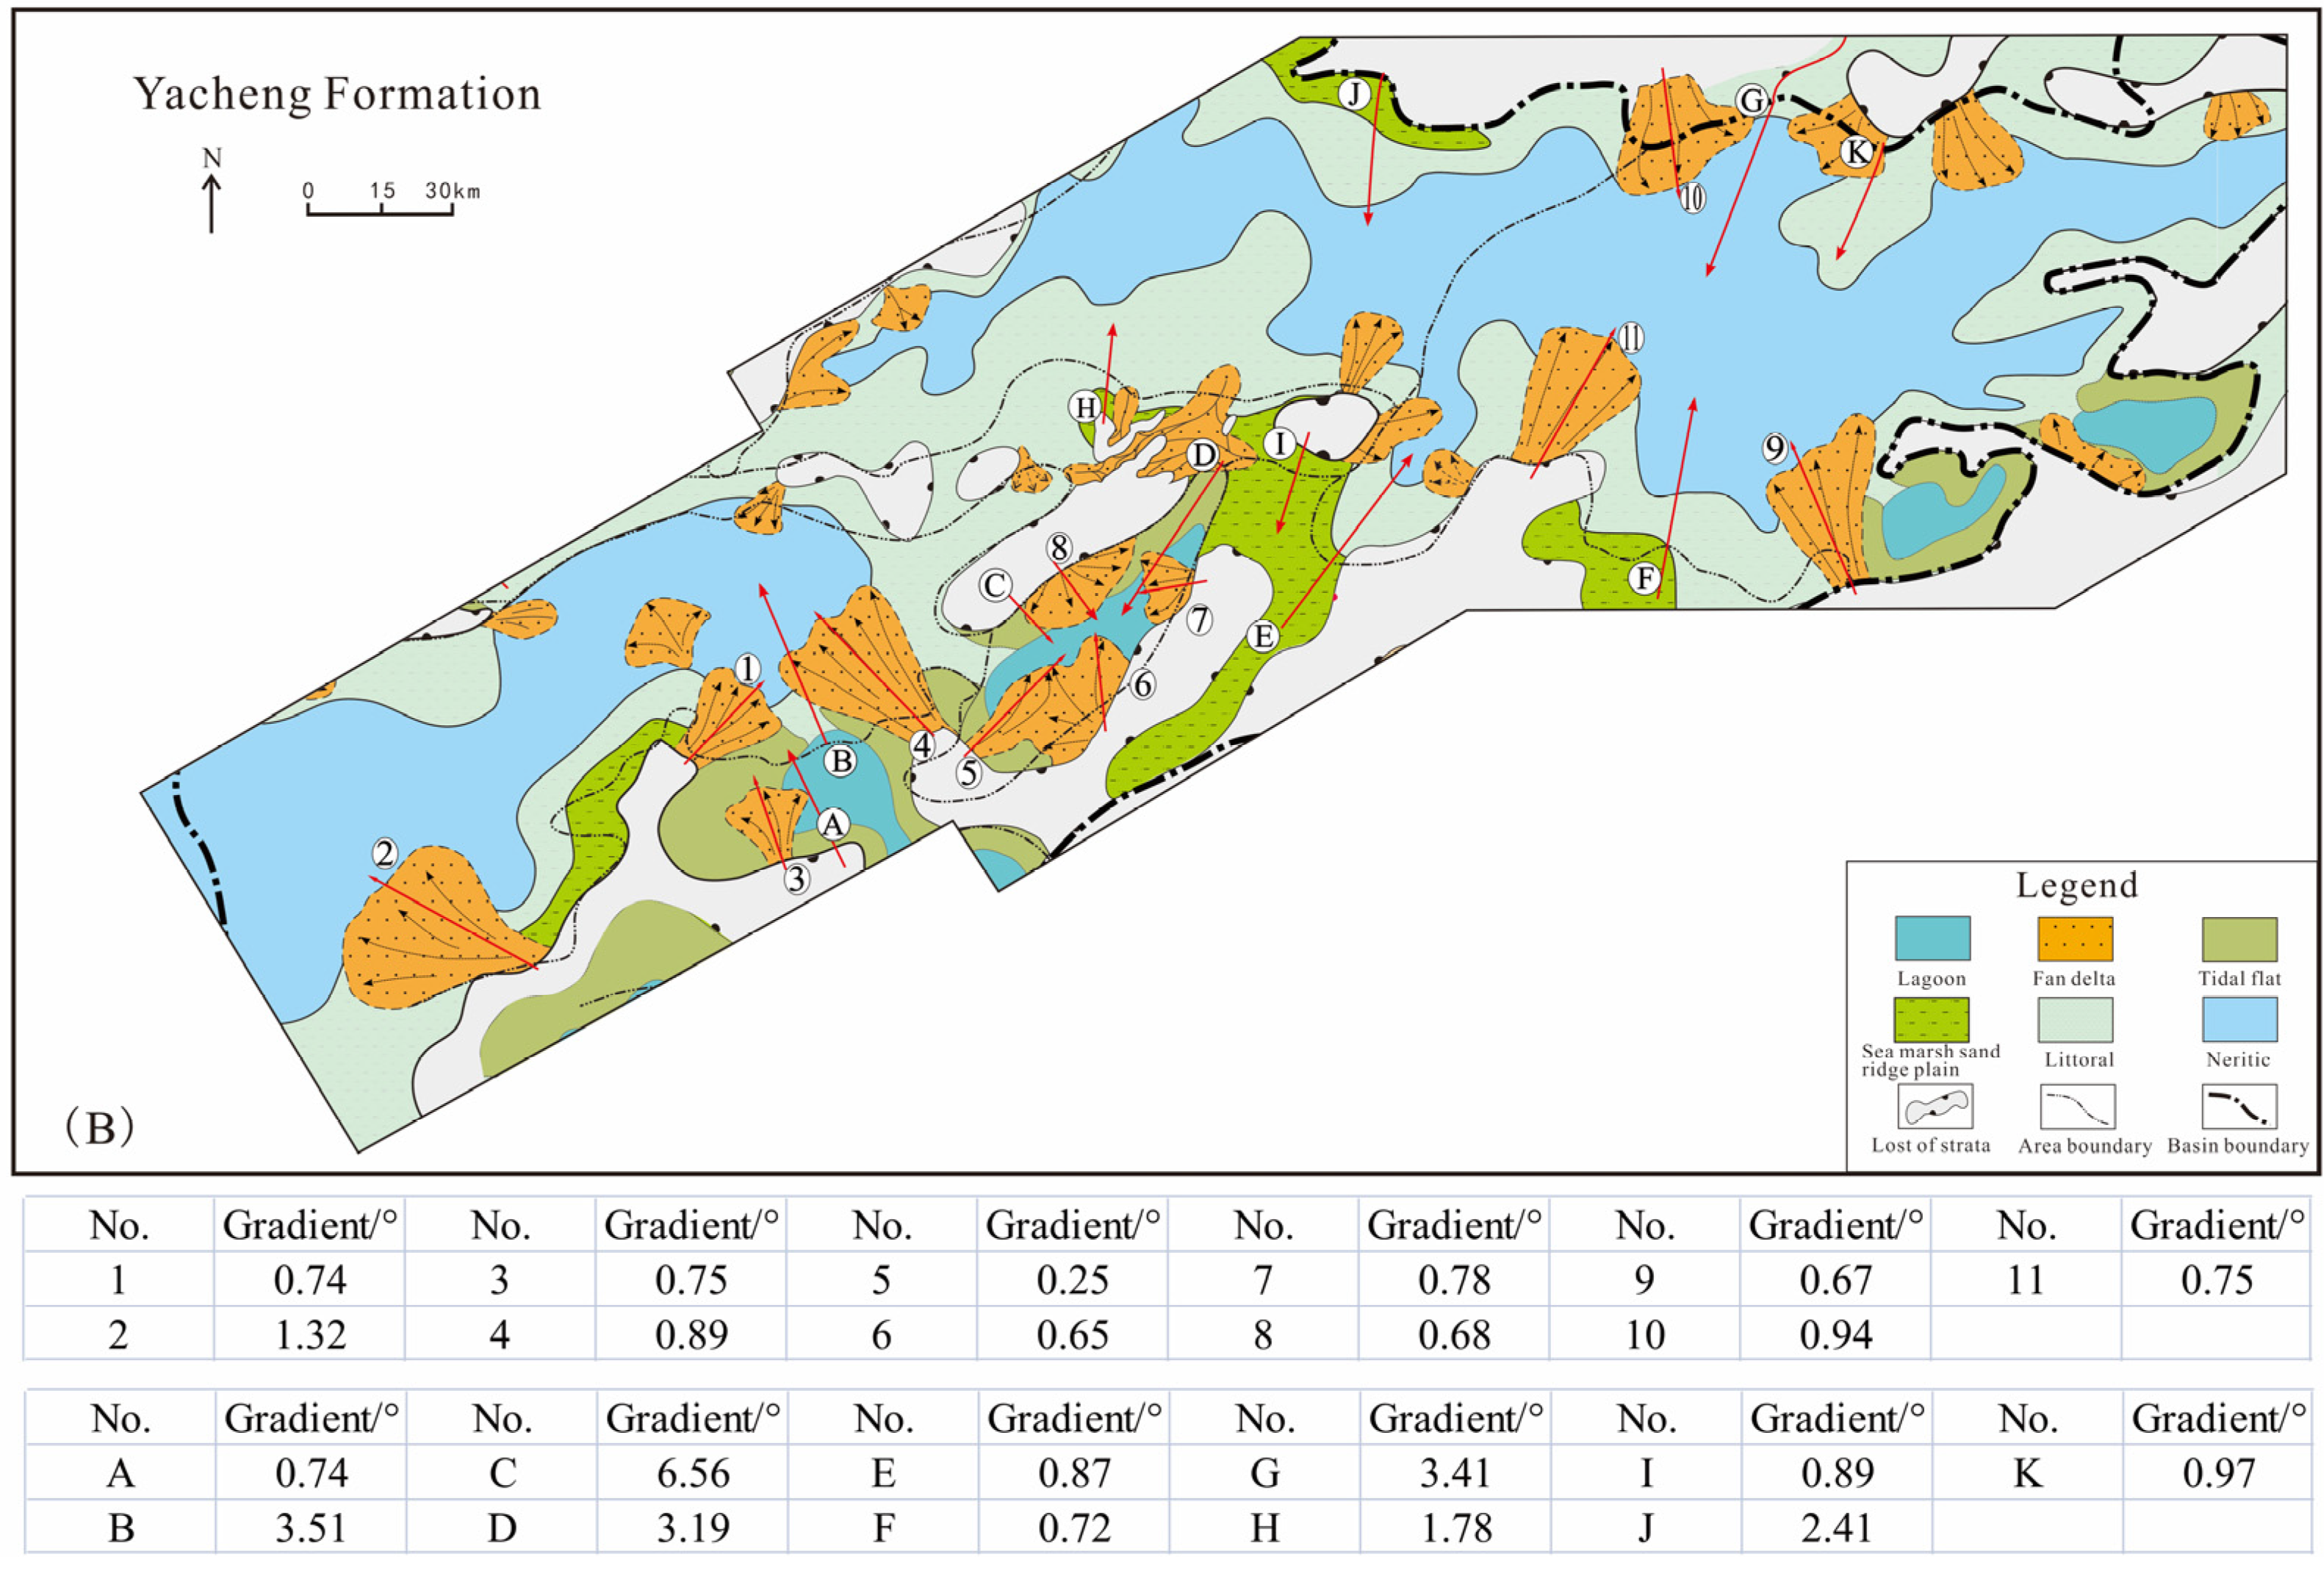
4.5. Responses of Basin-Marginal Fans

As previously discussed, during Phase-I and early Phase-II, the syn-sedimentary boundary faults resulted in the subsidence centers being located adjacent to the boundary fault. Therefore, within the sags, the basin-marginal fans deposited near the boundary faults were not able to migrate towards the center of the basin, and most of the fans showed the characteristics of retrogradation. The fans developed large vertical thicknesses and small horizontal scales. Moreover, near the boundary fault, the accommodation spaces were so large that the fans were usually unable to fill them up. As a result, few to no top lap points had developed, as illustrated in Figure 9a.
During the late Phase-II and Phase-III, the major faults located at the basin margins no longer controlled the subsidence centers, which began to migrate toward the sag center from the boundary faults. This led to the accommodation spaces near the boundary faults becoming insufficient. In addition, within the sags, the basin-marginal fans that formed near the boundary faults were able to extend further to deposit turbidite bodies, as detailed in Figure 9b. These fans developed thin vertical thicknesses and large horizontal scales. However, the accommodation spaces were not large, so the clastic detritus filled them easily, and more top lap points formed at the basin margins (Figure 9b).
In the current investigation, in accordance with the above discussion, it was concluded that the fans in Phase-III had achieved a larger extension when compared with those in Phase-II and Phase-I. However, in order to quantitatively delineate that phenomenon, the Els3 deposited at Phase-III and the Yacheng Formation deposited at Phase-II were used as examples to carry out further research. It was believed that the tectonic activities had affected the extension scales of the fans by influencing the paleo-geomorphology [38,39,40].
Using Formulas (1) and (2), the slope gradient of the fan body on the edge of the basin and the paleo-geomorphology nearby were both calculated (Figure 10). Furthermore, based on the data shown in Figure 10, it was concluded that the gentler the presentation of the nearby paleo-geomorphology was, the larger the extension scale of the developed basin-marginal fans would be. The gradient of the fans and the paleo-geomorphology in the third member of the Lingshui Formation were wholly more gentle than those in the Yacheng Formation. The Yacheng Formation belonged to Phase-II, when the subsidence rate and fault activity were large and the faults along the basin margins could control the subsidence center, thus the accommodation space was larger at the basin margin than other places in lateral space, especially at the early period of Phase-II. However, the subsidence rate and fault activity became small, and the boundary faults could not control the subsidence centers any more, causing the centers to migrate toward the central basin. As a result, the accommodation space in Phase-III increased from the basin margins to the basin center, and the paleo-geomorphology was more gentle than in Phase-II. Paleo-geomorphology can affect the sedimentation significantly, such as the horizontal extension scale and vertical thickness. Thus, the debris from the source areas was unloaded gradually when entering the basin in Phase-III due to the gentler slope of the synsedimentary paleogeomorphology, leading the basin-marginal fans to form a gentler gradient and extend further towards the central basin than in Phase-II.

5. Discussion

Analyzing the characteristics of periodic tectonic evolution and sedimentation response is important for petroleum exploration in marine basins, such as helping to find economic reservoirs.
In the interested area, economically significant reservoir facies are represented by the basin-marginal fans with a small slope, such as the deltas or fan deltas in Phase-III. Even though the deltas or fan deltas in Phase-II or Phase-I developed large thickness, the facies belts were narrow, the extension scale was limited, and the reservoir physical properties might be poor. That was because, in Phase-II or Phase-I, the accommodation space was larger at the basin margin than in the basin center, just as the paleogeomorphology developed a large gradient and the subsidence center was adjacent to the basin margin, so the potential energy of the debris material entering the basin decreased and unloaded rapidly, and sediments would be deposited quickly, resulting in the basin-marginal fans being coarse-grained and poorly sorted. In contrast, in Phase-I, the accommodation increased gradually from the basin boundary to the basin center; just as the paleogeomorphology developed a small gradient and the subsidence center moved to the basin center, so the potential energy of the debris material entering the basin decreased and was unloaded slowly, resulting in the basin-marginal fans being not only well sorted but also developing a large horizontal extension scale. The turbidite bodies were only derived from the basin-marginal fans depositing at the gentle basin margin. Since this kind of basin-marginal fan was well sorted, we guess that the turbidite bodies were better sorted and might have acted as reservoirs.

6. Conclusions

The tectonic activities of the deep-water areas of the Paleogene QDN Basin were found to display three phases. The subsidence rate and the fault activity showed “small-large-small” trends, and the ratio of the fault activity to the total subsidence rate gradually decreased from early Phase-I to Phase-III.
The paleo-geomorphology of the study area revealed different characteristics from Phase-I to Phase-III. From Phase-III to Phase-I, it was observed that the uplift and depression patterns had become gradually less obvious, and the subsidence centers began to migrate toward the basin center from the basin margins, with the slope of the basin margin changing from being steep to becoming gentle. The horizontal extension scale and vertical thickness of the basin-marginal fans were also controlled. From Phase-III to Phase-I, the thickness gradually became thinner, and the horizontal extension scale became larger.
Analyzing the characteristics of the periodic tectonic evolution and the sedimentation response will help to find economic reservoirs. The deltas or fan deltas with a gentle gradient in Phase-III may be well sorted, and the extension scale was large, so they might act as economically important reservoirs.

Author Contributions

Conceptualization, G.S.; methodology, G.S.; software, R.S.; validation, Z.L.; formal analysis, G.S.; investigation, G.S.; resources, R.S. and Y.C.; data curation, D.W.; writing—original draft preparation, G.S. and M.X.; writing—review and editing, M.X.; visualization, R.S.; supervision, Z.L. and Y.C.; project administration, M.X.; funding acquisition, G.S. All authors have read and agreed to the published version of the manuscript.

Funding

This research was funded by the National Natural Science Foundation of China, grant number 42002127 and 42072188.

Data Availability Statement

Not applicable.

Acknowledgments

We thank the Beijing Research Center of CNOOC (China) Co., Ltd. for providing the data used in this study.

Conflicts of Interest

The authors declare no conflict of interest.

References

  1. Muravchik, M.; Henstra, G.G.; Eliassen, G.T.; Gawthorpe, R.L.; Leeder, M.; Kranis, H.; Skourtsos, E.; Andrews, J. Deep-water sediment transport patterns and basin floor topography in early rift basins: Plio-Pleistocene syn-rift of the Corinth Rift, Greece. Basin Res. 2020, 32, 1194–1222. [Google Scholar] [CrossRef]
  2. Pechlivanidou, S.; Cowie, P.A.; Duclaux, G.; Nixon, C.W.; Gawthorpe, R.L.; Salles, T. Tipping the balance: Shifts in sediment production in an active rift setting. Geology 2019, 47, 259–262. [Google Scholar] [CrossRef]
  3. Frederick, B.C.; Blum, M.D.; Snedden, J.W.; Fillon, R.H. Early Mesozoic synrift Eagle Mills Formation and coeval siliciclastic sources, sinks, and sediment routing, northern Gulf of Mexico basin. Geol. Soc. Am. Bull. 2020, 132, 2631–2650. [Google Scholar] [CrossRef]
  4. Van Avendonk, H.J.A.; Christeson, G.L.; Norton, I.O.; Eddy, D.R. Continental rifting and sediment infill in the northwestern Gulf of Mexico. Geology 2015, 43, 631–634. [Google Scholar] [CrossRef]
  5. Curry, M.A.E.; Peel, F.J.; Hudec, M.R.; Norton, I.O. Extensional models for the development of passive-margin salt basins, with application to the Gulf of Mexico. Basin Res. 2018, 33, 1180–1199. [Google Scholar] [CrossRef]
  6. Lin, C.S.; Zhang, Y.M.; Li, S.T.; Ren, J.Y.; Zhang, Y.Z. Episodic rifting dynamic process and quantitative model of Mesozoic-Cenozoic faulted basins in eastern China. Earth Sci.-J. China Univ. Geosci. 2004, 29, 583–589. [Google Scholar]
  7. Ge, J.W.; Zhu, X.M.; Yu, F.S.; Jones, B.G.; Tao, W.F. Controls of faulting on synrift infill patterns in the Eocene PY4 Sag, Pearl River Mouth Basin, South China Sea. Aust. J. Earth Sci. 2019, 66, 111–132. [Google Scholar] [CrossRef]
  8. Wang, X.D.; Wang, R.; Shi, W.Z.; Tang, D.Q.; Xu, L.T.; Feng, Q. Tectonic characteristics and evolution of typical rift basins in eastern China: A case study in the Gudian area, Songliao Basin. Bull. Geol. Sci. Technol. 2022, 41, 85–95. [Google Scholar] [CrossRef]
  9. Pavelić, D. Tectonostratigraphic model for North Croation and North Bosnian sector of the Miocene Pannonian Basin System. Basin Res. 2001, 13, 359–376. [Google Scholar] [CrossRef]
  10. Yan, D.T.; Wang, H.; Wang, Q.C. Episodic tectonic cycles and sequence patten of the tertiary rifted basins of East China. Acta Pet. Sin. 2008, 2, 185–190. [Google Scholar]
  11. Lv, D.W.; Li, Z.X.; Wang, D.D.; Li, Y.; Wang, P.L. Sedimentary model of coal and shale in the Paleogene Lijiaya Formation of the Huangxian Basin: Insight from the petrological and geochemical characteristics of coal and shale. Energy Fuels 2019, 33, 10442–10456. [Google Scholar] [CrossRef]
  12. Tang, J.G.; Wang, K.M.; Qin, D.C. Tectonic deformation and its constraints to shale gas accumulation in Nanchuan area, southeastern Sichuan Basin. Bull. Geol. Sci. Technol. 2021, 40, 11–21. [Google Scholar]
  13. Middleton, A.W.; Uysal, I.T.; Golding, S.D. Chemical and mineralogical characterisation of illite-smectite: Implications for episodic tectonism and associate fluid flow, central Australia. Geochim. Et Cosmochim. Acta 2015, 148, 284–303. [Google Scholar] [CrossRef] [Green Version]
  14. Fu, C.; Li, S.L.; Li, S.L.; Xu, J.Y. Spatial and temporal variability of sediment infilling and episodic rifting in the North Pearl River Mouth Basin, South China Sea. J. Asian Earth Sci. 2021, 211, 104702. [Google Scholar] [CrossRef]
  15. Pei, J.X.; Zhang, C.; Wang, Y.H.; Wang, K.; Liu, J.; Wang, S.K. Sedimentary responses to Miocene tectonic events in the western margin of the South China Sea: A case study of the Wan’an Basin. Bull. Geol. Sci. Technol. 2021, 40, 42–53. [Google Scholar]
  16. Zhang, G.C.; Feng, C.J.; Yao, X.Z.; Ji, M.; Yang, H.Z.; Qu, H.J.; Zeng, Q.B.; Zhao, Z.; Sun, R. Petroleum Geology in Deepwater Settings in a Passive Continental Margin of a Marginal Sea: A Case Study from the South China Sea. Acta Geol. Sin. Engl. Ed. 2021, 95, 1–20. [Google Scholar] [CrossRef]
  17. Lei, C.; Luo, J.L.; Pang, X.; Li, C.; Pang, J.; Ma, Y.K. Impact of temperature and geothermal gradient on sandstone reservoir quality: Baiyun Sag in the Pearl River Mouth Basin Study Case (Northern South China Sea). Minerals 2018, 8, 452. [Google Scholar] [CrossRef]
  18. Zhao, Z.X.; Sun, Z.; Wang, Z.F.; Sun, Z.P. The mechanics of continental extension in Qiongdongnan Basin, northern South China Sea. Mar. Geophys. Res. 2015, 36, 197–210. [Google Scholar] [CrossRef]
  19. Wang, D.D.; Zhang, G.C.; Li, Z.X. The Development Characteristics and Distribution Predictions of the Paleogene Coal-measure Source Rock in the Qiongdongnan Basin, Northern South China Sea. Acta Geol. Sin. Engl. Ed. 2021, 95, 105–120. [Google Scholar] [CrossRef]
  20. Song, G.Z.; Li, Z.X.; Yang, H.Z.; Wang, D.D.; Chen, Y.; Sun, R. Control effects of the synsedimentary faults on the basin-marginal fans in the central part of the deep-water area of early Oligocene Qiongdongnan Basin, South China Sea. Acta Oceanol. Sin. 2021, 40, 54–64. [Google Scholar] [CrossRef]
  21. Wang, X.G.; Zhang, H.; Chen, Z.H. Numerical simulation of sedimentation in the Central Canyon of Lingshui area, Qiongdongnan Basin. Bull. Geol. Sci. Technol. 2021, 40, 42–53. [Google Scholar]
  22. Li, S.T.; Lin, C.S.; Zhang, Q.M. Episodic Rifing of Continental Marginal Basins and Tectonic Events since 10 Ma in the South China Sea. Chin. Sci. Bull. 1999, 43, 10–22. [Google Scholar] [CrossRef]
  23. Wei, J.G.; Wu, T.T.; Zhang, W.; Deng, Y.N.; Xie, R.; Feng, J.X.; Liang, J.Q.; Lai, P.X.; Zhou, J.H.; Cao, J. Deeply Buried Authigenic Carbonates in the Qiongdongnan Basin, South China Sea: Implications for Ancient Cold Seep Activities. Minerals 2020, 10, 1135. [Google Scholar] [CrossRef]
  24. Feng, Y.L.; Jiang, S.; Hu, S.Y.; Li, S.T.; Lin, C.S.; Xie, X.N. Sequence stratigraphy and importance of syndepositional structural slope-break for architecture of Paleogene syn-rift lacustrine strata, Bohai Bay Basin, E. China. Mar. Pet. Geol. 2016, 69, 183–204. [Google Scholar] [CrossRef]
  25. Ainsworth, R.B.; McArthur, J.B.; Lang, S.C.; Vonk, A.J. Quantitative sequence stratigraphy. AAPG Bull. 2018, 102, 1913–1939. [Google Scholar] [CrossRef]
  26. Ullah, S.; Jan, I.U.; Hanif, M.; Latif, K.; Mohibullah, M.; Sabba, M.; Anees, A.; Ashraf, U.; Thanh, H.V. Paleoenvironmental and bio-sequence stratigraphic analysis of the Cretaceous Pelagic carbonates of eastern Tethys, Sulaiman Range, Pakistan. Minerals 2022, 12, 946. [Google Scholar] [CrossRef]
  27. Shao, L.; Li, A.; Wu, G.X.; Li, Q.W.; Liu, C.L.; Qiao, P.J. Evolution of sedimentary environment and provenance in Qiongdongnan Basin in the northern South China Sea. Acta Pet. Sin. 2010, 31, 548–551. [Google Scholar]
  28. Choi, J.H.; Yang, S.J.; Han, S.R.; Kim, Y.S. Fault zone evolution during Cenozoic tectonic inversion in SE Korea. J. Asian Earth Sci. 2015, 98, 167–177. [Google Scholar] [CrossRef]
  29. Watters, T.R.; Daud, K.; Banks, M.E.; Selvans, M.M.; Chapman, C.R.; Ernst, C.M. Recent tectonic activity on Mercury revealed by small thrust fault scarps. Nat. Geosci. 2016, 9, 743–747. [Google Scholar] [CrossRef]
  30. Xia, S.Q.; Lin, C.S.; Li, X.; Du, X.F.; Li, H. The fault activity, tectonic subsidence history, and geodynamics of syn-depositional faults during the Paleogene in Liaodong Bay, Bohai Bay Basin. Geol. J. 2022, 57, 3447–3461. [Google Scholar] [CrossRef]
  31. Gumati, M.S. Seismic evidence for the syndepositional fault activity controls on geometry and facies distribution patterns of Cenomanian (Lidam) reservoir, Dahra Platform, Sirt Basin, Libya. Mar. Pet. Geol. 2022, 136, 105471. [Google Scholar] [CrossRef]
  32. Jiang, H.; Wang, H.; Liu, J.; Zhao, S.E.; Lin, Z.L.; Fang, X.X.; Cai, J. Activity of South Fault of Zhu-3 Depression and Its Controlling on Sedimentation during Shenhu Formation to Enping Formation in Pearl River Mouth Basin. Geol. Sci. Technol. Inf. 2009, 28, 49–53. [Google Scholar]
  33. Zhao, X.Y.; Dai, Z.Y.; Li, Y.; Jiang, Y.B.; Gong, Z.C.; Li, T.; Huang, L.; Cui, X.M.; Zhou, R.; Su, J.; et al. Using compaction simulation experiment to recover burial history: Taking the fourth Member of Shahejie Formation in Leijia area, Western Depression of Liaohe River as an example. Bull. Geol. Sci. Technol. 2021, 40, 165–177+215. [Google Scholar]
  34. Li, Z.Y.; Aschoff, J. Location, extent, and magnitude of dynamic topography in the Late Cretaceous Cordilleran Foreland Basin, USA: New insights from 3D flexural backstripping. Basin Res. 2022, 35, 120–140. [Google Scholar] [CrossRef]
  35. Zhao, J.X.; Chen, H.D.; Shi, Z.Q. The way and implications of rebuilding paleogeomorphology: Taking the research of paleogeomorphology of the Ordos Basin before Jurassic deposition as example. J. Chengdu Univ. Technol. 2001, 28, 260–266. [Google Scholar]
  36. Song, G.Z.; Zhang, G.C.; Li, Z.X.; Wang, D.D.; Xu, M. Characterization and formation mechanism of the basin-marginal deltas in the Paleogene Qiongdongnan Basin, northwestern South China Sea. Energy Explor. Exploit. 2020, 38, 923–943. [Google Scholar] [CrossRef]
  37. Song, G.Z.; Wang, H.; Wang, Z.F.; Liu, J.B.; Liu, X.L.; Sun, Z.P.; Zhang, G.C.; Xu, M.; Sang, G.Q. Sequence stratigraphic architectures and responses to syndepositional tectonic evolution in the Paleogene Lingshui Sag, Qiongdongnan Basin, northwestern South China Sea. Int. Geol. Rev. 2020, 62, 1036–1056. [Google Scholar] [CrossRef]
  38. Jude, A.C.; Christian, R.; Wilfried, J. Response of Cenozoic turbidite system to tectonic activity and sea-level change off the Zambezi Delta. Mar. Geophys. Res. 2017, 38, 209–226. [Google Scholar]
  39. Zhao, S.; Xie, X.N.; Liu, Z.R.; Lu, Y.B.; Xiao, S.Y.; Deng, Y.T. Control of Tectonic-paleogeomorphology on deposition system of faulting-subsiding basin: A case from the Eocene Niubao Formation in Lunpola Basin, Central Tibet. Geosci. Technol. Inf. 2019, 38, 53–64. [Google Scholar]
  40. Yue, J.H.; Huang, C.Y.; Cao, L.Z.; Wang, H.X.; Zheng, R.H.; Wu, J.P.; Xiang, X.; Liu, H. Sedimentary characteristics and controlling factors of the Ba 66 fan in Bayindulan Sag. Bull. Geol. Sci. Technol. 2021, 40, 88–98. [Google Scholar]
Figure 1. The location and structural divisions of the QDN Basin. Points b, d, and e, and black dashed lines A, B, C, D, and E are the research locations used in the following figures.
Minerals 13 00262 g001
Figure 2. Identification of the sequence stratigraphic surfaces in the Paleogene QDN Basin. TWT means two-way time. (a) Above the T60 boundary, incised valleys were developed with obvious truncating of the underlying strata; (b) Truncation and onlapping points revealed the unconformable contacts above the sequence surfaces; (c) The sequence boundary featured abrupt changes in the well log shapes and lithology.
Minerals 13 00262 g002
Figure 3. Three methods for analyzing the fault activity (Modified after Jiang et al., 2009 [32]).
Minerals 13 00262 g003
Figure 4. The sedimentary facies and relevant seismic facies developed in the Paleogene study area.
Minerals 13 00262 g004
Figure 5. The activity rates of the No. 2 Fault and the No. 11 Fault in the deep-water area of the Paleogene QDN Basin (see Figure 1 for the positions of c, d, and e). The activity rates show the characteristics of three phases. Inside each phase, the fault activity rate first rose rapidly to a peak value and then reduced gradually to a minimum value. (A) point c in No. 2 Fault; (B) point d in No. 2 Fault; (C) point e in No. 11 Fault.
Minerals 13 00262 g005
Figure 6. Two-dimensional backstripping and subsidence evolution of the seismic profile C located in the study area. (a) The sequence framework of the seismic profile C; (b) The backstripping section in Phase-I; (c) The backstripping section in Phase-II; (d) The backstripping section in Phase-III; (e) The section currently. (SC: subsidence center; see Figure 1 for the location of the seismic profile.)
Minerals 13 00262 g006
Figure 7. The ancient landform of every tectonic phase in the deep-water area of the Paleogene QDN Basin. In Phase-I, at the basin margin, several subsidence centers developed and then moved backwards to the basin boundary in Phase-II. During Phase-III, the subsidence centers migrated to the central basin.
Minerals 13 00262 g007
Figure 8. The small growth faults in SLS were controlled to form fault ditches that acted as source channels. (a) The subsidence centers formed fault ditches at the root of the boundary faults, inside of which developed two-way onlap with strong amplitude reflection; (b) The fault ditches acted as the incised valley.
Minerals 13 00262 g008
Figure 9. The basin-marginal fans that developed in different phases. (a) The fans formed before T70 (Phase-I and Phase-II), with a limited extension scale, no sliding deposit, and only one toplap point that developed; (b) The fans formed after T70 (Phase-III), with a longer extension scale, turbidite bodies developing in the front, and more top-lap points that developed.
Minerals 13 00262 g009
Figure 10. The slope gradient of the paleogeomorphology and the deltas at the edge of the basin (“A” and “1” are the line numbers chosen to compute the slope gradient of the paleogeomorphology and the delta gradient, respectively. (A): The sedimentary facies of the third-member of Lingshui Formation; (B): The sedimentary facies of Yacheng Formation. (Figure A and the relevant data were modified after Song et al., 2020a [37].)
Minerals 13 00262 g010aMinerals 13 00262 g010b
Table 1. The Paleogene stratigraphy and sedimentary environment of the QDN Basin.
Minerals 13 00262 i001
Table 2. The ratio of the fault activity rate to the total subsidence rate (the data for total subsidence was drawn from Song et al., 2020b [37]).
Minerals 13 00262 i002
Disclaimer/Publisher’s Note: The statements, opinions and data contained in all publications are solely those of the individual author(s) and contributor(s) and not of MDPI and/or the editor(s). MDPI and/or the editor(s) disclaim responsibility for any injury to people or property resulting from any ideas, methods, instructions or products referred to in the content.

