Article

Assessment of Gold-Bearing Quartz Vein as a Potential High-Purity Quartz Resource: Evidence from Mineralogy, Geochemistry, and Technological Purification

1
CAS Key Laboratory of Crust-Mantle Materials and Environments, School of Earth and Space Sciences, University of Science and Technology of China, Hefei 230026, China
2
Key Lab of Photovoltaic and Energy Conservation Materials, Institute of Solid State Physics, HFIPS, Chinese Academy of Sciences, Hefei 230031, China
*
Authors to whom correspondence should be addressed.
Minerals 2023, 13(2), 261; https://doi.org/10.3390/min13020261
Submission received: 22 December 2022 / Revised: 27 January 2023 / Accepted: 2 February 2023 / Published: 13 February 2023
(This article belongs to the Section Mineral Deposits)

Abstract

:
High-purity quartz (HPQ) is an important material widely used in many high-tech industries. It is a product processed from pure natural quartz raw materials, so selecting suitable quartz raw material is the key to successfully processing HPQ. Hydrothermal quartz vein is one of the most likely raw materials to be purified into HPQ because of its high SiO2 content. This study focuses on the evaluation of HPQ raw material potential of the two gold-bearing quartz vein tailing resources in Chibougamau (CBG) and Tianjingshan (TJS). Petrography and the contents of impurity elements in the two vein quartz samples before and after processing were studied by optical microscope, SEM, Raman spectrometry, XRD, LA-ICP-MS, and bulk solution ICP-OES. Petrographic results reveal that major impurities in quartz are feldspar, mica, iron compounds, ankerite, rutile, silicate melt, and fluid inclusions. LA-ICP-MS analysis result shows that the SiO2 contents are between 99.953–99.971 wt.% in CBG raw quartz and 99.969–99.976 wt.% in TJS raw quartz, respectively, with very low contents of impurity elements, except for Ca. Bulk solution ICP-OES analysis demonstrates that the CBG processed quartz sand has total impurity contents of 56.8 µg·g−1, with 13.1 µg·g−1 Al and 6.6 µg·g−1 Ti, and the TJS processed quartz sand has the total impurity contents of 85.2 µg·g−1 with 29.4 µg·g−1 Al and 6.1 µg·g−1 Ti. Both the contents of Al and Ti fit with the lattice-bound criteria for HPQ. These results, for most of the impurities, are likely hosted by silicate melt, fluid, and mineral inclusions, indicating that these two hydrothermal raw vein quartz samples can be upgraded to HPQ after processing by more advanced methods. Therefore, the CBG and TJS quartz vein deposits would be considered as potential future resources for HPQ to realize efficient recovery and utilization of tailings resources and to improve mine economic benefits.

1. Introduction

Quartz is the most important silica polymorph in nature, and is widely found in magmatic rocks, metamorphic rocks, sedimentary rocks, and hydrothermal veins [1,2]. Quartz minerals are not only in abundant reserves, but they also have excellent physical and chemical properties due to their special mineralization environment [3]. Therefore, quartz is extensively used in many fields [4]. Low-grade quartz is usually used in glass, ceramics, refractory, construction materials, and other fields [5]. The high-purity quartz (HPQ) with SiO2 content of more than 99.95% is widely used in high-tech industries, such as optical fiber communication, aerospace, semiconductor integrated circuits, precision optical instruments, and other fields [6,7,8,9,10].
High-purity quartz is a product purified from natural crystals, gangue, granite pegmatite, and quartzite. Müller et al. (2012) [11] determined that, for quartz to be classified as HPQ, the total impurity contents should be less than 50 µg·g−1, with Al < 30 µg·g−1, Ti < 10 µg·g−1, Na < 8 µg·g−1, K < 8 µg·g−1, Li < 5 µg·g−1, Ca < 5 µg·g−1, Fe < 3 µg·g−1, P < 2 µg·g−1, and B < 1 µg·g−1. Various impurities are introduced inside the quartz during the crystal growth process, such as lattice impurities, interstitial impurities, and inclusions. Therefore, there is no quartz with a pure SiO2 component in nature. To remove these impurities, quartz processing technologies have been studied in detail by many scholars. In the quartz processing industry, purification methods include magnetic separation, flotation, acid leaching, microwave treatment, chlorination, etc. [7,12,13,14]. Nowadays, the demand for HPQ in various fields is increasing as technology progresses. However, as raw materials, HPQ resources are relatively scarce in nature, and larger deposits even more so. In some research cases, pegmatite quartz, metamorphic activity quartz vein, and lenses, as well as some hydrothermal quartz veins, have the greatest potential for HPQ raw materials due to their high SiO2 contents [1,15,16,17,18]. The quality of HPQ is determined by the raw material quartz, so selecting suitable quartz raw material is the key for successfully processing HPQ.
In this study, two gold-bearing quartz vein tailing resources with economic potential were analyzed. The first one is located in Chibougamau town, Québec province, in Canada (CBG), and the other one is from the Tianjingshan area, which is located in the southern Anhui province, east China (TJS). A combination of analytical techniques have been applied in this research, including optical microscopy, scanning electron microscopy (SEM), Raman spectrometry, X-ray diffraction (XRD), trace element analysis by laser ablation inductively-coupled plasma mass spectrometry (LA-ICP-MS), inductively coupled plasma optical emission spectroscopy (ICP-OES), as well as conventional processing technologies, which aim to obtain detailed characteristics of the petrography and the type of impurities contained within two quartz materials. Meanwhile, the genesis of the investigated quartz veins has been analyzed to guide subsequent processing methods for quartz. Finally, the potential of these two quartz veins as HPQ deposits has been evaluated to realize efficient recovery and utilization of tailing resources and to improve mine economic benefits.

2. Geological Background and Samples

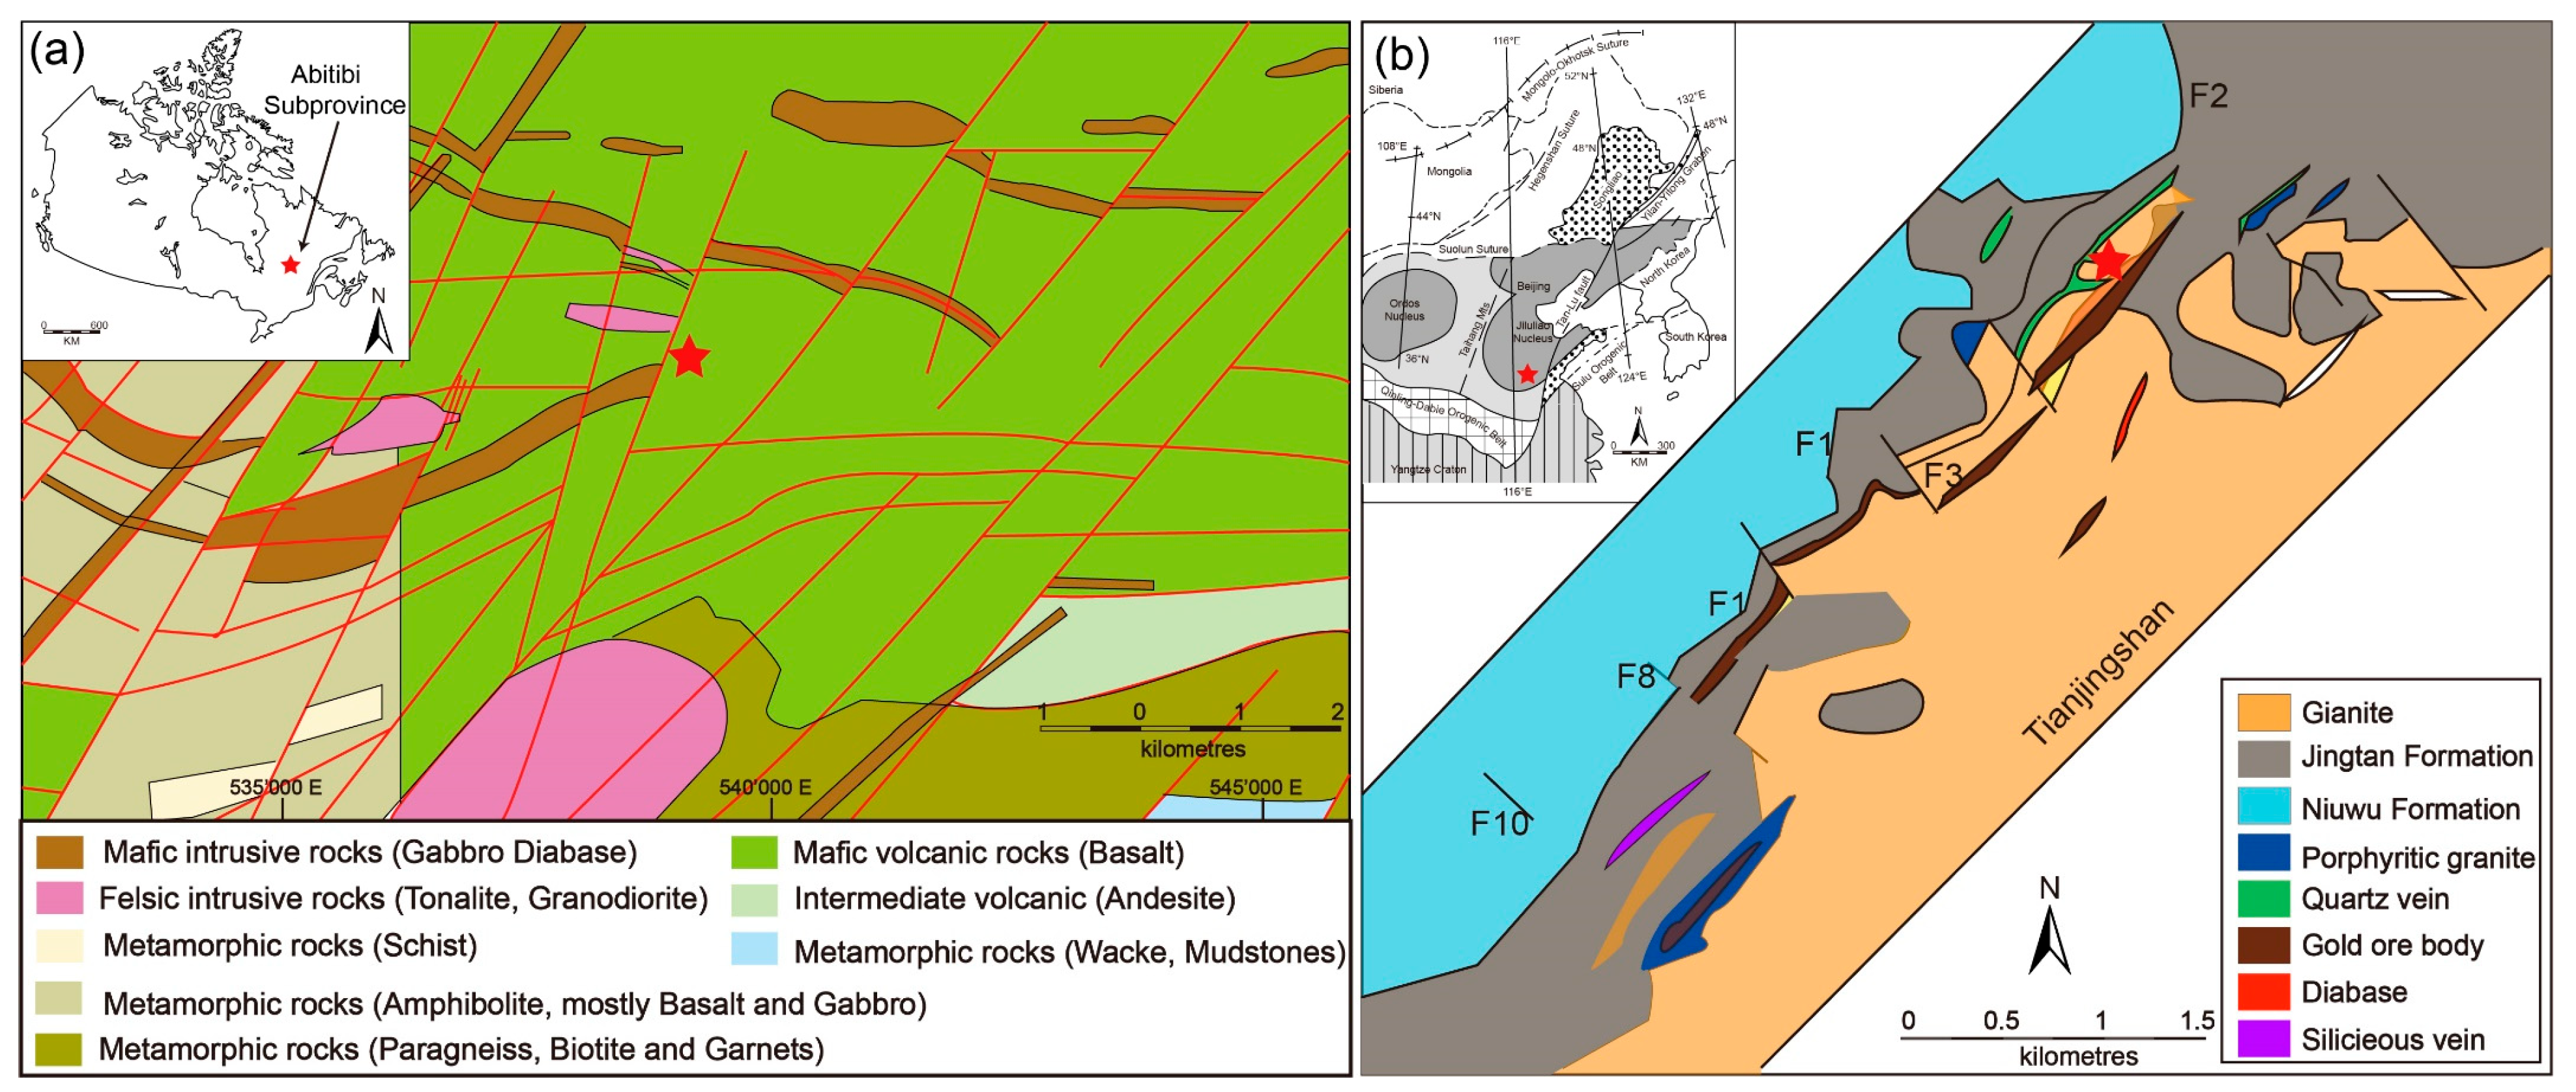
2.1. Chibougamau Quartz Vein in Canada (CBG)

The Chibougamau area is situated in the northeastern corner of the gold-endowed Abitibi greenstone belt, which covers more than 2 million km2, and it is the largest continuous greenstone belt in the part of Canada’s Superior Province (Figure 1a) [19,20,21,22]. This area is dominated by Archean volcanic stratigraphy (Roy Group), which consists of Obatogamau, Waconichi, Gilman, Blondeau, and Bordeleau formations. The Roy Group is characterized by a 3–4 km thick basalt to basaltic andesite assemblage overlain by volcaniclastic and sedimentary rocks [20,23,24]. Magmatic activity in the region falls into three categories: (1) 2730–2700 Ma syn-volcanic tonalite-trondhjemite-granodiorite intrusions; (2) 2700–2692 Ma syn-tectonic granodiorite, rare tonalite, and monzodiorite plutons; and (3) 2690–2670 Ma late-tectonic intrusions [22,25,26].
Joe Mann Mining is located 60 km south of the town of Chibougamau. There are many mineralized veins in the Joe Mann mine, which are hosted by highly altered and sheared rock, such as pyrite, pyrrhotite, and chalcopyrite lens and veinlets parallel to schistosity. These veins are laminated or banded in structure, consisting of alternating ribbons of quartz and mineralized wall rock. Vitreous white quartz is the main mineral in the veins, associated with a small amount of plagioclase and iron carbonate. Gold mineralization occurs in decimeter-scale quartz-carbonate veins located within ductile-brittle shear zones, which are sub-parallel to stratigraphy and one another. These shear zones are the main E–W deformation corridors cutting the mafic volcanic rocks of the Obatogamau Formation in the northern Caopatina Segment with the gabbro bed in the main body of the shear zone, and its southern zone is located in “rhyolite”. The thickness of these shears is about 8–20 m in the gabbro, and it is about 5–6 m in the rhyolite. Gold-bearing quartz-carbonate veins are generally sub-parallel to the shears, and they are located in the central zones of these structures [27].

2.2. Tianjingshan Quartz Vein in China (TJS)

The Tianjingshan deposit is located at the southeastern margin of the Jiangnan orogen (Anhui Province, eastern China, Figure 1b), which is the junction of the Yangtze Craton and the South China Block. This area experienced two orogenic stages in the Jinning Period, including the early subduction and late collision stages. It also experienced the later Indosinian Movement, which formed a series of NE and NNE fold fault zones [28]. During the Yanshanian movement, it was transferred into the continental margin active zone and dominated by strongly differentiated block fault movement [29]. A large number of Jinningian and Yanshanian granites are developed in this area. The lithology is mainly fine-grained porphyritic granodiorite, granite porphyry, medium-fine-grained porphyritic monzogranite, gneissic K-feldspar granite porphyry, and biotite granite. The magmatic rocks are closely related to the gold-bearing quartz veins in this area, which are mainly diorites and alkaline granites formed during the late stage of magmatic evolution [30].
The strata exposed in the Tianjingshan deposits are volcaniclastic rocks on the southeast side, which are mainly composed of metamorphic andesite, rhyolite porphyry, and dacite porphyry, yielding zircon U-Pb ages of 776–820 Ma [31]. The northwest side is metamorphic fine clastic rock mainly composed of sandstone. The length of the gold-bearing quartz vein is about 10 m to more than 1500 m, and the thickness is a few centimeters to 6 m. There are two main kinds of gold-bearing quartz veins, one is a single vein, the shape of veins, a small number of branches, and the other is quartz mesh veins, with intermittent irregular distribution. The gold-bearing quartz veins are mainly composed of quartz (>93%), sulfide (3%–5%), natural gold, and so on, belonging to the low sulfide type ores. Generally, the gold grade of the quartz vein is unevenly distributed, with a large coefficient of variation [30].
In the present study, these two gold-bearing quartz vein tailing resources were selected to evaluate their potential as raw materials for the production of HPQ. In addition, the quartz samples used in this study were selected from the core zone of the veins to avoid the contamination of impurities present in the border areas. In total, two vein quartz samples were obtained for systematic laboratory analyses.
Figure 1. Geological sketch map of the two gold-bearing quartz vein deposits. (a) Chibougamau, in Québec province in Canada (modified after Beauregard and Gaudreault, [27]); (b) Tianjingshan, in Anhui province in China (modified after Duan et al. [30]). All sample locations are marked as red stars.
Minerals 13 00261 g001

3. Analytical Methods

3.1. Optical Microscopy Observation

Double-polished thin sections were prepared for microscopic scrutiny from the two vein quartz samples. A transmitted polarizing microscope (TPM, Nikon DS-RI2, Tokyo, Japan) was used to characterize the petrological features of the quartz samples, including granular size, silicate melt, fluid and mineral micro-inclusions assemblage, and microstructure.

3.2. Scanning Electron Microscope (SEM) and Cathodoluminescence (CL)

Backscattered electron (BSE) imaging, quartz cathodoluminescence (CL) imaging, and identification of unknown minerals were conducted using a TESCAN MIRA3 scanning electron microscope (SEM, TESCAN, Czech Republic) equipped with the Gatan Chromal CL2 (CL, Gatan, England)system and an EDAX GENESIS APEX Apollo System energy dispersive spectrometer (EDS, EDAX, USA) at CAS Key Laboratory of Crust-Mantle Materials and Environments at the University of Science and Technology of China (USTC), Hefei, with working conditions of 15 kV, 15 nA for BSE imaging and EDS, and 10 kV and 15 nA for CL imaging.

3.3. Raman Spectrometry Measurement

Fluid and mineral micro-inclusions in quartz were identified by a JY HORIBA LabRam HR Evolution confocal Raman (HORIBA, Lille, France) micro-spectrometer equipped with a confocal optics, air-cooled CCD detector, and a 532 nm Ar laser excitation with 500 mW at CAS Key Laboratory of Crust-Mantle Materials and Environments at USTC, Hefei. Analytical conditions were 1 µm beam diameter, 200 µm slit width, 100 µm confocal aperture, 600 grooves/mm gratings, 100× objective, 2× accumulations, and 3 s acquisition time. The polycrystalline and monocrystalline silicon were analyzed at the start and end of each analytical session of the samples to check the stability of the instrument and to ensure the reliability of the data (520.7 cm−1 for a silicon metal standard).

3.4. Spot Chemical Composition Analysis by LA-ICP-MS

Impurity contents in quartz were measured by laser ablation inductively-coupled plasma mass spectrometry (LA-ICP-MS) on polished samples at the in situ Mineral Geochemistry Lab, Ore deposit and Exploration Centre (ODEC), Hefei University of Technology, China. The analyses were carried out on an Agilent 7900 Quadrupole ICP-MS coupled to a Photon Machines Analyte HE 193-nm ArF Excimer laser ablation system (Agilent, Santa Clara, California, USA). Argon was used as the make-up gas and mixed with the carrier gas via a T-connector before entering the ICP [32,33] with high He (0.9 L/min) and Ar (0.9 L/min) flow rates. Each analysis was performed by a uniform spot size diameter of 30 mm at 7 Hz with energy of ~7 J/cm2 for 40 s after measuring the gas blank for 20 s.
Standard reference materials NIST 610, NIST 612, and BCR-2G were used as external standards for the plot calibration curve. The preferred values of the element concentrations for the USGS reference glasses are from the GeoReM database (http://georem.mpch-mainz.gwdg.de/; accessed on 20 January 2022). Standard reference materials were run after each 10–15 unknowns; the detection limits were calculated for each element in each spot analysis. The offline data processing was performed using an in-house Matlab-based program called Spotanalysis1.0. Trace element compositions of silicate minerals were calibrated against multiple-references materials without applying internal standardization. The sums of all element concentrations expressed as oxide (according to their oxidation states present in the silicate) were considered to be 100% m/m for a given anhydrous silicate mineral [34].

3.5. Bulk Chemical Composition Analysis by ICP-OES

Impurity contents in pure raw vein quartz and processed quartz sand were measured by inductively coupled plasma-optical emission spectrometry (ICP-OES) at the Key Laboratory of Photovoltaic and Energy Conservation Materials, Institute of Solid State Physics, Hefei Institutes of Physical Science, Chinese Academy of Sciences, Hefei, China. All measurements were performed with a SPECTRO ARCOS FHX22 ICP spectrometer (SPECTRO, Germany). ICP-OES is used to accurately measure the metal elements contained in the minerals. The ICP-OES sample preparation method is the acid-soluble method, and the acids used are HF and HNO3. The standard solutions used were provided by the testing laboratory.

3.6. X-ray Powder Diffraction (XRD)

The structure and phase composition of the two processed quartz sand samples were analyzed by X-ray powder diffraction (XRD) with a Japan Rigaku SmartLab X-ray diffractometer equipped with graphite-monochromatized Cu Kα radiation (λ = 0.154056 nm), at a scanning rate of 0.02° s−1 in 2θ range of 10–50°.

3.7. Purification Process for the CBG and TJS Vein Quartz

Here, we purified the two raw vein quartz samples by a complete process of calcination, water quenching, grinding, flotation, and acid leaching. Among them, calcination, water quenching, and grinding belong to the pretreatment stage.
Pretreatment stage: the cleaned and dried raw quartz was manually crushed to 20–50 mm, and then it was calcined at 900 °C for 1 h before water quenching. Finally, the water-quenched ore samples were broken into the required particle size with a crusher, and 60–80 µm quartz sand was screened out for use. By the pretreatment, the impurities within the quartz can be exposed on the surface of the particles or detached to form single individuals, such as inclusions, lattice impurities, and other mineral impurities. Meanwhile, water quenching can cause cracks in the quartz particles. All these contribute to the effectiveness of chemical leaching [35].
Flotation: the flotation experiment was carried out using a XFD-III 1.5 L flotation machine. The stirring rates and air injection rate were 2000 rpm and 0.6 m3h−1, respectively, in this work. First, 75 g of the 60–80 µm quartz sand sample was mixed with ultra-pure water in this flotation cell, 1.5 mL HCl was added to adjust the pH 2–3 [36], and hydrofluoric acid (HF) was used as the activator. After stirring for 2 min., 4 mL cationic collector dodecylamine of analytical grade solution was added to the slurry. The flotation process lasted for 10 min. All reagents were prepared into a 0.1 mol/L solution for the flotation experiment. The froth and the sink products (quartz sand) were collected separately. The main purpose of flotation is to remove the feldspar and mica contained in the raw quartz.
Acid leaching: quartz sand samples after flotation (2 g) were put in pre-cleaned 50 mL Teflon cups and acid-leached at 80 °C for 10 h by using an HNO3-HCl-HF acid leaching system with 30 mL ultra-pure water, 3 mL ultra-pure HNO3, 4 mL HCl, and 0.8 mL ultra-pure HF. After acid leaching, the quartz sand samples were washed three times with ultra-pure water and dried under vacuum in an oven at a temperature of approximately 120 °C for 0.5 h. During the acid leaching, the acid can corrode the impurities exposed on the surfaces and even enter the interior of the quartz grains to corrode impurities through micro-cracks, thereby obtaining a better purification effect, especially showing great advantages on dissolving aluminosilicate minerals and surface irons from an intergrowth of the quartz and the impurities [35].

4. Results

4.1. Petrography

The present study focuses on the two vein quartz samples. Figure 2 and Figure 3 show photographs and microphotographs of the CBG and TJS raw vein quartz, particularly the fluid inclusions and co-existed minerals. EDS analysis of co-existed minerals in these two samples is shown in Figure S1.

4.1.1. CBG Raw Vein Quartz

CBG raw vein quartz is a grayish-white and sub transparent mineral with oily luster (Figure 2a). Optical microscopy observation shows that elongated quartz grains show undulate extinction and sutured grain boundaries. They are commonly medium coarse-grained, granular sizes of the quartz crystals range from 50 µm to 1000 µm, and the quartz content is about 80%–90% (Figure 2b). SEM observation on the CBG quartz found that the co-existed minerals contain ankerite (50–300 µm), muscovite (10–100 µm), K-feldspar (10–50 µm), albite (10–50 µm), iron compounds (hematite and pyrite, 10–50 µm), sillimanite (10–50 µm), apatite (10–50 µm), and rutile (<20 µm) in that order of abundance. Ankerite and muscovite are very common and ubiquitously distributed along quartz grain boundaries or within quartz crystals. Rutile occurs as tiny needles (an exsolution product) and prismatic crystals, and iron compounds are observed as micro-fractures filling inside the quartz crystals (Figure 2c–f).
CBG quartz also shows impurities of silicate melt and fluid inclusions. Among them, silicate melt inclusions are numerous and large (3–10 µm, Figure 3a). The contents of the fluid inclusions are also very high, but much smaller compared to those of the silicate melt inclusions and oriented. Although the size of the fluid inclusions shows extreme variation from <1 µm up to sizes observable in the hand specimen, most visible fluid inclusions fall in the range from 1 to 5 µm. The majority of the fluid inclusions are two-phase fluid inclusions. Usually, they are composed of liquid and gas, although some have precipitated salt crystals. Therefore, the liquid phase may be pure water or brine, while the gas phase is CO2 determined by Raman spectrometry (Figure 3b). However, there are also a certain amount of clean areas without inclusion in the sample (Figure 3c).

4.1.2. TJS Raw Vein Quartz

TJS vein quartz is usually a large block, with euhedral–anhedral morphology, being milky white and having oily luster (Figure 2g). The petrographic investigation by a transmitted polarizing microscope reveals that the TJS vein quartz is commonly coarse-grained and consists of subhedral to anhedral interlocked quartz crystals with particle sizes ranging from 500 µm to about 2000 µm (Figure 2h). The detected co-existed minerals with quartz in TJS raw quartz are relatively rare, being composed of only ankerite (20–100 µm) and albite (<20 µm) (Figure 2i). The microscopically estimated quartz content is 97–99 wt.%.
Compared with CBG raw vein quartz, the fluid inclusions in TJS raw quartz are much smaller. Sub-micro fluid inclusions are extremely common and densely distributed throughout the quartz crystal. Some of these fluid inclusions occur in parallel to the growth zones of the quartz crystal, denoting a primary origin (Figure 3d). In a few instances, the fluid inclusions contain vapor bubbles and occasionally precipitate solid crystals, which are tentatively interpreted as salt minerals, and traces of heavy hydrocarbon in the gas phase were only detected in a few cases by Raman spectrometry (Figure 3e). The sample also presents “colony” minute inclusions, as shown in Figure 3f. Because the individual inclusions are smaller than the resolution of the optical microscope, precise information concerning their shape and composition could not be obtained. Due to this difficulty, we cannot state if they are mineral or fluid inclusions.

4.1.3. Microstructure and XRD Analysis of the CBG- and TJS-Processed Quartz Sand Samples

The optical micrographs of the CBG and TJS quartz sand samples are shown in Figure 4a,b. It can be seen that the microscopic morphology of the two processed quartz sand samples is very similar. The surface is relatively smooth and clean, and the distribution of many micro-cracks is obvious. Compared with the raw quartz, the contents of the fluid inclusions in the two processed quartz sand samples are greatly reduced. The XRD results of the quartz match the SiO2 standard powder diffraction file (PDF#46-1045). This indicates that the two processed quartz sand samples are in the pure quartz phase (Figure 5).

4.2. Cathodoluminescence of the CBG and TJS Vein Quartz

The cathodoluminescence (CL) texture of the CBG vein quartz is relatively simple, with only a few white micro stripes shown in Figure 6a. Such a simple texture reveals weak hydrothermal activity after the formation of the original quartz. Compared with the CBG vein quartz, the CL texture of the TJS vein quartz is highly heterogeneous, and original dark areas have been replaced or segregated by numerous white thin stripes or a few thick stripes, indicating the complex formation history of the quartz (Figure 6b). It is suggested that the secondary quartz vein grows along the microfractures or fissures of the original quartz after the formation of the original quartz vein, indicating episodic fluid activity [37,38].

4.3. Spot Chemical Composition Analyzed by LA-ICP-MS

Four points analyses on inclusion-free spots would provide data concerning the lattice-bound impurity contents, and the results are presented in Table 1.
There are nine main impurity elements in quartz that we consider. The CBG raw vein quartz has the contents of Al (9.5–11.5 µg·g−1), Ti (1.5–2.0 µg·g−1), Na (10.2–51.2 µg·g−1), Ca (207.6–279.2 µg·g−1), K (0–30.1 µg·g−1), Li (0.6–0.7 µg·g−1), Fe (0–158.4 µg·g−1), P (0–71.2 µg·g−1), and B (2.0–4.8 µg·g−1), with total impurity elements and SiO2 contents of 286.9–474.1 µg·g−1 and 99.953–99.971 wt.%. While the TJS raw vein quartz has the contents of Al (11.5–19.6 µg·g−1), Ti (0.5–2.8 µg·g−1), Na (7.9–19.9 µg·g−1), Ca (196.5–219.2 µg·g−1), K (0–1.3 µg·g−1), Li (0–0.1 µg·g−1), Fe (0–41.7 µg·g−1), P (0.1–23.9 µg·g−1), and B (2.7–4.5 µg·g−1), with total impurity elements and SiO2 contents of 240.0–313.3 µg·g−1 and 99.969–99.976 wt.%. The content of Ca is very high in both of these two raw vein quartz samples.

4.4. Bulk Chemical Composition Analyzed by ICP-OES

Compared with LA-ICP-MS, ICP-OES can provide the contents of all impurity elements for the whole quartz, rather than a micro-zone in quartz. Here, ICP-OES is used to analyze the above nine impurity elements in the raw quartz and the processed quartz sand, and the results are shown in Table 1.
The sums of the impurity contents analyzed in CBG and TJS raw quartz are 1343.1 µg·g−1 and 196.8 µg·g−1, respectively. In these two samples, the very high contents of Na, K, and Al indicate the presence of co-existed minerals with quartz in the analyzed material. In addition, the high content of Fe in CBG raw quartz is mainly found in hematite and pyrite. These data are therefore not available and will not be discussed.
After purification, the sum content of the impurity elements in the CBG quartz is 56.8 µg·g−1, with Al (13.1 µg·g−1), Ti (6.6 µg·g−1), Na (<11.2 µg·g−1), Ca (6.3 µg·g−1), K (undetected), Li (undetected), Fe (12.9 µg·g−1), P (3.3 µg·g−1), and B (3.3 µg·g−1). The sum content of the impurity elements in the TJS quartz is 85.2 ppm, with Al (29.4 µg·g−1), Ti (6.1 µg·g−1), Na (33.1 µg·g−1), Ca (0.9 µg·g−1), K (<5.7 µg·g−1), Li (2.0 µg·g−1), Fe (undetected), P (3.6 µg·g−1), and B (4.5 µg·g−1). The SiO2 contents of CBG and TJS processed quartz sand are 99.994 wt.% and 99.991 wt.%, respectively.

5. Discussion

5.1. Characteristics of Impurities in Vein Quartz

The impurity content of HPQ is a key factor in determining the grade of the product. High impurity content can affect the application of HPQ. In addition, the removal method of quartz impurities is related to the type of impurity. Therefore, it is essential to identify the types of impurities contained in quartz before processing. The types of impurities in quartz mainly include lattice impurities, interstitial impurities, inclusions, and co-existed minerals.
The difficulty of removing different types of impurities is different. Co-existed minerals are relatively easy to remove. For example, feldspar, mica, zircon, and iron oxides are often present in raw quartz during the mineralization process. Most of these minerals are separated from the quartz particles to form separate minerals during water quenching and crushing, and they can be effectively removed by flotation, magnetic separation, and acid leaching [35,39]. Inclusions in natural quartz mainly include solid mineral inclusions, melt inclusions, and fluid inclusions. In theory, some co-existed minerals may also occur as micro and submicron mineral inclusions in quartz. Silicate melt inclusions are common in igneous and pegmatitic quartz. They are glassy or crystalline small blebs (~1–300µm) of silicate melt [40,41,42]. Fluid inclusions are common inclusions in quartz and are formed by fluids that are enclosed within the crystal during quartz mineralization. Water, carbon dioxide, methane, nitrogen, and heavier hydrocarbons are often present in fluid inclusions [41,43,44]. In addition, fluids containing large amounts of dissolved salts can form a daughter mineral, such as halite, during cooling [43]. Most of the metal impurity elements (Na, K, Ca, Mg, Ba, Mn, and REE) in quartz are also present in fluid inclusions [2,45,46]. Fluid inclusions not only affect the grade of quartz, but also affect the application of quartz. For example, in the glass industry, gas inclusions and liquid inclusions generate bubbles during the melting process that directly affect the mechanical and optical properties of quartz glass [47,48].
The lattice impurities and interstitial impurities of quartz are difficult to remove [49]. Some elements (Al3+, B3+, Fe3+, Ge4+, Ti4+, and P5+) will substitute for part of Si4+ in the quartz lattice and form lattice impurities. At the same time, some impurity ions (H+, Li+, Na+, K+, and Fe2+) enter the interstitial to maintain the charge balance [46,50,51,52,53,54]. Lattice impurities and interstitial impurities are very harmful to quartz products, as they will not only affect the quality of the product, but also reduce the service life. For example, high Fe content will affect the efficiency of solar photovoltaic products [55,56], and excessive Al will affect the service life of quartz crucibles [57].

5.2. Impurity Elements Incorporation into the Raw Quartz and Processed Quartz Sand Samples

Nine detrimental impurity elements in CBG and TJS processed quartz sand samples have been compared with the suggested upper content limits of HPQ, as shown in Figure 7.

5.2.1. CBG Vein Quartz

Through the data of raw quartz by LA-ICP-MS, CBG vein quartz has a very low Al content as it is found in nature, for most quartz resources, either hydrothermal, pegmatitic, or diagenetic, usually contain more than 20 µg·g−1 in Al [58]. The contents of B and Ti are also relatively low. These impurity elements are important substituents of Si in the quartz crystalline structure, and their low values are in line with the low concentration in Li, which is a charge compensator for Al3+ defects. For the main impurities Na, K, and Ca, their contents are high and variable. Usually, the contents of these elements are related to the co-existed minerals within quartz crystals (e.g., muscovite, ankerite, and feldspar by the microscopic examination and component analysis) or halite phases in fluid inclusions [59,60,61]. The high content of Fe in quartz indicates the presence of iron compounds (hematite and pyrite). P is detected, and it probably corresponds to apatite inclusions.
Data on some impurity contents of the CBG processed quartz sand reveal noticeable purification efficiencies, especially for the content of Ca (Table 1). The processed quartz sand has moderately low contents of Li, Al, K, and Ti, which are all below the upper content limits of HPQ designated by Müller et al. (2012). This indicates that mineral inclusions, such as feldspar and mica, have been completely removed from the quartz sand. However, Na, Ca, and Fe contents are still above the HPQ limits, probably resulting from residual micron and submicron fluid inclusions and iron compounds that were not removed during the purification process (Figure 7). In addition, some B and P possibly occur in quartz lattice. The sum content of the impurity elements in processed quartz sand is below 56.8 µg·g−1 (Table 1), which is slightly higher than the upper concentration limit of HPQ [11].

5.2.2. TJS Vein Quartz

In TJS raw quartz, the low contents of Al and Ti are generally similar to those in CBG quartz, with Al being slightly higher. Ca is the most abundant impurity, followed by Na, Fe, P, and B. Based on a combination of TMP and SEM analysis, the main mineral inclusions in raw quartz are ankerite and albite. Ca and Fe mainly occur in ankerite, Na mainly exists in albite, and P may correspond with apatite inclusions. Moreover, the high contents of Ca and Na are sometimes due to a saline environment. Generally, these elements are carried in quartz by fluid inclusions or mineral inclusions [59,62]. K is not detected, indicating that there is no mica in TJS quartz.
After purification, the sum content of the impurity elements in TJS processed quartz sand is below 85.2 µg·g−1. Observably, Ca content is reduced to an abnormally low value of 0.9 µg·g−1. Meanwhile, the Fe content is below the detection limit. All these indicate the absence of ankerite in processed quartz sand. The lattice-bound impurity elements Al, Ti, P, and B, and the charge compensation ion Li contents, are also relatively low. Among them, Li, Al, and Ti contents are below the upper limits of HPQ. The Na content in processed quartz sand is very high and well above the HPQ limits, which could be due to the micron and the submicron fluid inclusions or the undetected mineral inclusions in quartz crystal, such as albite (Figure 7).

5.3. Economic Assessment with CBG and TJS Quartz Vein Deposits

The main objective of this study is to assess and identify the potential of quartz vein deposits as HPQ resources in Chibougamau and Tianjingshan. Al and Ti are the most common impurity elements in quartz. When they occur as lattice-bound impurity elements, they are hard to be removed during the processes of the raw quartz material, and the chemical cleaning results in high production costs. So, Al and Ti are usually used as indicator elements of the quartz quality.
Aluminum and titanium contents in CBG and TJS vein quartz samples (raw quartz and processed quartz sand), the refined high-quality quartz products fabricated by Norwegian Crystallites in Norway (e.g., Drag NCA and Drag NC1), and Unimin in the USA (Iota STD and Iota 8) [9], are plotted in Figure 8. Both the raw quartz and the processed quartz sand from the CBG and TJS quartz vein are plotted in the HPQ field. The Al and Ti contents in CBG and TJS quartz are similar to those in commercial powders, and the CBG quartz has an Al content even lower than Iota STD or Drag NC1. In addition, the two processed quartz sand samples have total impurity contents of 56.8 µg·g−1 and 85.2 µg·g−1, only slightly above the upper content limit level of 50 µg·g−1. Na, K, Ca, and Fe may still be caused by residual albite, hematite, micron, submicron silicate melt, and fluid inclusions in processed quartz sand samples. One can be confident in speculating concerning an even lower level of impurities if advanced processing techniques, such as hot chlorination treatments [7,63], electrical fragmentation [64], and radiation methods [65], would be applied in the future to further remove the non-lattice-bound impurities and some lattice-bound impurities. Meanwhile, non-metal elements B and P can also be efficiently removed by oxidizing calcination due to their unstable oxidation states at high temperature [35]. Therefore, the CBG and TJS quartz vein deposits can be considered as potential future resources for HPQ. Then, the efficient recovery and utilization of tailing resources would be further realized, and the economic benefits of the mine would be improved.

5.4. Genetic Implications for the CBG and TJS Quartz Vein Deposits

Both CBG and TJS quartz veins are from gold deposits. As suggested by the Ti vs. Al plot in Figure 9, their data points obtained by the LA-ICP-MS technique fall into or near the field of orogenic Au deposit, indicating these quartz veins were generated under hydrothermal conditions. Indeed, CO2-bearing fluid inclusion has been recognized in CBG quartz in this study, which is one of the diagnostic features of orogenic gold deposits [38,66]. However, there are some differences in textures and compositions between the two types of quartz, and both contrasting fluid compositions and hydrothermal conditions are responsible for that.
CBG quartz is characterized by abundant mineral/fluid inclusions and relatively homogeneous CL texture. Besides, the sum of the impurity contents is 286.9 to 474.1 µg·g−1 (LA-ICP-MS data), and Ca, Fe, Al, Na, etc. are regarded as the major impurity elements. In general, the simple CL texture of the CBG quartz suggests that the quartz vein was produced under stable hydrothermal conditions without frequent disturbance. Such a fluid is enriched in Ca, Fe, Al, and Na, as revealed by the quartz chemistry and the coexisting minerals (e.g., ankerite, K-feldspar, albite). Given the high contents of the impurities and abundant mineral/fluid inclusions, along with the absence of the strong secondary hydrothermal modification, it is inferred that the impurity-bearing quartz results from the original metal-rich metamorphic fluid rather than secondary contamination by an external fluid [37,38].
In comparison with CBG quartz, TJS quartz is marked by smaller mineral/fluid inclusions and complicated CL texture. The sum of the impurity contents is 240.0 to 313.3 µg·g−1 (LA-ICP-MS data), and Ca, Fe, Al, Na, etc. are also regarded as the major impurity elements. The complex CL texture indicates that the quartz vein was formed by episodic hydrothermal activity, namely, the original quartz had been overprinted by secondary quartz along existing micro fractures. The primary hydrothermal fluid may be depleted in metals because the impurity contents and the co-existing minerals are fewer relative to the CBG quartz. Two parameters are suggested to cause low contents of the impurity elements for the TJS quartz. Firstly, the initial hydrothermal fluid has low contents of metals, and in this way, the resultant quartz vein is expected to present low metal abundance. Secondly, the primary quartz has been affected by episodic fluid, and it is highly possible that hydrothermal overprinting can induce the expulsion of some metal ions [37,67].
Accordingly, there are some differences in elemental contents of the fluid (high vs. low) and the geological processes (i.e., secondary modification or not) between the CBG and TJS quartz vein, which resulted in contrasting compositions and textures for both quartz samples.

6. Summary and Conclusions

In the present study, we focus on the evaluation of the HPQ raw material potential of the two gold-bearing quartz vein tailings resources in Chibougamau and Tianjingshan. Petrography and the contents of impurity elements of the two vein quartz samples before and after processing were studied, and the genesis of the investigated quartz vein was analyzed. The major conclusions are drawn as follows:
  • The petrographic investigation carried out on the CBG vein quartz reveals that the major impurities in quartz are mica, feldspar, ankerite, iron-compounds, and trace apatite, as well as silicate melt and fluids inclusions. The TJS vein quartz is characterized by a low content of mineral inclusions, being only ankerite and albite, while the silicate melt and the fluid inclusions are common in it.
  • The analysis by LA-ICP-MS shows that the SiO2 contents of CBG and TJS raw quartz are very high (CBG: 99.953–99.971 wt.%, TJS: 99.969–99.976 wt.%) with very low content of the impurity elements, except for Ca, which is contained mostly in ankerite and silicate melt and fluids inclusions.
  • The CBG quartz vein is produced under stable hydrothermal conditions, which resulted from the original metal-rich metamorphic fluid. However, the TJS quartz vein is formed by episodic hydrothermal activity, and the initial hydrothermal fluid has low contents of metals.
  • Bulk solution ICP-OES analysis demonstrated that the SiO2 contents of the CBG and TJS processed quartz sand samples are 99.994 wt.% and 99.991 wt.%, respectively. The total impurity contents are 56.8 µg·g−1 with 13.1 µg·g−1 Al and 6.6 µg·g−1 Ti for the CBG processed quartz sand, while they were 85.2µg·g−1 with 29.4 µg·g−1 Al and 6.1 µg·g−1 Ti for the TJS quartz sand. Since the main impurities in these two quartz samples are silicate melt, fluid, and mineral inclusions, they can be removed by more advanced purification processing. Therefore, these two quartz vein deposits have the potential to be raw materials for HPQ.

Supplementary Materials

The following supporting information can be downloaded at: https://www.mdpi.com/article/10.3390/min13020261/s1, Figure S1: EDS analyses of co-existed minerals in CBG and TJS raw vein quartz.

Author Contributions

Investigation, methodology and writing—original draft preparation, M.X.; project administration and data curation, C.S.; resources, writing—review and editing, X.Y. and J.C. All authors have read and agreed to the published version of the manuscript.

Funding

This research was funded by the Key Research Program of the Chinese Academy of Sciences (Grant No. ZDRW-CN-2021-3), Natural Science Foundation of China (nos. 42030801, 42011540384, 51874272).

Data Availability Statement

Data is contained within the article or Supplementary Materials.

Acknowledgments

We are grateful to Zhuang Zhao, Qi Hou, and Xue-song Jiang for their help with purification experiments, Fang-yue Wang for his assistance with the LA-ICP-MS analysis, and Ling Wang for bulk solution ICP-OES analysis.

Conflicts of Interest

The authors declared that they have no conflicts of interest to this work. We declare that we do not have any commercial or associative interest that represents a conflict of interest in connection with the work submitted.

References

  1. Rösler, H.J. Lehrbuch der Mineralogie, 2. Aufl.; VEB Deutscher Verlag für Grundstoffindustrie: Leipzig, Germany, 1981; p. 833. [Google Scholar]
  2. Götze, J. Chemistry, textures and physical properties of quartz—Geological interpretation and technical application. Miner. Mag. 2009, 73, 645–671. [Google Scholar] [CrossRef]
  3. Ding, Y.Z.; Lu, J.W.; Yin, W.Z. Research on purifying low-grade quartz ore by flotation. Metal Mine 2009, 5, 84–87, (In Chinese with English Abstract). [Google Scholar]
  4. Li, X.L.; Zhang, Q.D.; Xu, H.X. Research on purification of quartz sand in Sichun. Conserv. Util. Miner. Resour. 2014, 2, 35–38, (In Chinese with English Abstract). [Google Scholar]
  5. Englert, A.H.; Rodrigues, R.T.; Rubio, J. Dissolved air flotation (DAF) of fine quartz particles using an amine as collector. Int. J. Miner. Process. 2009, 90, 27–34. [Google Scholar] [CrossRef]
  6. Haus, R. High demands on high purity. Ind. Miner. 2005, 10, 62–67. [Google Scholar]
  7. Haus, R.; Prinz, S.; Priess, C. Assessment of High Purity Quartz Resources. In Quartz: Deposits, Mineralogy and Analytics; Springer: Berlin/Heidelberg, Germany, 2012; pp. 29–51. [Google Scholar]
  8. Moore, P. High-purity quartz. Ind. Miner. 2005, 455, 53–57. [Google Scholar]
  9. Müller, A.; Ihlen, P.M.; Wanvik, J.E.; Flem, B. High-purity quartz mineralisation in kyanite quartzites, Norway. Miner. Depos. 2007, 42, 523–535. [Google Scholar] [CrossRef]
  10. Shen, S.F. The actuality of study and manufacture in higher purity quartz. China Non-Met. Min. Ind. Her. 2006, 5, 13–16, (In Chinese with English Abstract). [Google Scholar]
  11. Müller, A.; Wanvik, J.E.; Ihlen, P.M. Petrological and Chemical Characterisation of High-Purity Quartz Deposits with Examples from Norway. In Quartz: Deposits, Mineralogy and Analytics; Springer: Berlin/Heidelberg, Germany, 2012; pp. 71–118. [Google Scholar]
  12. Haßler, S.; Kempe, U.; Götze, J. Trace element content of quartz from the Ehrenfriedersdorf Sn-W deposit. In Mineral Deposit Research: Meeting the Global Challenge: Proceedings of the Eighth Biennial SGA Meeting Beijing, China, 18–21 August 2005; Springer: Berlin/Heidelberg, Germany, 2005. [Google Scholar]
  13. Lei, S.M.; Pei, Z.Y.; Zhong, L.L.; Ma, Q.L.; Huang, D.D.; Yang, Y.Y. Study on the technology and mechanism of reverse flotation and hot pressing leaching with vein quartz. Non-Met. Mines 2014, 37, 40–43. [Google Scholar]
  14. Wang, L.; Li, C.X.; Wang, Y.; Yin, D.Q. China technologies present of high-purity quartz processing and the development propositions. J. Mineral. Petrol. 2011, 31, 110–114, (In Chinese with English Abstract). [Google Scholar]
  15. Larsen, R.B.; Polve’, M.; Juve, G. Granite pegmatite quartz from Evje-Iveland: Trace element chemistry and implications for high-purity quartz formation. Nor. Geol. Undersøkelse Bull. 2000, 436, 57–65. [Google Scholar]
  16. Ibrahim, S.S.; Shahien, M.M.; Seliem, A.Q.; Abukhadra, M.R.; Zayed, A.M. Marwit Rod El Leqah Quartz Deposits as a Strategic Source of High Purity Quartz. J. Geosci. Environ. Prot. 2015, 3, 41–47. [Google Scholar] [CrossRef]
  17. Wang, J.Y.; Xie, Z.F.; Wang, C.L.; Hu, Y.F. Trace Element Concentrations and Mineralogy of Quartz Vein Deposits from Southeastern Hubei Province, China. Minerals 2022, 12, 814. [Google Scholar] [CrossRef]
  18. Müller, A.; Ihlen, P.M.; Snook, B.; Larsen, R.B.; Flem, B.; Bingen, B.; Williamson, B.J. The Chemistry of Quartz in Granitic Pegmatites of Southern Norway: Petrogenetic and Economic Implications. Econ. Geol. 2015, 110, 1737–1757. [Google Scholar] [CrossRef]
  19. Goodwin, A.M.; Ridler, R.H. The Abitibi orogenic belt. In Symposium on Basins and Geosynclines of the Canadian Shield; Baer, A.J., Ed.; Geological Association of Canada: Wininipeg, MB, Canada, 1970; Volume 10–15, pp. 1–31. [Google Scholar]
  20. Leclerc, F.; Harris, L.B.; Bédard, J.H.; Breemen, O.V.; Goulet, N. Structural and Stratigraphic Controls on Magmatic, Vol-canogenic, and Shear Zone-Hosted Mineralization in the Chapais-Chibougamau Mining Camp, Northeastern Abitibi, Canada. Econ. Geol. 2012, 107, 963–989. [Google Scholar] [CrossRef]
  21. Mathieu, L. Detecting magmatic-derived fluids using pyrite chemistry: Example of the Chibougamau area, Abitibi Subprovince, Québec. Ore. Geol. Rev. 2019, 114, 103–127. [Google Scholar] [CrossRef]
  22. Fayol, N.; Jébrak, M. Archean Sanukitoid Gold Porphyry Deposits: A New Understanding and Genetic Model from the Lac Bachelor Gold Deposit, Abitibi, Canada. Econ. Geol. 2017, 112, 1913–1936. [Google Scholar] [CrossRef]
  23. Dimroth, E.; Rocheleau, M.; Mueller, W. Paleogeography, isostasy and crustal evolution of the Archean Abitibi Belt: A com-parison between the Rouyn-Noranda and the Chibougamau-Chapais areas. Can. Inst. Min. Metall. Spec. 1984, 34, 73–91. [Google Scholar]
  24. Daigneault, R.; St-Julien, P.; Allard, G.O. Tectonic evolution of the northeast portion of the Archean Abitibi greenstone belt, Chibougamau area, Quebec. Can. J. Earth Sci. 1990, 27, 1714–1736. [Google Scholar] [CrossRef]
  25. Chown, E.H.; Daigneault, R.; Mueller, W.; Mortensen, J.K. Tectonic evolution of the Northern volcanic zone, Abitibi belt, Quebec. Can. J. Earth Sci. 1992, 29, 2211–2225. [Google Scholar] [CrossRef]
  26. Chown, E.H.; Harrap, R.; Moukhsil, A. The role of granitic intrusions in the evolution of the Abitibi belt, Canada. Precambrian Res. 2002, 115, 291–310. [Google Scholar] [CrossRef]
  27. Beauregard, A.J.; Gaudreault, D. NI 43-101 Technical Report on the Joe Mann Mining Property; Legault Metal Inc.: Val-D’Or, QC, Canada, 2012. [Google Scholar]
  28. Xing, F.M.; Xu, X.; Chen, J.F.; Zhou, T.X.; Foland, K.A. The late Proterozoic continental accretionary history of the south-eastern margin of the Yangtze Platform. Acta Geol. Sin. 1992, 66, 59–72, (In Chinese with English Abstract). [Google Scholar]
  29. Yang, S.C. Geological characteristics and prospecting direction of fluorite deposit in Huangshan area, Anhui Province. China Sci. Technol. Inf. 2009, 1, 18–19, (In Chinese with English Abstract). [Google Scholar]
  30. Duan, L.A.; Yang, X.Y.; Sun, W.D.; Fang, S.M.; Yu, L.F.; Fan, Z.P. Geological and geochemical characteristics and prospecting prospect of Tianjingshan gold deposit in southern Anhui Province. Acta Geol. Sin. 2011, 85, 6, (In Chinese with English Abstract). [Google Scholar]
  31. Wu, R.X.; Zheng, Y.F.; Wu, Y.B. Zircon U-Pb age and isotope geochemistry of Neoproterozoic Jingtan volcanics in South Anhui. Geol. J. China Univ. 2007, 13, 282–296, (In Chinese with English Abstract). [Google Scholar]
  32. Ning, S.; Wang, F.; Xue, W.; Zhou, T. Geochemistry of the Baoshan pluton in the Tongling region of the Lower Yangtze River Belt. Geochimica 2017, 46, 397–412. [Google Scholar]
  33. Wang, F.; Ge, C.; Ning, S.; Nie, L.; Zhong, G.; White, N. A new approach to LA-ICP-MS mapping and application in geology. Acta Petrol. Sin. 2017, 33, 3422–3436. [Google Scholar]
  34. Liu, Y.; Hu, Z.; Gao, S.; Günther, D.; Xu, J.; Gao, C.; Chen, H. In situ analysis of major and trace elements of anhydrous minerals by LA-ICP-MS without applying an internal standard. Chem. Geol. 2008, 257, 34–43. [Google Scholar] [CrossRef]
  35. Lin, M.; Liu, Z.Y.; Wei, Y.; Liu, B.; Meng, Y.; Qiu, H.; Lei, S.M.; Zhang, X.; Li, Y.B. A Critical Review on the Mineralogy and Processing for High-Grade Quartz. Min. Metall. Explor. 2020, 37, 1627–1639. [Google Scholar] [CrossRef]
  36. Demir, C.; Gülgonul, I.; Bentli, I.; Çelik, M. Differential separation of albite from microcline by monovalent salts in HF medium. Miner. Metall. Proc. 2003, 20, 120–124. [Google Scholar] [CrossRef]
  37. Rusk, B.; Lowers, H.A.; Reed, M.H. Trace elements in hydrothermal quartz: Relationships to cathodoluminescent textures and insights into vein formation. Geology 2008, 36, 547–550. [Google Scholar] [CrossRef]
  38. Rusk, B. Cathodoluminescent textures and trace elements in hydrothermal quartz. In Quartz: Deposits, Mineralogy and Analytics; Götze, J., Möckel, R., Eds.; Springer: Berlin/Heidelberg, Germany; New York, NY, USA; Dordrecht, The Netherlands; London, UK, 2012; pp. 307–330. [Google Scholar]
  39. Pan, X.D.; Li, S.Q.; Li, Y.K.; Guo, P.H.; Zhao, X.; Cai, Y.S. Resource, characteristic, purification and application of quartz: A review. Miner. Eng. 2022, 183, 107600. [Google Scholar] [CrossRef]
  40. Frezzotti, M.L. Silicate-melt inclusions in magmatic rocks: Applications to petrology. Lithos 2001, 55, 273–299. [Google Scholar] [CrossRef]
  41. Leeder, O.; Thomas, R.; Klemm, W. Einschlüsse in Mineralen; VEB Deutscher Grundstoffverlag: Leipzig, Germany, 1987. [Google Scholar]
  42. Webster, J.D. Melt Inclusions in Plutonic Rocks; Short Course Series 36; Mineralogical Association of Canada: Montreal, QC, Canada, 2006; p. 237. [Google Scholar]
  43. Roedder, E. Fluid Inclusions. Reviews in Mineralogy; Mineralogical Society of America: Chantilly, VA, USA, 1984; Volume 12, p. 644. [Google Scholar]
  44. Van den Kerkhof, A.M.; Hein, U.F. Fluid inclusion petrography. Lithos 2001, 55, 27–47. [Google Scholar] [CrossRef]
  45. Blankenburg, H.J.; Götze, J.; Schulz, H. Quarzrohstoffe; Deutscher Verlag für Grundstof-Findustrie: Leipzig-Stuttgart, Germany, 1994; p. 296. [Google Scholar]
  46. Götze, J.; Plötze, M.; Graupner, T.; Hallbauer, D.K.; Bray, C. Trace element incorporation into quartz: A combined study by ICP-MS, electron spin resonance, cathodoluminescence, capillary ion analysis and gas chromatography. Geochim. Cosmochim. Acta 2004, 68, 3741–3759. [Google Scholar] [CrossRef]
  47. Gemeinert, M.; Gaber, M.; Hager, I.; Willfahrt, M.; Bortschuloun, D. On correlation of gas-liquid-inclusion’s properties and melting behaviour of different genetic quartzes for production of transparent fused silica. Neues Jahrb. Mineral. Abh. 1992, 165, 19–27. [Google Scholar]
  48. Kitamura, R.; Pilon, L.; Jonasz, M. Optical constants of silica glass from extreme ultraviolet to far infrared at near room tem-perature. Appl. Opt. 2007, 46, 8118–8133. [Google Scholar] [CrossRef]
  49. Dos Santos, M.F.M.; Fujiwara, E.; Schenkel, E.A.; Enzweiler, J.; Suzuki, C.K. Processing of quartz lumps rejected by silicon industry to obtain a raw material for silica glass. Int. J. Miner. Process. 2015, 135, 65–70. [Google Scholar] [CrossRef]
  50. Jourdan, A. Elemental and isotopic zoning in natural Alpine quartz crystals. Transplantation 2008, 29, 405–408. [Google Scholar]
  51. Lehmann, K.; Berger, A.; Götte, T.; Ramseyer, K.; Wiedenbeck, M. Growth related zonations in authigenic and hydrothermal quartz characterized by SIMS-, EPMA-, SEM-CL- and SEM-CC-imaging. Miner. Mag. 2009, 73, 633–644. [Google Scholar] [CrossRef]
  52. Müller, A.; Wiedenbeck, M.; Van den Kerkhof, A.M.; Kronz, A.; Simon, K. Trace elements in quartz—A combined electron microprobe, secondary ion mass spectrometry, laser-ablation ICP-MS, and cathodoluminescence study. Eur. J. Miner. 2003, 15, 747–763. [Google Scholar] [CrossRef]
  53. Miyoshi, N.; Yamaguchi, Y.; Makino, K. Successive zoning of Al and H in hydrothermal vein quartz. Am. Miner. 2005, 90, 310–315. [Google Scholar] [CrossRef]
  54. Müller, A.; Koch-Müller, M. Hydrogen speciation and trace element contents of igneous, hydrothermal and metamorphic quartz from Norway. Miner. Mag. 2009, 73, 569–584. [Google Scholar] [CrossRef]
  55. Dhamrin, M.; Saitoh, T.; Kamisako, K.; Yamada, K.; Araki, N.; Yamaga, I.; Sugimoto, H.; Tajima, M. Technology development of high-quality n-type multicrystalline silicon for next-generation ultra-thin crystalline silicon solar cells. Sol. Energ. Mat. Sol. Cells 2009, 93, 1139–1142. [Google Scholar] [CrossRef]
  56. Griscom, D.L. Self-trapped holes in pure-silica glass: A history of their discovery and characterization and an example of their critical significance to industry. J. Non-Cryst. Solids 2006, 352, 2601–2617. [Google Scholar] [CrossRef]
  57. Minami, T.; Maeda, S.; Higasa, M.; Kashima, K. In-situ observation of bubble formation at silicon melt–silica glass interface. J. Cryst. Growth 2011, 318, 196–199. [Google Scholar] [CrossRef]
  58. Dos Santos, M.F.M.; Fujiwara, E.; Schenkel, E.A.; Enzweiler, J.; Suzuki, C.K. Quartz resources in the Serra de Santa Helena formation, Brazil: A geochemical and technological study. J. S. Am. Earth Sci. 2014, 56, 328–338. [Google Scholar] [CrossRef]
  59. Dos Santos, M.F.M.; Fujiwara, E.; Schenkel, E.A.; Enzweiler, J.; Suzuki, C.K. Quartz sand resources in the Santa Maria Eterna formation, Bahia, Brazil: A geochemical and morphological study. J. S. Am. Earth Sci. 2015, 62, 176–185. [Google Scholar] [CrossRef]
  60. Götze, J. Mineralogy, geochemistry and cathodoluminescence of authigenic quartz from different sedimentary rocks. In Quartz: Deposits, Mineralogy and Analytics; Götze, J., Möckel, R., Eds.; Springer: Berlin/Heidelberg, Germany, 2012; pp. 287–306. [Google Scholar]
  61. Fruth, M.; Blankenburg, H.J. Charaketerisierung von authigenen idiomorphen Kohle-und Salinarquartzen durch Ein-schlussuntersuchungen. Neues Jahrb. Mineral. Abh. 1992, 165, 53–64. [Google Scholar]
  62. Götze, J.; Pan, Y.; Müller, A.; Kotova, E.; Cerin, D. Trace Element Compositions and Defect Structures of High-Purity Quartz from the Southern Ural Region, Russia. Minerals 2017, 7, 189. [Google Scholar] [CrossRef]
  63. Lin, M.; Pei, Z.Y.; Li, Y.B.; Liu, Y.Y.; Wei, Z.L.; Lei, S.M. Separation mechanism of lattice-bound trace elements from quartz by KCl-doping calcination and pressure leaching. Miner. Eng. 2018, 125, 42–49. [Google Scholar] [CrossRef]
  64. Dal Martello, E.; Tranell, G.; Gaal, S.; Raaness, O.S.; Tang, K.; Arnberg, L. Study of Pellets and Lumps as Raw Materials in Silicon Production from Quartz and Silicon Carbide. Metall. Mater. Trans. B 2011, 42, 939–950. [Google Scholar] [CrossRef]
  65. Belashev, B.Z.; Skamnitskaya, L.S. Irradiation methods for removal of fluid inclusion from minerals. RMZ–Mater. Geoenviron. 2009, 56, 138–147. [Google Scholar]
  66. Götze, J.; Pan, Y.; Müller, A. Mineralogy and mineral chemistry of quartz: A review. Miner. Mag. 2021, 85, 639–664. [Google Scholar] [CrossRef]
  67. Monecke, T.; Kempe, U.; Götze, J. Genetic significance of the trace element content in metamorphic and hydrothermal quartz: A reconnaissance study. Earth Planet. Sci. Lett. 2002, 202, 709–724. [Google Scholar] [CrossRef]
Figure 2. Photograph and microphotographs (TPM and BSE) of the CBG and TJS raw vein quartz. (a) Hand specimen of the CBG vein quartz sample. (b) Elongated quartz grains showing undulate extinction and sutured grain boundaries, muscovite filling micro-fractures within the CBG quartz crystals. (c) Ankerite, muscovite, and rutile included in CBG quartz. (d) Albite and sillimanite in CBG quartz fracture. (e) Apatite inclusion in CBG quartz. (f) Pyrite inclusion in CBG quartz. (g) Hand specimen of the TJS vein quartz sample. (h) Interlocked quartz crystals with irregular grain boundaries. (i) Ankerite inclusion in TJS quartz. Ank = ankerite, Ab = albite, Ap = apatite, Ms = muscovite, Py = pyrite, Sil = sillimanite, Rt = rutile.
Minerals 13 00261 g002
Figure 3. Photomicrographs (TPM) of the silicate melt and fluid inclusions in CBG and TJS raw vein quartz. (a) Silicate melt inclusions in CBG quartz. (b) Fluid inclusions composed of CO2 and H2O and array in CBG quartz. (c) No inclusions in some areas in CBG quartz. (d) Array of some fluid inclusions in TJS quartz. (e) Fluid inclusions composed of hydrocarbon and H2O in TJS quartz. (f) The colony spherical fluid inclusions in TJS quartz.
Minerals 13 00261 g003
Figure 4. Optical microphotographs (TPM) of the CBG- (a) and TJS- (b) processed quartz sand samples.
Minerals 13 00261 g004
Figure 5. X-ray diffraction patterns of the CBG- and TJS-processed quartz sand samples.
Minerals 13 00261 g005
Figure 6. Cathodoluminescence images of the CBG (a) and TJS (b) vein quartz.
Minerals 13 00261 g006
Figure 7. Nine detrimental impurity elements in CBG and TJS processed quartz sand samples along with the suggested upper content limits of high-purity quartz (HPQ, modified after Müller et al. [11]). K and Li contents in CBG sample, and Fe content in TJS sample are below the detection limit of the instrument.
Minerals 13 00261 g007
Figure 8. Al vs Ti plot of CBG and TJS vein quartz samples and refined HPQ products (modified after Müller et al. [9]). Quartz with Al < 30 µg·g−1 and Ti < 10 µg·g−1 is considered as HPQ.
Minerals 13 00261 g008
Figure 9. Logarithmic Ti versus Al plot of the CBG and TJS quartz vein deposits (modified after Rusk, [38]).
Minerals 13 00261 g009
Table 1. Impurity element contents (µg·g−1) of raw and processed vein quartz samples determined by LA-ICP-MS and ICP-OES analysis.
SampleClassificationSiO2 Content (wt.%)AlTiNaCaKLiFePBSumAnalytical Instrument
CBGspot99.971 10.7 1.9 14.0 219.1 2.3 dbl34.2 dbl4.8 286.9 LA-ICP-MS
99.953 10.8 1.5 10.2 279.2 dbldbl158.4 12.0 2.0 474.1
99.966 11.5 2.0 10.5 207.6 30.1 0.6 1.7 71.2 2.7 337.9
99.969 9.5 2.0 51.2 226.4 9.0 0.7 dbl5.4 3.3 307.5
raw 99.866 470.1 7.9 125.3 384.8 132.1 dbl212.4 5.1 5.5 1343.1 ICP-OES
processed99.994 13.1 6.6 <11.26.3 dbldbl12.9 3.3 3.3 56.8
TJSspot99.975 16.6 0.5 18.3 199.6 dbldbl0.0 6.2 4.5 245.7 LA-ICP-MS
99.973 19.6 0.6 19.9 196.5 dbl0.1 12.8 13.8 3.3 266.6
99.969 14.3 2.8 7.9 219.2 dbl0.1 41.7 23.9 3.4 313.3
99.976 11.5 1.2 9.0 214.1 1.3 0.1 dbl0.1 2.7 240.0
raw 99.980 97.4 6.4 42.3 14.3 20.2 dbl6.8 4.0 5.3 196.8 ICP-OES
processed99.991 29.4 6.1 33.1 0.9 <5.72.0 dbl3.6 4.5 85.2
HPQ standard99.995 <30.0<10.0<8.0<5.0<8.0<5.0<3.0<2.0<1.0<50.0ICP-OES
Refined HPQ powderIota STD99.998 16.2 1.3 0.9 0.5 0.6 0.9 0.2 0.1 0.1 20.8
Iota 899.999 7.0 1.2 0.0 0.5 <0.04<0.02<0.030.1 <0.089.0
Drag NC1 99.996 26.0 4.0 2.7 0.6 0.7 4.0 0.5 dbl<0.438.9
Drag NCA 99.999 7.0 4.0 0.7 0.1 0.3 0.7 0.1 dbldbl12.9
Disclaimer/Publisher’s Note: The statements, opinions and data contained in all publications are solely those of the individual author(s) and contributor(s) and not of MDPI and/or the editor(s). MDPI and/or the editor(s) disclaim responsibility for any injury to people or property resulting from any ideas, methods, instructions or products referred to in the content.

