Abstract
In this study, a three-dimensional finite difference numerical model of the Jinfeng Gold Mine, including surface topography, ore body, shafts, and main faults, was built to estimate the shaft stability and surface deformation induced by underground mining transferred from open-pit mining. Satellite monitoring data of surface displacement at several points was used to calibrate the numerical model. The sequence of excavation and filling in the simulation was determined according to the mining schemes with appropriate simplification. The distribution of large deformations in simulation is consistent with the cracking areas on the slopes and surface. Besides, shaft deformation in the simulation is small, which is consistent with the reality that there are no large deformations of shafts in the underground mining activities above 30 m level. After the completion of simulated underground mining, the deformations of shafts and surface are generally far less than the critical deformation. Hence, we concluded that the shafts and surface of the Jinfeng Gold Mine can remain stable in the underground mining stage. Overall, the method in the study provides references for the estimation of shaft stability and surface deformation in the underground mining stage of mine transfer from open pit.
1. Introduction
Many open-pit mines transfer to underground mining stage to get deeper orebodies with the depletion of shallow resources. Surface deformation, slope instability, and underground hazards, such as tunnels or shafts failure, are often induced by underground mining transferred from open-pit mining [1,2,3]. Particularly, the shaft stability and surface deformation are crucial for the safety and high efficiency of underground mining transfer from open-pit mining [4,5].
Plenty studies have been carried out on shaft stability and surface deformation induced by underground mining transferred from open-pit mining. The conventional methods include the empirical method, analytical method, physical modeling, and numerical modeling [6]. In the empirical method, researchers need to collect plenty of data from field observation and measurements and build empirical equations or graphs to analyze and predict shaft stability and surface deformation. Nonetheless, the empirical method is site-dependent, and which can only be applied to similar projects [7,8]. Most of the analytical methods are based on some simplifications and idealize the rock strata as beam or slab, which is then analyzed with certain mechanical analysis methods. However, there are only a few analytical methods due to the complexity, and simplification will lead to the inaccurate estimation of shaft stability and surface deformation, especially in the cases with complex surface topography and geological structures [9]. The physical modeling method requires to construct an isometric solid model made of gypsum or other materials, and it is difficult to simulate the three-dimensional geological body with complex surface, slopes, and geological structures, and it also costs a lot of money and time [10].
Numerical methods can comprehensively consider factors, such as surface topography, in-situ stress condition, complex geological structures, and mechanical properties of rock mass [11], and numerical methods have been developed to analyze shaft stability and surface deformation induced by underground mining transferred from open-pit mining, such as finite element method (FEM), discrete element method (DEM), boundary element method (BEM), finite difference method (FDM), and hybrid methods, etc. Reasonable properties of the numerical model are obtained by rock mechanics experiment, field investigation, rock mass classification, and simple numerical simulation, etc.
Unlu T et al. [12] obtained the geological sections from geological information system and mine information system to construct a FEM model. Comparing the prediction results of the numerical simulation model with GPS and INSAR, the model was optimized, then predicted the mining-induced subsidence with it. Sepehri et al. [13] established a full three-dimensional elastic-plastic FEM model and calibrated it with extensometers, and the result shows that the numerical model has good predictive ability for surface deformation. Huang et al. [14] built a three-dimensional DEM model with faults and interfaces to study the mechanism of surface deformation caused by excavation and backfilling. They found that the upper orebody influenced displacements in the lower orebody and constructed a subsidence profile. Bruneau. G et al. [6] studied the influence of fault and mining sequence on rock mass deformation and shaft stability using a BEM model and field investigation. The simulation results were in agreement with the recorded field observation, and the model predicted a constant rate of displacement. Xu et al. [15] employed the FDM model to predict the mining-induced surface subsidence, judged the impact of coal mining with different mining schemes on the dam body, and selected the mining scheme with the least impact. Zhao et al. [16] proposed a method to analyze the range of surface subsidence and damage caused by sublevel caving based on GPS monitoring and FDM and proposed a new conceptual model of surface subsidence and overburden deformation and failure.
Rock mass is often divided into discontinuous bodies by geological structures such as faults and joints. BEM describes model attributes and calculates with nominal values to solve engineering problems, and mainly deals with excavation without complicated geology, so it is difficult to analyze the surface deformation and shaft stability of a large-scale model [11]. Rock mass is a set of rigid or deformable blocks, spheres, or other shaped elements. Geological structures, such as joints and faults, can be clearly modeled [17] in DEM. However, for large-scale three-dimensional model of the whole mining area, DEM presents higher requirements on computing equipment. In addition, FDM and FEM can be combined with a two- or three-dimensional interface to simulate discontinuous geological bodies [18]). FDM uses an explicit solution procedure, compared with the implicit solution procedure of FEM. In FDM, matrices are never formed, and it has low requirements on equipment. In addition, FDM can realize large deformation of elements and more complex constitutive models without extra work [19].
In this paper, the study was conducted in Jinfeng Gold Mine, a large-scale underground mine transferred from open-pit. FLAC3D 6.0 was employed to analyze shafts stability and surface deformations induced by underground mining with the upward drift and cemented fill method. Based on the mechanical properties, mining sequences, and current mining status, a three-dimensional numerical model, including surface topography, ore body, shafts, and main faults, was established, and the model was calibrated with satellite monitoring data of vertical displacement at several points on the surface, to estimate the shaft stability and surface deformation induced by underground mining transfer from open-pit mining.
2. Jinfeng Gold Mine
Jinfeng Gold Mine is located in Guizhou Province, China, and it is the largest Carlin-type gold deposit in the southwest of China (Figure 1). There are four major faults crossing the mining area: F2, F3, F6, and F7 (Figure 2), and the main surrounding rocks are mudstone and sandstone. The ore body comprises three groups of ore veins and generally trends N 70° W, dips 72° NE and 70° to the east. The individual ore body has a strike length of more than 800 m and widths varying from 0.6 m to 63 m. The ore body below 30 m level trends almost NS and has an average strike length of 250 m. A small orebody near the surface is located in the northwest of the open pit, which is called RB orebody.
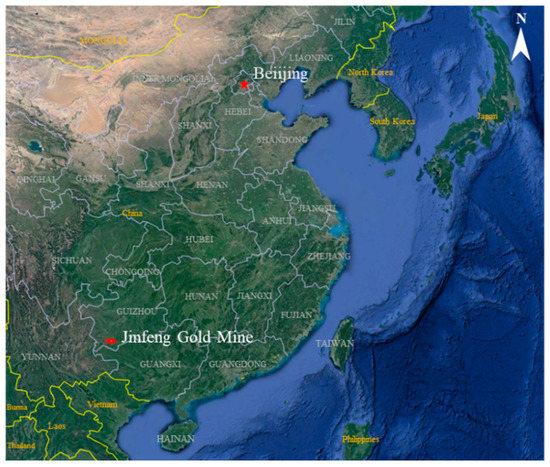
Figure 1.
Location of the Jinfeng Gold Mine.
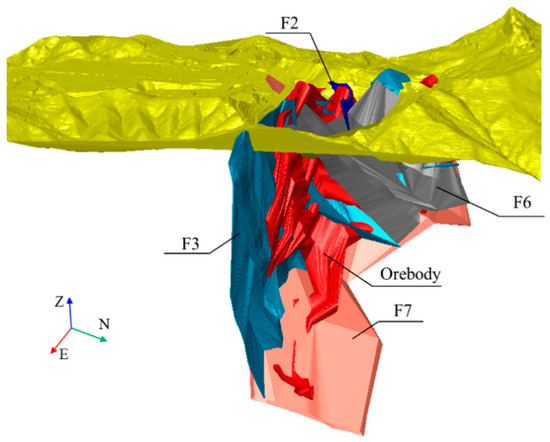
Figure 2.
Geological model of Jinfeng Gold Mine (Including faults, ore body and surface topography).
In 2009, open-pit mining operation for the ore body above 450 m level started. Open-pit mining was completed, and development of the underground mine commenced, forming an open-pit with a radius of about 300 m and a depth of about 600 m in 2015.
For the underground mining, nine levels of 490 m, 430 m, 370 m, 310 m, 250 m, 205 m, 150 m, 90 m, and 30 m are set above 30 m level. The deep orebody between 30 m and −240 m has a smaller strike length compared with the upper orebody, which will be mined in the next mining scheme (Figure 3). The intake shafts located in the center and the returned shafts are on the ends of the ore body. The shaft system consists of four groups of shafts: Df shafts, Xf shafts, Jf shafts, and Nf shafts. Each group of shafts is composed of open shaft and staple shafts. The positions of shafts are shown in Figure 4, and the information is shown in Table 1.
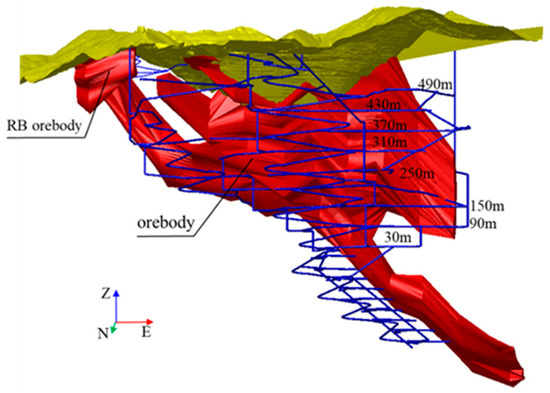
Figure 3.
Distribution of the underground development system.
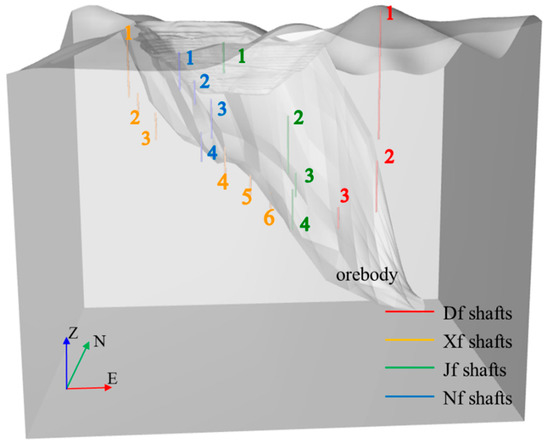
Figure 4.
Distribution of four groups of shafts.

Table 1.
Information of shafts.
Upward drift and cemented fill method was employed in the Jinfeng Gold Mine (Figure 5). The heights of mining level and sublevel are respectively 60 m and 20 m. The size of drift is 4.5 m wide and 5 m high, and alternately filled with total tailings and cemented tailings. Generally, ore body is mined downward. For a sublevel, the mining is carried out in layers upwards.
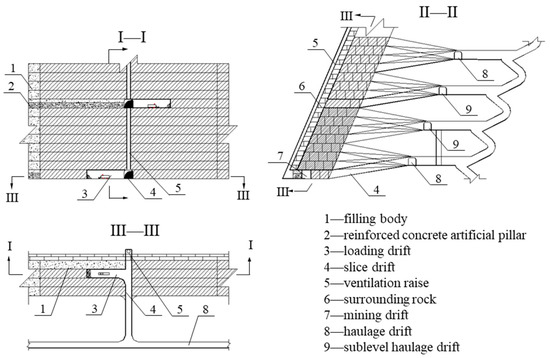
Figure 5.
Schematic of the upward drift and cemented fill method.
The underground mining has induced surface deformation and cracking (Figure 6), the road on the northwest of the open-pit is affected and cracked (area ①). There are also many cracks to the east slope of the open-pit (area ②), and the benches (area ③) to the north of the open-pit was cracked and treated by blasting to form a new slope with natural repose angle. Therefore, to ensure safe mining, further estimation of the shaft stability and surface deformation induced by underground mining transfer from open-pit mining is necessary.
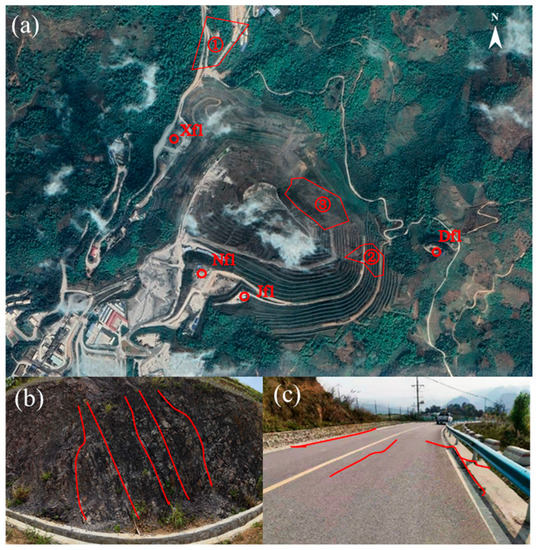
Figure 6.
Surface damage on the open-pit and road (a) Surface damage areas and shafts location; (b) Cracks on the east slope (②area); (c) Cracks on the road (① area).
3. Methods
In this paper, based on the mechanical properties, mining sequences, and current mining status in Jinfeng Gold Mine, a three-dimensional geological model, including surface topography, ore body, main faults, and shafts, was established, and FLAC3D was employed to estimate the shafts stability and surface deformation according to underground mining schemes. The excavation and filling sequence in the model was determined according to the mining schemes with appropriate simplification. The numerical model was calibrated with satellite monitoring data of vertical displacement at certain positions on the surface. The schematic diagram is shown in Figure 7. Horizontal and vertical strains, inclination, curvature of shafts, and horizontal and vertical strains of surface were extracted to obtain the deformations of shafts and surface in the underground mining schemes, and estimated shaft stability and surface deformation under the effect of underground mining activities. The calculation of various deformations is shown in Figure 8 and Equations (1)–(4).
where i is inclination; c is curvature; εv is vertical strain; εh is horizontal strain; H is horizontal displacement; V is vertical displacement; L is horizontal or vertical distance; ΔH is horizontal displacement difference; Δi is inclination difference; ΔV is vertical displacement difference.
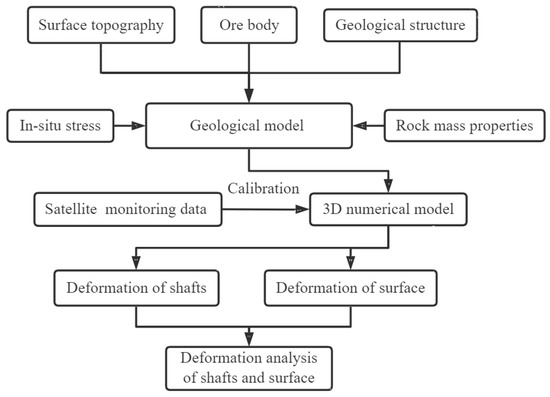
Figure 7.
Flowchart of the method to analysis shafts and surface.
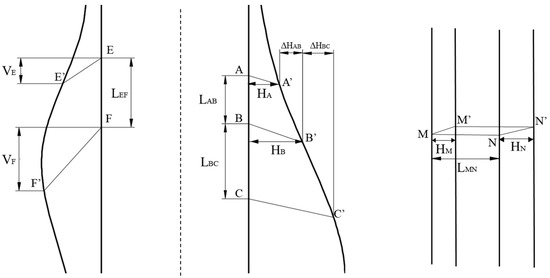
Figure 8.
Schematic diagram of deformation calculation (A, B, C, E, F, M, N is the initial position of the point, and A’, B’, C’, E’, F’, M’, N’ is the position after deformation).
4. Numerical Simulation of Shafts Stability and Surface Deformations
4.1. Numerical Model Setup
To estimate the shaft stability and surface deformation induced by underground mining transferred from open-pit mining precisely, the model scope is appropriately expanded from the mining area to reduce the influence of boundary effect. Finer meshing was assigned to the research domain where the shafts, faults, surface, and orebody are located. Finally, a three-dimensional numerical model was established with a length of 1700 m (WE), a width of 1350 m (NS), and an average height of 1000 m, including a total of 3.6 million zones and 2 million nodes. The three-dimensional model is shown in Figure 9.
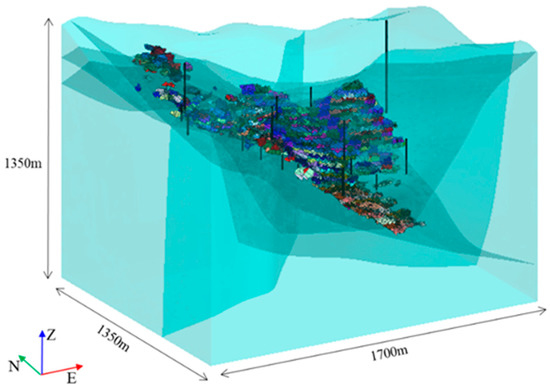
Figure 9.
Three-dimensional numerical model in FLAC3D.
4.2. Constitutive Model and Boundary Condition
The Mohr–Coulomb criterion is adopted as the constitutive model of rock mass and ore body, which is consistent with the properties of geotechnical material as the failure envelope corresponds to the Mohr–Coulomb criterion (shear yield function) and tension cutoff (tension yield function).
The X-direction (WE) horizontal displacement restrain is applied to the X-direction boundaries, the Y-direction (NS) horizontal displacement restrain is applied to the Y-direction boundaries, and the displacements in all directions are restrained to the bottom of the model.
According to the in-situ stress measurement result obtained by the hollow inclusion stress-relief method provided by the Jinfeng Gold Mine, the gravity stress is considered as the vertical stress. Moreover, the maximum and minimum horizontal principal stresses vary with depth, and the direction of the maximum horizontal principal stress is NE. The equations of the vertical stress (σv), maximum horizontal principal stress (σhmax), and minimum horizontal principal stresses (σhmin) are presented as follows:
4.3. Mining Sequences
In the underground mining procedure, there are thousands of mining drifts, and adjacent drifts are alternately filled with total tailings and cemented tailings. The directions of mining drifts alter with the morphology of ore body. On the condition that the simulation is carried out according to the practical mining schemes completely, it will greatly increase the complicacy of modeling and calculation. Therefore, it is necessary to simplify the sequence of excavation and filling in the model.
The main ore body trends almost WE, and the strike direction of deeper ore body (under the 30 m level) is nearly NS. Hence, the ore body is divided into stopes of 50 m long, 20 m high and a width of the thickness of the ore body. The simplification increases the size of the stopes, and it is bound to increase the disturbance and deformation of rock mass. Therefore, the filling of stopes is carried out immediately after the excavation, and the properties of the fillings are set as the properties of the cemented tailings, so as to balance the influence of simplification.
To calculate the initial state of stress efficiently, elastic constitutive parameters were assigned to the model, and higher mechanical parameters are set for the zones and faults. After the initial stress field is obtained, the plastic zones, displacement, and velocity of joints are cleared.
In the model, the heights of mining level and sublevel are respectively 60 m and 20 m. In general, the underground mining is divided into four parts. In the first part, ore bodies above 205 m were extracted. Ore bodies between 205 m and 30 m were extracted in the second part. In the next part, the western RB ore body near the surface was excavated. A deep ore body from 30 m to −250 m level was finally extracted. The mining of each part is carried out successively, and one step was delayed from bottom to top in levels of the same part. The excavated stopes in the same level were triangle distributed, and exploitation was carried out from the middle to both sides of the ore body. The simulated underground mining procedure was divided into 50 steps, with a total of 350 stopes. The distribution and excavation sequence of stopes are shown in Figure 10 and Figure 11.
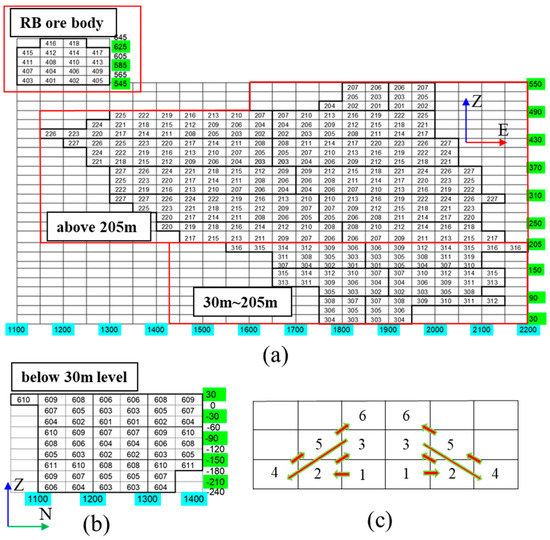
Figure 10.
Stopes distribution and mining sequence in the same level (a) Stopes distribution above 30 m levels; (b) Stopes distribution blow 30 m levels; (c) Mining sequence in the same level.
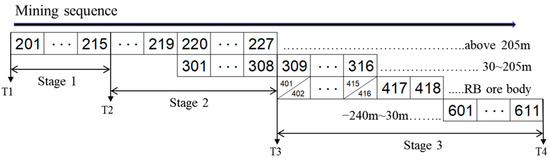
Figure 11.
Underground mining sequence.
4.4. Model Calibration
We obtained the satellite monitoring data of several positions on the surface from the beginning of 2019 to November 2021, and calculated the vertical displacement monthly in the process.
These positions are the bottom of the open-pit, surface points near the Df1, Xf1 and Jf1, as shown in Figure 12a. The vertical displacement of each position is an average of multiple points’ displacement near them in order to reduce the chance of a special value in both simulation and monitoring. The properties of the rock mass and faults were calibrated by comparing the monitoring displacement with the simulation results of the corresponding process in the model. Mechanical parameters after multiple calibrations are shown in Table 2.
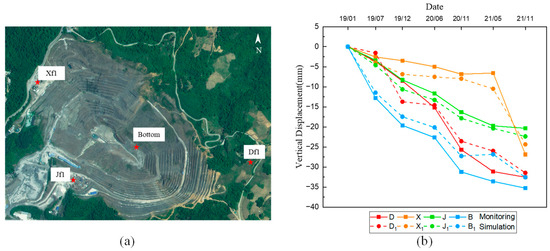
Figure 12.
Monitoring positions and comparison of vertical displacements between monitoring and simulation after calibrations (a) Monitoring positions; (b) Comparison between monitoring and simulation.
Table 2.
Mechanical properties after calibration.
The comparison of vertical displacements between monitoring and simulation after calibrations is shown in Figure 12b (D, X, J, and B represent monitoring data of Df1, Xf1, Jf1, and bottom of the pit). Comparing the vertical displacement of positions in the process, it is obvious that the monitoring data are generally consistent with the numerical simulation results, and the numerical simulation results are reliable.
5. Numerical Results
The simulation of excavation and filling is roughly divided into three stages according to the number of stopes. Displacements of four moments at the beginning and end of the stages are taken to analyze the shafts and surface deformations. Stages and moments are shown in Figure 11. T1 is the moment before excavation and filling, and T4 is the moment that the excavation and filling of the whole ore body are completed.
5.1. Spatial and Temporal Distribution of Df Shafts Deformation
The Df shafts’ horizontal strains at four moments during the simulation is shown in Figure 13a. Horizontal strains of the upper two shafts (Df1 and Df2) gradually raises with the increase of depth (decrease of altitude), and the horizontal strains of the lowest shaft (Df3) are smaller. The main reason for this is that the Df1 is located at the hanging wall though far away from the ore body, and Df2 is located at the end of the ore body but close to it, so they are affected by the underground mining activity. Besides, Df3 is short and located oblique below the ore body, so it is much less affected.
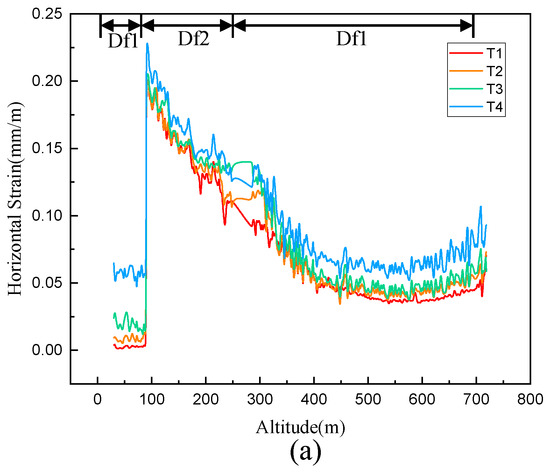
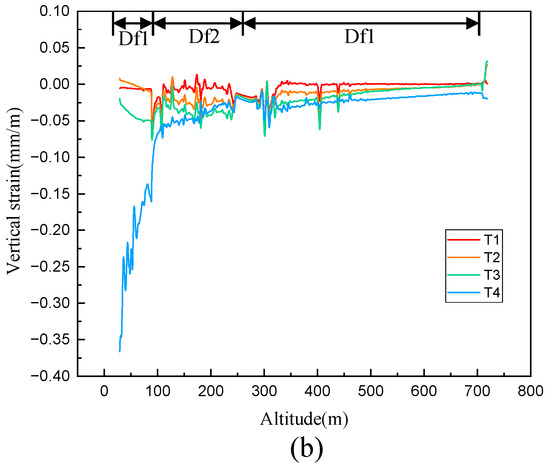
Figure 13.
Horizontal and vertical strains of Df shafts (a) Horizontal strain of the Df shafts; (b) Vertical strain of the Df shafts.
In addition, considering the variation of Df shafts’ horizontal strains with time, the strains mainly occur during the excavation of the shafts (before T1). The mining activities have less impact on the horizontal strains, and the average horizontal strains increase by about 0.025 × 10⁻³. Besides, the maximum value of Df shafts’ horizontal strains is approximately 0.2 × 10⁻³ at the bottom of Df2, which is far less than the critical strain specified in the code for design of metal mine in China [20], 2.0 × 10⁻³. The critical strain of shafts specified in the code for design of metal mine in China is shown in the Table 3.
Table 3.
Critical strain of shafts specified in the code for design of metal mine in China.
The vertical strains of Df shafts are shown in Figure 13b. Generally, the vertical strains rise with the increase of depth, and the vertical strains at the same depth increase with the mining proceeding. The variation of vertical strains with time and depth is basically the same as that of horizontal strains. The difference is that vertical strains mainly occur in the mining stage, while the horizontal strains mainly occur in the shaft excavation stage. The maximum vertical strain of Df shafts occurs at the bottom of Df3 shaft after the excavation and filling of the whole ore body. The maximum vertical strain is about 0.37 × 10⁻³, and it is also far less than the critical strain of 2 × 10⁻³ [20].
Inclination of the Df shafts is shown in Figure 14a. Overall, the inclinations of the Df1, Df2 and Df3 are respectively negative, fluctuate in a small range around 0, and positive, which means that the shafts incline towards the ore body (open pit), at the different locations. Moreover, the inclination of Df shafts increases with the process of the mining. Inclination of Df shafts is small when the excavation of shaft is completed (T1), and mainly occurs in the mining stage. The maximum inclination of Df shafts occurs at the bottom of Df3 after the excavation and filling of the whole ore body, 0.15 × 10⁻³. The critical value of shaft inclination is 3 × 10⁻³, and the inclination of Df shafts is far less than the critical strain.
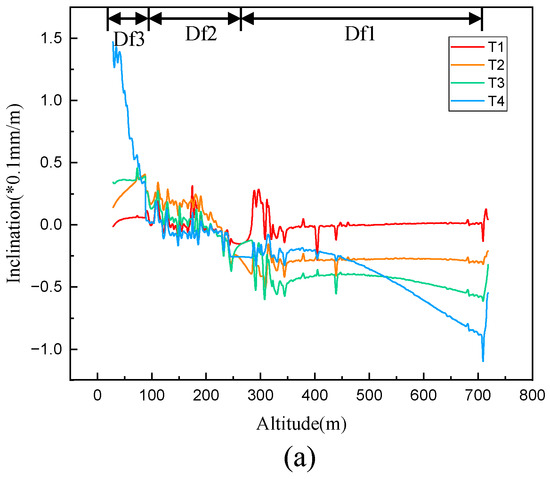
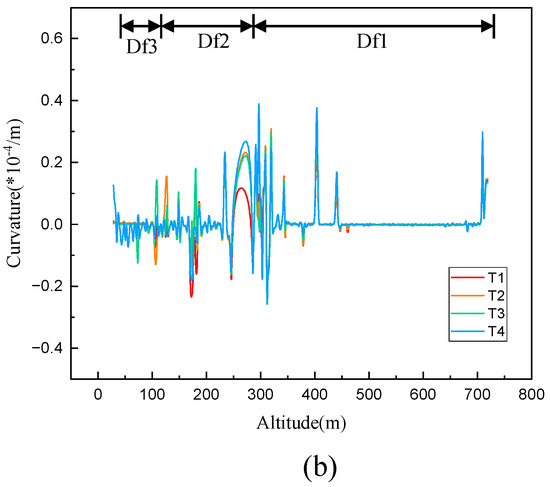
Figure 14.
Inclination and curvature of Df shafts (a) Inclination of the Df shafts; (b) Curvature of the Df shafts.
Figure 14b shows the Df shafts’ curvatures, the variations of curvature of the Df2 and Df3 are more obvious than that of the Df1. Curvature increases with the mining activities proceeding, but remains less than 0.6 × 10⁻⁴/m, which is far less than the critical strain of 2 × 10⁻⁴/m.
To avoid lengthy content, various deformations of the other three groups of shafts will not be described in this paper. The deformations of the four groups of shafts in the whole simulation process can be described as follows:
- (1)
- Horizontal strains mainly occur in the shaft excavation stage, and the horizontal strains of shafts generated in the mining stage are about one third of the maximum value generated in the whole simulation process.
- (2)
- Vertical strains, inclination, and curvature mainly occur in the mining stage and increase with the mining exceeding.
- (3)
- The extreme values of horizontal strain, vertical strain, and inclination in the four groups of shafts basically appear at the deepest part after the completion of the whole simulation process. Due to the small disturbance of the upward drift and cemented fill method applied to the surrounding rock, the deformations are much less than the critical values specified in the code for the design of metal mines in China.
5.2. Final Deformations of Shafts
The final horizontal strains of the four groups of shafts are shown in Figure 15a. Generally, the horizontal strains of shafts rise with the depth increasing. In particular, Df3, the lowest section of Df shafts, has lower horizontal strains due to it is short and located oblique below the ore body. Four lower shafts of the Xf shafts (Xf3, Xf4, Xf5 and Xf6) and the Nf4 are closer to the ore body and located at the footwall, so in a certain shaft above, with the depth rises, farther away from the ore body, the horizontal strains decrease. Jf1 is close to the open-pit slope (less than 20 m at the nearest position), where the shaft is closer to the surface, and the horizontal strains show an increasing trend. In general, the final horizontal strain of the four groups of shafts is less than 0.5 × 10⁻³.
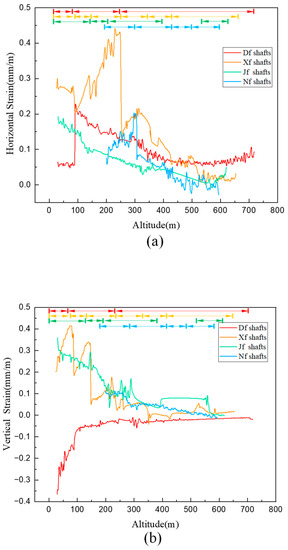
Figure 15.
Final horizontal and vertical strains of four group of shafts (The altitude lower, the depth rises, and the shafts are numbered from the surface) (a) Horizontal strain of the shafts; (b) Vertical strain of the shafts.
Figure 15b shows the final vertical strains of four groups of shafts. The vertical strains increase as the depth rises. The vertical strains’ variations of Xf3, Xf4, Xf5, and Xf6 are the same as their horizontal strains in that the strains decrease with increasing depth. The maximum vertical strain of the four group of shafts during the simulation process is less than 0.4 × 10⁻³.
Figure 16a shows the final inclinations of shafts. Inclinations of Df1 and Df2 are respectively negative and fluctuate in a small range around 0. Df3 and the other three groups of shaft inclinations are positive, which means that the shafts incline towards the ore body (open-pit), at the different locations. As certain shafts are close to the ore body and located at the footwall, the inclinations decrease as closer to the bottoms, such as Xf4, Xf5, Jf4, Nf3, and N4. The maximum inclination is 0.4 × 10⁻³.
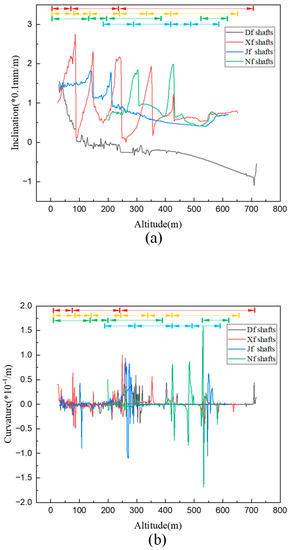
Figure 16.
Final inclination and curvature of four group of shafts (a) Inclination of the shafts; (b) Curvature of the shafts.
Figure 16b shows the curvatures of shafts. The curvatures of Df2 and Df3 are larger and more variable than Df1. The Xf shafts and Jf shafts also have larger curvatures at the end of each shaft, and the Nf shafts have large curvatures at the ends and in the middle of individual shafts. In general, the curvatures of the four groups of shafts are small, and there are only relatively large values at some points, which is no more than 2 × 10⁻⁴/m.
5.3. Final Deformation along a Line on the Surface
Take points continuously on the line y = 1250 on the surface as shown in Figure 17a, and then calculate the horizontal and vertical strains, as shown in Figure 17c,d. Here, x < 1600 is in the west, located at the footwall of the ore body, and x > 1600 is in the east, located at the hanging wall. The maximum strains appear at the bottom of the pit and increase with the mining procedure. Finally, the maximum horizontal strain at the bottom of the open-pit is approximately –0.18 × 10⁻³, and the maximum vertical strain is –0.48 × 10⁻³.
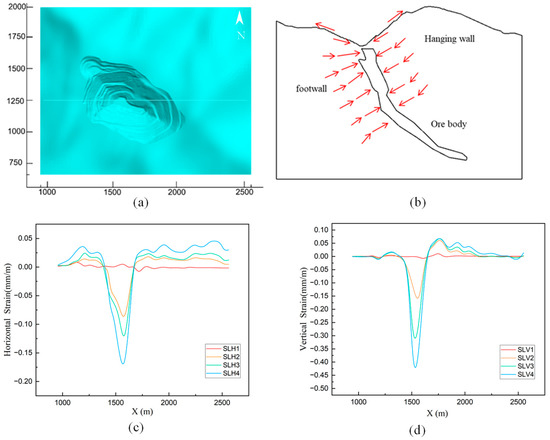
Figure 17.
Deformations along y=1250 on the surface (a) Position of the line where we take the deformation; (b) Pattern of rock mass movement; (c) Horizontal strain along the line; (d) Vertical strain along the line.
In addition, it should be noted that the deformation at the open-pit bottom is negative. The deformations of slope and surface are positive, and the deformation of the hanging wall is larger and more widely distributed than that of the footwall, which means that tensile deformations occur on the slope and surface, compression deformations occur at the bottom of the open-pit, and the tensile strain of the hanging wall is larger than that of the footwall. The reason for this is that fillings replace the ore after the underground mining activities, and the constraint on the surrounding rock is reduced. The surrounding rock moves towards the ore body to form a compression area at the bottom of the open-pit, resulting in tensile strain at the slope and the ground surface (Figure 17b).
5.4. Analysis of Surface Deformation
Extract the data of surface points at the four moments and calculate the horizontal and vertical strains. Then, interpolate with the inverse distance weighted (IDW) method to obtain the distribution of the horizontal and vertical strains of surface, as shown in Figure 18 and Figure 19. The area of relatively large deformations is gradually expanded with the exceeding mining activities. Larger deformations at the first three moments mainly occur at the bottom, and in the north and south slope, then occur in the northwest out of the open pit at the last moment, corresponding to the mining of the RB orebody.
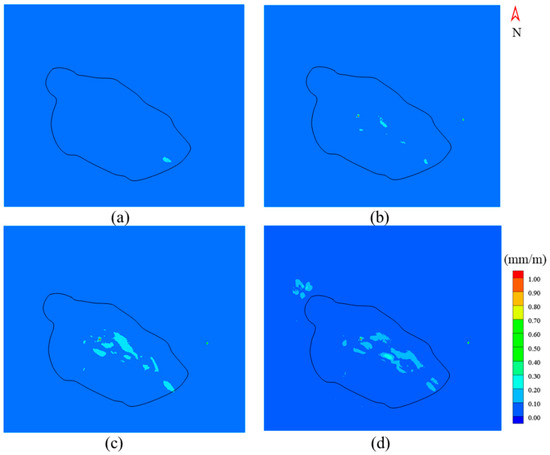
Figure 18.
Surface horizontal strain (a) moment 1; (b) moment 2; (c) moment 3; (d) moment 4.
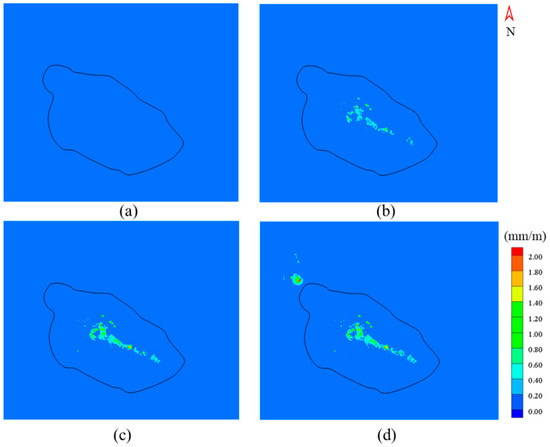
Figure 19.
Surface vertical strain (a) moment 1; (b) moment 2; (c) moment 3; (d) moment 4.
Finally, the strains are mainly distributed in 0~0.25 × 10⁻³. Only at the bottom of the open-pit, on the north and east slopes and on the northwest out of the open-pit, there are large strains, and they are lower than 0.5 × 10⁻³. According to the critical strain of 2 × 10⁻³, it can be judged that there will be no large movements of the surface. The distribution and variation of the horizontal and vertical strains are related to mining location and mining sequence. When the ore body above 30 m is mined, the bottom and north slopes of the open-pit are affected. At the end of the underground mining stage, the ore body below 30 m and RB orebody are extracted, large deformations occurred on the northwest out of the open-pit, and the relative large deformations areas at the bottom, north, and east slope of the open-pit developed further.
The second chapter explains how crack occurred in the north and east slopes and the pavement located in the northwest out of the open-pit, which is well consistent with the distribution area of higher surface deformation in the simulation results. The overall deformations of the numerical simulation are small, which is consistent with the actual deformation of the mine. Underground mining is applied to the deep orebody below 30 m level, and the ore body is relatively small and far from the surface compared with upper orebody. Therefore, it can be judged that the ground crack will not expand and develop further.
6. Conclusions
This paper proposed a method to study the shaft stability and surface deformations induced by underground mining transfer from open-pit mining. The study was conducted in Jinfeng Gold Mine. A three-dimensional finite difference numerical model, including surface topography, ore body, main faults, and shafts, is established. Satellite monitoring data of surface displacement at several points are used to calibrate the model.
The distribution areas of relatively large deformation in numerical simulation are consistent with the cracking areas on the slopes and surface. Shaft deformations in the simulation are small, which is consistent with the reality that there is no large deformation of shafts in the underground mining activities.
After the completion of simulated underground mining, the deformations of shafts are much lower than the critical values specified in the code for the design of metal mines in China, and the surface deformations are small, mainly distributed in 0~0.25 × 10⁻³. Only at the bottom, on the north and east slopes, and in the northwest out of the open-pit, are there relatively large deformations, which are far less than the critical value, 2 × 10⁻³. Hence, it is concluded that the shafts and surface of the Jinfeng Gold Mine can remain stable in the underground mining stage.
However, the simplification of the excavation and filling sequence in the method has a certain influence on the simulation results. Moreover, due to the limitation of the research content, this method only analyzed the deformations of the surface and shafts. In the future, more comprehensive shaft stability and surface deformation analysis can be carried out in combination with the consideration of the plastic zone and stress concentration of the model.
Overall, the method in this paper can provide references for the analysis of shaft stability and surface deformation in the underground mining stage of mines transferred from open-pit.
Author Contributions
All authors contributed to the study conception and design. Material preparation, data collection and analysis were performed by S.F., W.Y. and Y.Z. The first draft of the manuscript was written by X.Z. and W.Y. All authors commented on previous versions of the manuscript. All authors have read and agreed to the published version of the manuscript.
Funding
This work was supported by a project of the Key projects of National Natural Science Foundation of China (52130403) and the Fundamental Research Funds for the Central Universities (N2001033 and N2101022). Author Xingdong Zhao has received research support from Guizhou Jinfeng Mining Limited.
Data Availability Statement
The raw data required to reproduce these findings cannot be shared at this time as the data also forms part of an ongoing study.
Acknowledgments
This work was supported by China Academy of Safety Science and Technology and Guizhou Jinfeng Mining Limited.
Conflicts of Interest
Competing Interests The authors have no relevant financial or non-financial interests to disclose.
References
- Parmar, H.; Yarahmadi Bafghi, A.; Najafi, M. Impact of ground surface subsidence due to underground mining on surface infrastructure: The case of the Anomaly No. 12. Sechahun Iran. Environ. Earth Sci. 2019, 78, 1–14. [Google Scholar] [CrossRef]
- Li, X.S.; Yang, S.; Wang, Y.M.; Nie, W.; Liu, Z.F. Macro-micro response characteristics of surrounding rock and overlying strata towards the transition from open-pit to underground mining. Geofluids 2021, 2021, 1–18. [Google Scholar] [CrossRef]
- Zhao, Y.; Yang, T.; Bohnhoff, M.; Zhang, P.; Yu, Q.; Zhou, J.; Liu, F. Study of the rock mass failure process and mechanisms during the transformation from open-pit to underground mining based on microseismic monitoring. Rock Mech. Rock Eng. 2018, 51, 1473–1493. [Google Scholar] [CrossRef]
- Ma, F.; Zhao, H.; Zhang, Y.; Guo, J.; Wei, A.; Wu, Z.; Zhang, Y. GPS monitoring and analysis of ground movement and deformation induced by transition from open-pit to underground mining. J. Rock Mech. Geotech. Eng. 2012, 4, 82–87. [Google Scholar] [CrossRef]
- Zhang, D.-b.; Zhang, Y.; Cheng, T.; Meng, Y.; Fang, K.; Garg, A.; Garg, A. Measurement of displacement for open pit to underground mining transition using digital photogrammetry. Measurement 2017, 109, 187–199. [Google Scholar] [CrossRef]
- Bruneau, G.; Hudyma, M.; Hadjigeorgiou, J.; Potvin, Y. Influence of faulting on a mine shaft—a case study: Part II—numerical modelling. Int. J. Rock Mech. Min. Sci. 2003, 40, 113–125. [Google Scholar] [CrossRef]
- Saeidi, A.; Deck, O.; Verdel, T. Development of building vulnerability functions in subsidence regions from empirical methods. Eng. Struct. 2009, 31, 2275–2286. [Google Scholar] [CrossRef]
- Marino, G.; Osouli, A.; Elgendy, M.; Karimpour, M. Utilization of Historical Subsidence Data for Prediction of Adverse Subsidence Conditions over Trona Mine. Int. J. Geomech. 2017, 17, 04016061. [Google Scholar] [CrossRef]
- Yang, G.; Leung, A.K.; Xu, N.; Zhang, K.; Gao, K. Three-dimensional physical and numerical modelling of fracturing and deformation behaviour of mining-induced rock slopes. Appl. Sci. 2019, 9, 1360. [Google Scholar] [CrossRef]
- Sartkaew, S.; Khamrat, S.; Fuenkajorn, K. Physical model simulation of surface subsidence under sub-critical condition. Int. J. Phys. Model. Geotech. 2019, 19, 234–246. [Google Scholar] [CrossRef]
- Hamdi, P.; Stead, D.; Elmo, D.; Töyrä, J. Use of an integrated finite/discrete element method-discrete fracture network approach to characterize surface subsidence associated with sub-level caving. Int. J. Rock Mech. Min. Sci. 2018, 103, 55–67. [Google Scholar] [CrossRef]
- Unlu, T.; Akcin, H.; Yilmaz, O. An integrated approach for the prediction of subsidence for coal mining basins. Eng. Geol. 2013, 166, 186–203. [Google Scholar] [CrossRef]
- Sepehri, M.; Apel, D.B.; Hall, R.A. Prediction of mining-induced surface subsidence and ground movements at a Canadian diamond mine using an elastoplastic finite element model. Int. J. Rock Mech. Min. Sci. 2017, 100, 73–82. [Google Scholar] [CrossRef]
- Huang, G.; Kulatilake, P.H.S.W.; Shreedharan, S.; Cai, S.; Song, H. 3-D discontinuum numerical modeling of subsidence incorporating ore extraction and backfilling operations in an underground iron mine in China. Int. J. Min. Sci. Technol. 2017, 27, 191–201. [Google Scholar] [CrossRef]
- Xu, N.; Kulatilake, P.H.; Tian, H.; Wu, X.; Nan, Y.; Wei, T. Surface subsidence prediction for the WUTONG mine using a 3-D finite difference method. Comput. Geotech. 2013, 48, 134–145. [Google Scholar] [CrossRef]
- Zhao, X.; Zhu, Q. Analysis of the surface subsidence induced by sublevel caving based on GPS monitoring and numerical simulation. Nat. Hazards 2020, 103, 3063–3083. [Google Scholar] [CrossRef]
- Cheng, G.; Chen, C.; Li, L.; Zhu, W.; Yang, T.; Dai, F.; Ren, B. Numerical modelling of strata movement at footwall induced by underground mining. Int. J. Rock Mech. Min. Sci. 2018, 108, 142–156. [Google Scholar] [CrossRef]
- Vyazmensky, A.; Stead, D.; Elmo, D.; Moss, A. Numerical analysis of block caving-induced instability in large open pit slopes: A finite element/discrete element approach. Rock Mech. Rock Eng. 2010, 43, 21–39. [Google Scholar] [CrossRef]
- Table, UCIST Shake. FLAC3D User’s Manual; Quanser Consulting Inc.: Markham, ON, Canada, 1997; pp. 38–42. [Google Scholar]
- GB50830; The Code for Design of Metal Mine. China Metallurgical Construction Association. China Planning Press: Beijing, China, 2013; pp. 68–72.


Disclaimer/Publisher’s Note: The statements, opinions and data contained in all publications are solely those of the individual author(s) and contributor(s) and not of MDPI and/or the editor(s). MDPI and/or the editor(s) disclaim responsibility for any injury to people or property resulting from any ideas, methods, instructions or products referred to in the content. |
© 2023 by the authors. Licensee MDPI, Basel, Switzerland. This article is an open access article distributed under the terms and conditions of the Creative Commons Attribution (CC BY) license (https://creativecommons.org/licenses/by/4.0/).