Article

Study on the Provenance and Tectonic Setting of Mudstone in the Lower Silurian Longmaxi Formation of the Yanyuan Basin on the Western Margin of the Yangtze Platform

1
Chengdu Geological Survey Center, China Geological Survey, Chengdu 610081, China
2
Key Laboratory of Sedimentary Basin and Oil & Gas Resources, Ministry of Natural Resources, Chengdu 610081, China
*
Authors to whom correspondence should be addressed.
Minerals 2023, 13(2), 194; https://doi.org/10.3390/min13020194
Submission received: 25 November 2022 / Revised: 19 January 2023 / Accepted: 28 January 2023 / Published: 29 January 2023

Abstract

:
This study investigates the provenance and tectonic background of the lower Silurian Longmaxi Formation black shale of the Yanyuan Basin in the western Kangdian ancient land and provides guidance for shale gas exploration and development in the area. The mineral petrological and geochemical characteristics of the Longmaxi Formation black shale in this area have been studied in detail. The study area is mainly a passive continental margin environment, but also has the attributes of an active continental margin and island arc environment due to the collision between the western oceanic crust and the Yangtze continental crust. The source rocks are mainly felsic igneous rocks, with a small contribution of intermediate–basic rocks. It is inferred that the Kangdian ancient land in the eastern part of the area could be the main provenance area, but with the contribution of sediments derived from oceanic island arc located in the west. During the whole Longmaxi period, the tectonic movement was intense, the climate was cold, the degree of chemical weathering was low, and it was a highly volatile geological sedimentary basin. Therefore, the highly siliceous organic-rich mudstone, which was different from the Sichuan Basin, was deposited.

1. Introduction

For the past few years, with the vigorous development of unconventional oil and gas in China, shale gas exploration and development of the Longmaxi Formation at the lower Paleozoic boundary of the Sichuan Basin has achieved remarkable results [1,2,3]. To further explore the shale gas resource potential of the Longmaxi Fm, geological surveys and evaluations of shale gas in complex tectonic areas outside the Sichuan Basin have become imperative, including the Yanyuan Basin on the west side of the Kangdian ancient land. The Yanyuan Basin is similar to the Sichuan Basin, which is located on the eastern side of the ancient land, where the organic-rich black shale of deep-water shelf facies of the Longmaxi Fm was deposited [4]. However, the tectonics and fractures of the Yanyuan Basin are more complex and developed. Its sedimentary tectonic background and source rock attributes are also obviously different from those of the Sichuan Basin. Many scholars have carried out much research on the Longmaxi Fm mudstone in the Sichuan Basin and have studied in detail the porosity, permeability, petrophysical properties, sedimentary environment, paleontology, geophysical characteristics, and other contents closely related to exploration and development [2,3,4]. However, the amount of existing research on the Longmaxi Fm in the Yanyuan Basin is relatively low, and only a few scholars have performed relevant research on the lithological characteristics, sedimentary environment, and siliceous genesis [5,6]. At present, there are relatively few studies on basic geological research, such as the structural background and source rock attributes [5,6]. Therefore, this paper mainly studies and analyzes the mineralogy, petrology, and sedimentary geochemical characteristics of the Longmaxi Fm in the Yanyuan Basin to reveal its provenance characteristics and tectonic background, which is of great importance for an in-depth understanding and evaluation of the shale gas exploration potential in the basin.

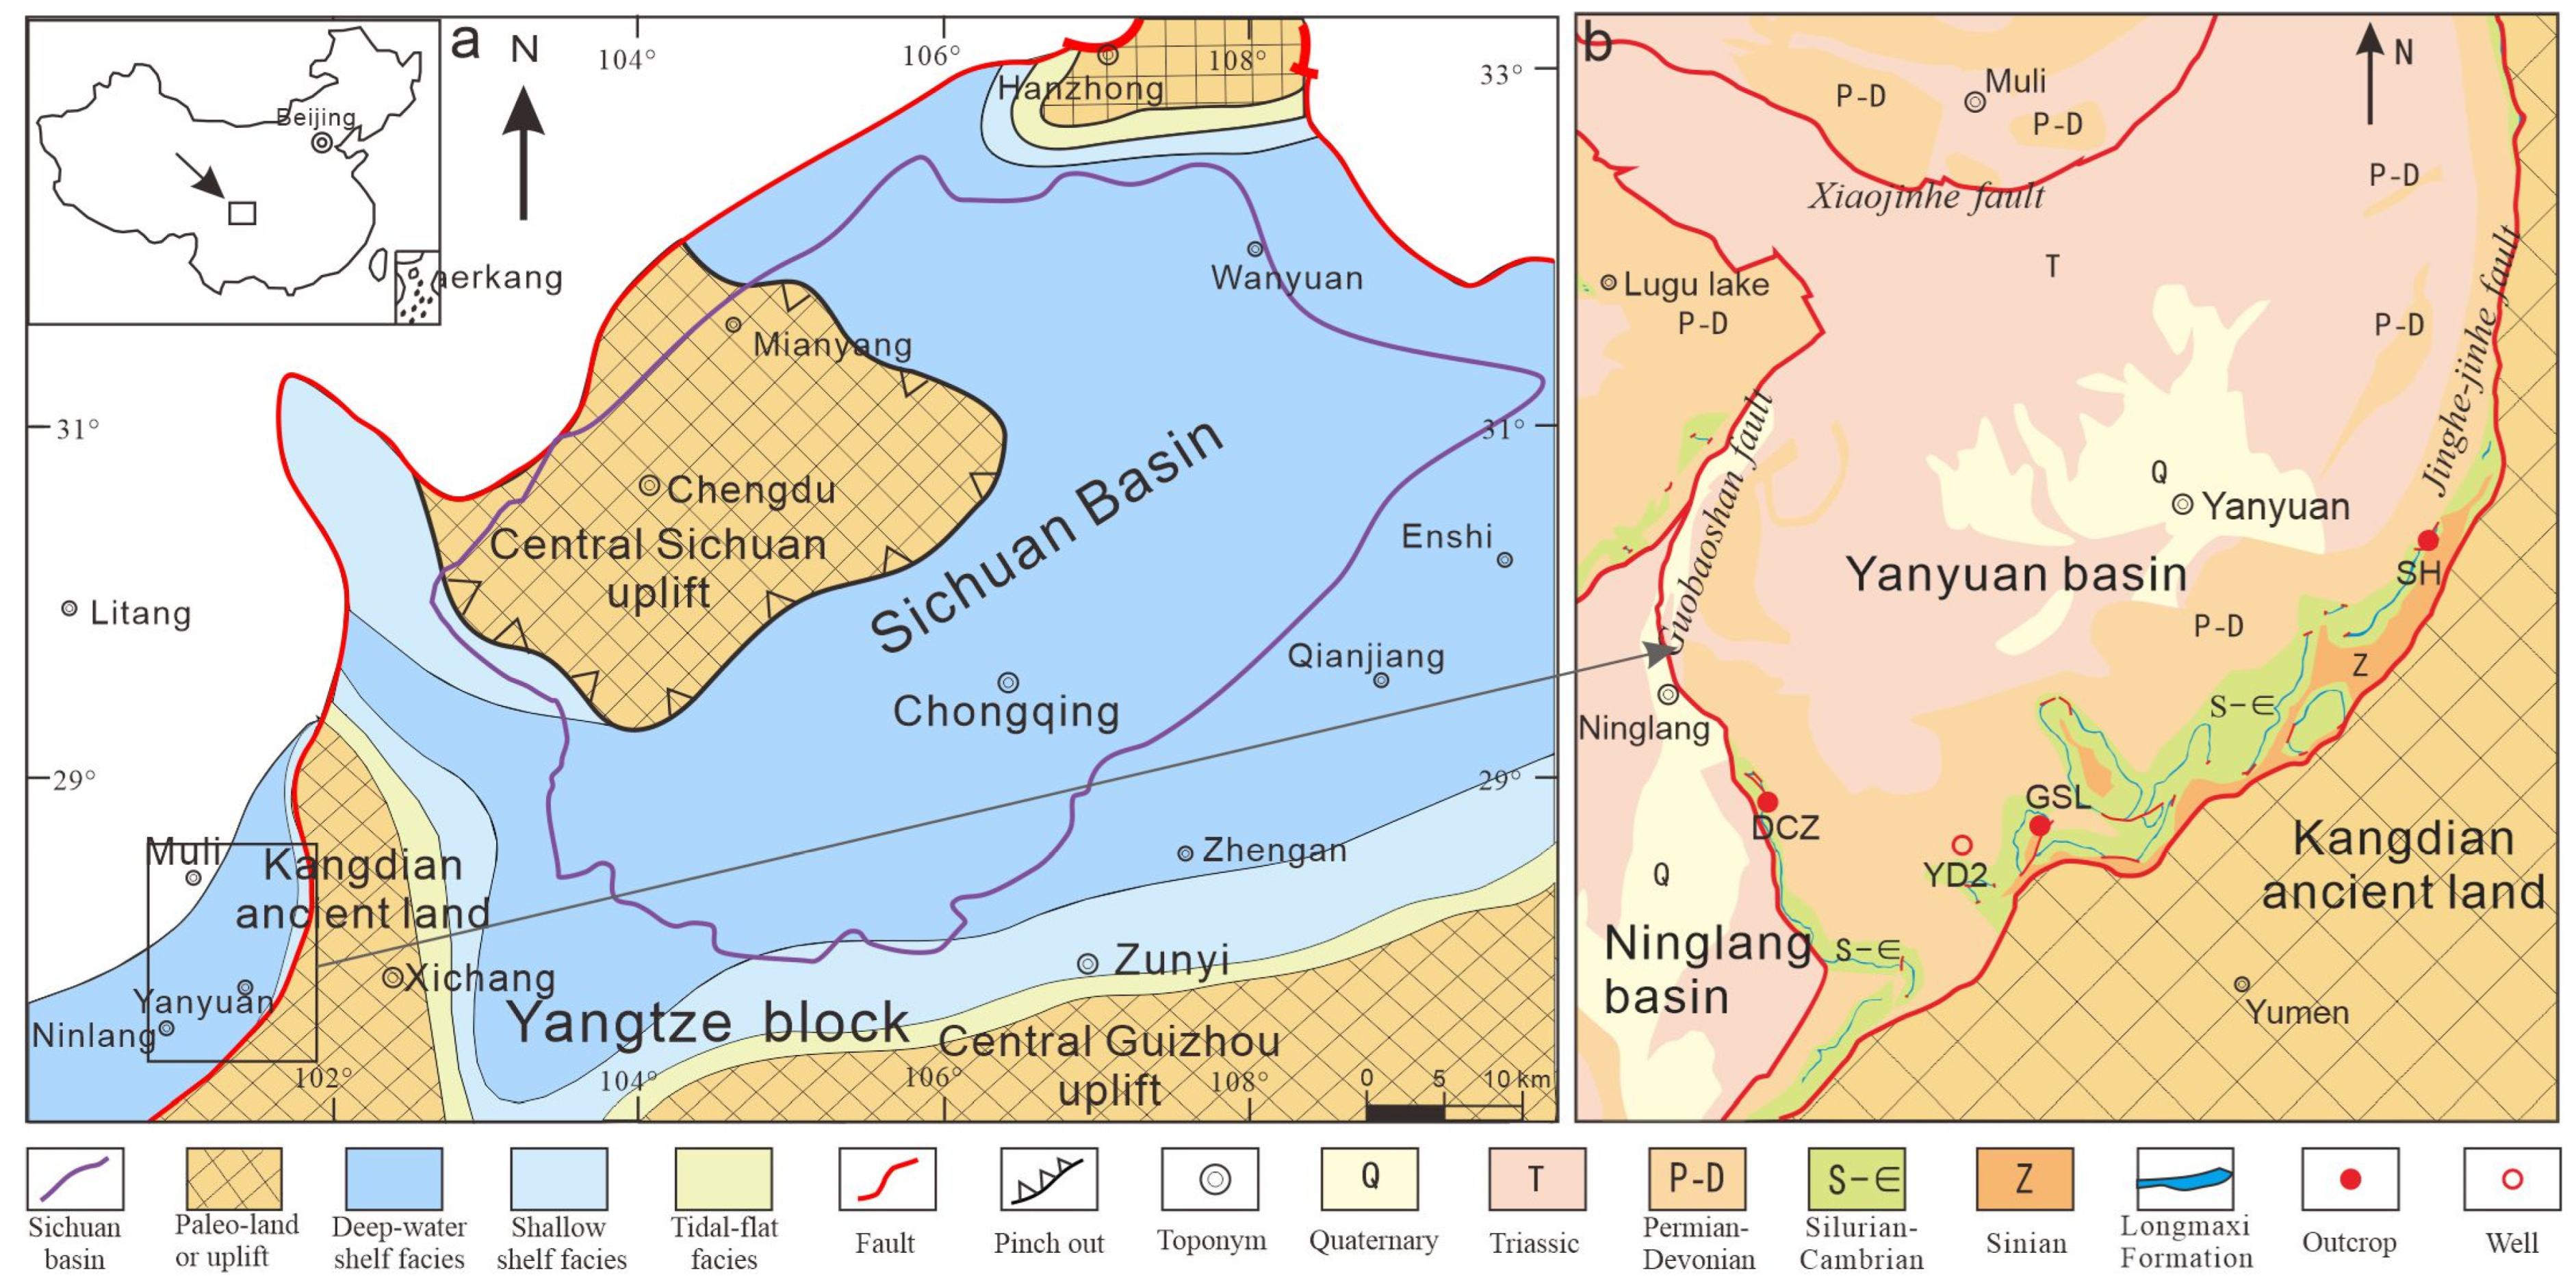
2. Geological Setting

The Yanyuan Basin is located on the western edge of the Middle and Upper Yangtze at the junction of Sichuan and Yunnan (Figure 1a). In the east, it is bounded by the Jinghe–Jinghe fault and is adjacent to the north–south Kangdian ancient land. In the northwest, it is bounded by the Xiaojinhe and Guobaoshan–Yanfeng faults and is adjacent to the nearly north-south Sanjiang multi-island arc orogenic system [6,7] (Figure 1a,b). Tectonically, the basin is mainly located in the nappe thrust belt in central Yunnan, which is the junction of the Songpan Ganzi Indosinian fold system and the western margin of the Yangtze platform [8,9]. Sinian Quaternary strata are exposed in the basin, and Jurassic and Cretaceous systems are absent. The Paleozoic strata are mainly exposed along the southeast edge of the area. The Lower Silurian Longmaxi Fm is in parallel unconformable contact with the limestone of the Middle Ordovician Baota Fm, and the Upper Ordovician Wufeng Fm is missing. The top of the Longmaxi Fm is in conformable contact with the overlying Baizitian Fm limestone (the eastern SH outcrop is in fault contact) (Figure 2b). The lithology of the Longmaxi Fm in the study area is quite different compared to the Sichuan Basin and is generally characterized by rapid seaward-dipping sedimentation. The seaward-dipping surface is characterized by increased siliceous and carbonaceous contents, and the silica contents of silicon are obviously higher than those in the Sichuan Basin, but the contents of calcium are lower [4,6] (Figure 2). The sedimentary water gradually deepens from west to east, and the sedimentary center is in the Gesala area (GSL outcrop). The dominant lithology is black siliceous mudstone, with thicknesses of 50~60 m (TOC > 1%). The Shuhe area (SH outcrop) near the ancient land is a shallow shelf deposit, and the lithology is mainly argillaceous siltstone and limestone. The lithologic phase change of the Dacaozi area (DCZ outcrop), which is far from the ancient land toward the ocean, is dark gray siltstone, with a decreasing silica content, an increasing silty composition, and a significant thinning of sediment thickness. It is speculated that there is an underwater highland in the Dacaozi area (Figure 2) [6]. The Longmaxi Fm shows a sedimentary sequence that becomes shallower upward. The lower half indicates that deep-water shelf facies deposit mainly siliceous and carbonaceous siliceous mudstone. The upper half is mostly composed of shallow water shelf facies that are mainly silty mudstone and argillaceous siltstone (Figure 2). This paper uses the GSL outcrop as the research object to systematically analyze its geochemical characteristics to discuss the provenance attributes and sedimentary tectonic background of this area.

3. Samples and Methods

A total of 24 samples (YI−Y24) were collected from the GSL outcrop for mineral composition and element geochemical analysis. The GSL outcrop is located at the southern edge of the Yanyuan Basin (Figure 1b), and the exposed Silurian Longmaxi Fm is approximately 90 m thick (Figure 3). The middle and lower parts are mainly deep-water shelf deposits, and the water body is a reducing environment [4,6]. The bottom lithology is mainly gray-black thin siliceous shale, and the middle section is mainly composed of grayish black siliceous carbonaceous shale. Fine to coarse quartz particles are visible under the microscope, and a large number of radiolarian fossils are present (Figure 3 and Figure 4a,b), indicating a large amount of biogenic silica or hydrothermal-derived silica [4,6]. Horizontal bedding is developed in these graptolitic shales, and pyrite framboids are visible under the scanning electron microscope (Figure 4c,d). Several 1~5 cm thick bentonite layers are visible in the profile. It is speculated that the source area was affected by volcanism [5]. The upper lithology is mainly composed of black calcareous carbonaceous mudstone and gray-black calcareous silty mudstone. The top gradually changes into dolomite, with few graptolites, indicating that the sedimentary water is shallow and resulted in shallow-water shelf facies. From the bottom to the top, the siliceous and carbonaceous materials gradually decrease, and the calcareous sands increase.
The sampling locations and numbers are shown in Figure 3. All analyses were completed in the shale gas key laboratory of Chongqing Geological Survey and Research Institute. Before analysis and testing, fresh samples were selected as much as possible and ground to 200 mesh under pollution-free environmental conditions for major and trace element analyses. The major elements were detected with an Axios mAx PW4400/40 X-ray fluorescence spectrometer in Panaco, the Netherlands, and the relative standard deviation was less than 1%. Trace elements were analyzed by an inductively coupled plasma mass spectrometer (ICP-MS, X-series Ⅱ ThermoFisher of America), and the relative standard deviation was less than 5%. A ZJ207 Bruker D8 advanced X-ray diffractometer was used for the X-ray diffraction test, and the measurement standard followed SY/T5163−2010.

4. Analytical Results

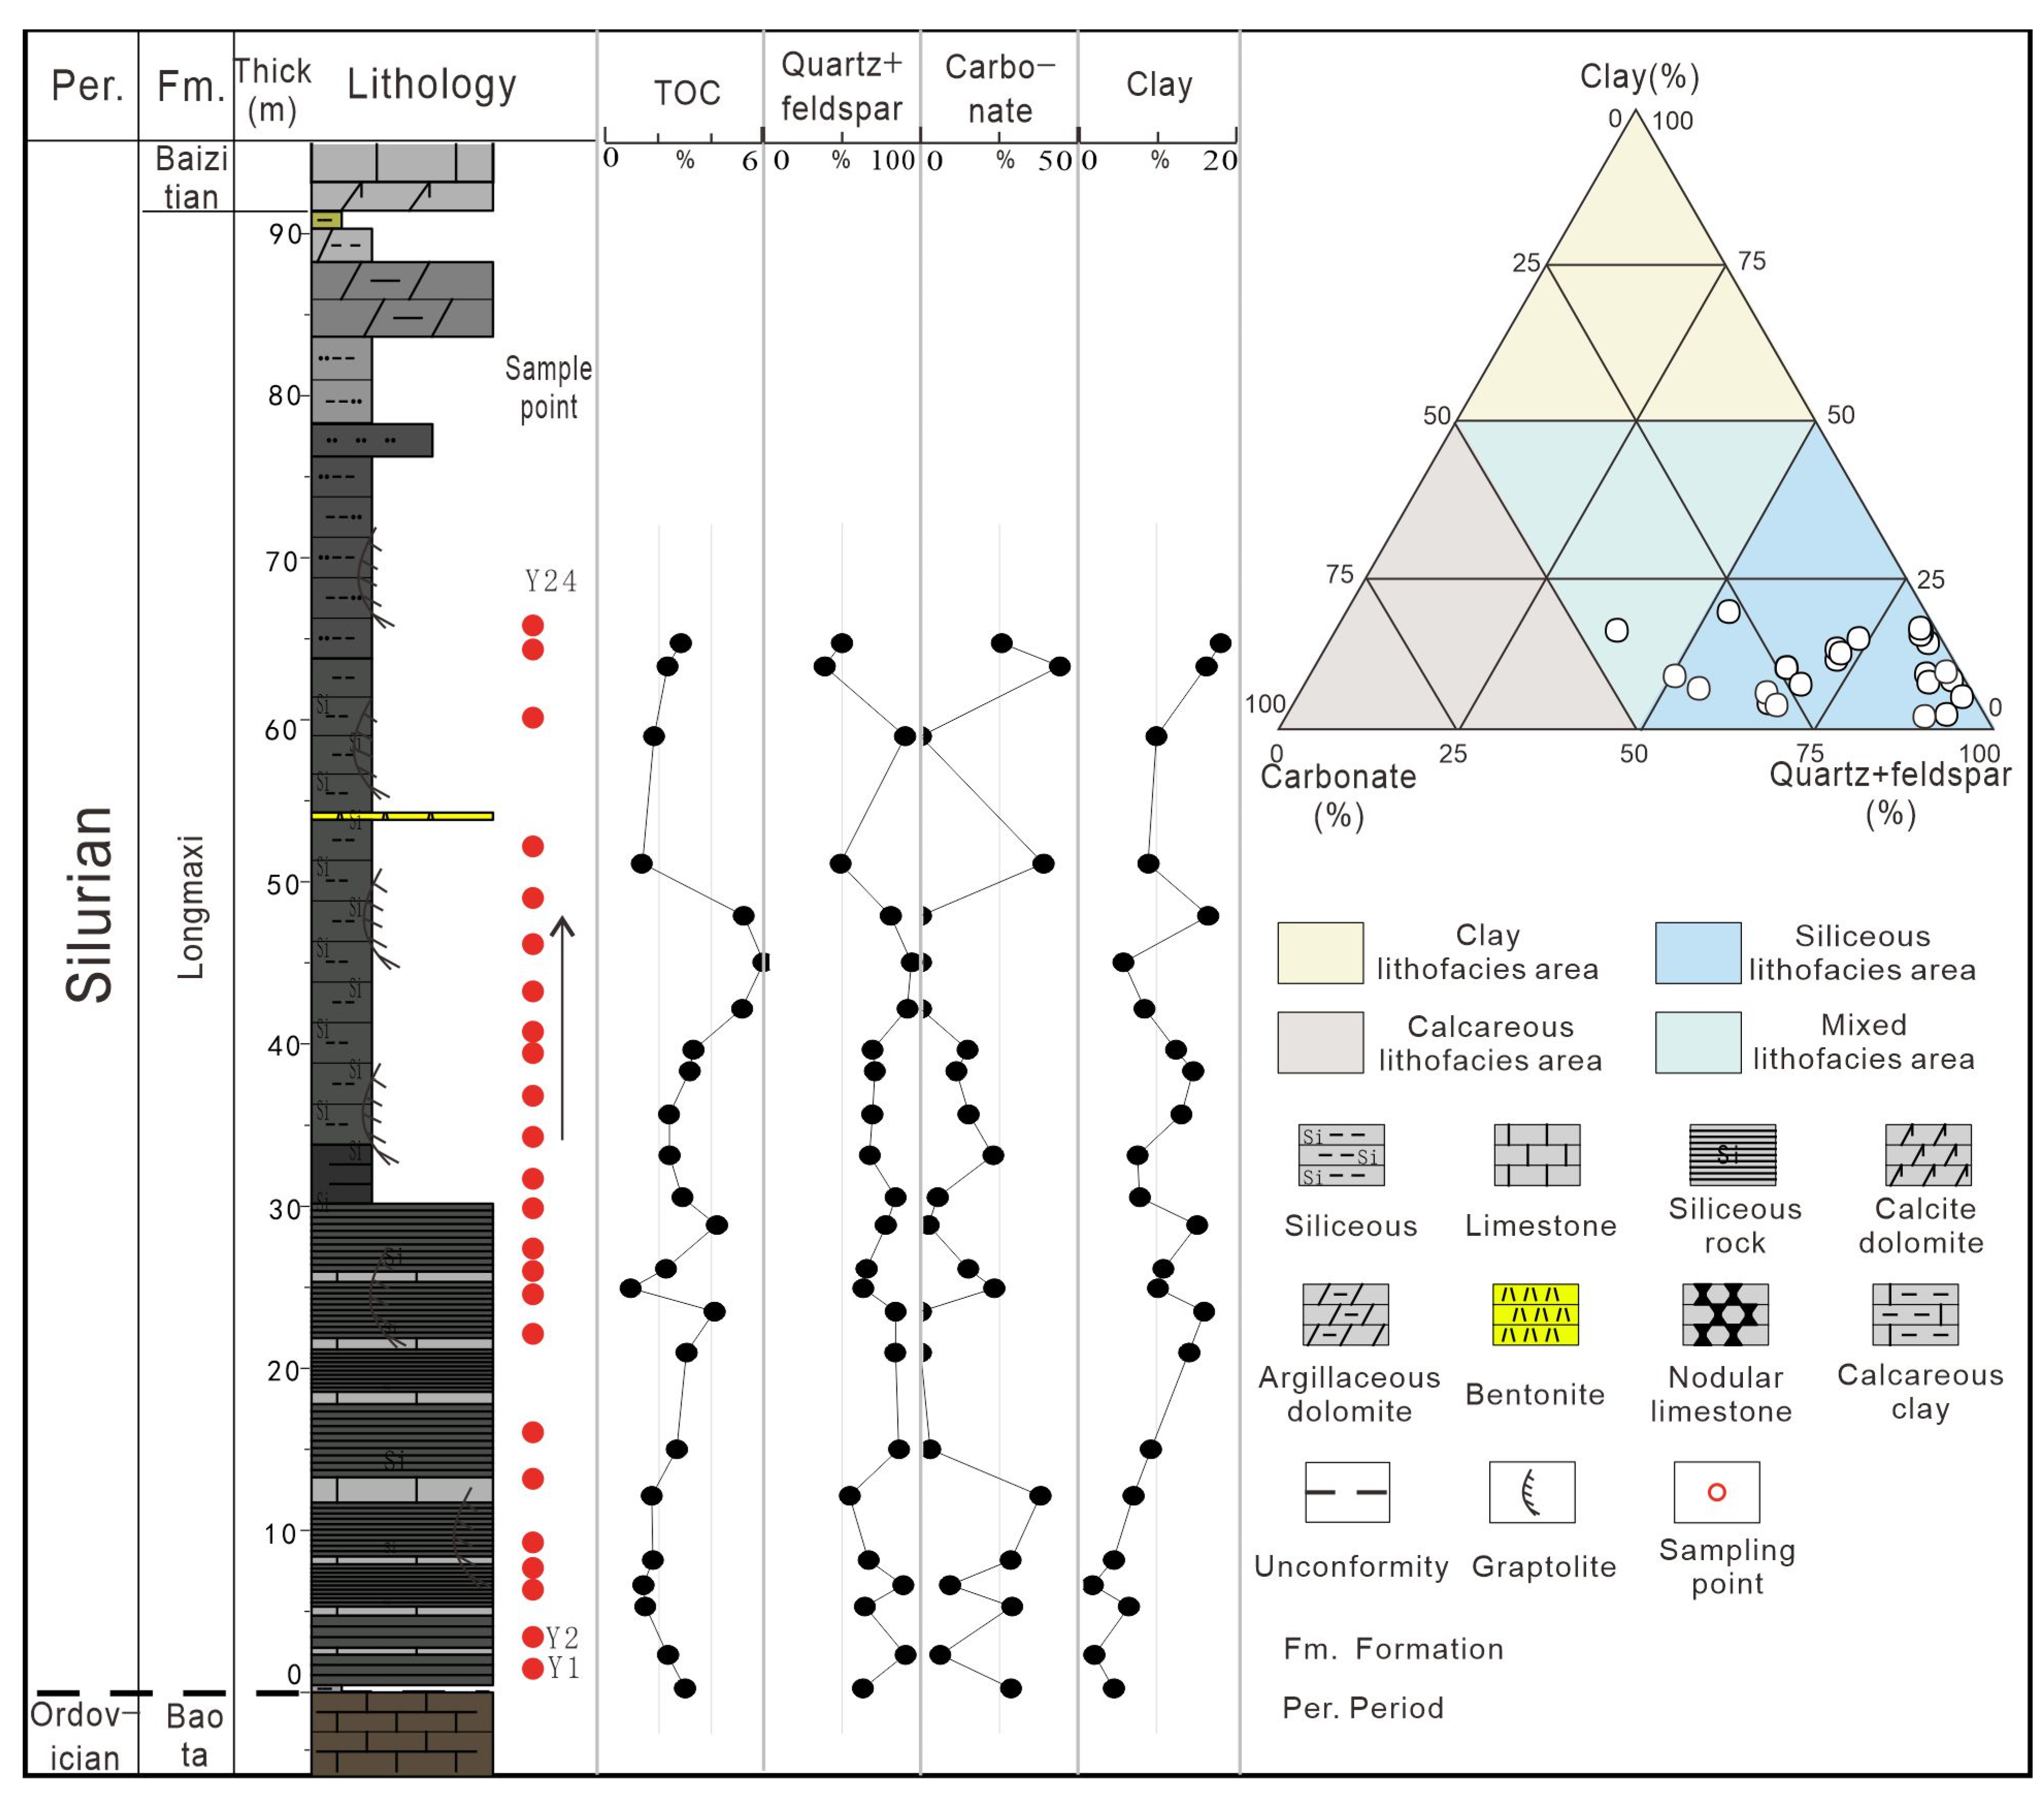
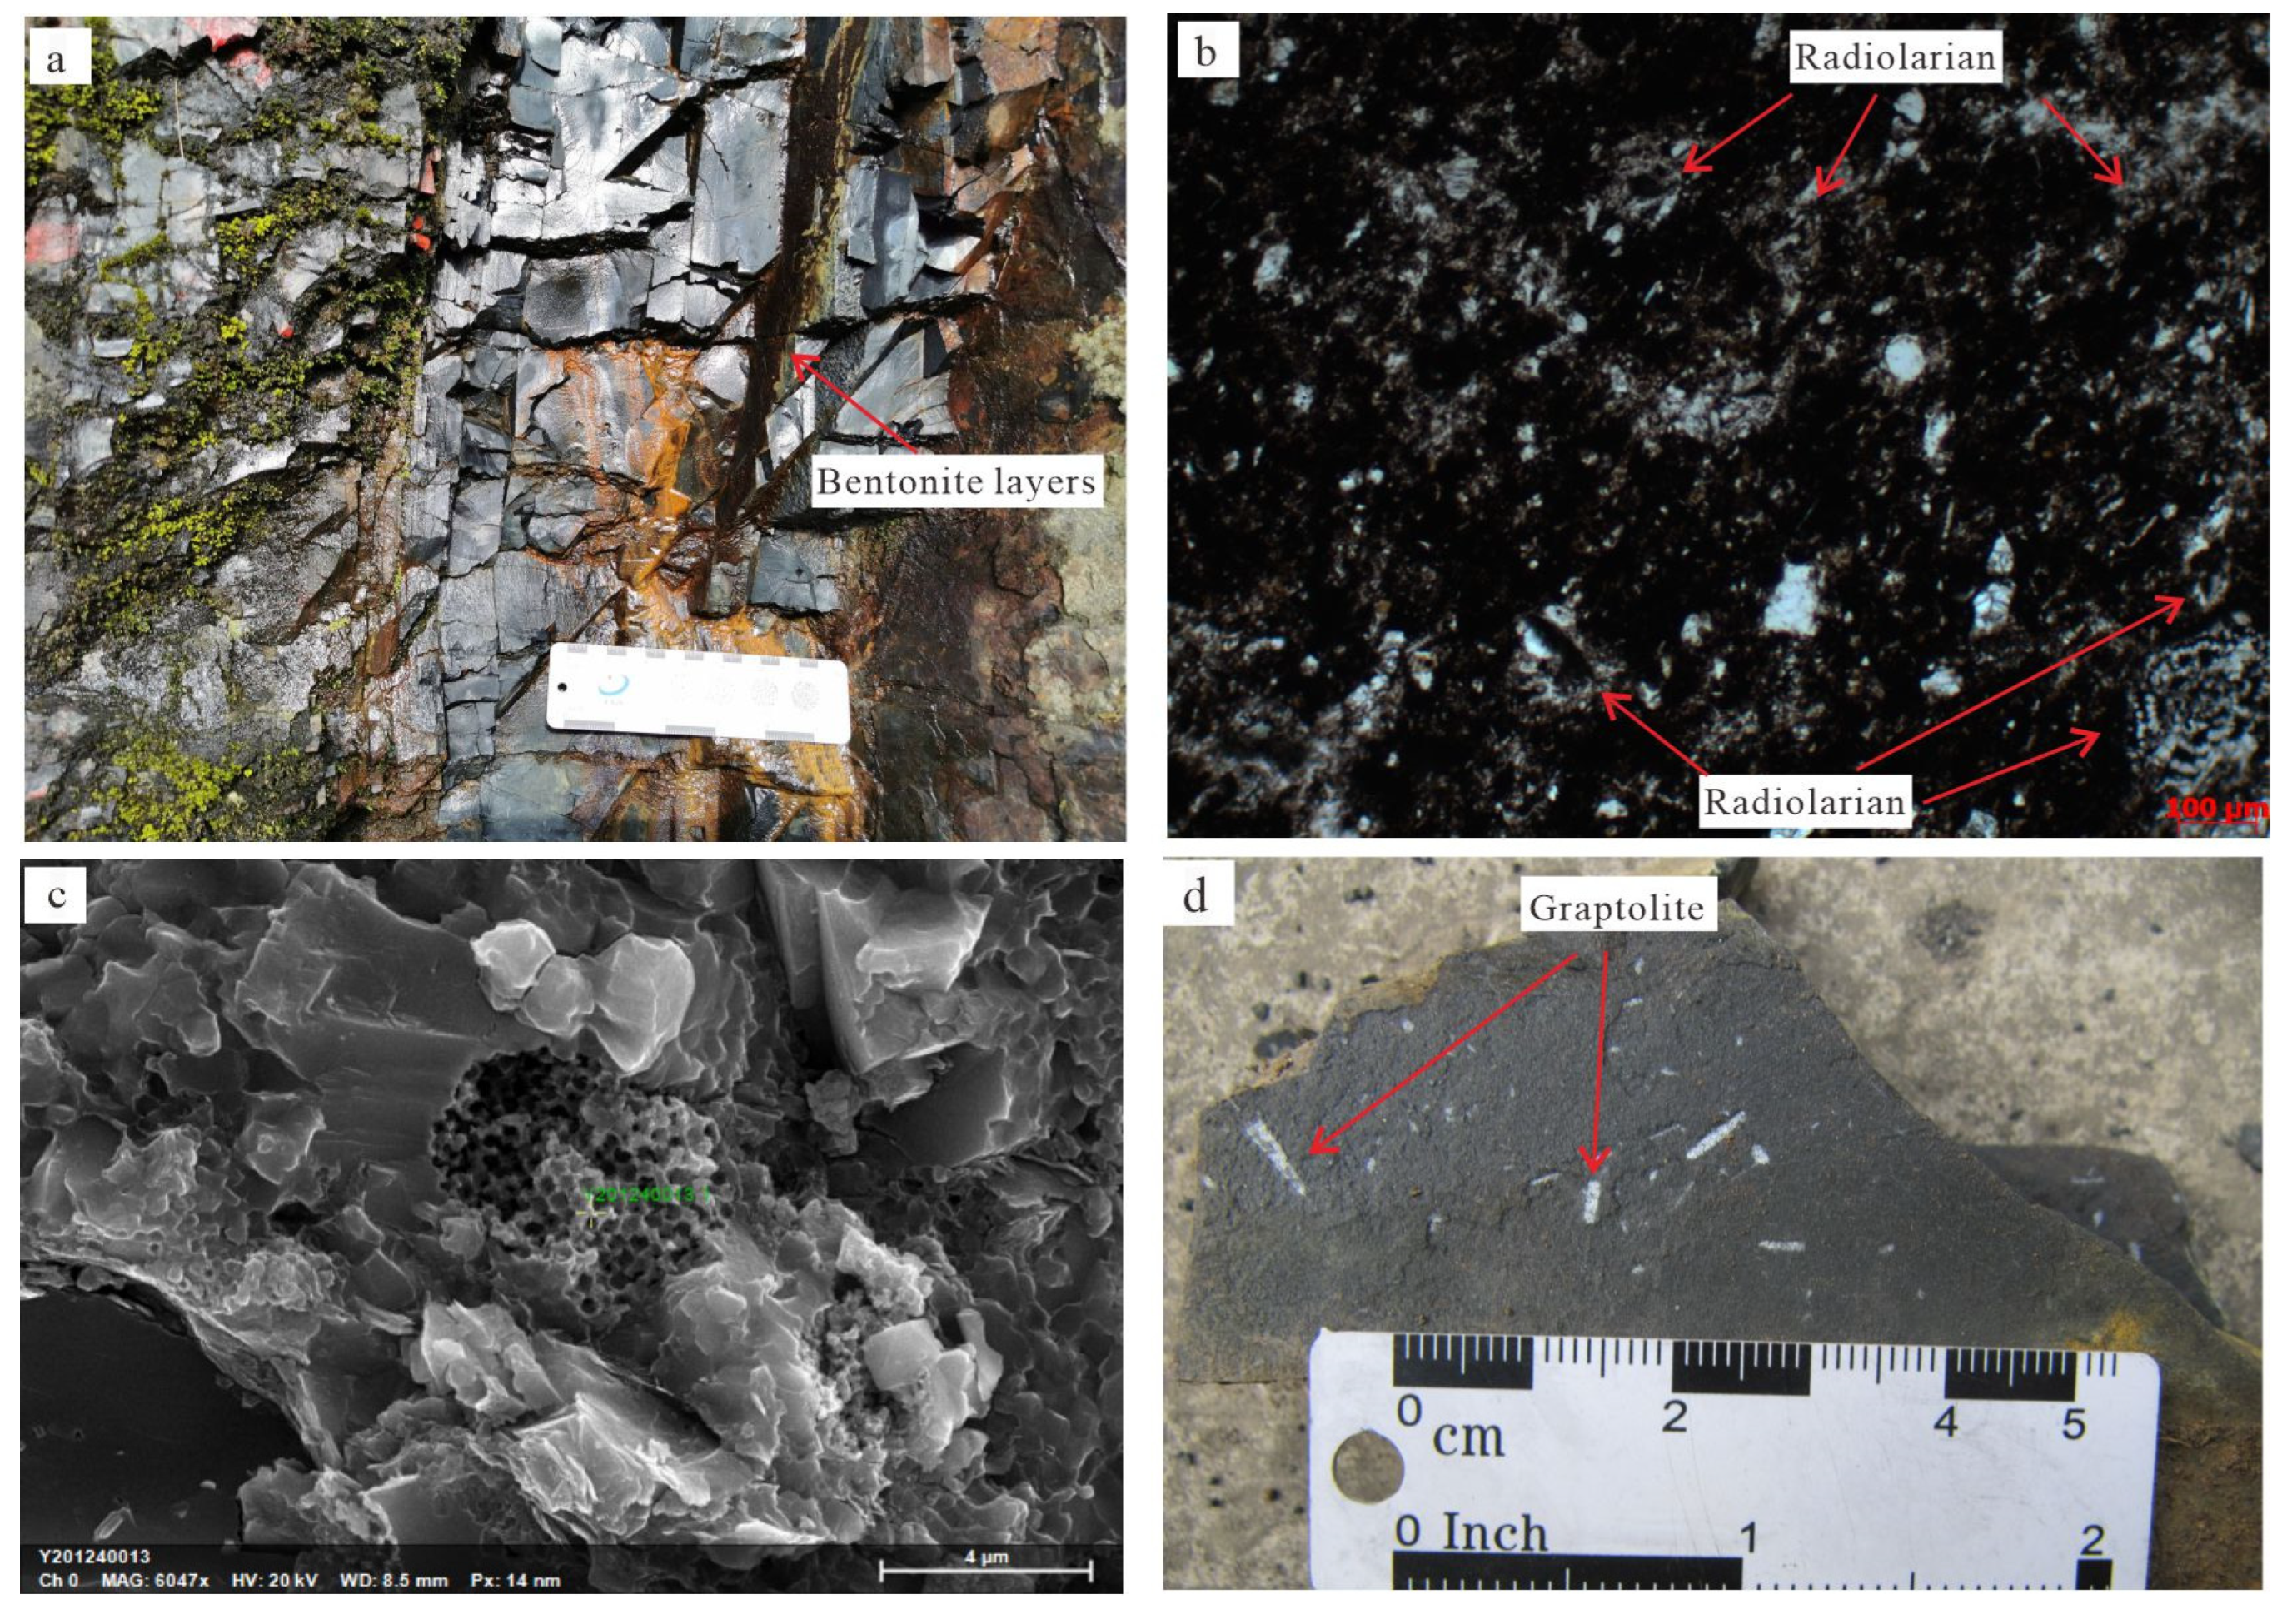
4.1. Petromineralogical Characteristics

X-ray diffraction analysis of 24 shale samples (Table 1) shows that quartz is the dominant mineral in the black shale, with values of 27.1%~89.5% and an average value of 64.7%. The feldspar content is low, in which the potassium feldspar contents are 0%~12%, with an average of 3.7%, and the albite is 0%~12.1%, with an average of 5.6%. The content of carbonate minerals is relatively low. The calcite contents are 0%~36.5%, with an average of 12.4%, and the dolomite contents are 0%~20.6%, with an average of 8.5%. Pyrite is widely visible in the profile, with values of 0%~4.6% and an average of 2.8%, indicating that the sedimentary water body is anoxic. The clay mineral content is relatively low, ranging from 1.9% to 18.2%, with an average of 10.1%. The mineral composition histogram and ternary diagram (Figure 3) show that the sample points mainly plot in the siliceous rock facies area, indicating that the black siliceous shale was greatly influenced by rising ocean currents during its deposition. The thin section identification results show that the black shale is mainly composed of silica, followed by a small amount of iron, quartz, etc. Quartz (mainly terrigenous detrital quartz) is distributed unevenly in granular form, and the rest of the siliceous matter is distributed unevenly in microcrystalline aphanitic siliceous form (Figure 4b). It is speculated that it is mainly biogenic siliceous, hydrothermal silicon, and normal chemical cementation (authigenic quartz silicon) [5,6]. Under plane-polarized light, it has an argillaceous texture overall, mainly including clay minerals and felsic fine fragments <0.004 mm, which are unevenly distributed. The carbonaceous material has no fixed form and is unevenly distributed in the form of carbon chips or is disseminated, indicating that the rock is rich in organic matter [6].

4.2. Geochemical Characteristics

The total organic carbon (TOC) contents of the GSL outcrop are high, ranging from 0.91% to 5.98%, with an average of 2.82% (Table 2). The TOC contents of the lower layered siliceous rock section are generally between 1% and 2%, and that of the middle black carbonaceous siliceous mudstone section is relatively high, which is more than 2% overall, indicating a high-quality shale section [10]. The TOC of black silty siliceous mudstone in the upper part is slightly lower than that in the middle part but is still between 1% and 3%. The whole section is rich in organic matter, and the thickness of shale that is rich in organic matter is more than 50 m, indicating a high-quality reservoir [10,11,12]. The SiO2 content is high, which is 48.57%~88.26%, with an average of 73.52%. The average contents of Al2O3, CaO, K2O, Fe2O3, and MgO are 5.27%, 5.53%, 1.77%, 1.57%, and 1.21%, respectively, and the contents of other oxides are less than 1%. In addition, the sample has a high loss on ignition (LOI = 9.57%), which may be related to the rich organic matter in the sample.
The enrichment factor EF = [(i/Al)sample/(i/Al)UCC], used to describe the enrichment of an element in black shale, is defined as the ratio of the element molar concentration in the sample to the average molar concentration in the upper continental crust (UCC) [13]. Compared with the UCC, the trace elements are more enriched, except for depletions in Ge, Sr, and Re, especially the highly enriched Mo, Sb, Ba, and As elements, which are 36.4, 25.7, 15.7, and 15.6 times those of the UCC, respectively (Table 3). The high enrichment in Mo, As, Sb, U, V, Ba, Ni, Cr, Cu, Zn, and Sc and the strong depletion in Sr and Re may be related to hydrothermal activity [6,14], especially the high enrichment in As, which is a normal sign of the difference between hydrothermal sedimentation and normal sedimentation [15]. The high enrichment in Mo, Ba, and V indicates that the paleoproductivity in this area is high. The enrichment in Cr may be related to the rich Cr in the mantle brought by volcanism. The enrichment of redox-sensitive elements, such as Mo, Ni, and V, indicates that the sedimentary water body in the Longmaxi period was a reducing environment [16,17].
The rare earth elements (REE) of the Longmaxi Formation in the study area are 24.13 × 10⁻⁶~152.83 × 10⁻⁶, with an average of 83.14 × 10⁻⁶ (Table 3), and the light to heavy rare earth ratios (ΣLREE/ΣHREE) are 2.73~11.8, with an average of 7.51, indicating that LREEs are significantly enriched relative to HREEs.δEu values (PAAS-standardized), which are 0.64~1.44, with an average of 0.85, showing a weak negative Eu anomaly. The δEu values of Y2, Y4, Y19, and Y22 show positive abnormalities (1.44, 1.32, 1.2, and 1.04), reflecting the influence of hydrothermal deposition [19,20,21]. The values of δCe (PAAS-standardized) are 0.85~0.93, with an average of 0.86, showing a weak negative anomaly, indicating a reducing sedimentary environment [16,17,22,23]. LaN/YbN values range from 0.25 to 1.98, with an average value of 1.17, which is between continental margin values (LaN/YbN value is 1.49–1.74) and pelagic and deep-sea basin values (LaN/YbN value is 0.70) [24,25], indicating a continental margin environment that was affected by pelagic and deep-sea sediments to some extent. The standardized distribution curve of chondrite-normalized REEs is a right-handed L-type curve enriched in LREEs, and the HREEs tend to be flat (Figure 5a), which is consistent with the compositional characteristics of the average upper crust and conforms to the sedimentary characteristics of crust-mantle source materials [26]. On the North American shale composite (NASC) standardized diagram (Figure 5b), most of the sample standardization curves show a nearly horizontal distribution and are similar to NASC, indicating that most of the sediment source rocks are from the continental upper crust [27,28]. The REE distribution model in the study area is not quite consistent (Figure 5b), which indicates an intense tectonic movement in the Longmaxi period, it was a highly volatile geological sedimentary basin, and the source rock attributes are relatively complex.

5. Discussion

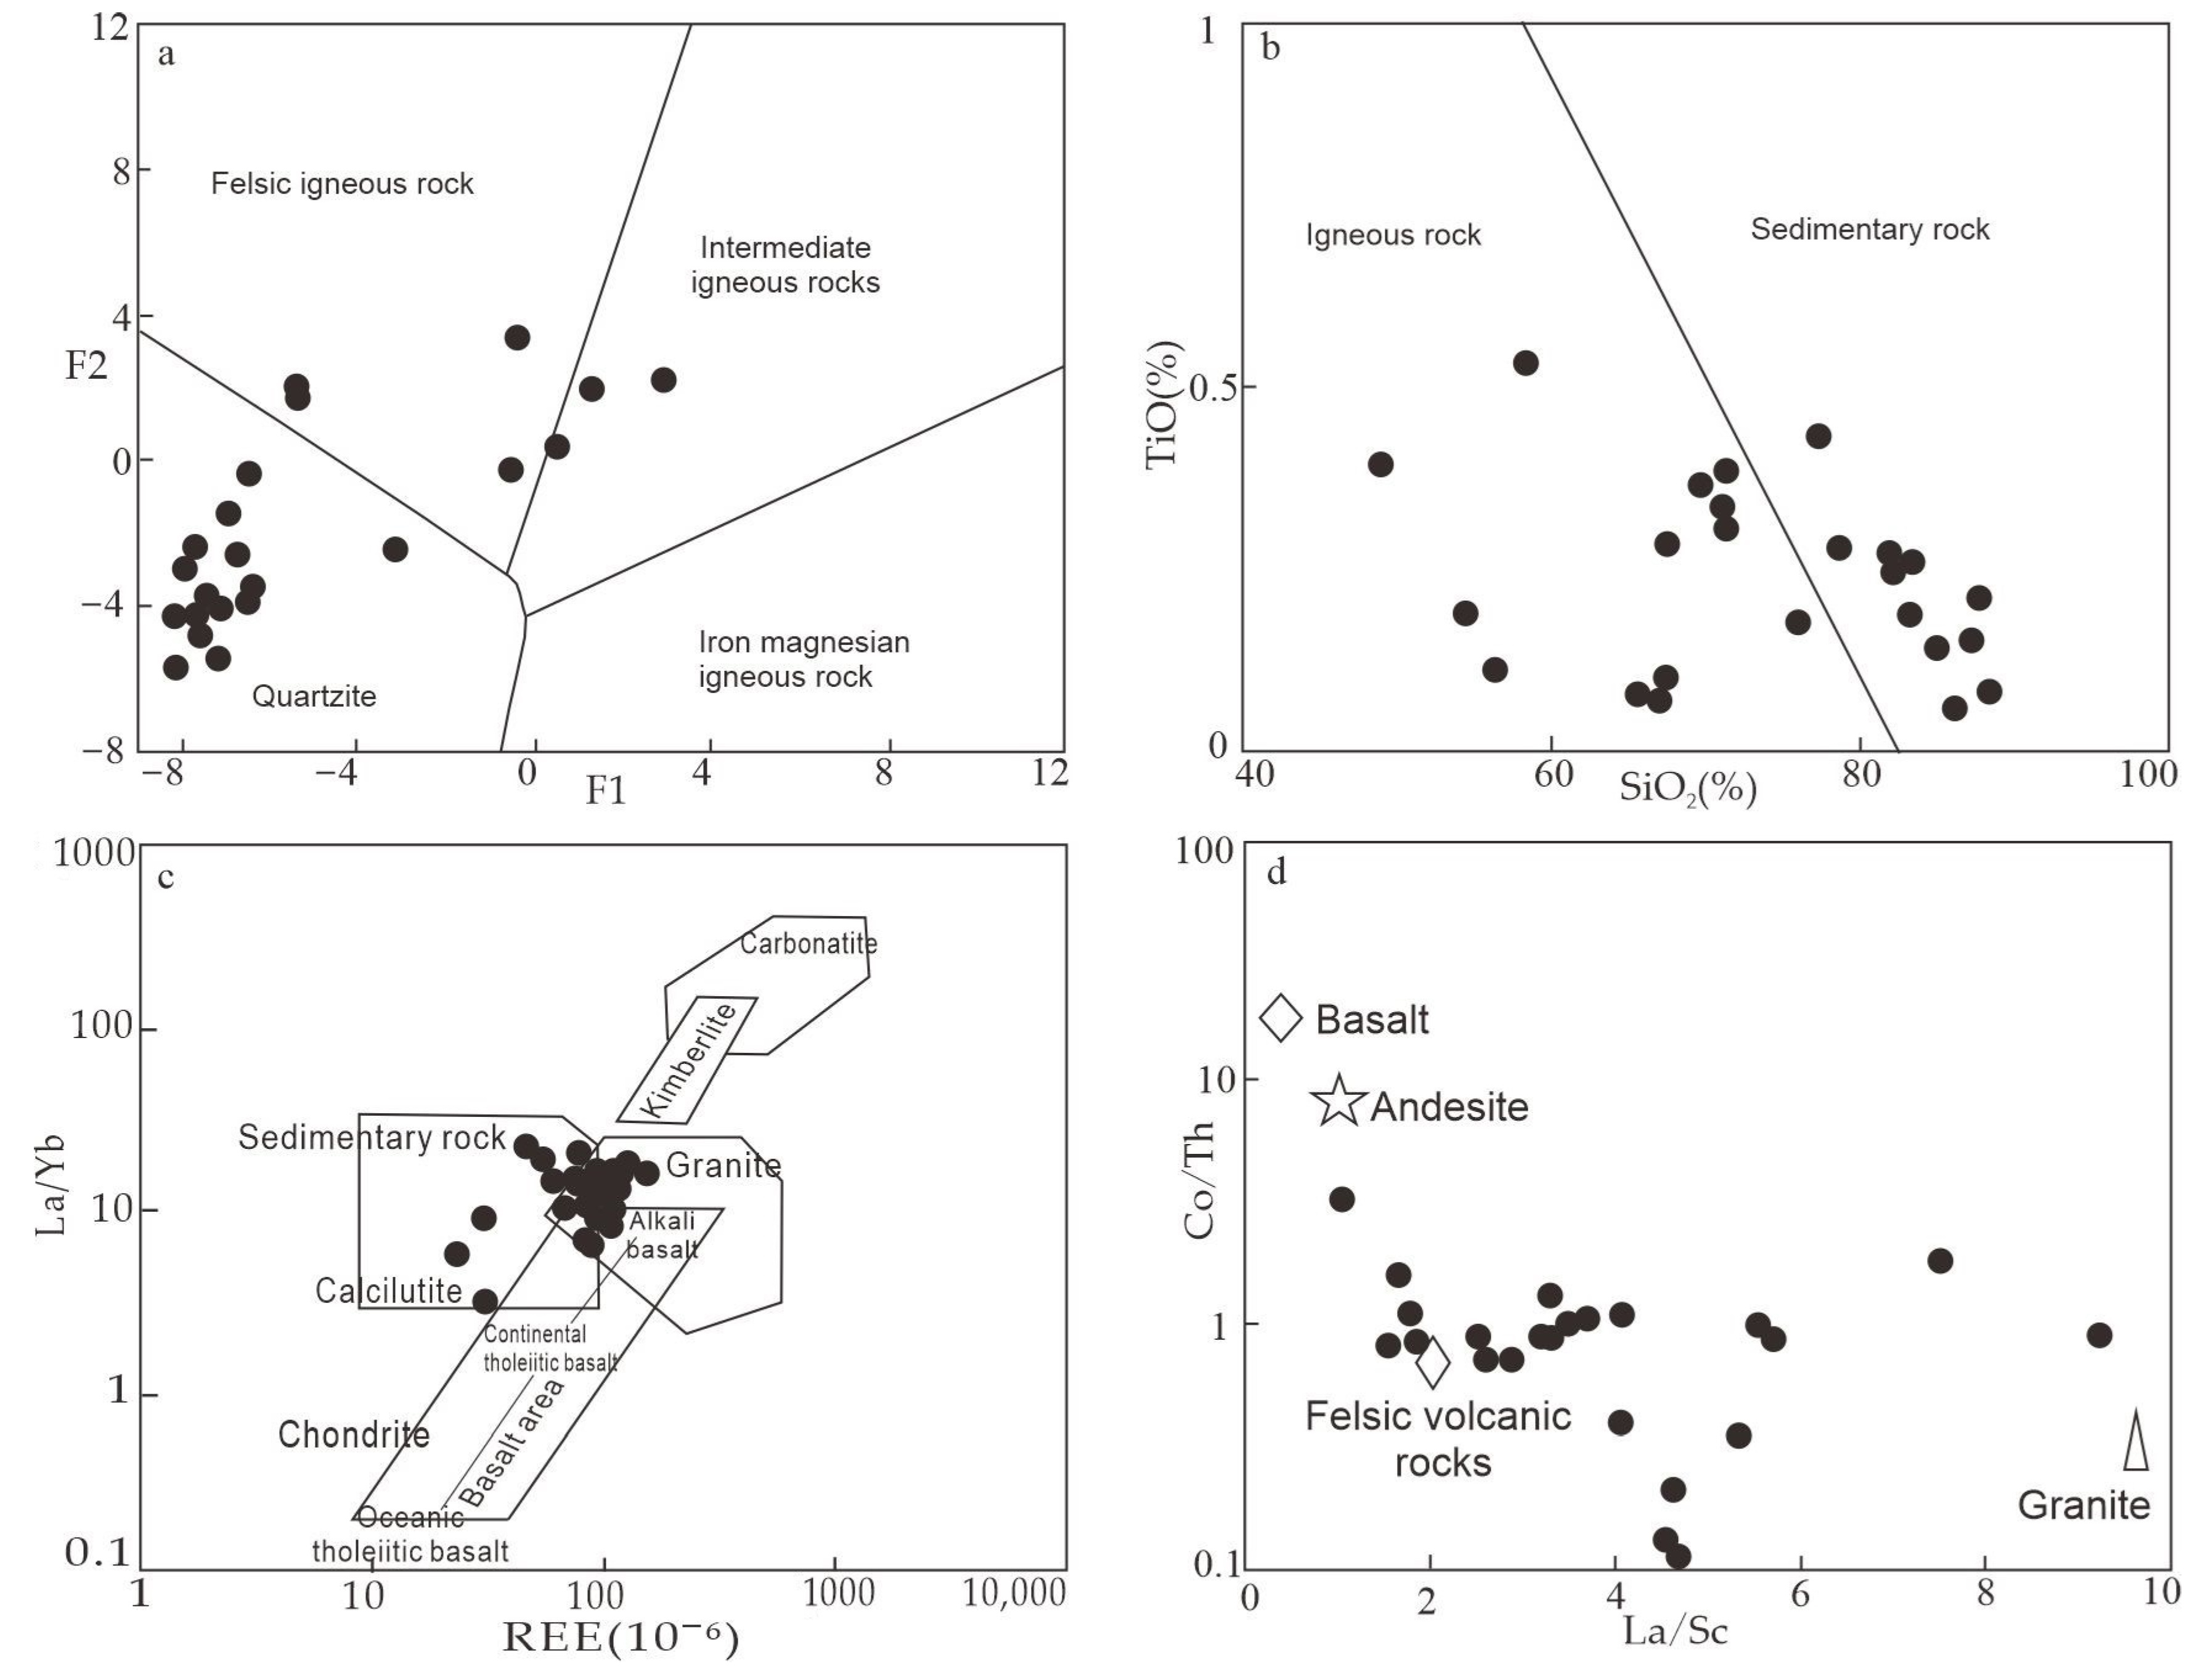
5.1. Rock Types in the Provenance Area

The geochemical characteristics of silty sand and clay samples can best reflect the attributes of the provenance area [11,12,29]. The relevant diagrams and ratios of major element oxides such as SiO2, TiO2, K2O, and Al2O3 can be used as indicators to determine the composition of the source area of fine clastic rocks [22,30,31]. At the same time, some nonmigratory trace elements, such as Zr, Hf, Th, Sc, Y, and REEs, change little during the evolution of the sedimentary basin, which can retain relevant information about the source rocks and can be used as an ideal object for provenance discrimination [13,32].
Rose et al. (1988) [19] established a discriminant function to distinguish source rock types according to the characteristics of Ti, Al, Fe, Mg, Ca, Na, and K oxides in sediments as follows:
F1 = −1.773 × TiO2 + 0.607 × Al2O3 + 0.76 × Fe2O3 − 1.5 × MgO + 0.616 × CaO + 0.509 × Na2O − 1.224 × K2O − 9.09;
F2 = 0.445 × TiO2 + 0.07 × Al2O3 − 0.25 × Fe2O3 − 1.142 × MgO + 0.438 × CaO + 1.475 × Na2O + 1.426 × K2O − 6.861;
According to the F1–F2 diagram, the provenance fields of felsic, neutral, or mafic igneous rocks and quartzite sedimentary rocks are distinguishable. In the F1–F2 diagram (Figure 6a), most samples from the study area plot in the quartz sedimentary rock fields, and a few plot in the felsic and intermediate igneous rock fields, which indicates that the source rocks are mostly acidic–intermediate acidic igneous rocks. In the SiO2–TiO2 diagram [33] (Figure 6b), all samples plot in the transitional area of sedimentary and igneous rocks, indicating that the source includes both sedimentary and igneous rocks. In the ΣREE–La/Yb diagram [34,35] (Figure 6c), most of the samples plot in the sedimentary rock–calcareous mudstone and granite area, and a few plot in the overlapping area of sedimentary rocks calcareous mudstone, granite, and basalt. In the La/Sc–Co/Th diagram [16,36] (Figure 6d), samples are mainly distributed in the felsic igneous rock and near the granite provenance fields, and a few plot in the mixed felsic–metabasic rock fields. All of the above results indicate that the provenance of the Longmaxi period was complex, mainly consisting of felsic provenance and granite and a small amount of intermediate–basic igneous rocks.
The REEs in sedimentary rocks have strong inheritance from their parent rocks [16,19,21]. Felsic rocks have high LREE/HREE values and negative Eu anomalies, while basic rocks generally have low LREE/HREE values and no obvious Eu anomalies (δEu) [23]. Samples from the Longmaxi Formation in the study area are characterized by high LREE/HREE values (average of 7.51) and overall negative Eu anomalies (average of 0.85) (Table 3), indicating more felsic rock characteristics. In addition, most of the samples show a very similar chondrite-normalized distribution pattern to PAAS [13] (Figure 5a), which also shows that most of the sediments come from felsic source rocks, but there are still a few with different distribution patterns, indicating the diversity of parent rocks. Similarly, δEu can be used as an important parameter to identify the source of parent rock materials [37,38]. If the parent rock is acidic granite, δEu is usually a negative anomaly (δEu < 0.90). If the parent rock is basic basalt, δEu is a nonnegative or positive anomaly (0.90 < δEu < 1.0); whereas, if δEu is positive (1.01 < δEu < 2.33), it indicates that the source rock is plagioclasite or a submarine hydrothermal or extreme reducing alkaline environment [11,37,39]. In the study area, δEu varies greatly, with both positive and negative anomalies, ranging from 0.64 to 1.44, with an average of 0.85, showing weak negative Eu anomalies. This result indicates that the source rocks are mainly acidic igneous rocks, including samples Y2, Y4, Y19, and Y22. δEu values show positive anomalies, indicating that the study area may have been affected by submarine hydrothermal solution, and the source rocks have mixed origins. Studies show that Archean continental crust is mainly composed of tonalite–trondhjemite–granodiorite (TTG), with weak Eu as a negative anomaly (δEu > 0.83) and high (Gd/Yb)N values (>1.5) [10,17,30]. In this study, δEu is 0.85, and the average value of (Gd/Yb)N is 1.51, suggesting that its provenance may be post-Archean felsic volcanic rocks.
In summary, the source area of the Longmaxi Formation black shale has complex rock types and mixed origins. It is mainly acidic felsic igneous rocks, with a small contribution of intermediate–basic rocks. Combined with the paleogeographic and tectonic background, it is inferred that the Kangdian ancient land in the eastern part of the area could be the main provenance area, but with the contribution of sediments derived from oceanic island arc located in the west.

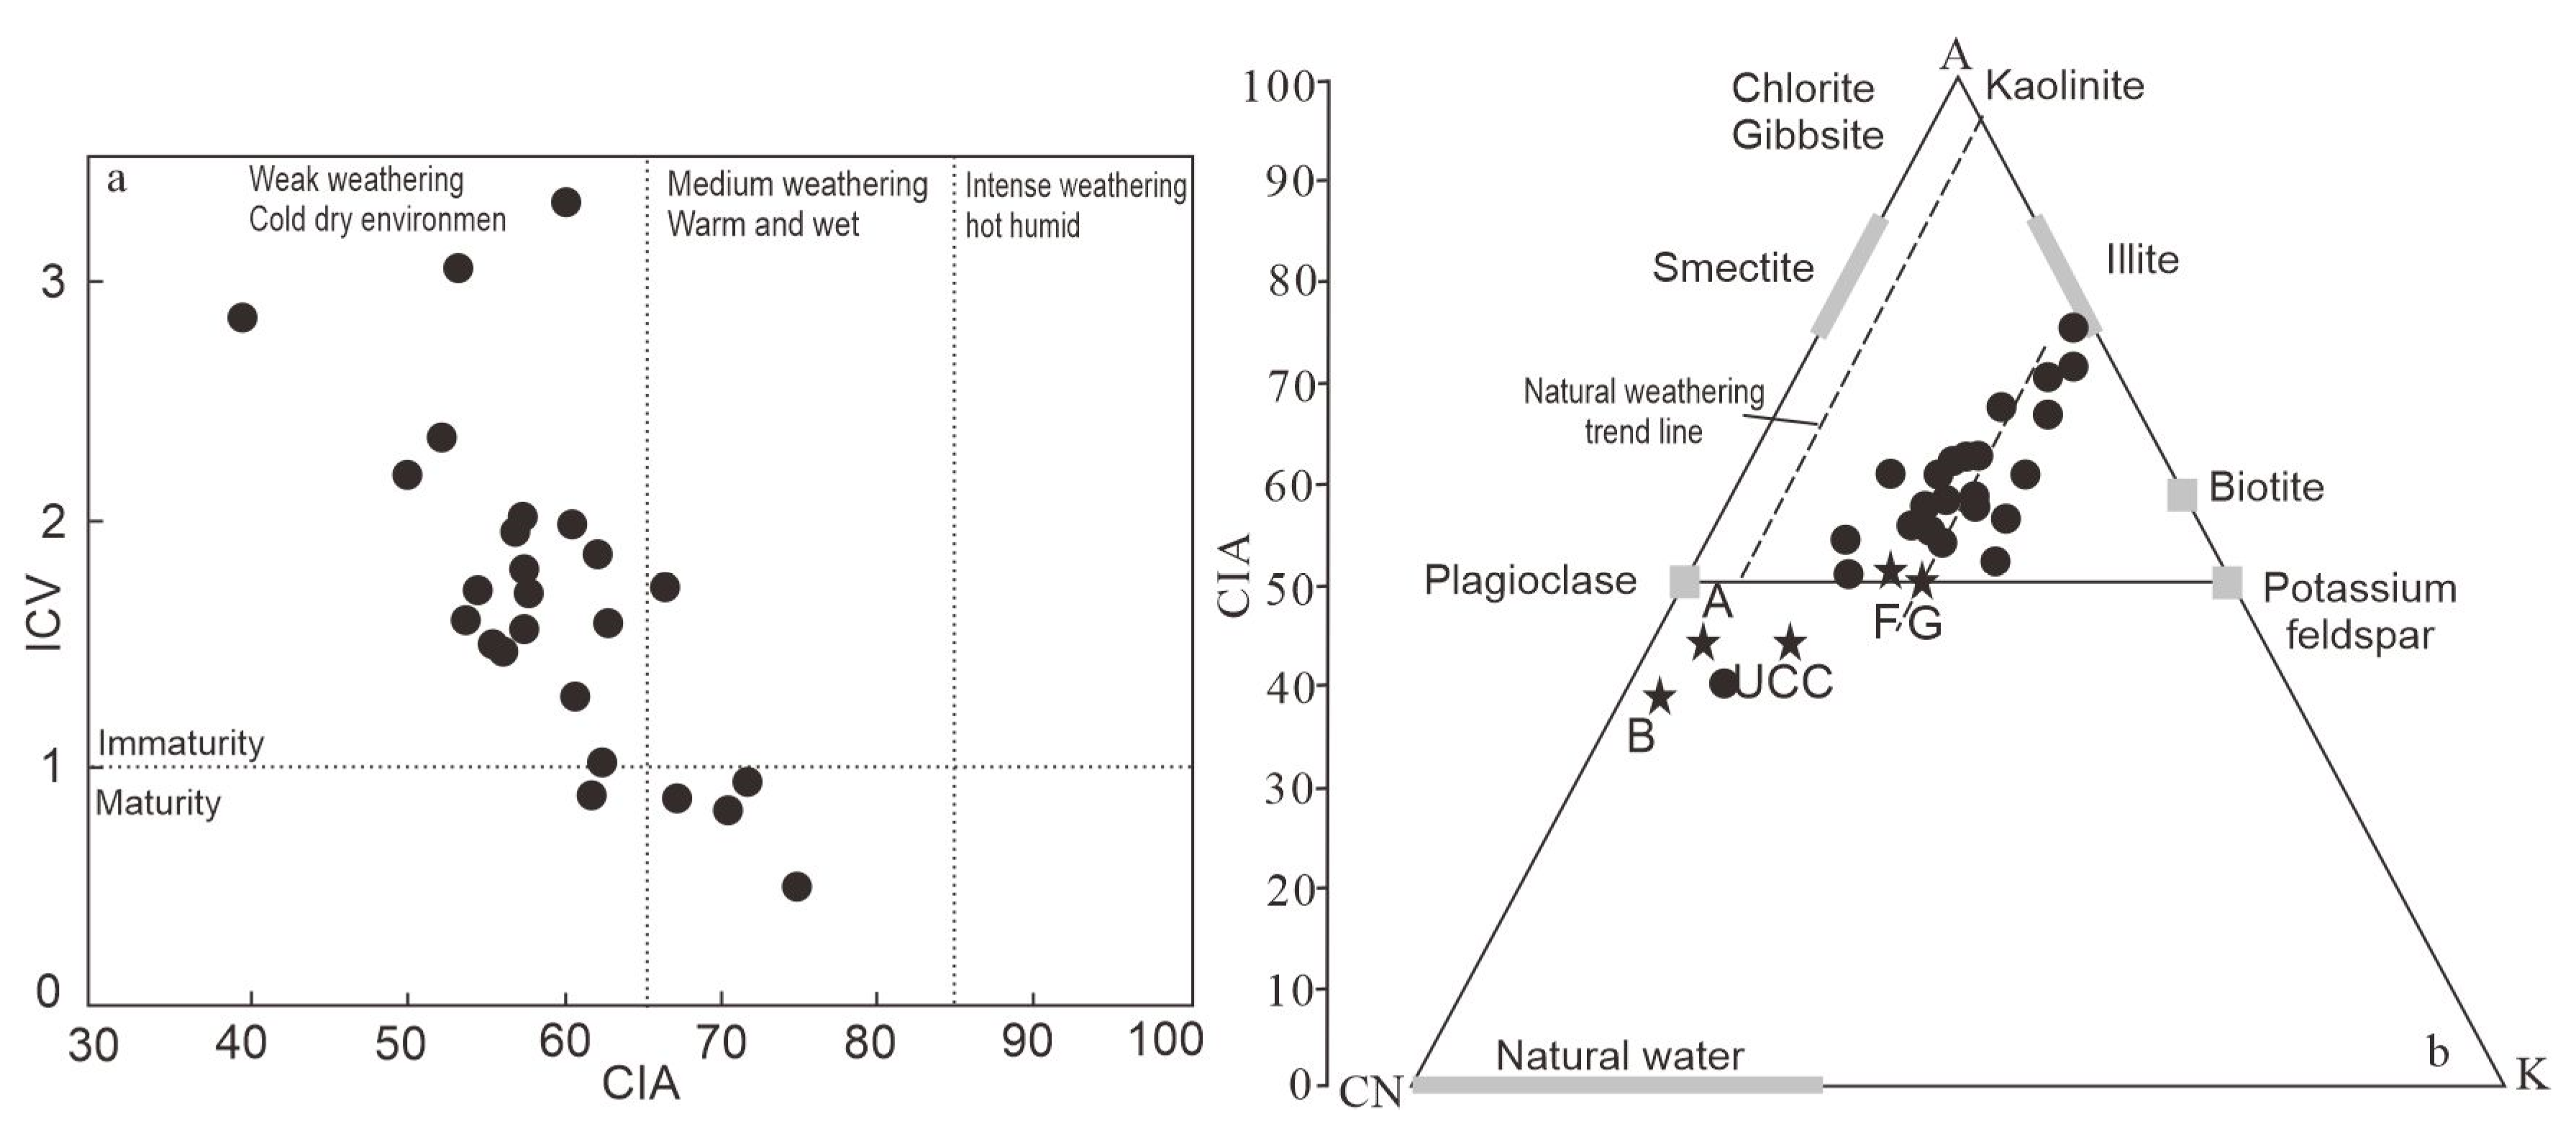
5.2. Provenance Weathering

Cox (1995) [31] found that, compared with the young sediments, the oxides of the recycled sedimentary rocks showed an increasing K2O content and no obvious regularity of SiO2 and Al2O3 contents; the other oxides showed a decreasing trend, and they indicated an index of compositional variability (ICV). The formula is ICV = mol (Fe2O3 + K2O* + Na2O + CaO* + MgO + MnO + TiO2)/(Al2O3), all of which are molar masses, and CaO* represents the CaO abundance derived from silicate minerals. To date, no direct methods have been used to quantify and distinguish the CaO contents in silicate portions and nonsilicate portions (apatite and carbonates). K2O* is the corrected K2O to eliminate the effect of potassium metasomatism on the results. The CaO* and K2O* contents studied here refer to the method described by McLennan et al. (1991) [22] and Cox (1995) [31]. It is used to assess whether clastic sedimentary rocks are composed of primary sediments or recycled sediments [31]. Generally, those with ICV > 1 are compositionally immature with the first cycle of sediments deposited in tectonically active settings. On the other hand, those with ICV < 1 are compositionally mature and are deposited in a tectonically quiescent or cratonic environment, where sediment recycling is active or primary sedimentation occurs under strong weathering conditions [40,41]. The ICV values in the study area are 0.50~3.33, with an average value of 1.71 (Table 2, Figure 7a), which indicates low mineral maturity and mainly the first sedimentation of the tectonic activity zone. This shows that the tectonic movement in the provenance area was more intense, which is strongly consistent with the overall tectonic compression and uplift of the Yangtze platform during the Longmaxi period [42].
The chemical index of alteration (CIA) is an important indicator used to assess the degree of chemical weathering [36,43]. Recirculation of sediments increases the proportion of clay minerals, thus increasing the CIA value [25,36]. Previous studies have shown that the provenances of the study area are the primary deposits of the tectonically active zone and have undergone weak chemical weathering, so the CIA can directly represent the chemical weathering intensity and paleoclimatic characteristics of its deposition [16]. Moreover, because metasomatism makes Ca2+, Na+, and K+ unstable, thereby affecting the CIA value, it is also necessary to exclude the influence of metasomatism on chemical weathering [36,44,45]. Under ideal conditions, if not metasomatized, the weathering proceeds along the direction of A-CN or A-K in the Al2O3–CaO* + Na2O–K2O (A-CN-K) diagram [14,46]. In the A-CN-K diagram (Figure 7b), most of the samples are distributed along the A-CN direction, and the actual weathering line is basically parallel to the natural weathering line (Figure 7b), indicating that the metasomatism after the sedimentation period is weak, and the CIA value can be used to determine the chemical weathering.
Generally, a CIA value of 50~65 represents primary weathering in cold and dry environments, a value of 65~85 represents moderate weathering in warm and humid environments, and a value of 85~100 represents strong weathering in hot and humid environments. The CIA values in the study area are 40~75, with an average value of 59, indicating that the Longmaxi Formation was generally subject to minor chemical weathering and that the climate may have been cold and dry during sedimentation. The CIA values of the lower section of the Longmaxi Formation are mainly in the range of 40~65 (Table 2, Figure 7a), which are roughly equivalent to the CIA value of Pleistocene glacial clay (50~65) [25,43], indicating the weak chemical weathering degree under cold and dry climate conditions. The CIA values of the upper section are mainly in the range of 55~75, and the chemical weathering is slightly increased, indicating that the climate has a tendency toward warm and humid conditions. This shows that the cold climate of the late Ordovician ice age was inherited in the early stage of the Longmaxi Formation in the study area, and the climate was warmer in the late stage. The lower CIA indicates that the tectonic movement in the Longmaxi period was strong and the chemical weathering was weak.
Generally, climate factors control the chemical weathering degree, while tectonics control the denudation and supply of source rocks. In the A-CN-K ternary diagram (Figure 7b), the distribution of sample points is relatively scattered, indicating that the source rocks experienced unstable climatic and tectonic conditions during deposition. At the same time, the chemical weathering trend line plots between granite and felsic igneous rock, and only one numerical point is cast near the andesite, indicating that the material source is mainly felsic igneous rock and granite, and a small amount of intermediate–basic rock is mixed, which is the same as the strong theory obtained previously.
If the composition of the main chemical elements in the sediment changes greatly and the samples in the A-CN-K ternary diagram are scattered and not compact, it indicates that the climate and tectonic environment are in an unstable state. In contrast, if the main elements change little or the samples are distributed compactly, it reflects the relatively stable state of the source rock undergoing chemical weathering and denudation [20,45]. The distribution of samples from the study area is relatively scattered (Figure 7b), indicating that rocks from the source area experienced unstable climatic and tectonic conditions during sedimentation. At the same time, the chemical weathering trend line plots between granite and felsic igneous rock, and a few points plot near andesite, indicating that the source material is mainly felsic igneous rock, with a small contribution of intermediate–basic igneous rocks. Trace element Th/U values are also one of the indicators used to characterize the degree of chemical weathering [13,36]. In the analyzed samples, the Th/U values also range from 0.29 to 2.28 (Table 3), with a mean of 1.14, which is lower than the UCC (3.89) and PAAS (4.71) and shows weak chemical weathering, which is consistent with the results discussed above.

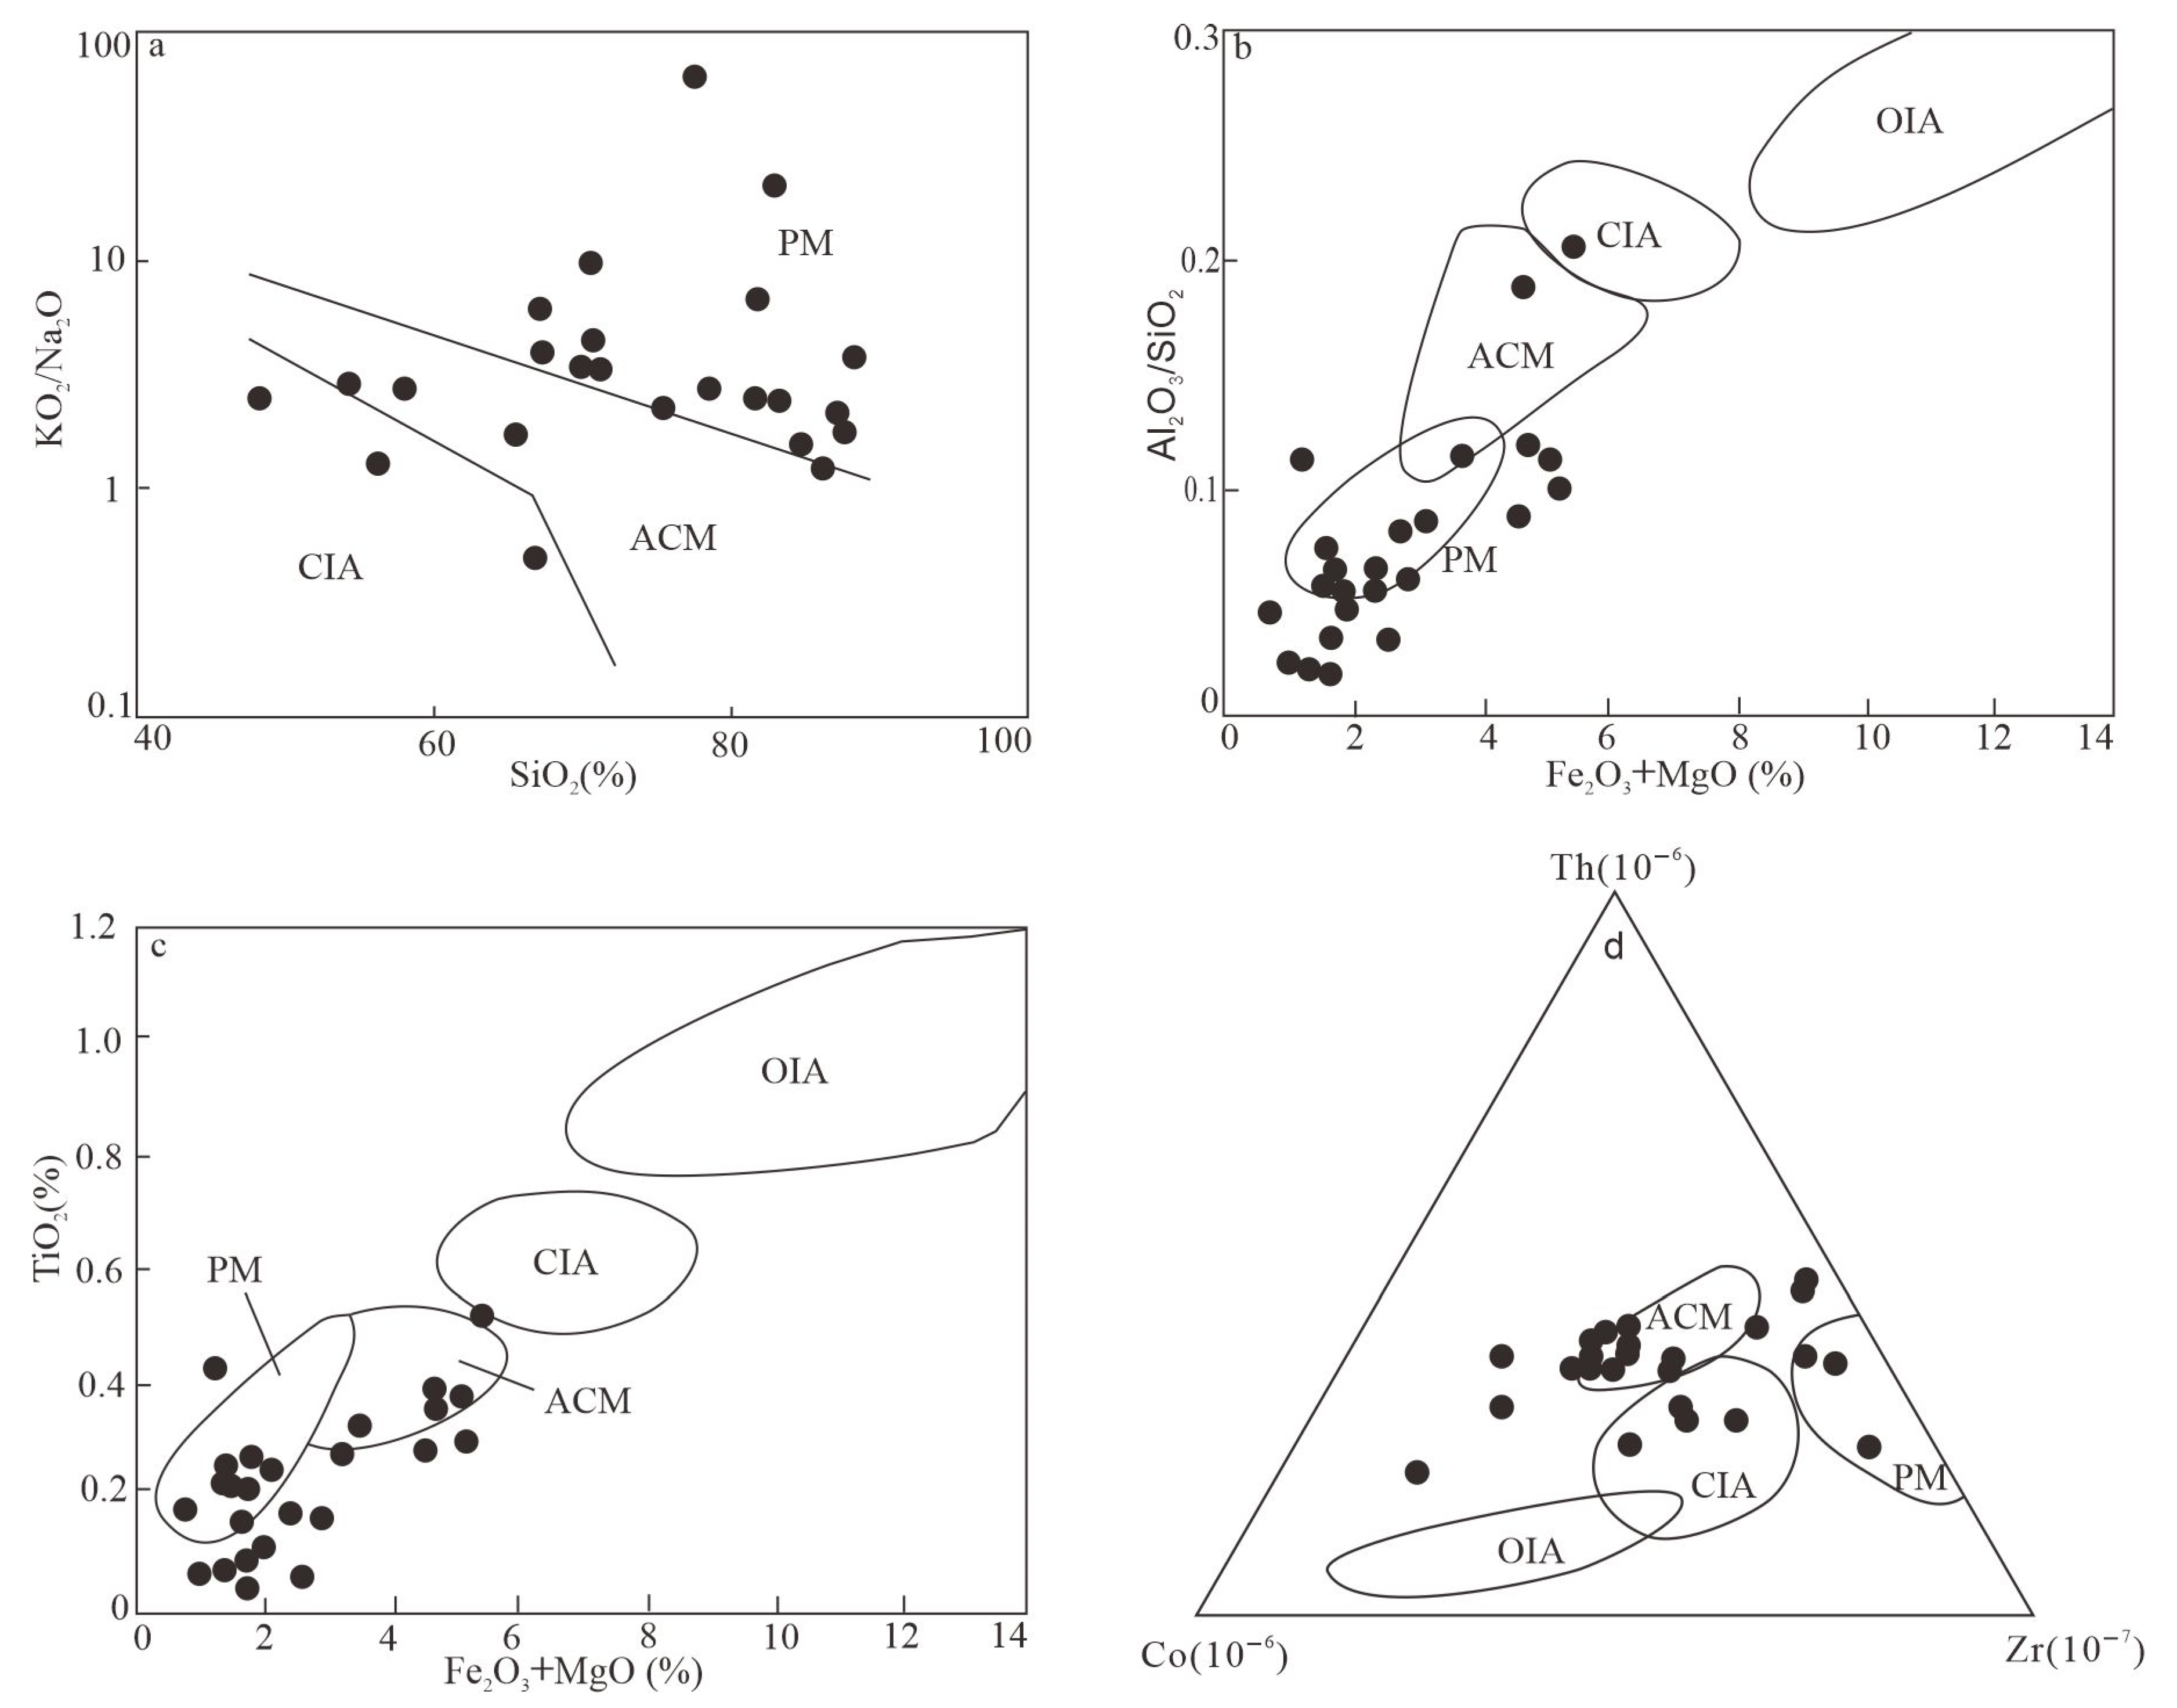
5.3. Tectonic Background

Different tectonic environments in the process of plate movement have unique geochemical characteristics, so geochemical characteristics are often used to reconstruct the tectonic background of the source area [32,35,45]. Because of the uncertainty of geochemical indicators, it is generally a comprehensive assessment by means of multiple elements [22,23]. As shown in the major element discrimination diagram [33,35] (Figure 8a–c), the analyzed samples are scattered, and most of them plot in the passive continental margin and active continental margin fields. Only a few plot in the continental island arc area, indicating that the tectonic background of the source area is relatively complex, and it is mainly a passive continental margin; however, it also has the attributes of an active continental marginal and island arc background. The trace element discriminant diagram [12,13,21] (Figure 8d) also shows the same trend; the samples mainly plot in the active continental margin, and a small part plots in the passive continental margin and continental island arc regions.
The REE study shows that the average REE values of the sediments on the passive continental margin are similar to those of the PAAS [16,47], characterized by LREE enrichment and negative Eu anomalies. In contrast, the sediments at the active continental margin are mainly volcanic rocks with low differentiation, characterized by HREE enrichment and no Eu anomalies. The Longmaxi black shale is enriched in LREEs, and most samples have negative Eu anomalies (Table 2), indicating passive continental margin sediments, but a few samples also show an active continental margin signature. At the same time, the distribution patterns of the REE chondrite-standardized curve (Figure 5a) and NASC-standardized curve (Figure 5b) of the Longmaxi Formation shale show similar characteristics to the REE distribution curve of graywacke on the passive continental margin, but a few samples show chemical affinity to the active continental margin and island arc. This is consistent with the discrimination results of major and trace elements.

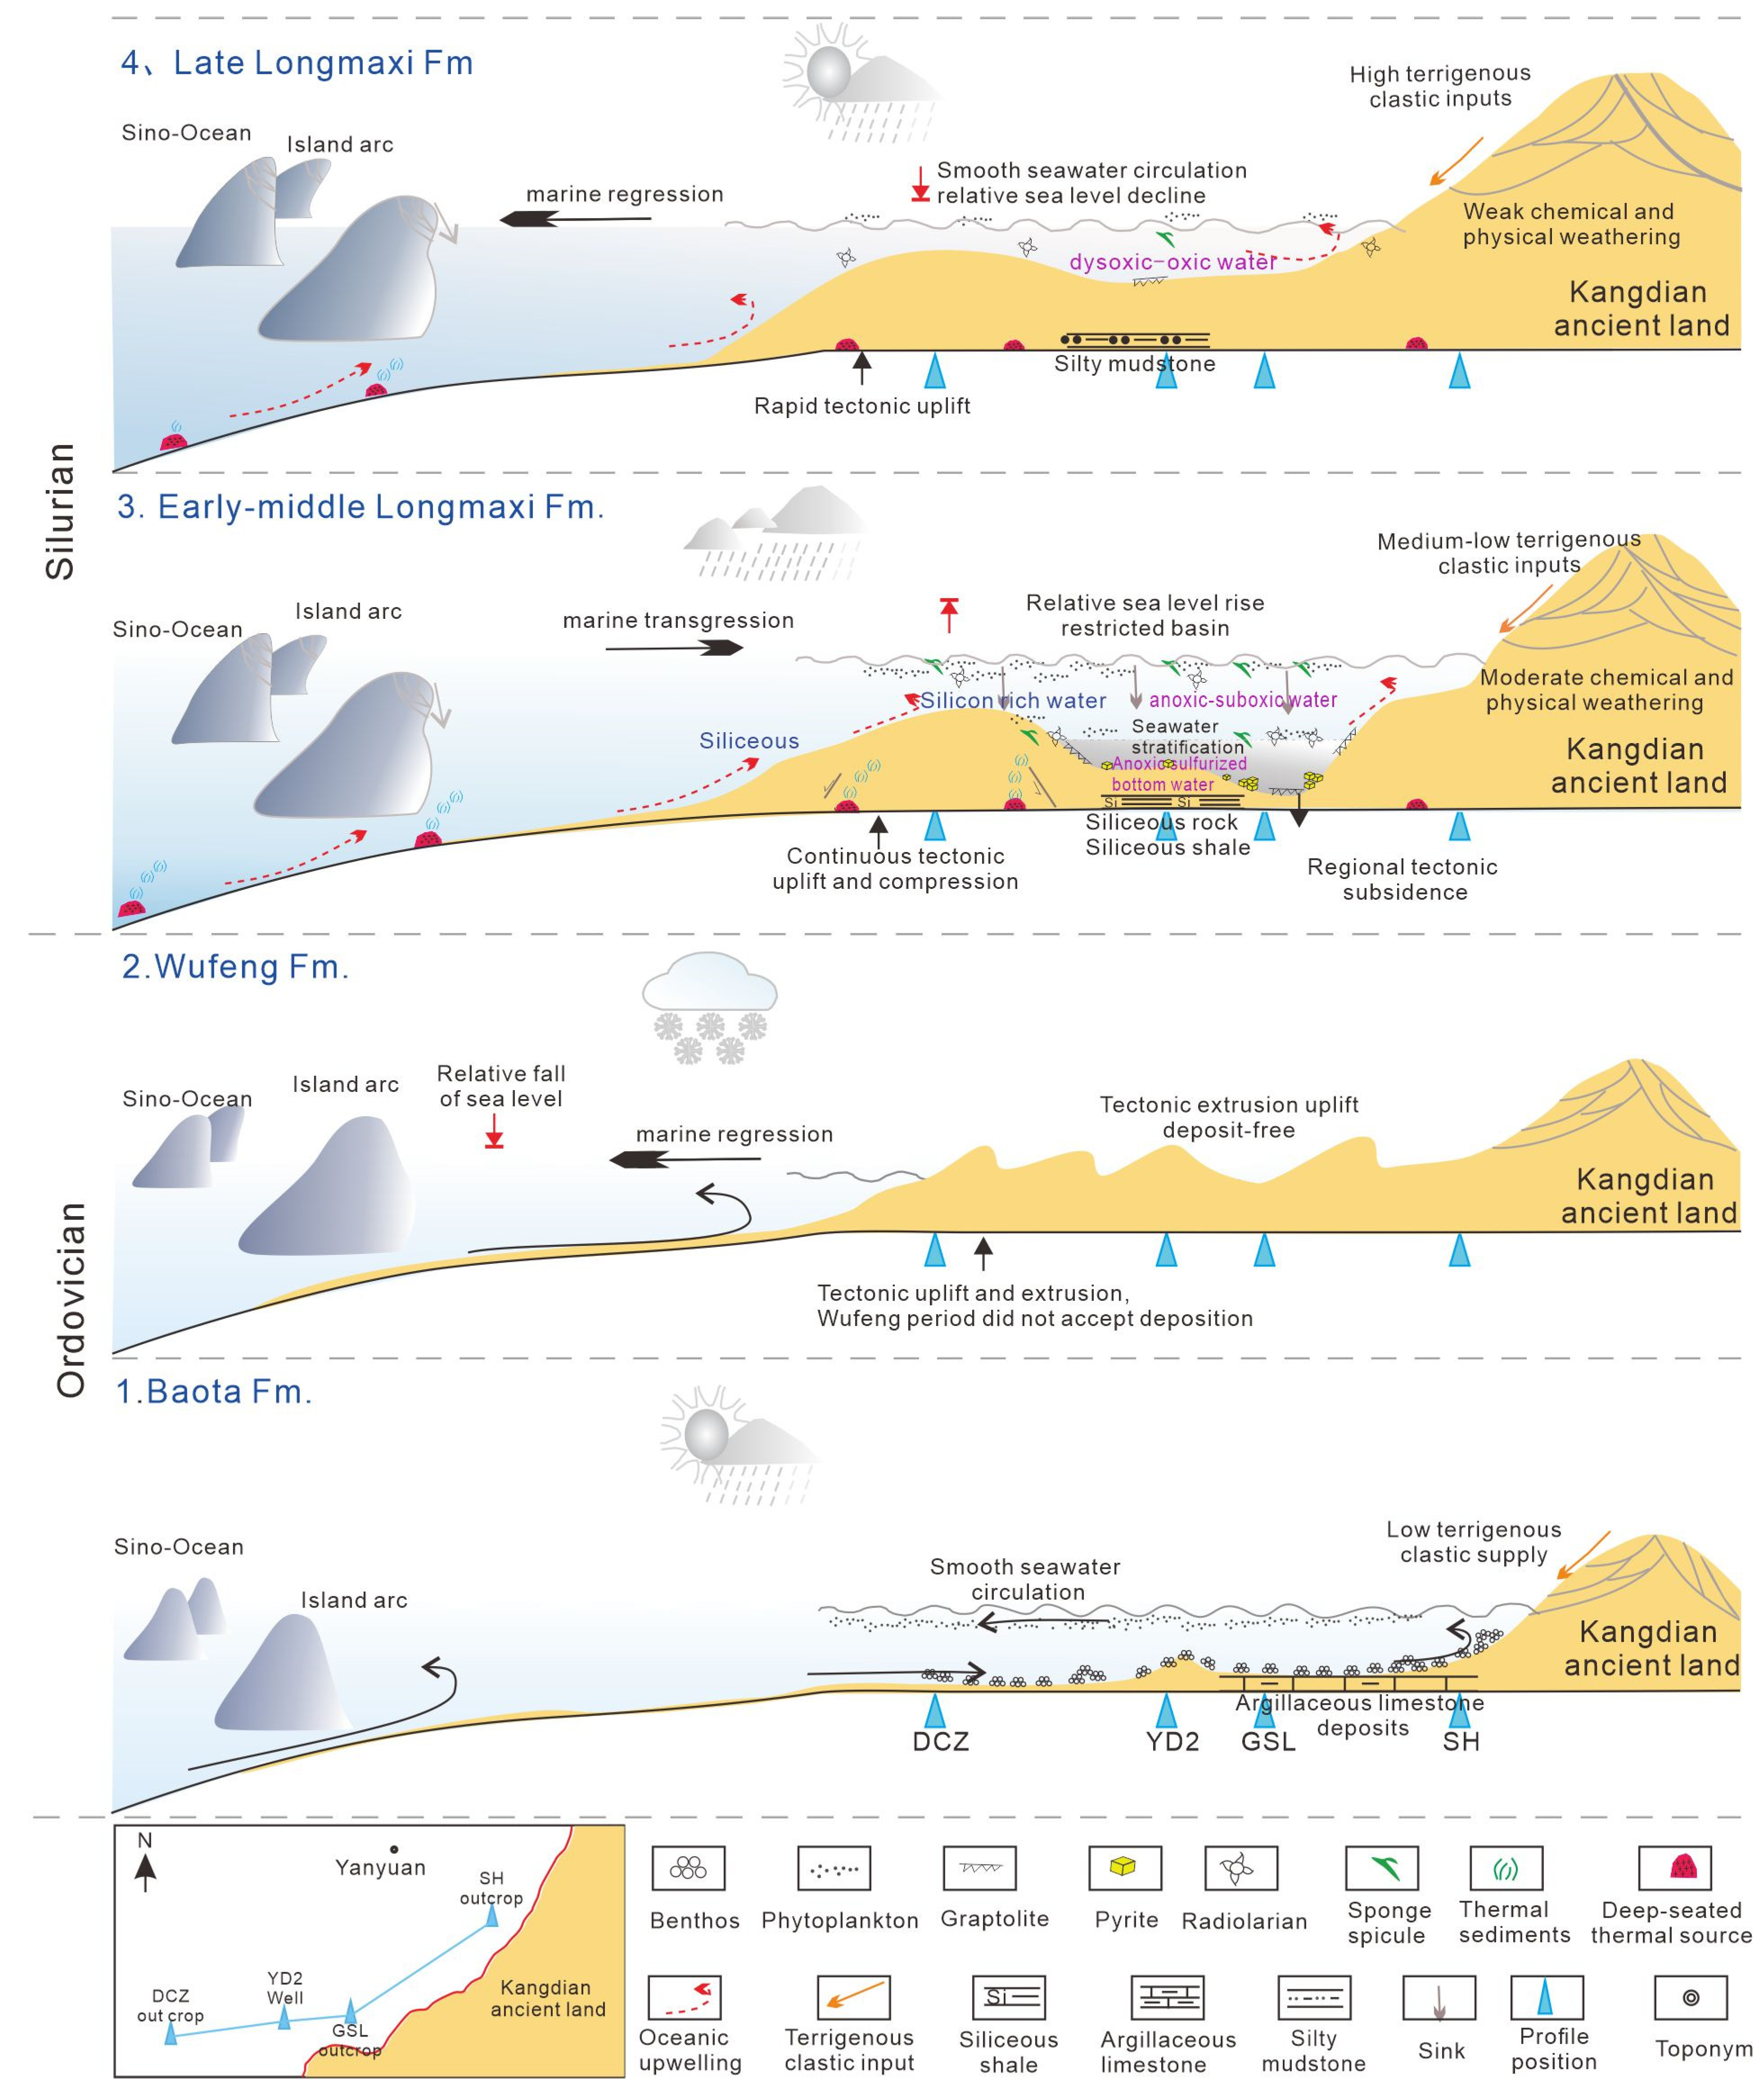
5.4. Sedimentary Tectonic Evolution Model and Its Geological Significance

The structure of the Yangtze platform is complex. Since the early Paleozoic, with the continuous northward subduction of the South China plate, the Yangtze platform has undergone intraplate deformation from the southeast to the northwest and has gradually bent downward to form a semi-restricted deep-water foreland basin, where the Wufeng Formation and the Longmaxi Formation black shale were deposited [48,49]. At this time, the northern margin of the Yangtze plate is still at the passive continental margin, while other regions are experiencing contraction [42]. The Yanyuan Basin is located at the southwest edge of the Yangtze plate, which is connected with the open ocean in the west and the Kangdian ancient land in the east. During the Longmaxi period, the western margin of the Yangtze platform was continuously uplifted, belonging to a passive continental margin environment [6,50], but the tectonic activity in the study area was significant, including volcanic activity. However, some samples show geochemical characteristics suggesting that they were derived from source rocks formed in an active continental margin and island arc setting. It is speculated that this may be related to the collision between the western oceanic crust and the Yangtze continental crust [5,7] or due to the influence of volcanism, hydrothermal fluid, and rising ocean currents, which caused the black shale to retain the geochemical composition of an active continental margin and island arc tectonic setting, which is consistent with the interpretations discussed above.
The Kangdian ancient land has been exposed for a long time, since the Phanerozoic [51], and is the main provenance supply area. The ancient land area adjacent to the Yanyuan Basin, such as the Xichang–Miyi area, mainly contains exposed Archean crystalline basement, whose lithology is mainly the “Kangding complex” [51,52]. The Kangding complex consists of two sets of rock series, one of which is plagioclase granite gneiss and quartz diorite gneiss of amphibolite facies—molasse facies; the other mainly consists of the plagioclase breccia and mica schist of medium–low grade metamorphic volcanic–sedimentary rock series [51]. As discussed above, the source rocks in the study area are more complex and mainly provided by the Archean crystalline basement of the Kangdian ancient land. In summary, we restored the sedimentary tectonic evolution model of the Longmaxi Formation in the Yanyuan Basin (Figure 9).
During the Baota period of the Middle Ordovician, the Yanyuan Basin was mainly a shallow sea carbonate sedimentary platform environment. The seawater circulation was good, the climate was warm and humid, and the weather was hot. It was suitable for the growth of organisms, such as benthos and plankton (bivalves, trilobites, brachiopods, foraminifera, etc.). The paleoproductivity was high, but the water body was an oxidizing environment, which was not conducive to the preservation of organisms after death, and it was difficult to form organic rich sedimentary rocks.
During the late Ordovician Gondwana Glacier Event, there was a short ice age in the Hirnantia period, which led to the mass extinction event, and the shell limestone of the Guanyinqiao Member of the Wufeng Formation was deposited [53,54]. This sedimentary record is found in and around the Sichuan Basin. However, the Yanyuan Basin was exposed and uplifted during the deposition of the late Middle Ordovician Baota Formation due to tectonic uplift, and no Wufeng Formation sediments were found.
Then, in the early stage of the Longmaxi period, the glacial period ended, the climate slowly warmed, the ice and snow melted, and large-scale transgression occurred. Meanwhile, the tectonic movement on the west side of the ancient land intensified, and the regional tectonics suddenly induced subsidence and, as a result, formed a restricted basin. At this time, the bottom seawater was anaerobic sulfurized, plankton, such as graptolites, were buried in the bottom seawater after death, and pyrite developed. In addition, the frequent rising ocean currents and hydrothermal fluid provided a large amount of nutrients, and algae thrived, resulting in the high primary paleoproductivity of the early Longmaxi Formation and the formation of organic-rich black siliceous shale deposits, which are a high-quality reservoir for shale gas exploration and development.
In the late period of the Longmaxi Formation, the continental margin was rapidly uplifted, and the relative sea level was lowered, forming an open basin environment. The anoxic–dysoxic environment was destroyed. A large amount of terrigenous sediment entered the basin, resulting in a reduction in primary paleoproductivity and a low TOC value.

6. Conclusions

The systematic study of the petrological and geochemical characteristics of the Longmaxi Formation black shale in the Yanyuan Basin shows the following:
  • The black shale in the study area has a high siliceous content and biosiliceous features such as radiolaria and spongy bone needles. A large number of graptolites and porphyritic interlayers are observed. Black shale has complex parent rock types and mixed origins that consist mainly of acidic felsic igneous rocks, with minor contributions from admixed intermediate–basic rocks. It is speculated that the parent rock was mainly provided by the Archean crystalline basement of the Kangdian ancient land in the eastern part of the study area, together with a small amount of deep-sea and island arc materials from the western ocean.
  • In the early Longmaxi period, the study area inherited the cold climate of the late Ordovician glacial period, and the chemical weathering was weak. In the late Longmaxi period, the climate gradually warmed, and chemical weathering was enhanced. During the whole Longmaxi period, the tectonic movement was intense, physical weathering was the main action, and the clastic sedimentary was the initial sedimentation under the active tectonic environment.
  • The western margin of the Yangtze platform continued to uplift during the Longmaxi period, as part of a passive continental margin environment, but the tectonic activity in the study area was obviously strong, and the source rock showed the attributes of an active continental margin and island arc environment. It is speculated that this may be related to the collision between the western oceanic crust and the Yangtze continental crust; mantle sources or deep-sea materials were deposited due to volcanism and hydrothermal or rising ocean currents, which caused the black shale to retain the geochemical composition of the active continental margin and island arc tectonic background.

Author Contributions

Conceptualization, Q.Z. and B.Z.; methodology, B.Z.; software, B.Z.; validation, Q.Y.; formal analysis, Q.Z. and B.Z.; investigation, Y.M., H.Z., J.K., A.Z., Y.Z., J.C. and X.F.; resources, Q.Y. and B.Z.; data curation, Q.Z.; writing—original draft preparation, Q.Z.; writing—review and editing, Q.Z. and B.Z.; supervision, B.Z. and Q.Y.; project administration, Q.Y.; funding acquisition, Q.Y., H.Z., J.K. and Y.Z. All authors have read and agreed to the published version of the manuscript.

Funding

This research was funded by the National Science and Technology Major special Project “Shale Gas Exploration and Evaluation Technology Test and Application Promotion”. Project No.: 2016ZX05034–004; project name: Study on Cambrian–Silurian structural–sedimentary difference, shale gas enrichment rules and regional optimization in the southern margin of Sichuan Basin Project No.: CCL2021RCPS0073ESN.

Acknowledgments

We thank the journal reviewers for their very constructive and helpful comments, which helped to improve the manuscript.

Conflicts of Interest

The authors declare no conflict of interest.

References

  1. Zou, C.; Zhao, Q.; Cong, L.; Wang, H.; Shi, Z.; Wu, J.; Pan, S. Development progress, potential and prospect of shale gas in China. J. Nat. Gas Ind. 2021, 41, 1–14, (In Chinese with English Abstract). [Google Scholar]
  2. Zhang, J.; Shi, M.; Wang, D.; Tong, Z.; Hou, X.; Niu, J.; Li, X.; Li, Z.; Zhang, P.; Huang, Y. Fields and directions for shale gas exploration in China. J. Nat. Gas Ind. 2021, 41, 12–22, (In Chinese with English Abstract). [Google Scholar] [CrossRef]
  3. Dong, D.; Liang, F.; Guan, Q.; Jiang, Y.; Zhou, S.; Yu, R.; Gu, Y.; Zhang, S.; Qi, L.; Liu, Y. Development model and identification evaluation technolo-gy of WufengLongmaxi Formation quality shale gas reservoirs in the Sichuan Basin. J. Nat. Gas Ind. 2022, 42, 96–111, (In Chinese with English Abstract). [Google Scholar]
  4. Zhang, Q.; Wang, J.; Yu, Q.; Wang, X.; Zhao, A.; Zhang, H.; Wang, Z. Black shales from the Longmaxi Formation in western Xikang-Yunnan ancient land: Geochemistry and geological implications. J. Sediment. Geol. Tethyan Geol. 2017, 37, 97–107, (In Chinese with English Abstract). [Google Scholar]
  5. Wang, Z.; Deng, M.; Cheng, J.; Zhang, H. Influence of fault and magmatism on oil and gas preservation condition to the west of Kangdian cncient continent. Taking Yanyuan basin as an example. J. Earth Sci. 2018, 43, 286–294, (In Chinese with English Abstract). [Google Scholar]
  6. Zhang, Q.; Wang, J.; Yu, Q.; Xiao, Y.; Zhang, B.; Wang, X.; Zhao, A. The Silicon Source and Sedimentary Environment of the Lower Silurian Longmaxi Formation in Yanyuan Basin, Western Edge of the Yangtze Platform. Geol. Rev. 2018, 64, 610–622, (In Chinese with English Abstract). [Google Scholar]
  7. Cheng, J.; Deng, M.; Wang, Z.; Yu, Q.; Zhang, H.; Liu, W.; Zhao, A.; Yang, G. Paleo-marine redox conditions and development model of high-quality source rocks of the Early Silurian on the West side of Kangdian Oldland: A case study of CYD2 well in Yanyuan area. J. Geol. Bull. China 2022, 41, 1813–1823. [Google Scholar]
  8. Zhu, M.; Chen, H.; Zhou, J.; Yang, S. Provenance of early Triassic in Yanyuan basin upper Yangtze and its im-plication for the tectonic evolution. J. Earth Sci. 2016, 41, 1309–1321, (In Chinese with English Abstract). [Google Scholar]
  9. Hu, S.; Guo, W. Rhombohedral structure framework and its junction structure style in Ninglang area of Yun nan. J. Mineral. Petrol. 1995, 15, 93–99, (In Chinese with English Abstract). [Google Scholar]
  10. Zhang, Q.; Xiao, Y.; Wang, X.; Yu, Q.; Wang, J.; Zhao, A.; Men, Y.; Zhou, Y. Geochemistry of the Longmaxi Formation mudstones of the southwest Sichuan Basin: Implications for provenance and source weathering. J. Geol. Rev. 2020, 66, 1393–1403, (In Chinese with English Abstract). [Google Scholar]
  11. Zhang, J.; Mou, C.; Zhou, K.; Feng, L.; Wu, H.; Chen, X. Geochemical characteristic of sandstones from the Mangbang formation in the Husa basin, Wstern Yunnan and its constraints on provenances and tectonic setting. J. Acta Geol. Sinaca 2017, 91, 1083–1096, (In Chinese with English Abstract). [Google Scholar]
  12. Liu, B.; Wang, X. Geochemistry of early paleozoic sedimentary rocks in the middle-lower reaches of the Yangtze river and its constrains on tectonic setting and provenance. J. Geotecton. Metallog. 2018, 42, 163–176, (In Chinese with English Abstract). [Google Scholar]
  13. Taylor, S.R.; Mclennan, S.M. The Continental Crust: Its Composition and Evolution. J. Geol. 1985, 94, 57–72. [Google Scholar]
  14. Sensarma, S.; Rajamani, V.; Tripathi, J.K. Petrography and Geochemical Characteristics of the Sediments of the Small River Hemavati, Southern India: Implications for Provenance and Weathering Processes. J. Sediment. Geol. 2008, 205, 111–125. [Google Scholar] [CrossRef]
  15. Marchig, V.H.; Gundlach, P.; Mller, P.; Schley, F. Some Geochemical Indicators for Discrimination Between Diagenetic and Hydrothermal Metalliferous Sediments. J. Mar. Geol. Deep. Sea Res. Part B Oceanogr. Lit. Rev. 1982, 50, 241–256. [Google Scholar] [CrossRef]
  16. Moradi, A.V.; Sari, A.; Akkaya, P. Geochemistry of the Miocene Oil Shale (Hanili Formation) in the Ankr-Orum Basin, Central Turkey: Implications for Paleoclimate Conditions, Source–Area Weathering, Provenance and Tectonic Setting. J. Sediment. Geol. 2016, 341, 289–303. [Google Scholar] [CrossRef]
  17. Zhang, Q.; Men, Y.; Yu, Q.; Wang, G.; Xiao, Y.; Zhang, H.; Zhao, A.; Zhou, Y.; Cao, J. Characteristics and Enrichment Genesis of the Platinum Group Elements (PGEs) in Organic Rich Shale of Wufeng and Longmaxi Formations of Upper Ordovician and Lower Silurian in the Sichuan Basin. J. Miner. 2022, 12, 1363. [Google Scholar] [CrossRef]
  18. Haskin, L.A.; Wildeman, T.R.; Haskin, M.A. Accurate Procedure for the Determination of the Rare Earths by Neu-tron Activation. J. Radioanal. Chem. 1968, 1, 337–348. [Google Scholar] [CrossRef]
  19. Roser, B.P.; Korsch, R.J. Provenance Signatures of Sandstone-Mudstone Suites Determined Using Discriminant Function Analysis of Major-Element Data. J. Chem. Geol. 1988, 67, 119–139. [Google Scholar] [CrossRef]
  20. Fedo, C.M.; Nesbitt, H.W.; Young, G.M. Unraveling the Effects of Potassium Metasomatism in Sedimentary Rocks and Paleosols, with Implications for Paleoweathering Conditions and Provenance. J. Geol. 1995, 23, 921–924. [Google Scholar] [CrossRef]
  21. Nesbitt, H.W.; Young, G.M. Petrogenesis of Sediments in the Absence of Chemical Weathering: Effects of Abra-sion and Sorting On Bulk Composition and Mineralogy. J. Sediment. 2010, 43, 715–717. [Google Scholar] [CrossRef]
  22. Mclennan, S.M.; Taylor, S.R. Sedimentary Rocks and Crustal Evolution: Tectonic Setting and Secular Trends. J. Geol. 1991, 99, 1–21. [Google Scholar] [CrossRef]
  23. Cullers, R.L. The Geochemistry of Shales, Siltstones and Sandstones of Pennsylvanian–Permian Age, Colorado, Usa: Implications for Provenance and Metamorphic Studies–Sciencedirect. J. Lithos 2000, 51, 1–203. [Google Scholar] [CrossRef]
  24. Du, Y.; Zhu, J.; Gu, S.; Xu, Y.; Yang, J. Sedimentary geochemical characteristics of Cambrian–ordovician siliceous rocks in the northern qilian orogenic belt and their implications for multi-island oceans. J. Sci. China Ser. D Earth Sci. 2007, 37, 1314–1329, (In Chinese with English Abstract). [Google Scholar]
  25. Zhang, Q.; Yu, Q.; Wang, J.; Xiao, Y.; Cheng, J.; Zhao, A.; Zhang, B. Application of ICP-MS to study the Rare Earth Element characteristics and sedimentary environment of black shale in the Longmaxi formation in the Southwestern Si-chuan Basin. J. Rock Miner. Anal. 2018, 37, 217–224, (In Chinese with English Abstract). [Google Scholar]
  26. Gromet, L.P.; Haskin, L.A.; Korotev, R.L.; Dymek, R.F. The North American Shale Composite: Its Compilation, Major and Trace Element Characteristics. J. Geochim. Cosmochim. Acta 1984, 48, 2469–2482. [Google Scholar] [CrossRef]
  27. Gadd, M.G.; Peter, J.M.; Jackson, S.E.; Yang, Z.; Petts, D. Platinum, Pd, Mo, Au and Re Deportment in Hy-per-Enriched Black Shale Ni-Zn-Mo-Pge Mineralization, Peel River, Yukon, Canada. J. Ore Geol. Rev. 2019, 107, 600–614. [Google Scholar] [CrossRef]
  28. Bai, Y.; Liu, Z.; Sun, P.; Liu, R.; Hu, X.; Zhao, H.; Xu, Y. Rare Earth and Major Element Geochemistry of Eocene Fi-ne-Grained Sediments in Oil Shale- And Coal-Bearing Layers of the Meihe Basin, Northeast China. J. Asian Earth Sci. 2015, 97, 89–101. [Google Scholar] [CrossRef]
  29. Fedo, C.M.; Young, G.M.; Nesbitt, H.W. Paleoclimatic Control On the Composition of the Paleoproterozoic Serpent Formation, Huronian Supergroup, Canada: A Greenhouse to Icehouse Transi-tion. J. Precambrian Res. 1997, 86, 201–223. [Google Scholar] [CrossRef]
  30. Condie, K.C. Chemical Composition and Evolution of the Upper Continental Crust: Contrasting Results From Surface Samples and Shales. J. Chem. Geol. 1993, 104, 1–37. [Google Scholar] [CrossRef]
  31. Cox, R.; Lowe, D.R.; Cullers, R.L. The Influence of Sediment Recycling and Basement Composition On Evolution of Mudrock Chemistry in the Southwestern United States. J. Geochim. Cosmochim. Acta 1995, 59, 2919–2940. [Google Scholar] [CrossRef]
  32. Bhatia, M.R.; Crook, K.A.W. Trace Element Characteristics of Graywackes and Tectonic Setting Discrimination of Sedimentary Basins. J. Contrib. Mineral. Petrol. 1986, 92, 181–193. [Google Scholar] [CrossRef]
  33. Roser, B.P.; Korsch, R.J. Determination of Tectonic Setting of Sandstone-Mudstone Suites Using SiO2 Content and K2O/Na2O Ratio. J. Geol. 1986, 94, 635–650. [Google Scholar] [CrossRef]
  34. Bhatia, M.R. Plate Tectonics and Geochemical Composition of Sandstones: A Reply. J. Geol. 1985, 91, 611–626. [Google Scholar] [CrossRef]
  35. Bhatia, M.R. Rare Earth Element Geochemistry of Australian Paleozoic Graywackes and Mudrocks: Provenance and Tectonic Control. J. Sediment. Geol. 1985, 45, 97–113. [Google Scholar] [CrossRef]
  36. Wang, Z.; Wang, J.; Fu, X.; Zhan, W.; Armstrong-Altrin, J.S.; Yu, F.; Feng, X.; Song, C.; Zeng, S. Geochemistry of the Upper Triassic Black Mudstones in the Qiangtang Basin, Tibet: Implications for Paleoenvironment, Provenance, and Tectonic Setting. J. Asian Earth Sci. 2018, 160, 118–135. [Google Scholar] [CrossRef]
  37. Sugitani, K.; Yamashita, F.; Nagaoka, T.; Yamamoto, K.; Minami, M.; Mimura, K.; Suzuki, K. Geochemistry and Sed-imentary Petrology of Archean Clastic Sedimentary Rocks at Mt. Goldsworthy, Pilbara Craton, Western Aus-tralia: Evidence for the Early Evolution of Continental Crust and Hydrothermal Alteration. J. Precambrian Res. 2006, 147, 124–147. [Google Scholar] [CrossRef]
  38. Tribovillard, N.; Algeo, T.J.; Baudin, F.; Riboulleau, A. Analysis of Marine Environmental Conditions Based Onmolybdenum–Uranium Covariation—Applications to Mesozoic Paleoceanography. J. Chem. Geol. 2012, 324–325, 46–58. [Google Scholar] [CrossRef]
  39. Algeo, T.J.; Tribovillard, N. Environmental Analysis of Paleoceanographic Systems Based On Molybdenum–Uranium Covariation. J. Chem. Geol. 2009, 268, 211–225. [Google Scholar] [CrossRef]
  40. McLennan, S.M. Relationships between the trace element composition of sedimentary rocks and upper continental crust. Geochem. J. Geophys. Geosyst. 2001, 2, 1–10. [Google Scholar] [CrossRef]
  41. Van de Kamp, P.C.; Leake, B.E. Petrography and Geochemistry of Feldspathic and Mafic Sediments of the Northeastern Pacific Margin. J. Trans. R. Soc. Edin. Earth 1985, 76, 411–449. [Google Scholar] [CrossRef]
  42. Mei, M.; Ma, Y.; Deng, J.; Hao, L. Tectonic Palaeogeographic Changes Resulting From the Caledo-nian Movement and the Formation of the Dianqiangui Basin: Discussion On the Deep Exploration Potential of Oil and Gas in the Dianqiangui Basin. J. Earth Sci. Front. 2005, 12, 227–236, (In Chinese with English Abstract). [Google Scholar]
  43. Nesbitt, H.W.; Young, G.M. Early Proterozoic Climates and Plate Motions Inferred From Major Element Chem-istry of Lutites. J. Nat. 1982, 299, 715–717. [Google Scholar] [CrossRef]
  44. Verma, S.P.; Armstrong-Altrin, J.S. Geochemical Discrimination of Siliciclastic Sediments From Active and Pas-sive Margin Settings. J. Sediment. Geol. 2016, 332, 1–12. [Google Scholar] [CrossRef]
  45. Verma, S.P.; Rivera-Gómez, M.A.; Díaz-González, L.; Pandarinath, K.; Amezcua-Valdez, A.; Rosales-Rivera, M.; Verma, S.K.; Quiroz-Ruiz, A.; Armstrong-Altrin, J.S. Multidimensional Classification of Magma Types for Altered Igneous Rocks and Application to their Tectonomagmatic Discrimination and Igneous Provenance of Si-liciclastic Sediments. J. Lithos 2017, 278–281, 321–330. [Google Scholar] [CrossRef]
  46. Zhao, Y.; Liu, Y.; Han, G.; Wu, L.; Li, W.; Wen, Q.; Liang, C. Geochemical characteristics of major elements in the Permian sandstones from the central and southern Great Xing’an range sand discriminations on their tectonic envi-ronment of the provence. J. Ji Lin Univ. Earth Sci. Ed. 2012, 42, 285–297, (In Chinese with English Abstract). [Google Scholar]
  47. Zhao, Z. Geochemical characteristics of rare earth elements and their applications in the study of the genesis of rocks and ore deposits. J. Earth Environ. 1978, 33, 3–13, (In Chinese with English Abstract). [Google Scholar]
  48. Fan, J.; Michael, J.M.; Chen, X.; Wang, D.; Zhang, Y.; Chen, Q.; Chi, Z.; Chen, F. Biostratigraphy of the black pencil stone shale of the Ordovician-Siliurian Longmaxi Formation in South China. J. Chin. Sci. Earth Sci. 2012, 42, 130–139, (In Chinese with English Abstract). [Google Scholar]
  49. Li, Y.; Zhang, T.; Ellis, G.S.; Shao, D. Depositional Environment and Organic Matter Accumulation of Upper Or-dovician–Lower Silurian Marine Shale in the Upper Yangtze Platform, South China. J. Palaeogeogr. Palaeoclimatol. Palaeoecol. 2017, 466, 252–264. [Google Scholar] [CrossRef]
  50. Nie, H.; Jin, Z.; Ma, X.; Liu, Z.; Lin, T.; Yang, Z. Graptolites zone and sedimentary characteristics of Upper Ordovician Wufeng formation -Lower Silurian Longmaxi formation in Sichuan basin and tis adjacent areas. J. Acta Petrolei Sin. 2017, 38, 160–174, (In Chinese with English Abstract). [Google Scholar]
  51. Liu, J.; Zhang, C.; Yang, Z. The metallogenic system and regularity in the southwestern margin of the yangtze platform. J. Chengdu Univ. Technol. (Sci. Technol. Ed.) 2004, 31, 185–188, (In Chinese with English Abstract). [Google Scholar]
  52. Luo, Y. The evolution of paleoplates in the Kang-Dian tectionic zone. J. Earth Sci. 1983, 3, 93–101, (In Chinese with English Abstract). [Google Scholar]
  53. Chen, X.; Rong, J.; Yue, L.; Boucot, A.J. Facies patterns and geography of the Yangtze region, South China, through the Ordo-vician and Silurian transition. J. Palaeogeogr. Palaeoclimatol. Palaeoecol. 2004, 204, 353–372. [Google Scholar]
  54. Li, S.; Xiao, K.; Wo, Y.; Long, S.; Cai, L. Developmental Controlling Factors of Upper Ordovician-Lower Silurian High Quality Source Rocks in Marine Sequence, South China. J. Acta Sedimentol. Sin. 2008, 24, 160–168, (In Chinese with English Abstract). [Google Scholar]
Figure 1. Diagram of depositional facies of the Longmaxi Fm of the Middle and Upper Yangtze region (a); geological sketch of Yanyuan Basin (b).
Minerals 13 00194 g001
Figure 2. Stratigraphic correlation map of Longmaxi Formation in Yanyuan Basin.
Minerals 13 00194 g002
Figure 3. The sampling location in the Longmaxi Formation Stratigraphic column and the Ternary diagram of mineral composition.
Minerals 13 00194 g003
Figure 4. The characteristics of the black shale of the Longmaxi Formation. (a) Siliceous rocks in the lower part of longmaxi Formation. (b) Radiolarian, thin section characteristics. (c) Pyrite framboids, SEM. (d) Graptolite photo.
Minerals 13 00194 g004
Figure 5. Chondrite-normalized (a) and NASC-normalized (b) REE patterns of the Longmaxi Formation in the Yanyuan Basin.
Minerals 13 00194 g005
Figure 6. The source rock discrimination diagrams for the Longmaxi Formation black shale in the Yanyuan Basin (a); (b) base map from [33]; (c) base map from [34]; (d) base map from [36].
Minerals 13 00194 g006
Figure 7. Palaeoclimate discrimination diagram of the Yanyuan Basin. The CIA–ICV diagram (a) and A–CN–K diagram (b) of the study area base map from [14,16]. Stars: A—andesite; B—basalt; F—felsic igneous rock; G—granite; UCC—upper continental crust.
Minerals 13 00194 g007
Figure 8. Tectonic setting discrimination diagrams for the Longmaxi Formation from the Yanyuan Basin. (a) Base map from [33]; (b,c) base maps from [35]; (d) base map from [32]. PM—passive continental margin; ACM—active continental margin; CIA—continental island arc; OIA—oceanic island arc.
Minerals 13 00194 g008
Figure 9. Sedimentary tectonic evolution model of the Yanyuan Basin. (1) The Ordovician Baota period: a shallow sea carbonate platform developed and experienced progressive uplift. (2) The Ordovician Wufeng period: the study area was uplifted and denuded, and no sediment was found. (3) Early stage of the Silurian Longmaxi period: glacial period ended and the global sea level rose, and regional tectonic subsidence formed a restricted basin, under the cold climate of the late Ordovician, with weak chemical weathering and less input of terrigenous detritus. (4) Late stage of the Silurian Longmaxi period: sudden tectonic uplift results in relative sea level falling and the climate was gradually warming and chemical weathering increased and influenced the increment of terrigenous detrital.
Minerals 13 00194 g009
Table 1. Mineral compositions by X-ray diffraction analysis of samples from the Longmaxi Formation from the Yanyuan Basin (10−2).
Sample No.QuartzPotassium FeldsparPlagioclaseCalciteDolomitePyriteClay
Y161.81.4 26.22.5 4.6
Y289.50.8 2.73.5 2.1
Y362.7 1.725.93.2 6.5
Y488.8 4.54.8 1.9
Y564.4 2.419.88.8 4.6
Y649.4 5.436.51.6 7.1
Y780.91.34.00.72.31.59.3
Y877.01.75.0 2.114.2
Y976.42.84.7 16.1
Y1050.19.73.69.913.53.010.2
Y1148.112.05.47.57.62.910.9
Y1270.51.75.51.01.54.615.2
Y1378.21.74.01.34.12.87.9
Y1462.51.53.611.211.91.77.6
Y1552.910.55.71.513.72.513.2
Y1656.86.87.1 11.33.314.7
Y1760.33.95.01.913.03.412.5
Y1881.02.18.4 8.5
Y1988.31.54.4 5.8
Y2068.12.610.2 16.6
Y2142.82.43.730.19.03.09.0
Y2282.11.76.2 10.0
Y2327.13.28.524.719.6 16.4
Y2433.54.212.15.220.6 18.2
average value64.73.75.612.48.52.810.1
Table 2. Major element (10−2) abundances and some associated parameters of Longmaxi mudstones from the Yanyuan Basin.
SampleTOCSiO2Al2O3Fe2O3CaOMgOK2ONa2OTiO2P2O5MnOL.O.IICVCIA
Y12.9967.302.101.3012.890.370.830.140.100.060.6313.481.9861
Y22.3488.261.710.651.840.630.540.140.070.040.054.811.8962
Y31.4766.831.450.5814.900.500.300.570.060.130.1513.712.8640
Y41.4086.221.390.753.790.960.320.260.050.040.055.893.0754
Y51.7665.862.130.6412.571.960.470.270.070.070.1415.053.3360
Y61.7256.242.801.1618.770.880.780.580.110.040.2617.782.2350
Y72.6887.253.461.270.950.541.040.500.150.060.024.941.5056
Y83.0583.255.301.900.170.521.700.080.250.070.015.860.9472
Y94.1282.025.931.120.070.491.670.660.250.060.006.870.8767
Y100.9167.335.821.957.402.592.820.700.280.070.1210.052.3652
Y112.2671.008.042.274.301.433.490.770.330.080.068.241.4856
Y124.2178.746.622.310.850.891.850.690.280.100.027.291.2761
Y132.8983.314.251.461.320.941.300.530.180.070.025.791.5957
Y142.4075.824.441.185.311.681.340.580.170.070.078.821.9657
Y152.3869.788.272.393.272.383.000.860.360.090.068.331.7258
Y163.1771.047.972.622.982.472.840.860.380.120.058.921.8157
Y173.3171.097.042.623.352.552.520.260.310.090.059.801.7466
Y185.1781.945.261.370.110.381.610.240.260.060.007.680.8371
Y195.9884.823.770.590.130.161.050.650.140.040.007.830.8862
Y205.2377.458.711.190.250.072.550.040.430.060.008.660.5075
Y211.3454.404.241.2018.031.661.390.490.180.060.1617.202.0258
Y221.8187.664.531.440.120.241.350.730.210.050.013.641.0162
Y232.3248.579.122.4714.272.303.161.260.390.110.0717.751.7155
Y242.8358.2612.023.165.042.344.481.660.530.360.0611.371.5954
average value2.8273.525.271.575.531.211.770.560.230.080.099.571.7159.20
Table 3. Trace element and rare element (10−6) abundances and some associated parameters of Longmaxi mudstones from the Yanyuan Basin.
SampleMoSbBaAsSrScCoThUCrΣREELREEHREELREE/HREEδEuδCeLaN/YbNTh/U
Y1176.0274457.6770.33.187.322.247.6761.530.5022.338.172.730.850.850.250.29
Y222.20.8365595.391.41.951.61.955.329.524.1319.664.474.401.440.860.520.37
Y311.20.753785.832372.661.932.045.8316.299.4786.4413.036.630.790.791.210.35
Y412.70.779264.2651.11.971.971.524.2618.932.1127.134.985.451.320.850.840.36
Y510.41.17895.082093.82.342.325.0818.785.4574.4710.986.780.820.791.210.46
Y618.21.638814.662063.375.493.074.6622.498.8387.8610.978.010.760.781.460.66
Y7141.5612613.3746.23.813.973.923.3737.861.4154.307.117.640.950.851.351.16
Y817.22.217934.2627.94.984.536.174.2649.768.5360.737.807.790.780.861.181.45
Y918.21.5222623.3733.54.240.787.063.3772.982.9676.486.4811.800.910.861.792.09
Y106.741.5420463.662405.422.987.313.6627.9110.8795.9914.886.450.680.890.882.00
Y1113.71.857456.451086.636.637.46.4553.296.5983.1013.496.160.750.900.761.15
Y1228.62.1519206.9940.65.888.527.556.9973.6110.0897.9812.108.100.770.851.431.08
Y1314.81.4117253.9850.94.324.615.193.9845.869.0160.688.337.280.900.851.191.30
Y1410.21.4824683.3877.23.854.994.663.3827.369.7760.679.106.670.840.851.051.38
Y1512.31.6833344.0789.66.326.787.564.0769.6106.0092.6813.326.960.660.881.011.86
Y1621.92.6183736.1779.77.537.396.516.1796.190.3275.7514.575.200.670.930.601.06
Y1723.32.5790826.492.57.428.555.216.468.383.8370.9312.905.500.710.930.620.81
Y1836.33.0915465.1128.13.981.684.545.1164.782.6775.746.9310.930.780.841.780.89
Y1913.71.329903.9826.62.950.433.273.9840.354.1249.594.5310.951.200.871.680.82
Y2025.41.7135574.9834.46.741.25.624.9883.5129.15117.4111.7410.000.680.871.541.13
Y217.781.0815542.992914.764.334.842.9926.4116.49102.9413.557.600.690.831.401.62
Y2211.11.4427992.6832.14.073.24.052.6839.147.8544.053.8011.601.040.921.981.51
Y2311.11.5414837.61378.659.259.277.660.5152.83137.4215.418.920.640.961.411.22
Y242.291.0228284.2568.311.67.979.674.2598.892.4480.5411.906.770.780.890.862.28
average value15.851.7829894.8598.685.004.525.124.855083.1473.1210.027.510.850.861.171.14
UCC1.500.205501.50350.0011.0010.0010.702.8035
EF30.4425.701615.570.811.311.301.384.994
UCC value from [13]; LREE/HREE = (La + Ce + Pr + Nd + Sm + Eu)/(Gd + Tb + Dy + Ho + Er + Tm + Yb + Lu), δCe = CeN/(LaN × PrN)1/2, δEu (δEu = EuN/) SmN × GdN)1/2), N is chondrite standardization [18].
Disclaimer/Publisher’s Note: The statements, opinions and data contained in all publications are solely those of the individual author(s) and contributor(s) and not of MDPI and/or the editor(s). MDPI and/or the editor(s) disclaim responsibility for any injury to people or property resulting from any ideas, methods, instructions or products referred to in the content.

