Article

Uranium in Fluorite, a Case Study: The La Azul Fluorspar Deposit, Taxco, Guerrero, Mexico

by
Teresa Pi-Puig
1,2,*,
Jesús Solé
1,2,* and
Leticia Alba-Aldave
1
1
Instituto de Geología, Universidad Nacional Autónoma de México (UNAM), Cd. Universitaria, Coyoacán, Mexico City 04510, Mexico
2
Laboratorio Nacional de Geoquímica y Mineralogía (LANGEM), Universidad Nacional Autónoma de México (UNAM), Cd. Universitaria, Coyoacán, Mexico City 04510, Mexico
*
Authors to whom correspondence should be addressed.
Minerals 2023, 13(12), 1495; https://doi.org/10.3390/min13121495
Submission received: 19 August 2023 / Revised: 19 November 2023 / Accepted: 21 November 2023 / Published: 29 November 2023

Abstract

:
Uranium can be found in the Earth’s crust in different reservoirs, with igneous rocks being the primary source of this element from which many types of secondary deposits are formed. Fluorspar deposits generally do not contain uranium, but in some cases, fluorite can carry both uranium in solid solutions and inclusions of uranium minerals. We studied the concentration (ICP-MS), composition (electronic microprobe), and spatial distribution (microscopy and auto-radiography) of elemental uranium and uranium minerals at different scales (microscopy and auto-radiography in fluorite from the La Azul fluorspar deposit (Taxco, Mexico) to assess the origin of uranium and its significance in this ore deposit. Auto-radiography images with the CR-39 detector were found to be impressive in their ability to elucidate uranium distribution at the millimeter scale. The limit between the solid solution of elemental uranium in natural fluorite and the appearance of uranium oxides as inclusions appeared to be between 20 μg g−1 and 40 μg g−1 bulk uranium concentration in this fluorspar ore. The maximum concentration of U in fluorite from the La Azul deposit was about 100 μg g−1. Using Raman spectroscopy and microprobe analysis, we identified the micro-inclusions of uranium minerals as uraninite (of the pitchblende variety); its composition suggested a hydrothermal origin for this fluorspar deposit. We also calculated a chemical age that can be compared with the previously published regional geology and isotopic (U-Th-Sm)/He ages in fluorite. Micro-thermometric studies of fluid inclusions were carried out in different samples of uranium-rich fluorite to identify the nature and origin of the mineralizing fluid and the precipitation mechanisms of uranium minerals. We concluded that the uranium-rich fluorite precipitated in the initial phases of mineralization from a reducing fluid, with low salinity (<8% NaCl eq.) and an intermediate temperature (110–230 °C), and that the presence of organic compounds and sulfides (mainly pyrite) favored the simultaneous precipitation of uraninite (pitchblende variety) and fluorite.

1. Introduction

Uranium and thorium are found as trace elements in common rocks. The mean U and Th concentrations in the upper Earth’s crust are about 2 µg g−1 and 10 µg g−1, respectively [1]. Their concentrations in the Earth’s mantle, on the other hand, are much lower. There are many (U/Th)-bearing minerals, see compilations made by the authors of [2,3,4,5], but rock-forming minerals only allow traces of U and Th in their structure. U and Th concentrations in non-mineralized rocks commonly come from minute inclusions of (U/Th)-rich minerals (e.g., apatite, allanite, uraninite, monazite, and zircon).
The intimate association of purple fluorite with uranium minerals has been recognized in different deposits; this association is typical of epigenetic hydrothermal systems. The dark-blue/violet color of fluorite has been attributed to the effects of radioactivity, as postulated by Refs. [6,7,8,9,10,11], which generates a disturbance in its crystal lattice rather than as a result of its chemical composition.
The association of uranium and other lithophile trace elements (e.g., Th, Mo, Be, Zn, V, and As) in fluorite ore deposits appears to be frequently related to the alkalinity of the source rocks [12,13,14,15,16]. This explains the close relationship of uranium-rich fluorite with highly differentiated alkaline volcanic rocks, e.g., [17,18]. This association has also been widely connected to recent volcanic activity (tertiary to present) and extensional tectonism [17,18,19,20,21,22,23]. It is worth mentioning that fluorite deposits are commonly related to this type of magma in areas of thickened crust, e.g., [20,21,22,23,24], possibly due to crustal contamination processes.
Many authors have recognized that fluoride may play a key role in the hydrothermal transport of uranium [13,15,25,26]. More recently, Li et al. [27] demonstrated that U(IV)–F complexes (reducing conditions) and uranyl–F complexes (oxidizing conditions) predominate under low temperatures (T < ~200 °C), while chloride complexes predominate in acidic solutions above ~250 °C. Additionally, Holland and Malinin [28] experimentally demonstrated that reactions among sulfide minerals create microenvironments that result in the efficient scavenging of U from the solution.
The calcium that permits fluorite precipitation in these deposits mainly comes from the interaction of the acidic fluid with the box rocks, e.g., [29]. In these stages of uranium-rich fluorite precipitation, hematite is not precipitated; the coprecipitation of uranium and sulfide minerals confirms the existence of reducing conditions [28]. As the fluid oxidizes, it depletes uranium, e.g., [30], and precipitates hematite and kaolinite [31,32].
This work employed optical and electron microscopy, Raman spectroscopy, geochemistry, and autoradiography to characterize uranium and thorium distribution in the epithermal La Azul fluorspar deposit. Fluid inclusion micro-thermometry was also introduced to decipher the nature and origin of the mineralizing fluids, as well as the precipitation mechanisms of uranium-rich fluorite. This article’s main goals were: quantifying uranium concentration in the different parts of the fluorite samples using a combination of punctual uranium measurements and the autoradiography method, determining the mineralogical nature of uranium-rich inclusions, and identifying the conditions of their formation.

2. Geological Setting and Mineral Paragenesis

The La Azul fluorite deposit is located about 6 km NE of the city of Taxco (Guerrero State, México). This region (Figure 1) holds an important ore district, of which the silver–lead–zinc mines of Taxco are the most renowned. Regional geology can be described from the bottom-to-top stratigraphic sequence. The oldest unit is the Taxco Schist of Lower Cretaceous age [33]; it was formed by sedimentary and volcanic rocks in greenschist facies, and nonconformity distinguishes it from the Morelos limestones [34]. This is a regional-scale formation, whose age probably ranges from Aptian to Santonian. The Mexcala Formation overlays this unit and was formed by terrigenous sediments of Late Cretaceous age. A red conglomerate, probably from the Balsas Group [35], covers the Mexcala Formation, and locally, it was deposited directly over the Morelos limestones. Its age is uncertain, but it is probably Paleogene due to its stratigraphic position. Eocene sandstones, conglomerates, and siltstones cover the area’s northern part and an Oligocene conglomerate outcrop west of the city of Taxco. An Eocene volcanic succession [36,37], formed by rhyolites, ignimbrites, and an andesites outcrop, is located in the northern part of Taxco city, the highest topographic relief in the area.
The La Azul fluorspar deposit has been linked to Cenozoic volcanic rocks [38] and is found adjacent to a normal fault that juxtaposes the Cretaceous limestones of the Morelos Formation with the volcanic succession (Figure 1). Volcanic wall rocks were locally silicified, fluoritized, or altered to sericite and kaolinite.
The La Azul fluorite ore deposit paragenesis (schematized in Figure 2) is composed of fluorite with variable amounts of calcite, barite, calcedony, and quartz. Pyrite, marcasite, celestite, hematite, manganese oxides, and kaolinite are the main accessory minerals. Individual crystals of chlorargyrite (AgCl), cinnabar (HgS), and realgar (As4S4) have been identified via scanning electron microscopy in the purple-colored fluorites. Iron and magnesium oxides are late minerals occasionally associated with altering sulfides (mainly pyrite).
Fluorite crystal sizes range from several micrometers to about 2 cm. Fluorite crystals in La Azul display various colors, including white, gray, yellow, green, brown, and purple. The purple varieties are uranium-rich, as has been described previously in a number of deposits around the world [9,39,40], and were the study objectives of this work. In the La Azul mineralization, several of these uranium-rich fluorites also contains H2S, which can be easily identified by its characteristic rotten egg smell, and methane, which was identified via mass spectrometry [39].
Albeit mineralogically uncomplicated, this deposit exhibits a noticeable textural variety (Table 1). The first fluorite (F1) generations present massive, banded, brecciated, or botryoidal textures. Late fluorites (F2) mainly present secondary textures (predominantly nodules, cavity filling, and late overgrowths). These fluorites are not associated with carbonate replacement and are, therefore, poorer in Sr and richer in lanthanides. Genetically, they are related to the entry of new fluids into the system or to the remobilization of previously formed fluorites. In the main body of La Azul, there is a predomination of either massive fluorite composed of very small crystals or visible, well-shaped crystals, in which we can observe growth textures. Massive fluorite is frequently associated with microcrystalline silica. The darkest fluorite is always early (F1) in the paragenetic sequence; it occurs replacing the carbonate; it is also rich in strontium. Upon fracture, it gives off a very pronounced smell of H2S and is frequently associated with the uranium minerals that produced dark haloes in adjacent fluorite (Figure 3). The hydrothermal alterations of the La Azul deposit are kaolinization (argillic alteration), oxidation (generally formation of hematite), and silicification (mainly with the formation of chalcedony). However, all these alteration processes occur in later episodes in the paragenetic sequence than those related to the formation of the uranium-rich fluorite.
In previous studies conducted by the first two authors of this study, several episodes of mineralization have been recognized via combined geochemistry and (U-Th-Sm)/He dating [38,39]. The early uranium-rich fluorite mineralization has been dated at ~32 Ma, with later fluorite precipitation as young as ~10 Ma [38]. There is a good agreement between the ages of volcanic rocks and early fluorite. The first stage of mineralization was related to limestone replacement; later stages have been linked to the input of new fluids or remobilization.

3. Materials and Methods

3.1. Bulk Fluorspar Uranium Concentration via ICP-MS

Uranium, thorium, and samarium contents in fluorite were determined via inductively coupled plasma mass spectrometry (ICP-MS) using 200 mg aliquots. The aliquots were extracted with a diamond drill bit from the areas with the purest fluorite. These areas were selected using a stereoscopic microscope. The material obtained with the drill was homogenized with an agate mortar and analyzed to determine U, Th, and Sm. Rhodium was employed as an internal standard and international reference materials were used as external standards. Fluorite samples were handpicked under a binocular microscope to ensure homogeneity and purity. Fluorite was crushed in an alumina mortar and desiccated for 12 h at 110 °C. Then, the samples were weighed, fused with alkaline reagents, and dissolved in nitric acid and distilled water. U and Th blanks were 0.01 µg g−1 and 0.05 µg g−1, respectively. Duplicate measurements were carried out in several samples to check for U and Th inhomogeneities. The maximum relative error was assumed to be ~5%, based on the analysis of reference materials. The precision and accuracy of the results have been determined with W2 and WMG-1 as certification materials and the following calibration standards: MAG1, BIR1, DNC1, GXR-2, LKSD-3, Mica-Fe, GXRI, SY3, and STM1. Analytical blanks lower than 1 µg g−1 were always reported in all elements. The relative uncertainty of uranium, thorium, samarium, and strontium measurements was below 5%.
Chemical data from uranium-rich inclusions, measured with an electron microprobe, can be used to calculate a chemical age of such inclusions. Considering the three radioactive chains that generate radiogenic Pb (235U, 238U, and 232Th) and 238U as 99.275% and 235U as 0.7196% of total uranium nowadays, we can obtain the following equation for the chemical age of uraninite:
P b = U 0.992745 e λ 238 t 1 + 0.0072 e λ 235 t 1 + T h e λ 232 t 1
The first term provides the lead generated by the decay of 238U to 206Pb, the second from 235U to 207Pb, and the third from 232Th to 208Pb. Lambda constants are equal to λ238 = 0.000155125 Ma−1, λ235 = 0.00098485 Ma−1, and λ232 = 0.000049475 Ma−1 [41]. Transforming Equation 1 for use with wt.% of PbO, UO2, and ThO2 measured using the electron microprobe, and assuming ages lower than 100 Ma and samples without Th, Equation (1) can be simplified to provide:
U r a n i n i t e   a g e   M a 7510   P b O U O 2

3.2. Alpha-Autoradiography

Alpha particles emitted from inside the geological sample are stopped within a very short range, no more than 50 µm in common minerals. This fact implies that radiation detectors must be placed in close contact with the polished face of the sample to detect the emissions efficiently. As alpha particles emitted from the sample’s surface can only travel a few mm in air, a right planar contact is necessary to reproduce the alpha distribution and texture in detail. Experimental work with the CR-39 substance (allyl diglycol polycarbonate, also named Columbia Resin), used extensively in optics and aerodynamics, proved that this material is an extremely sensitive alpha detector for U, Th, and Rn radioactive decay chains. As a result, CR-39 is the more commonly used material for detecting radon, protons, neutrons, heavy ions, and many other applications. However, there have been very few attempts to use CR-39 in the field of earth sciences, with the most remarkable being that of [42] for the characterization of U distribution in granites from the South of England. The detection process consists of three steps: exposure to radiation, chemical etching, and reading (either manually or automatically).
For this experiment, we selected 0.6-mm-thick plates of CR-39 that can be cut into appropriate sizes for each sample with simple mechanical tools. However, it is necessary to be very careful with CR-39 as it is easily scratched, permanently damaging the detection surface. The detector was placed on the polished surface of each sample inside a low vacuum container or one filled with nitrogen to avoid the radon in the environment that would increase the background.
As an integrative passive detection method, the detectors must remain in contact with the samples for two or three months to have an adequate track density for U contents from 1 to 100 µg g−1. After exposure, the CR-39 was chemically etched in a 6M KOH solution at 60 °C ± 1 °C [42,43]. The etching process was completed in four steps of five hours each to have control of the autoradiography image. After each chemical step, the detectors were washed with distilled water for fifteen minutes and dried with absorbent paper.
The autoradiographies have been scanned at high resolution and digitally processed to increase contrast. All images were enhanced following the same procedures. The etched autoradiography of the alpha emitters in the CR-39 was visually compared to the scanned polished surfaces of the samples, and the image was processed to have a map density.

3.3. Microprobe Analysis of Uranium Inclusions

Inclusions of U/Th minerals in the La Azul fluorite have less than 10 μm diameters (Figure 2). Therefore, usual chemical procedures are impossible, so we used electron microprobe (EMP), energy-dispersive spectroscopy (EDS), and wavelength-dispersive spectroscopy (WDS) analyses for chemical characterization. Two EMPs were used, namely a Jeol JXA 8900 from the Instituto de Geofísica (Universidad Nacional Autónoma de México, Mexico) and a CAMECA SX-50 from the Centres Científics i Tecnològics (CCiTUB, Universitat de Barcelona, Barcelona, Spain).
Electron microprobe (EDS and WDS) analyses were carried out in uranium-rich inclusions from four polished thin sections of different samples. Representative analyses of U/Th/Sm-rich inclusions are shown in Table 2. Natural minerals and synthetic phases were used as reference materials (kaersutite, plagioclase, uranium metal, thorium metal, galena, and apatite). Instrumental conditions were an accelerating voltage of 20 kV, a beam current of 15 nA, and a beam diameter of about 1 μm. The signal integration time was 40 s for each element.
The relative accuracy and precision of the electron microprobe analyses were difficult to evaluate, even using the reference materials, as the studied inclusions were very small, not much larger than the spatial resolution of the microprobe, which was limited to about 2 μm due to the spreading of the beam within the sample. For this reason, we only analyzed the largest inclusions (>2 μm).

3.4. Micro-Raman Spectroscopy

The analyses were carried out in a WiTec AlphaSNOM micro-Raman confocal spectroscope belonging to the Laboratorio Universitario de Caracterización Espectroscópica (LUCE) of the Instituto de Ciencias Aplicadas y Tecnología (Universidad Nacional Autónoma de México, Mexico). The fluorite samples were analyzed using a 100× objective, and a 532 nm green laser was used as an excitation source travelling in optical fiber from the source to the microscope, with the laser power being 50 mW. A diffraction grating with 600 groves mm−1 was used to analyze the samples from 0 cm−1 to 3800 cm−1. The exposure time was 2 s, and 10 accumulations were obtained per analysis.

3.5. X-ray Diffraction

X-ray diffraction was carried out at the Instituto de Geología, UNAM, using a Shimadzu XRD-6000 diffractometer equipped with a Cu tube, 1° slits, 5.5° soller slits, 0.15 mm resolving slit, a graphite monochromator, and a scintillation counter. All the data were acquired via a step scan and sample rotation.

3.6. Measurement of Fluorine in Volcanic Rocks

The measurement of fluorine in the nearby volcanic rocks was carried out using Mettler Toledo ion-selective electrodes. The electrodes respond to changes in the activity of a specific ion in the solution (fluorine in our case). A total of 200 mg of the sample was weighed and placed in a platinum crucible in which 250 mg of flux (NaOH) had previously been melted. The crucible was then placed in a muffle at 600 °C for 30 min, allowed to cool, and distilled water was added to remove the molten material from the container, which was transferred to a plastic container where 5 mL of ultrapure concentrated nitric acid was added. Finally, 6 g of ammonium citrate was added to the solution to eliminate the Al and Fe complexes that could interfere with the measurement, and a concentrated NaOH solution was added drop by drop until a pH of 6.1 was obtained. The solution was transferred to a flask, and the measurement was calibrated with 1 ppm and 10 ppm standards.

3.7. Microthermometry of Fluid Inclusions in Uranium-Rich Fluorite

For the microthermometric study of fluid inclusions, nine double-polished thick (about 100–150 µm) sections [44,45] of uranium-rich fluorite were made. Measurements were performed with a LINKAM THMS stage. Salinities were calculated according to the Bodnar model [46]. Several microthermometric calculations were obtained using the FLINCOR program [47].
As fluorite is a mineral with exfoliation, the measurements were carried out under very low heating rates, and the homogenization temperature (Th) was always measured before the cooling temperatures to avoid decrepitations. The following data were measured: homogenization temperature (Th), ice melting temperature (I), and eutectic temperature (Te). The homogenization temperatures have a precision of 2%, and the ice melting temperatures have a maximum error of 0.2%.

4. Results

4.1. Uranium Concentration and Distribution in Fluorspar Samples

A non-uniform distribution of uranium was observed along the crystal’s growth zones; in the parts adjacent to these zones, the density of dislocations (metamictic damage) was observed (Figure 3).
In the lattice of fluorite crystals, uranium is distributed uniformly in the form of impurity. When the content of this uranium is high, and during the growth of the fluorite crystals, the excess of uranium is deposited along the growth zones or to the peripheral parts of the crystals in the form of independent uranium minerals (Figure 3D–F). The location of small crystals of pyrite and uranium minerals in the growth planes of fluorite (Figure 3) implies that the formation of these minerals is simultaneous with the precipitation of early fluorite (F1). Iron oxides (mainly hematite) are mainly found associated with small fractures and cavities; therefore, they are later.
The main alpha producers in geological samples are U, Th, and Sm; hence, we measured the concentration of these elements in nine samples of fluorite with very different textures and colors (Table 1). A relatively large span of U concentrations, from ca. 5 µg g−1 to ca. 100 µg g−1, was found, but the concentrations of Th and Sm were found to be extremely low, always less than 1 µg g−1. Dark varieties are generally richer in uranium, but there is no simple correlation between color and uranium contents. Comparing our results with those of the literature, the U content of the samples from the early fluorite (F1) of the La Azul mine was quite high and similar to that of several deposits that have recently been dated via the (U-Th-Sm)/He method, e.g., [48] or laser ablation U-Pb, e.g., [49], but lower than those reported by the authors of [50,51] that exceed 700 μg g−1.

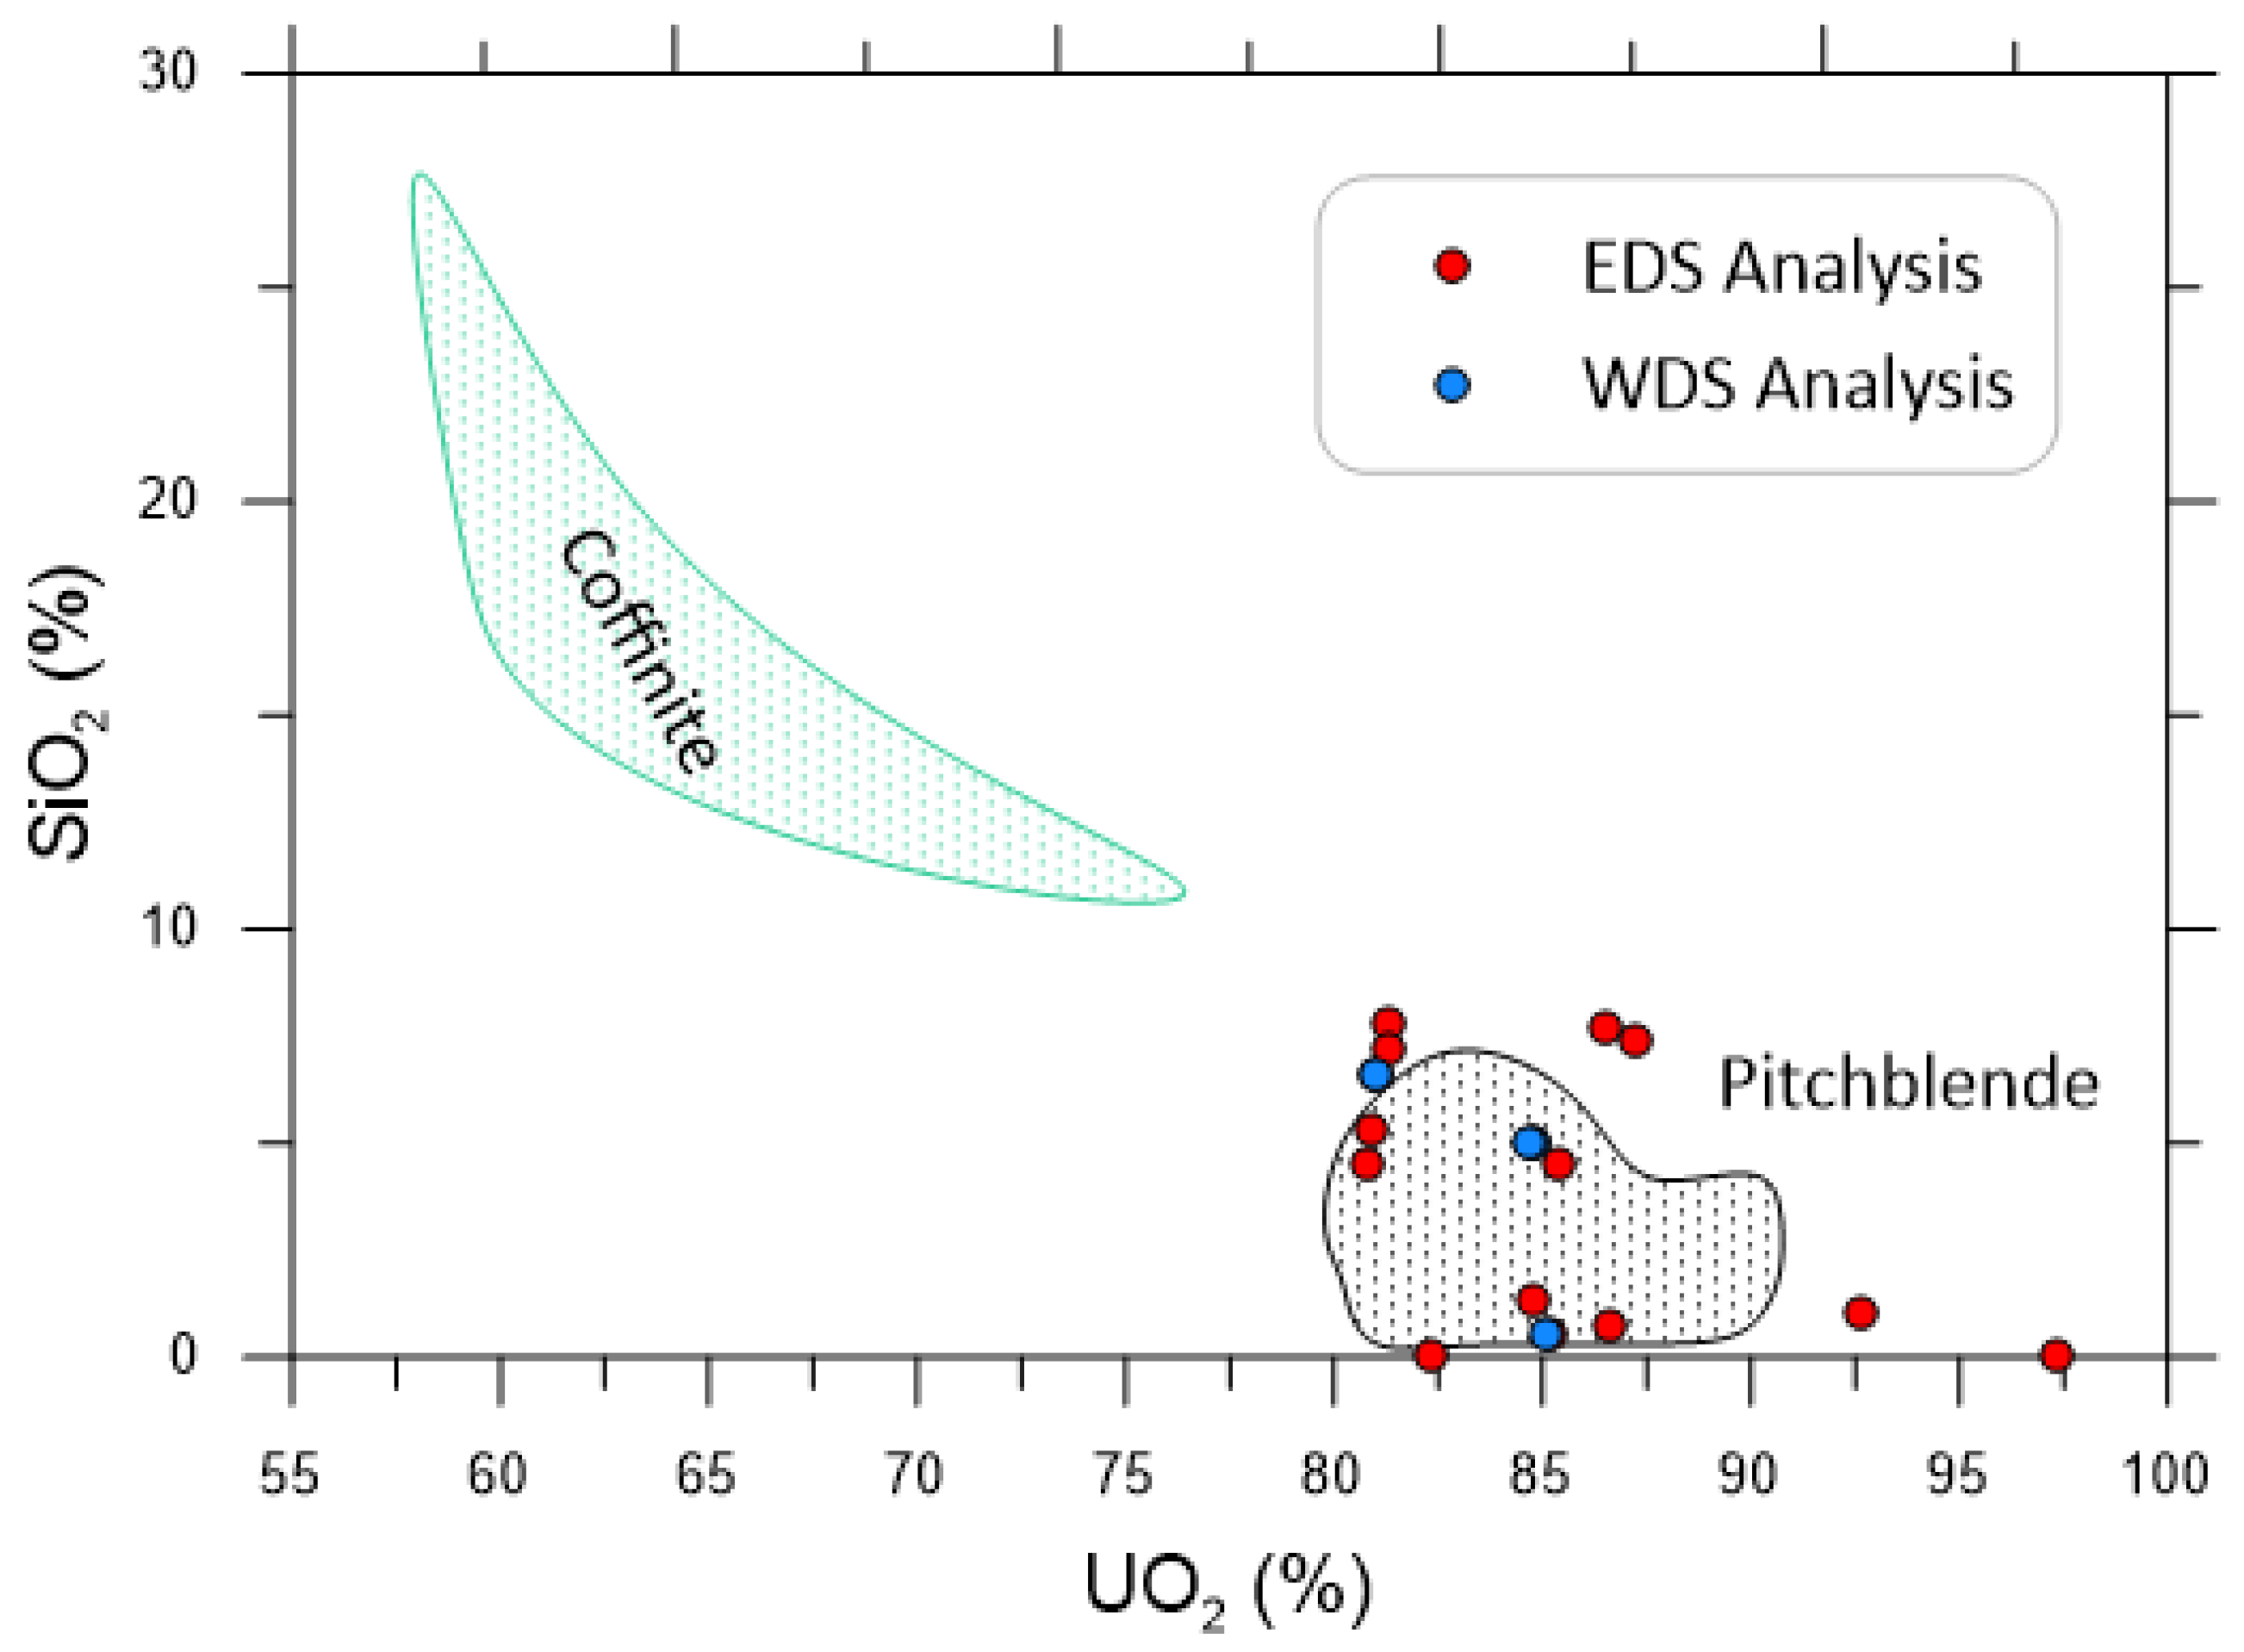
4.2. Composition (EDS and WDS) and Textural Characteristics of Uranium-Rich Inclusions in Fluorite

Uranium-rich inclusions are anhedral and fine-grained and are found within fluorite, never filling cavities or interstitial locations. They usually occur as subhedral, isolated crystals in fluorite growth surfaces, but several aggregates of semispherical morphology have been observed. Euhedral crystals have not been found. Figure 3 shows the distribution of (U/Th) inclusions in the La Azul purple fluorite samples.
The major elements of uranium-rich inclusions are characterized by high UO2 (81.0%–85.1%, median 83.6% via WDS, and 80.9%–90.8%, median 83.6% via EDS), intermediate CaO (9.4%–11.8%, median 10.3% via WDS, and 0%–12.8%, median 9.8% via EDS), and low SiO2 (0.6%–6.6%, median 4.1% via WDS, and 0%–7.8%, median 3.9% via EDS) and Pb (0.32%–0.79%, median 0.5% via WDS, and 0%–1.4%, median 0.4% via EDS). The analyzed crystals coexist with pyrite crystals (Figure 3). The calculated water values were between 0.5% and 2.5%. It should be mentioned that the values obtained for fluorine via EDS, and some via WDS, were very low; therefore, it was ruled out that the measured calcium could correspond to the fluorite host crystals.
Higher concentrations of Si and P in uraninite can be related to incipient alteration to coffinite (USiO4(OH)4) and uranium phosphates, respectively. Nevertheless, our analyses display a low concentration of P2O5 (<0.36 wt.%) and a relatively low concentration of SiO2 (<7.8 wt.%). The electron microprobe analyses allowed these inclusions to be identified as uraninite (UO2), which is very poor in REE and Th [52].
Lead oxide in uraninite is supposed, a priori, to be radiogenic, but lead in fluorite is not. However, as fluorite from the La Azul has a Pb concentration of less than ~50 μg g−1 [39], their contribution to the analyzed lead obtained in uraninite is negligible, even in the case that all CaO from analyses were derived from the fluorite matrix (the analysis of pure fluorite will give maximum PbO concentrations of about 0.005 wt.%).

4.3. Alpha-Autoradiography

Figure 4 shows the images of nine polished hand samples of fluorspar ore and scanned images of C-39 autoradiography of the same sections of the La Azul deposit. It is important to note that all analyzed samples exhibited a very low Th concentration, less than 1 µg g−1, so almost all tracks are derived from U. These samples were chosen to display a diversity of textures and the full range of U contents. Their descriptions can be found in Table 1.
Sample description: Az7: alternate bands of F1a and F1b fluorite; Az5: deep purple (F1a) and brown (F1b) fluorite replacing carbonate; Az2: rhythmical purple fluorite (F1a) and quartz; Az20: crust of early fluorite (F1); Az92: massive fluorite of purple (F1a) and brown (F1b) hues distributed irregularly; T3: hydrothermal breccia of purple fluorite (F1a) in a matrix with calcite; T1: fine-grained massive purple (F1a) and brown (F1b) fluorite; A20: massive purple fluorite (F1a) with porosity; and Az53: rhyolite breccia containing purple fluorite (F1a) clasts.

4.4. Micro-Raman Spectroscopy

For stoichiometric UO2, the Raman active mode was observed at 440–445 cm−1 [53,54], but this peak, ascribed to a stretching mode of the U-O bond, undergoes a progressive loss in intensity and concomitant broadening as the structure is modified through the increased incorporation of oxygen [55].
The La Azul samples measured show a distinct band at ~440 cm−1 (Figure 5) assigned to stoichiometric UO2 [54,55,56,57]. The other bands on the left are associated with analytical oxidation, as the temperature increase in the sample produced using the laser beam may cause the oxidation of UO2 to U3O8 [54]. It should be mentioned that pitchblende, the less crystalline variety of uraninite, has several oxidation states between U2O and UO3 [57,58]. For example, the band located at ~335 cm−1 corresponds to U3O8 and was interpreted as a U-O stretching vibration band [59]. Between 200 cm−1 and 300 cm−1, the V2(UO2)2+ bending mode and V3(UO2)2+ antisymmetric stretch were also identified [59].

4.5. X-ray Diffraction

Uraninite and fluorite are isostructural, with the added coincidence of nearly identical lattice parameters (~0.547 nm). This fact made it almost impossible (except for a very high-resolution diffraction experiment) to separate the peaks of the two minerals. Uraninite has a much higher electron density than fluorite, so its diffracted intensities are much stronger. In the absence of fluorite, uraninite will be detectable at parts per million concentrations with the XRD technique; nevertheless, large amounts of fluorite completely mask the uraninite peaks (Figure 6).

4.6. Fluorine Contents in Volcanic Rocks

The La Azul fluorite deposit is mainly located in the fault contact between volcanic rocks and carbonate sedimentary rocks (Morelos Fm.). The fluorine content of the box rocks associated with the fluorite mineralization was measured using ion-selective electrodes. For the volcanic rocks of the lower series, values between 98 μg g−1 and 336 μg g−1 of fluorine have been obtained, while in the rocks of the upper sequence, the fluorine concentrations vary from 207 μg g−1 to 518 μg g−1. The Morelos Formation (Mesozoic sedimentary carbonates) presents low fluorine values (≤100 μg g−1) far from the mineralization and higher fluorine values (1200 μg g−1) near mineralization. Taxco shale presents values close to those of the volcanic rock (102–493 μg g−1). Carbonates are always uranium-poor, so while the calcium in F1 fluorite probably comes from carbonate replacement, the fluorine and uranium were transported via hydrothermal mineralization fluids.

4.7. Microthermometric Data of Fluid Inclusions

The petrographic study has allowed us to determine primary inclusions mainly associated with the fluorite growth zones but with irregular distribution. Inclusions of 10–15 microns of rounded or lenticular shape, biphasic (L + V), predominate, with degrees of filling ranging from 0.7 to 0.9 (Figure 7). This information was introduced in the main text: Primary inclusions were related to the mineralizing fluids that allowed the simultaneous precipitation of fluorite and uraninite. Pseudosecondary or secondary inclusions were not studied, since we do not know what relationship they could have with mineralization. The data obtained for primary inclusions in fluorite were confirmed using some data from inclusions in quartz and calcite. A few primary inclusions were found in late fluorite (F2). The data obtained for F2 fluorite always indicate lower temperatures (<110 °C) and low salinities (<6 wt.% NaCl eq.).
The micro-thermometric study proved that all the inclusions studied homogenize to liquids with homogenization temperature values between 110 °C and 230 °C, with a predominance of intermediate values (ranging from 140 °C to 180 °C). Freezing temperatures are between −36 °C and −50 °C. Ice melting temperatures are always between 0 °C and −5.5 °C, with low values predominating. It was not possible to precisely measure the eutectic temperature, but it has been determined that it is slightly higher than −21 °C, and therefore, the presence of different salts is deduced, and the system H2O-NaCl-CaCl [60] is the one that looks most likely similar. However, since the salinity is always very low, we simplified the fluid to a pure H2O-NaCl system and used the formula of Hall et al. [61] to calculate salinity:
Salinity (wt.%) = 0.00 + 1.78θ − 0.0442θ2 + 0.000557θ3, where θ is the melting temperature of ice. The obtained salinity values were from 0 to 7 wt.% NaCl eq.
A considerable dispersion of the results was observed for the set of samples analyzed, but there were no significant changes in the microthermometric data obtained for the different uranium-rich fluorite samples (Figure 8a,b).

5. Discussion

5.1. Distribution of U in Fluorite Samples

There are 74 nuclides that decay via alpha emission, but most are very scarce in nature since they are artificially produced or short-lived. Therefore, the only alpha emitters that need to be considered in geological samples are from U and Th decay chains and 147Sm. In Figure 9, the morphology of the tracks is evident, showing circles (spheres in fact) with a mean radius of ~15 µm. In dense zones, the overlapping of tracks occurs, making it difficult to count them, as shown in Figure 9c. The alpha-autoradiography using CR-39 is a two-dimensional image of the total alpha activity of the sample’s polished surface. It must be highlighted that the concentrations of Th and Sm were very low in these samples (and consequently, in this fluorspar deposit), so the alpha images were produced almost exclusively via uranium.
Although we only used samples from a unique mineral deposit, the different textures and uranium contents, ranging from ~1 µg g−1 to ~100 µg g−1, were diverse enough to test the method. We first observed the extraordinary mimics of texture obtained via autoradiography in all samples. In sample Az20 (Figure 4b), we also observed that U leaching occurred in the fractures that cut the sample. This fact was not evident in hand samples or microscopic observation, with the latter only showing a change in color from light to deep purple. The autoradiography, however, indicates that these changes in color are syngenetic, as uranium was relatively uniform in these areas.
In contrast, samples Az5 and Az7 (Figure 4a) have several fractures, but none showed remobilized uranium. Contrarily to Az20 fractures, these are not hydrothermal circulation channels. Uranium is very soluble in its oxidized form, so autoradiography is a good method to determine whether hydrothermal circulation occurred after sample genesis. Autoradiography can discern hydrothermal fracture and vein filling with uranium remobilization from sample fracture without uranium mobility.
Samples T1 and Az92 (Figure 4b) are noteworthy, as autoradiography clearly revealed the presence of at least two distinct generations of fluorite, characterized by much contrasted U contents. Although the hand sample displayed the interface between the two generations, the very distinctive uranium concentration of each is proof of their precipitation from different hydrothermal solutions.
Sample T3 (Figure 4b) is a hydraulic breccia cemented by calcite. Fluorite clasts show a somewhat irregular texture and color, but this was not observed in the U distribution, which was rather uniform. The calcite filling fractures had small, disseminated fragments of fluorite, which displayed some alpha activity, but calcite itself seemed to be low in U. The last sample, Az53 (Figure 4c), is remarkable for its texture and the alpha activity that mimics it. It is a rhyolitic breccia that includes clasts of uranium-rich fluorite; oncentrically developed bands in fluorite were clearly seen. Its matrix contains fluorite, calcite, quartz, and minorly altered igneous minerals. Calcite clasts are free from uranium, as can be observed in autoradiography.

5.2. Uranium Mineralogy

One of the main takeaways from the observation of autoradiographs is the presence of uranium activity in almost all fluorite samples, regardless of the microscopical presence of uraninite. Ca–U isomorphism has been confirmed in synthetic fluorite crystals [62], but isomorphous replacement has been restricted. Berzina et al. [7], using fission tracks from uranium in fluorite, concluded that the distribution of uranium in a fluorite lattice does not exceed ~1 µg g−1; larger concentrations result in the formation of uraninite crystals.
Our observations provide a larger range of uranium isomorphism, as only fluorite samples with more than ~20 μg g−1 of uranium exhibited micro-inclusions of uraninite, which were microscopically apparent by the presence of purple haloes in the fluorite surrounding the uranium-rich inclusions. For example, samples Az2, Az5, and Az7 (Figure 4a), along with the low-uranium parts of T1 and Az92 (Figure 4b), do not show uraninite inclusions. It must be emphasized, however, that these observations were made with optical microscopy and electron microprobes, with an image resolution between 1 µm and 0.1 µm, so the existence of nanometer-sized inclusions of uraninite cannot be ruled out.
The name uraninite is essentially used for the crystalline (isometric) uranium dioxide (UO2) mineral with low water content, while the name pitchblende refers to the microcrystalline or colloform amorphous variety, with its water content varying from about 2 per cent to 5 per cent. The small grain size may be attributed to rapid crystallization at low temperatures in mesothermal deposits, e.g., [63,64].
Considering the textural and compositional characteristics and the hydrothermal origin of the uranium-rich inclusions studied in the fluorite samples from the La Azul mine, these can be defined as pitchblende. The results obtained are chemically very similar to the pitchblende reported by the authors of [63] in a hydrothermal system. Figure 10 compares the chemical results obtained for uraninite from the La Azul mine with those of pitchblende obtained by these authors.

5.3. Uraninite as a Geochemical Indicator

Uranium-rich minerals are formed under diverse chemical conditions and are considered excellent indicators of geochemical environments [4]. The chemistry of uraninite can serve as an indicator of its origin [2]. Uraninite is isometric (fluorite structure; Fm3m), with its nominal composition being UO2+x. However, pure UO2 is unknown in nature, being oxidized and containing additional elements that strongly depend on the depositional environment and the conditions of the transport of U. Three types of uraninite can be defined by their genesis: (a) igneous and metamorphic, (b) hydrothermal; and (c) low temperature or sedimentary [64,65]. Only the first type of uraninite contains Th and REE, as U and Th have different solution behaviors and are fractionated in many aqueous environments. In hydrothermal processes, uranium is partially or totally oxidized to U6+ and is decoupled from Th. The electron microprobe analysis revealed a very low concentration of Th in uraninite from the La Azul fluorspar deposit, suggesting a hydrothermal origin for the uranium-rich inclusions in fluorite and, thus, for the fluorite itself.

5.4. Chemical Age of Uraninite

The electron microprobe analysis of U, Th, and Pb in single uraninite grains can be used to estimate that specific grain’s chemical age of formation [66]. This age is derived from the assumption that the total lead present in the sample is of radiogenic origin and a result of the decay of uranium and thorium. Pavshukov et al. [67] noted the ability of uraninite to retain radiogenic Pb within the structure. Nonetheless, due to the low Pb concentration in fluorite (Table 2), we assumed that the fluorite matrix does not influence the calculated ages. Therefore, we only used the analysis of the biggest crystals (>4 μm) we found and rejected several analyses with very low U concentrations or anomalous compositions.
It is important to mention that the results obtained for the chemical age (Table 2) were useful to corroborate (with less precision) the range of isotopic (U-Th-Sm)/He ages (Table 1) obtained in the same fluorite samples [38]; the results were generally comparable.

5.5. Transport and Precipitation of Uranium in Fluorite Samples

Uranium is an extremely electropositive and reactive element. In an aqueous solution, its most stable form is as uranyl ion (UO22+), which behaves as a divalent metal ion that can bind to F, OH, SO42−, and NO3 (or C and O compounds). In an aqueous solution, uranium can also be found as U4+, forming many compounds with a high coordination number and variable geometry, e.g., [68]. Fluorine, probably of magmatic origin, would be transported to the surface in the form of compounds and would serve as a carrier for U, e.g., [13]. At low temperatures, uranium speciation is mainly controlled via oxidation–reduction processes, pH, and the amount and type of carbonates dissolved in the medium. Several components that can form compounds with U are hydroxides, carbonates, fluorine, phosphorus, and organic matter. In mineralizing solutions, uranium is mainly transported in an oxidized form [69].
In the La Azul deposit, fluoride complexes of uranium may be important for this transport. The reduction of U6+ to U4+ is a possible mechanism for depositing uraninite from hydrothermal solutions [27,69,70]. This reduction is probably related to the La Azul fluorspar deposit with the presence of organic matter [39,71] and the pH variation associated with the fluid’s reaction with the limestone wall rock.
It is known that the reduction of uranyl cations to form uraninite in aqueous solution can occur under hydrothermal conditions (180–200 °C) thanks to the presence of organic matter [72]. In the Taxco mining district deposits, the uraninite inclusions found within fluorite have been chemically characterized using microprobes and SEM-EDS and classified as hydrothermal (rich in Ca and poor in Th). This led us to propose a hydrothermal origin of uranium that was probably transported to the surface as fluorinated compounds.
The importance of organic matter in hydrothermal deposits has also been reviewed by Landais [73]. The organic substrate loses H and allows for the formation of uraninite via the reduction of aqueous uranium. Experimental studies [74] have shown that at temperatures below 50 °C, there is no reaction; that from 50 °C to 120 °C there is fixation of the uranyl ion by the organic matter; and that from 120 °C to 250 °C (temperature range determined via micro-thermometric fluid inclusion studies in La Azul fluorite deposits) the fixation of the uranyl ion coexists with the reduction to uraninite. The La Azul fluorite deposit is anomalously rich in uranium (up to ~100 ppm) compared to data from the review by Pi [39] on fluorite’s U and Th content from more than 100 fluorite deposits from different types and endogenous origin of the former USSR and elsewhere.
The fluorite rich in uranium is, in turn, the richest in organic matter (e.g., CH4 and H2S), so we believe that both parameters are related, although they have different origins. Uranium transported in its oxidized form is easily reduced thanks to the thermal degradation of organic matter and the release of CO2. Fluorite with uraninite inclusions is early, enriched in Sr, and always related to carbonate replacement.
Uranium deposition can be associated with the presence of organic matter (reducing conditions) and is largely due to the neutralization of solutions of an acidic nature. The carbonate rocks of the Morelos Formation collaborate via dissolution in this neutralization process and reduces fluorine activity via the precipitation of fluorite. Fluorite precipitation is mainly related to a decrease in temperature and pH. It is worth mentioning that the formation temperature of pitchblende varies from 150 °C to 250 °C, e.g., [27] and that these values agree very well with the microthermometric data of fluid inclusions measured in uranium-rich fluorite.

6. Conclusions

The mineralogy of the La Azul deposit is like that described for other fluorite deposits in Mexico and worldwide. The uranium-rich fluorites are early in the mineralization process of the La Azul mine. They are purple and rich in uranium, organic matter, and strontium. Specifically, they are related to the presence of sulfides, and genetically, they are associated with carbonate replacement.
Uranium can be found in solid solution within fluorite, but mineral inclusions are formed irregularly concentrated in the growth zones when the concentration is greater than ~20 µg g−1. It is worth mentioning that the emission of alpha particles partially damages the structure of the violet fluorite crystals. The distribution of uranium within fluorite can be studied in detail and quantitatively using autoradiography. The chemical age obtained for uraninite is more variable than the isotopic age (U-Th-Sm/He or U-Pb methods) and can only be obtained for crystals larger than the size of the beam of the microprobe (4 microns in our case).
The compositional data (EDS and WDS) and Raman spectrometry of the inclusions of uranium-rich minerals showed that they are uraninite (UO2) inclusions. The crystals do not have euhedral shapes and are, therefore, defined as pitchblende, and their origin is related to hydrothermal processes. The fluids that allowed for the simultaneous precipitation of uraninite and fluorite are fluids of intermediate temperature (110–230 °C) and low salinity (<8 wt.% NaCl eq.).
These values are typical of epithermal systems with a magmatic component. The presence of organic matter––evidenced by H2S release and methane mass spectrometry measurements––and sulfides are considered factors that favored the precipitation of uranium minerals in the La Azul deposit.

Author Contributions

Conceptualization, T.P.-P. and J.S.; methodology, T.P.-P., J.S. and L.A.-A.; software, J.S.; formal analysis, T.P.-P., J.S. and L.A.-A.; investigation, T.P.-P. and J.S.; resources, T.P.-P.; data curation, T.P.-P. and J.S.; writing—original draft preparation, T.P.-P. and J.S.; writing—review and editing, T.P.-P., J.S. and L.A.-A. All authors have read and agreed to the published version of the manuscript.

Funding

This research received no external funding.

Data Availability Statement

Data are contained within the article.

Acknowledgments

We acknowledge Margarita Reyes Salas from the Universidad Nacional Autónoma de Mexico, México and Xavier Llovet from CCiTUB, Universitat de Barcelona, Spain, for the microprobe analyses. We also acknowledge Luis Espinosa and José Golzarri for their support during the autoradiography analysis. We are grateful for the Laboratorio Universitario de Caracterización Espectroscópica (LUCE) of the Instituto de Ciencias Aplicadas y Tecnología (Universidad Nacional Autónoma de México, Mexico), for the Raman analysis. We especially thank Mireia Lilit Solé Pi for the English revision of the manuscript.

Conflicts of Interest

The authors declare no conflict of interest.

References

  1. Condie, K.C. Chemical composition and evolution of the upper continental crust: Contrasting results from surface samples and shales. Chem. Geol. 1993, 104, 1–37. [Google Scholar] [CrossRef]
  2. Frondel, C. Systematic mineralogy of uranium and thorium. US Geol. Surv. Bull. 1958, 1064, 400. [Google Scholar]
  3. Frondel, J.W.; Fleischer, M.; Jones, R.S. Glossary of uranium and thorium bearing minerals 4th edition. US Geol. Surv. Bull. 1967, 1250, 69. [Google Scholar]
  4. Finch, R.; Murakami, T. Systematic and paragenesis of uranium minerals. In Uranium: Mineralogy, Geochemistry and the Environment, Reviews in Mineralogy; Burns, P.C., Finch, R., Eds.; Walter de Gruyter GmbH & Co. KG.: Berlin, Germany, 1999; Volume 38, pp. 9–179. [Google Scholar]
  5. Lauf, R.J. Mineralogy of Uranium and Thorium; Schiffer Publishing, Ltd.: Atglen, PA, USA, 2016; 352p. [Google Scholar]
  6. Deer, W.A. Rock-Forming Minerals: Framework Silicates; Longmans: Harlow, UK, 1962; Volume 4. [Google Scholar]
  7. Berzina, I.G.; Melnikov, I.V.; Popenko, D.P. Determination of content and spatial distribution of uranium in fluorites from tracks of fission fragments of uranium. Sov. At. Energy 1972, 32, 237–241. [Google Scholar] [CrossRef]
  8. Nassau, K.; Prescott, B.E. Smoky, blue, greenish yellow, and other irradiation-related colors in quartz. Mineral. Mag. 1977, 41, 301–312. [Google Scholar] [CrossRef]
  9. Akyüz, T.; Boical, C.; Tretyakova, S.P.; Güzel, T.; Saritepe, P.; Oganiessian, Y.T. Investigation of uranium and thorium concentrations in the fluorite beds of Anatolia by using solid state nuclear track detectors. J. Radioanal. Nucl. Chem. 1997, 220, 259–261. [Google Scholar] [CrossRef]
  10. El-Mansi, M.M. Colouration of fluorite and its relation to radioactivity. J. Mineral. Soc. Egypt 2000, 12, 93–106. [Google Scholar]
  11. Raslan, M.F. Mineralogical and geochemical characteristics of uranium-rich fluorite in El-Missikat mineralized granite, Central Eastern Desert, Egypt. Geologija 2009, 52, 213–220. [Google Scholar] [CrossRef]
  12. Richardson, C.K.; Holland, H.D. Fluorite deposition in hydrothermal systems, an experimental study. Geochim. Cosmochim. Acta 1979, 43, 1313–1325. [Google Scholar] [CrossRef]
  13. Narayan Das, G.R.; Bhatnagar, G.S. Uraninite-fluorite-bearing sheared granites of Brijrani Gad in Bhilangana Valley. J. Geol. Soc. India 1981, 22, 247. [Google Scholar]
  14. Cathelineau, M. Les Gisements D’uranium Lies Spatialement aux Leucogranites Sud-Armoricains et a Leur Encaissant Metamorphique, Relations et Interactions Entre les Mineralisations et Divers Contextes Geologiques et Structuraux; Volum 42 de Sciences de la terre, Mémoires, ed.; Fondation Scientifique de la Géologie et de ses Applications: Nancy, France, 1982; 375p. [Google Scholar]
  15. George-Aniel, B.; Poty, B.; Leroy, J. Uranium deposits of the Sierra Peña Blanca: Three examples of mechanisms of ore deposit formation in a volcanic environment. In Uranium Deposits in Volcanic Rocks. Proceedings of the IAEA Vienna Symp Uranium Deposits in Volcanic Rocks, El Paso, TX, USA, 2–5 April 1984; International Atomic Energy Agency: Vienna, Austria, 1985; pp. 175–186. [Google Scholar]
  16. Kaiser, E.P.; Page, L.R. Distribution of Uranium Deposits in the United States; Kaiser, P., Kiag, R.U., Stogard, V.R., Stogard, F., Jr., Wyaat, D.G., Gott, G.B., Eds.; Department of the Interior, U.S. Geological Survey: Reston, VA, USA, 1952; p. 5.
  17. Bolonin, A.V.; Nikiforov, A.V.; Lykhin, D.A.; Sugorakova, A.M. The Chailag-Khem fluorite-barium-strontium rare earth carbonatite occurrence, the Western Sayan Range, Russia. Geol. Ore Depos. 2009, 51, 17–32. [Google Scholar] [CrossRef]
  18. Wilmarth, V.R.; Bauer, H.L., Jr.; Staatz, M.H.; Wyant, D.G. Uranium in fluorite deposits. US Geol. Surv. Circ. 1952, 220, 13. [Google Scholar]
  19. Sherborne, J.E., Jr.; Buckovic, W.A.; Dewitt, D.B.; Hellinger, T.S.; Pavlak, S.J. Major uranium discovery in volcaniclastic sediments, basin and range province, Yavapai County, Arizona. Am. Assoc. Pet. Geol. Bull. 1979, 63, 621–646. [Google Scholar]
  20. Cunningham, C.G.; Steven, T.A.; Rasmussen, J.D. Volcanogenic uranium deposits associated with the Mount Belknap volcanics, Marysvale volcanic field, west-central Utah (abstract). Energy exploration in the 80’s. In Proceedings of the Annual Meeting of the Southwest Section, American Association of Petroleum Geologists, El Paso, TX, USA, 25–27 February 1980; p. 22. [Google Scholar]
  21. Lindsey, D.A. Volcanism and uranium mineralization at Spor Mountain, Utah. AAPG Stud. Geol. 1981, 13, 89–98. [Google Scholar]
  22. Duex, T.W.; Henry, C.D. Uranium mobility in late magmatic and hydrothermal processes. Evidence from fluorite deposits, Texas and México. In Uranium Deposits in Volcanic Rocks; International Atomic Energy Agency: Vienna, Austria, 1985. [Google Scholar]
  23. Kesler, S.E. Metallogenic evolution of convergent margins; selected ore deposits models. Ore Geol. Rev. 1997, 12, 153–171. [Google Scholar] [CrossRef]
  24. Langmuir, D. Uranium solution-mineral equilibria at low temperatures with applications to sedimentary ore deposits. Geochim. Cosmochim. Acta 1978, 42, 547–569. [Google Scholar] [CrossRef]
  25. Parks, G.A.; Pohl, D.C. Hydrothermal solubility of uraninite. Geochim. Cosmochim. Acta 1988, 52, 863–875. [Google Scholar] [CrossRef]
  26. Xing, Y.; Mei, Y.; Etschmann, B.; Liu, W.; Brugger, J. Uranium Transport in F-Cl-Bearing Fluids and Hydrothermal Upgrading of U-Cu Ores in IOCG Deposits Hindawi. Geofluids 2018, 2018, 6835346. [Google Scholar] [CrossRef]
  27. Li, L.; Wang, Z.; Xu, D. Relationship between Uranium Minerals and Pyrite and Its Genetic Significance in the Mianhuakeng Deposit, Northern Guangdong Province. Minerals 2021, 11, 73. [Google Scholar] [CrossRef]
  28. Holland, H.D.; Malinin, S.D. The solubility and occurrence of non-ore minerals. In Geochemistry of Hydrothermal Ore Deposits, 2nd ed.; Barnes, H.L., Ed.; Wiley: New York, NY, USA, 1979; pp. 461–501. [Google Scholar]
  29. Cunningham, C.G.; Rasmussen, J.D.; Steven, T.A.; Rye, R.O.; Rowley, P.D.; Romberger, S.B.; Selverstone, J. Hydrothermal uranium deposits containing molybdenum and fluorite in the Marysvale volcanic field, west-central Utah. Miner. Depos. 1998, 33, 477–494. [Google Scholar] [CrossRef]
  30. Henley, R.W. Hydrolysis reactions in hydrothermal fluids, Fluid-mineral equilibria in hydrothermal systems. Rev. Econ. Geol. 1984, 1, 45–56. [Google Scholar]
  31. Reed, M.; Spycher, N. Calculation of pH and mineral equilibria in hydrothermal waters with application to geothermometry and studies of boiling and dilution. Geochim. Cosmochim. Acta 1984, 48, 1479–1492. [Google Scholar] [CrossRef]
  32. Spirakis, C.S.; Heyl, A.V. Evaluation of proposed precipitation mechanisms for Mississippi Valley-type deposits. Ore Geol. Rev. 1995, 10, 1–17. [Google Scholar] [CrossRef]
  33. Campa-Uranga, M.F. Early Cretaceous protolith ages for metavolcanic rocks from Taxco and Taxco Viejo in Southern Mexico. In Proceedings of the Cordilleran Section 99th Annual Meeting, Puerto Vallarta, Mexico, 1–3 April 2003. [Google Scholar]
  34. De Cserna, Z.; Fries, C., Jr. Carta Geológica de México, Hoja Taxco 14Q-h(7), Serie 1:100,000 y Resumen de la Geología de la Hoja de Taxco. Estados de Guerrero, México y Morelos; Instituto de Geología de la UNAM: Ciudad de México, Mexico, 1981. [Google Scholar]
  35. Fries, C., Jr. Geología del Estado de Morelos y de Partes Adyacentes de México y Guerrero, Región Central-Meridional de México; Universidad Nacional Autónoma de México, Instituto de Geología, Boletín: Ciudad de México, Mexico, 1960; Volume 60, 236p. [Google Scholar]
  36. Morán-Zenteno, D.J.; Alba-Aldave, L.A.; Solé, J.; Iriondo, A. A major resurgent caldera in southern Mexico: The source of the late Eocene Tilzapotla ignimbrite. J. Volcanol. Geotherm. Res. 2004, 136, 97–119. [Google Scholar] [CrossRef]
  37. Hernández-Vargas, J.J.; Martiny, B.M.; Morán-Zenteno, D.J.; Pérez-Gutiérrez, R.; López-Martínez, M. 40Ar/39Ar geochronology and revised stratigraphy of the late Eocene Taxco volcanic field, southern Mexico. J. S. Am. Earth Sci. 2017, 79, 40–56. [Google Scholar] [CrossRef]
  38. Pi, T.; Solé, J.; Taran, Y. (U–Th)/He dating of fluorite: Application to the La Azul fluorspar deposit in the Taxco mining district, Mexico. Miner. Depos. 2005, 39, 976–982. [Google Scholar] [CrossRef]
  39. Pi, T. Estudio Mineralógico, Gequímico y Geocronológico de los Yacimientos de Fluorita de Taxco (Guerrero) y Zacualpan (Edo. De México). Ph.D. Thesis, Universidad Nacional Autónoma de México, Ciudad de México, Mexico, 2005; 420p. [Google Scholar]
  40. Fayziyev, A.R.; Koplus, A.V. Uranium and thorium in fluorite from endogenous deposits in the USSR. Geochem. Int. 1988, 25, 80–87. [Google Scholar]
  41. Jaffey, A.H.; Flynn, K.F.; Glendenin, L.E.; Bentley, B.C.; Esslin, A.M. Precision measurements of half-lives and specific activities of 235U and 238U. Phys. Rev. C 1971, 4, 1889–1906. [Google Scholar] [CrossRef]
  42. Sohrabi, M.; Shirazi, K.M. Optimization of etchants for electro-chemical etching of traces in policarbonate neutron personnel dosimeters. Nucl. Tracks Radiat. Meas. 1984, 8, 117–120. [Google Scholar]
  43. Espinosa, G. Trazas Nucleares en Sólidos; Universidad Nacional Autónoma de México, Instituto de Física: Valencia, Spain, 1994; 127p. [Google Scholar]
  44. Roedder, E. Volume 12: Fluid inclusions. Rev. Mineral. 1984, 12, 644. [Google Scholar]
  45. Goldstein, R.H. Fluid inclusions in sedimentary and diagenetic systems. Lithos 2001, 55, 159–193. [Google Scholar] [CrossRef]
  46. Bodnar, R.J. The system H2O-NaCl. Fourth biennial Pan-American conference on research on fluid inclusions. Program Abstr. 1992, 4, 108–111. [Google Scholar]
  47. Brown, P.E. FLINCOR: A microcomputer program for the reduction and investigation of fluid inclusion data. Am. Miner. 1989, 74, 1390–1393. [Google Scholar]
  48. Lenoir, L.; Blaise, T.; Somogyi, A.; Brigaud, B.; Barbarand, J.; Boukari, C.; Nouet, J.; Brézard-Oudot, A.; Pagel, M. Uranium incorporation in fluorite and exploration of U–Pb dating. Geochronology 2021, 3, 199–227. [Google Scholar] [CrossRef]
  49. Wolff, R.; Dunkl, I.; Kempe, U.; Stockli, D.; Wiedenbeck, M.; von Eynatten, H. Variable helium diffusion characteristics in fluorite, Geochim. Cosmochim. Acta 2016, 188, 21–34. [Google Scholar] [CrossRef]
  50. Piccione, G.; Rasbury, E.T.; Elliott, B.A.; Kyle, J.R.; Jaret, S.J.; Acerbo, A.S.; Lanzirotti, A.; Northrup, P.; Wooton, K.; Parrish, R.R. Vein fluorite U-Pb dating demonstrates post 6.2 Ma rare-earth element mobilization associated with Rio Grande rifting. Geosphere 2019, 15, 1958–1972. [Google Scholar] [CrossRef]
  51. Piccione, G.; Pi-Puig, T.; Rasbury, T. Solé, Concordant U-Pb and (U_Th)/He fluorite ages from Taxco mining district, México. J. GSA Annu. Meet. 2015, 47, 379. [Google Scholar]
  52. Janeczek, J.; Ewing, R.C. Structural formula of uraninite. J. Nucl. Mater. 1992, 190, 128–132. [Google Scholar] [CrossRef]
  53. Biwer, B.M.; Elbert, W.L.; Bates, J.K. The raman spectra of several uranyl-containing minerals using microprobe. J. Nucl. Matter 1990, 175, 188–193. [Google Scholar] [CrossRef]
  54. Allen, G.C.; Butler, I.S.; Anh Tuan, N. Characterization of uranium oxides by micro-raman spectroscopy. J. Nucl. Mater. 1987, 144, 17–19. [Google Scholar] [CrossRef]
  55. Palacios, M.L.; Taylor, S.H. Characterization of Uranium Oxides Using in Situ Micro-Raman. Spectrosc. Appl. Spectrosc. 2000, 54, 1373–1378. [Google Scholar] [CrossRef]
  56. Bonales, L.J.; Menor-Salván, C.; Cobos, J. Study of the alteration products of a natural uraninite by Raman spectroscopy. J. Nucl. Mater. 2015, 462, 296–303. [Google Scholar] [CrossRef]
  57. Stefaniak, E.A.; Alsecz, A.; Sajó, I.E.; Worobiec, A.; Máthé, Z.; Török, S.; Van Grieken, R. Recognition of uranium oxides in soil particulate matter by means of l-Raman spectrometry. J. Nucl. Mater. 2008, 381, 278–283. [Google Scholar] [CrossRef]
  58. Stefaniak, E.A.; Alsecz, A.; Frost, R.; Máthé, Z.; Sajó, I.E.; Török, S.; Worobiec, A.; Van Grieken, R. Combined SEM/EDX and micro-Raman spectroscopy analysis of uranium minerals from a former uranium mine. J. Hazard. Mater. 2009, 168, 416–423. [Google Scholar] [CrossRef] [PubMed]
  59. Driscoll, R.J.P.; Wolverson, D.; Mitchels, J.M.; Skelton, J.M.; Parker, S.C.; Molinari, M.; Khan, I.; Geeson, D.; Allen, G.C. A Raman spectroscopic study of uranyl minerals from Cornwall, UK. RSC Adv. 2014, 4, 59137–59149. [Google Scholar] [CrossRef]
  60. Crawford, M.L. Phase equilibria in aqueous fluid inclusions. Fluid Inclusions applications to petrology. In Short Course Handbook; Mineralogical Association of Canada: Québec, QC, Canada, 1981; pp. 75–100. [Google Scholar]
  61. Hall, D.L.; Sterner, S.M.; Bodnar, R.J. Freezing point depression of NaCl-KCl-H2O solutions. Econ. Geol. 1988, 83, 197–202. [Google Scholar] [CrossRef]
  62. Doynikova, O.A.; Sidorenko, G.A. To mineralogy of tetravalent uranium. New Data Min. 2010, 45, 79–90. [Google Scholar]
  63. Zhong, F.; Yan, J.; Wang, K.; Pan, J.; Xia, F.; Liu, G.; Liu, W. Mineralogy and geochemistry of pitchblende in the Changjiang U ore field, Guangdong Province, South China: Implications for its mineralization. Geochem. J. 2022, 56, 74–95. [Google Scholar] [CrossRef]
  64. McMillan, R.H. Genetics aspects and classification of important Canadian Uranium Deposits. In Mineralogical Society of Canada, Short Course Handbook 3; Kimberly, M.M., Ed.; Uranium Deposits: Their Mineralogy and Origin; Mineralogical Society of Canada: Québec city, QC, Canada, 1978; pp. 187–204. [Google Scholar]
  65. Plant, J.A.; Simpson, P.R.; Smith, B.; Windley, B.F. Uranium ore deposits: Products of the radioactive Earth. In Reviews in Mineralogy and Geochemistry; Uranium: Mineralogy, Geochemistry and the Environment; Burns, P.C., Finch, R., Eds.; Mineralogical Society of America: Chantilly, VA, USA, 1999; Volume 38, pp. 255–319. [Google Scholar]
  66. Bowles, J.F.W. Age dating of individual grains of uraninite in rocks from electron microprobe analyses. Chem. Geol. 1990, 83, 47–53. [Google Scholar] [CrossRef]
  67. Pavshukov, V.V.; Komlev, L.V.; Anderson, E.B.; Smyslova, I.G. On the state of the uranium-lead system in uranium ores (from the data of X-ray microprobe analysis). Geokhimiya 1975, 603–613. [Google Scholar]
  68. Greenwood, N.; Earnshaw, A. Chemistry of the Elements; Elsevier: Amsterdam, The Netherlands, 2012. [Google Scholar]
  69. Spirakis, C.S. Discussion of “Fluorite deposits at Encantada-Buenavista, México; products of Mississippi Valley Type Processes (Ore Geology Reviews 23:107-124)”. Ore Geol. Rev. 2004, 25, 327–328. [Google Scholar] [CrossRef]
  70. Garrels, R.M.; Larsen, E.S., 3rd. Geochemistry and mineralogy of the Colorado Plateau uranium ores. In US Geological Survey Professional Paper; United States Geological Survey: Reston, VA, USA, 1959; Volume 320, 236p. [Google Scholar]
  71. Tugarinov, A.I.; Naumov, G.B. Die Migrations-und Absatzverhältnisse des Urans bei der Erzbildung. Zeitschr. Angew. Geol. 1974, 20, 410–413. [Google Scholar]
  72. Spirakis, C.S. The roles of organic matter in the formation of uranium deposits in sedimentary rocks. Ore Geol. Rev. 1996, 11, 53–69. [Google Scholar] [CrossRef]
  73. Landais, P. Organic geochemistry of sedimentary uranium ore deposits. Ore Geol. Rev. 1996, 11, 33–51. [Google Scholar] [CrossRef]
  74. Nakashima, S.; Disnar, J.R.; Perruchot, A. Precipitation kinetics of uranium by sedimentary organic matter under diagenetic and hydrothermal conditions. Econ. Geol. 1999, 94, 993–1006. [Google Scholar] [CrossRef]
Figure 1. Geological map of the Taxco mining district, Guerrero state, Mexico. Geology based on several maps published by the authors of [33,34,35,36,37].
Minerals 13 01495 g001
Figure 2. Mineral paragenesis of early fluorite (F1) mineralization in the La Azul fluorspar deposit. F1 includes F1a and F1b fluorites, which are mainly distinguished by their uranium content, with F1a being richer in this element than F1b. The bars represent the distribution in time and the mutual relationship between phases.
Minerals 13 01495 g002
Figure 3. Distribution of uranium minerals in early fluorite (F1) samples: (A,C) Observation with transmitted light optical microscopy of purple fluorite associated with carbonate replacement; (B) the same observation as in (A) with crossed nicols; (D) distribution of uranium inclusions in later growth zones (white rectangles) of fluorite from the La Azul deposit. Uraninite can be identified by the purple haloes (transmitted light) generated in fluorite via irradiation; (E) crystals of early fluorite (F1) associated with cogenetic uranium mineral inclusions; and (F) the same image as 3E but in reflected light; primary uranium minerals in fluorite and later iron oxide filling cavities can be observed. U: uraninite inclusions, Fl: fluorite, Cc: calcite, and IO: iron oxides (mainly hematite).
Minerals 13 01495 g003
Figure 4. Hand sample photographs (ac) of nine fluorite samples from the La Azul fluorspar deposit, Taxco mining district, Mexico, together with grayscale and colored alpha-autoradiographies. See Table 1 for all sample descriptions. Dark zones in autoradiography correspond to higher track density, i.e., higher U concentration. Original autoradiographies on the CR-39 detector have been scanned in grayscale, and the contrast has been increased by the same amount in all images using CorelDraw 17. Then, each image was colored using Mathematica v.10.1. White areas correspond to zero trace density. The scale color bar has been calibrated with the maximum concentration of uranium corresponding to 100 µg g−1 of U, as determined with ICP-MS analyses.
Minerals 13 01495 g004aMinerals 13 01495 g004bMinerals 13 01495 g004c
Figure 5. Raman spectra of five uranium-rich inclusions. The band at ~440 cm−1 was assigned to UO2, and the band at ~335 cm−1 was assigned to U3O8. The pink and yellow inclusions are not indicative of uraninite.
Minerals 13 01495 g005
Figure 6. (a) Rietveld adjustment (upper graph) of fluorite sample A-20. Uraninite cannot be detected, as demonstrated in the lower graph. (b) XRD-calculated pattern of fluorite with 100 µg g−1 (0.01%) of uraninite. Observe that detecting such a low concentration would only be possible if fluorite was absent. In a fluorspar ore, it is very difficult (or impossible) to deconvolute uraninite from fluorite.
Minerals 13 01495 g006
Figure 7. Microphotography of preserved biphasic primary fluid inclusion (Bi-pfi) (a,b,d) and strangulated fluid inclusions (s-fi) in early (F1) fluorite (a,c). The black square in the images = 4 µm.
Minerals 13 01495 g007
Figure 8. (a) Histogram of homogenization temperatures for primary fluid inclusions in early fluorite samples (F1) with different textures. (b) Histogram of calculated salinities for primary fluid inclusions in early fluorite samples (F1) with different textures.
Minerals 13 01495 g008
Figure 9. Enlarged view of alpha-autoradiography from sample T1. (a) is a low-magnification view; (b,c) show magnifications of the two boxes labeled in (a). Each spherical trace is an etched path from an alpha particle.
Minerals 13 01495 g009
Figure 10. SiO2–UO2 diagram for uranium-rich inclusions. Comparison of the La Azul chemical results with the chemical results of pitchblende and coffinite (dotted areas) reported by the authors of [63].
Minerals 13 01495 g010
Table 1. Description of studied samples. Concentrations of Sr, U, Th, and Sm, along with their ages, were obtained from the authors of [38,39]. See images of these samples in Figure 4. Relative uncertainty of uranium, thorium, samarium, and strontium measurements are below 5%.
SampleColorDescriptionSrbulk
µg g−1
Ubulk
µg g−1
Thbulk
µg g−1
Smbulk
µg g−1
(U-Th-Sm)-He Age (Ma)
A20PurplePurple fluorite with irregularly banded texture. Open spaces (porosity) are filled by late fluorite and oxides. Optical microscopy shows the presence of small amounts of quartz.4368.50.680.1732.0 ± 1.7
Az2PurpleRhythmical purple fluorite and quartz.874.020.090.05
Az5PurpleDeep purple and brown fluorite replacing carbonate. Late calcite fills cavities. Minor quartz.1433.630.100.1631.5 ± 1.5
Az20Pink/blueCrust formed by elongated fluorite crystals that grow perpendicular to the crust surfaces. Minor amounts of calcite and oxides.21421.0<0.050.1331.8 ± 1.7
Az53Purple/blackRhyolite breccia containing purple fluorite clasts in a red matrix composed of quartz, kaolinite, iron oxides, and altered biotite.6828.10.220.56
Az7WhiteAlternate bands of pure white and gray fluorite. Minor amounts of calcite are also present.3804.7<0.050.1132.7 ± 1.7
Gray4885.4<0.050.1129.8 ± 1.7
Az92PurpleMassive fluorite of purple and brown hues distributed irregularly.40994.4<0.050.0532.0 ± 1.7
Brown95651.50.060.2632.6 ± 1.8
T1PurpleFine-grained massive purple and brown fluorite divided by an alteration band. White points are barite crystals. Minor amounts of quartz and oxides.2258.910.060.12
T3PurpleBreccia with clasts of brown/purple fluorite in a calcite matrix with minor amounts of quartz.38026.90.060.4530.7 ± 1.6
Table 2. Representative microprobe analysis (EDS and WDS) of the uranium-rich inclusions in the La Azul purple fluorite and their calculated chemical (total lead) ages.
Weight (%)EDS1EDS2EDS3EDS4EDS5WDS1WDS2WDS3WDS4
ThO22.042
UO286.5092.6787.1885.4097.3581.0084.7085.1084.24
MgO0.002.011.330.371.49
K2O1.64 0.341.310.30
Na2O 0.290.051.780.49
CaO 9.559.4211.779.62
Al2O3 1.31 1.130.31
SiO27.761.007.434.560.076.635.010.574.87
Y2O3
PbO 1.202.033.22 0.320.380.790.37
P2O5 0.88 1.52
FeO2.070.641.640.72
F
Total10010010010010097.5099.5198.2399.1
Chemical age (Ma) 30346934
Disclaimer/Publisher’s Note: The statements, opinions and data contained in all publications are solely those of the individual author(s) and contributor(s) and not of MDPI and/or the editor(s). MDPI and/or the editor(s) disclaim responsibility for any injury to people or property resulting from any ideas, methods, instructions or products referred to in the content.

