Article

Deeper Understanding of the Strength Evolution and Deformation Characteristics of Sodium Silicate–Cemented Paste Tailing Material

Department of Civil Engineering, University of Ottawa, Ottawa, ON K1N 6N5, Canada
*
Author to whom correspondence should be addressed.
Minerals 2023, 13(11), 1382; https://doi.org/10.3390/min13111382
Submission received: 25 September 2023 / Revised: 23 October 2023 / Accepted: 26 October 2023 / Published: 28 October 2023

Abstract

:
This research aims to examine the impact of sodium silicate (SS) on the mechanical and microstructural properties of cemented paste tailings or cemented paste backfill (CPB), a cementitious construction material extensively used in underground mining operations. The study involved various compositions and curing conditions of SS-CPB samples, and their uniaxial compressive strength (UCS), stress–strain behavior, microstructure, and modulus of elasticity were evaluated by conducting mechanical (UCS) and microstructural (DT/DTG, MIP) tests, as well as monitoring experiments. Findings indicate that SS improves the mechanical strength of CPB and enhances its microstructure. The development of UCS is affected by SS dosage, curing time, water chemistry, curing temperature, and curing stress. Higher SS dosage, curing time, temperature, and stress lead to higher UCS, while sulfates decrease UCS. SS also increases CPB’s resistance to sulfate attack, and field curing temperature improves the binder hydration enhancement induced by SS. The presence of SS affects the stress–strain properties of CPB, including the shape of the stress–strain curve, maximum stress and strain, and modulus of elasticity. The modulus of elasticity of CPB with SS is higher than that without SS under field thermal curing conditions. Moreover, UCS and the modulus of elasticity have a linear relationship in SS-CPB, regardless of SS content. A relationship is proposed to estimate the modulus of elasticity of SS-CPB from its UCS. The study has significant practical implications for the cost-effective design of mine CPB structures and for improving underground mine work safety and productivity.

1. Introduction

The cemented paste backfill (CPB) technique is a method used to support underground mine excavations that has gained popularity worldwide due to its effectiveness in mitigating geotechnical and geo-environmental risks associated with mining, improving mining productivity, and being environmentally friendly. In terms of economic benefits, ore recovery from mines using CPB will be higher than that from mines without CPB [1,2,3,4,5]. CPB is created by combining tailings, binder (usually 3% to 7% by weight), and water (15%–25%). The stability of the underground workspace depends on the strength and stability of the CPB structure, which is typically assessed using the uniaxial compressive strength (UCS) of CPB [6]. Depending on the CPB structure’s dimensions, the function/application of the CPB, and the mine’s characteristics, the UCS necessary for CPB varies [7,8]. Furthermore, obtaining the required UCS as quickly as possible is a critical objective of backfill operations. Faster UCS acquisition allows for earlier opening of barricades, which results in increased mine productivity [7]. However, the structural integrity of CPB is not solely determined by the UCS; there are other essential factors that contribute to its structural integrity. Designing the properties of interest for ground support also requires considering CPB’s deformation behavior and stiffness (Young’s modulus). The UCS and deformation behavior of CPB are influenced by various factors or conditions, including static and dynamic loading conditions, binder content, binder type, tailing fineness, curing time, and curing temperature [7,9,10].
Portland cement (PC) is a widely used binder for CPB production; however, its high cost and carbon dioxide emissions during production are major concerns. The cost of cement can account for as much as 75% of CPB’s total cost [7,11], making it crucial for mining companies to explore alternative binders that can improve its engineering properties, including strength and deformation, while reducing the cement content and increasing its strength gain rate. Recently, sodium silicate has emerged as a promising chemical additive that can lower the binder percentage in CPB and enhance its strength and strength gain rate. It is an alkaline solution that can activate pozzolanic materials like cement, slag, and fly ash [12].
Scholars have examined the impact of sodium silicate as a chemical additive on the mechanical characteristics of different CPB mixtures to reduce cement consumption and increase strength and strength gain rate (e.g., Refs. [3,13,14,15,16,17,18,19]). Nevertheless, all the preceding investigations regarding the unconfined compressive strength (UCS) of CPB with sodium silicate (SS-CPB) have relied on CPB samples that were cured under standard laboratory settings, such as stress-free, ambient-temperature, or consistent-temperature environments. Thus, the in situ mechanical strength of SS-CPB cannot be accurately represented or determined by previous studies, and several fundamental questions regarding the development of strength and deformation behavior in SS-CPB remain unanswered. When curing in the field, CPB encounters various complex loading conditions, such as mechanical stress from self-weight and filling rate, thermal effects caused by heat produced during binder hydration, and hydraulic conditions such as drainage. The previous studies did not take into account or incorporate these conditions. That means many queries about the strength evolution and deformation characteristics of SS-CPB persist unaddressed. For example, how does the strength evolution and deformation behavior of SS-CPB vary based on the drainage, field curing temperature, and curing stress? These critical design issues remain unaddressed by any investigation. In addition, there have been no prior investigations into how the strength of SS-CPB is influenced by sulfate.
In addition, it has been widely acknowledged that alterations in pore water pressure (PWP) and suction within CPB considerably impact its liquefaction potential and strength, as evidenced by studies such as those of [20,21,22,23]. Nonetheless, no research has been conducted on the development of PWP and suction or how they impact the strength of SS-CPB. Moreover, the acquisition of strength in CPB is significantly influenced by the development of its microstructure during binder hydration, as shown by Refs. [7,24]. However, our comprehension of the impact of sodium silicate dosage, curing stress, temperature, and time on CPB’s microstructure is still limited, and the effect of changes in microstructure on CPB strength needs further investigation to gain a better understanding of its behavior.
The principal aims of this investigation are twofold: (i) to conduct experimental testing to assess the independent and combined effects of non-isothermal field conditions, binder type (PCI and Slag), sodium silicate content, chemistry (sulfate), and curing stress on the strength development and deformation behavior of SS-CPB, and (ii) to determine how variations in the microstructure and suction of SS-CPB impact its strength development.

2. Experimental Programs

2.1. Materials

2.1.1. Tailings

This investigation utilized two distinct types of tailings: synthetic tailings and gold tailings. Cemented paste backfill typically comprises between 70% and 85% tailings by weight. Synthetic tailings, also referred to as silica tailings (STs), are composed of pure ground silica or quartz with a 99.8% SiO2 content and are produced by US Silica Co., Ltd., Katy, TX, USA. STs are chemically inert and employed for precise control of the tailings’ mineralogical and chemical composition, which helps to minimize uncertainties. Furthermore, STs’ grain size distribution closely resembles the particle size distribution typically found in tailings from numerous mines in eastern Canada (Figure 1). The second type of tailing material is natural gold tailings (GTs) extracted from a hard-rock mine in Canada. The dominant minerals in the GTs include albite (32.8%), chlorite (16.1%), quartz (15.0%), dolomite (15.0%), and talc (7.0%) [25]. Figure 1 depicts the particle size distribution of both STs and GTs.

2.1.2. Sodium Silicate

Water glass or sodium silicate was initially introduced in 1818 [26]. The two main components of sodium silicate are soda ash (sodium carbonate, Na2CO3) and silica sand (a widespread source of SiO2), which are heated in a furnace at temperatures between 1000 and 1400 °C. The formula for sodium silicate can be expressed as Na2O·nSiO2, with the variable “n” denoting the ratio of SiO2 to Na2O by weight [27]. The value of “n” varies from 1.6 (high alkalinity) to 3.85 (low alkalinity) [17,18]. Sodium silicate has several uses in various fields, including as an alkali activator for blast furnace slag and fly ash, cement, glue, paints, detergents, and as a hardening agent for natural and synthetic stones. Sodium silicate has also been found to be a successful alkali activator for most pozzolans, including blast furnace slag and fly ash [13,14]. In this study, a commercial liquid sodium silicate solution (Type N; supplier: National Silicates Co., Ltd., Etobicoke, ON, Canada) with a content of 8.9% and 28.7% Na2O and SiO2, respectively, was used to create the SS-CPB mixture. The solid content of the sodium silicate was 37.6%.

2.1.3. Binder and Mixing Waters

The development of adequate strength in the backfill is substantially dependent on the binder. The chemical and physical characteristics of the binder play a critical role in achieving this goal. Among the cost-control factors in mine backfilling, cement is a crucial element [16,28]. Therefore, type I Portland cement (PCI) and blast furnace slag (Slag) were used as binders in this research. The use of Slag helps reduce the cement consumption and overall cost of CPB. Table 1 illustrates the characteristics of PCI and Slag.
In order to hydrate the binder and reach the desired consistency of CPB for transport, tap and distilled waters (for preparing CPB with precise initial sulfate concentrations) were used.

2.2. Preparing Specimens and Determining Mix Ratios

Specimen Preparation

Approximately 200 specimens of CPB were created by blending STs or GTs, binders, water, and sodium silicate in specified amounts. A consistent paste was formed by mixing the mixture with a food mixer for 10 min, using a water-to-binder ratio of 7.6. Subsequently, the initial yield stress of each sodium silicate–CPB mixture was measured to guarantee a suitable yield stress. The CPB paste was then placed into cylindrical polyvinyl molds with a diameter of 5 cm and a height of 10 cm. The specimens were left to cure for 12 h, 1 day, 3 days, 7 days, 28 days, 90 days, or 150 days. Table 2 outlines the proportions mixed for the prepared samples.

2.3. Test Methods and Monitoring Program

2.3.1. UCS Test

Specimens that had been cured for varying lengths of time, namely 12 h or 1, 3, 7, 28, 60, 90, or 150 days, underwent unconfined compression tests. Using a computer-controlled mechanical press with a standard loading capacity of 50 kN, the testing was carried out in accordance with ASTM C39. During testing, all specimens underwent a constant deformation rate of 1.0 mm/min, and a computerized data-logging system was used to gather all test data. The software Lab-View (LabVIEW 2021) was then utilized to assess the collected data. For each age, we tested at least two specimens to ensure accurate results.

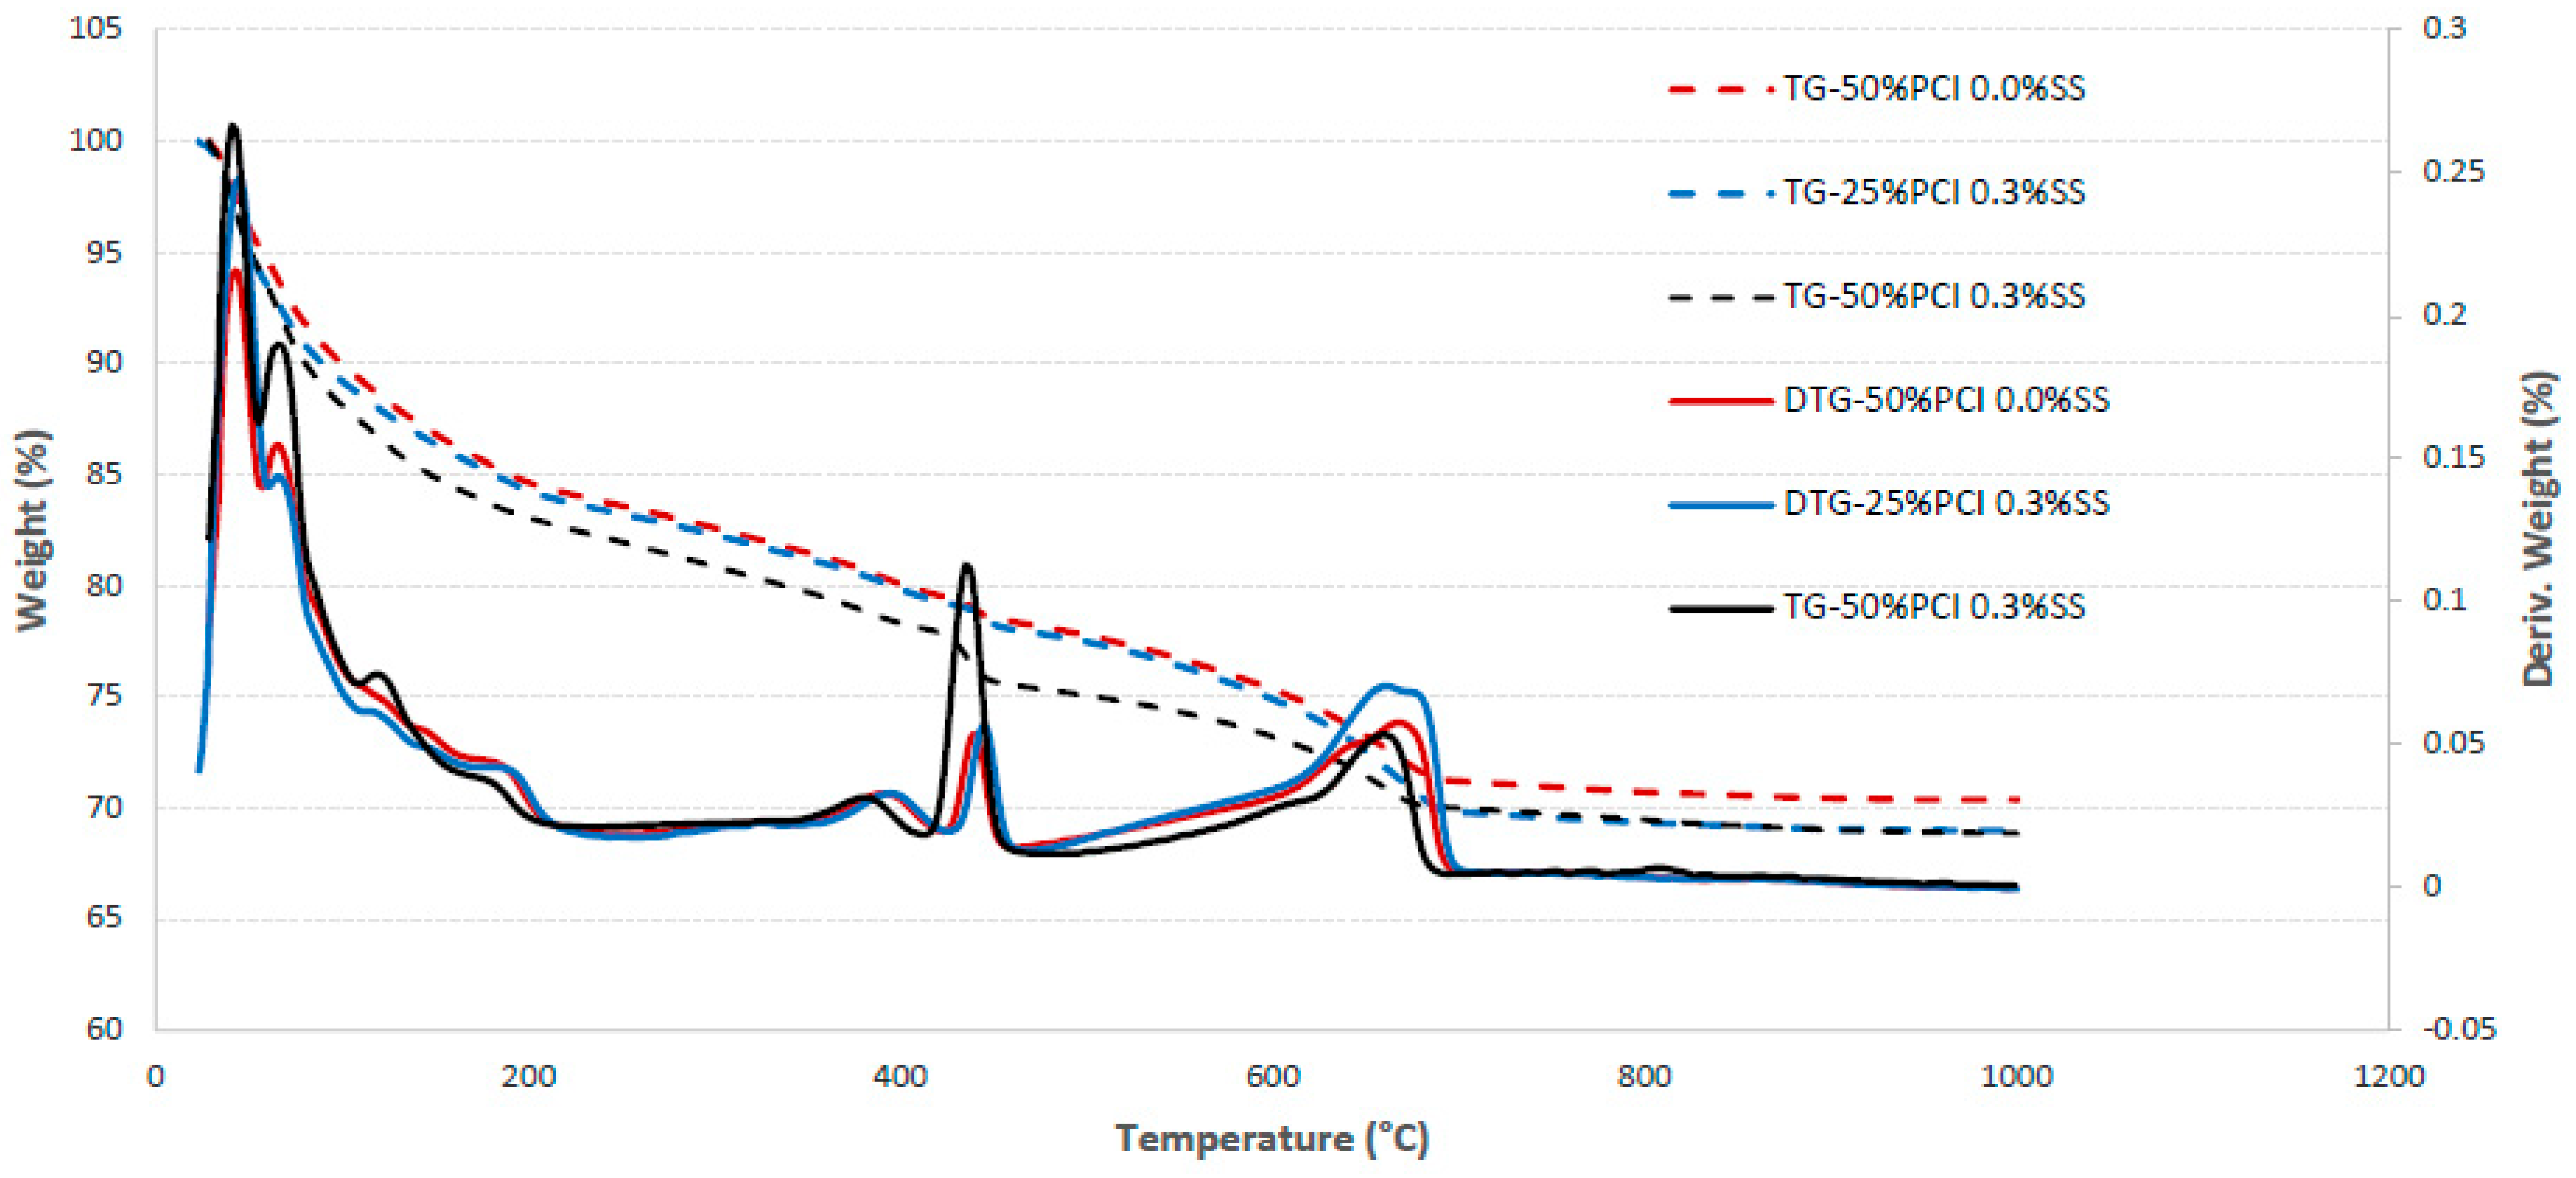
2.3.2. Microstructural Analysis and Tests

The influence of sodium silicate (SS) on the development of hydration products in the backfill material was analyzed through experimental investigation using thermogravimetry (TG) and differential thermogravimetry (DTG) techniques. To this end, TG/DTG tests were carried out on cement pastes of CPB both with and without SS. The experiment required the samples to be prepared by drying them at 45 °C for up to 4 days before testing. An Ulvac TGD 9600 thermal analysis system was utilized to perform thermal (TG/DTG) tests on 10 mg (±0.5 mg) of powdered specimens. Heating of the samples was performed in a nitrogen gas atmosphere (flow rate: 100 cm3 min−1) with a gradual temperature increase of 10 °C/min from room temperature to 1000 °C. A water-to-binder ratio of 1 was utilized to create the samples for testing, which imitated the high water content of CPB.
To examine the CPB microstructure, a mercury intrusion porosimetry (MIP) test technique was employed. While MIP has certain limitations, it has been utilized for several years to assess the pore size distribution of cemented materials (such as in the studies of [29,30]. A PMI mercury/nonmercury intrusion porosimeter instrument was employed to execute MIP testing and assess the total porosity and pore size distribution of the backfill specimens. To ensure that no cracking occurred, specimens were dried in a vacuum oven at 50 °C until they reached a constant weight, removing any free water, before MIP tests.

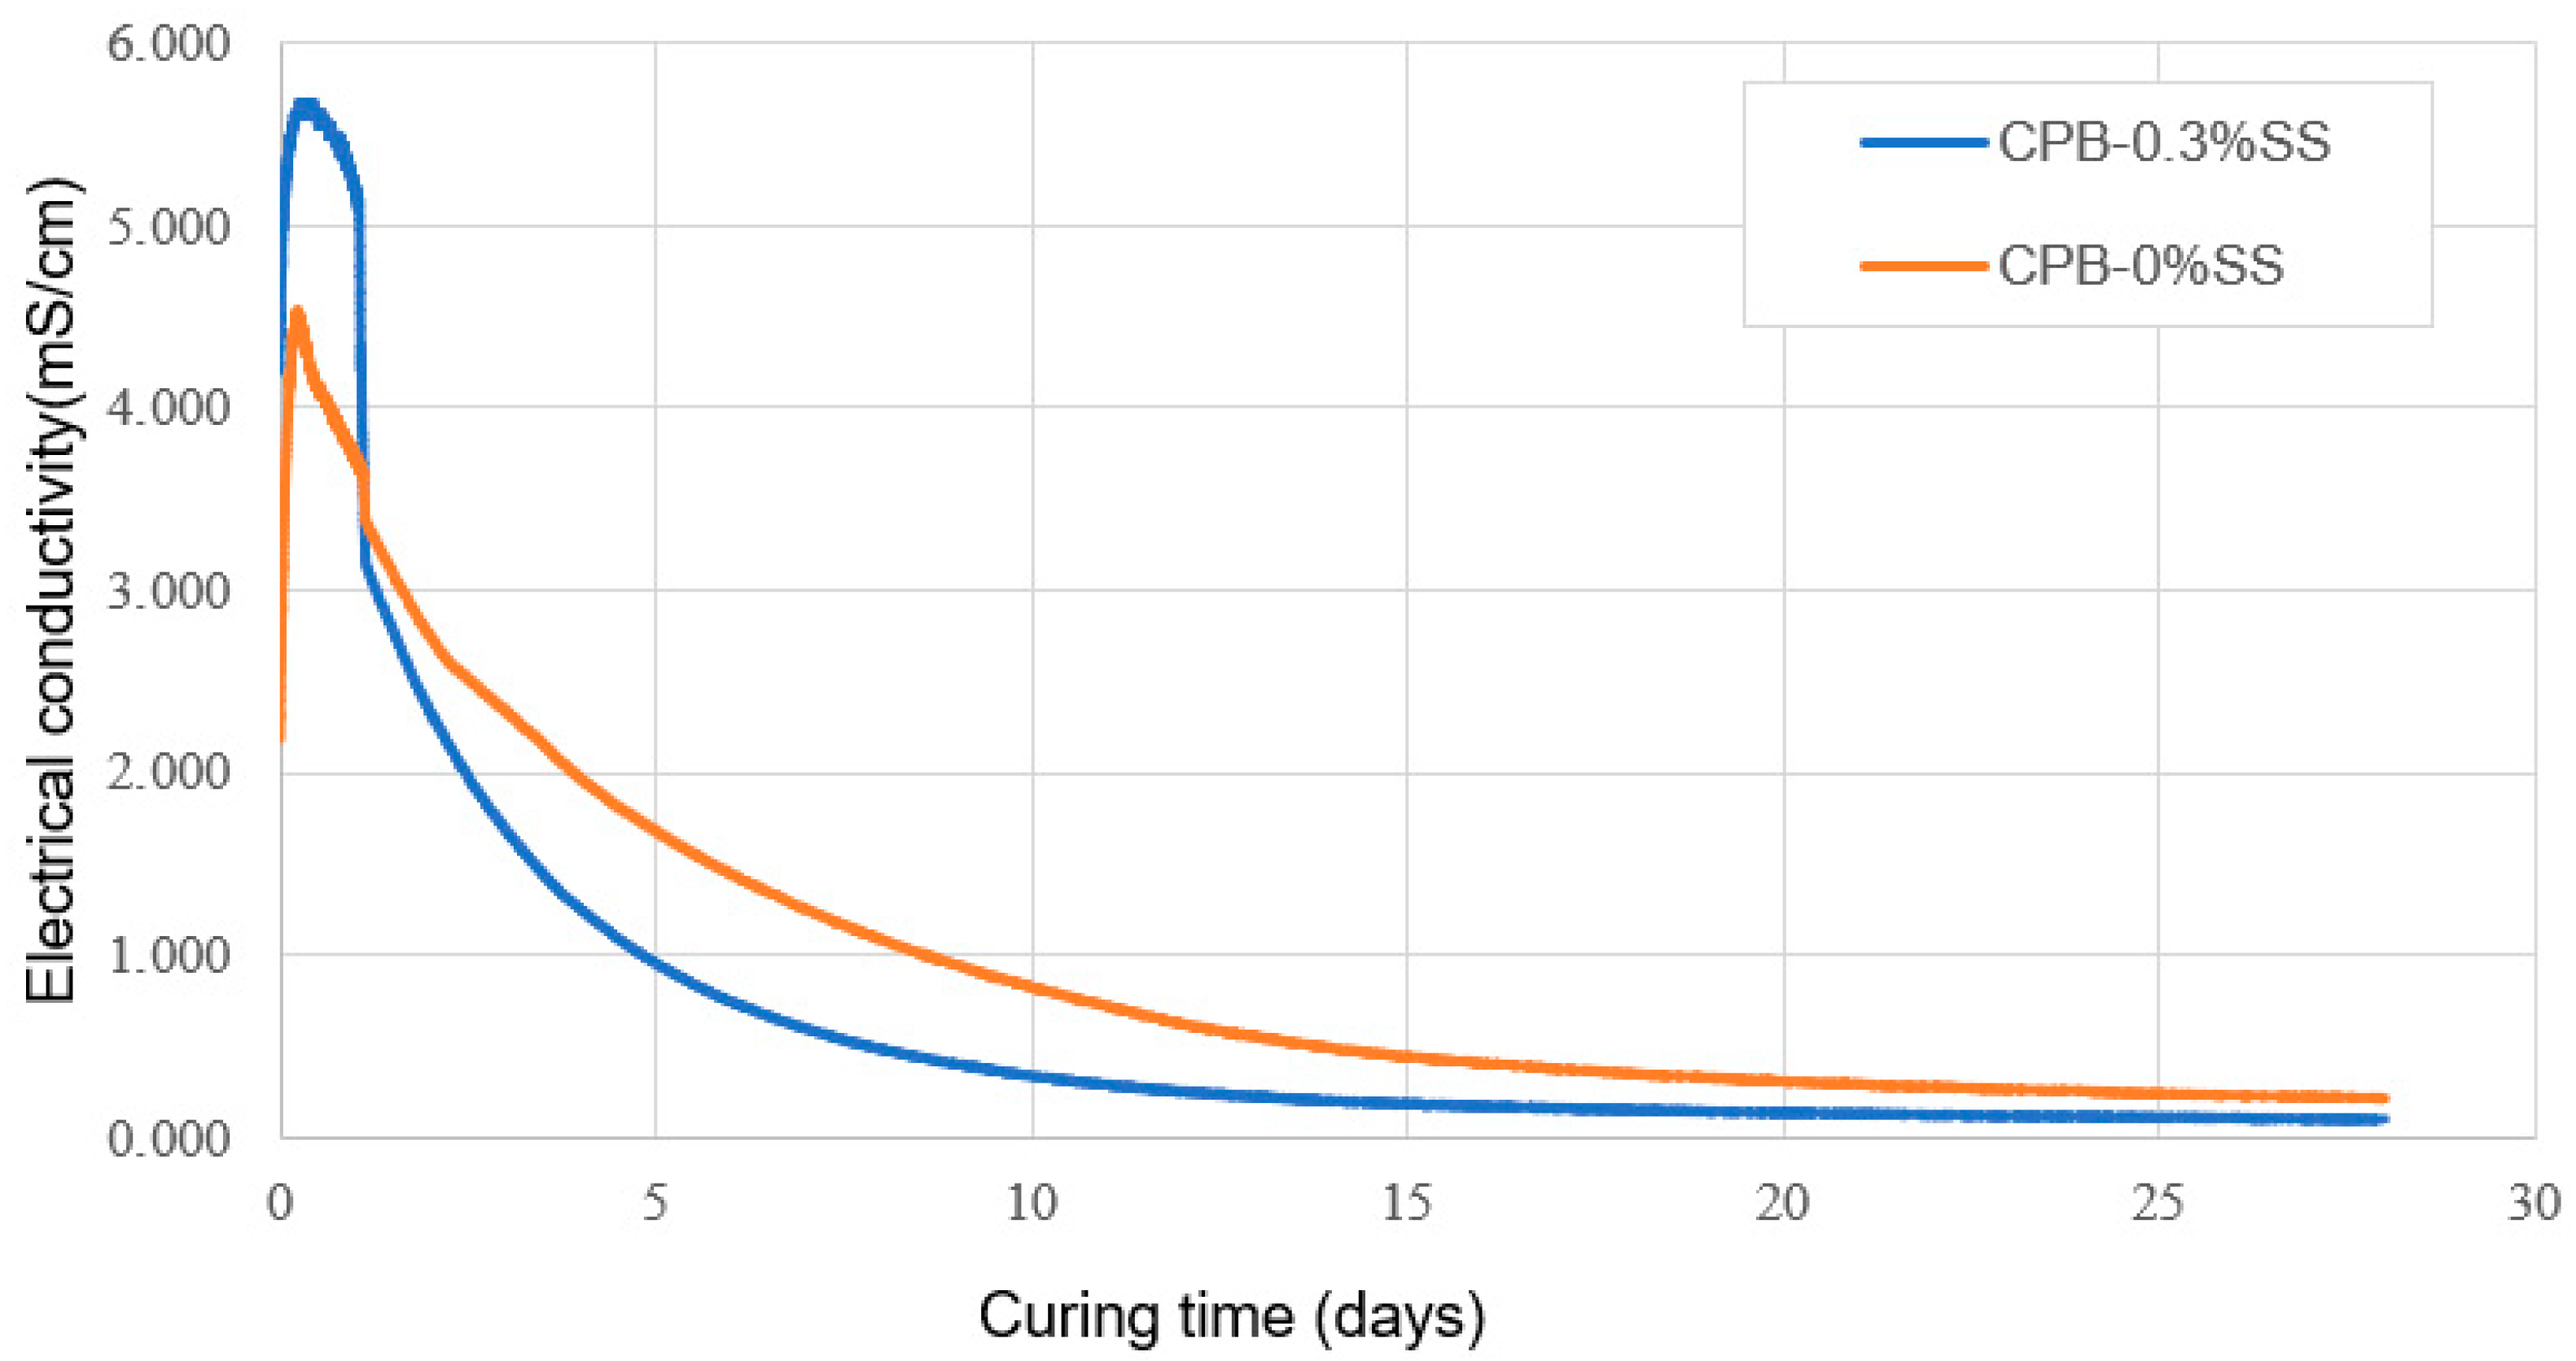
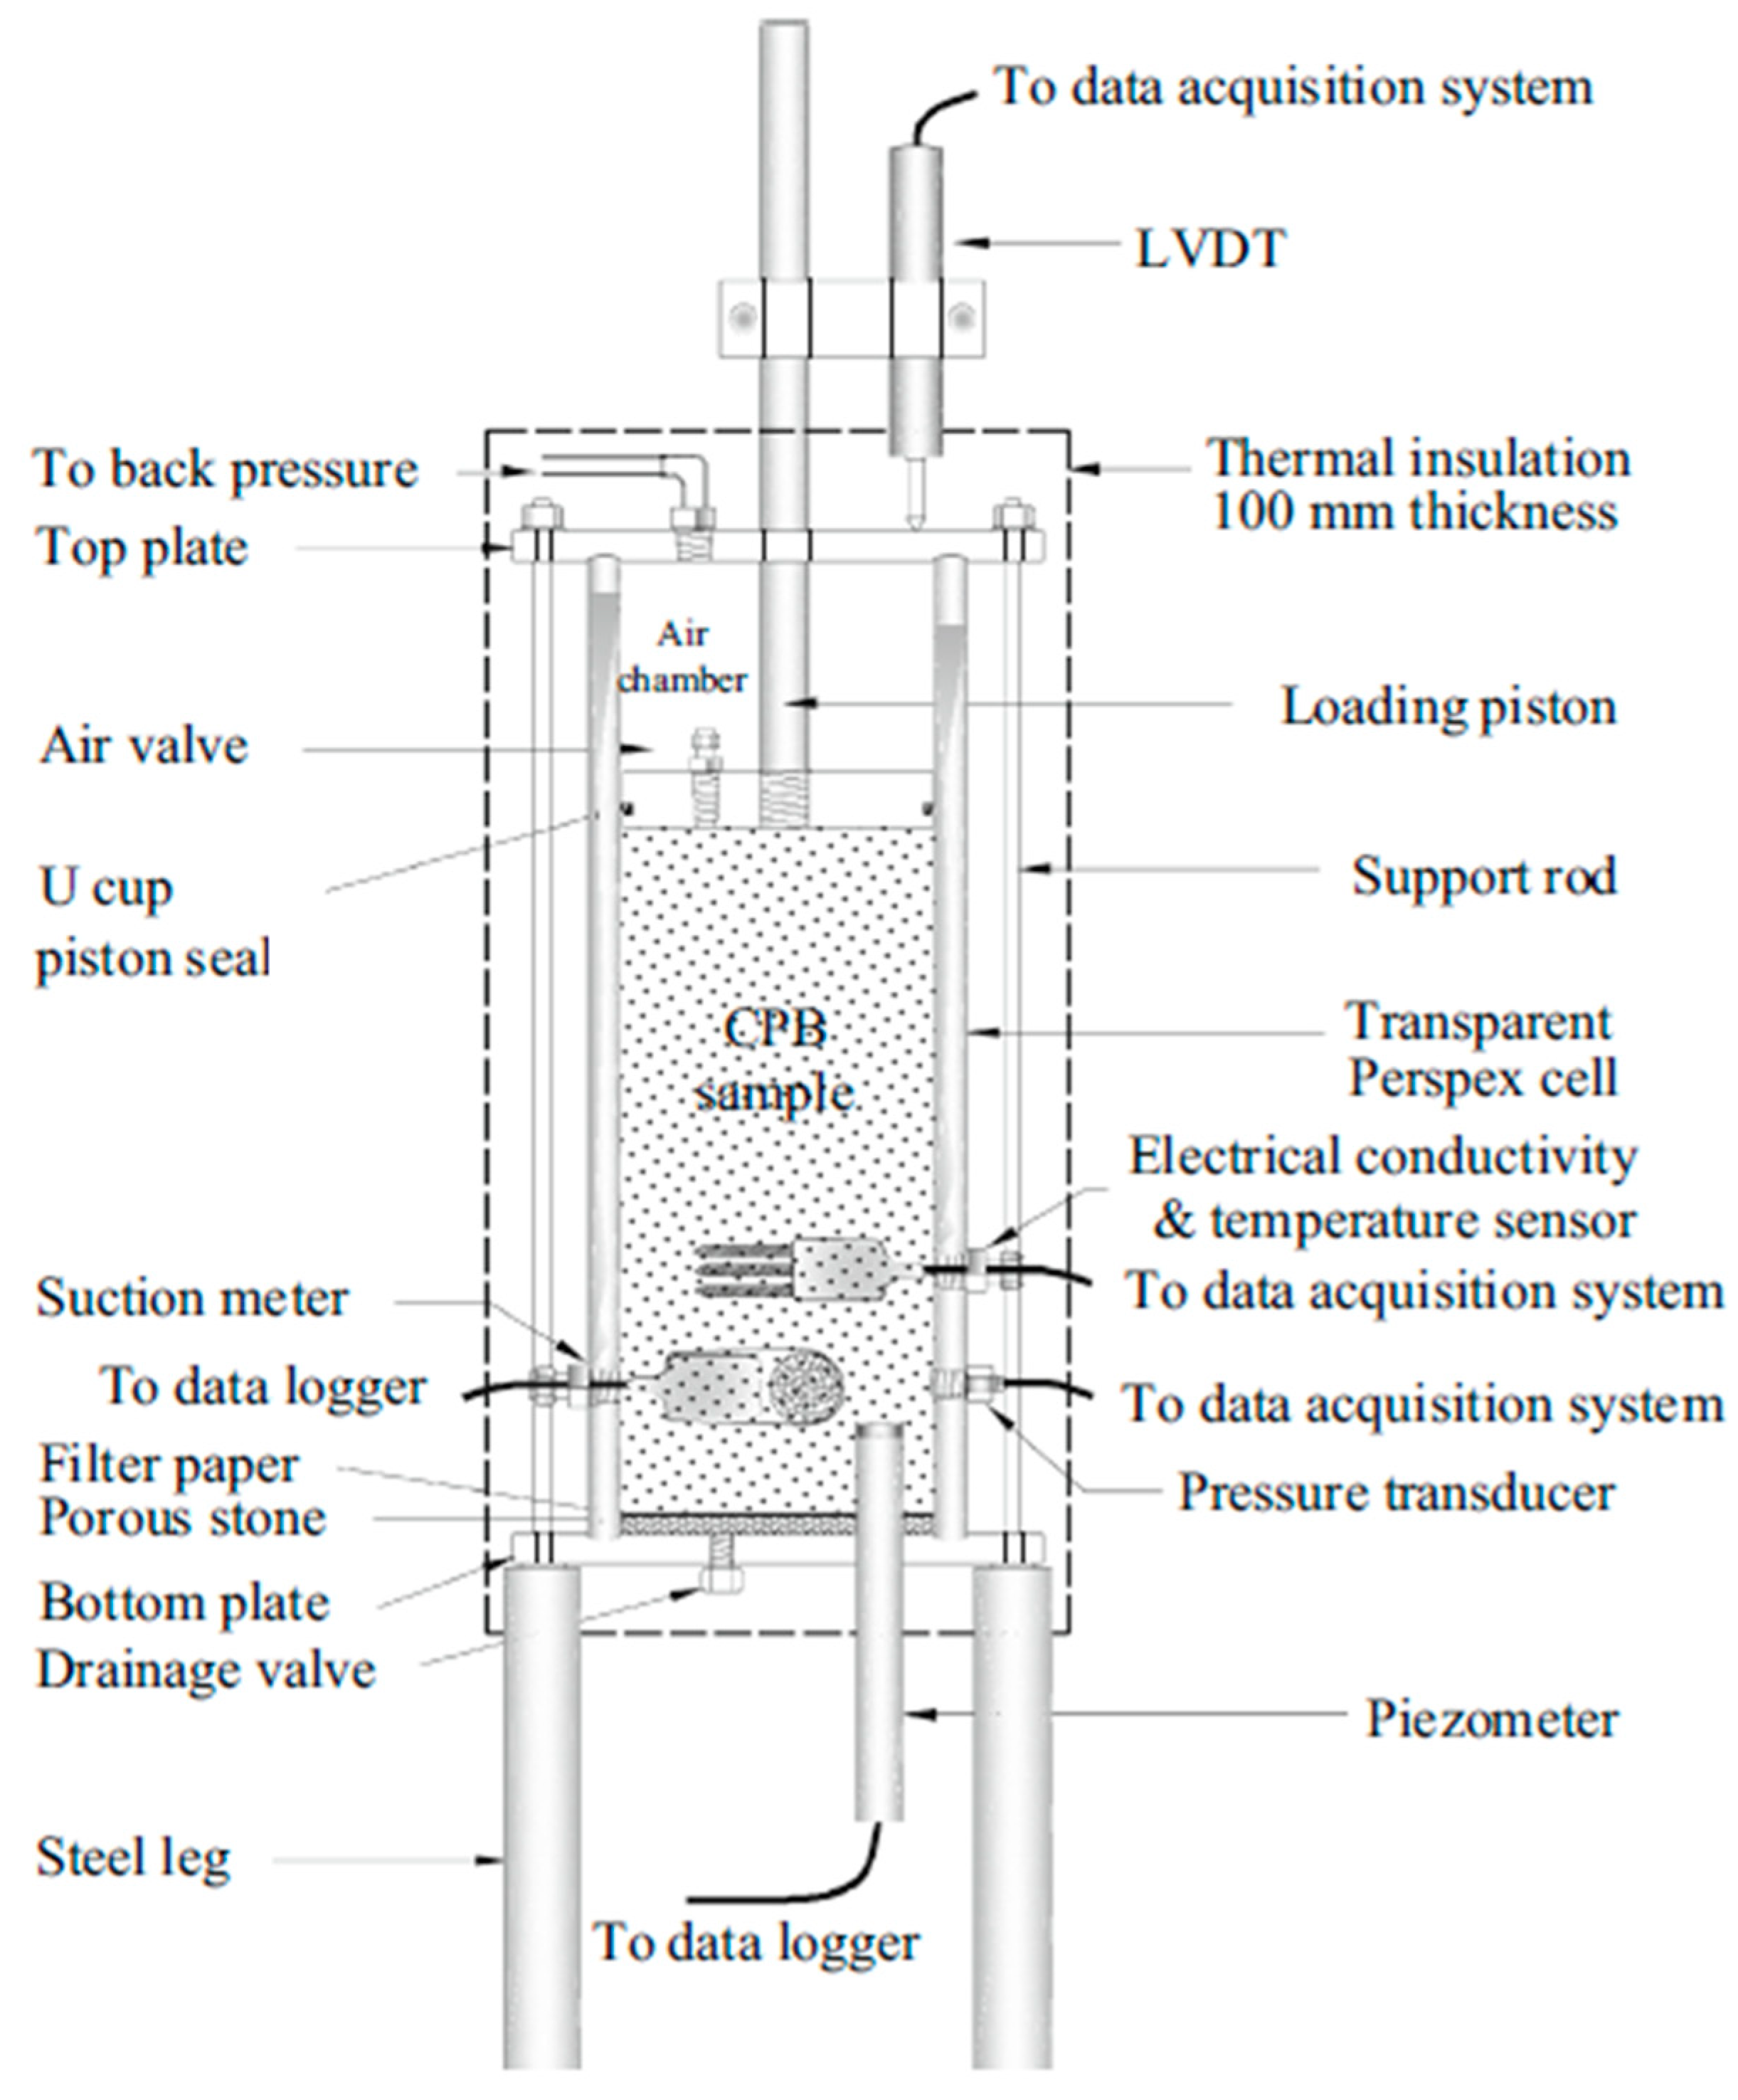
2.3.3. Monitoring Program

To gain a deeper insight into the hydration mechanism of CPB, the changes in various properties were monitored, including electrical conductivity (EC), temperature, volumetric water content (VWC), and suction. A 5TE soil moisture sensor (manufactured by METER Group (2365 NE Hopkins Court, Pullman, WA, USA) was utilized to measure EC, VWC, and temperature, while an MPS-6 sensor (manufactured by METER Group) was employed to monitor matric suction. The variations in EC in cementitious materials can provide insight into ion transfer that occurs due to chemical reactions. The 5TE sensor provides EC measurement with an accuracy of 10%, VWC with 3%, and temperature with 1 °C accuracy. On the other hand, an accuracy of 10% is achieved by the MPS-6 sensor when measuring between −9 kPa and −100 kPa. Using a cylindrical mold with a 10 cm diameter and 20 cm height, each monitoring device was placed at the center. Data acquisition was performed by connecting an EM50 data logger to a computer.

3. Results and Discussion

3.1. Strength Development of SS-CPB

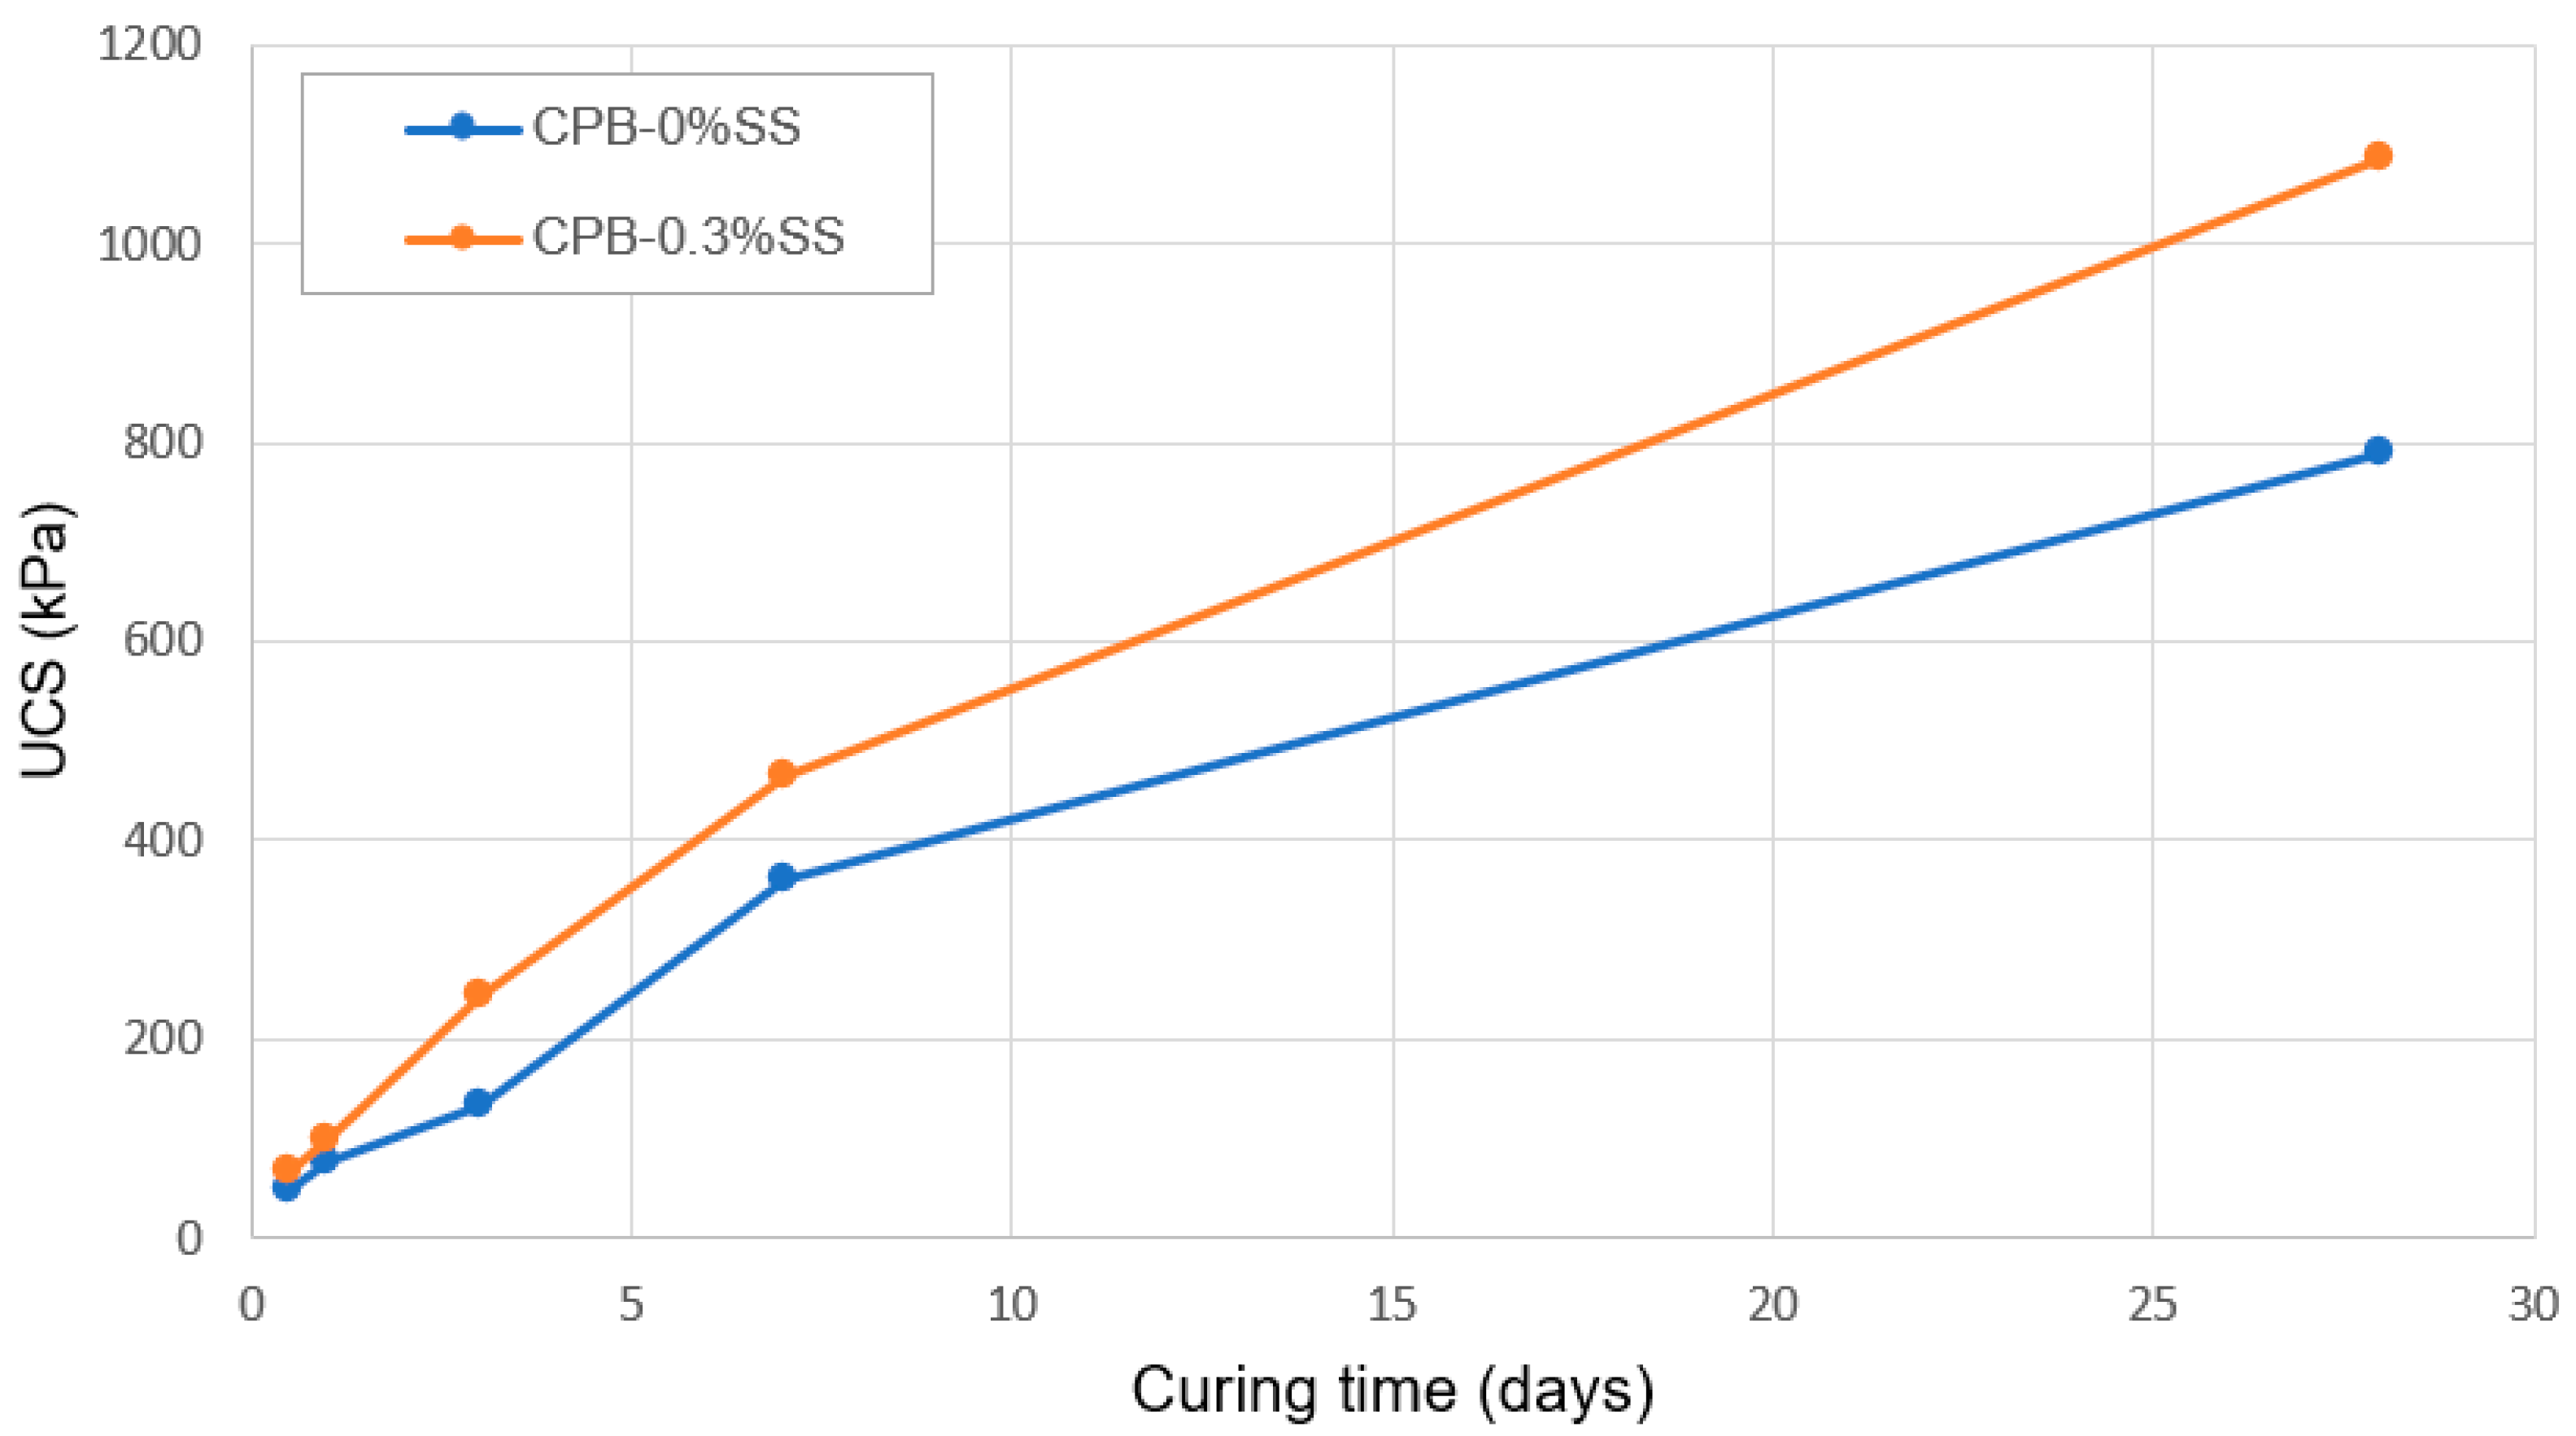
3.1.1. Relationship between Curing Time and Strength Development of SS-CPB

The impact of curing time on the strength of CPB with and without sodium silicate is illustrated in Figure 2. The figure unequivocally demonstrates that the UCS values rise as curing time increases, irrespective of whether sodium silicate is present or not. This increase is due to the higher degree of cement hydration that occurs with longer curing time [31]. This, in turn, causes the production of a greater amount of cement hydration products such as C-S-H and CH in the CPB medium. C-S-H plays a crucial role in cement hardening [32,33,34], and as more hydration products are precipitated over time, the cohesion and pore structure of the CPB system are refined, resulting in increased strength [7]. To further support this, TG/DTG analysis was performed on the cement pastes of samples CPB-0%SS and CPB-0.3%SS, which were cured for 28 days. As shown in Figure 3, this analysis demonstrated an increase in hydration products during the curing period. The figure depicts three peaks representing the decomposition of different products. The first peak, which occurs between 50 °C and 200 °C, is attributed to the loss of weight due to the dehydration of water molecules in hydration products such as ettringite, gypsum, and C-S-H [7,8,9,10,11,12,13,14,15,16,17,18,19,20,21,22,23,24,25,26,27,28,29,30,31,32,33,34,35]. The second peak at 400 °C–510 °C is the result of the dehydroxylation of CH, and the third peak or weight loss (650 °C–700 °C) is a result of calcite disintegration [7,35].
From Figure 2, it is also observed that the strength gain of the CPB with sodium silicate (SS) is faster than that of the CPB without SS. As the curing time increases, the discrepancy in UCS values between these two types of samples grows. Thus, these results suggest that the barricades for a CPB mass with SS could be opened earlier than those for a CPB mass without SS, resulting in increased mining productivity. Two factors contribute to the higher strength and strength gain rate of CPB-0.3%SS samples. In general, soluble SS doubly enhances the strength development of CPB-0.3%SS by acting as an alkaline activator and producing additional C-S-H [13]. The higher and faster strength development of CPB is linked to the presence of a greater amount of hydration products (e.g., C-S-H), which help to increase the cohesion of CPB samples and refine the pore structure. First, SS plays the role of an alkaline activator for the slag by generating hydroxide ions from the hydrolysis of the sodium silicate solution. The hydration rate of the slag is sped up by this alkaline activator, resulting in a larger volume of hydration products (e.g., C-S-H, CH). This is experimentally confirmed by the EC monitoring results of CPB with and without SS presented in Figure 4, which shows that there was a greater number of ions on the first day for samples with 0.3%SS than for CPB without sodium silicate, since the maximum CE value of CPB-0.3%SS reached 5.6 mS/cm. In contrast, the CPB specimens without SS reached a peak at 4.4 mS/cm. This peak was reached earlier for the sample with 0.3%SS than for the samples without SS, indicating that SS accelerates the hydration of the binder. In addition, SiO2 produced by the hydrolysis of the SS solution can react with CH(Ca(OH)2)—the remaining hydration product of the Portland cement—to generate additional C-S-H (hydrated calcium silicate), which is in agreement with the results of the TG/DTG analysis shown in Figure 3. This figure shows that the endothermic peaks and weight losses were higher for the CPB with SS than for the one without SS in the temperature range of 80 °C to 170 °C. In other words, more hydration products, such as ettringite, gypsum, and C-S-H, were formed in the CPB with SS [7,35]. The findings regarding the physical properties of CPB with SS (porosity, void ratio, and dry density) are depicted in Figure 5. The findings indicate that the pore structure of CPB is refined over time, which supports the development of strength. It is evident from the figures that the samples containing SS exhibit lower void ratios and porosity values and higher dry density when compared to the specimens without SS. This implies that sodium silicate addition improves or refines the pore structure of CPB.

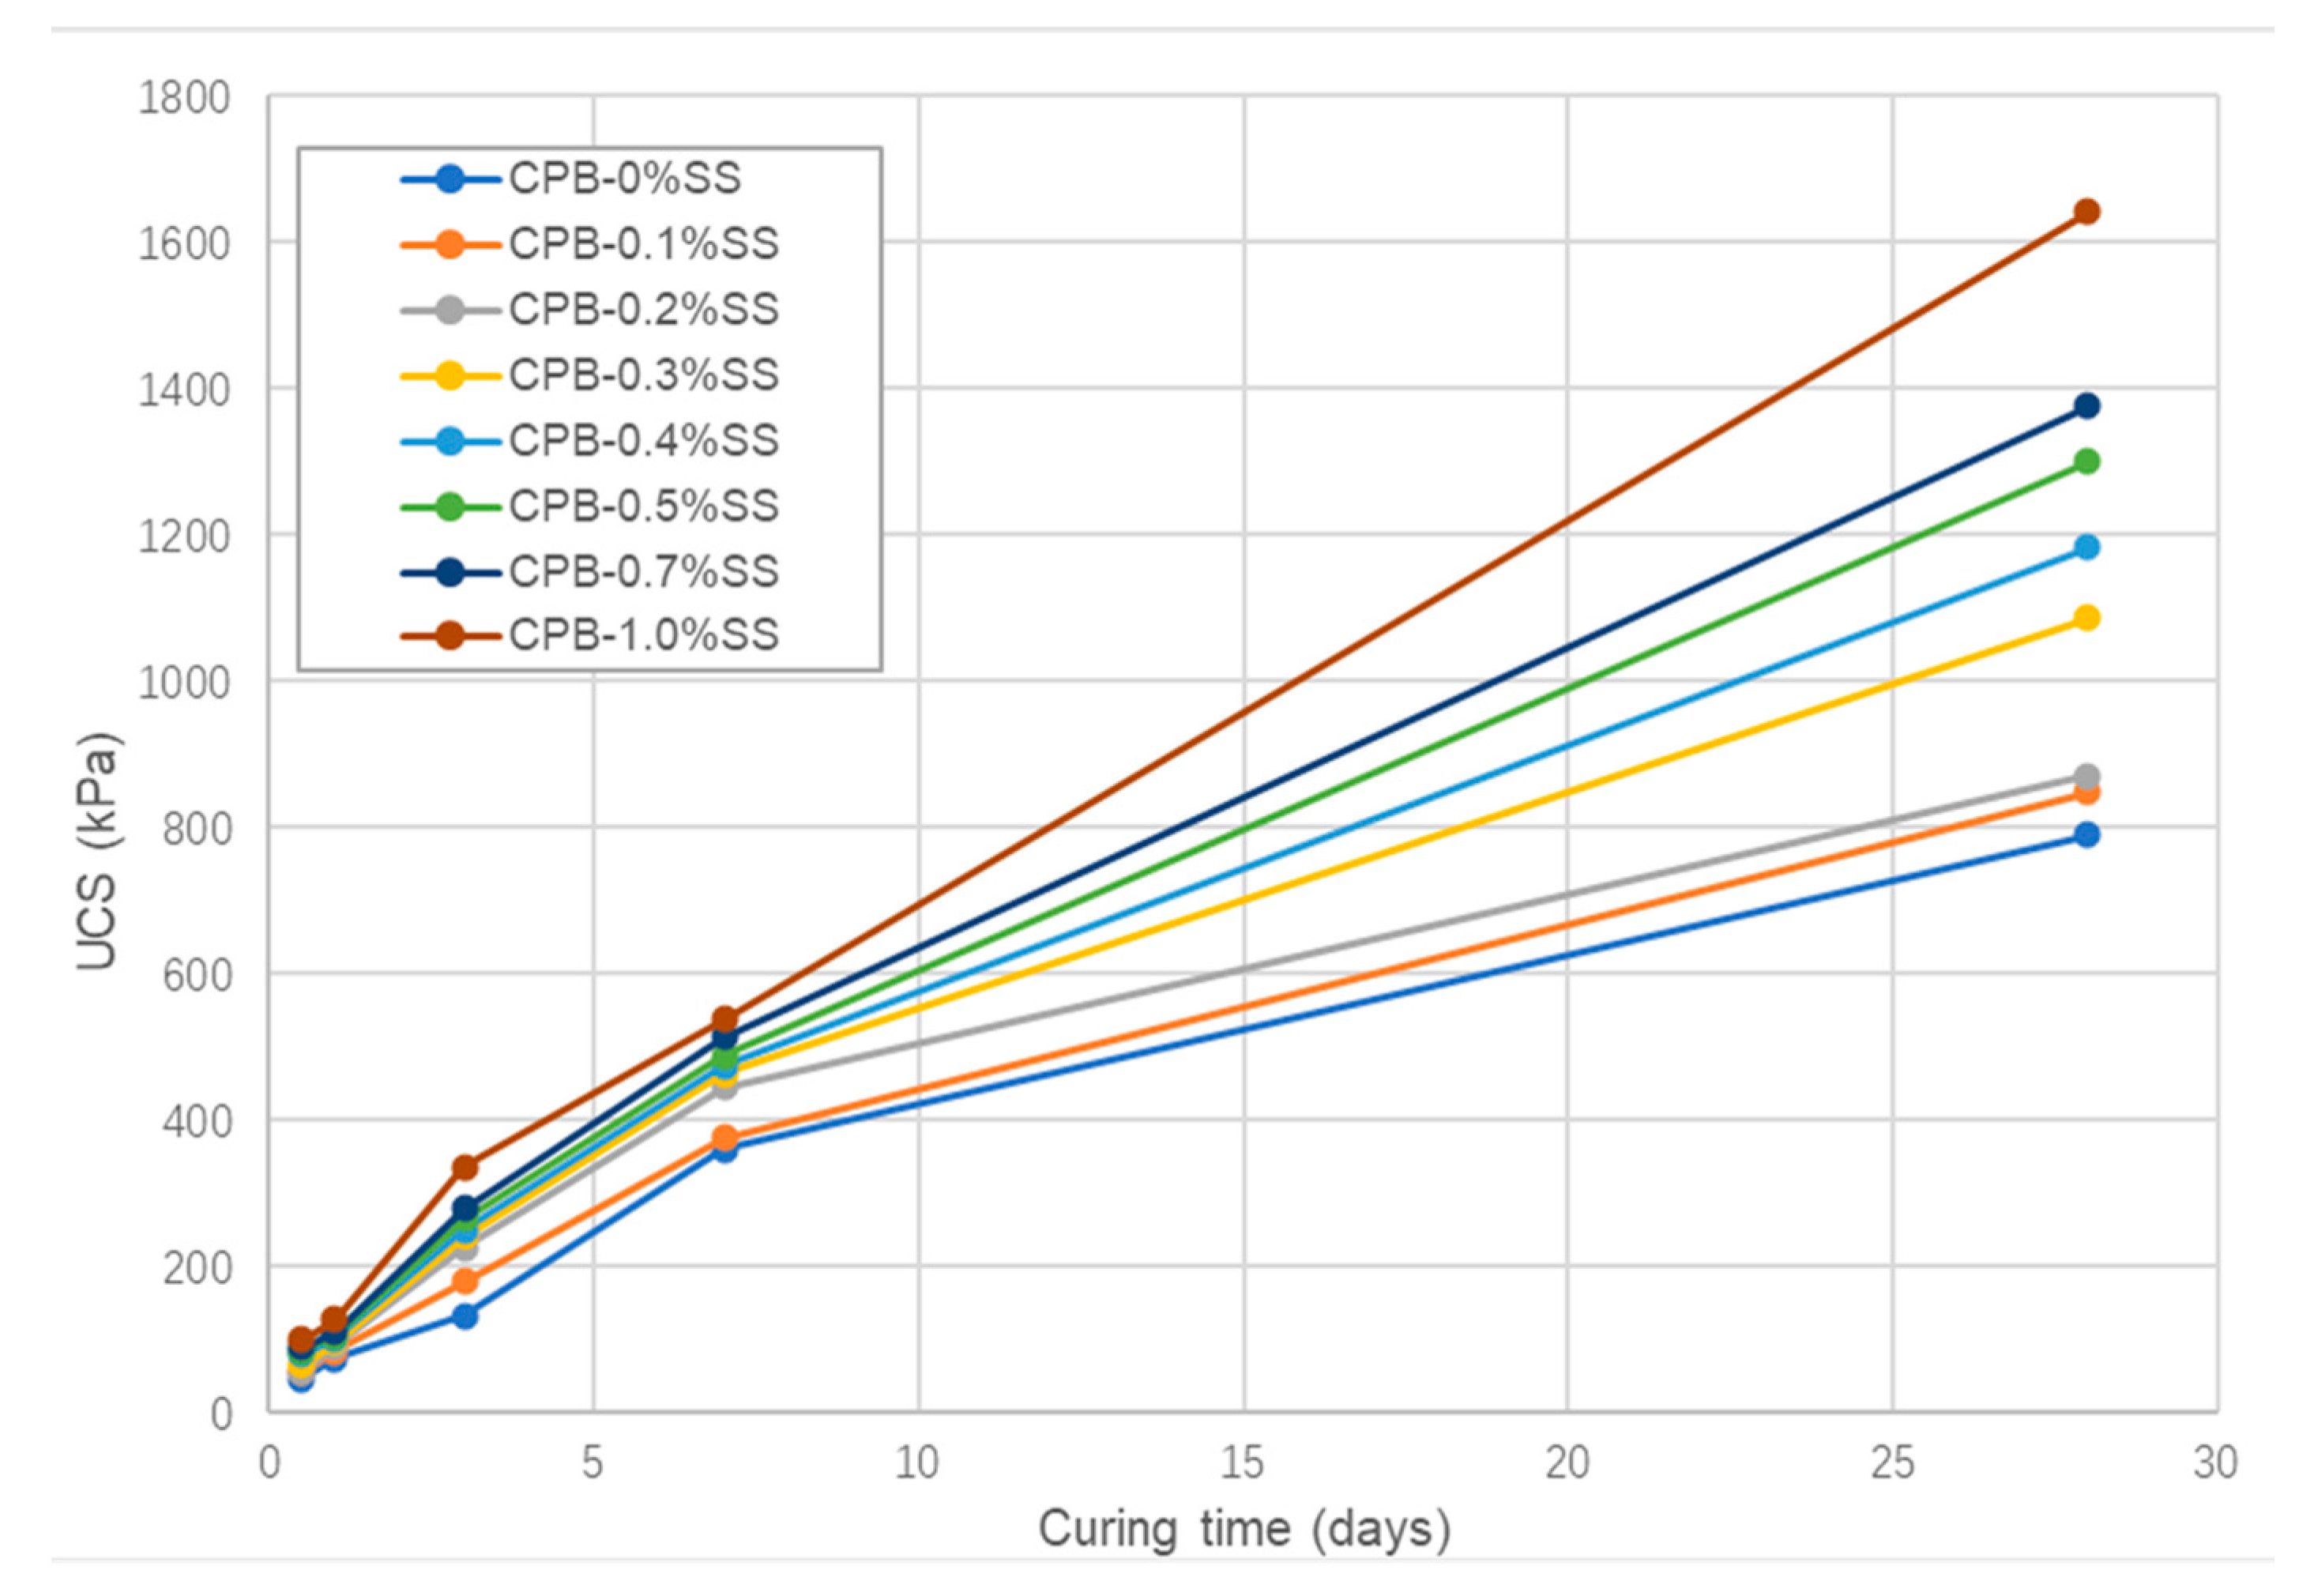
3.1.2. The Role of SS Content in the Strength Growth of CPB

Figure 6 shows the UCS results of CPB samples with various proportions of sodium silicate and different curing times. It is evident that the strength of CPB specimens is notably affected by the proportion of SS added to the samples, irrespective of the curing time. The CPB strength increases with increasing SS content. The explanation for this is that an increase in SS content leads to an increase in slag activation and enhances binder hydration. Consequently, more hydration products are created, the CPB pore structure is further refined, and the strength of the CPB increases. This refinement of CPB pore structure as SS percentage rises is shown by the effect of SS content on the change in void ratio, porosity, and dry density of CPB with time (Figure 5). This figure shows that specimens with higher SS percentages have lower values for porosity (Figure 5a) and void ratio (Figure 5b), with higher dry density (Figure 5d). Furthermore, Figure 5c reveals that the water content of CPB decreases as the SS content increases, i.e., more water is consumed in CPB samples with higher SS content. Higher water consumption means lower pore water pressure or higher suction in the backfill samples and thus higher strength [35].

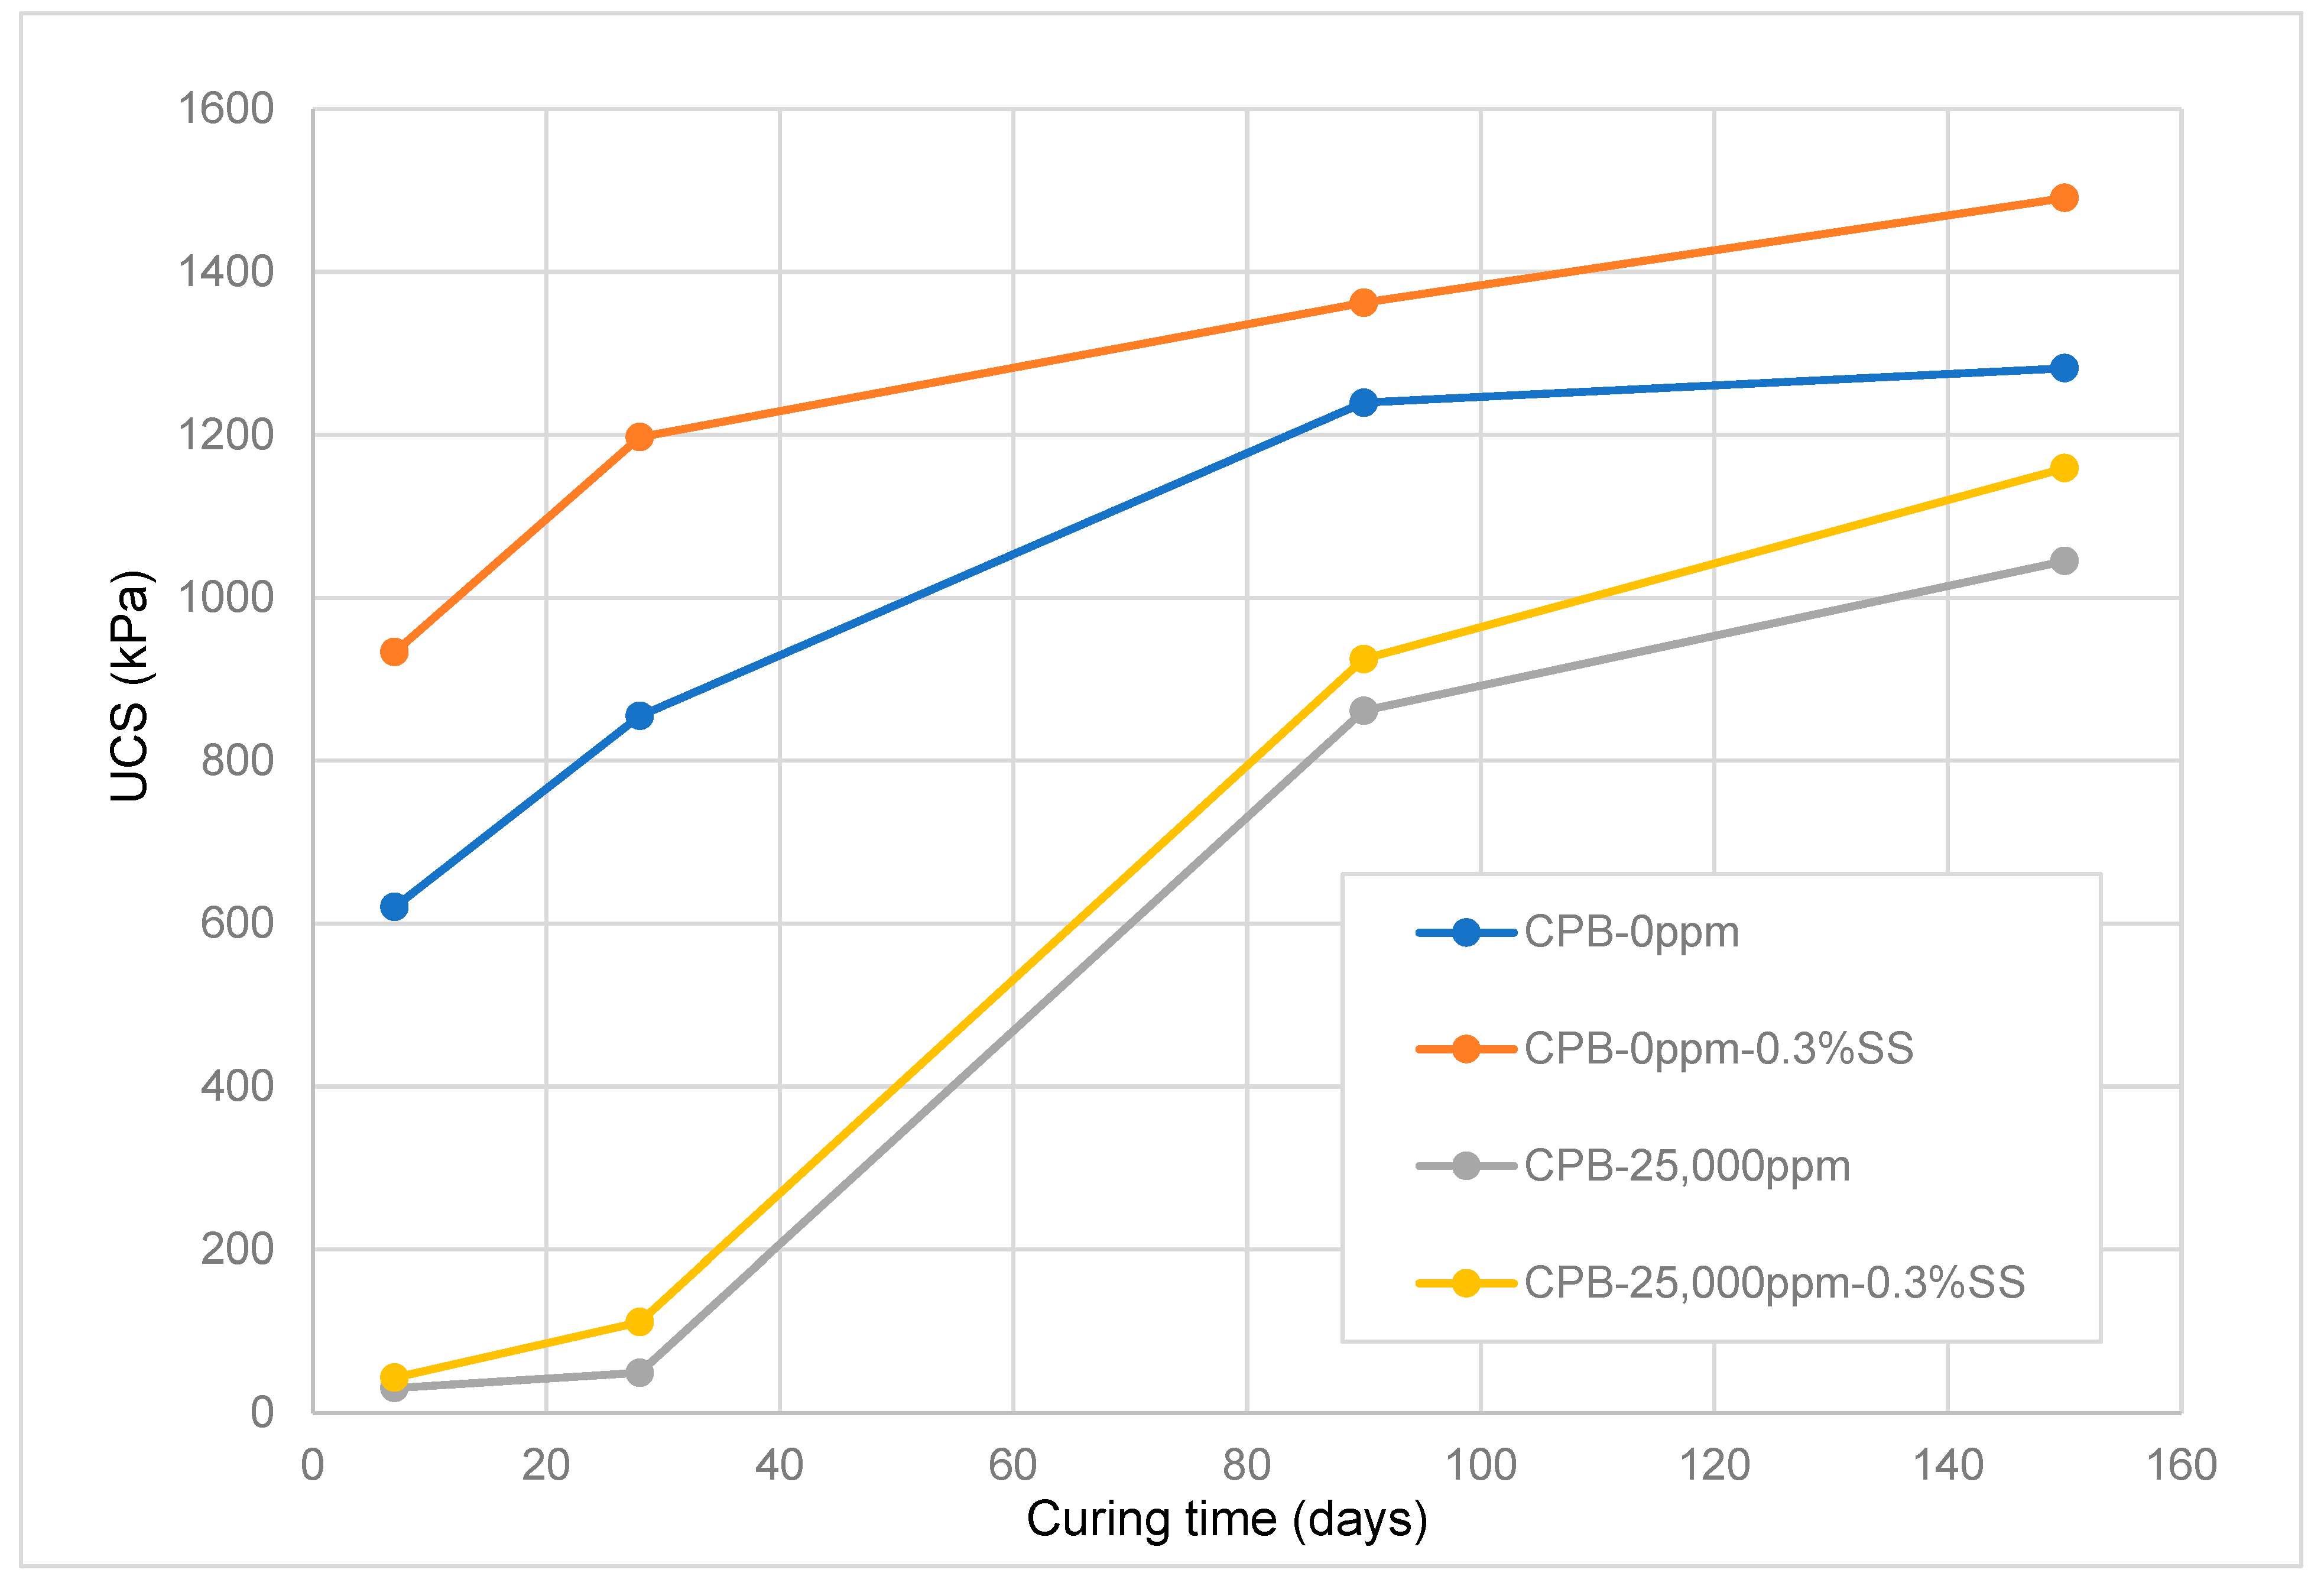
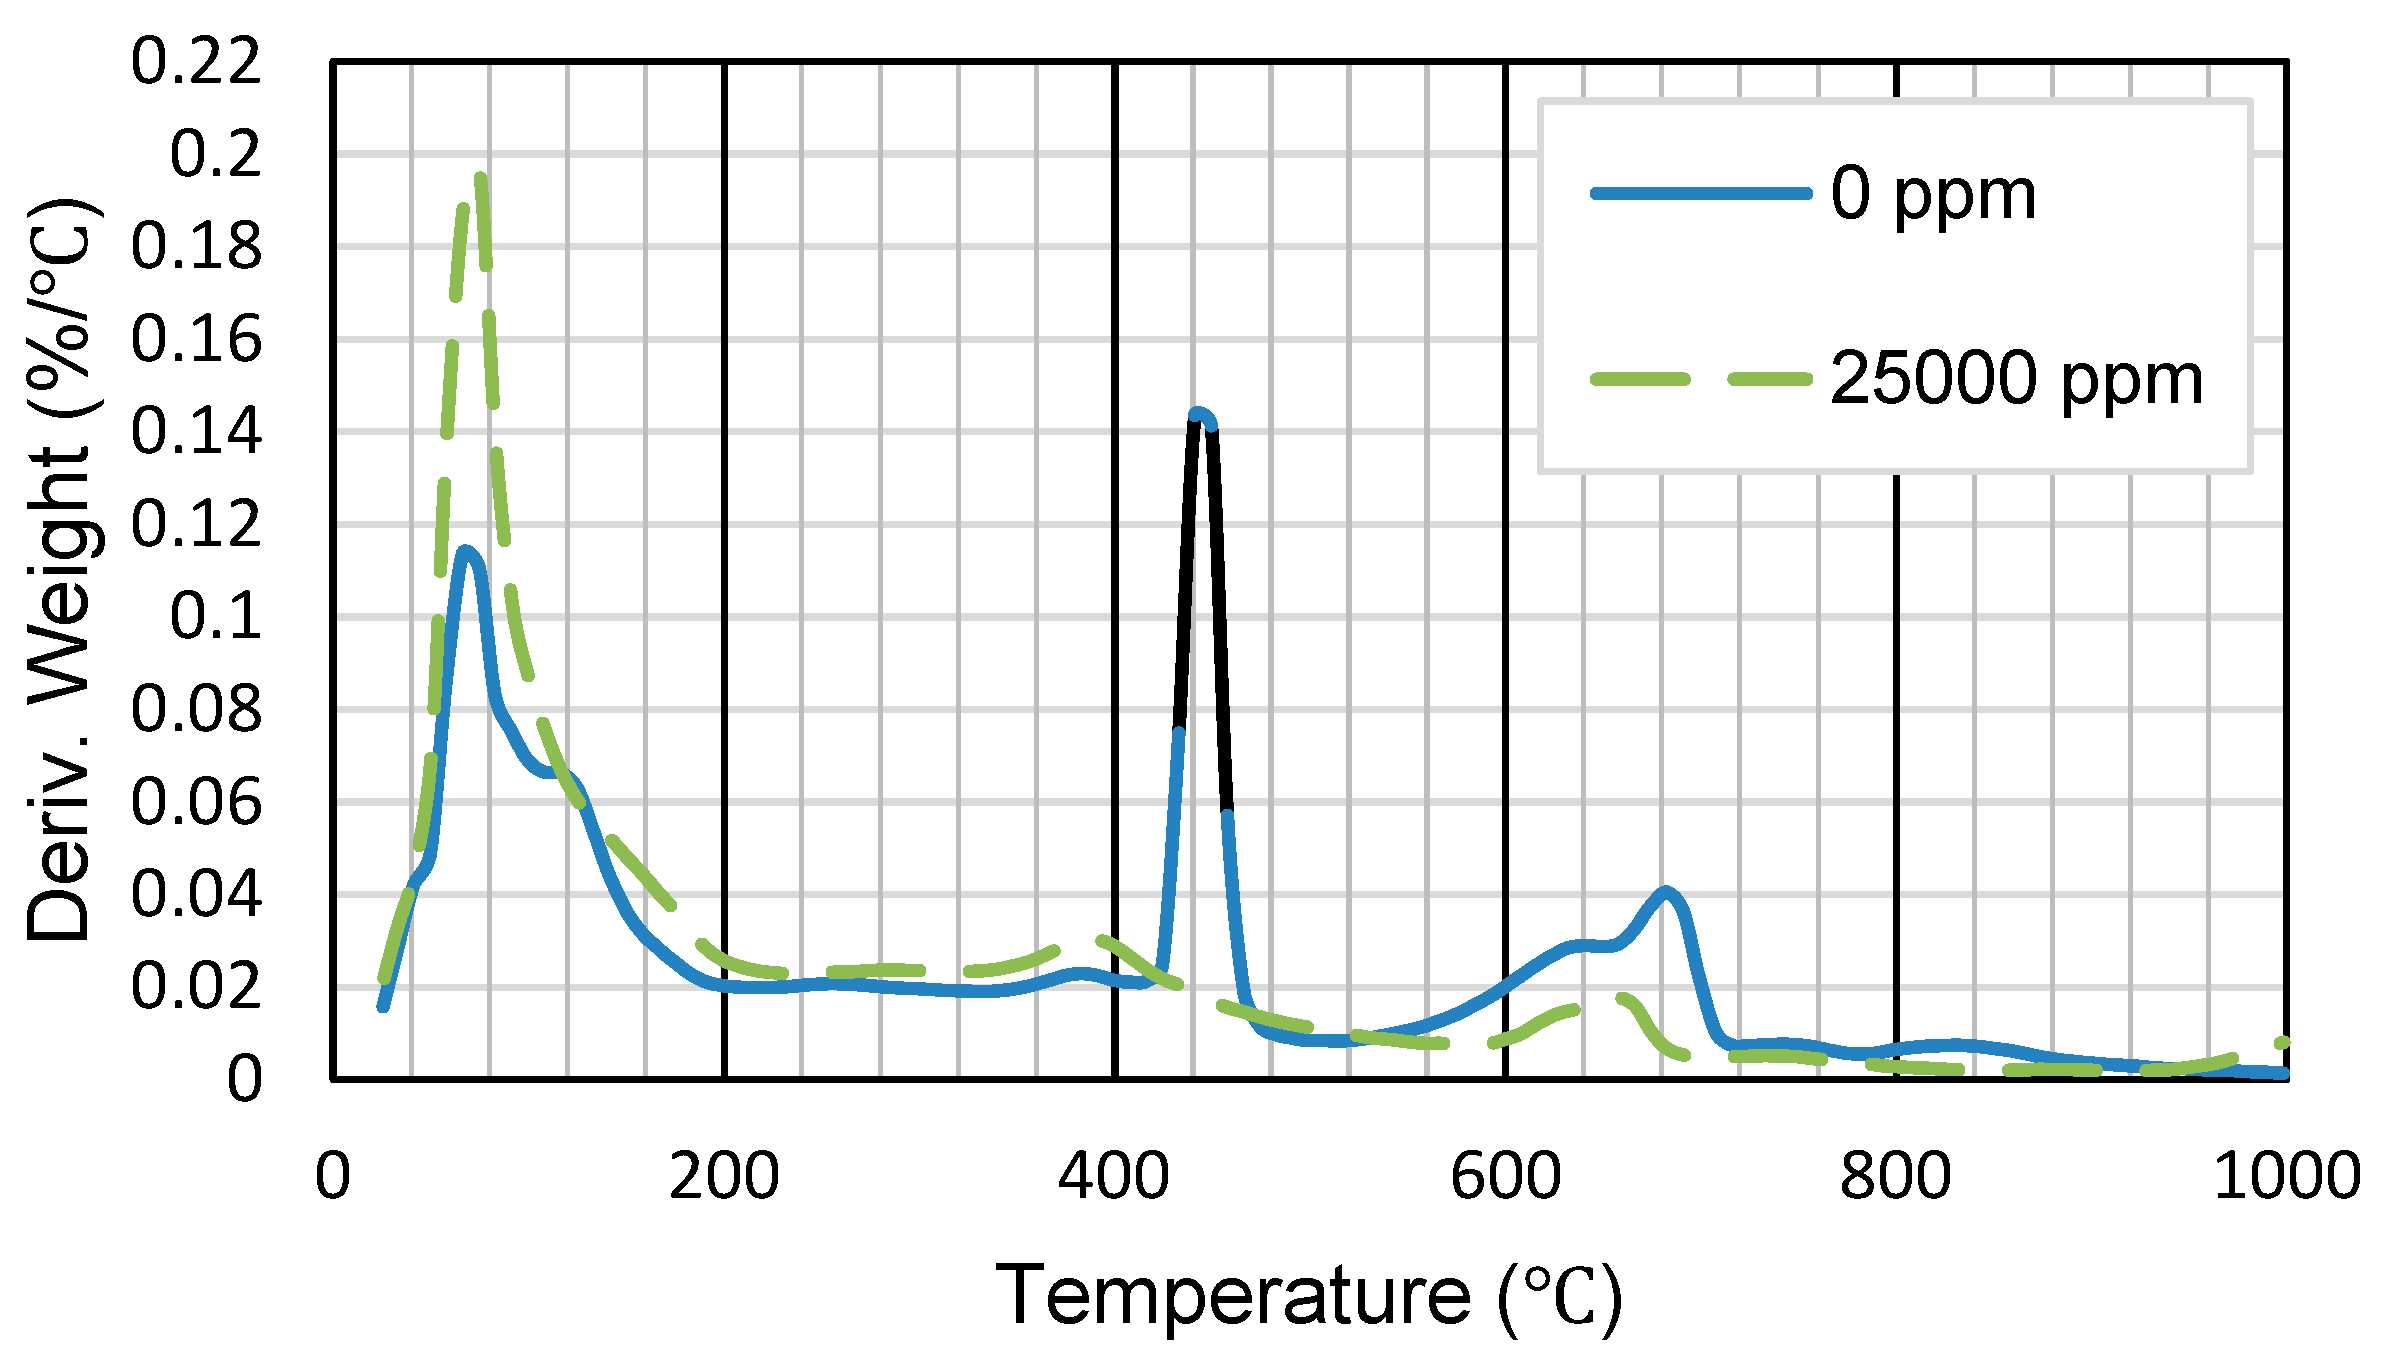
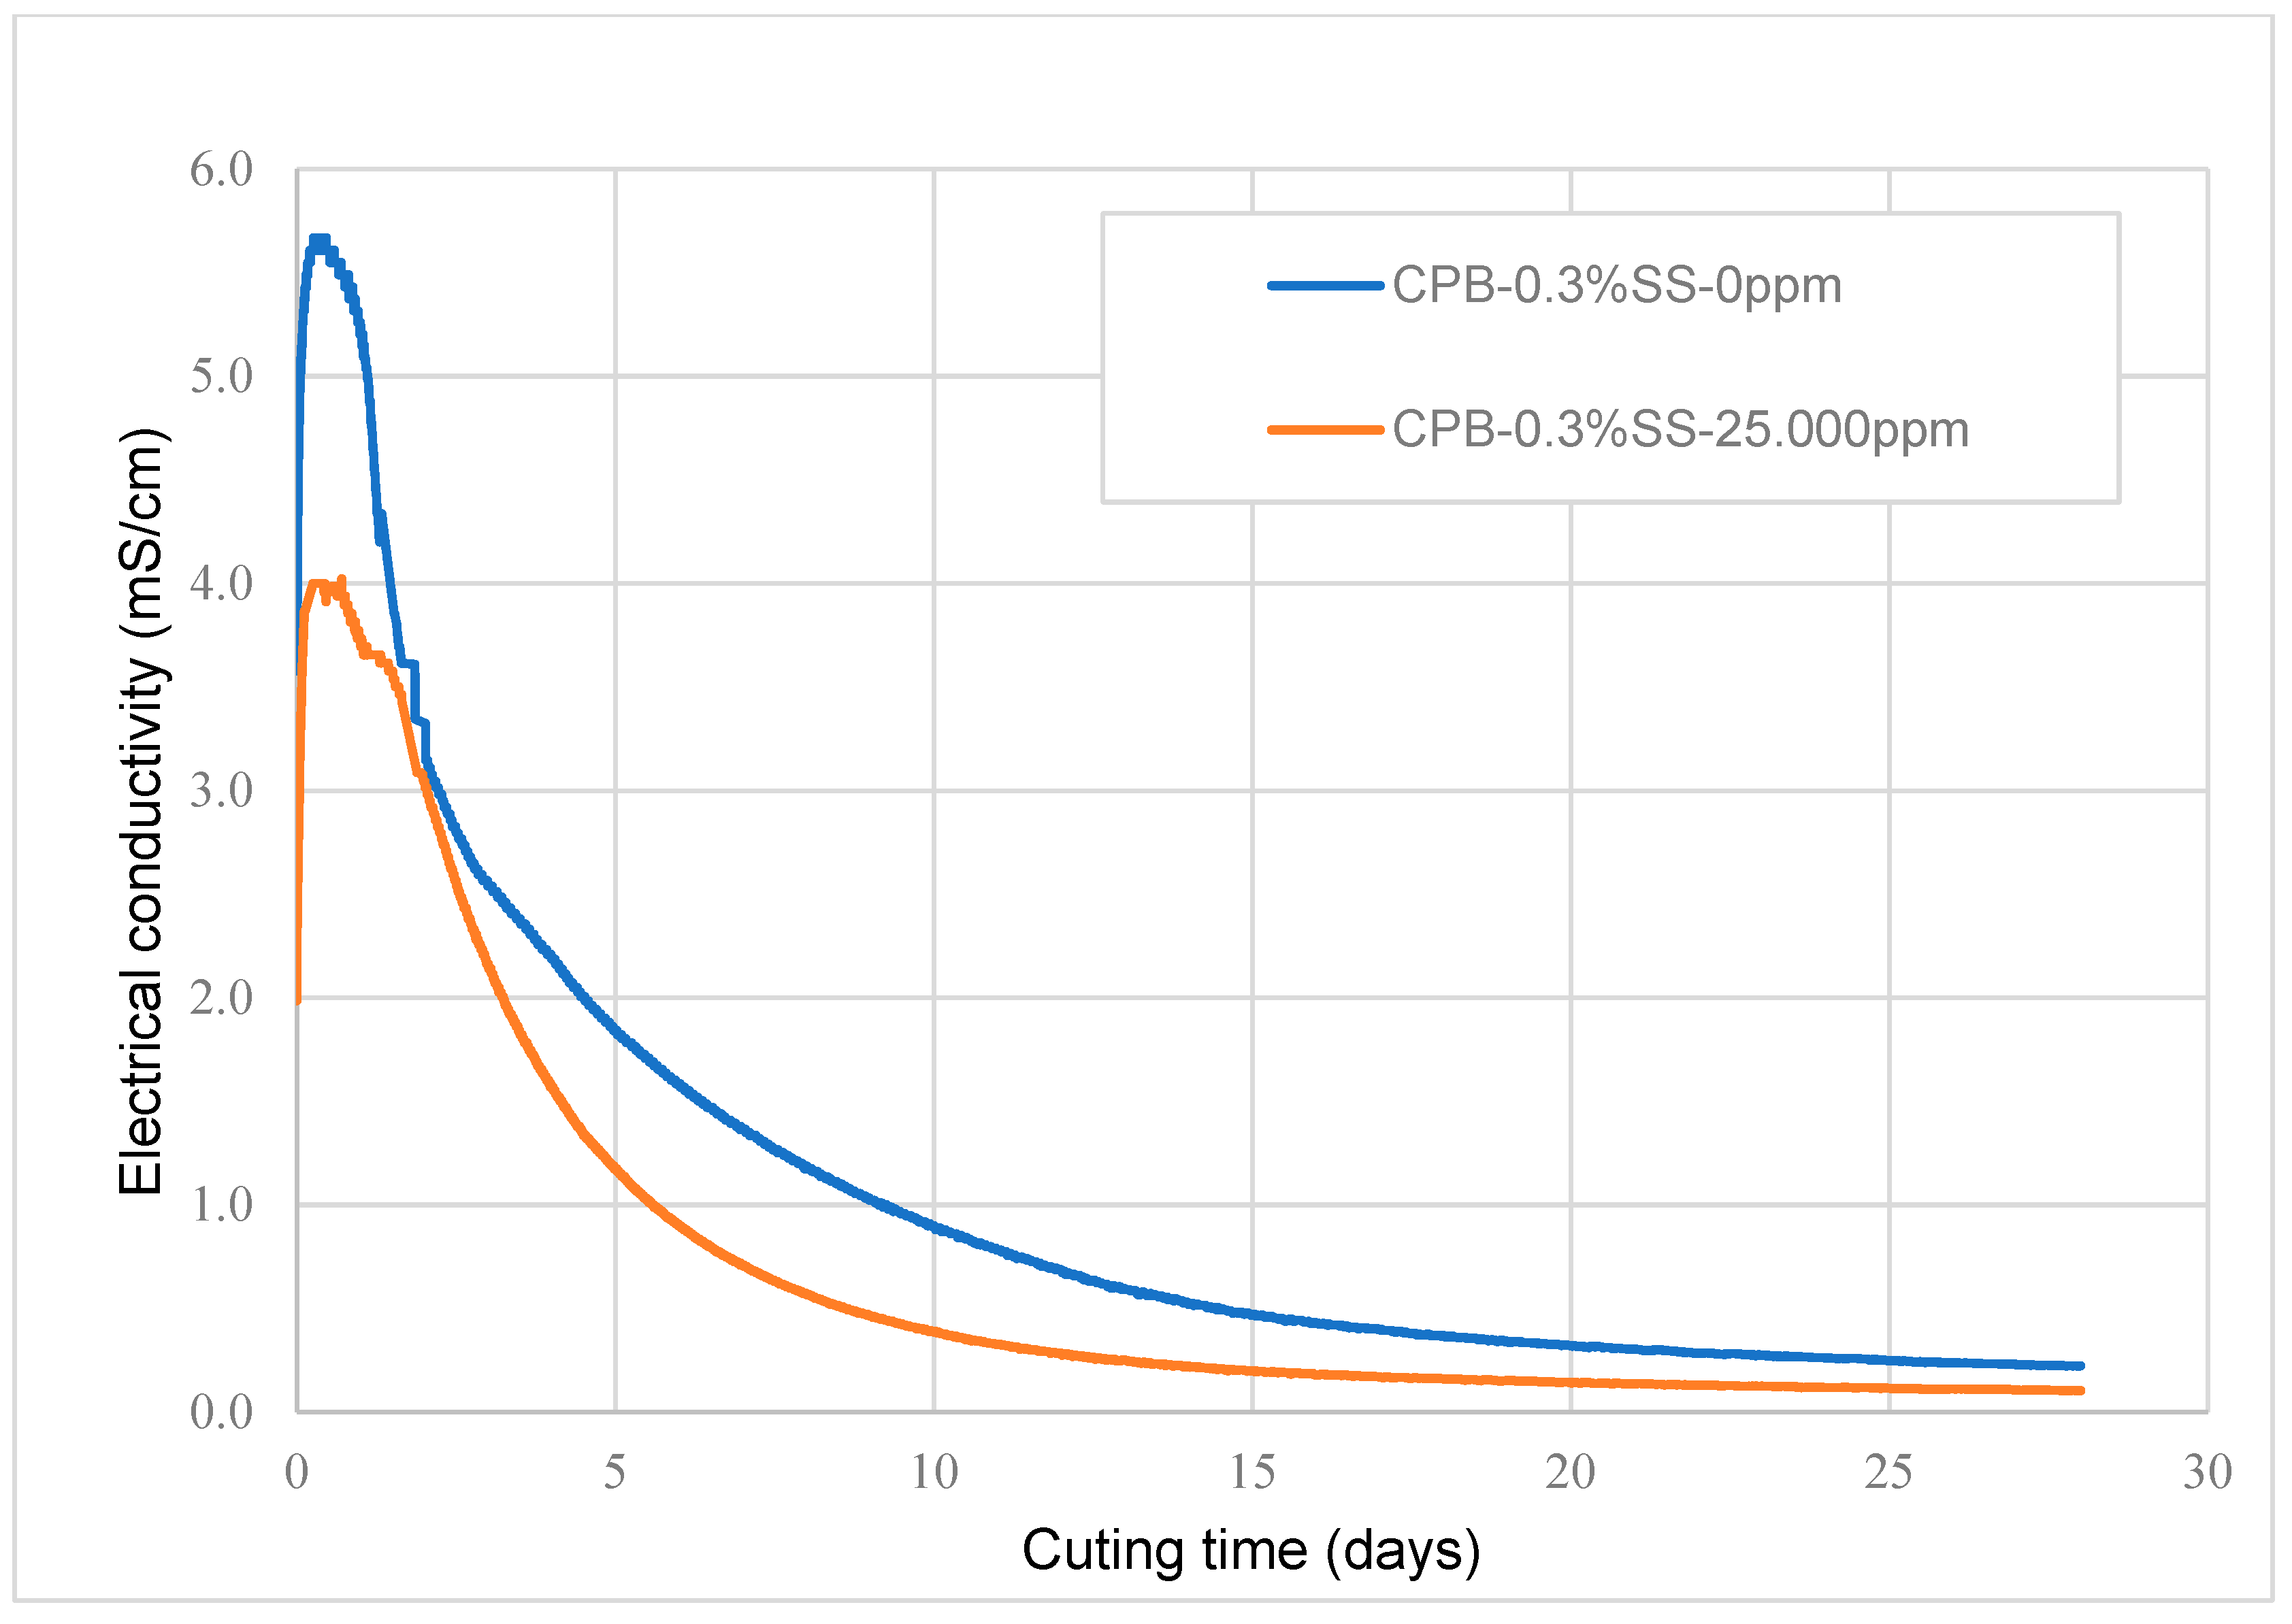
3.1.3. Impact of the Chemical Composition of Mixing Water (Sulfate Content)

In practice, the CPB found in hard-rock mines can possess varying concentrations of sulfate ions, ranging from low (≤5000 ppm) to high concentrations (25,000 ppm), due to multiple reasons such as the oxidation of sulfide minerals in tailings and the utilization of mine process water as mixing water [8,36,37] (. Consequently, the impact of sulfate on the strength development of SS-supplemented CPB was examined. Figure 7 exhibits the influence of sulfate on the strength development of SS-CPB. The presence of sulfate ions significantly impacts the UCS of SS-CPB in both the short and the long term. Irrespective of the SS content, the CPB specimens with sulfate ions exhibit lower strength than those without sulfate at 7 days and 28 days. However, after 28 days of curing, the strength of CPB samples with sulfate increases significantly with time. The mechanism of action of sulfate ions inhibits and delays the hydration reactions of the binder at an early point, thereby impeding the strength development of CPB [7,37,38,39]. The inhibition of binder hydration induced by sulfate ions was verified through the EC monitoring, MIP tests, and TG/DTG analyses carried out on SS-CPB specimens with and without sulfate, as presented in Figure 8, Figure 9, and Figure 10, respectively. The EC results in Figure 8 reveal that the sulfate ions delay the hydration process of the cement, leading to the creation of a smaller amount of hydration products in the sample with 25,000 ppm of sulfate ions. The results of TG/DTG analyses performed on the cement paste samples prepared with and without sulfate and cured for 28 days, as illustrated in Figure 9, demonstrate the formation of a smaller quantity of hydration products in the sample with sulfate. This presence of a greater amount of hydration products in the sample without sulfate gives these samples a finer pore structure, as indicated by the MIP test results presented in Figure 10. The samples without sulfate exhibit a denser pore structure and finer pores than CPB-0.3%SS with sulfate. Studies by [40] suggest that the mechanical strength of CPB with a denser pore structure is higher than that of samples with a coarser pore structure. This perspective aligns with the fact that the UCS values of the specimens without sulfate that cured for 28 days are higher than those of the CPB-0.3%SS-25,000 ppm samples.
Furthermore, Figure 7 indicates that CPB with sodium silicate and sulfate ions has slightly higher UCS values than that without SS and with sulfates, regardless of curing time. In other words, CPB preparations with SS have slightly higher resistance to sulfate attacks than samples without SS. This can be ascribed to the fact that, as shown above, SS promotes binder hydration and thus produces more binder hydration products, giving CPB samples with SS higher strength.

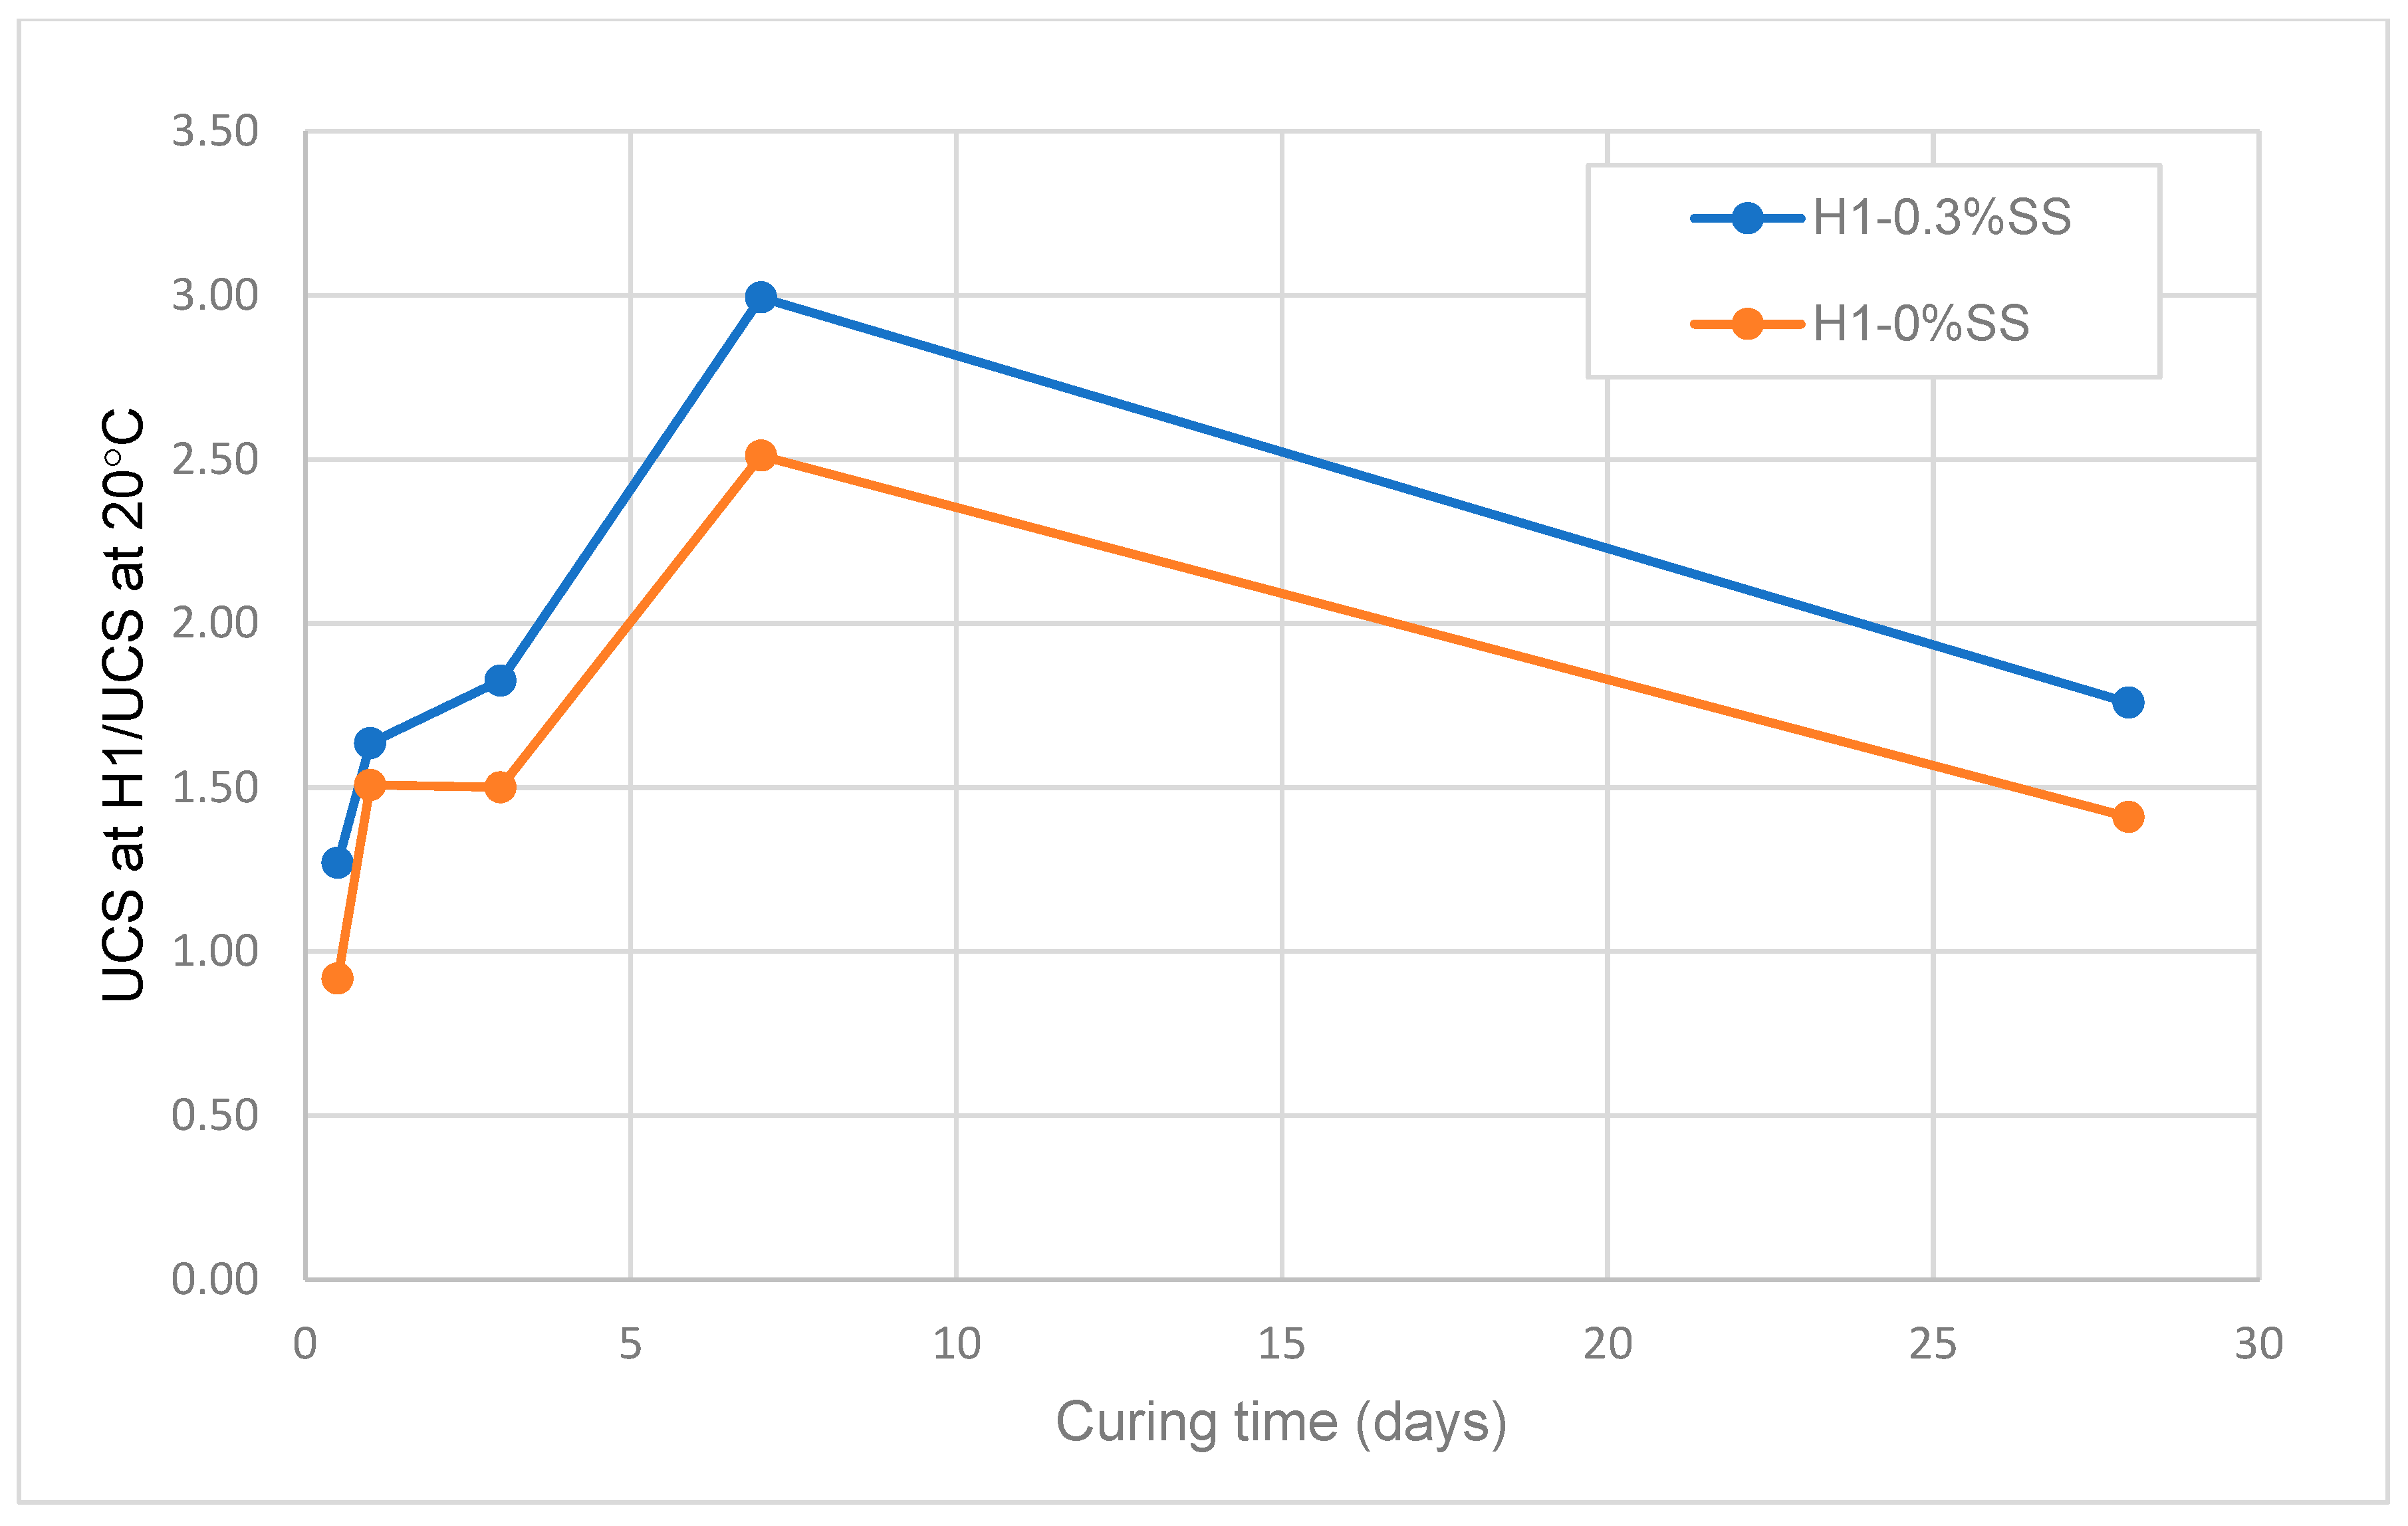
3.1.4. Effect of Non-Isothermal Curing on the Strength Development of SS-CPB

In the field, the backfill mass is subjected to non-isothermal curing conditions primarily related to the heat generated in the backfill structure by the hydration of the binder. To facilitate the transfer of laboratory results to the field, it is necessary to subject SS-CPB samples to curing temperatures that are similar to those encountered in the field. This will provide a better understanding and evaluation of the strength development of SS-CPB in the field. Thus, five sets of CPB specimens were cured following the temperature histories shown in Figure 11 to investigate the influence of non-isothermal field curing conditions on the strength development of SS-CPB. Each set of samples was cured for 0.5, 1, 3, 7, and 28 days in a temperature-controlled chamber under different field temperature histories (H1 and H2; Figure 11) to simulate the non-isothermal curing conditions of CPB in the field or at constant room temperature (~20 °C), which served as a control (Figure 11). This chamber had an interior space for sample curing. A heating blanket surrounded the chamber and heated it until it reached a specific temperature. A controller with a temperature sensor provided power to the heating blanket when the chamber temperature was below the set value. A 100 mm thick insulating material covered the chamber to prevent heat loss. H1 and H2 showcase the temperature–time history at 2.5 m above the bottom of two CPB structures, measuring 20 m × 10 m and 5 m × 2.5 m (in height and width). The numerical backfill temperature prediction tool established by ref. [41] was used to obtain the temperature–time histories, and it has been successfully tested and validated against numerous field and laboratory backfill temperature monitoring data (e.g., Refs. [23,41,42]).
In Figure 12, the influence of non-isothermal curing conditions on the UCS of SS-CPB is demonstrated for different curing times and SS dosages. The curing temperature history had a considerable impact on the UCS development of SS-CPB samples. For example, from 3 to 28 days of curing, the strength of CPB without SS cured at the non-isothermal H1 condition was approximately 2–3 times higher than that of CPB-0SS cured at 20°. In contrast, the strength of CPB-0.3SS after 28 days of curing under the non-isothermal H1 condition increased by 880 kPa compared to that of the identical samples cured at room temperature (20°). The 28-day UCS of CPB without SS cured under the non-isothermal H1 condition was approximately 750 kPa higher than that of CPB-0SS after 28 days of curing at 20 °C. In addition, the 28-day UCS of CPB-0.3SS cured under the non-isothermal H1 condition increased by 880 kPa compared to that of identical samples of the same age cured at room temperature (20°). Furthermore, Figure 12 also shows that the presence of SS augments the effect of non-isothermal curing on the UCS of CPB. Indeed, the UCS of CPB-0.3SS cured under H1 is notably higher than that of CPB-0SS cured under H1 (higher curing temperature). Evidence in Figure 13 indicates that the inclusion of sodium silicate enhances the temperature-induced strength increase of CPB. This figure shows the impact of the presence of SS on the ratio of the strength of CPB cured under H1 to that of CPB cured at 20 °C. This figure indicates that the UCS of CPB cured under non-isothermal conditions (H1) was significantly influenced (increased) by sodium silicate. These results mean that the non-isothermal curing of the backfill and higher curing temperatures in the field promote the strength development of the backfill mass with SS more than that of backfill without SS. In other words, the CPB structure with SS would reach the required mechanical stability faster, which is beneficial to increase the productivity of the mine.
The reason for the higher strengths of CPB cured under H1 and H2 is attributed to the higher temperatures used in those curing conditions. Previous studies, e.g., Refs. [22,29,40,43] have shown that a higher curing temperature hastens the cement hydration process and results in a significant augmentation of the quantity of hydration products in CPB systems. The former is demonstrated by the EC results in Figure 14. The EC of CPB with 0.3% SS cured under non-isothermal H1 conditions is higher than that of the identical sample cured at room temperature throughout the monitoring period. At the early stages, the EC of the specimens cured under non-isothermal conditions and higher temperatures reached a higher maximum value of 6.8 mS/cm in 2.5 h, while the samples cured at room temperature reached a lower EC value of about 5.6 mS/cm, and after a longer time (6.5 h). This demonstrates that more ions were generated during the hydration reaction of samples exposed to non-isothermal curing, resulting in a large volume of hydration products. This can be confirmed by the findings of TG/DTG analyses conducted on CPB samples cured at different temperatures, as illustrated in Figure 15. The second peak in Figure 15 (between 400 °C and 500 °C) is higher for CPB exposed to non-isothermal curing owing to the formation of more cement hydration products, such as CH, at higher temperatures [7].
Additionally, a huge amount of hydration products is beneficial for refining the pore structure of CPB, resulting in higher compressive strength. This is consistent with the MIP test results for curing the samples under isothermal (20 °C) and non-isothermal conditions in Figure 16. This figure shows that CPB exposed to non-isothermal curing conditions achieved a finer pore structure and lower total porosity, which is ascribed to the buildup of large quantities of hydration products in the backfill capillary pores and leads to higher mechanical strength. These results are consistent with the strength gain process discussed earlier.

3.1.5. Strength of SS-CPB under the Influence of Curing Stress

In the field, the CPB mass is exposed to various curing stresses. An important factor for curing stress is the overburden pressure caused by the backfill weight. Thus, the influence of curing stress on the strength of CPB with SS was investigated. Two sets of CPB specimens with different percentages of SS (0 wt% and 0.3 wt%) were made and cured under stress at a room temperature of 20 °C using the University of Ottawa THMC-Backfill curing system (Figure 17) developed by [43,44] to gain insight into the effect of curing stress on the strength of CPB specimens. This THMC-Backfill curing system was designed to simulate the mine backfilling sequence and the self-weight or curing stress generated by the mine backfill processes during CPB curing. Figure 17 shows the schematic of the pressure cell apparatus. The frame of this experimental device is a plastic cylinder with a diameter of 101.6 mm (4 in.) and a height of 304.8 mm (12 in.). Using an axial piston, one-dimensional vertical pressure was exerted on the top of the cylinder. The driving force of the piston is compressed air. The pressure can be up to 600 kPa, which simulates a depth of about 35 m in a mine stope. During the curing period, a 100 mm thick layer of insulating material surrounded the cylinder and was essential for thermal insulation and impeding heat transfer between the specimens and their surrounding environment. Figure 18 shows the history of curing stresses applied to the samples. The initial pressure was 20 kPa. In addition, the pressure was gradually increased every 3 h to 35, 55, 75, and 150 kPa for the first 12 h to mimic a more realistic weight pressure on the sample. Next, the air pressure applied to the piston was gradually (every 24 h) increased to a maximum pressure of 600 kPa. This maximum air pressure and rate of pressure increase represent an approximately 35 m high backfill stope and an average filling rate of 0.31 m/h, respectively.
Figure 19 shows the strength evolution of CPB with and without SS cured under stress and under stress-free (control) conditions. The UCS of all samples improves with curing time due to the precipitation of more binder hydration products, as explained earlier. In addition, the stress-cured specimens gained strength faster and achieved higher strength values than those cured without stress, regardless of whether the CPB contained sodium silicate. This is due to the fact that the stress applied to the samples during the curing period resulted in a considerable increase in the packing density and refinement of the pore structure of the samples, thereby increasing the strength and rate of strength gain in the samples [44]. This is supported by the changes in dry density, void ratio, and porosity of the samples with and without air pressure, as shown in Figure 20. The figure shows that the dry density of the pressure-cured CPB was much higher than that of the corresponding CPB without pressure throughout the curing period, while the stress-cured CPB showed lower porosity and void ratio values. The capillary pores of the CPB matrix were progressively filled with cement hydration products over time, which may confirm the relationship between strength gain and porosity reduction [39,45].

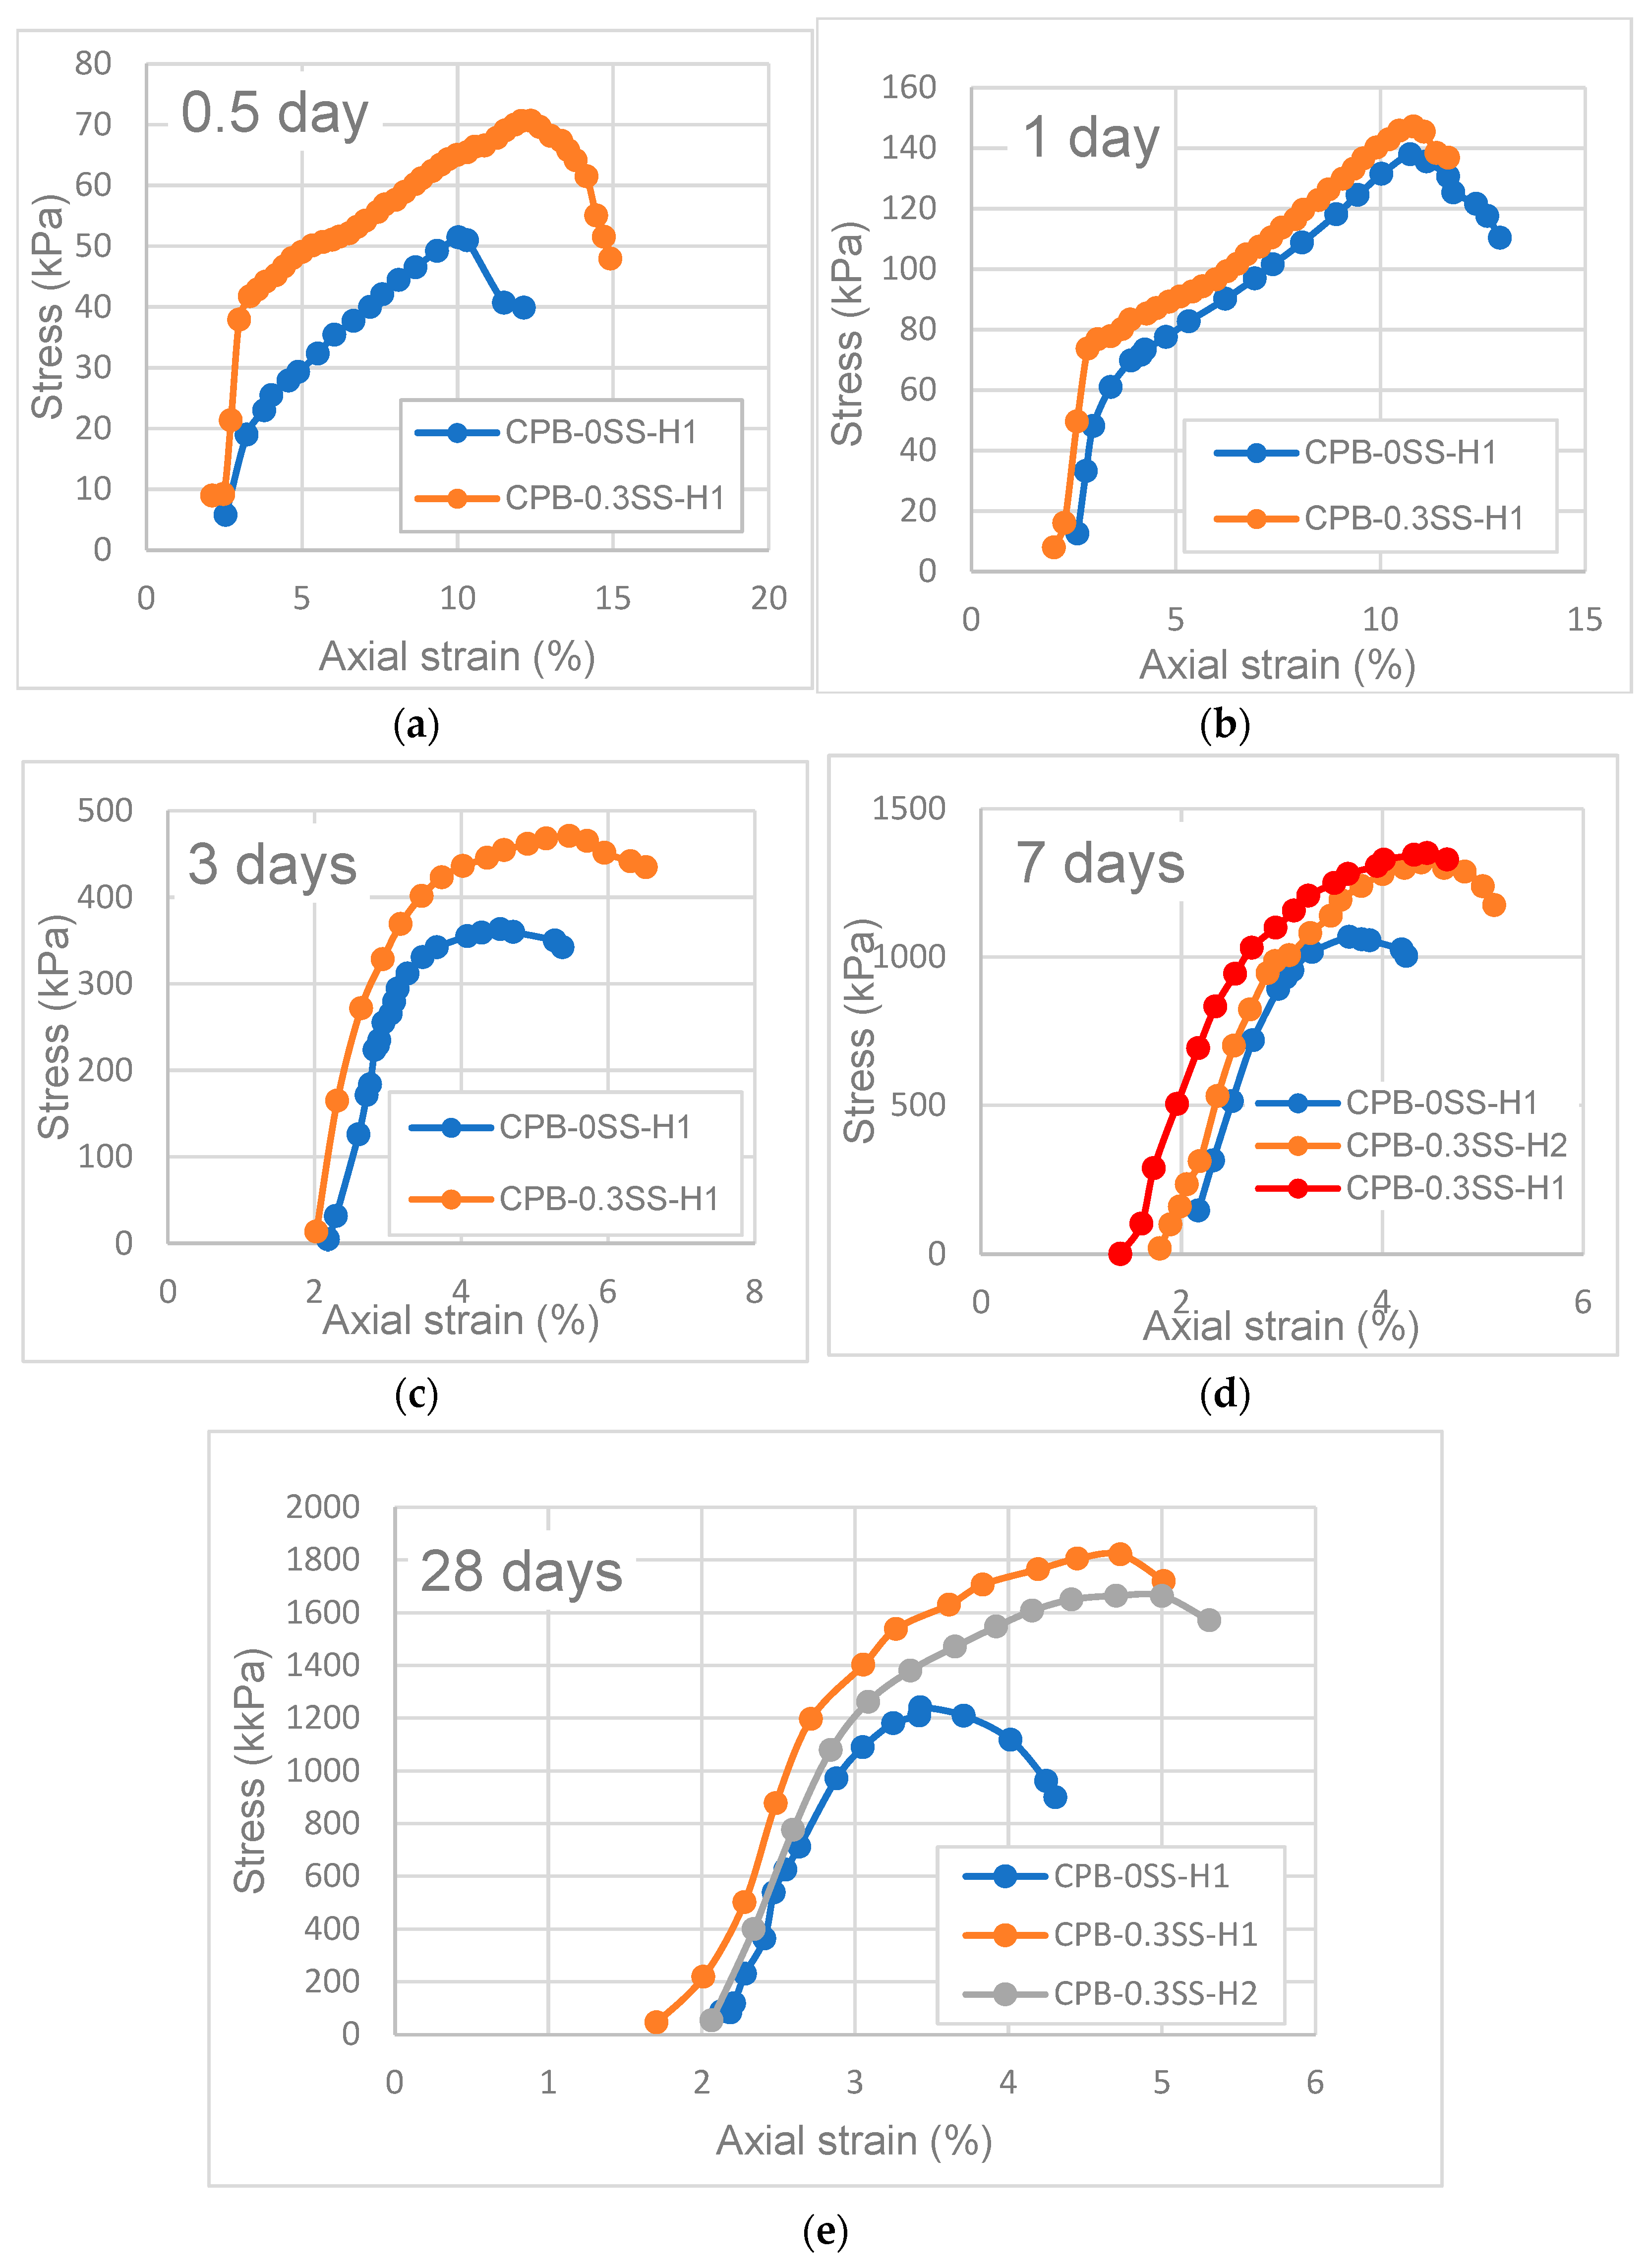
3.2. Deformation Behavior of SS-CPB

Typical axial strain–stress curves of SS-CPB specimens made with different dosages of sodium silicate and subjected to different curing times are shown in Figure 21, Figure 22, Figure 23 and Figure 24. Regardless of curing time and SS content, the stress–strain curves can be divided into three stages (Figure 21): the almost linear elasticity (OE) stage, the inelastic stage before failure (EP), and the residual stress after failure (PR) stage. It is noted that the shape of the stress–strain curve was affected by both the SS content (Figure 22) and the curing time (Figure 23). In the OE stage, the stress increased almost linearly before the axial strain increased to a specific point. The slope of the OE stage of SS-CPB increased with an increasing amount of SS. A higher amount of SS led to a higher hydration rate, that is, a greater amount of hydration products, a finer pore structure, and greater self-desiccation in the SS-CPB structure, as previously demonstrated, which contributed to the formation of a stiffer mass. In the EP stage (or elastoplastic stage), the stress increased nonlinearly with increasing axial strain. The maximum or peak stress of CPB-SS increased with SS dosage because of the enhanced hydration of the binder by SS (Figure 3 and Figure 4), resulting in the generation of more cement hydration products, i.e., a higher-resistance SS-CPB material. The non-linear stress growth at this stage is mainly attributed to crack propagation in the CPB matrix [21,44,46]. In the PR stage, the stress decreased to a residual level with increasing axial strain. The residual stress is attributed to the mobilization of resistance forces by the growth cracks within the CPB material [45]. With a longer curing time, the stress–strain behavior of SS-CPB showed the following characteristics: (i) the slope of the OE stage was steeper; (ii) the maximum stress of SS-CPB increased and the corresponding axial strain decreased in the EP stage, i.e., the SS-CPB hardened with a longer curing time; and (iii) the slope of stress reduction increased in the PR stage (Figure 23). Figure 23 also shows that for longer curing times, the stress–strain response of SS-CPB showed a more defined peak and subsequent softening. These characteristics are attributed to a longer curing time, which resulted in a higher degree of cement hydration, greater self-dehydration, and a finer pore structure, as experimentally demonstrated in the previous sections. These results agree with previous studies on cementitious materials [9].
Typical examples of the influence of non-isothermal field curing temperature on the stress–strain behavior of CPB with and without sodium silicate are depicted in Figure 24. This figure clearly shows that irrespective of stage, the stress–strain characteristics (e.g., shape of the stress–strain curve, maximum stress and strain, and the modulus of elasticity) of CPB under field temperature conditions were affected by the presence or absence of sodium silicate in the CPB composition. The peak stress improved and the corresponding strain increased in the presence of sodium silicate. Furthermore, Figure 24 indicates that under field thermal curing conditions, the modulus of elasticity of CPB with SS was higher than that without SS, regardless of curing time; in other words, SS-CPB was stiffer. By adding sodium silicate to CPB, more cement hydration products were formed, which ultimately resulted in changes in the stress–strain characteristics of SS-CPB exposed to field curing temperatures. Additionally, the impact of SS on the cement hydration reactions was intensified by higher curing temperatures in the field, as previously explained.
The changes in the elastic modulus of SS-CPB specimens cured at different field curing temperatures (H1, H2) are illustrated in Figure 25. The values for elastic modulus have been determined by analyzing the linear portion of the stress–strain curve of SS-CPB, which represents the stiffness of the SS-CPB. The field curing temperature had a noticeable effect on the elastic modulus of SS-CPB. The modulus of elasticity for SS-CPB rose in response to the increase in temperature. The greater amount of hydration products produced due to higher curing temperature resulted in an increase in the elastic modulus. Higher temperature means faster hydration rate, higher self-desiccation, and finer pore structure, as previously shown and discussed. These factors contributed to the increase in elastic modulus [19,22,47,48]. This increase in the elastic modulus of SS-CPB with higher curing temperature also has some practical implications. For example, stiffer SS-CPB structures developed with higher curing temperatures could provide more robust immediate support when exposed to complex loads from the adjacent rock, thereby contributing to the mechanical stability of the mine openings.
The UCS and modulus of elasticity are important properties of CPB structure from the viewpoint of geotechnical design. In the backfill engineering practice, typically only the UCS of the CPB is determined or tested for quality-control purposes. By means of empirical relationships, it is common to estimate the elastic moduli from the UCS. Thus, in this research, the interrelationship between the UCS and elastic modulus (E) of SS-CPB samples was analyzed by considering different sodium silicate proportions and curing durations. The experimental data were analyzed using the following linear function:
E = a × UCS
where E (MPa) represents the modulus of elasticity of SS-CPB under uniaxial compression, UCS (kPa) is the uniaxial compressive strength of SS-CPB, and a is a constant. Using regression analysis (Figure 26), the modulus of elasticity of SS-CPB samples considered in this study can be estimated using the Equation (2)
E = 0.0227 × UCS
Figure 26 shows that the UCS of SS-CPB has a linear relationship with the elastic modulus. The differences between the CPB curves with different SS contents are minor, less than 5%. Thus, it can be concluded that the relationship between the UCS and modulus of elasticity remains unaffected by the contents of SS. The proposed relationship between the modulus of elasticity and compressive strength would be useful for the engineering design of SS-CPB structures. The robustness and accuracy of the relationship prediction can be improved by further analysis of additional experimental data obtained in future studies on different types of SS-CPB.

4. Conclusions

The effectiveness of SS as a chemical additive for CPB was demonstrated by the findings of this study. Based on the findings, the following inferences are drawn:
  • The addition of SS to CPB mixtures significantly increases the mechanical strength of the CPB (up to 100%+ compared to the UCS of CPB without SS); in other words, it enhances the mechanical stability of CPB structures. But the extent of the increase depends on the amount of SS added and the length of the curing time. SS acts as an alkaline activator, which results in accelerated hydration of the binder. In addition, it also creates an extra C-S-H gel because of the reaction of SiO2 with CH.
  • The amount of sulfate present in the mixing water notably changes the short- and long-term strength of SS-CPB. The sulfate ions retard the hydration process of the cement, resulting in the production of a smaller amount of hydration products in the specimens with 25,000 ppm sulfate ions, resulting in lower strength. However, it was found that sodium silicate improves the resistance of CPB samples to sulfate attack. This would mean that when tailings and/or mixing waters with relatively high sulfate contents are used in the preparation of CPB, the addition of SS to CPB would result in more stable and safer CPB structures when exposed to sulfate attack, which is beneficial for underground mine work safety and mine productivity.
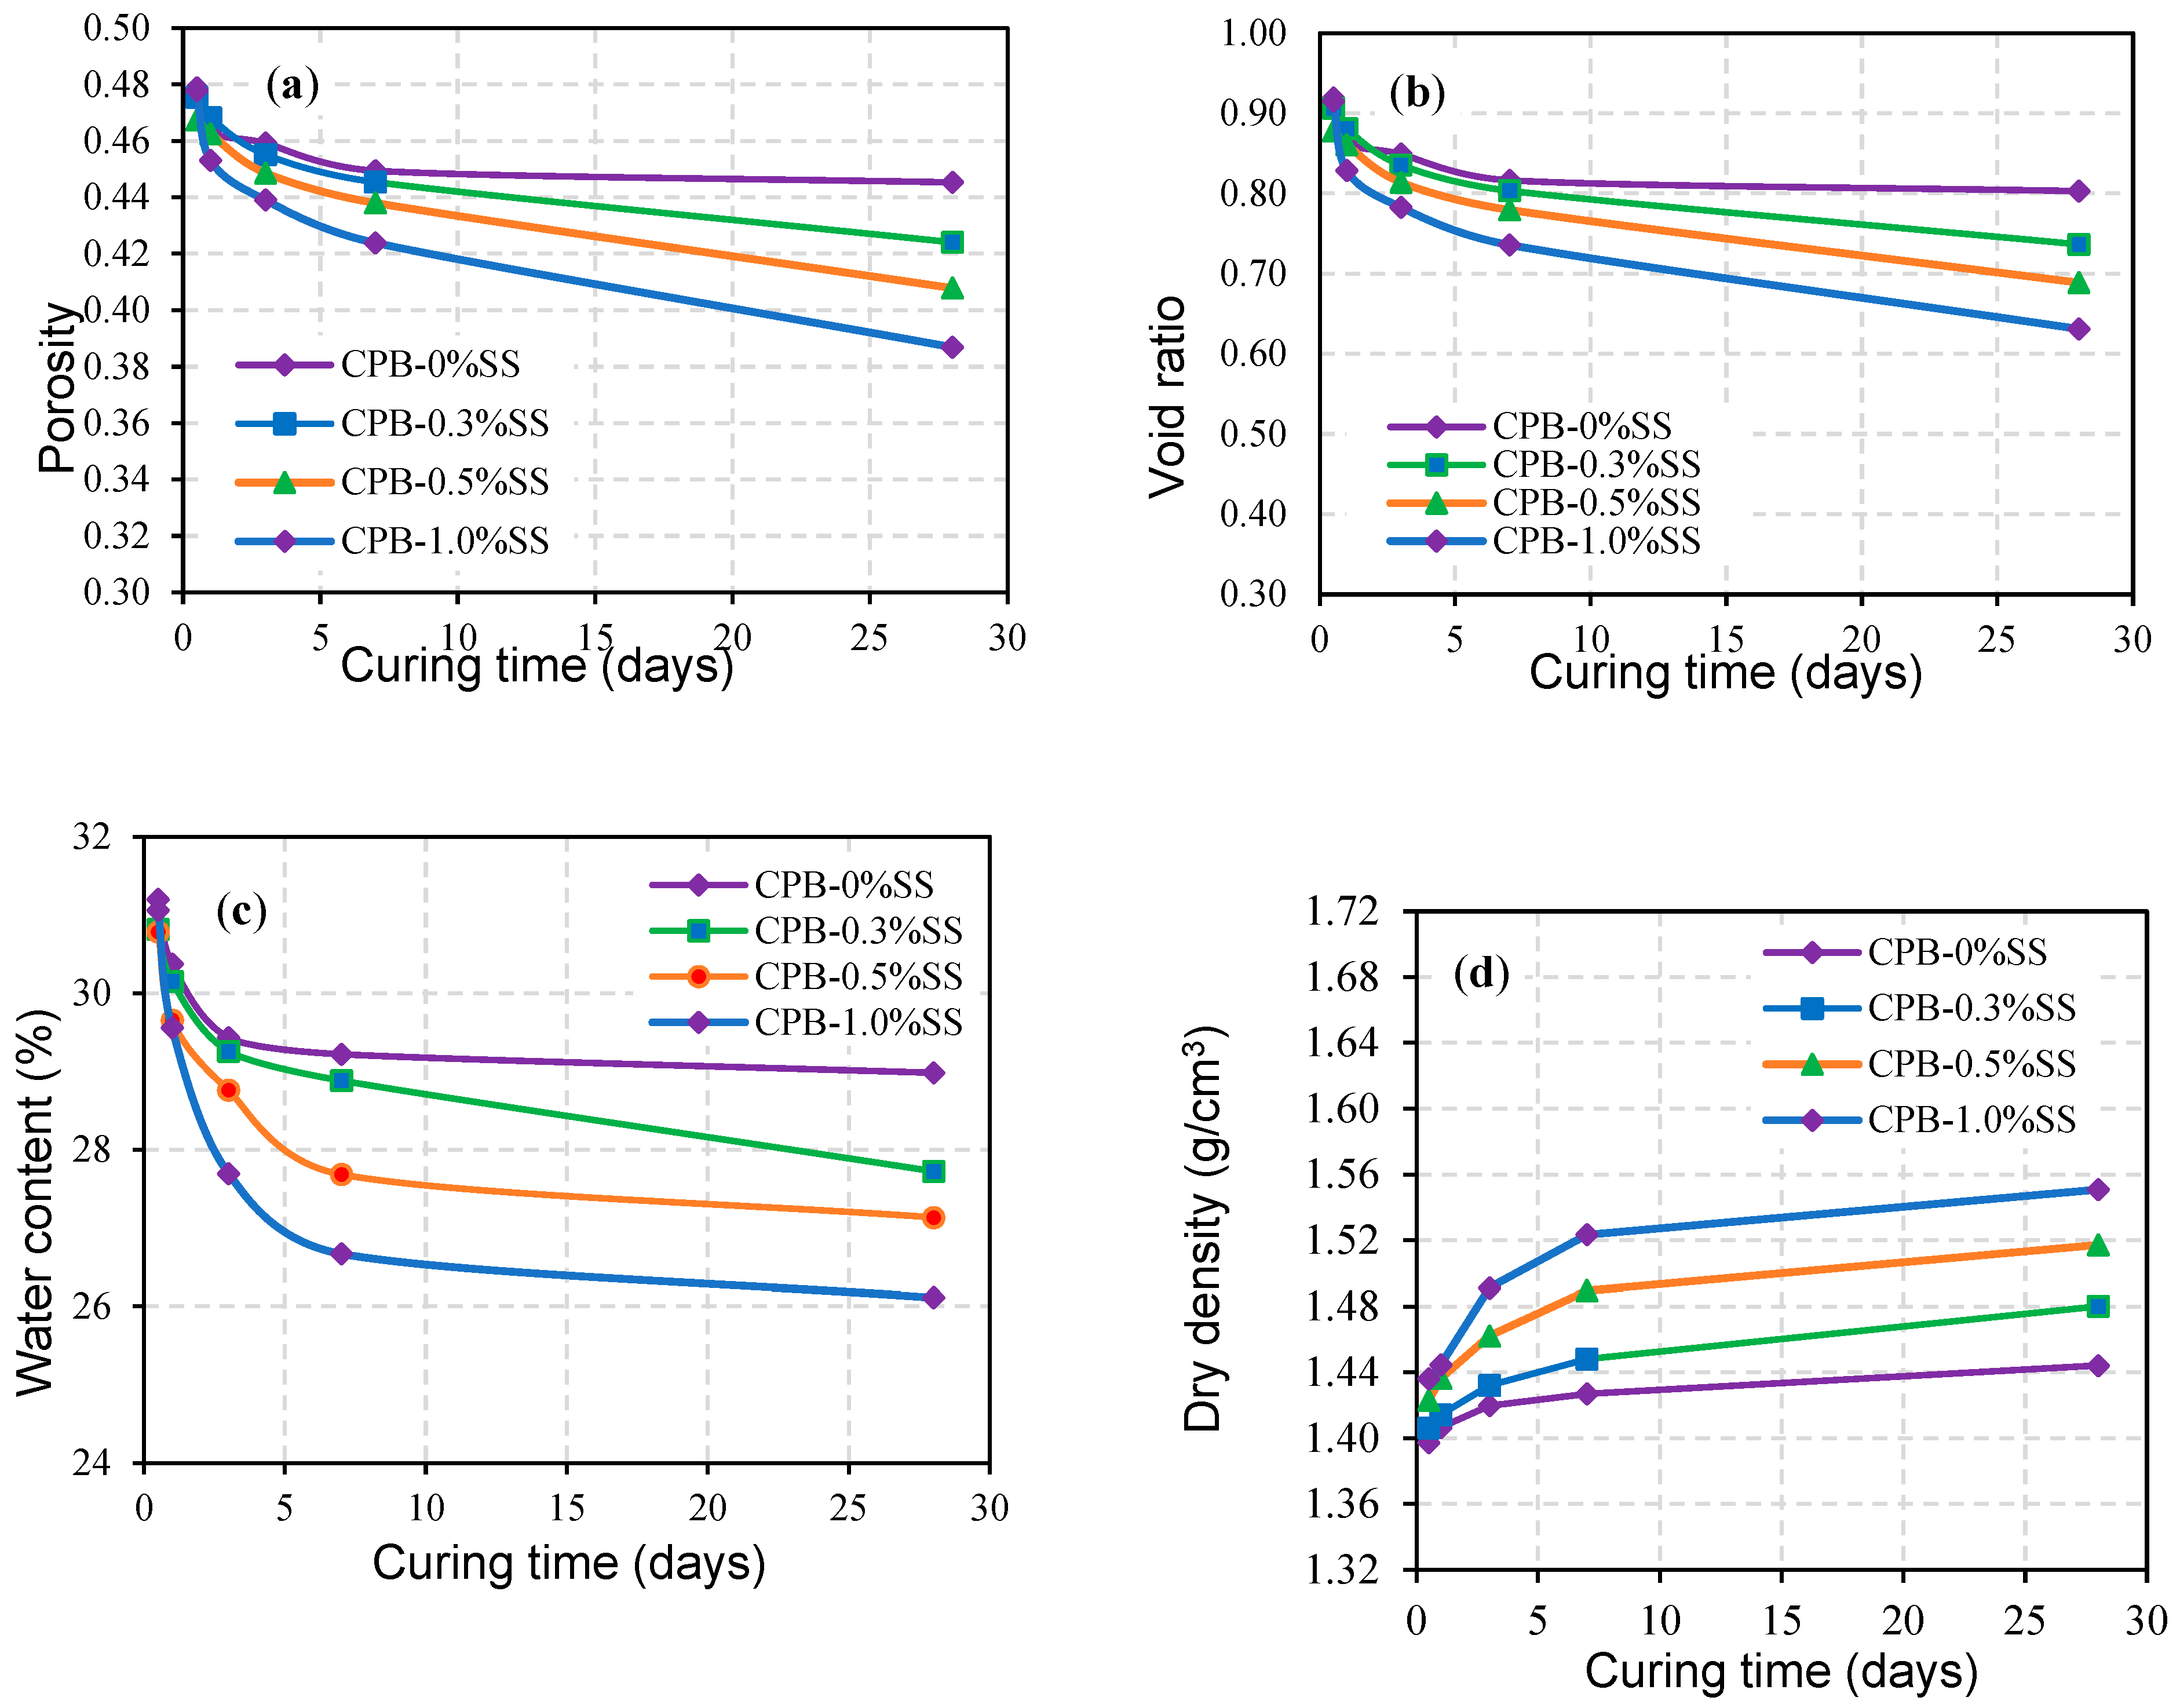
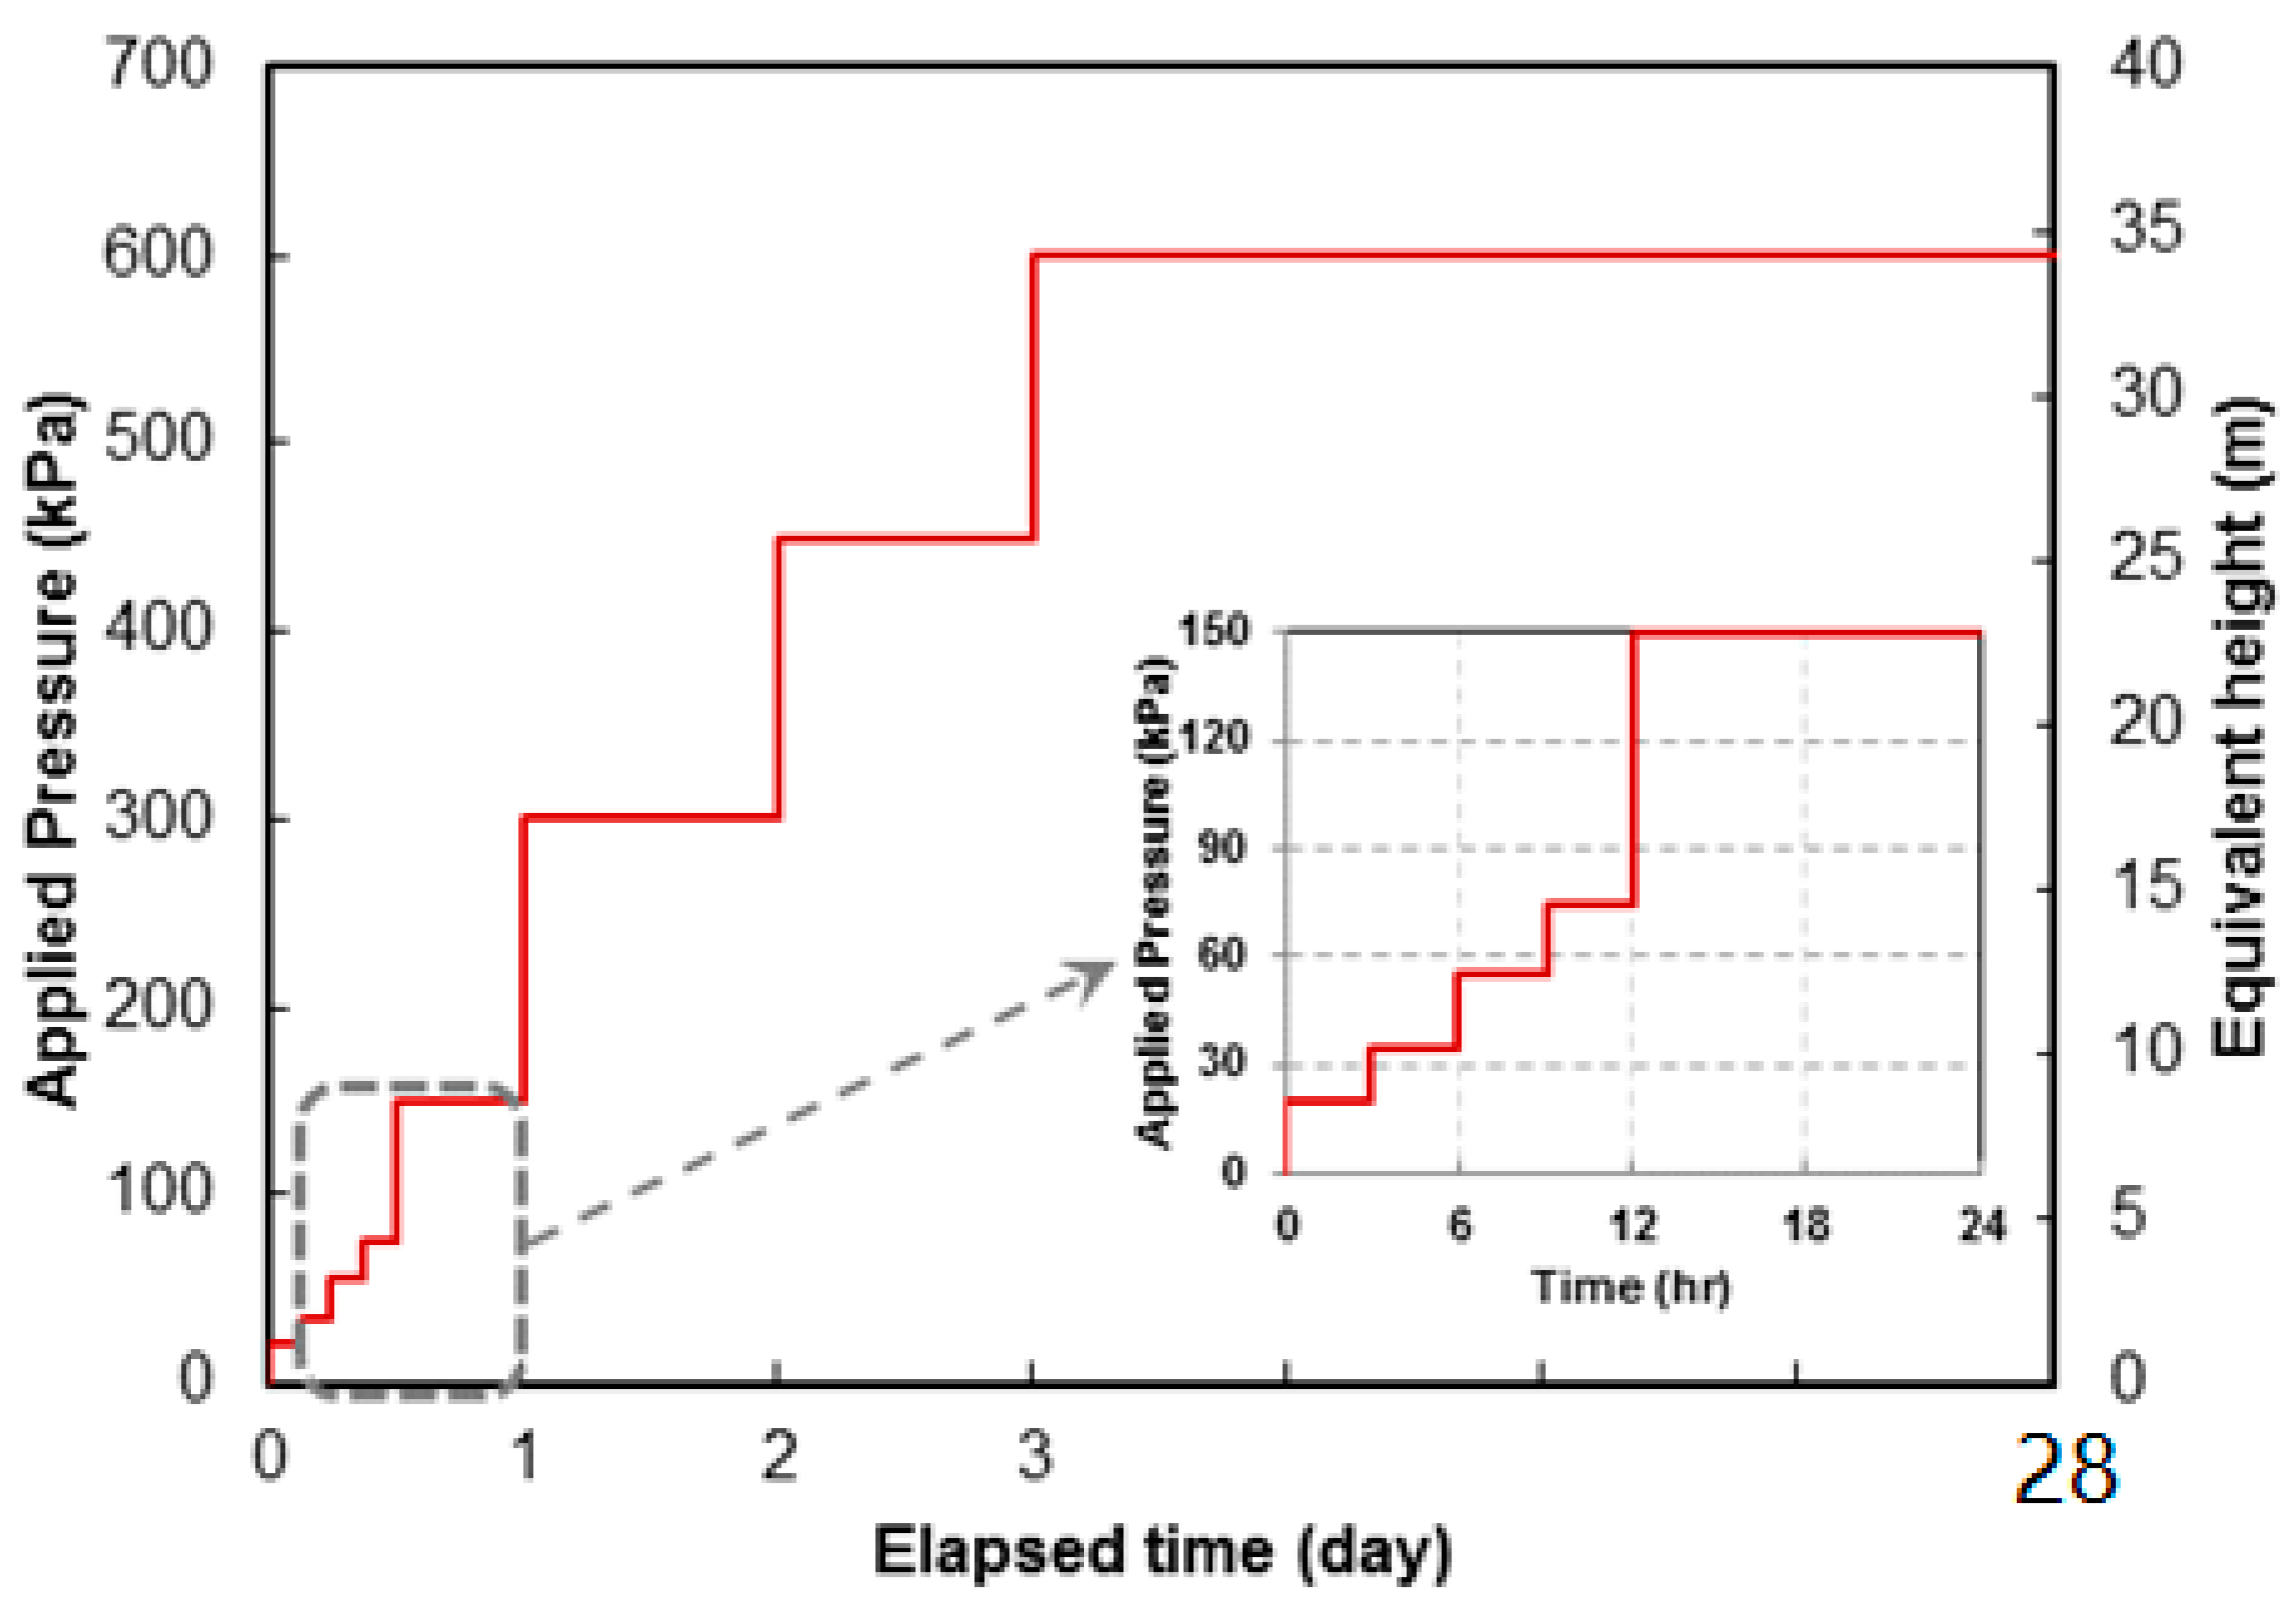
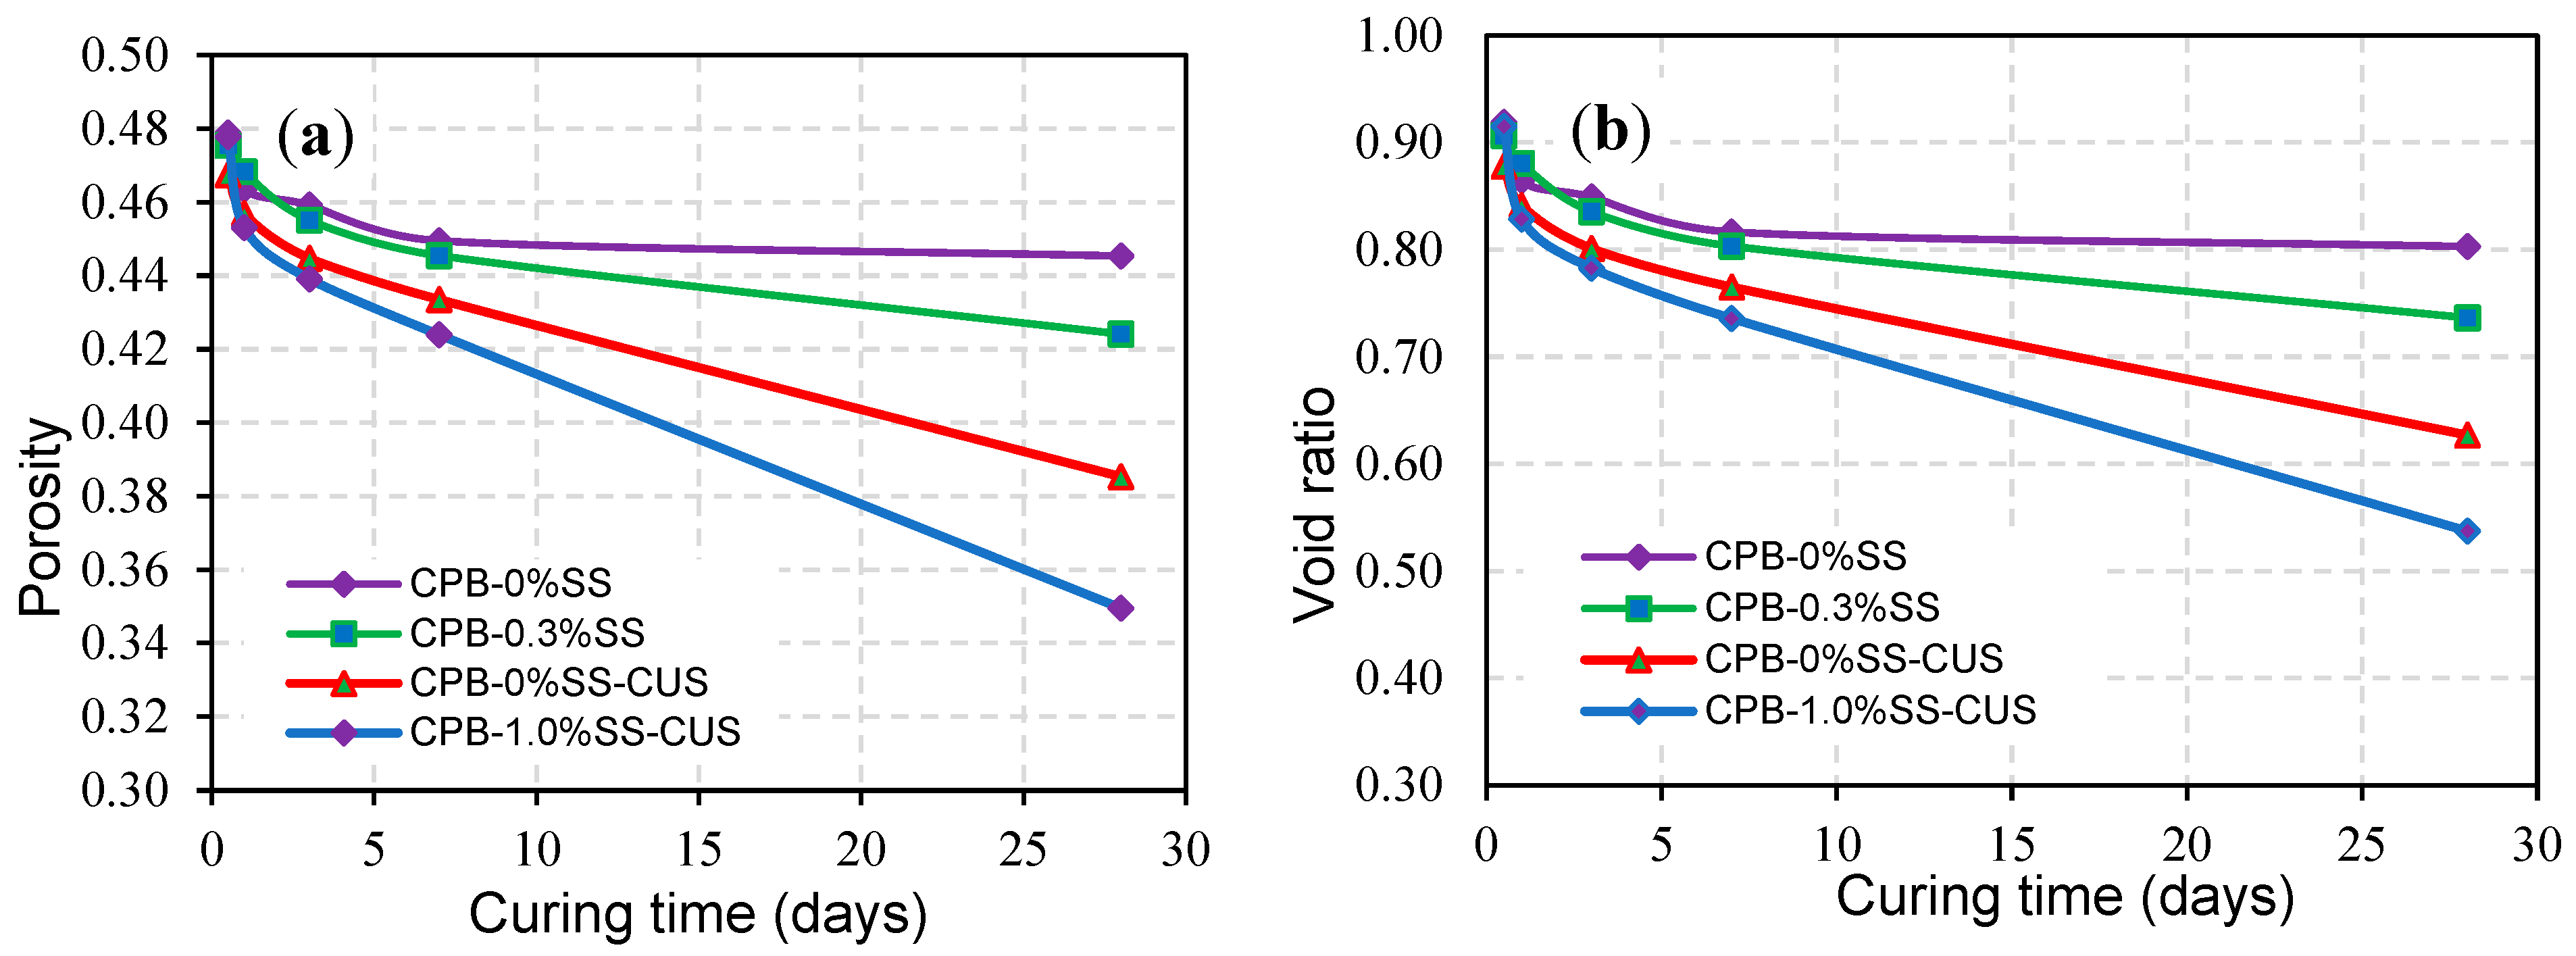
  • The strength of SS-CPB samples cured under simulated field CPB overburden pressure was found to be greater than that of samples cured under stress-free conditions. Curing stress has the effect of rearranging the tailing particles in the SS-CPB samples, which in turn increases packing density, reduces void ratio and porosity, and ultimately results in an increase in compressive strength. This finding means that the field overburden pressure or stress to which SS-CPB is exposed during placement and curing should be considered in the strength evaluation of SS-CPB in order to design more cost-effective cemented backfill structures.
  • The strength and rate of strength gain of SS-CPB cured at non-isothermal field curing temperatures is higher than that of SS-CPB cured at constant room temperature (20 °C) due to the enhanced binder hydration by the higher field curing temperature. It was also found that the non-isothermal curing of the backfill and the higher curing temperatures in the field are more favorable for the strength development of the CPB with SS than that of CPB without SS. In other words, a CPB structure with SS would reach the required mechanical stability more quickly, which is advantageous to improve the productivity of the mine.
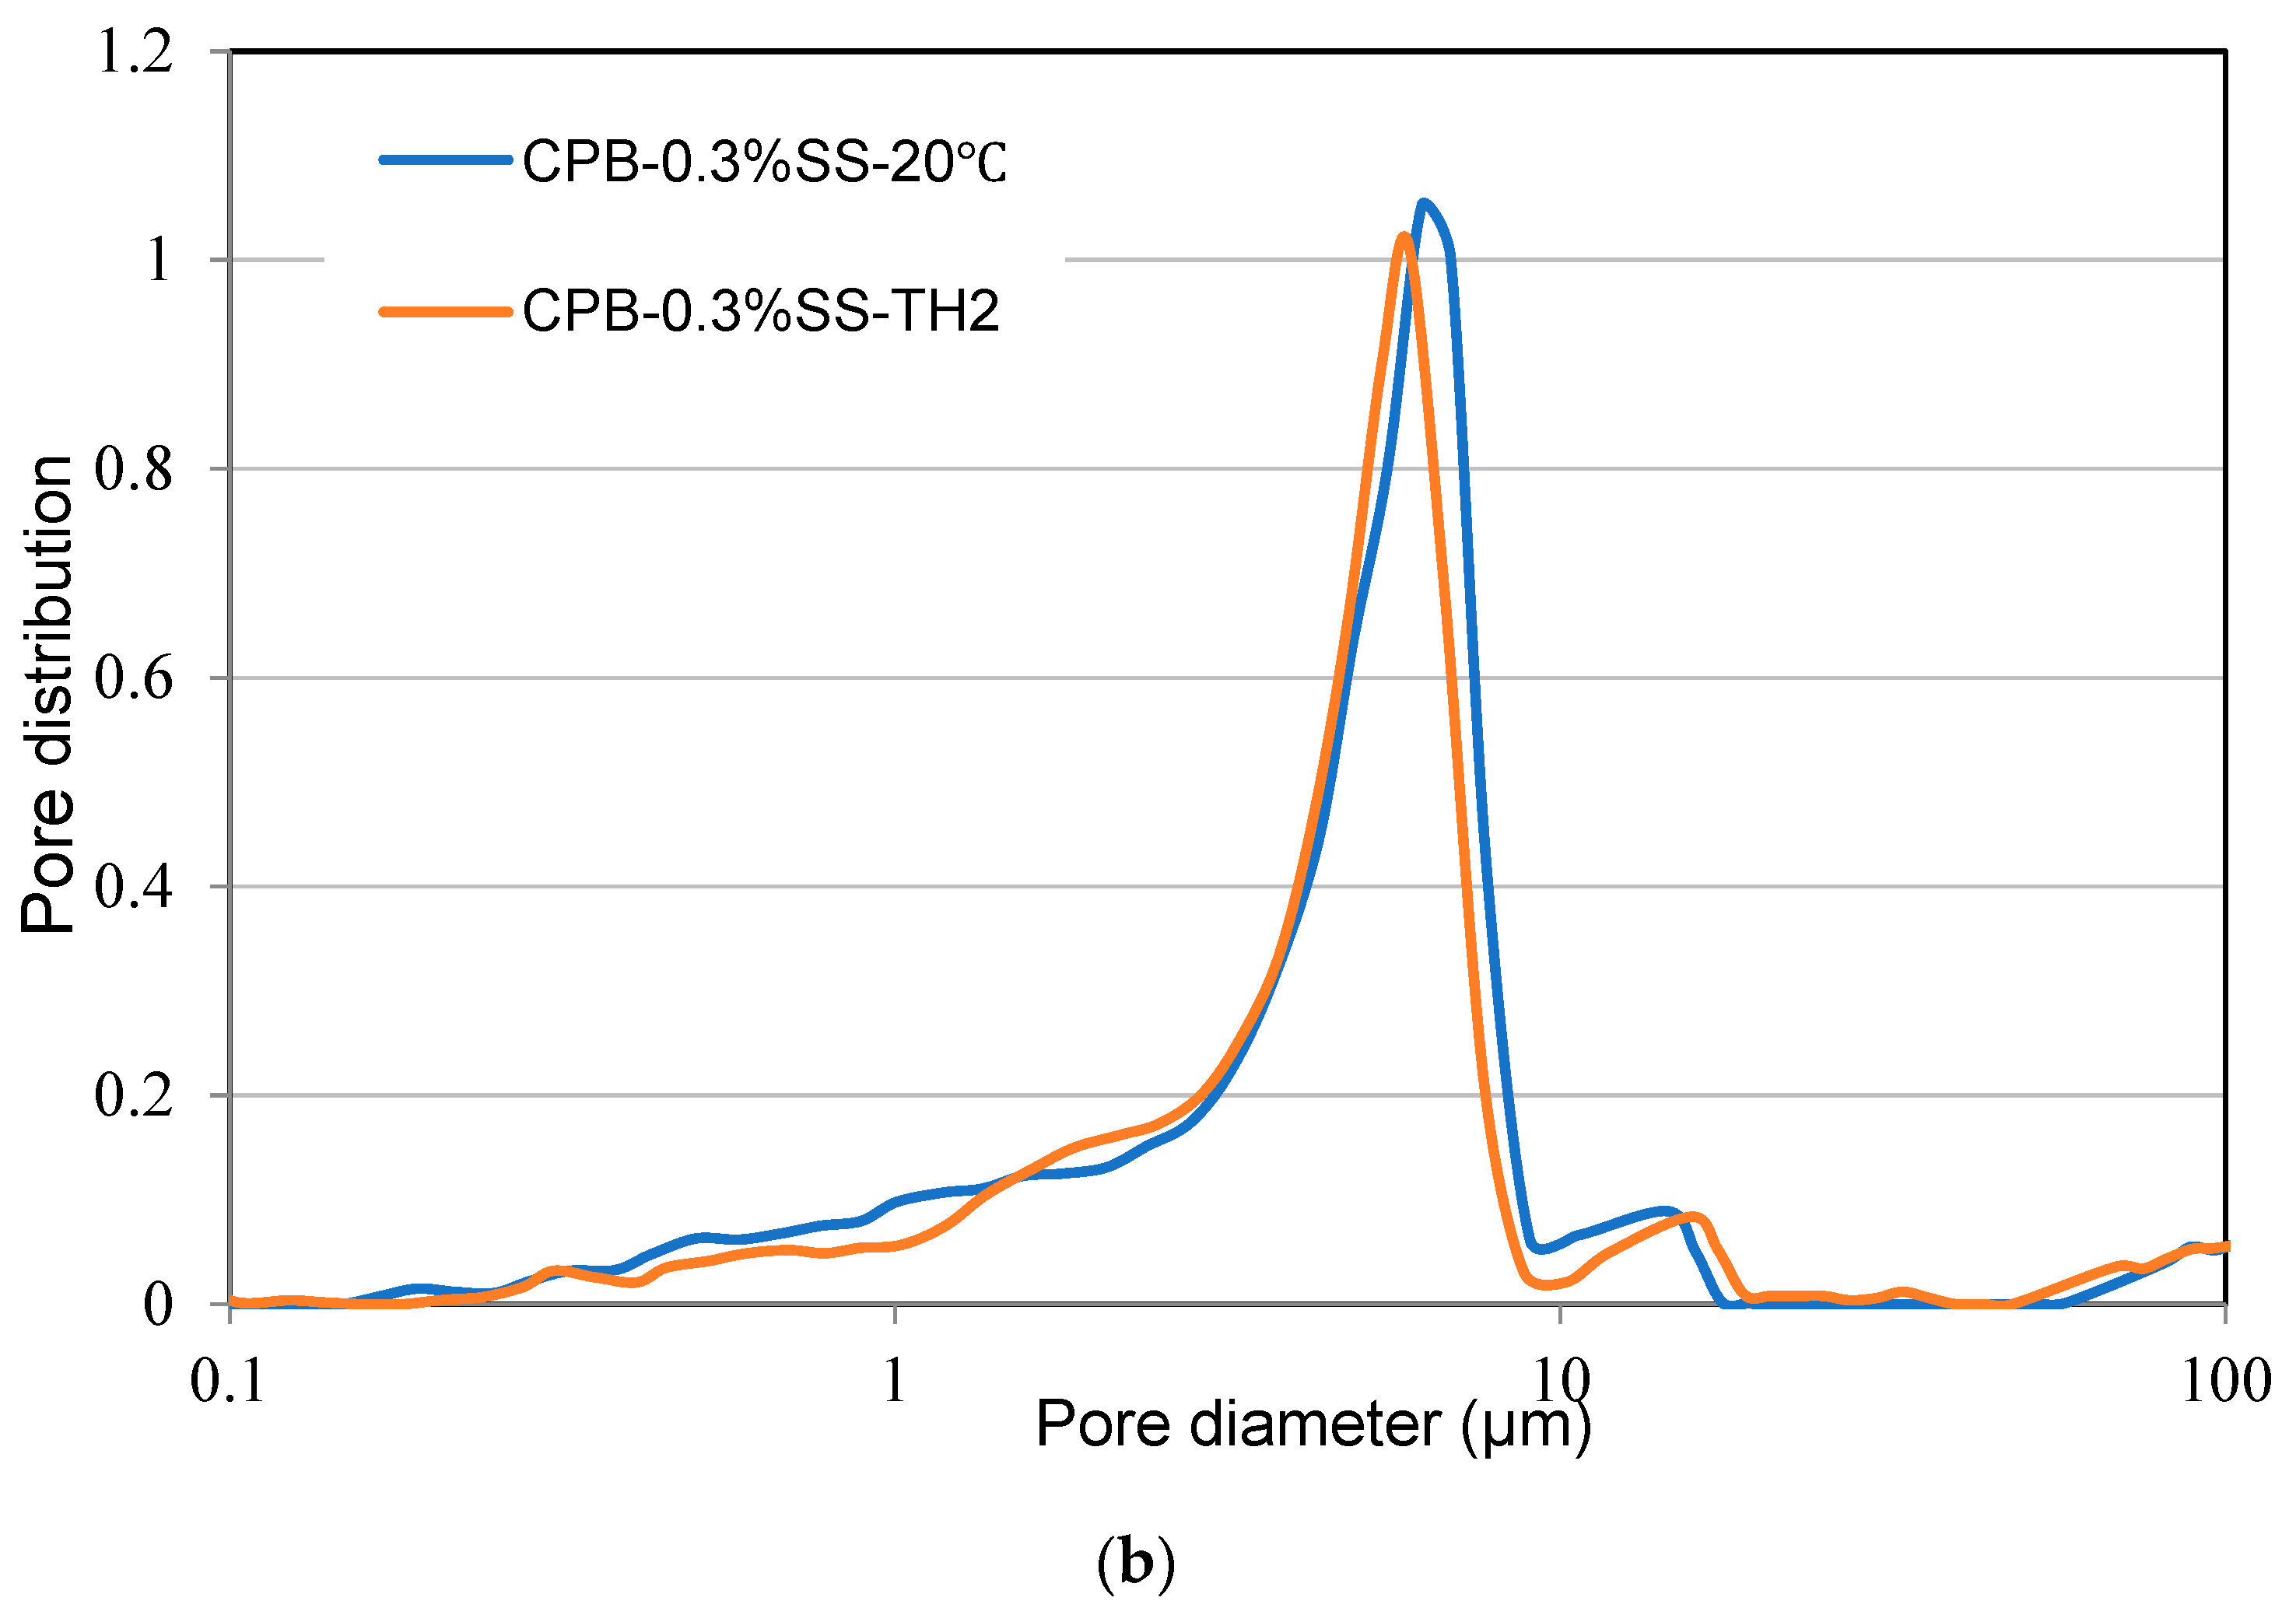
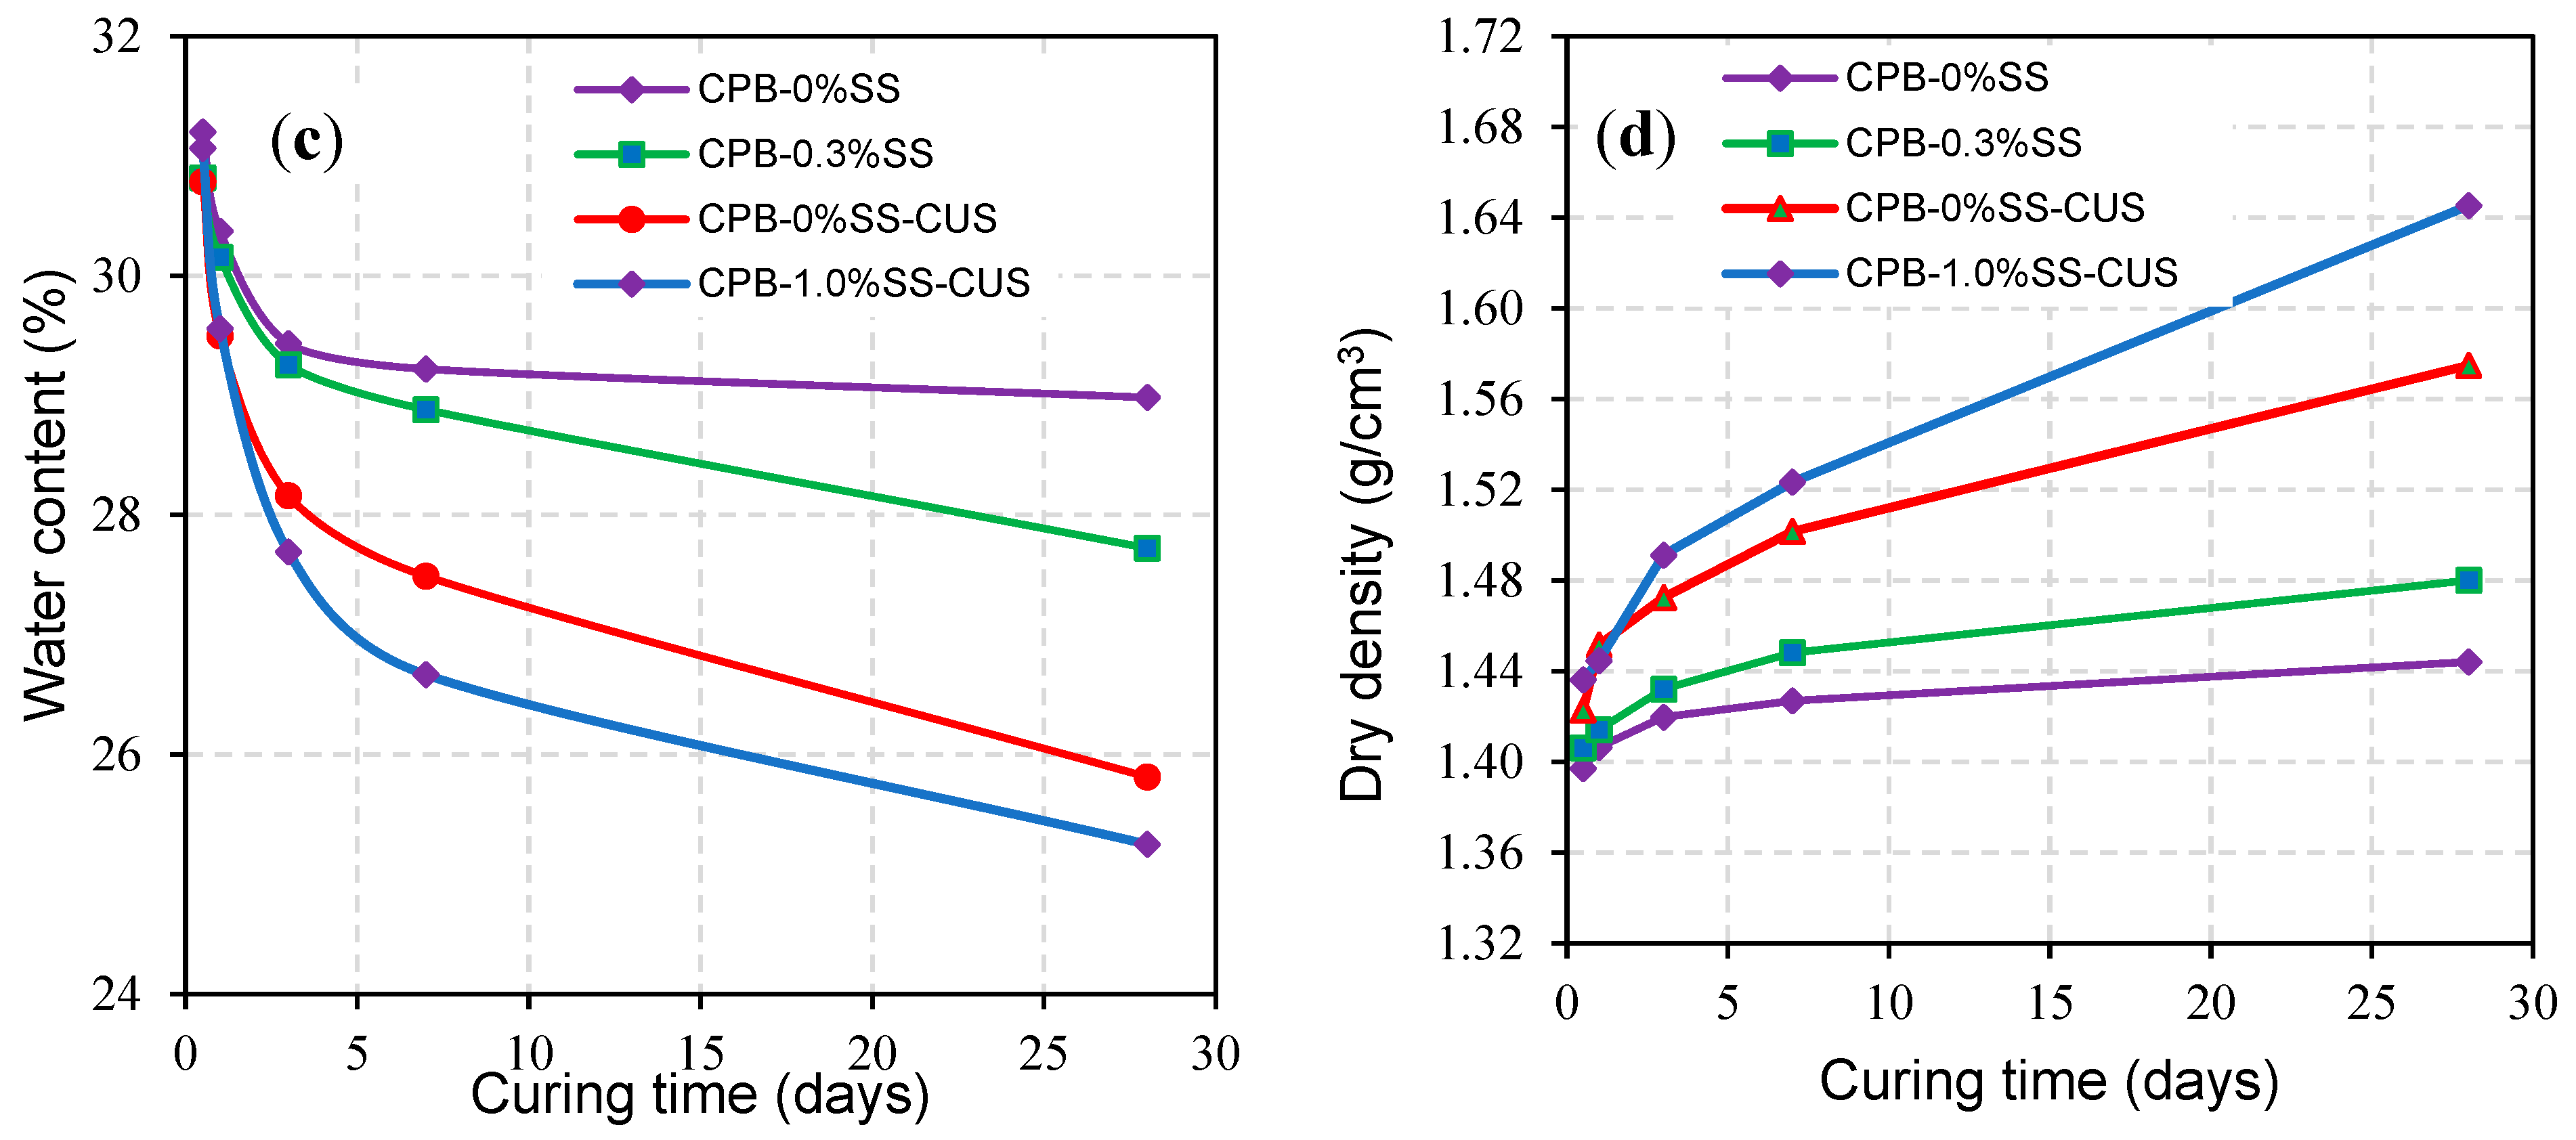
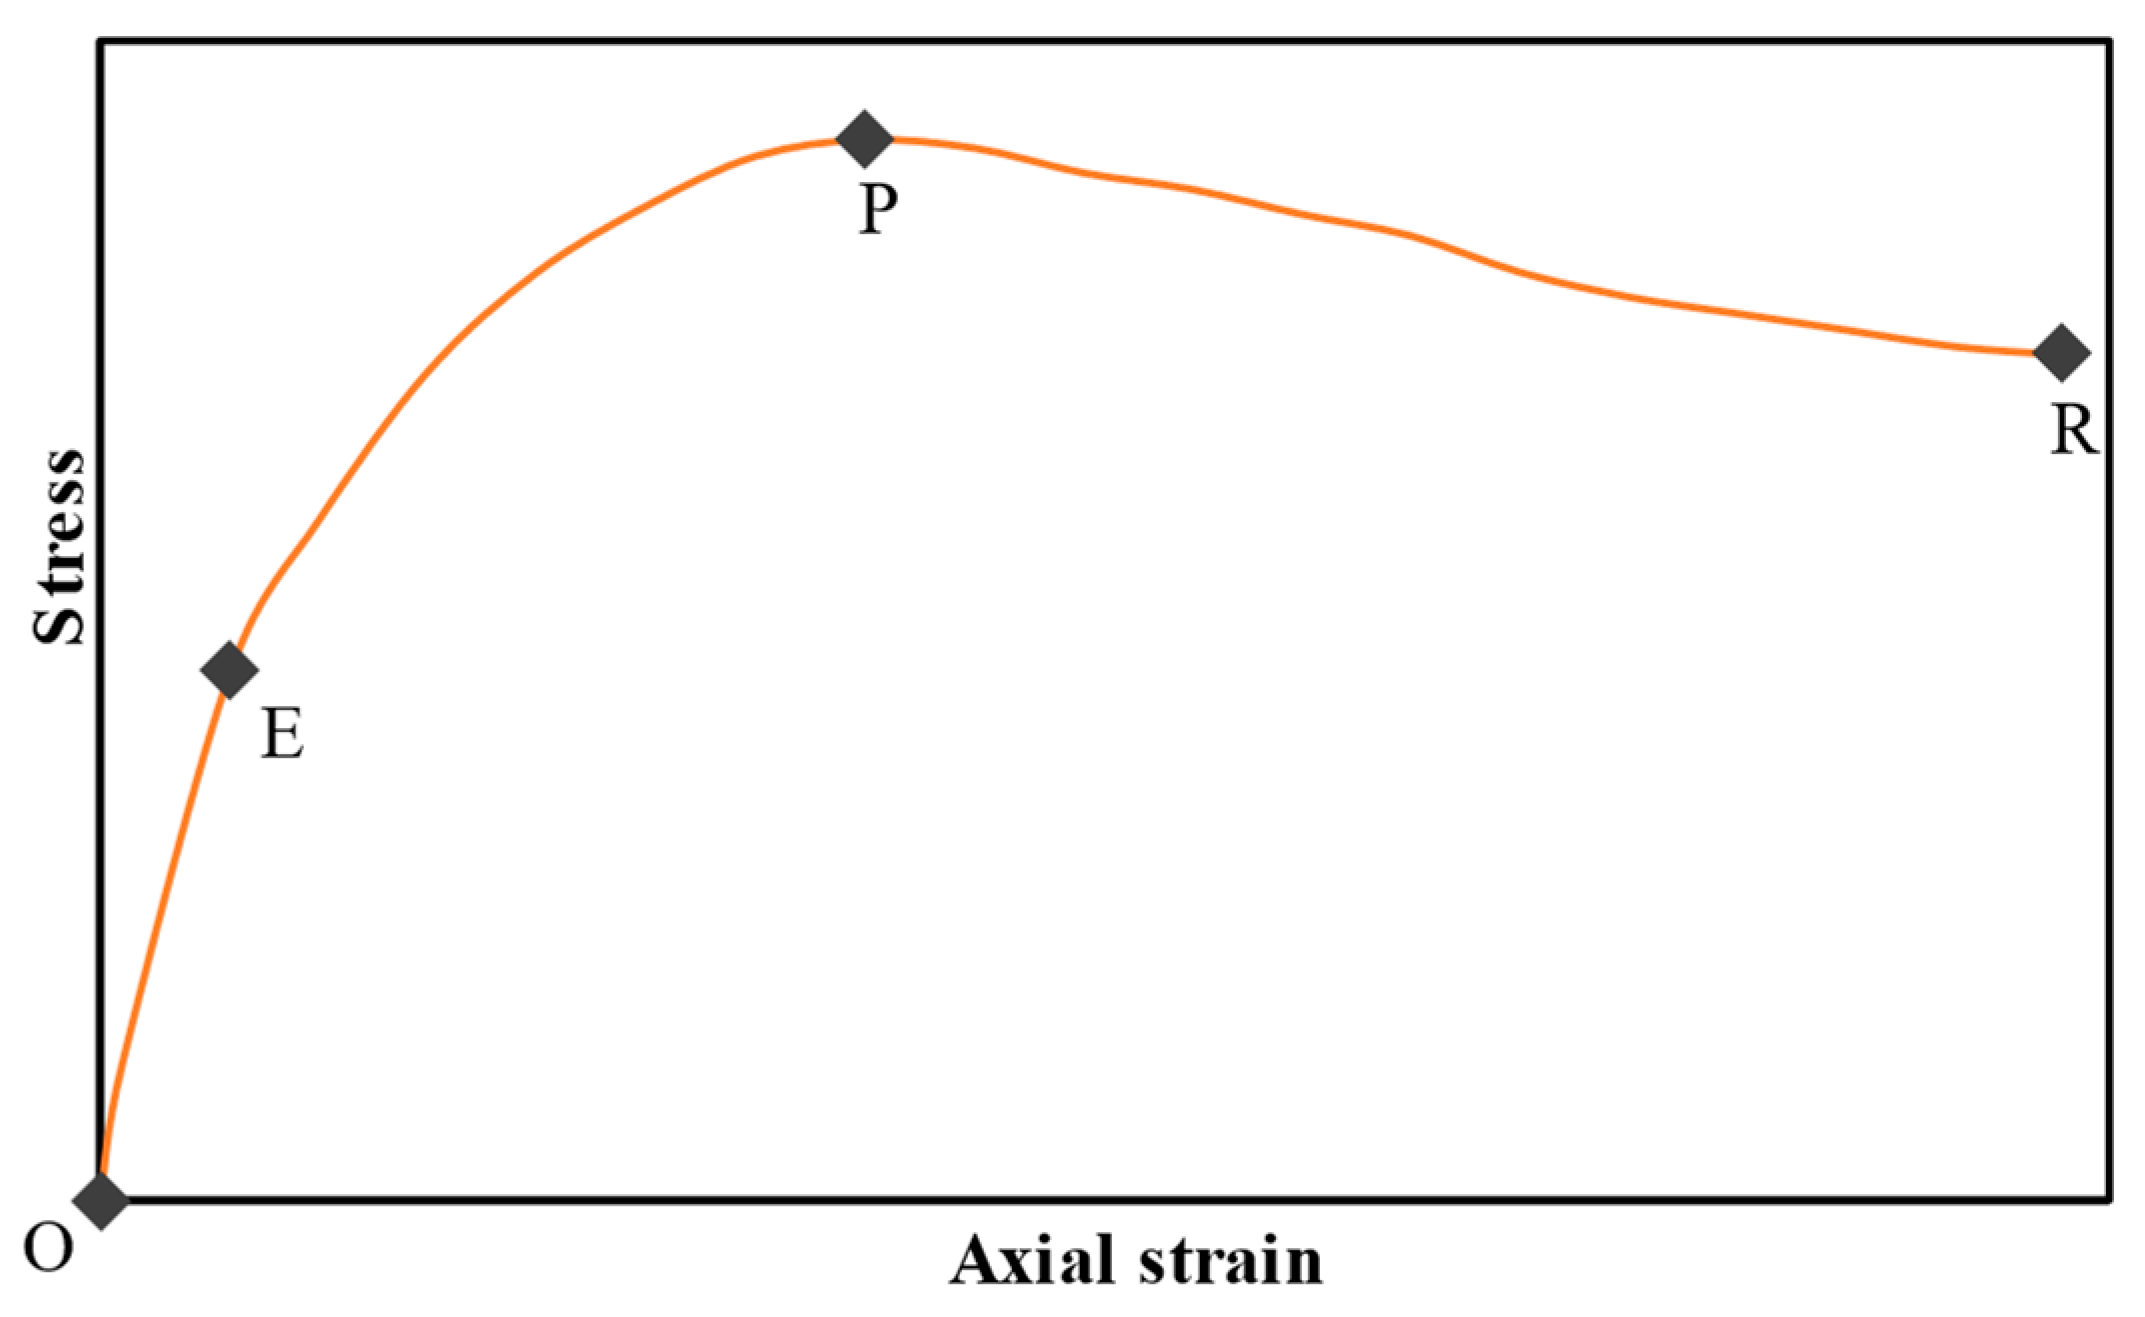
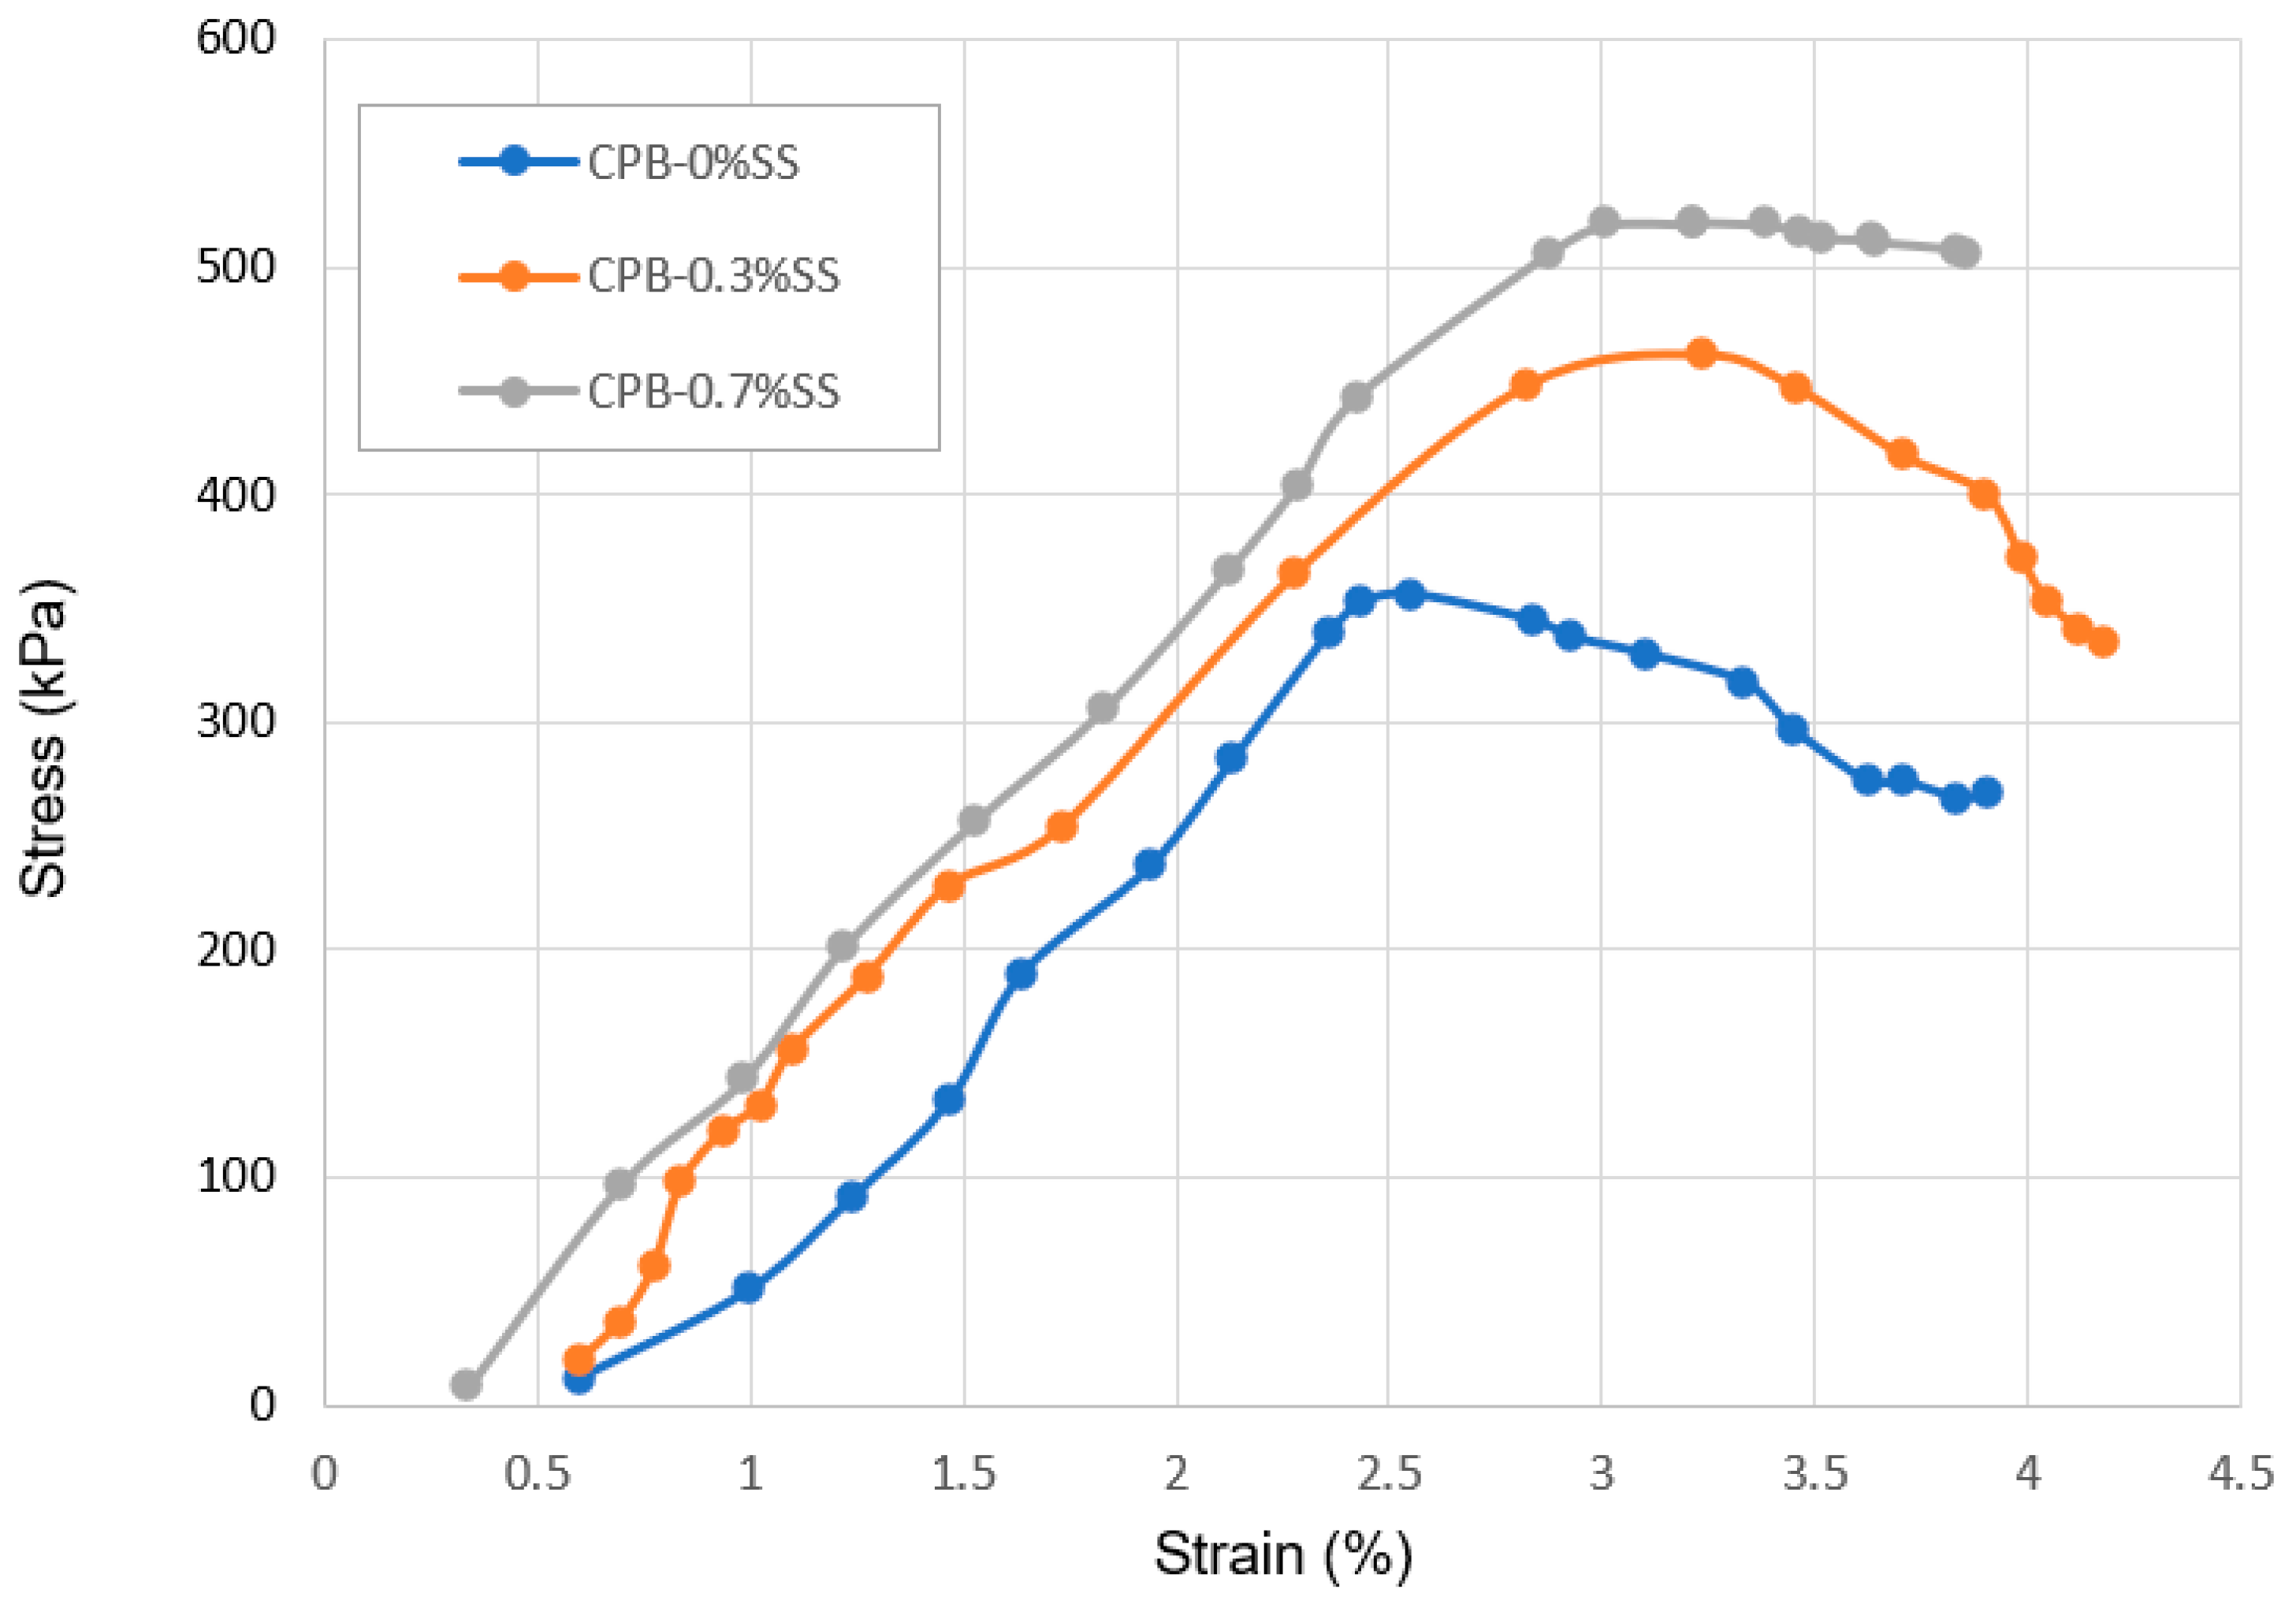
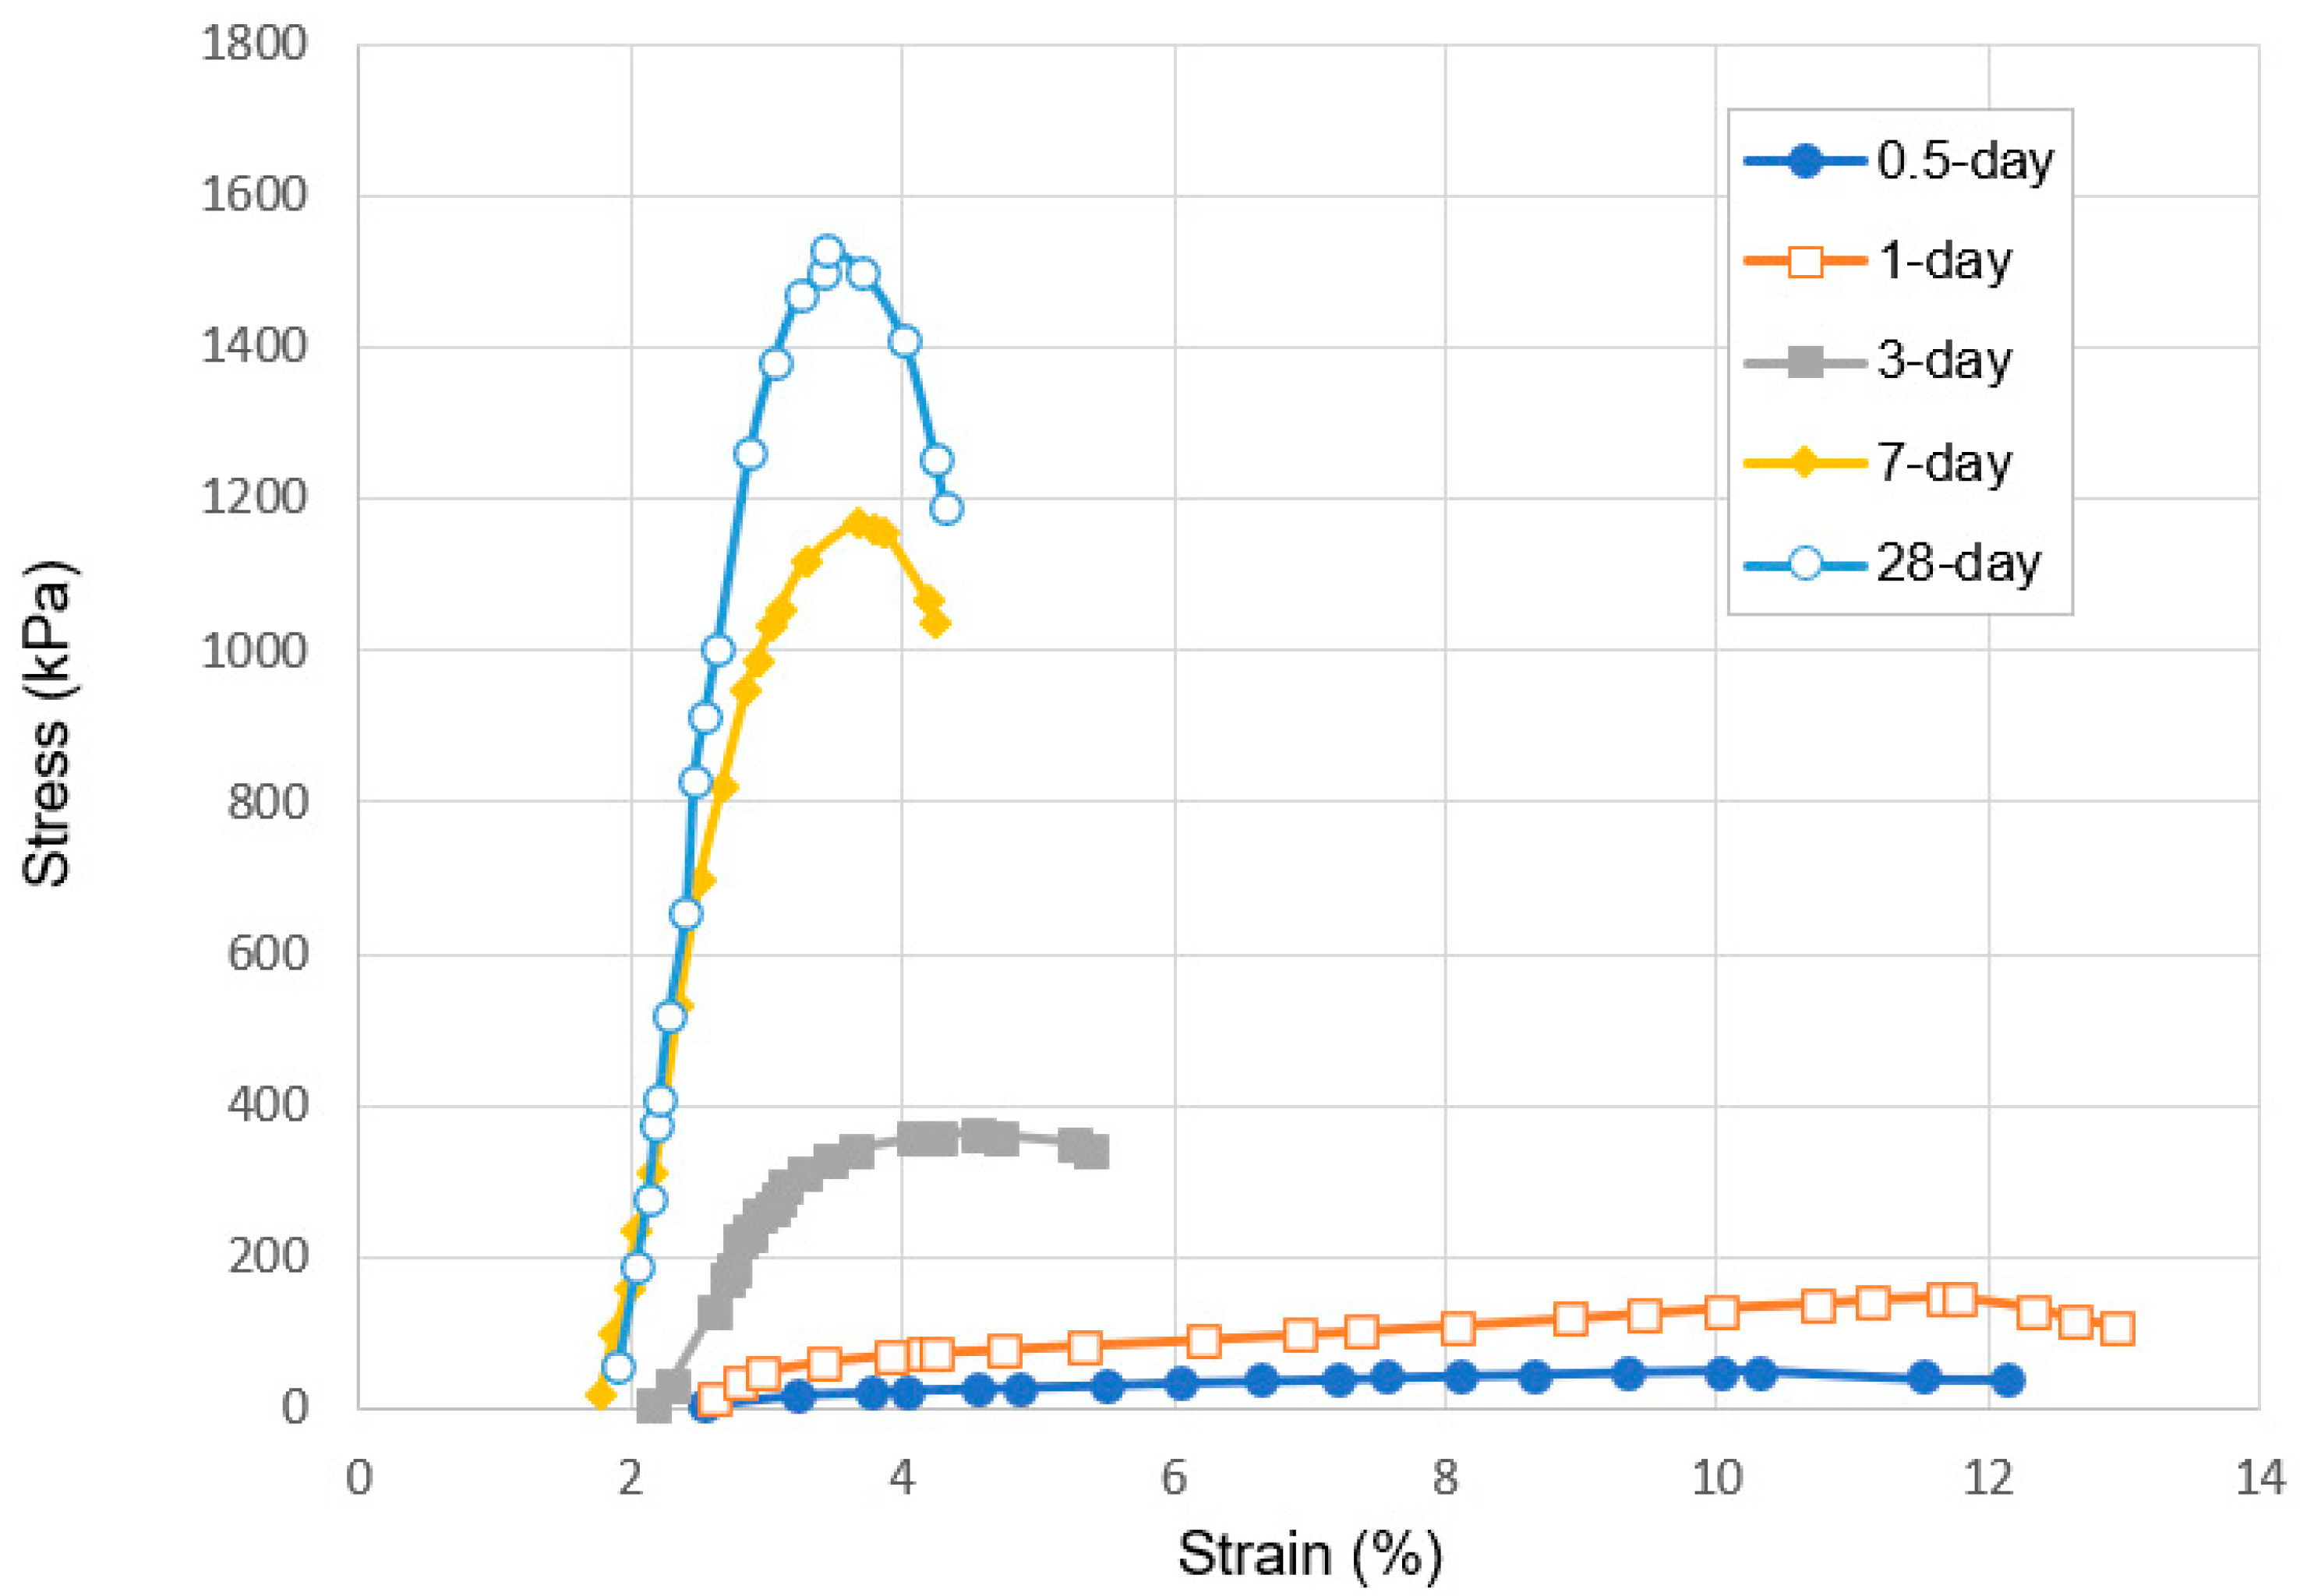
  • The stress–strain characteristics (e.g., the shape of the stress–strain curve, maximum stress and strain, modulus of elasticity) of CPB are markedly influenced by the presence of sodium silicate in the CPB composition. CPB’s axial stress–strain responses differ depending on the presence or absence of SS. The presence of SS in CPB leads to an augmentation of peak stress and modulus of elasticity, primarily due to the enhanced hydration of the binder caused by SS. It is also observed that the stress–strain characteristics of SS-CPB are significantly affected by the curing time. For longer curing times, the stress–strain responses of SS-CPB show greater stiffness, higher peak stress, more defined peaks, and subsequent softening. The reason for this is that longer curing times lead to a greater degree of cement hydration, greater self-dehydration, and a finer pore structure of the SS-CPB material.
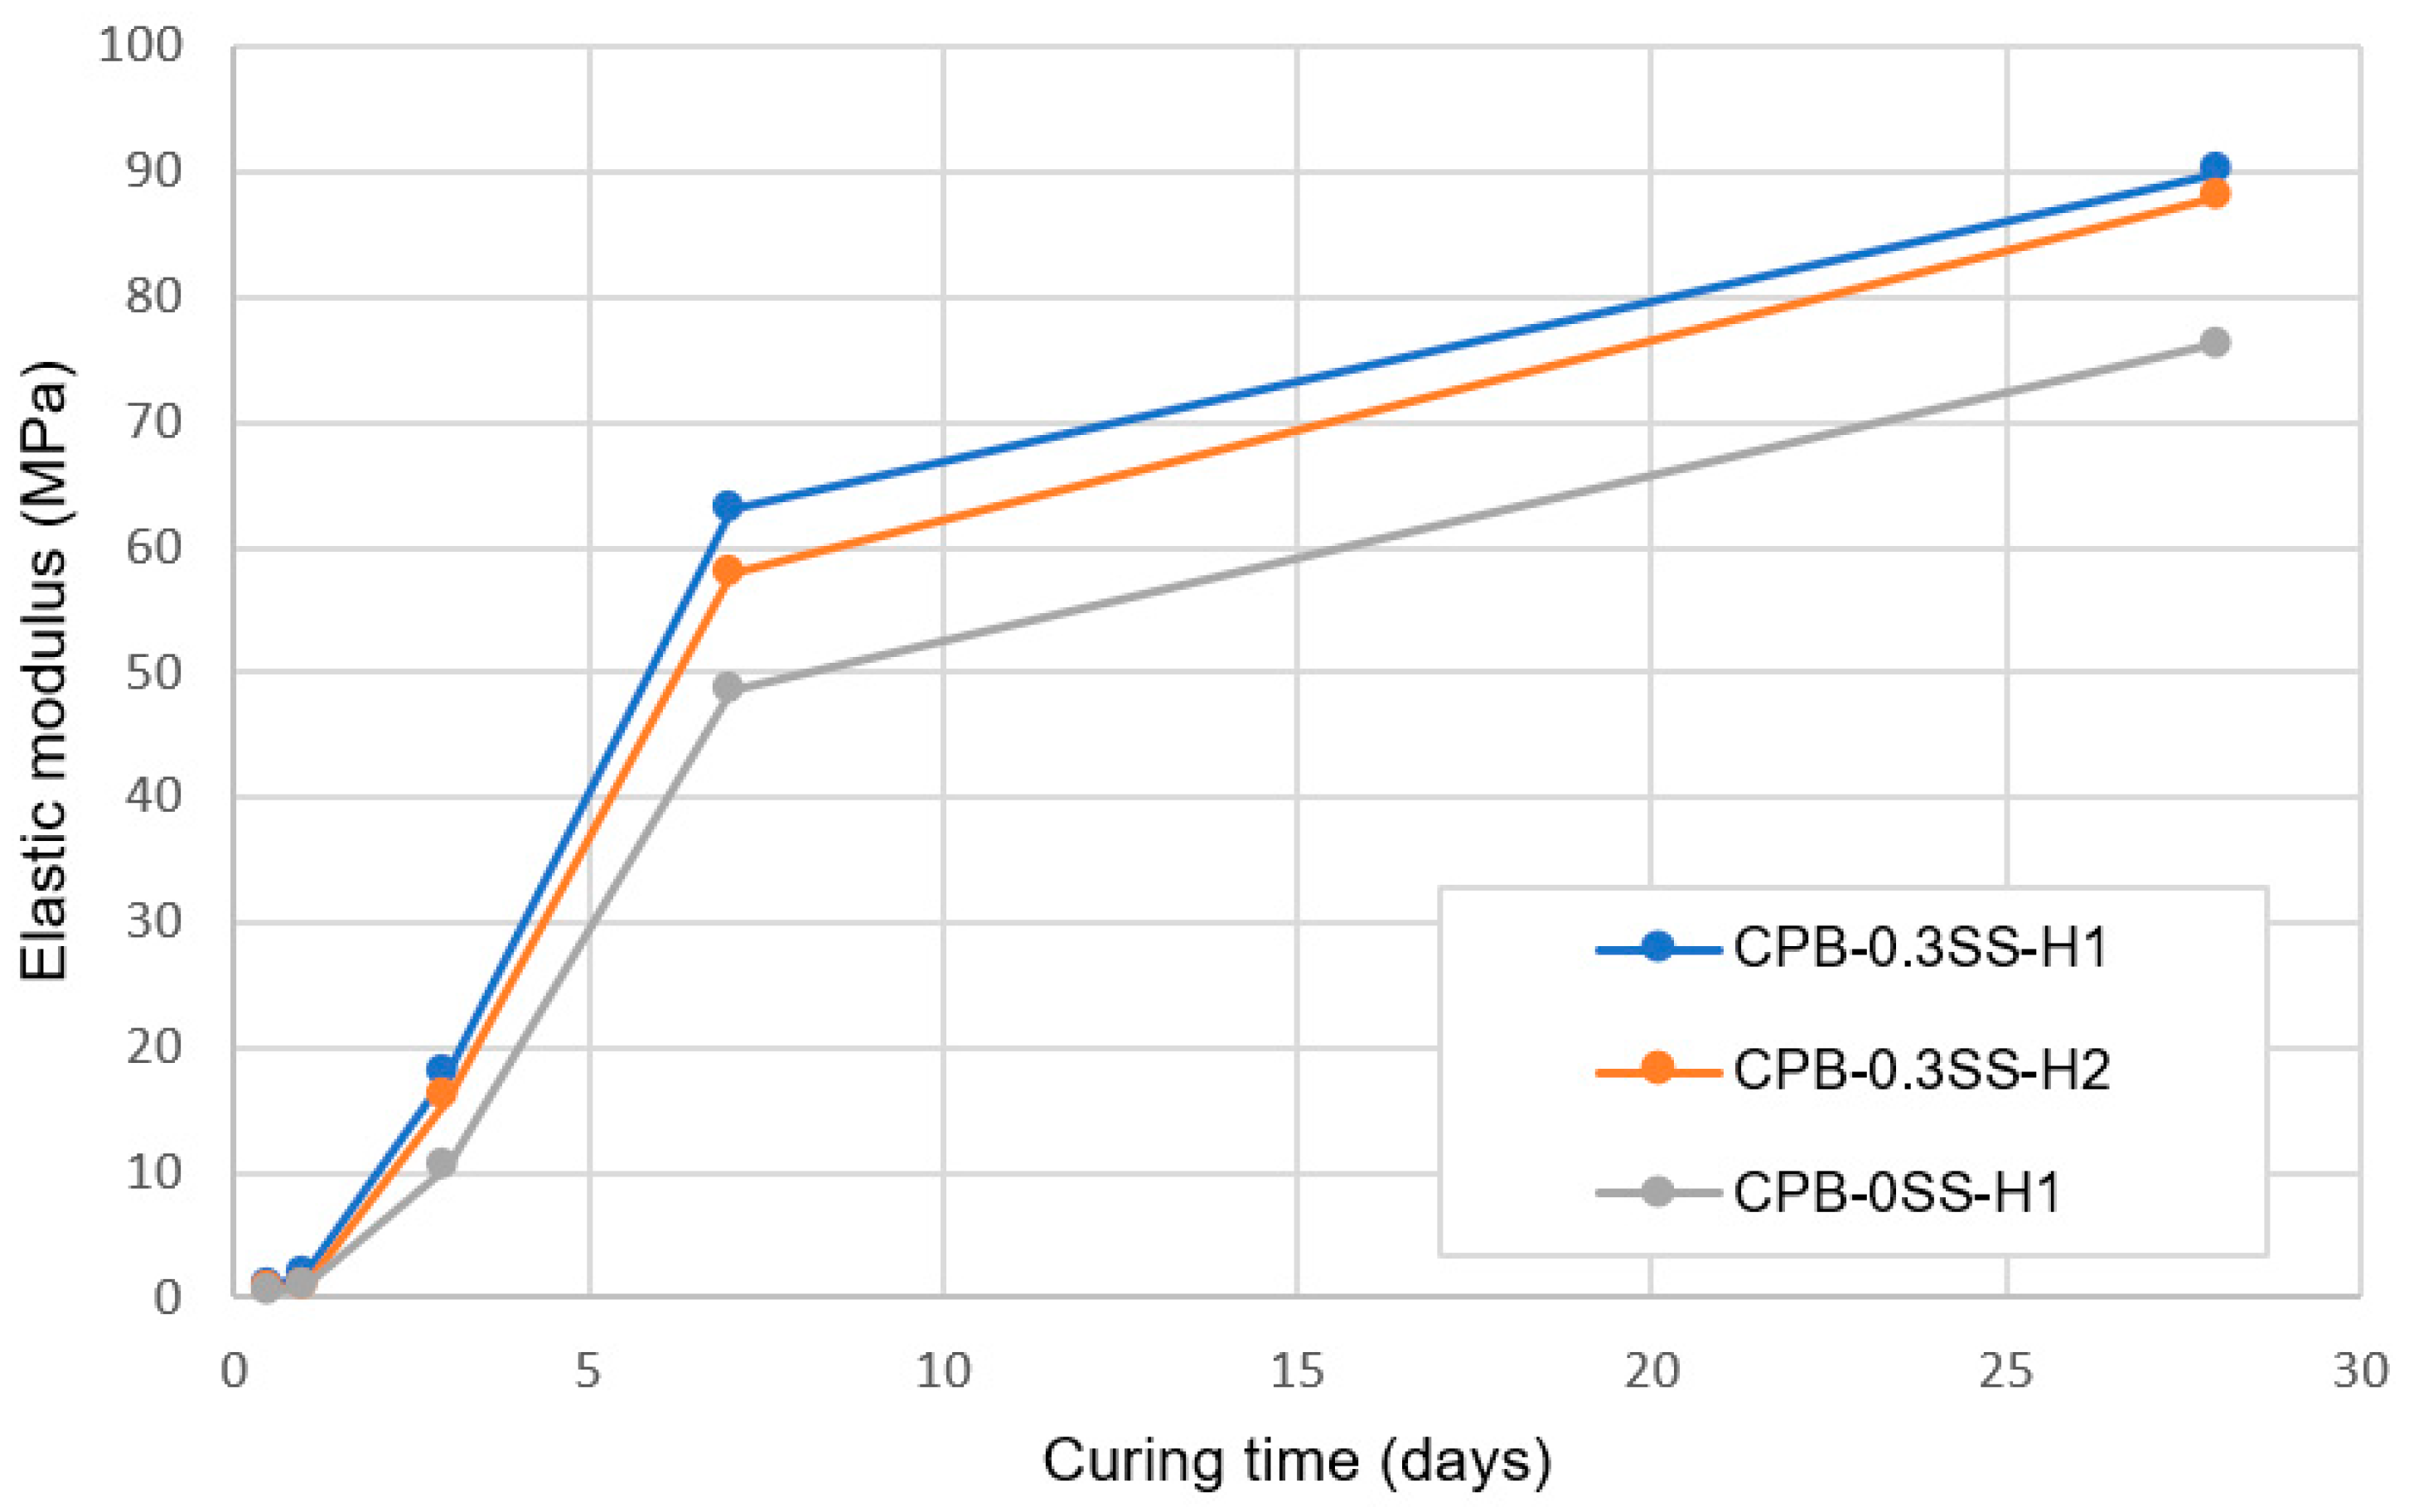
  • The results demonstrate that the stress–strain characteristics (e.g., the shape of the stress–strain curve, maximum stress and strain, and modulus of elasticity) of CPB under field temperature conditions are impacted by the presence of SS in the CPB composition. The maximum stress is enhanced, and the corresponding strain is increased with the addition of SS. Furthermore, under field thermal curing conditions, the modulus of elasticity of CPB with SS is higher than that without SS, irrespective of curing time, i.e., SS-CPB is stiffer.
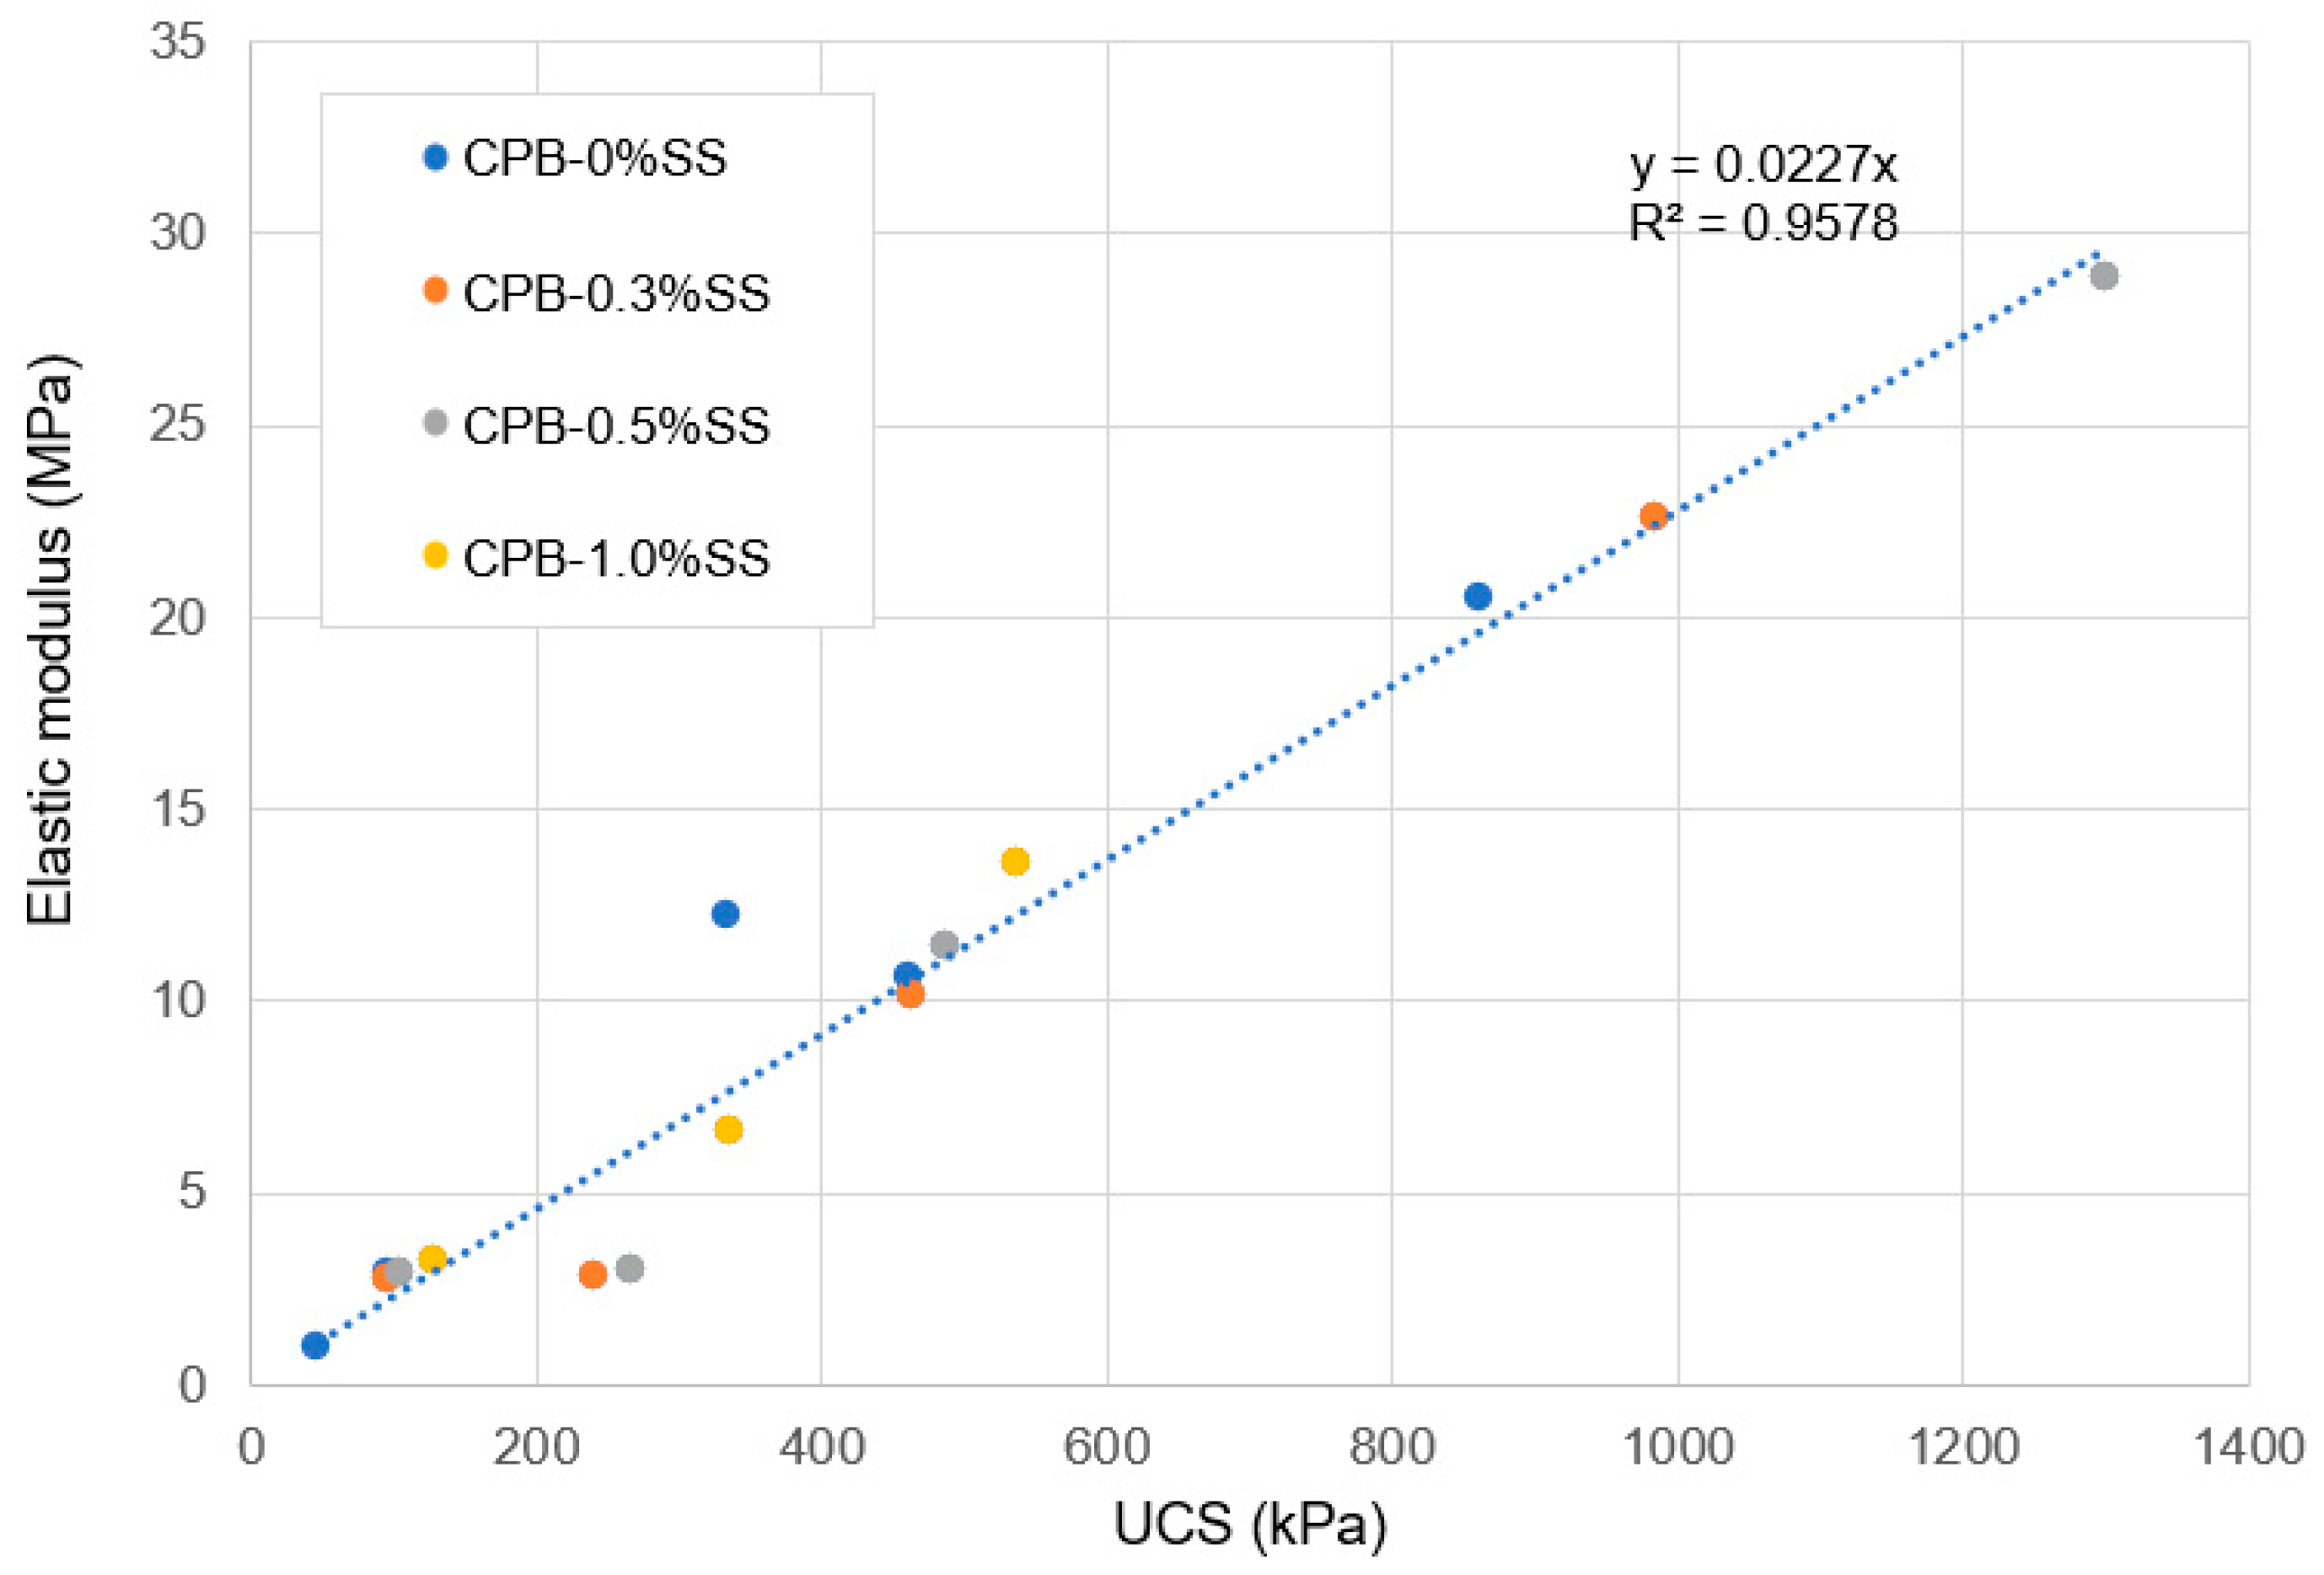
  • It was also found that the compressive strength of SS-CPB has a linear relationship with the modulus of elasticity, and SS contents do not significantly affect this relationship.

Author Contributions

Conceptualization, M.F.; methodology, J.M., M.F. and H.M.P.; validation, J.M., M.F. and H.M.P.; formal analysis, J.M., M.F. and H.M.P.; investigation, J.M. and H.M.P.; resources, M.F.; writing—original draft preparation, J.M.; writing—review and editing, M.F. and H.M.P.; supervision, M.F.; project administration, M.F.; funding acquisition, M.F. All authors have read and agreed to the published version of the manuscript.

Funding

The authors would like to acknowledge the financial support of the Natural Sciences and Research Council (NSERC) of Canada. Moreover, the authors thank Lafarge Canada for providing the Slag used in this research.

Data Availability Statement

Some of all the data, models, or code that support the findings of this study are available from the corresponding author upon reasonable request.

Conflicts of Interest

The authors declare no competing interest.

References

  1. Kasap, T.; Yilmaz, E.; Sari, M. Physico-chemical and micro-structural behavior of cemented mine backfill: Effect of pH in dam tailings. J. Environ. Manag. 2022, 314, 115034. [Google Scholar] [CrossRef]
  2. Yang, L.H.; Li, J.C.; Jiao, H.Z.; Wu, A.; Yin, S. Research on the homogenization evaluation of cemented paste backfill in the preparation process based on image texture features. Minerals 2022, 12, 1622. [Google Scholar] [CrossRef]
  3. Jiang, H.; Qi, Z.; Yilmaz, E.; Han, J.; Qiu, J.; Dong, C. Effectiveness of alkali-activated slag as alternative binder on workability and early age compressive strength of cemented paste backfills. Constr. Build. Mater. 2019, 218, 689–700. [Google Scholar] [CrossRef]
  4. Fridjonsson, E.O.; Hasan, A.; Fourie, A.B.; Johns, M.L. Pore structure in a gold mine cemented paste backfill. Miner. Eng. 2013, 53, 144–151. [Google Scholar] [CrossRef]
  5. Yilmaz, E.; Belem, T.; Bussière, B.; Benzaazoua, M. Relationships between microstructural properties and compressive strength of consolidated and unconsolidated cemented paste backfills. Cem. Concr. Compos. 2011, 33, 702–715. [Google Scholar] [CrossRef]
  6. Vergne, J. Rules of thumb for the hard rock mining industry. In Hard Rock Miner’s Handbook 2000, 3rd ed.; McIntosh Engineering Inc.: Tempe, AZ, USA, 2000. [Google Scholar]
  7. Fall, M.; Célestin, J.C.; Pokharel, M.; Touré, M. A contribution to understanding the effects of curing temperature on the mechanical properties of mine cemented tailings backfill. Eng. Geol. 2010, 114, 397–413. [Google Scholar] [CrossRef]
  8. Fall, M.; Pokharel, M. Coupled effects of sulphate and temperature on the strength development of cemented tailings backfills: Portland cement-paste backfill. Cem. Concr. Compos. 2010, 32, 819–828. [Google Scholar] [CrossRef]
  9. Xue, G.; Yilmaz, E.; Song, W.; Cao, S. Compressive strength characteristics of cemented tailings backfill with alkali-activated slag. Appl. Sci. 2018, 8, 1537. [Google Scholar] [CrossRef]
  10. Yang, L.; Yilmaz, E.; Li, J.; Liu, H.; Jiang, H. Effect of superplasticizer type and dosage on fluidity and strength behavior of cemented tailings backfill with different solid contents. Constr. Build. Mater. 2018, 187, 290–298. [Google Scholar] [CrossRef]
  11. Hassani, F.; Archibald, J.F. Mine Backfill; Canadian Institute of Mining, Metallurgy and Petroleum: Montreal, QC, Canada, 1998. [Google Scholar]
  12. Tariq, A.; Yanful, E.K. A review of binders used in cemented paste tailings for underground and surface disposal practices. J. Environ. Manag. 2013, 131, 138–149. [Google Scholar] [CrossRef]
  13. Ali, G.A. Temperature Dependency of the Rheological Properties and Strength of Cemented Paste Backfill that Contains Sodium Silicate. Master’s Thesis, University of Ottawa, Ottawa, ON, Canada, 2021; 134p. [Google Scholar]
  14. Cavusoglu, I.; Yilmaz, E.; Yilmaz, A.O. Sodium silicate effect on setting properties, strength behavior and microstructure of cemented coal fly ash backfill. Powder Technol. 2021, 384, 17–28. [Google Scholar] [CrossRef]
  15. Cihangir, F.; Ercikdi, B.; Kesimal, A.; Ocak, S.; Akyol, Y. Effect of sodium-silicate activated slag at different silicate modulus on the strength and microstructural properties of full and coarse sulphidic tailings paste backfill. Constr. Build. Mater. 2018, 185, 555–566. [Google Scholar] [CrossRef]
  16. Cihangir, F.; Ercikdi, B.; Kesimal, A.; Turan, A.; Deveci, H. Utilisation of alkali-activated blast furnace slag in paste backfill of high-sulphide mill tailings: Effect of binder type and dosage. Miner. Eng. 2012, 30, 33–43. [Google Scholar] [CrossRef]
  17. Kermani, M.; Hassani, F.P.; Aflaki, E.; Benzaazoua, M.; Nokken, M. Evaluation of the effect of sodium silicate addition to mine backfill, Gelfill—Part 1. J. Rock Mech. Geotech. Eng. 2015, 7, 266–272. [Google Scholar] [CrossRef]
  18. Kermani, M.; Hassani, F.P.; Aflaki, E.; Benzaazoua, M.; Nokken, M. Evaluation of the effect of sodium silicate addition to mine backfill, Gelfill—Part 2: Effects of mixing time and curing temperature. J. Rock Mech. Geotech. Eng. 2015, 7, 668–673. [Google Scholar] [CrossRef]
  19. Chang, S. Strength and Deformation Behaviour of Cemented Paste Backfill in Sub-Zero Environment. Master’s Thesis, University of Ottawa, Ottawa, ON, Canada, 2016; p. 152. [Google Scholar]
  20. Wang, Z.; Wang, Y.; Cui, L.; Bi, C.; Wu, A. Insight into the isothermal multiphysics processes in cemented paste backfill: Effect of curing time and cement-to-tailings ratio. Constr. Build. Mater. 2022, 325, 126739. [Google Scholar] [CrossRef]
  21. Ghirian, A.; Fall, M. Properties of cemented paste backfill. In Paste Tailing Management; Springer International Publishing: Cham, Switzerland, 2017; pp. 59–109. [Google Scholar]
  22. Cui, L.; Fall, M. Mechanical and thermal properties of cemented tailings materials at early ages: Influence of initial temperature, curing stress and drainage conditions. Constr. Build. Mater. 2016, 125, 553–563. [Google Scholar] [CrossRef]
  23. Wu, D.; Fall, M.; Cai, S.-J. Numerical modelling of thermally and hydraulically coupled processes in hydrating tailings backfill columns. Int. J. Min. Reclam. Environ. 2014, 28, 173–199. [Google Scholar] [CrossRef]
  24. Haruna, S.; Fall, M. Time- and temperature-dependent rheological properties of cemented paste backfill that contains superplasticizer. Power Technol. 2020, 360, 731–740. [Google Scholar] [CrossRef]
  25. Aldhafeeri, A.; Fall, M.; Pokharel, M.; Pouramini, Z. Temperature dependency of the reactivity of cemented paste backfill. Appl. Geochem. 2016, 72, 10–19. [Google Scholar] [CrossRef]
  26. Britannica. Water Glass. 2018. Available online: https://www.britannica.com/science/water-glass (accessed on 5 September 2023).
  27. Elghali, A.; Benzaazoua, M.; Bussière, B.; Genty, T. In situ effectiveness of alkaline and cementitious amendments to stabilize oxidized acid-generating tailings. Minerals 2019, 9, 314. [Google Scholar] [CrossRef]
  28. Cihangir, F.; Akyol, Y. Effect of desliming of tailings on the fresh and hardened properties of paste backfill made from alkali-activated slag. Adv. Mater. Sci. Eng. 2020, 2020, 4536257. [Google Scholar] [CrossRef]
  29. Orejarena, L.; Fall, M. Mechanical response of a mine composite material to extreme heat. Bull. Eng. Geol. Environ. 2008, 67, 387–396. [Google Scholar] [CrossRef]
  30. Diamond, S. The microstructure of cement paste and concrete—A visual primer. Cem. Concr. Compos. 2004, 26, 919–933. [Google Scholar] [CrossRef]
  31. Jiang, H.; Ren, L.; Gu, X.; Zheng, J.; Cui, L. Synergistic effect of activator nature and curing temperature on time-dependent rheological behavior of cemented paste backfill containing alkali-activated slag. Environ. Sci. Pollut. Res. 2023, 30, 12857–12871. [Google Scholar] [CrossRef]
  32. Libos, I.L.; Cui, L. Effects of curing time, cement content, and saturation state on mode-I fracture toughness of cemented paste backfill. Eng. Fract. Mech. 2020, 235, 107174. [Google Scholar] [CrossRef]
  33. Gan, M. Cement and Concrete; CRC Press: Boca Raton, FL, USA, 1997. [Google Scholar]
  34. Taylor, H.F.W. The Chemistry of Cements. Academic Press: London, UK, 1993. [Google Scholar]
  35. Al-Moselly, Z.; Fall, M.; Haruna, S. Further insight into the strength development of cemented paste backfill materials containing polycarboxylate ether-based superplasticizer. J. Build. Eng. 2021, 47, 103859. [Google Scholar] [CrossRef]
  36. Cui, L.; McAdie, A. Experimental study on evolutive fracture behavior and properties of sulfate-rich fiber-reinforced cemented paste backfill under pure mode-I, mode-II, and mode-III loadings. Int. J. Rock Mech. Min. Sci. 2023, 169, 105434. [Google Scholar] [CrossRef]
  37. Erçikdi, B.; Cihangir, F.; Kesimal, A.; Deveci, H. Practical importance of tailings for cemented paste backfill. In Paste Tailings Management; Springer International Publishing: Cham, Switzerland, 2017; pp. 7–32. [Google Scholar]
  38. Ercikdi, B.; Kesimal, A.; Cihangir, F.; Deveci, H.; Alp, İ. Cemented paste backfill of sulphide-rich tailings: Importance of binder type and dosage. Cem. Concr. Compos. 2009, 31, 268–274. [Google Scholar] [CrossRef]
  39. Fall, M.; Benzaazoua, M.; Saa, E.G. Mix proportioning of underground cemented tailings backfill. Tunn. Undergr. Space Technol. 2008, 23, 80–90. [Google Scholar] [CrossRef]
  40. Wang, Y.; Fall, M.; Wu, A. Initial temperature-dependence of strength development and self-desiccation in cemented paste backfill that contains sodium silicate. Cem. Concr. Compos. 2016, 67, 101–110. [Google Scholar] [CrossRef]
  41. Nasir, O.; Fall, M. Modeling the heat development in hydrating cemented paste backfill structures. Comput. Geotech. 2009, 36, 1207–1218. [Google Scholar] [CrossRef]
  42. Wu, D.; Fall, M.; Cai, S.-J. Coupled modeling of temperature distribution and evolution in cemented tailings backfill structures that contains mineral admixtures. J. Geotech. Geol. Eng. 2012, 30, 935–961. [Google Scholar] [CrossRef]
  43. Ghirian, A.; Fall, M. Coupled behavior of cemented paste backfill at early ages. Geotech. Geol. Eng. 2015, 33, 1141–1166. [Google Scholar] [CrossRef]
  44. Ghirian, A.; Fall, M. Long-term coupled behaviour of cemented paste backfill in load cell experiments. Geomech. Geoengin. 2016, 11, 237–251. [Google Scholar] [CrossRef]
  45. Fall, M.; Belem, T.; Samb, S.; Benzaazoua, M. Experimental characterization of the stress-strain behaviour of cemented paste backfill. J. Mater. Sci. 2007, 42, 3914–3922. [Google Scholar] [CrossRef]
  46. Liu, Q.; Liu, D.; Tian, Y.; Liu, X. Numerical simulation of stress-strain behaviour of cemented paste backfill in triaxial compression. Eng. Geol. 2017, 231, 165–175. [Google Scholar] [CrossRef]
  47. Wu, A.; Wang, Y.; Zhou, B.; Shen, J. Effect of initial backfill temperature on the deformation behavior of early age cemented paste backfill that contains sodium silicate. Adv. Mater. Sci. Eng. 2016, 2016, 8481090. [Google Scholar] [CrossRef]
  48. Cao, S.; Yilmaz, E.; Song, W. Dynamic response of cemented tailings matrix composites under SHPB compression load. Constr. Build. Mater. 2018, 186, 892–903. [Google Scholar] [CrossRef]
Figure 1. Particle size distributions of the tailings used, along with the average grain size distribution of tailings collected from nine mines located in Eastern Canada (particle distributions obtained using a laser diffraction particle size analyzer).
Minerals 13 01382 g001
Figure 2. Effect of curing time on the strength of CPB with (CPB-0.3%SS) and without (CPB-0%SS) sodium silicate (SS).
Minerals 13 01382 g002
Figure 3. Effects of SS on the TG/DTG behavior of 28-day cured cement pastes.
Minerals 13 01382 g003
Figure 4. Change in EC of CPB with (0.3%SS) and without (0.0%SS) sodium silicate (SS).
Minerals 13 01382 g004
Figure 5. Effects of varying SS amounts on the physical properties of CPB: (a) porosity, (b) void ratio, (c) water content, and (d) dry density.
Minerals 13 01382 g005
Figure 6. Impact of curing time and SS content on the strength of SS-CPB.
Minerals 13 01382 g006
Figure 7. Effect of mixing water chemistry on the strength development of SS-CPB.
Minerals 13 01382 g007
Figure 8. DTG results of 28-day cured CPB containing initial sulfate contents of 0 ppm or 25,000 ppm.
Minerals 13 01382 g008
Figure 9. Comparing the electrical conductivity of SS-CPB specimens with and without sulfate.
Minerals 13 01382 g009
Figure 10. MIP testing results for SS-CPB specimens with sulfate concentrations of 0 and 25,000 ppm after curing for 28 days: (a) total pore volume, (b) pore distribution.
Minerals 13 01382 g010
Figure 11. CPB Temperature histories for different stope sizes [41]. (H: stope height; W: stope width). Adapted with permission from Ref. [41]. Copyright 2009 Elsevier.
Minerals 13 01382 g011
Figure 12. Influence of non-isothermal curing conditions on the UCS development of SS-CPB.
Minerals 13 01382 g012
Figure 13. Effect of the presence of SS on the ratio of the UCS of CPB cured under H1 to that of CPB cured at 20 °C.
Minerals 13 01382 g013
Figure 14. Impact of non-isothermal curing temperature on the electrical conductivity of CPB samples cured at room temperature and H1.
Minerals 13 01382 g014
Figure 15. Comparing TG/DTG results of CPB samples under isothermal (20 °C) and non-isothermal (TH2) conditions.
Minerals 13 01382 g015
Figure 16. Comparing MIP test results for samples cured isothermally and non-isothermally: (a) total pore volume, (b) pore distribution.
Minerals 13 01382 g016aMinerals 13 01382 g016b
Figure 17. Schematic diagram of the THMC-Backfill curing system and arrangement of sensors [43,44]. Reprinted with permission from Refs. [43,44]. Copyright 2015 Springer, 2016 Taylor & Francis.
Minerals 13 01382 g017
Figure 18. CSH-1: curing stress history. The pressure application scheme simulates a 30 m mine backfill height and an average filling rate of 0.31 m/h.
Minerals 13 01382 g018
Figure 19. Impact of curing under stress on the UCS of CPB specimens with (0.3%SS) and without (0%SS) SS.
Minerals 13 01382 g019
Figure 20. Influence of varying SS amounts on the physical characteristics of CPB: (a) porosity, (b) void ratio, (c) water content, and (d) dry density.
Minerals 13 01382 g020aMinerals 13 01382 g020b
Figure 21. The typical axial strain–stress curve of SS-CPB samples.
Minerals 13 01382 g021
Figure 22. The stress–strain behavior of CPB with various amounts of SS after curing for 7 days.
Minerals 13 01382 g022
Figure 23. Changes in the axial strain–stress behavior of CPB-0%SS-H1 samples with different curing times.
Minerals 13 01382 g023
Figure 24. Changes in the axial strain–stress behavior of SS-CPB samples with different field curing temperatures cured for: (a) 0.5 day, (b) 1 day, (c) 3 days, (d) 7 days, (e) 28 days (0SS: 0% sodium silicate content; 0.3SS: 0.3% sodium silicate content).
Minerals 13 01382 g024
Figure 25. Elastic modulus evolution of SS-CPB samples subjected to different field curing temperatures.
Minerals 13 01382 g025
Figure 26. Relationship between the initial elastic modulus and UCS of samples with various dosages of sodium silicate.
Minerals 13 01382 g026
Table 1. Main characteristics of the binders.
ElementPCI (%)Slag (%)
Fe2O32.7-
SO33.83.9
SiO218.034.2
Al2O34.59.5
MgO2.611.0
CaO62.841.1
Relative density3.23.9
Table 2. Mixture composition of the prepared SS-CPB samples and curing conditions (SS: sodium silicate).
SampleBinder
Content
(%)
BinderBinder RatioTailing
Type
W/C
Ratio
Mixing
Water
SS (%)Curing StressCuring Times (Days)Curing Temp
(°C)
A. Impact of curing time on the UCS of SS-CPB
CPB-ST-0.3%SS4.50PCI:Slag50/50ST7.6TW0.300.5, 1, 3, 7, 2820
CPB-NT-0.3%SS4.50PCI:Slag50/50GT7.6TW0.300.5, 1, 3, 7, 2820
B. Impact of curing time and SS content on the strength of SS-CPB
CPB-0%SS4.50PCI:Slag50/50ST7.6TW000.5, 1, 3, 7, 2820
CPB-0.1%SS4.50PCI:Slag50/50ST7.6TW0.100.5, 1, 3, 7, 2820
CPB-0.2%SS4.50PCI:Slag50/50ST7.6TW0.200.5, 1, 3, 7, 2820
CPB-0.3%SS4.50PCI:Slag50/50ST7.6TW0.300.5, 1, 3, 7, 28,20
CPB-0.4%SS4.50PCI:Slag50/50ST7.6TW0.300.5, 1, 3, 7, 28,20
CPB-0.5%SS4.50PCI:Slag50/50ST7.6TW0.500.5, 1, 3, 7, 28,20
CPB-0.7%SS4.50PCI:Slag50/50ST7.6TW0.700.5, 1, 3, 7, 28,20
CPB-1.0%SS4.50PCI:Slag50/50ST7.6TW1.000.5, 1, 3, 7, 28,20
C. Impact of mixing water chemistry on the strength of SS-CPB
CPB-0p-0.3%SS4.50PCI:Slag50/50ST7.6DW0.307, 28, 90, 15020
CPB-25p-0.3%SS4.50PCI:Slag50/50ST7.625,000 ppm0.307, 28, 90, 15020
CPB-25p4.50PCI:Slag50/50ST7.625,000 ppm007, 28, 90, 15020
CPB-0p4.50PCI:Slag50/50ST7.6DW007, 28, 90, 15020
D. Impact of curing stress on the strength of SS-CPB
CPB-0.3%SS-CS4.50PCI:Slag50/50ST7.6TW0.3CSH-10.5, 1, 3, 7, 2820
CPB-CS4.50PCI:Slag50/50ST7.6TW0CSH-10.5, 1, 3, 7, 2820
E. Impact of non-isothermal curing on the strength of SS-CPB
CPB-H1-0.3%SS4.50PCI:Slag50/50ST7.6TW0.300.5, 1, 3, 7, 28H1
CPB-H14.50PCI:Slag50/50ST7.6TW0.000.5, 1, 3, 7, 28H1
CPB-H2-0.3%SS4.50PCI:Slag50/50ST7.6TW0.300.5, 1, 3, 7, 28H2
CPB-0.3%SS4.50PCI:Slag50/50ST7.6TW0.300.5, 1, 3, 7, 2820
CPB4.50PCI:Slag50/50ST7.6TW000.5, 1, 3, 7, 2820
Notes: ST: silica tailing; GT: gold tailing; SS: sodium silicate; TW: tap water; DW: distilled water; CS: curing stress; CSH-1: curing stress history; H1: temperature history 1; and H2: temperature history 2.
Disclaimer/Publisher’s Note: The statements, opinions and data contained in all publications are solely those of the individual author(s) and contributor(s) and not of MDPI and/or the editor(s). MDPI and/or the editor(s) disclaim responsibility for any injury to people or property resulting from any ideas, methods, instructions or products referred to in the content.

