Article

Characteristics and Controlling Factors of Particle Crushing in Volcaniclastic Sediments under Compaction: The Quaternary Pyroclastic Deposits of Hongtu Hill, Changbaishan Area, Northeastern China

1
College of Earth Sciences, Jilin University, Changchun 130061, China
2
Key Laboratory of Mineral Resources Evaluation in Northeast Asia, Ministry of Natural Resources, Changchun 130061, China
3
Jilin Oilfield Company, PetroChina, Songyuan 138000, China
4
Applied Technology College, Jilin University, Changchun 130061, China
5
Gas Production Company, Daqing Oilfield Company Limited, Daqing 163114, China
*
Authors to whom correspondence should be addressed.
Minerals 2023, 13(10), 1351; https://doi.org/10.3390/min13101351
Submission received: 15 August 2023 / Revised: 14 October 2023 / Accepted: 22 October 2023 / Published: 23 October 2023
(This article belongs to the Special Issue Petrological and Geochemical Characteristics of Reservoirs)

Abstract

:
Recently, many scholars have conducted experimental mechanical compaction studies on sandstones, carbonates, and mudstones to visually study the mechanical compaction process and reservoir evolution of sedimentary rocks. However, experimental mechanical compaction studies on the evolution of the compaction process of pyroclastic rocks have been ignored. Volcaniclastic rock reservoirs are widely distributed across the world and strongly influenced by the crushing of pyroclastic particles. In this study, we analyzed the characteristics and controlling factors of the crushing of pyroclastic particles during compaction diagenesis from a microscopic perspective through experimental mechanical compaction. These results can provide quantitative compaction background parameters for the quantitative study of pyroclastic rock reservoir evolution. We took pyroclastic samples from Hongtu Hill in the Changbaishan area as an example, and experimental mechanical compaction experiments were conducted. Furthermore, image surface porosity and particle analysis statistical methods were used, and the variations in the effective porosity and image surface porosity under different axial stresses were studied. The results showed that, after compaction, the effective porosity did not exhibit a decreasing trend with increasing axial stress but rather a normal distribution trend that initially increased and then decreased. In the compaction experiment, the pyroclastic particle crushing process was segmented with increasing axial stress, and there was an obvious compaction band in the initial stage of the compaction, called the particle rearrangement stage (10–30 MPa). Furthermore, there were relatively non-successive compaction localization areas in the later stage of compaction, called the particle crushing stage (50–70 MPa), which was represented by vitreous basalt particles surrounded by porphyritic basalt particles. During experimental mechanical compaction, the smaller the compactness, the smaller the solidity, and the larger the slenderness of the particles, the more likely the particles were to break during compaction. Particles containing intragranular pores and vitreous basalt particles were easily crushed.

1. Introduction

Pyroclastic rocks can form good reservoirs, such as those in the Sichuan Basin, the Kebai area of the Junggar Basin, the Linshang area of the Bohai Bay Basin, the CampoBremen gas field in the Austral Basin, Argentina, and the Yingtai fault depression and Wangfu fault depression in the Songliao Basin [1,2,3,4,5]. Pyroclastic rocks and tuffite can have high porosity and permeability values when buried at depths above 3000 m [6]. The undiagenetic pyroclastic rocks have extremely high porosity, while the consolidated pyroclastic rocks in the basin have significantly lower porosity, which is mainly caused by the influences of compaction and cementation.
Compaction, as an important component of diagenesis, has been shown in numerous studies to be one of the main factors in the reduction of the porosity and permeability of reservoirs [7,8]. The evolution of the porosity and permeability during mechanical compaction is influenced by the sediment composition and structural parameters, such as particle size (Supplementary Materials), morphology, particle crushing, and rearrangement [9,10,11]. In recent years, in mechanical compaction research, most scholars have adopted experimental mechanical compaction to explore the compaction process. Compaction experiment studies have been conducted on rocks such as sandstones, carbonates, and mudstones. It has been clarified that the variations in the porosity and permeability of sandstones are related to the type of sandstone, particle size [12,13,14,15], quartz cementation [16], and shale matrix content [17]. The relationship with the bearing axial stress is linear [18,19], and the variations in the porosity and permeability with depth are segmented, with a depth of 600 m as the boundary dividing the initial rapid-change stage and the later slow-change stage [20]. The final strain and given axial stress-strain rate of carbonate rocks during compaction are controlled by the initial porosity, applied axial stress, fluid properties, initial particle accumulation, and size [21,22,23,24]. Mechanical compaction experiments on carbonate rocks are more applicable to bioclastic rocks (artificial mixtures) and high-porosity limestone [25]. In the simulation of mudstone compaction, the physical properties of mudstone (e.g., porosity, density, and sound velocity) vary greatly with increasing effective axial stress, clay mineral content, and fluid content [26,27].
In contrast, for pyroclasts with vitreous scoria, which are significantly different from other sedimentary rock particles, their evolution during compaction has not been clearly characterized. To understand better the compaction pattern of sedimentary rocks, in this study, the Quaternary pyroclast in the Hongtu Hill, Changbaishan area, were taken as an example, experimental simulations of the compaction process were conducted, and the characteristics and controlling factors of the crushing of pyroclastic particles during the compaction process were explored. The results of this study provide quantitative compaction background parameters for subsequent quantitative studies of pyroclastic reservoir evolution.

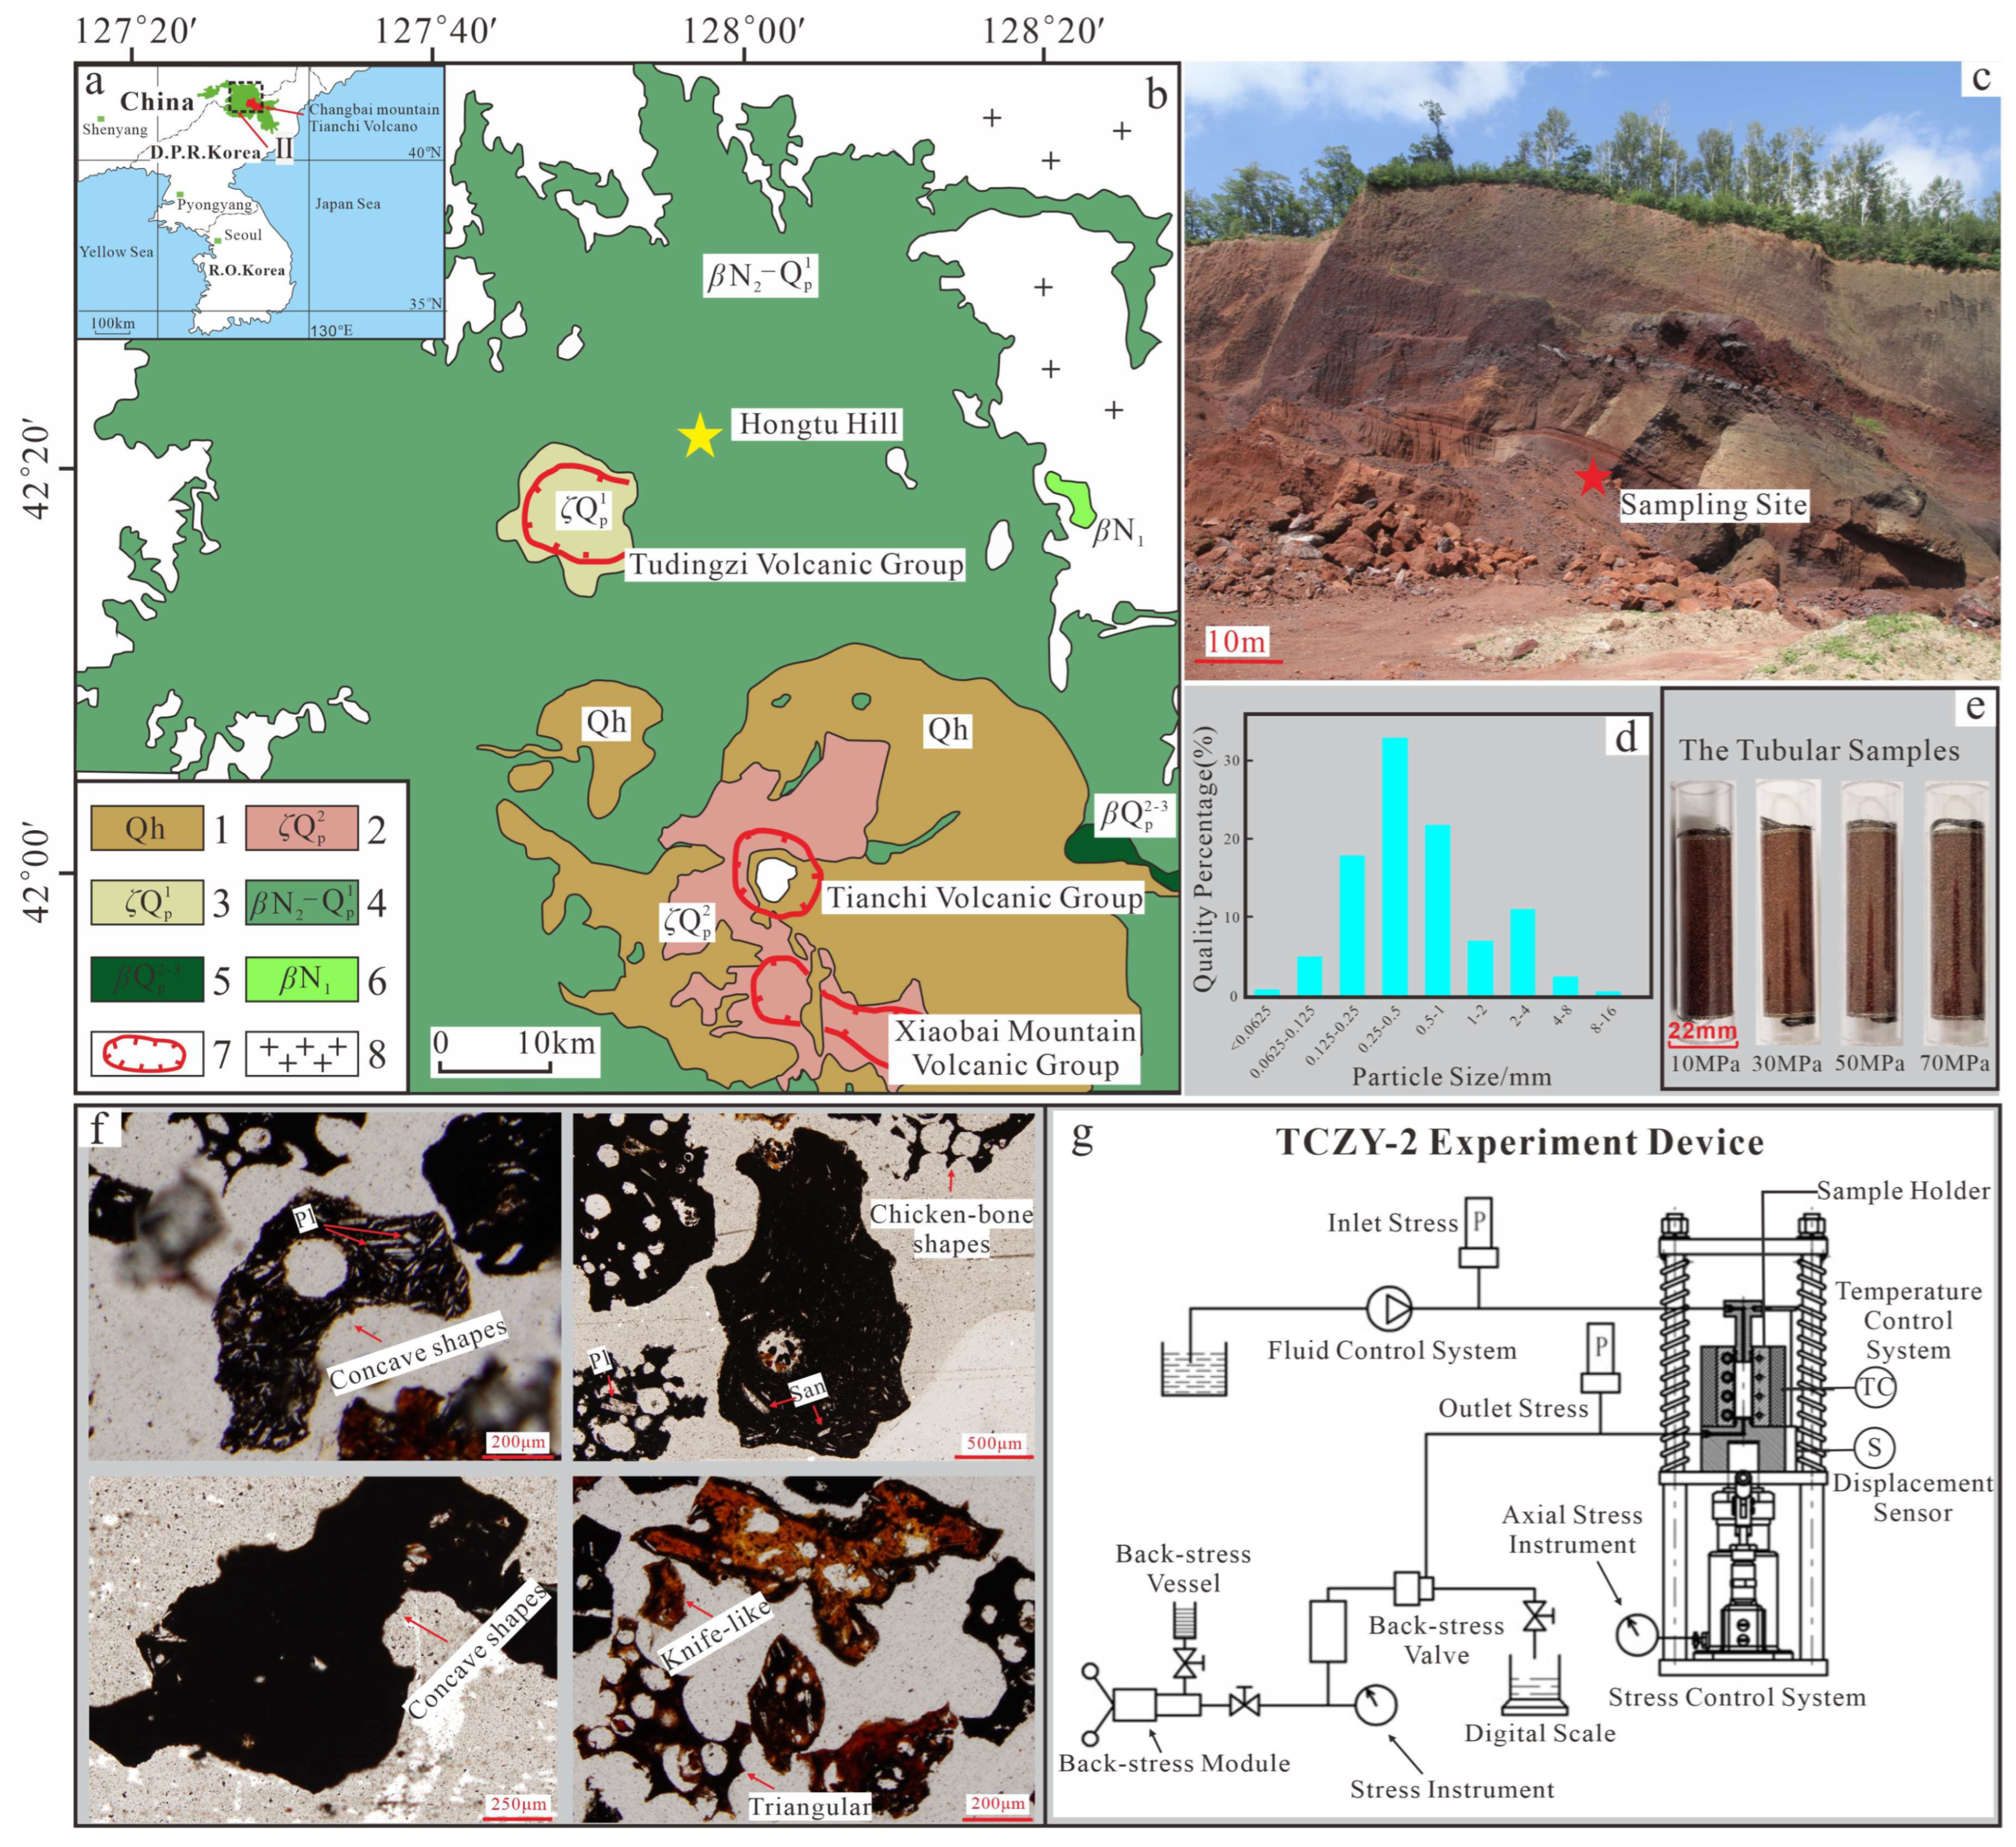
2. Geologic Setting and Samples

The Tianchi Volcano in the Changbaishan area is a Cenozoic multi-genetic central composite volcano located in northeastern China (Figure 1a). It has undergone three major evolutionary stages: (1) an early basaltic shield-forming stage (2–1 Ma); (2) followed by a basaltic to trachytic composite cone-forming stage (1–0.04 Ma), Hongtu Hill is a minor monogenetic basaltic scoria cone developed at this stage [28]; and (3) the latest explosive stage, during which comendite (rhyolite) and trachyte magma were erupted [29,30]. The Tianchi Volcano experienced a Plinian-type eruption during the Millennium, resulting in the ejection of pyroclast with an estimated volume of approximately 96–172 km³. Those materials are widely distributed around the Tianchi Volcano [30,31]. The Quaternary pyroclast exposed on the surface is very well developed and not influenced by the burial process. The sampling site in this study was Hongtu Hill, Liudaogou Town, Linjiang City, Jilin Province, located in the northeastern part of the Tudingzi Volcanic Group in the Changbaishan area (Figure 1b). According to field observations and sieve analysis results, a bedding profile was developed, and the entire structure is a basaltic cinder cone, with thin layers of grayish-black pyroclastic material at the top. The coarse debris (particle size concentration of 8–16 mm) in the lower quarry is composed of red basaltic scoria, while the fine debris (particle size concentration of 0.25–1 mm) is dominated by red tephra, with a small amount of bedrock debris. The middle and upper parts have a good bedding structure. The coarse debris (particle size concentration of 2–8 mm) is red basaltic scoria, the fine debris is mainly red tephra, and there is a small amount of bedrock debris (Figure 1c,e).
Under a polarizing microscope, some of the particles have irregular shapes such as knife-like, triangular, and chicken-bone shapes with sharp angles, and some of them are rounded or concave shapes (Figure 1f). It is mainly divided into two types. The first is reddish-brown vitreous basalt particles (65%) with a vitreous structure and developed pore structure. The second is the black basalt particles (35%) with a porphyritic structure, more regular and rounded shapes, and better roundness. Samples from the Hongtu Hill have low phenocryst contents (total phenocryst content < 5 vol%), mainly consisting of plagioclase and sanidine. The phenocrysts of the Hongtu Hill are generally smaller (20–60 μm in width).

3. Methods

3.1. Experimental Mechanical Compaction

Experimental mechanical compaction is an effective technique for simulating diagenesis in the laboratory. Before the compaction experiment, the sample preparation process was as follows. First, the sieve analysis was performed. Based on the particle size determined by the sample tube size and the development of the pores in the particles, the pyroclastic samples with a particle size of 0.25–0.5 mm were selected and placed in a large sample box for full mixing. Then, the tubular samples (a highly transparent polycarbonate (PC) tube with an inner diameter of 22 mm and an outer diameter of 25 mm) were removed using the cutting ring method, and both ends were fixed with a round high penetration sieve plate for easy placement in the compaction device (Figure 1e).
In our compaction experiment, we adopted a TCZY-2 model simulation experimental device, which mainly included a stress and temperature control system, a sample holder, a fluid control pump, a back-stress module, a stress sensor (Range: 50 MPa; Accuracy: 0.25%), a displacement sensor (Range: 100 mm; Accuracy: 0.001 mm), digital scale (Capacity: 220 g; Accuracy: 0.1 mg) and stress instrument (NHR-5100 Digital Display Instrument) (Figure 1g). The device enables uniaxial compaction simulations in which the axial stress is applied along the vertical axis while preventing horizontal strain. In the experimental compaction process, firstly, the PC tube containing the scoria sample was dried for 24 h. After drying, we measured the sample’s mass using a digital scale. Then the fluid control pump was used to displace the distilled water. By measuring mass before and after displacement, and using the density of distilled water, we can calculate the effective porosity before compaction. Effective porosity refers to the ratio of the pore volume through which distilled water can be displaced during the distillation displacement process to the total sample volume. After drying again for 24 h, the sample was loaded into the sample holder and a piston was placed at both ends. Vertical axial stress was applied to the sample under normal temperature conditions, and the compaction displacement was recorded by the displacement sensor on the sample holder. The sample was compressed to the target axial stress (10, 30, 50, and 70 MPa), and then, the static axial stress on the sample was kept stable by continuously replenishing the axial stress. When the added axial stress was less than 0.033 MPa (the minimum index value of the axial stress gauge), the sample was considered to have reached a stable state. The entire process took approximately 1 h. The fluid control pump was used to displace the distilled water, and the displacement axial stress did not exceed the target axial stress to prevent changing the particle crushing structure to obtain the effective porosity data of the compacted sample. By measuring the change in the effective porosity under different simulated axial stress conditions during compaction, the purpose of simulating the reservoir formation process and the evolution mechanism was achieved.

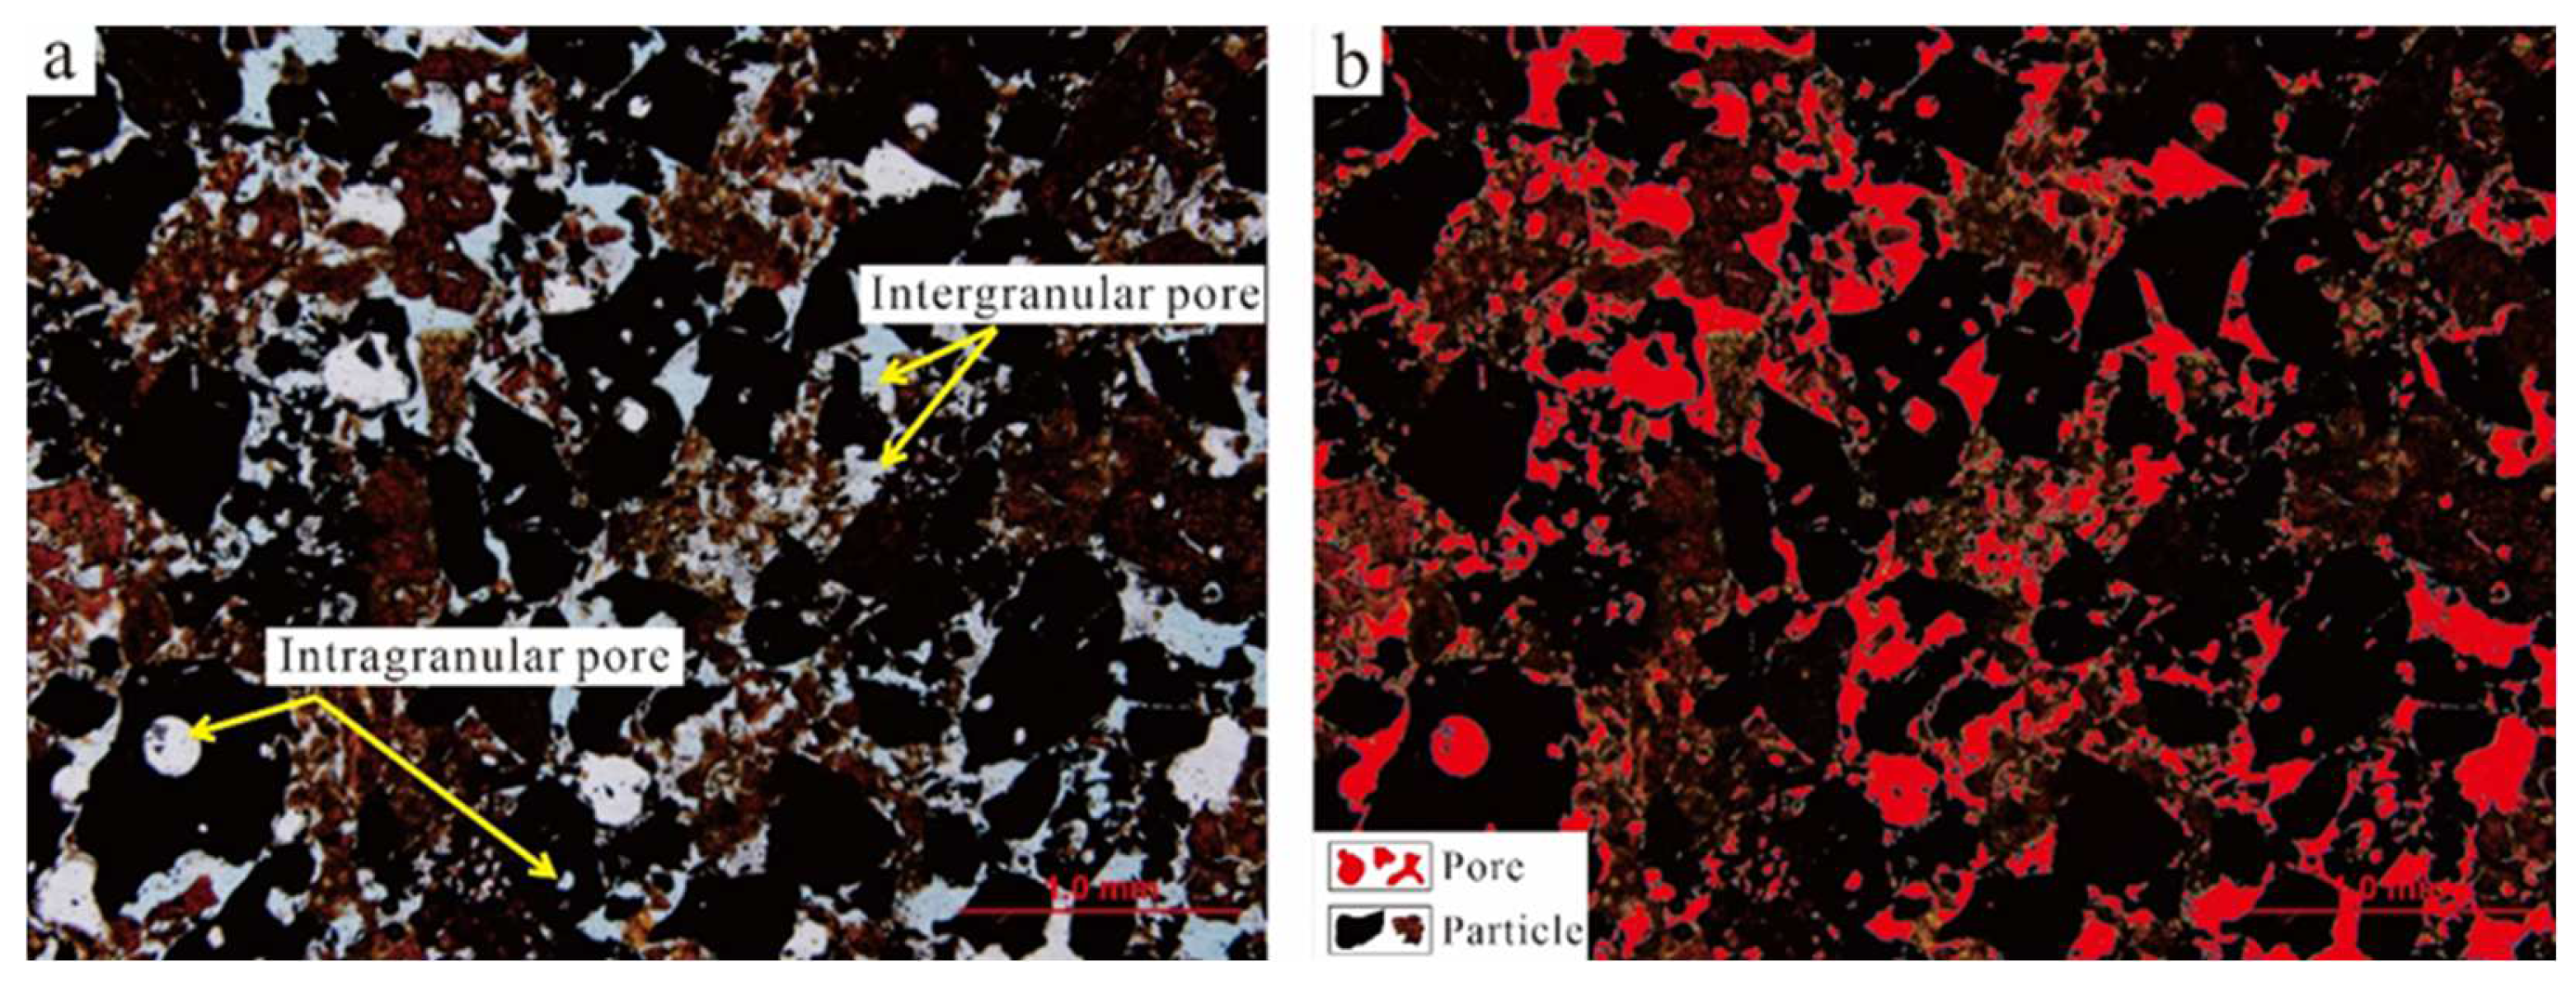
3.2. Image Surface Porosity

After drying the stably compacted sample, a blue epoxy resin colloid was injected into the sample pores under vacuum and high-axial stress (below the target axial stress) conditions. After curing, the PC tube containing the scoria sample was cut, polished, and prepared into the blue casting thin section. The difference in color allowed clear observation of the rock’s pore structure under a polarizing microscope. The CIAS image analysis system was used to conduct the median filtering of the image and then the intensity hue saturation (IHS) segmentation method was used to segment the image. The rock skeleton and pore information at the microscopic scale based on the blue casting thin sections were processed. The gray and white parts in Figure 2 are pores, including intergranular pores and intragranular pores (Figure 2a). The image was digitized into a two-dimensional array (x, y), where x and y are the numbers of horizontal and vertical pixels, respectively. After calibration, the number of red pixel points n in the image was counted. The image surface porosity φ in Figure 2b can be expressed as follows:
φ = n/xy,
where x is the number of pixels on the horizontal side of the image; y is the number of pixels in the longitudinal direction; and n is the number of pixels occupied by pores in the image.

3.3. Particle Size Analysis

The particle size analysis can also be applied to scoria samples by utilizing the imaging process method. In the particle size analysis in this study, first, the image acquisition was completed using an Olympus system (Model: DP71), and a representative view area with good optical characteristics was photographed. Then, the CIAS software (Version 3.4) was used for the optical preprocessing of the image. To better meet the requirements of the particle size analysis, image enhancement, and median filtering were performed on the image, along with associated smoothing, sharpening, and denoising to correct the image. After this processing, the particle boundary and feature extraction could be better obtained. After the pre-processing, threshold segmentation was carried out on the image. In a segmented image, the boundaries between some particles are usually unclear due to the blue epoxy. To better separate some of the adhesion particles into individual particles and to count the particle size information of each particle more accurately in the next step, it was necessary to conduct manual segmentation. The particle size information statistics were measured using the CIAS software (Version 3.4) to obtain the particle area, circumference, diameter, and other parameters. The particle diameter obtained using this method is the equivalent circular diameter of the particle (diameter of the circle with the same area as the particle) in mm. The outline parameters (compactness, solidity, and slenderness) of the sample particles under different axial stresses can be obtained using the JMicroVision software (Version 1.3.4) [33]. In this study, the particles in the blue casting thin sections of the sample without compaction and those in the thin sections of the samples compacted under axial stress of 70 MPa were statistically analyzed using the JMicroVision software (Version 1.3.4). The samples prepared using the cutting ring method after sieve analysis were sparse because they were uncompacted, and a total of 227 particles were counted in three blue casting thin sections. Due to the relatively high axial stress of 70 MPa, the compaction state of each part of the blue casting thin section was similar, and the particles were seriously crushed. There were 1272 particles in one blue casting thin section.
Combined with the observations under the polarizing microscope, the characteristics of the particle crushing were mainly divided into three stages. In the early stage of particle crushing, during the compaction process, local crushing occurred in particles with irregular shapes. In the middle stage, with the continuous increase in the axial stress, the entire particle was squeezed and partial crushing occurred. In the later stage, with the continuous increase in the axial stress, the entire particle was severely squeezed and large-scale crushing occurred (Figure 3). The above characteristics and the decrease in the Φ value were observed during the particle size analysis process, and the crushed particles and uncrushed particles were fully differentiated by the statistics. The relevant parameters are presented in Table 1.

4. Results

By using the above methods, the relevant values of each sample under different axial stresses were obtained through data statistical recording and calculation, and the experimental results were analyzed to explore the variations in the parameters during the experimental compaction process of the pyroclastic rock.

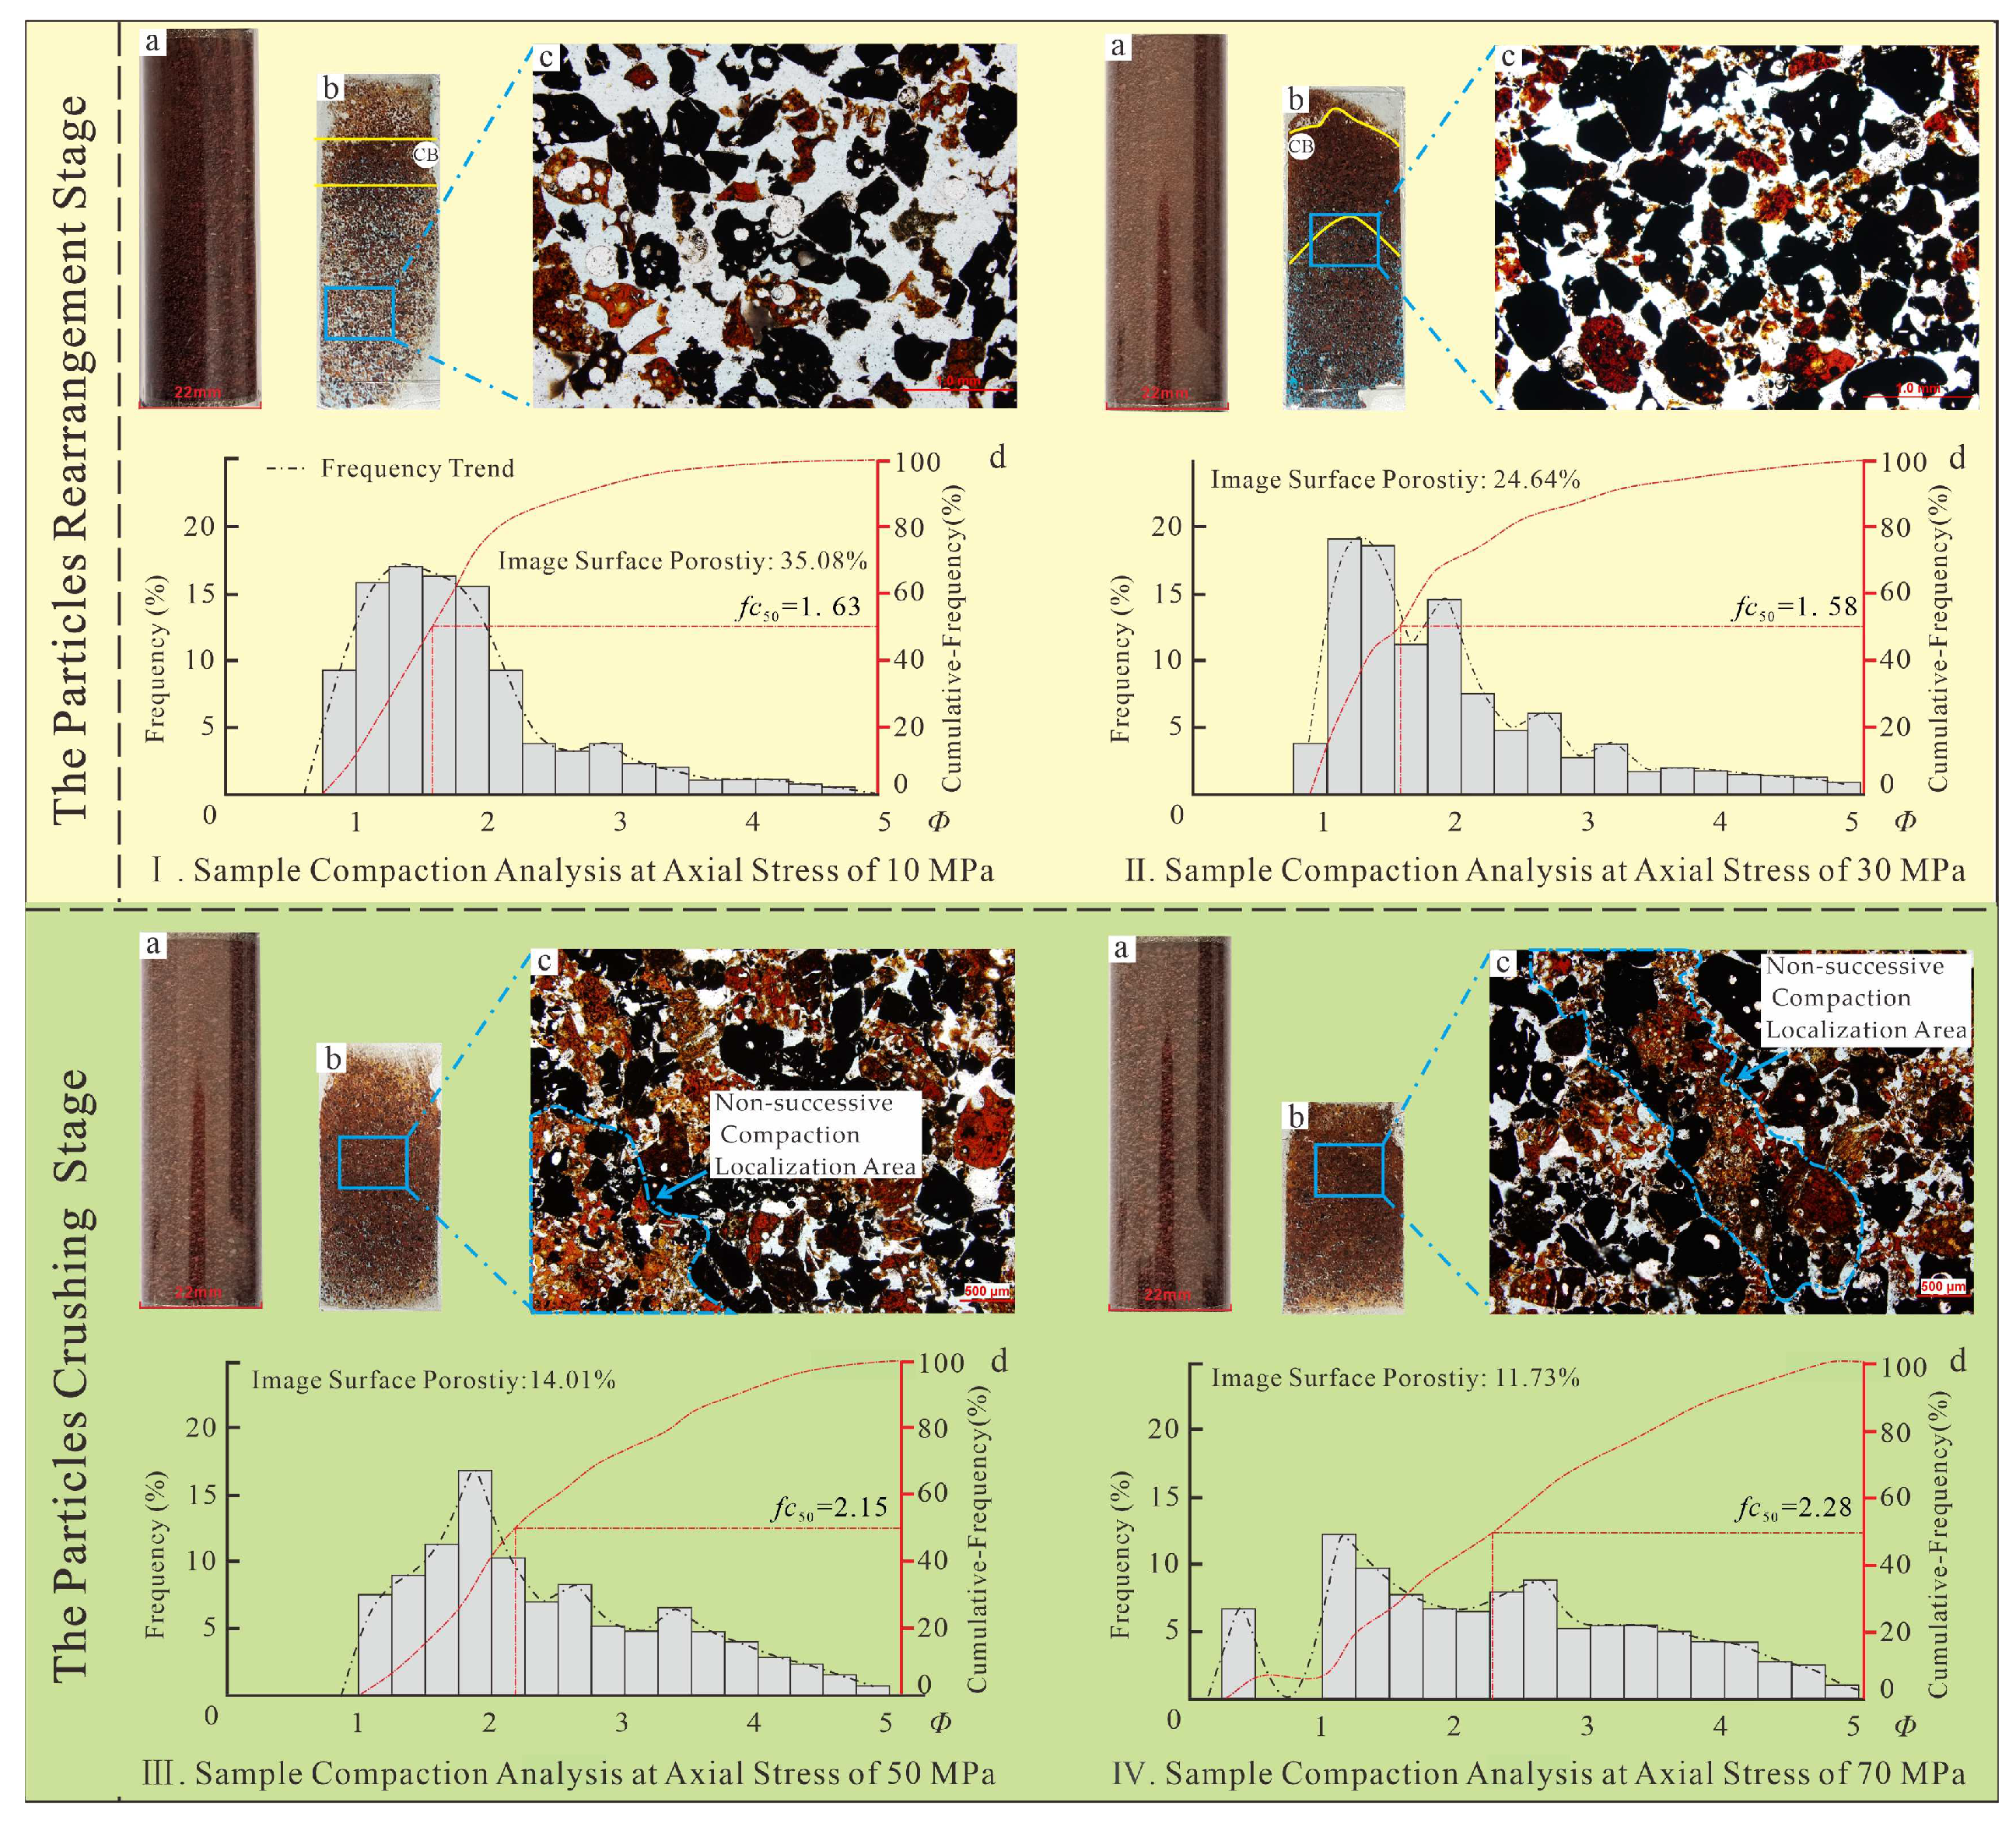
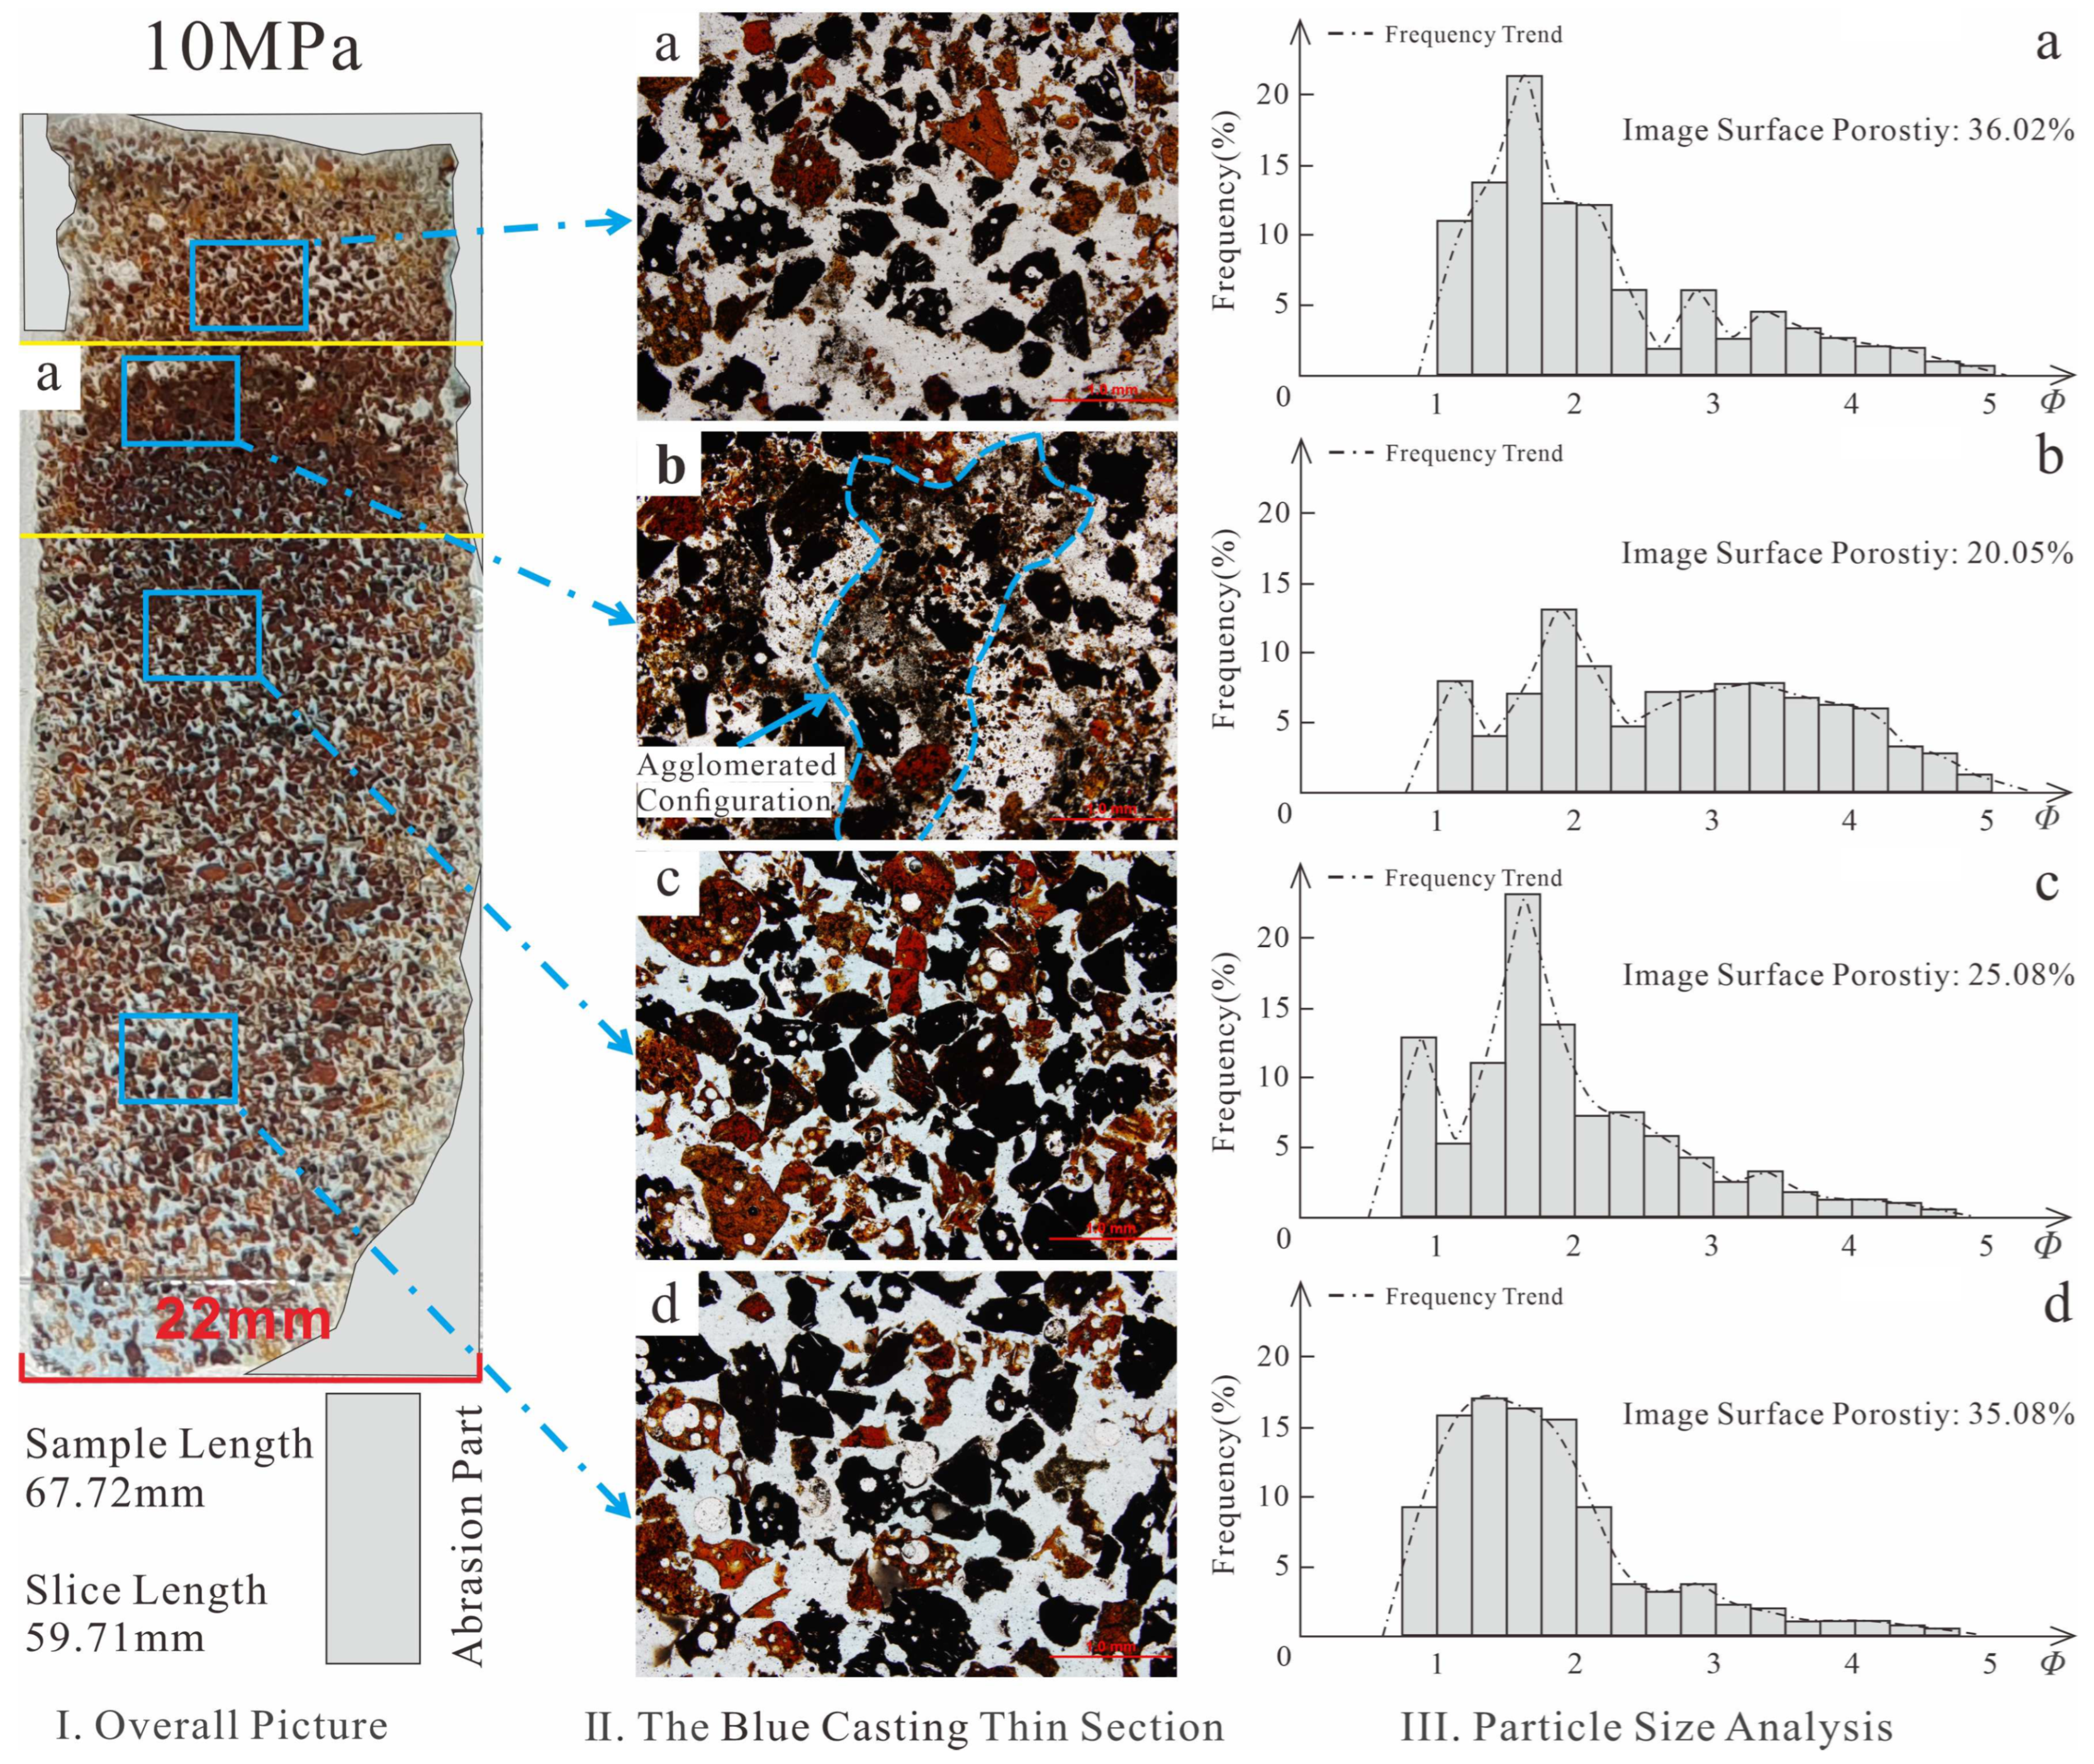
4.1. Effective Porosity and Image Surface Porosity

In the experimental mechanical compaction process, to visually characterize the relationship between the effective porosity and burial depth, axial stress was applied to the sample to simulate the axial stress imposed by the overlying strata at the corresponding depth, and the overlying axial stress value was approximately converted to the corresponding burial depth. In addition, the formation density was not uniform. Therefore, in the data processing, since most of the samples were scoria, the particle size of the sample preparation was selected to be small. The average stratigraphic rock density was set as 2.6 g/cm3, the geostatic pressure of a stratum with a thickness of 1 m was equal to approximately 0.0257 MPa [34], and the corresponding simulated depth was calculated (Table 2).
In the process of strata burial, the porosity of the strata generally decreases with increasing burial depth. For sandstone and mudstone, the porosity decreases with increasing depth. Within 500 m, the porosity decreases sharply, and the rate of change is very small when the depth reaches approximately 3000 m [35]. In this study, the experimental mechanical compaction process of the pyroclastic rock was different from that reflected by sandstone and mudstone. As the axial stress gradually increased, the effective porosity after compaction did not exhibit a decreasing trend but rather a normal distribution trend that initially increased and then decreased. However, with increasing axial stress during the compaction experiment, the image surface porosity after the compaction decreased from 35.08% at 10 MPa to 11.73% at 70 MPa (Table 2).

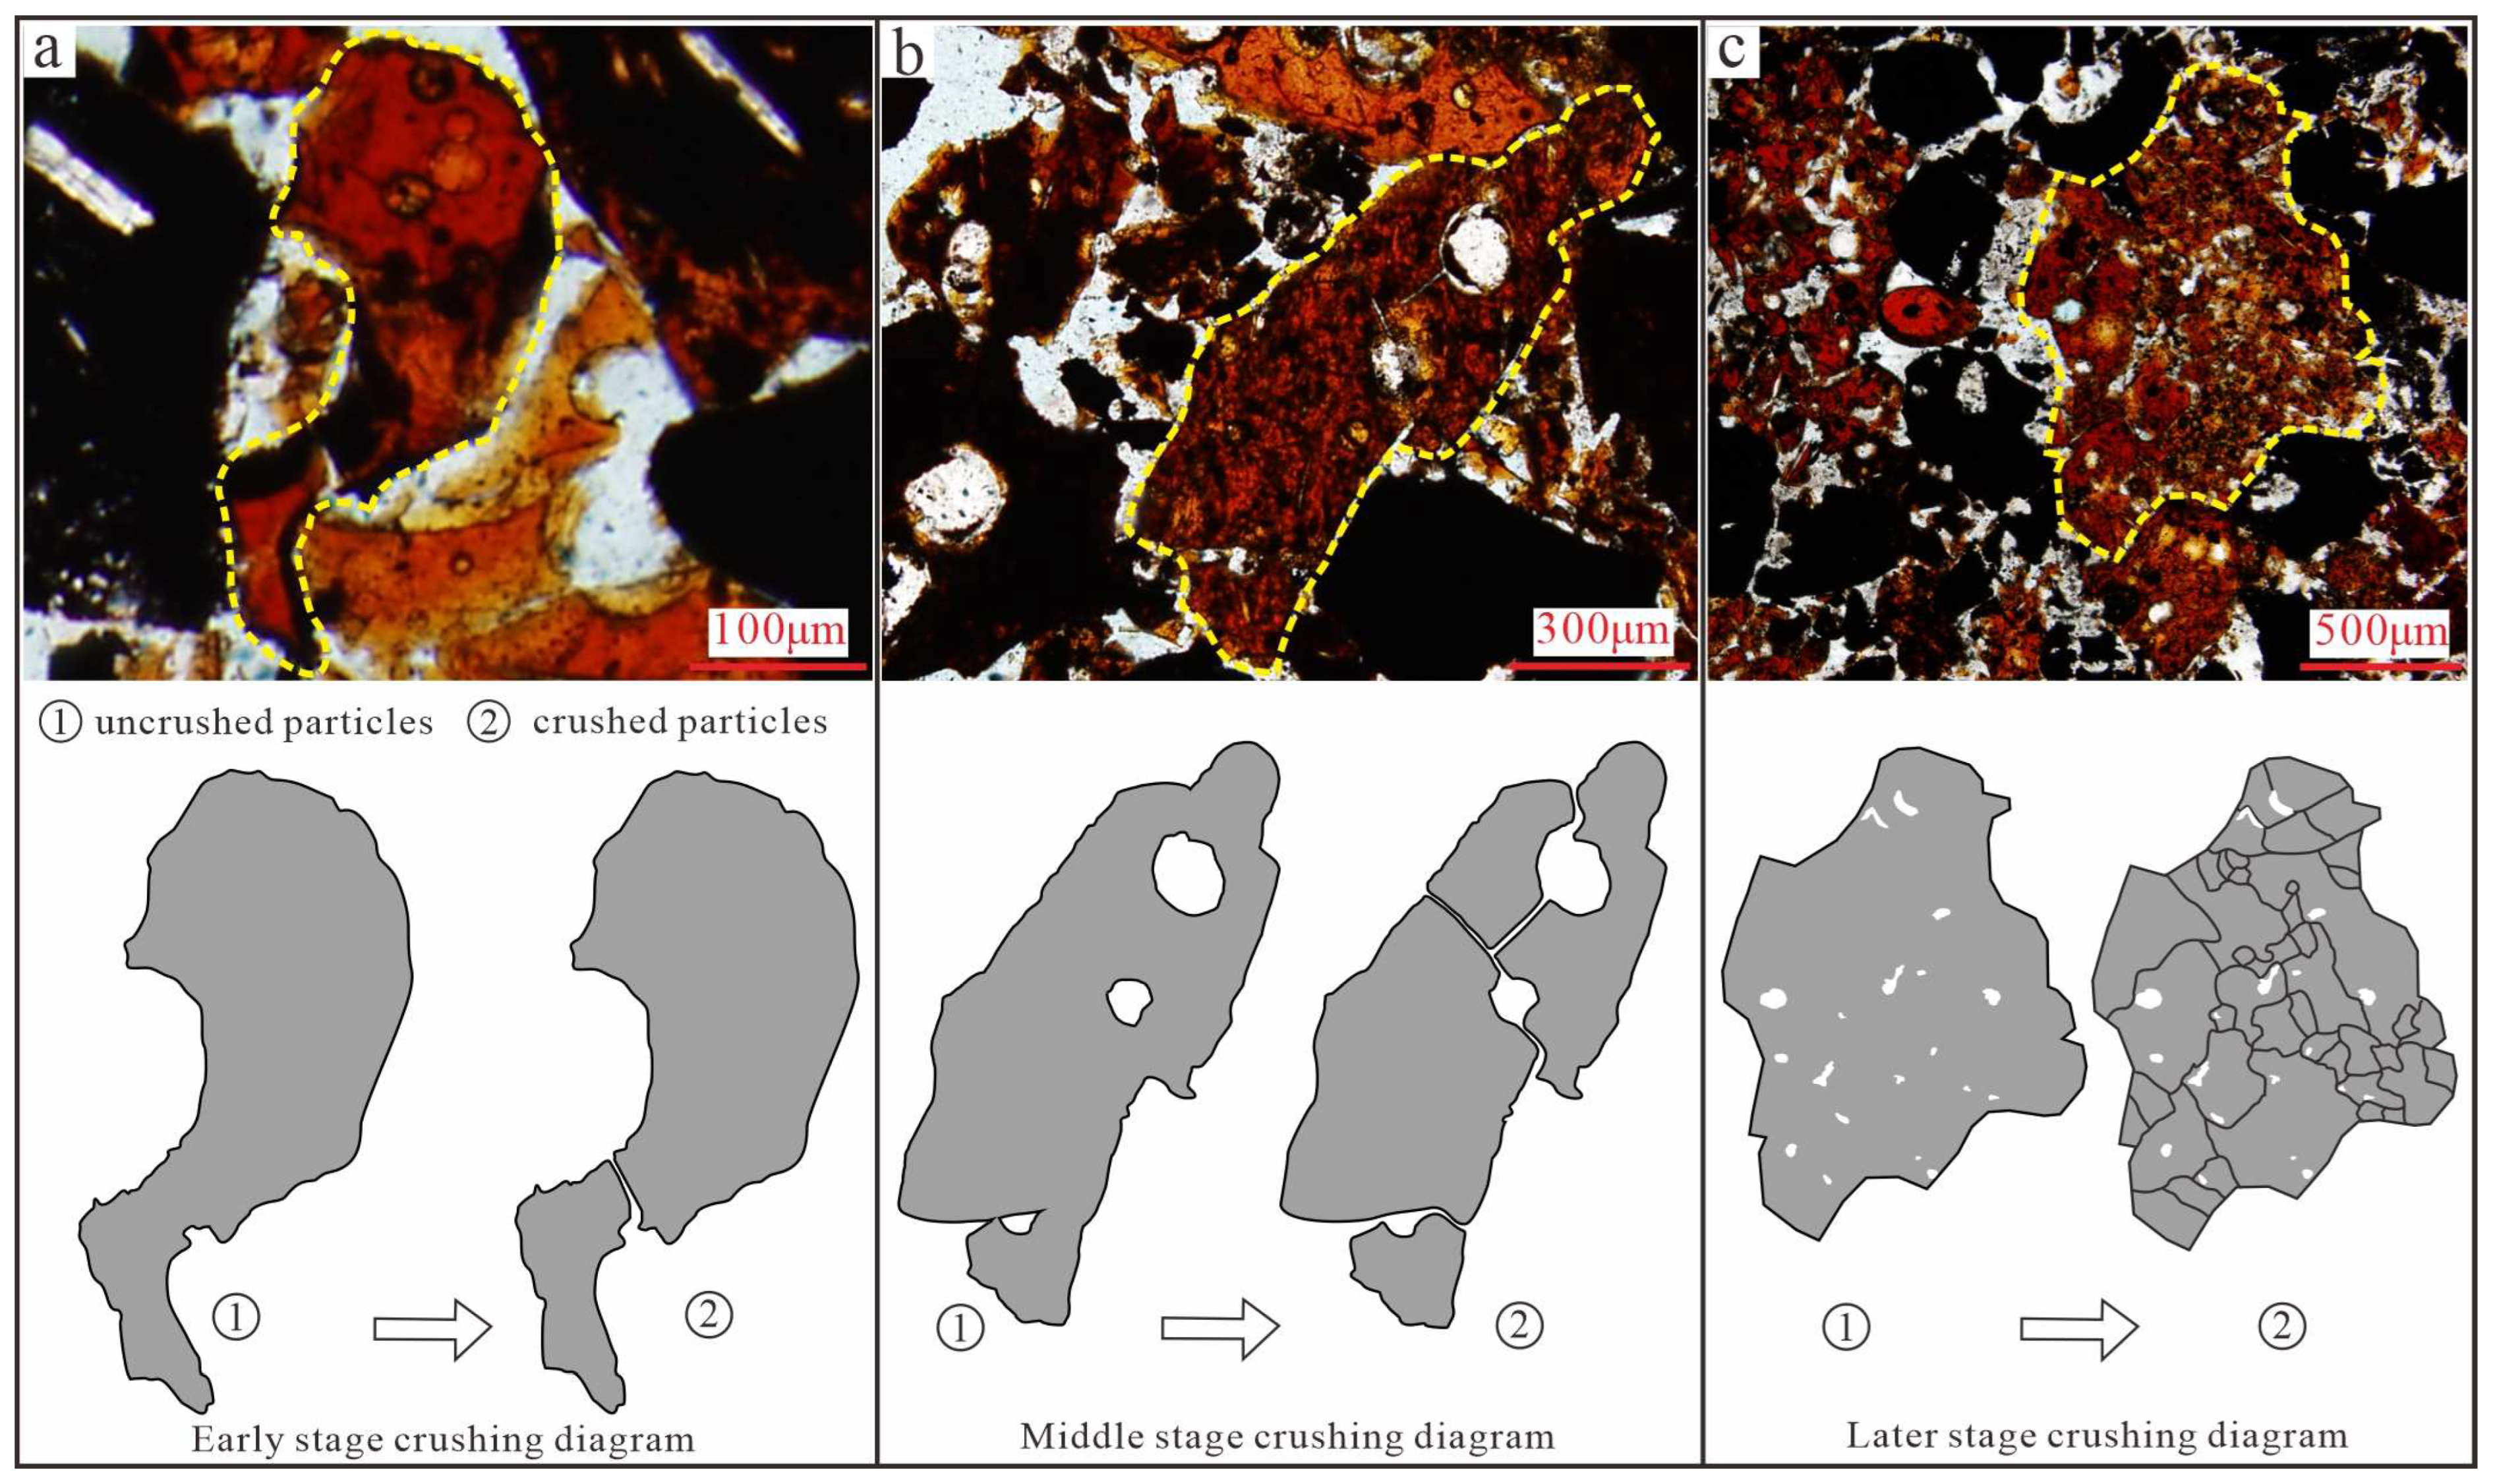
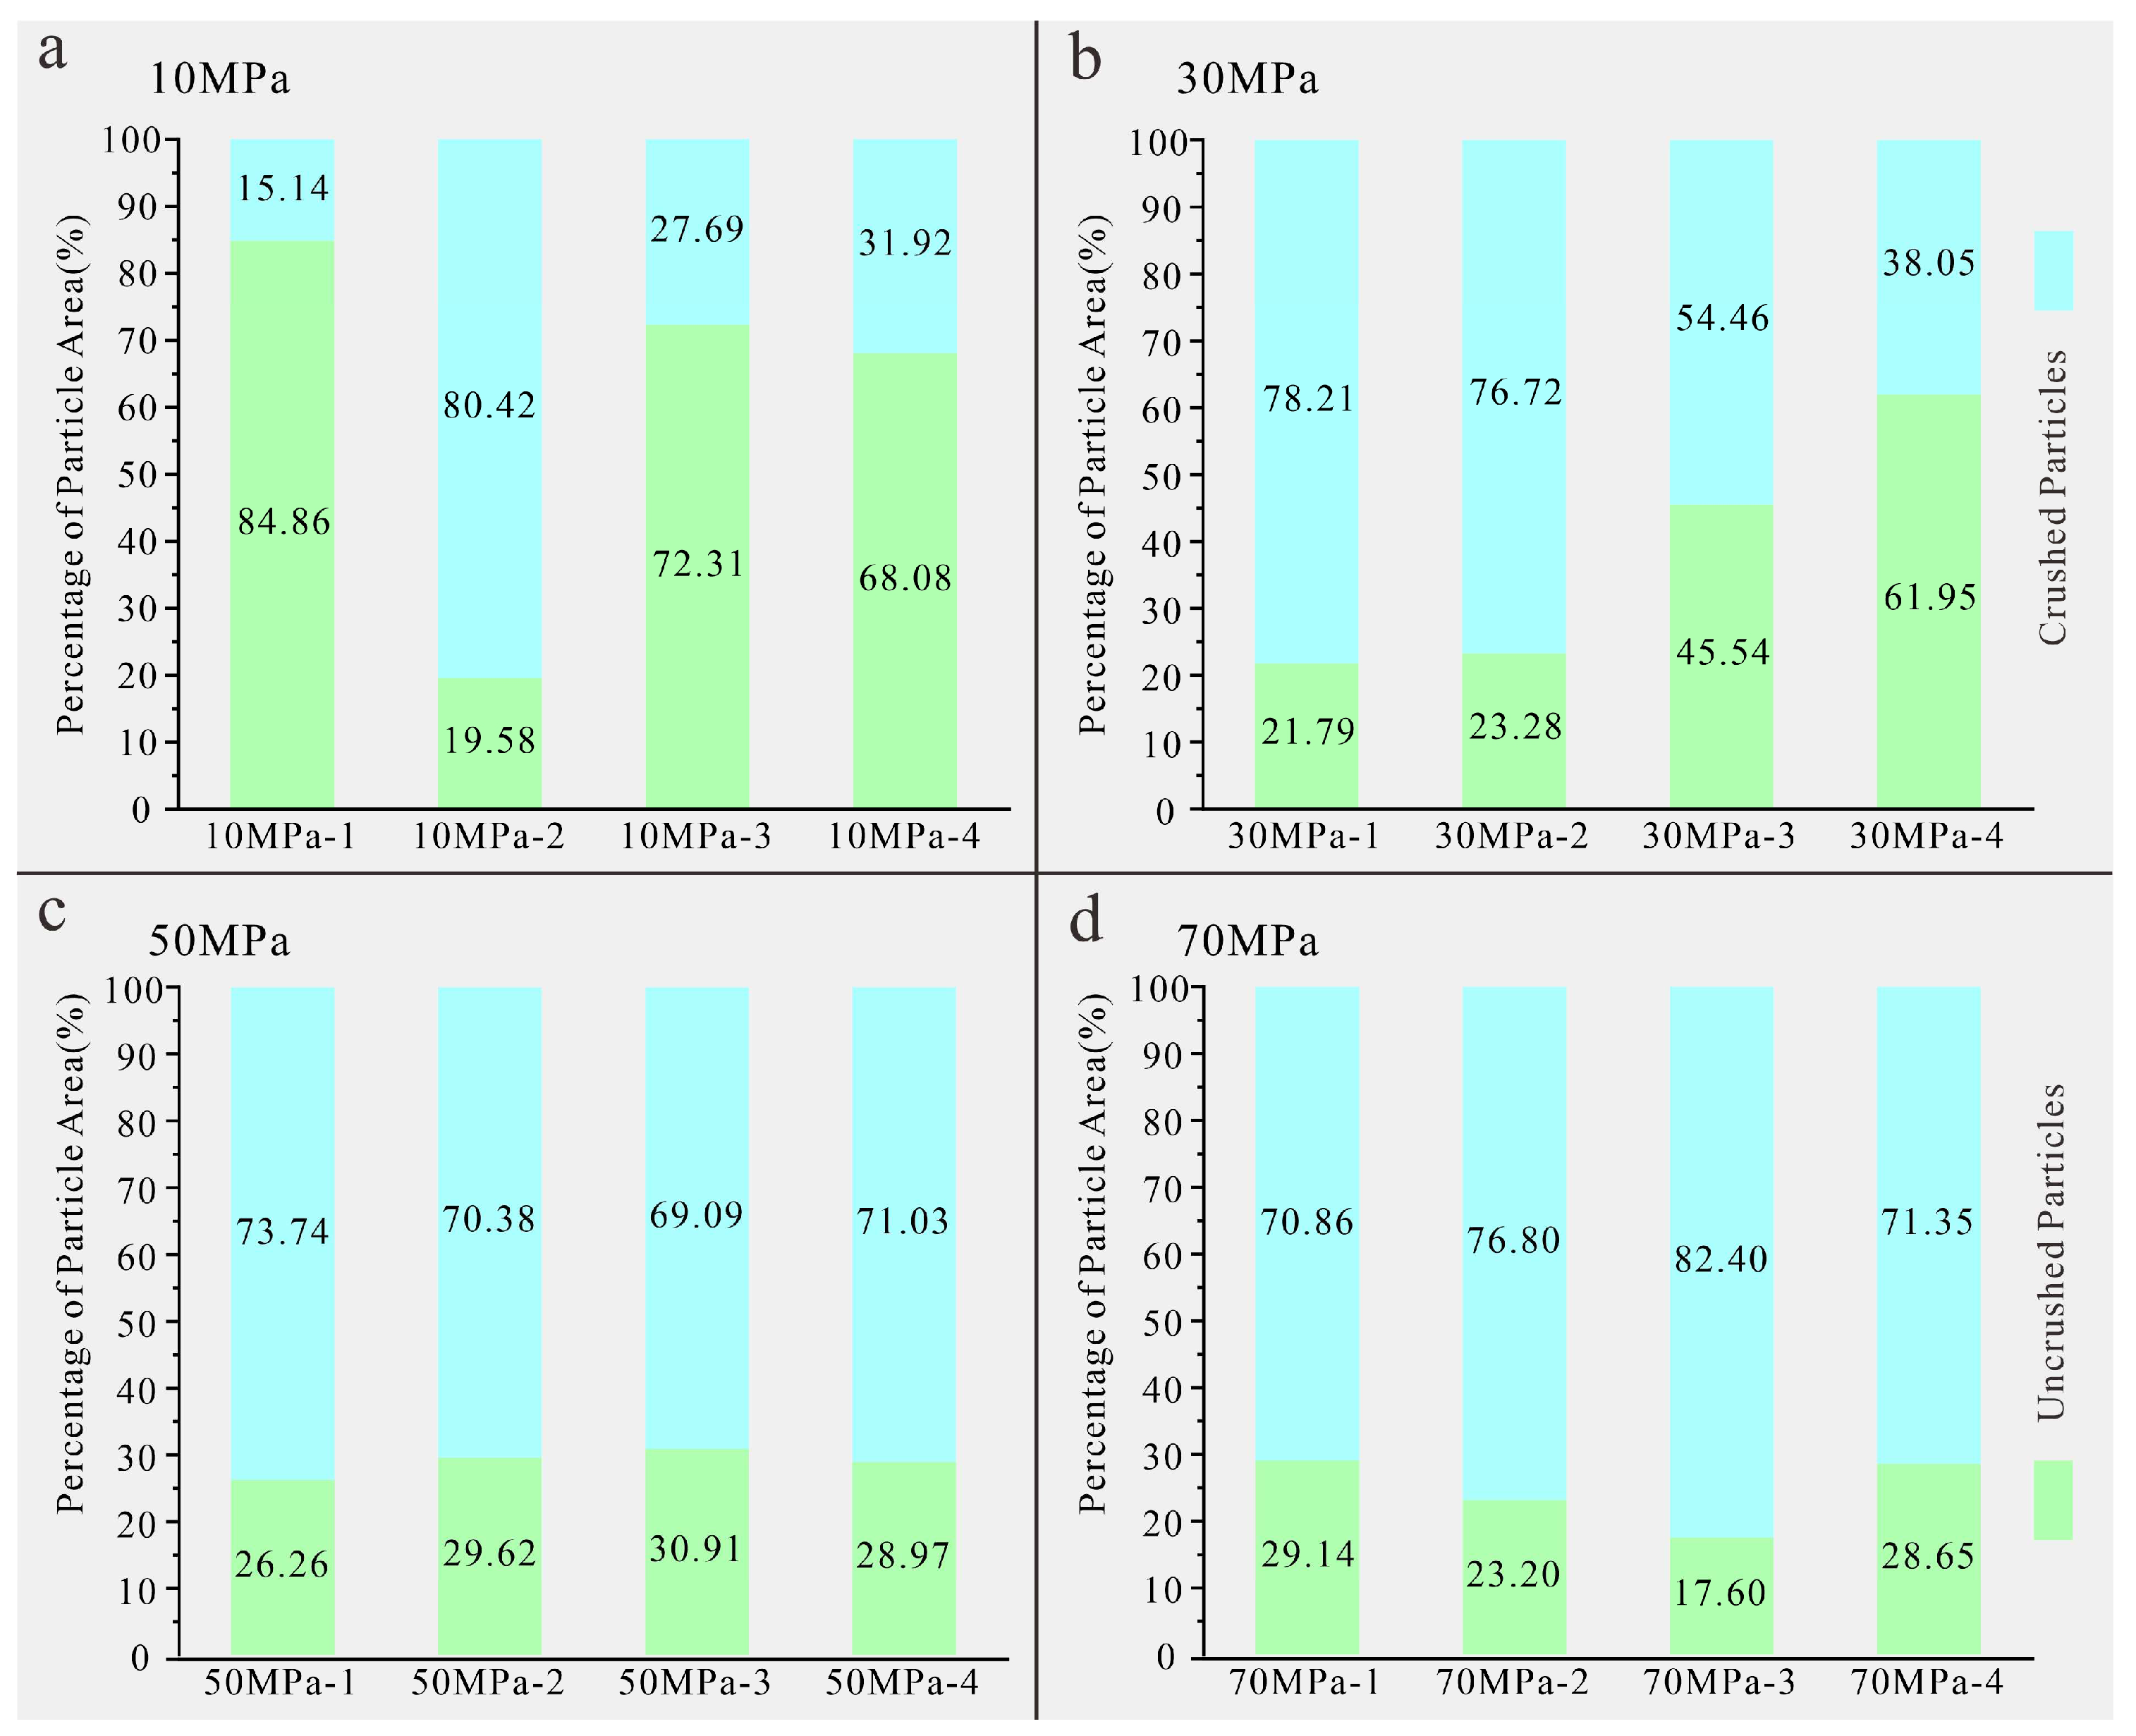
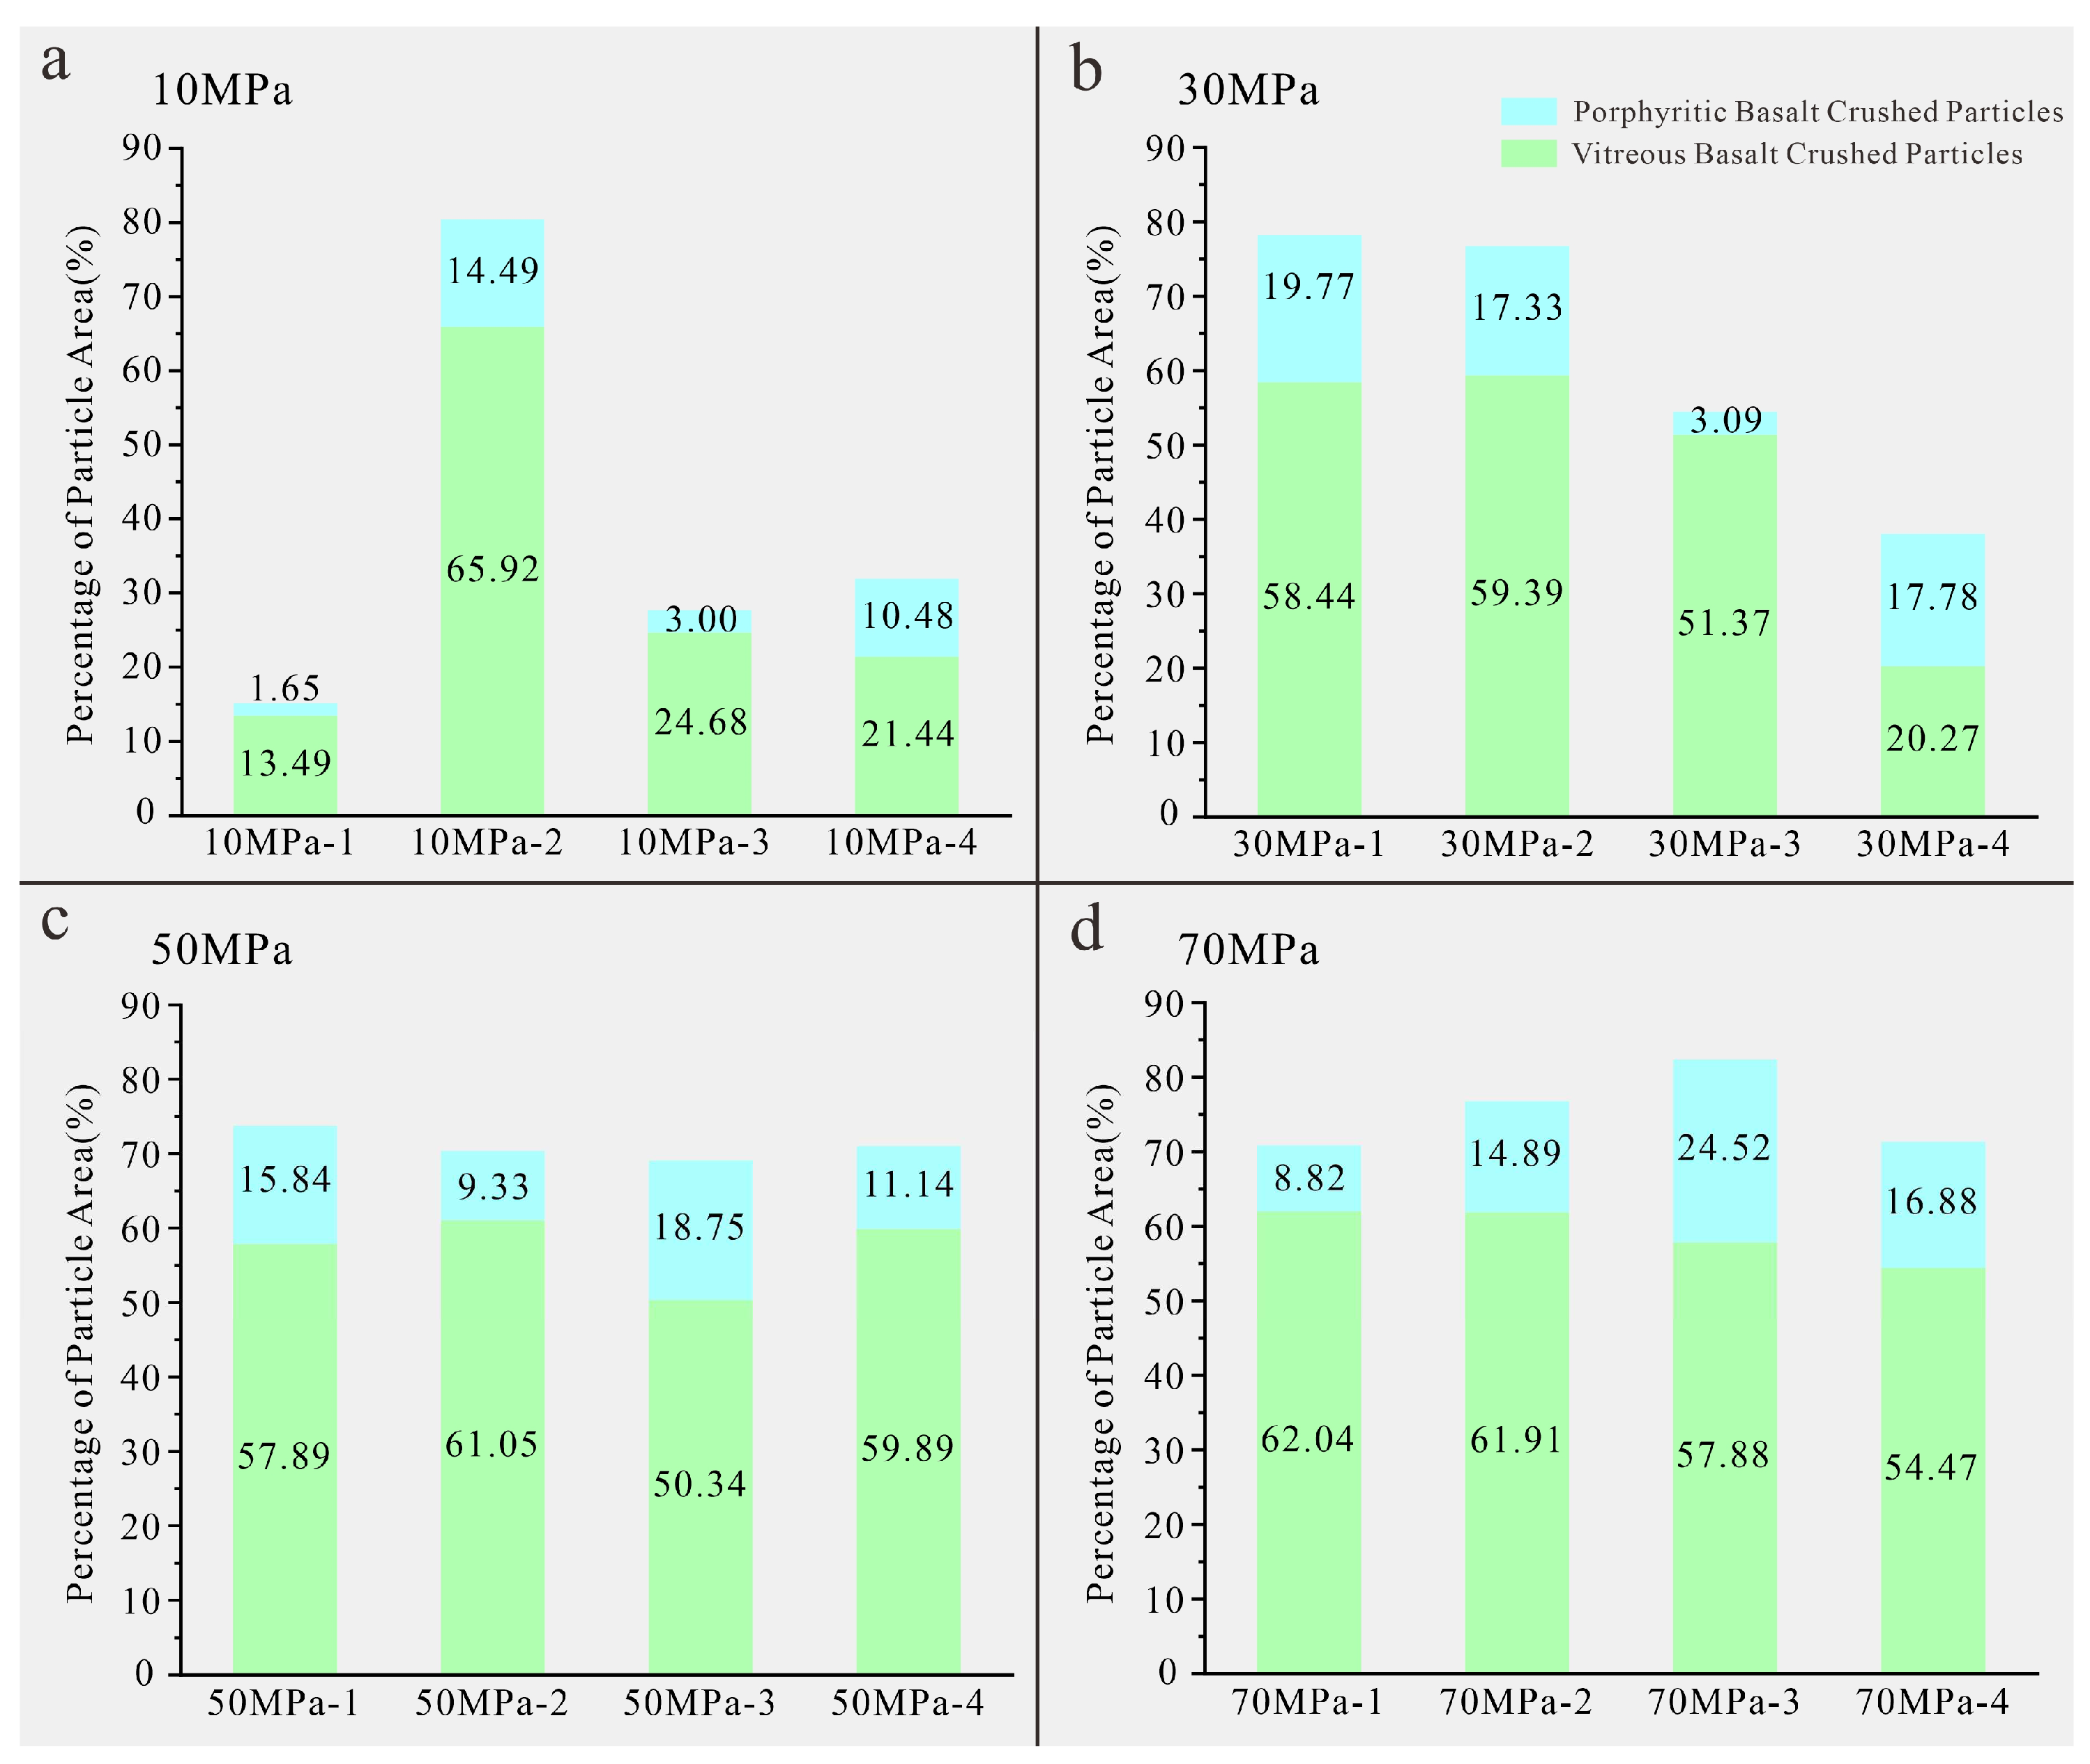
4.2. Characteristics of Particle Crushing

According to the observations and particle size analysis of the blue casting thin sections, the entire compaction process was segmented, dividing it into two stages within the range of 10–30 MPa: the frequency of 10 MPa sample particles with Φ values of 0–2 (particle size of 0.25–1 mm) is 73.06%, and the frequency of 30 MPa is 62.89%. Both of which were close to each other, and the value was larger (Figure 4). The crushed particle area accounted for less than 55% (Figure 5), except for the blue casting thin sections (10 MPa−2, 30 MPa−1, and 30 MPa−2) in the compaction band. The intergranular pores of the particles in the field of view were greatly reduced, most of the particles were intact, most of the particles in the blue casting thin section were in contact with each other and remained uncrushed, and the particle contact relationship was usually point contact but occasionally line contact. The above-mentioned stage is called the particle rearrangement stage; In the range of 50–70 MPa, the frequency of sample particles with Φ values of 0–2 decreased significantly compared to those in the previous range. The frequency in the 50 MPa was 43.96%, and in the 70 MPa was 42.54% (Figure 4). The proportion of the crushed particle area for both was greater than 55% (Figure 5). The contact relationship was mainly concave-convex contact and suture contact but was occasionally point contact. This is called the particle crushing stage. In the initial stage of compaction, the pyroclastic particles that had started to be deposited exhibited a process of position adjustment. The scoria particles aggregated with each other, slipped, moved, and twisted to achieve rearrangement, and some of the structures also changed to reach a state of compact accumulation with the lowest potential energy. The steep change during this process was reflected in the substantial decline in the image surface porosity. After the detrital particles reached a stable accumulation state, as the axial stress continued to increase, the tightness of the accumulation between the particles increased further. Additionally, the continuous crushing of intragranular particles occurred, the image surface porosity continued to decrease, and the particle crushing became increasingly intense.
With increasing axial stress, the particle crushing became more uniform and obvious. Pyroclastic particles of Hongtu Hill are mainly crushed after 30 MPa. Under an axial stress of 10 MPa, the frequency of the crushed particles with Φ values of 2–5 (particle size of 0.03125–0.25 mm) after compaction was 26.95%, and this frequency increased with increasing axial stress. When the axial stress reached 70 MPa, the frequency increased to 57.45%. With increasing axial stress, the proportion of the small particles gradually increased. The degree of particle crushing became more noteworthy (Figure 4-I-d, II-d, III-d and IV-d).
According to the analysis of the comparison of particle crushing areas of different pyroclastic materials under different axial stresses, It was observed that in the crushed particles, the vitreous basalt particles dominated under different stresses. The ratio of area for the crushed vitreous basalt particles ranged from 2 to 7 times that of the porphyritic basalt particles (Figure 6).

4.3. Localized Compaction Deformation

The compaction localization areas, which are characterized by banding and a relatively homogeneous distribution, found in field outcrops and thin sections are also called compaction bands (CBs) [36,37]. In the compaction process, localized compaction deformation has been well documented, such as that of porous sandstone [36,38,39,40,41], high-porosity carbonate [42], basalt [43], and limestone [44,45,46]. Deformation has also been observed in Late Miocene outcrops of volcanoclastic rocks in coastal Taiwan [46]. The reason for the occurrence of a compaction band is mainly related to the mineral composition and particle size, and uniform mineral composition and size make it easier to form a compaction band. In addition, the localized compaction deformation feature has nothing to do with the test equipment, end friction, strain rate, and saturation state, so it should be an intrinsic property of porous rocks [47].
During this experimental compaction, localized compaction deformation was observed in the blue casting thin sections. Four parts of the blue casting thin section compressed at 10 MPa were identified under the microscope. Through observations and particle size analysis, it was found that the sample compacted under an axial stress of 10 MPa exhibited obvious localized compaction deformation (CBs), with non-uniform bands with a thickness of approximately 4.20 mm and an image surface porosity of 20.05%, which are lower than those in the other parts (Figure 7-III). The finding is consistent with previous research, for instance, during the experimental compaction process of andesitic rocks from Volcán de Colima, Mexico, the porosity within the CBs is approximately 10%, while the porosity outside the CBs is about 17% [48,49]. Similarly, in the Bentheim sandstone, the porosity within the CBs is approximately 8%, significantly lower than the initial porosity of 23% [39].
The frequency of the crushed particles with Φ values of 3–5 (particle size of 0.03125–0.125 mm) was 40.84%, which was the highest value among the four blue casting thin sections (Figure 7-III-b). Particle crushing was more common in the compaction band (Figure 7-I-a), which showed that the particles were tightly arranged in an agglomerated configuration. The particles below the compaction band were rearranged, and only a small proportion of the particles were crushed (Figure 7-II-a,c,d). No obvious compaction band was observed in the blue casting sections of the samples compressed under 50 MPa and 70 MPa. In addition to the compaction band (Figure 4-II-b) in the samples under an axial stress of 30 MPa, under axial stresses of 50 MPa and 70 MPa, localized compaction deformation was also observed in the blue casting thin sections in the form of non-successive compaction localization areas (Figure 4-III-b,c and IV-b,c). These areas of non-successive compaction localization were usually found in the vitreous basalt grains and were surrounded by porphyritic basalt particles. The particles in these areas were very severely crushed and often clumped.

5. Discussion

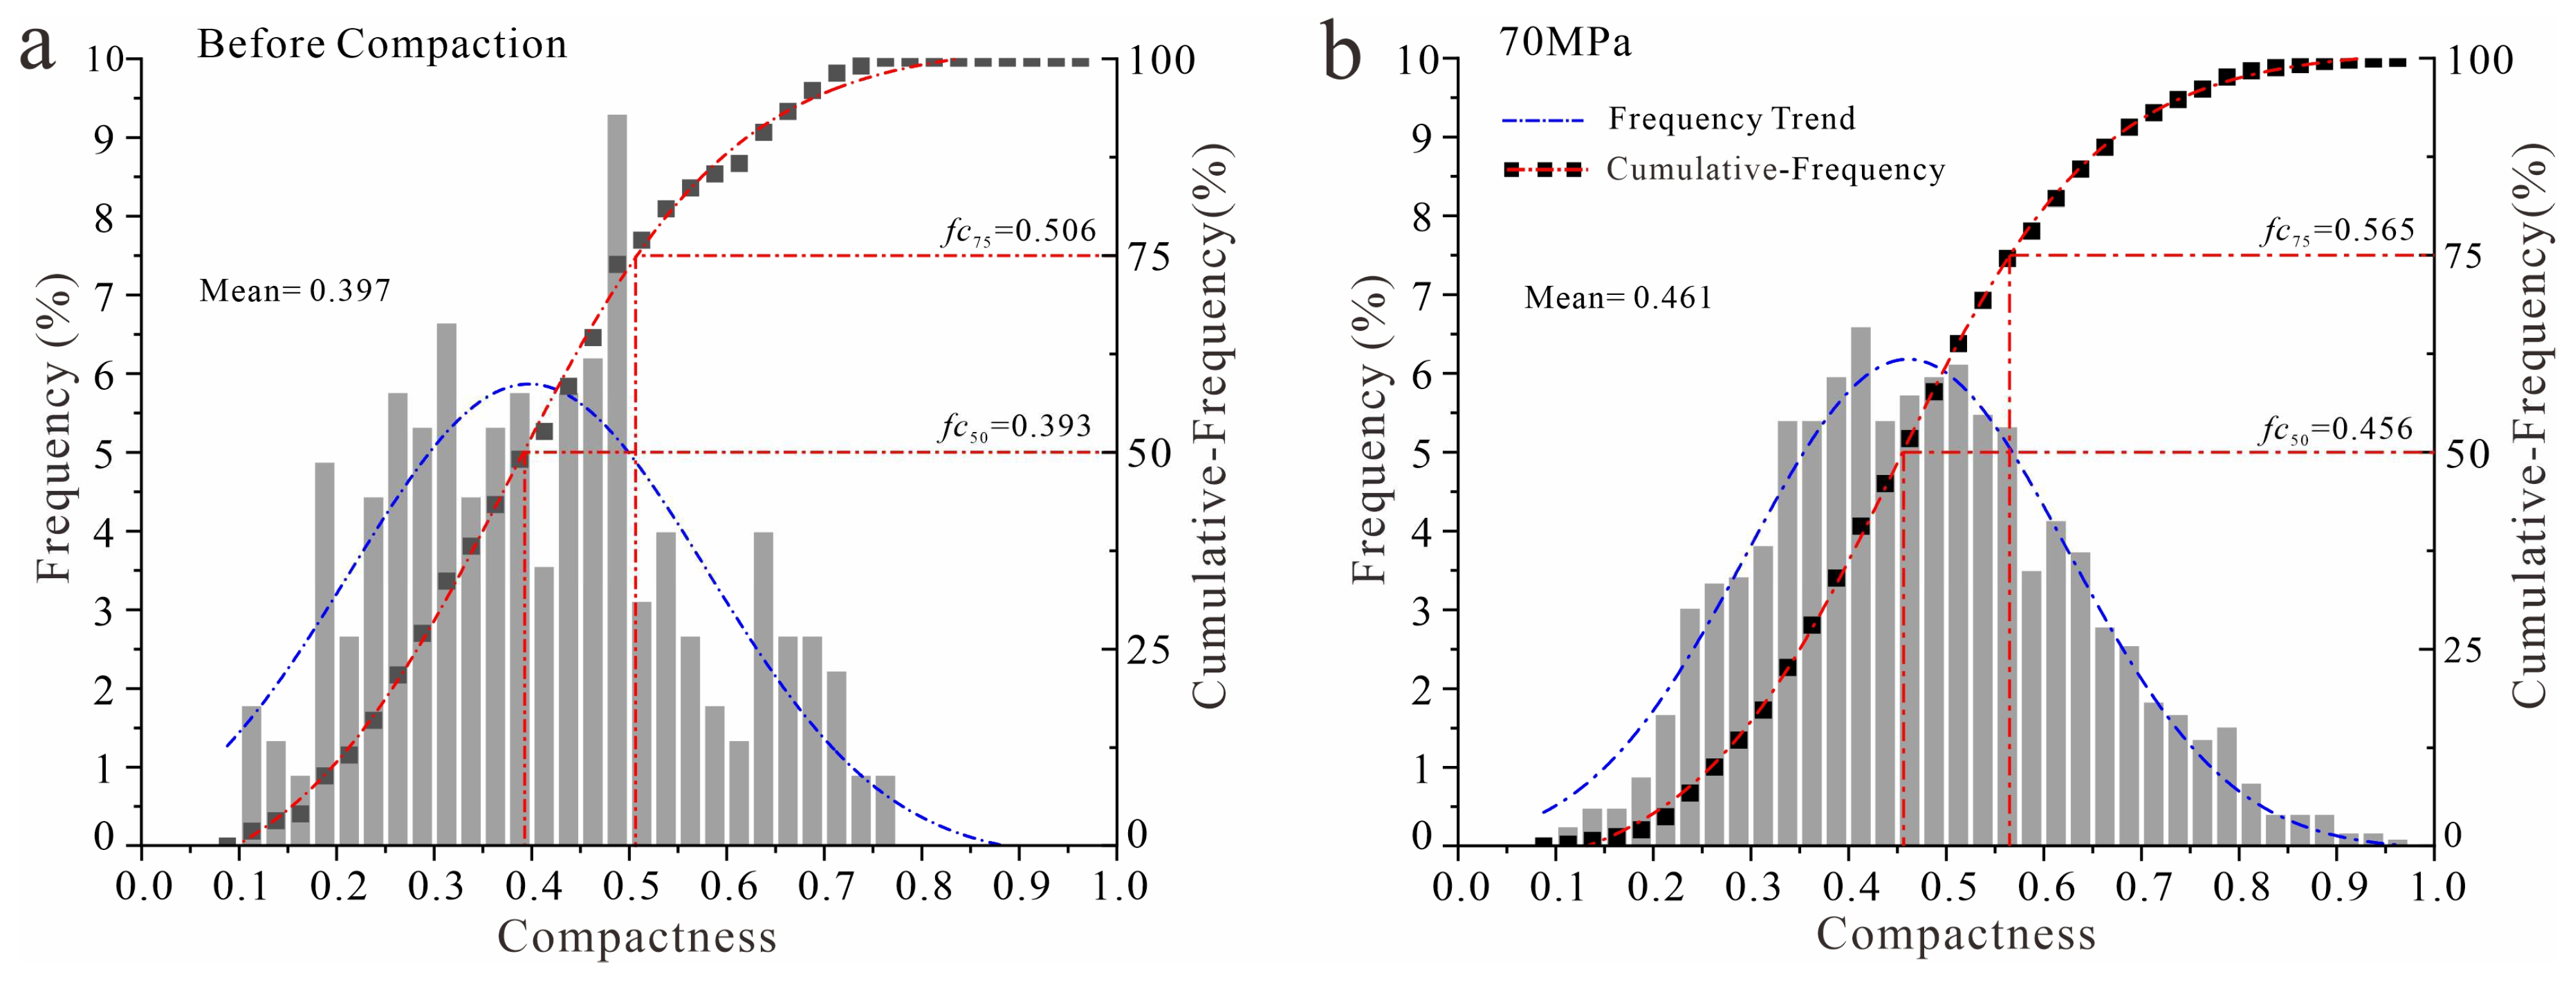
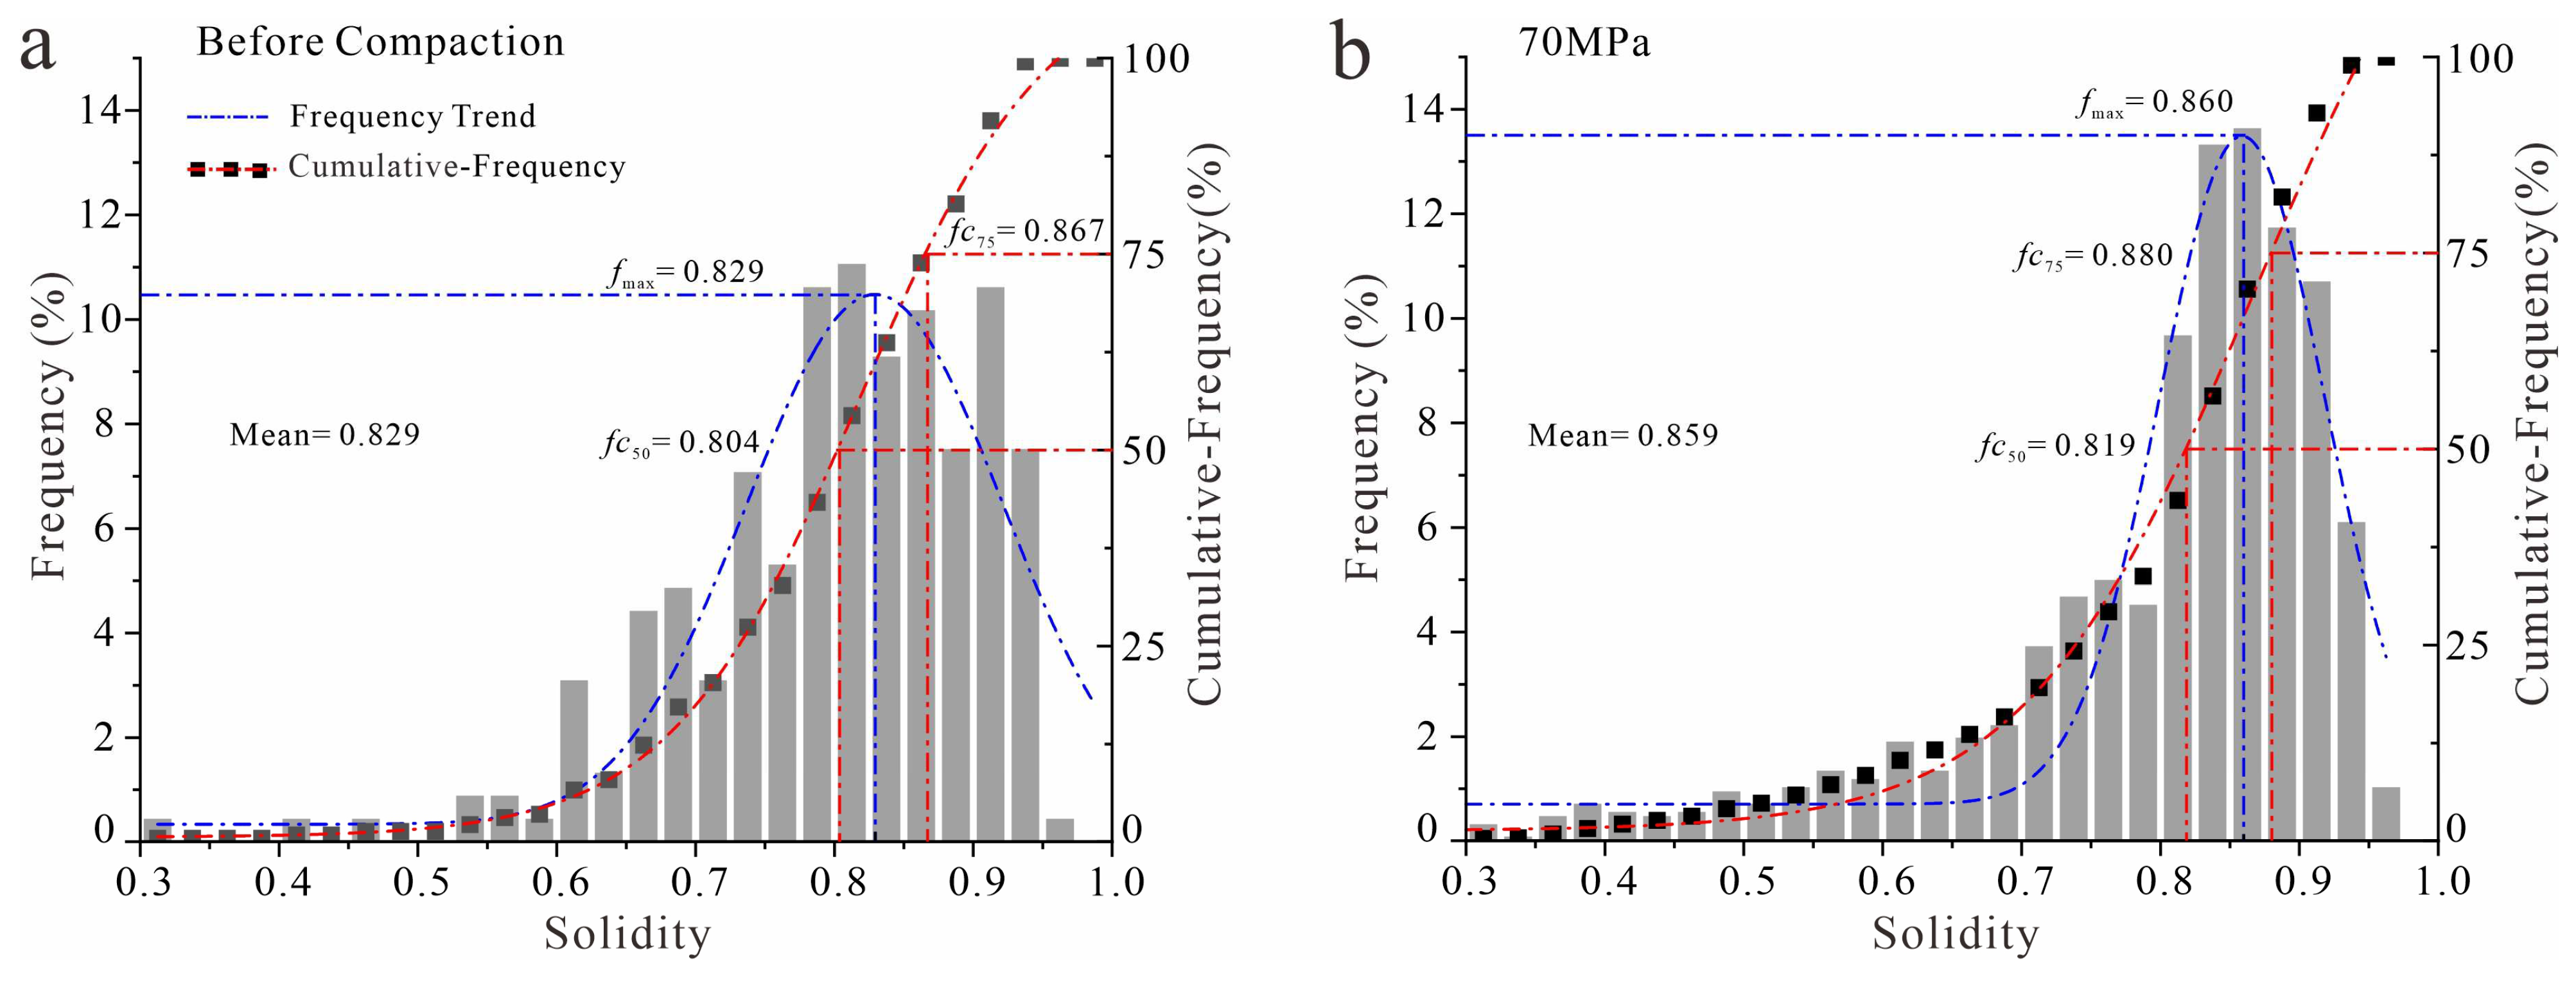
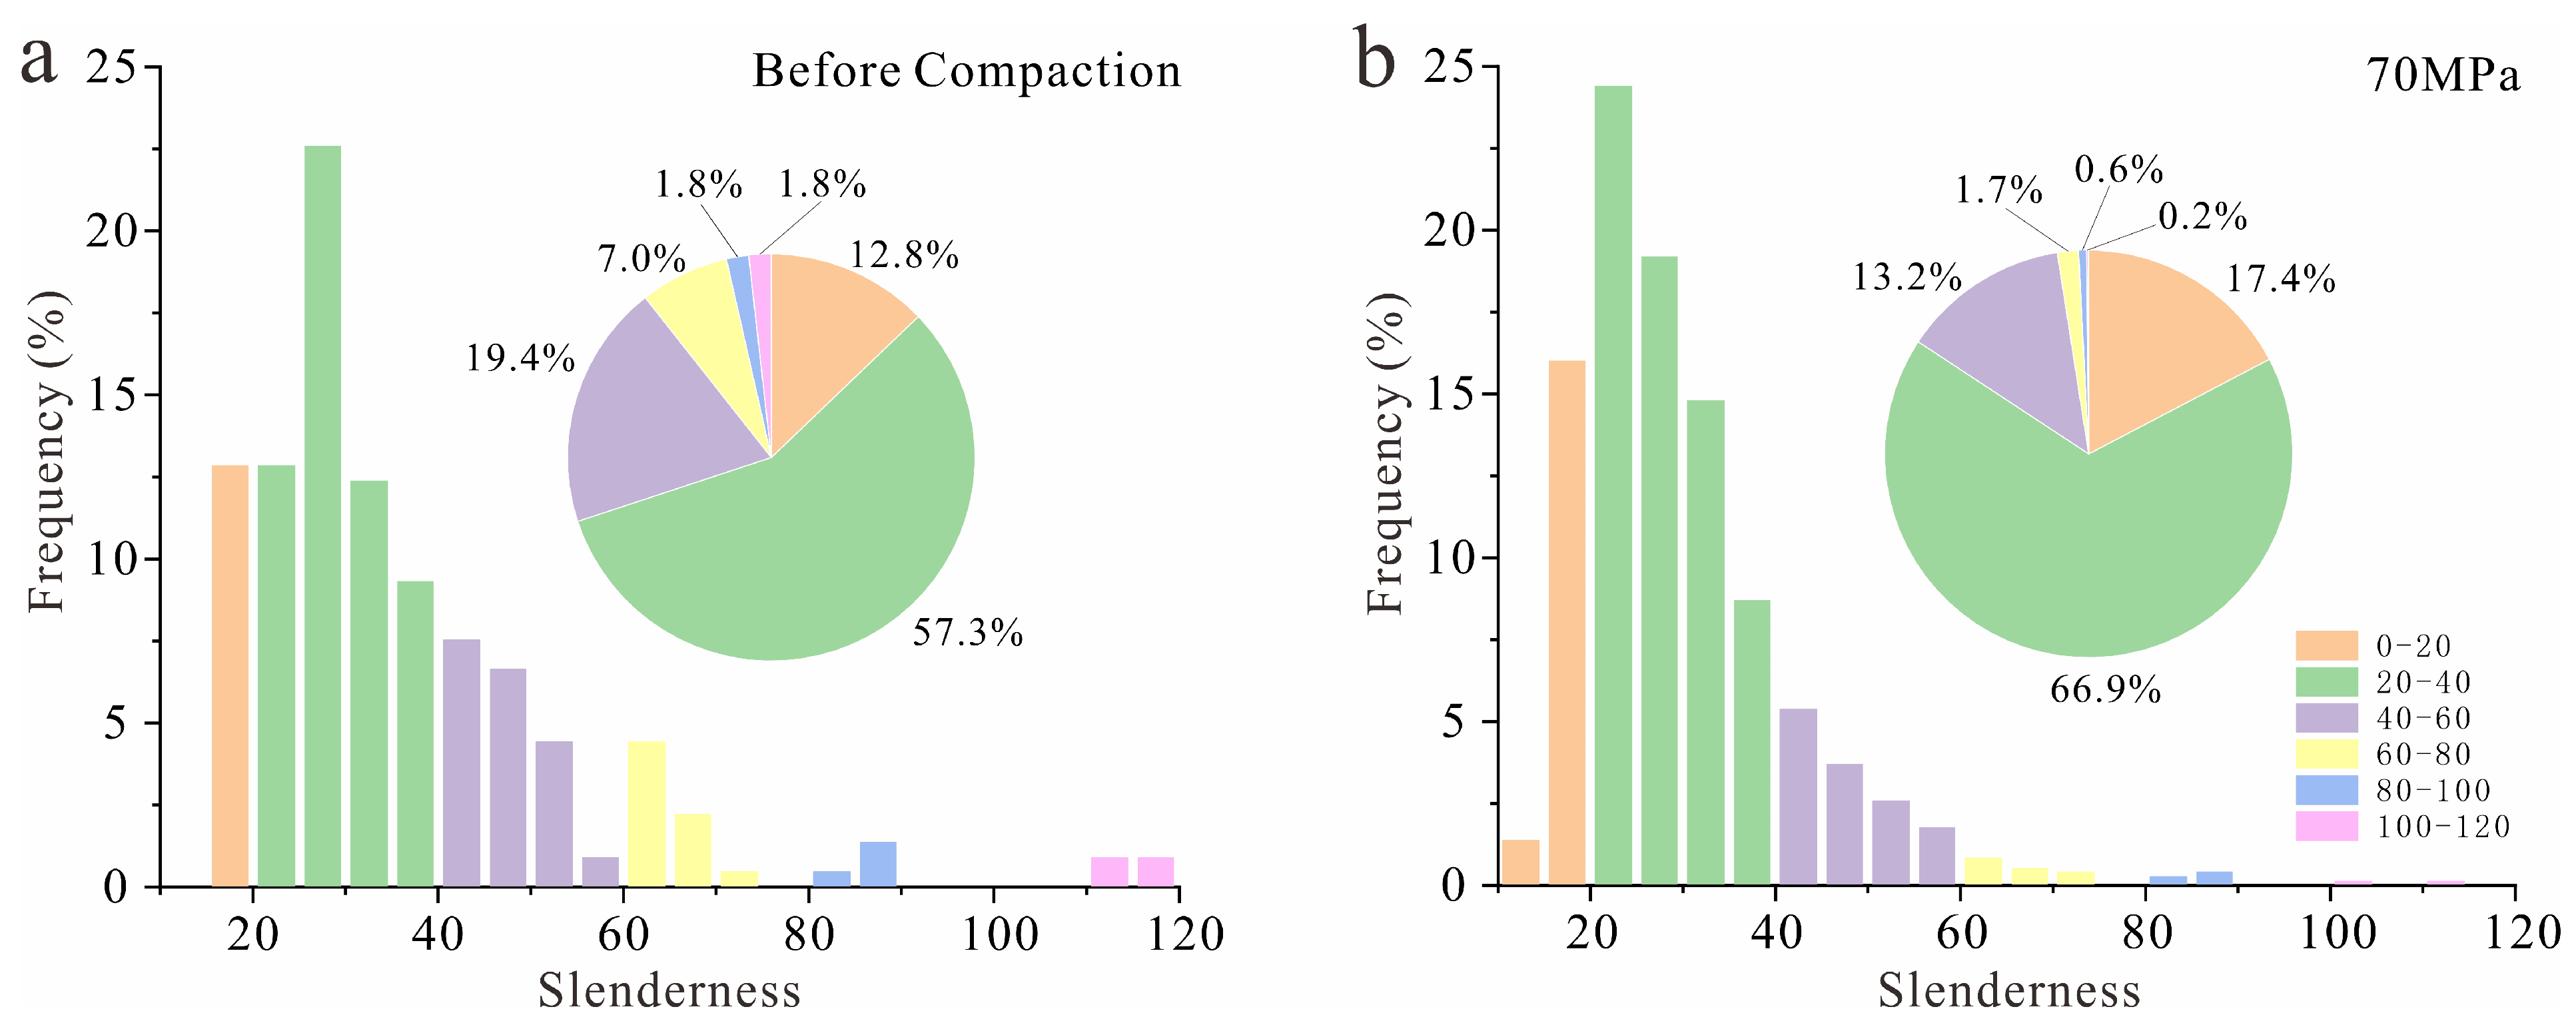
5.1. Relationships between Compactness, Solidity, and Slenderness and Particle Crushing

The particle shape largely determines the particle accumulation state and the arrangement of and contacts between the particles, and it is also an important factor affecting the physical and mechanical properties of the particles. Cho et al. studied the particle shape of natural sand and artificially crushed sand and concluded that the particle shape had a significant influence on the mechanical properties of the particles [50]. Liu et al. observed that there was a good correlation between the sand particle shape and mechanical parameters [51]. Indeed, during the compaction process, the scoria particles are subject to varying degrees of crushing, leading to changes in particle shape. In this study, we chose three parameters (Compactness, Solidity, and Slenderness, definitions are given in Table 1) of the particle shape. We used changes in parameters to illustrate the response of particle shape to stress during the compaction experiment process. We can determine which type of particles of the shape parameter experienced particle crushing. We can further assess the influence of the particle shape on the particle crushing by comparing the parameters of the particle shape before compaction (uncompacted) with those under the maximum axial stress applied.
Among the particle shape parameters, the larger the compactness value was, the better the degree of particle rounding was (Table 1). By comparing the evolution of the compactness of the particles, the mean value of the overall parameter before compaction was determined to be 0.397, the compactness value of the parameter with a cumulative frequency of 50 was determined to be 0.393, and the compactness value of the parameter with a cumulative-frequency of 75 was determined to be 0.506. With increasing axial stress, the particle crushing degree increased, and the mean value of the parameter at 70 MPa was 0.461. The compactness value of the parameter with a cumulative frequency of 50 was 0.456, and the compactness value of the parameter with a cumulative frequency of 75 was 0.565 (Figure 8). The changing trend of the parameters shifted to the right as a whole, indicating that the smaller the compactness value of the parameter was, the more easily the particles were crushed during the compaction process.
Among the particle shape parameters, the larger the solidity value was, the more regular the particle shape was (Table 1). By comparing the evolution of the solidity value of the particles before compaction, the solidity value of the cumulative frequency of up to 50 was determined to be 0.804, the solidity value of the cumulative frequency of up to 75 was 0.867, and the peak value of the fitting trend was 0.829. With increasing axial stress, the degree of particle crushing increased, and the solidity value of the cumulative frequency of up to 50 under 70 MPa was 0.819. The solidity value of the parameter with a cumulative frequency of up to 75 was 0.880, and the peak value of the fitting trend was 0.860 (Figure 9). The changing trend of the parameters shifted to the right as a whole, indicating that the smaller the solidity value was in the compaction process, the more easily the particles were crushed.
Among the particle shape parameters, the larger the slenderness value was, the longer the particle shape was (Table 1). According to the analysis of the evolution of the slenderness value of the particle, before compaction, the frequency of slenderness value (range: 0–40) was 70.1%. With increasing axial stress, at 70 MPa, the slenderness value increased to 84.3% under 70 MPa, while the length-to-width ratio of particles decreased (Figure 10). The overall trend of the parameter change was to the left, indicating that the larger the slenderness value of the particle was during the compaction process, the more likely it was that the particle would be crushed.

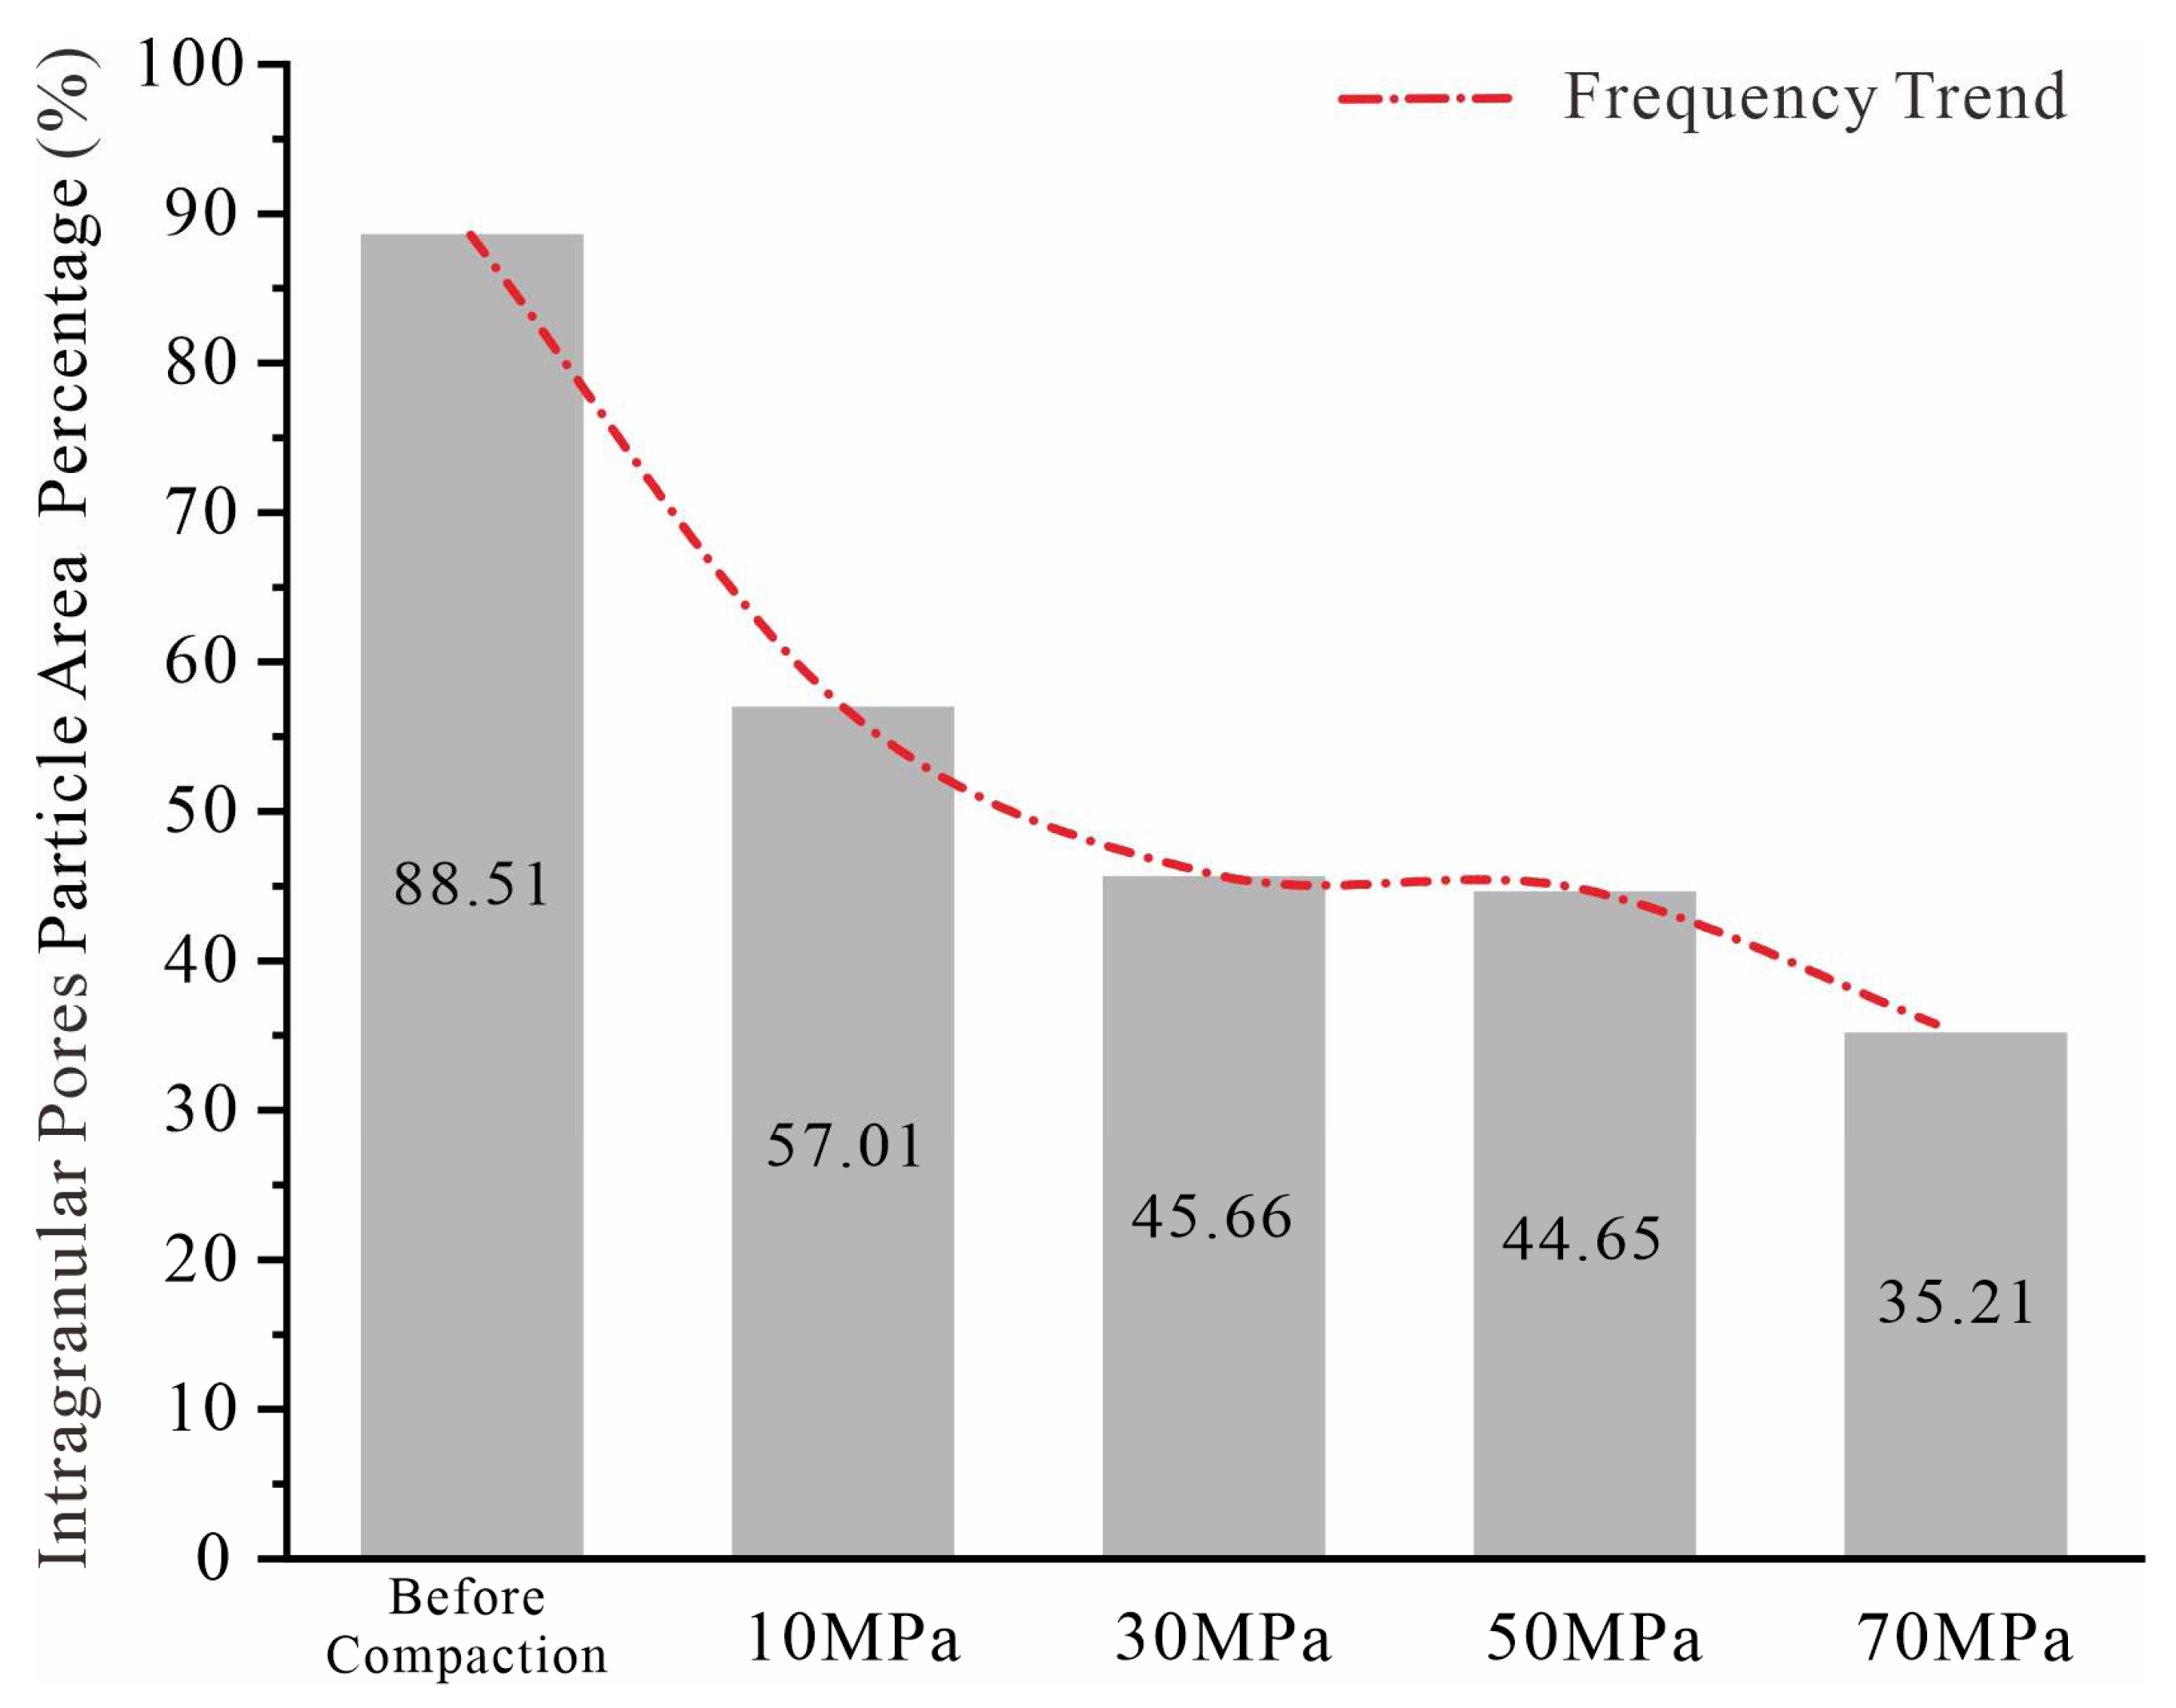
5.2. Relationship between Intragranular Pores in Scoria and Particle Crushing

In terms of the microstructure, the inelastic compaction of porous rocks is the main cause of pore collapse and particle crushing [52]. In the experimental sample compaction process, pore collapse occurred, which increased the effective flow of the surrounding particles and increased the probability of particle contact. For porous rocks, an increase in the intragranular pores helps to improve the relative proportions of tensile crushing and intergranular crushing, and the localization features become more obvious [53]. The difference in the effective porosity is reflected by the image surface porosity. According to the statistics of the particles containing intragranular pores in the sections before compaction and under various axial stresses, more than 31% of the particles containing intragranular pores were crushed when the axial stress was increased to 10 MPa. According to the observations of blue casting thin sections of samples compressed at 10 MPa, the crushing of the particles containing intragranular pores mainly occurred in the bands (Figure 6). As the axial stress constantly increased, the intragranular pores in the scoria collapsed, the area proportion of the particles containing intragranular pores gradually decreased, and the particles developed from porous to less porous or even non-porous (Figure 11). With axial stress gradually increased, the effective porosity exhibited a normal distribution trend which is different from the behavior of sandstone and mudstone. Furthermore, we have observed that scoria particles contain numerous intragranular pores, and intragranular pores collapse can increase the overall effective porosity of the material by increasing the connectivity between pores (Figure 3). The abnormal trend is likely attributed to the collapse of pores. Therefore, the existence of intragranular pores in scoria is an important factor affecting particle crushing.

5.3. Relationship between Scoria Type and Particle Crushing

The scoria type is also a crucial determinant of the particle crushing characteristics. The external environment causes the mineral composition and content of each particle to be different, so the strength of the detrital particles can vary even when they are from the same source. In China and abroad, many researchers have verified the influence of mineral composition and contents on particle strength through experiments [54,55,56,57]. According to the statistics of the crushed particles in the blue casting thin sections of the samples compresses under different axial stresses, in the particle rearrangement stage, the overall area of crushed particles was less than 55%, except in the blue casting thin sections of the compaction band positions (10 MPa−2, 30 MPa−1, and 30 MPa−2). Among the relatively small crushed particle areas, vitreous basalt particles still occupied a larger proportion. In the particle crushing stage, the area proportion of the crushed particles was similar, and the vitreous basalt particles still comprised the main part of the particle crushing (Figure 6). Due to the differences in the properties of the particles themselves, the vitreous basalt particles were more fragile than the porphyritic basalt particles under each axial stress in the mechanical compaction experiments.

6. Conclusions

In the compaction experiments conducted on pyroclastic rocks, excluding the influence of other factors on the mechanical compaction, the compaction rate increased and the image surface porosity decreased with increasing axial stress for particles from the same source and in the same particle size range from the pyroclastic samples. However, the effective porosity after compaction did not exhibit a decreasing trend with increasing stress but rather a normal distribution trend that initially increased and then decreased, which is different from the trends for sandstone and mudstone.
In the experimental compaction of the pyroclastic samples, the particle crushing process was segmented with increasing axial stress, that is, the particle rearrangement stage during the early compaction (10–30 MPa) and the particle crushing stage during later compaction (50–70 MPa). The former produced obvious compaction bands (CBs), and the intergranular pores in the particles were greatly reduced. Most of the particles remained intact. Most of the particles in the blue casting thin sections were in contact with each other and remained uncrushed, and the particle contact relationship was usually point contact but occasionally line contact. The latter stage mostly produced non-successive compaction localization areas, with an increased frequency of particle crushing, and the contact relationships were predominantly concave-convex contact, suture contact, and occasionally point contact. The localized compaction deformation is very likely to be an important factor affecting the deterioration of pyroclastic rock reservoirs with the increase of burial depth.
In the case of experimental mechanical compaction, pyroclastic particles of Hongtu Hill are mainly crushed after 30 MPa, the main factors controlling the particle crushing were the compactness, solidity, slenderness, the abundance of intragranular pores in the pyroclastic materials, and the contents between the vitreous basalt scoria particles. The smaller the compactness and solidity were and the larger the slenderness of the particles was, the more likely the particles were to break during compaction. The particles containing intragranular pores were also more likely to break during compaction. The vitreous basalt particles were more fragile than the porphyritic basalt particles.

Supplementary Materials

The following supporting information can be downloaded at: https://www.mdpi.com/article/10.3390/min13101351/s1, CISA-Particle Size Analysis Datas Reports.

Author Contributions

Conceptualization, J.H.; methodology, T.G.; software, J.B.; validation, J.H., Z.Z. and H.T.; formal analysis, H.T. and L.Y.; investigation, J.B.; resources, T.G.; data curation, Z.Z.; writing—original draft preparation, J.B.; writing—review and editing, H.T. and L.Y.; visualization, J.B.; supervision, H.T. and L.Y.; project administration, H.T.; funding acquisition, H.T. All authors have read and agreed to the published version of the manuscript.

Funding

This research was funded by the Key R&D projects in Jilin Province (grant No. 20230203107SF), the National Key R&D Program of China (grant No. 2019YFC0605402) and the National Natural Science Foundation of China (grant No. 41790453).

Data Availability Statement

The data that support the findings of this study are openly available at https://data.mendeley.com/drafts/dm2p9trpsh (accessed on 25 March 2023), an open-source online data repository hosted at Mendeley Data (Bai Jiawei, 2023).

Acknowledgments

We thank Guo Tianchan for the field work. We appreciate the support of CISA software (http://www.westimage.com.cn (accessed on 1 December 2022)) and JMicroVision software (https://jmicrovision.github.io (accessed on 13 December 2022)) for experimental data processing.

Conflicts of Interest

The authors declare no conflict of interest.

References

  1. Sruoga, P.; Rubinstein, N.; Hinterwimmer, G. Porosity and permeability in volcanic rocks: A case study on the Serie Tobifera, South Patagonia, Argentina. J. Volcanol. Geotherm. Res. 2004, 132, 31–43. [Google Scholar] [CrossRef]
  2. Tang, H.F.; Kong, T.; Liu, X.; Yang, D.; Huo, H.Y.; Huang, Y.L. Characteristics and formation mechanisms of high quality reservoir of volcaniclastic sedimentary rocks of Early Cretaceous in Songliao Basin. Acta Pet. Sin. 2016, 37, 631–643. [Google Scholar]
  3. Tang, H.F.; Tian, Z.W.; Gao, Y.F.; Dai, X.J. Review of volcanic reservoir geology in China. Earth Sci. Rev. 2022, 232, 104158. [Google Scholar] [CrossRef]
  4. Wen, L.; Li, Y.; Yi, H.Y.; Liu, X.; Zhang, B.J.; Qiu, Y.G.; Zhou, G.; Zhang, X.H. Lithofacies and reservoir characteristics of Permian volcanic rocks in the Sichuan Basin. Nat. Gas Ind. 2019, 39, 17–27. [Google Scholar] [CrossRef]
  5. Yuan, X.G.; Li, W.F.; Dong, H.; Wang, T.; Zhang, B.L.; Li, S. Characteristics and controlling factors of Permian volcanic reservoirs in Kebai Area. Fault-Block Oil Gas Field 2015, 22, 445–449. [Google Scholar]
  6. Wang, P.J.; Chen, S.M. Cretaceous volcanic reservoirs and their exploration in the Songliao Basin, northeast China. AAPG Bull. 2015, 99, 499–523. [Google Scholar] [CrossRef]
  7. Ji, Y.L. Geology of Oil and Gas Reservoirs, 2nd ed.; China University of Petroleum Press: Qingdao, China, 2015. [Google Scholar]
  8. Mohamed, A.K.; Ibrahim, M.H.; Alaa, M.S. Petrography, diagenesis and reservoir characteristics of the Pre-Cenomanian sandstone, Sheikh Attia area, East Central Sinai, Egypt. J. Afr. Earth Sci. 2014, 96, 122–138. [Google Scholar]
  9. Fisher, Q.J.; Casey, M.; Clennell, M.B.; Knipe, R.J. Mechanical compaction of deeply buried sandstones of the North Sea. Mar. Pet. Geol. 1999, 16, 605–618. [Google Scholar] [CrossRef]
  10. Marcussen, O.; Thyberg, B.I.; Peltonen, C.; Jahren, J.; Bjrlykke, K.; Faleide, J.I. Physical properties of Cenozoic mudstones from the northern North Sea: Impact of clay mineralogy on compaction trends. AAPG Bull. 2009, 93, 127–150. [Google Scholar] [CrossRef]
  11. Peltonen, C.; Marcussen, Ø.; Bjørlykke, K.; Jahren, J. Mineralogical control on mudstone compaction: A study of Late Cretaceous to Early Tertiary mudstones of the Vring and Mre basins, Norwegian Sea. Pet. Geosci. 2008, 14, 127–138. [Google Scholar] [CrossRef]
  12. Chester, J.S.; Lenz, S.C.; Chester, F.M.; Lang, R.A. Mechanisms of compaction of quartz sand at diagenetic conditions. Earth Planet. Sci. Lett. 2004, 220, 435–451. [Google Scholar] [CrossRef]
  13. Chuhan, F.A.; Kjeldstad, A.; Bjørlykke, K.; Høeg, K. Experimental compression of loose sands: Relevance to porosity reduction during burial in sedimentary basins. Can. Geotech. J. 2003, 45, 995–1011. [Google Scholar] [CrossRef]
  14. Fawad, M.; Mondol, N.H.; Jahren, J.; Bjorlykke, K. Mechanical compaction and ultrasonic velocity of sands with different texture and mineralogical composition. Geophys. Prospect. 2011, 59, 697–720. [Google Scholar] [CrossRef]
  15. Hou, G.F.; Ji, Y.L.; Wu, H.; Li, L.L.; Wang, Y.S.; Wang, W. Quantitative characterization of factors influencing the physical properties of clastic reservoirs by physical simulation. Geol. Sci. Technol. Inf. 2017, 36, 153–159. [Google Scholar]
  16. Lander, R.H.; Walderhaug, O. Predicting porosity through simulating sandstone compaction and quartz cementation. AAPG Bull. 1999, 83, 433–449. [Google Scholar]
  17. Zhuo, X.Z.; Zhang, L.Y.; Chen, X.S.; Zhang, J.J.; Yang, J.L.; Li, Y.C. Influence of the Argillaceous Matrix on Pore Evolution Model of the Deep Reservoir in Well Kun-2, Qaidam Basin. Geol. Rev. 2015, 61, 1447–1457. [Google Scholar]
  18. Liu, G.Y.; Jin, Z.J.; Zhang, L.P. Experimental study on the simulation of compaction of clastic rock formation. Acta Sedimentol. Sin. 2006, 24, 407–413. [Google Scholar]
  19. Liu, G.Y.; Liu, Y.; Zhang, L.P. Effect of compaction on the physical properties of sandstone reservoirs. J. Xi’an Shiyou Univ. Nat. Sci. Ed. 2006, 21, 24–28+41+112. [Google Scholar]
  20. Cao, Y.C.; Xi, K.L.; Wang, J.; Yuan, G.H.; Yang, T. Preliminary Discussion of Simulation Experiments on the Mechanical Compaction and Physical Property Evolution of Sandstones. Geoscience 2011, 25, 1152–1158. [Google Scholar]
  21. Couvreur, J.F.; Vervoort, A.; King, M.S.; Lousberg, E.; Thimus, J.F. Successive cracking steps of a limestone highlighted by ultrasonic wave propagation. Geophys. Prospect. 2001, 49, 71–78. [Google Scholar] [CrossRef]
  22. Vajdova, V.; Baud, P.; Wong, T.F. Compaction, dilatancy, and failure in porous carbonate rocks. J. Geophys. Res. Solid Earth 2004, 109, 1–16. [Google Scholar] [CrossRef]
  23. Croizé, D.; Bjorlykke, K.; Jahren, J.; Renard, F. Experimental mechanical and chemical compaction of carbonate sand. J. Geophys. Res. Solid Earth 2010, 115, B11204. [Google Scholar] [CrossRef]
  24. Croizé, D.; Ehrenberg, S.N.; BjøRlykke, K.; Renard, F.O.; Jahren, J. Petrophysical properties of bioclastic platform carbonates: Implications for porosity controls during burial. Mar. Pet. Geol. 2010, 27, 1765–1774. [Google Scholar] [CrossRef]
  25. Croizé, D.; Renard, F.; Gratier, J.P. Compaction and Porosity Reduction in Carbonates: A Review of Observations, Theory, and Experiments. Adv. Geophys. 2013, 54, 181–238. [Google Scholar]
  26. Mondol, N.H.; BjøRlykke, K.; Jahren, J.; HøEg, K. Experimental mechanical compaction of clay mineral aggregates—Changes in physical properties of mudstones during burial. Mar. Pet. Geol. 2007, 24, 289–311. [Google Scholar] [CrossRef]
  27. Zanella, A.; Cobbold, P.R.; Le Carlier de Veslud, C. Physical modelling of chemical compaction, overpressure development, hydraulic fracturing and thrust detachments in organic-rich source rock. Mar. Pet. Geol. 2014, 55, 262–274. [Google Scholar] [CrossRef]
  28. Liu, P.C.; Yi, J.; Shan, X.L.; Wu, C.Z.; Gao, F.H.; Guo, J.N.; Li, J.H.; Wang, W.; Ventura, G. Modelling the Post-Caldera Plumbing System of Changbaishan Volcano (China) from Integrated Geochemical, Isotopic, Geobarometry, and Geophysical Data. Lithos 2023, 454–455, 107287. [Google Scholar] [CrossRef]
  29. Zhang, M.L.; Guo, Z.F.; Liu, J.Q.; Liu, G.M.; Zhang, L.H.; Lei, M.; Zhao, W.B.; Ma, L.; Vincenzo, V.; Guido, V. The intraplate Changbaishan volcanic field (China/North Korea): A review on eruptive history, magma genesis, geodynamic significance, recent dynamics and potential hazards. Earth Sci. Rev. 2018, 187, 19–52. [Google Scholar] [CrossRef]
  30. Wei, H.Q.; Liu, G.M.; Gil, J. Review of eruptive activity at Tianchi volcano.Changbaishan, Northeast China: Implications for possible future eruptions. Bull. Volcanol. 2013, 75, 706. [Google Scholar] [CrossRef]
  31. Pan, B.; De Silva, S.L.; Xu, J.D.; Chen, Z.; Miggins, D.P.; Wei, H. The VEI-7 Milennium eruption, Changbaishan-Tianchi volcano, China/DPRK: New field, petrologicaland chemical constraints on stratigraphy, volcanology, and magma dynamics. J. Volcanol. Geotherm. Res. 2017, 343, 45–59. [Google Scholar] [CrossRef]
  32. Qian, C.; Cui, T.R.; Jiang, B.; Li, L.C.; Chen, H.J.; Qin, T.; Tang, Z.; Si, Q.L.; Lu, L. A study on the characteristics of late cenozoic volcanic terrain in Changbaishan Mountain and its geological application. Quat. Sci. 2014, 34, 312–324. [Google Scholar]
  33. Roduit, N. JMicroVision: Un Logiciel D’analyse D’images Pétrographiques Polyvalent. Ph.D. Thesis, University of Geneva, Geneva, Switzerland, 2007. [Google Scholar]
  34. Ji, Y.L.; Wu, H.; Wang, Y.S.; Zhou, Y.; Wang, W.; Hou, G.F.; Zhang, Y.L. Application of physical simulation to study the physical evolution characteristics of clastic reservoirs: An example of the Paleocene Shahejie Formation in the Shengli Oil Region. Geol. J. Chin. Univ. 2017, 23, 657–669. [Google Scholar]
  35. Selley, R.C. Porosity gradients in North Sea oil-bearing sandstones. J. Geol. Soc. 1978, 135, 119–132. [Google Scholar] [CrossRef]
  36. Fossen, H.; Schultz, R.A.; Torabi, A. Conditions and implications for compaction band formation in the Navajo Sandstone, Utah. J. Struct. Geol. 2011, 33, 1477–1490. [Google Scholar] [CrossRef]
  37. Haimson, B.C.; Klaetsch, A.R. Compaction bands and the formation of slot-shaped breakouts in St. Peter sandstone. Geol. Soc. Publ. 2007, 284, 89–105. [Google Scholar] [CrossRef]
  38. Mollema, P.N.; Antonellini, M.A. Compaction bands: A structural analog for anti-mode I cracks in aeolian sandstone. Tectonophysics 1996, 267, 209–228. [Google Scholar] [CrossRef]
  39. Baud, P.; Klein, E.; Wong, T.F. Compaction localization in porous sandstones: Spatial evolution of damage and acoustic emission activity. J. Struct. Geol. 2004, 26, 603–624. [Google Scholar] [CrossRef]
  40. Fortin, J.; Stanchits, S.; Dresen, G.; Guéguen, Y. Acoustic emission and velocities associated with the formation of compaction bands in sandstone. J. Geophys. Res. Solid Earth 2006, 111, B10203. [Google Scholar] [CrossRef]
  41. Holcomb, D.; Rudnicki, J.W.; Issen, K.A.; Sternlof, K. Compaction localization in the Earth and the laboratory: State of the research and research directions. Acta Geotech. 2007, 2, 1–15. [Google Scholar] [CrossRef]
  42. Abdallah, Y.; Sulem, J.; Bornert, M.; Ghabezloo, S.; Stefanou, I. Compaction Banding in High-Porosity Carbonate Rocks: 1. Experimental Observations; John Wiley & Sons, Ltd.: Hoboken, NJ, USA, 2021. [Google Scholar]
  43. Adelinet, M.; Fortin, J.; Schubnel, A.; Guéguen, Y. Deformation modes in an Icelandic basalt: From brittle failure to localized deformation bands. J. Volcanol. Geotherm. Res. 2013, 255, 15–25. [Google Scholar] [CrossRef]
  44. Baud, P.; Schubnel, A.; Heap, M.; Rolland, A. Inelastic Compaction in High-Porosity Limestone Monitored Using Acoustic Emissions. J. Geophys. Res. Solid Earth 2017, 122, 9989–10008. [Google Scholar] [CrossRef]
  45. Cilona, A.; Faulkner, D.R.; Tondi, E.; Agosta, F.; Mancini, L.; Rustichelli, A.; Baud, P.; Vinciguerra, S. The effects of rock heterogeneity on compaction localization in porous carbonates. J. Struct. Geol. 2014, 67, 75–93. [Google Scholar] [CrossRef]
  46. Cavailhes, T.; Rotevatn, A. Deformation bands in volcaniclastic rocks—Insights from the Shihtiping tuffs, Coastal Range of Taiwan. J. Struct. Geol. 2018, 113, 155–175. [Google Scholar] [CrossRef]
  47. Klein, E.; Baud, P.; Reuschlé, T.; Wong, T.F. Mechanical behaviour and failure mode of bentheim sandstone under triaxial compression. Phys. Chem. Earth Part A 2001, 26, 21–25. [Google Scholar] [CrossRef]
  48. Heap, M.J.; Kennedy, B.M.; Pernin, N.; Jacquemard, L.; Baud, P.; Farquharson, J.I.; Scheu, B.; Lavallee, Y.; Gilg, H.A.; Letham-Brake, M.; et al. Mechanical behaviour and failure modes in the Whakaari (White Island volcano) hydrothermal system, New Zealand. J. Volcanol. Geotherm. Res. 2015, 295, 26–42. [Google Scholar] [CrossRef]
  49. Heap, M.J.; Baud, P.; Mcbeck, J.A.; Renard, F.; Carbillet, L.; Hall, S.A. Imaging strain localisation in porous andesite using digital volume correlation. J. Volcanol. Geotherm. Res. 2020, 404, 107038. [Google Scholar] [CrossRef]
  50. Cho, G.C.; Dodds, J.; Santamarina, J.C. Particle Shape Effects on Packing Density, Stiffness, and Strength: Natural and Crushed Sands. J. Geotech. Geoenviron. Eng. 2006, 132, 591–602. [Google Scholar] [CrossRef]
  51. Liu, Q.B.; Xiang, W.; Budhu, M.; Cui, D.S. Quantification of sandy soil particle shape and its influence on mechanical index. Rock Soil Mech. 2011, 32, 190–197. [Google Scholar]
  52. Wong, T.F.; Baud, P. The brittle-ductile transition in porous rock: A review. J. Struct. Geol 2012, 44, 25–53. [Google Scholar] [CrossRef]
  53. Xiong, L.F. Study on Deformation Damage Mechanism of Pore Rock and Its Influencing Factors. Ph.D. Thesis, University of Science and Technology Beijing, Beijing, China, 2022. [Google Scholar]
  54. Hatzor, Y.H.; Zur, A.; Mimran, Y. Microstructure effects on microcracking and brittle failure of dolomites. Tectonophysics 1997, 281, 141–161. [Google Scholar] [CrossRef]
  55. Wu, X.Y.; Baud, P.; Wong, T.F. Micromechanics of compressive failure and spatial evolution of anisotropic damage in Darley Dale sandstone. Int. J. Rock Mech. Min. Sci. 2000, 37, 143–160. [Google Scholar] [CrossRef]
  56. Lindqvist, J.E.; Åkesson, U.; Malaga, K. Microstructure and functional properties of rock materials. Mater. Charact. 2007, 58, 1183–1188. [Google Scholar] [CrossRef]
  57. Liu, W.C.; Huang, L.F.; Liu, S.; Guo, J.Y. Study on the factors influencing the crushing characteristics of ore particles. Mod. Min. 2020, 36, 103–105. [Google Scholar]
Figure 1. Profile of the Quaternary pyroclast samples from Hongtu Hill, Changbaishan area. (a) Overview map showing the location of the Changbaishan Volcanic Field. (b) Geologic map of the Hongtu Hill area (modified from [32]). 1—Holocene volcanic eruptions, 2—Middle Pleistocene volcanic trachyandensite eruptions, 3—Early Pleistocene volcanic trachyandensite eruptions, 4—Pliocene-Early Pleistocene basaltic eruptions, 5—Middle Pleistocene-Late Pleistocene basaltic eruptions, 6—Miocene basaltic eruptions, 7—Volcanic Group, 8—Granite area. (c) The quarry scoria samples. (d) Frequency distribution of sieved particle size of scoria samples. (e) Tubular samples of particle size (0.25–0.5 mm). (f) Photograph of some particles of scoria samples, 4×, plane-polarized light. (g) Schematic diagram showing the apparatus of TCZY-2 model simulation experimental device. Abbreviation for minerals: Pl, plagioclase; San, sanidine.
Minerals 13 01351 g001
Figure 2. A blue casting thin section of the Quaternary scoria particles (0.25–0.5 mm) from Hongtu Hill under an axial stress of 50 MPa. (a) The blue casting thin section in plane-polarized light showing intragranular and intergranular pores (4×). (b) The blue casting thin section after CIAS feature extraction.
Minerals 13 01351 g002
Figure 3. Diagram of the main crushing characteristics of the microscopic particles of the scoria samples from Hongtu Hill, Changbaishan area. (a) A blue casting thin section of a crushed particle under an axial stress of 30 MPa and the corresponding diagram of the early crushing stage of the particle. (b) A blue casting thin section of a crushed particle under an axial stress of 50 MPa and the corresponding diagram of the middle crushing stage of the particle. (c) A blue casting thin section of a crushed particle under an axial stress of 70 MPa and the corresponding diagram of the later crushing stage of the particle.
Minerals 13 01351 g003
Figure 4. Blue casting thin sections and particle size analysis of the Quaternary pyroclastic samples from Hongtu Hill, Changbaishan area, under axial stresses of 10, 30, 50, and 70 MPa. (I-a,II-a,III-a,IV-a) Tubular samples before compaction. (I-b,II-b,III-b,IV-b) Overall pictures of the blue casting thin section after compaction under axial stresses of 10 MPa, 30 MPa, 50 MPa, and 70 MPa (I-c,II-c,III-c,IV-c). Microscopic pictures of the blue casting thin section, 4×, plane-polarized light (I-d,II-d,III-d,IV-d). Particle size analysis characteristics after compaction under axial stresses of 10 MPa, 30 MPa, 50 MPa, and 70 MPa. Φ = −log2D, where D is the image surface particle diameter in mm.
Minerals 13 01351 g004
Figure 5. Statistical analysis of crushed particles in blue casting sections of the Quaternary pyroclasts from Hongtu Hill, Changbaishan area, under different axial stresses. Statistical analysis of crushed particles under axial stresses of (a) 10 MPa, (b) 30 MPa, (c) 50 MPa, and (d) 70 MPa.
Minerals 13 01351 g005
Figure 6. Comparison of particle crushing areas of different pyroclastic materials under different axial stresses under the microscope for the Quaternary pyroclasts from Hongtu Hill, Changbaishan area. Particle crushing areas of different pyroclastic materials under axial stresses of (a) 10 MPa, (b) 30 MPa, (c) 50 MPa, and (d) 70 MPa.
Minerals 13 01351 g006
Figure 7. The blue casting thin section and particle size analysis of the Quaternary pyroclasts from Hongtu Hill, Changbaishan area, under an axial stress of 10 MPa. (I) Overall picture of the compacted blue casting thin section under an axial stress of 10 MPa. (I-a) Compaction band. (II-a,II-b,II-c,II-d) Blue casting thin sections of the samples compressed under an axial stress of 10 MPa, 4×, plane-polarized light. (III-a,III-b,III-c,III-d) Statistical graphs of the particle size analysis corresponding to Figure II.
Minerals 13 01351 g007
Figure 8. Frequency distribution of compactness value of microscopic particles of the Quaternary pyroclasts from Hongtu Hill, Changbaishan area. Frequency distribution of compactness values of microscopic particles: (a) before compaction and (b) under an axial stress of 70 MPa.
Minerals 13 01351 g008
Figure 9. Frequency distribution of solidity values of microscopic particles of the Quaternary pyroclasts from Hongtu Hill, Changbaishan area. Frequency distribution of solidity values of microscopic particles: (a) before compaction and (b) under an axial stress of 70 MPa.
Minerals 13 01351 g009
Figure 10. Frequency distribution of slenderness of microscopic particles of the Quaternary pyroclasts from Hongtu Hill, Changbaishan area. Frequency distribution of slenderness values of microscopic particles: (a) before compaction and (b) under an axial stress of 70 MPa.
Minerals 13 01351 g010
Figure 11. Comparison of particle areas of microscopic particles containing intragranular pores in the Quaternary pyroclasts from Hongtu Hill, Changbaishan area, under different axial stresses.
Minerals 13 01351 g011
Table 1. Measured and outlined parameters obtained from the particle size analysis of the scoria particles using the image process method.
ParameterSymbolDefinitionGeological
Implications
AreaSParticle area
PerimeterPParticle perimeter
Image surface porosityφProportion of pore area under the microscope
Particle diameterDDiameter of the circle with the same area as the particle
D =2√(S/π)
Particle size
ΦΦ = −log2DParticle size
Compactness-Ratio of the area of a particle profile to the area of a circle with the same perimeterDegree of rounding
Solidity-Ratio of the area of the particle profile to its convex area (the convex area is the area of the circumscribed convex polygon of the profile)Degree of outline regularity
Slenderness-Slenderness =P2/S
Ratio of the square of the perimeter of the particle profile to its area
Degree of outline slenderness
Table 2. Results of experimental mechanical compaction of the Quaternary pyroclastic samples from Hongtu Hill, Changbaishan area, which were measured using a TCZY-2 model simulation experimental device.
Axial Stress (MPa)Simulation Depth
(m)
Compaction Band Thickness
(mm)
Compaction Rate
(%)
Image Surface Porosity
(%)
Effective Porosity (%) Porosity
Reduction
(%)
Before
Compaction
After
Compaction
10 3899.14 11.8335.08 57.46 31.02 26.20
30116719.26 15.2124.64 55.63 40.13 15.50
501945- 27.9514.01 56.03 40.08 15.95
702724-42.7511.73 55.95 37.76 18.19
Disclaimer/Publisher’s Note: The statements, opinions and data contained in all publications are solely those of the individual author(s) and contributor(s) and not of MDPI and/or the editor(s). MDPI and/or the editor(s) disclaim responsibility for any injury to people or property resulting from any ideas, methods, instructions or products referred to in the content.

