Article

Genesis of the Yi’nan Tongjing Gold–Copper Skarn Deposit, Luxi District, North China Craton: Evidence from Fluid Inclusions and H–O Isotopes

1
School of Resources and Environmental Engineering, Shandong University of Technology, Zibo 255049, China
2
MNR Key Laboratory for Exploration Theory and Technology of Critical Mineral Resources, China University of Geosciences, Beijing 100083, China
3
No. 1 Institute of Geology and Mineral Resources of Shandong Province, Ji’nan 250100, China
4
Shandong Engineering Laboratory for High-Grade Iron Ore Exploration and Exploitation, Ji’nan 250100, China
5
Key Laboratory of Gold Mineralization Processes and Resource Utilization, MNR, Ji’nan 250013, China
*
Authors to whom correspondence should be addressed.
Minerals 2023, 13(10), 1348; https://doi.org/10.3390/min13101348
Submission received: 6 September 2023 / Revised: 4 October 2023 / Accepted: 21 October 2023 / Published: 23 October 2023

Abstract

:
The Luxi district presents an exceptional research area for the investigation of the significant role played by magma exsolution fluids in the mineralization process of Au–Cu deposits. A particularly noteworthy occurrence within this region is the Yi’nan Tongjing Au–Cu skarn deposit, situated in the central-southern part of the Luxi district. This deposit primarily occurs in the contact zone between the early Cretaceous Tongjing complex and the Proterozoic to Cambrian sequences. The ore formation process observed in this deposit can be categorized into three distinct stages: (I) thermal metamorphism, (II) prograde alteration, and (III) retrograde alteration. The retrograde alteration stage is further divided into four sub-stages: late skarn (III-1), oxide (III-2), sulfide (III-3), and late quartz-calcite (III-4). It is primarily during the III-3 sub-stage that gold mineralization occurs. Petrographic analysis has identified three types of fluid inclusions (FIs) within garnet, quartz, and calcite grains. These include liquid-rich two-phase aqueous FIs, vapor-rich two-phase aqueous FIs, and halite-bearing multi-phase FIs. The homogenization temperatures of fluid inclusions from stages II, III-3, and III-4 range between 430–457 °C, 341–406 °C, and 166–215 °C (first to third quartiles), respectively. The garnet samples from stage II exhibit hydrogen and oxygen isotope compositions (δ18OH2O = 6.8‰ and δD = −73‰) that are indicative of a typical magma source. However, the hydrogen and oxygen isotopes of sub-stages III-1, III-2, and III-3 (δ18OH2O = 7.32‰ to 9.74‰; δD = −107‰ to −81.9‰) fall below the magma water box while the hydrogen and oxygen isotope values of III-4 (δ18OH2O = −5.3‰ to −0.9‰ and δD = −103.8‰ to −67‰) tend to move towards the meteoric water line. Furthermore, the ore-forming fluid displays characteristics of a mixture between the crustal and mantle fluids. The Tongjing complex occurred along a weakened fault zone, initiating a process of thermal metamorphism upon contact with the wall rock. This thermal metamorphism resulted in the formation of diverse assemblages, including hornfels, reaction skarns, and skarnoids. Subsequently, the upward movement of ore-forming fluids triggered exsolution which led to the establishment of a high-temperature, medium-salinity NaCl–H2O system with a single phase at depths ranging from 1–3 km. This marked the formation of the prograde alteration stage. Afterward, the ore-forming fluid underwent water–rock interactions and the admixture of meteoric water at a depth of 1–2 km. These processes facilitated phase separation, commonly referred to as boiling, resulting in the transformation of the ore-forming fluid into higher salinity fluids and lower-density gases. This evolutionary transition ultimately induced the precipitation and liberation of gold and copper from the fluid.

1. Introduction

Skarn deposits constitute a significant sources of diverse metallic elements, including gold, silver, lead, zinc, tin, tungsten, iron, and copper [1,2,3]. These deposits demonstrate a widespread global distribution and a close association with magmatism. The latter aspect provides essential materials and heat for mineralization [3,4,5]. Skarn Au–Cu deposits, despite being less frequent than porphyry Cu–Au deposits, often exhibit elevated grades of gold and copper [6], thus garnering considerable attention from economic geologists [4,6,7,8]. Previous research endeavors aimed at comprehending the genesis of Au–Cu skarn deposits and mainly focused on skarn minerals (e.g., garnet), sulfide geochemistry (pyrite and chalcopyrite), and isotopes (S and Pb), contributing to our understanding of the mineralization process (e.g., [7,8,9,10]). However, the understanding of the mechanisms that trigger gold and copper precipitation in skarn deposits, including water–rock reactions and fluid mixing, remains inadequate. The changes in key physical and chemical parameters, such as temperature, pressure, and depth, of the ore-forming fluid caused by these mechanisms are still not comprehensively understood. Therefore, it is crucial to gain a better understanding of the source and evolution of ore-forming fluids and the corresponding mineral formation in order to fully understand the formation of skarn-type Au–Cu deposits.
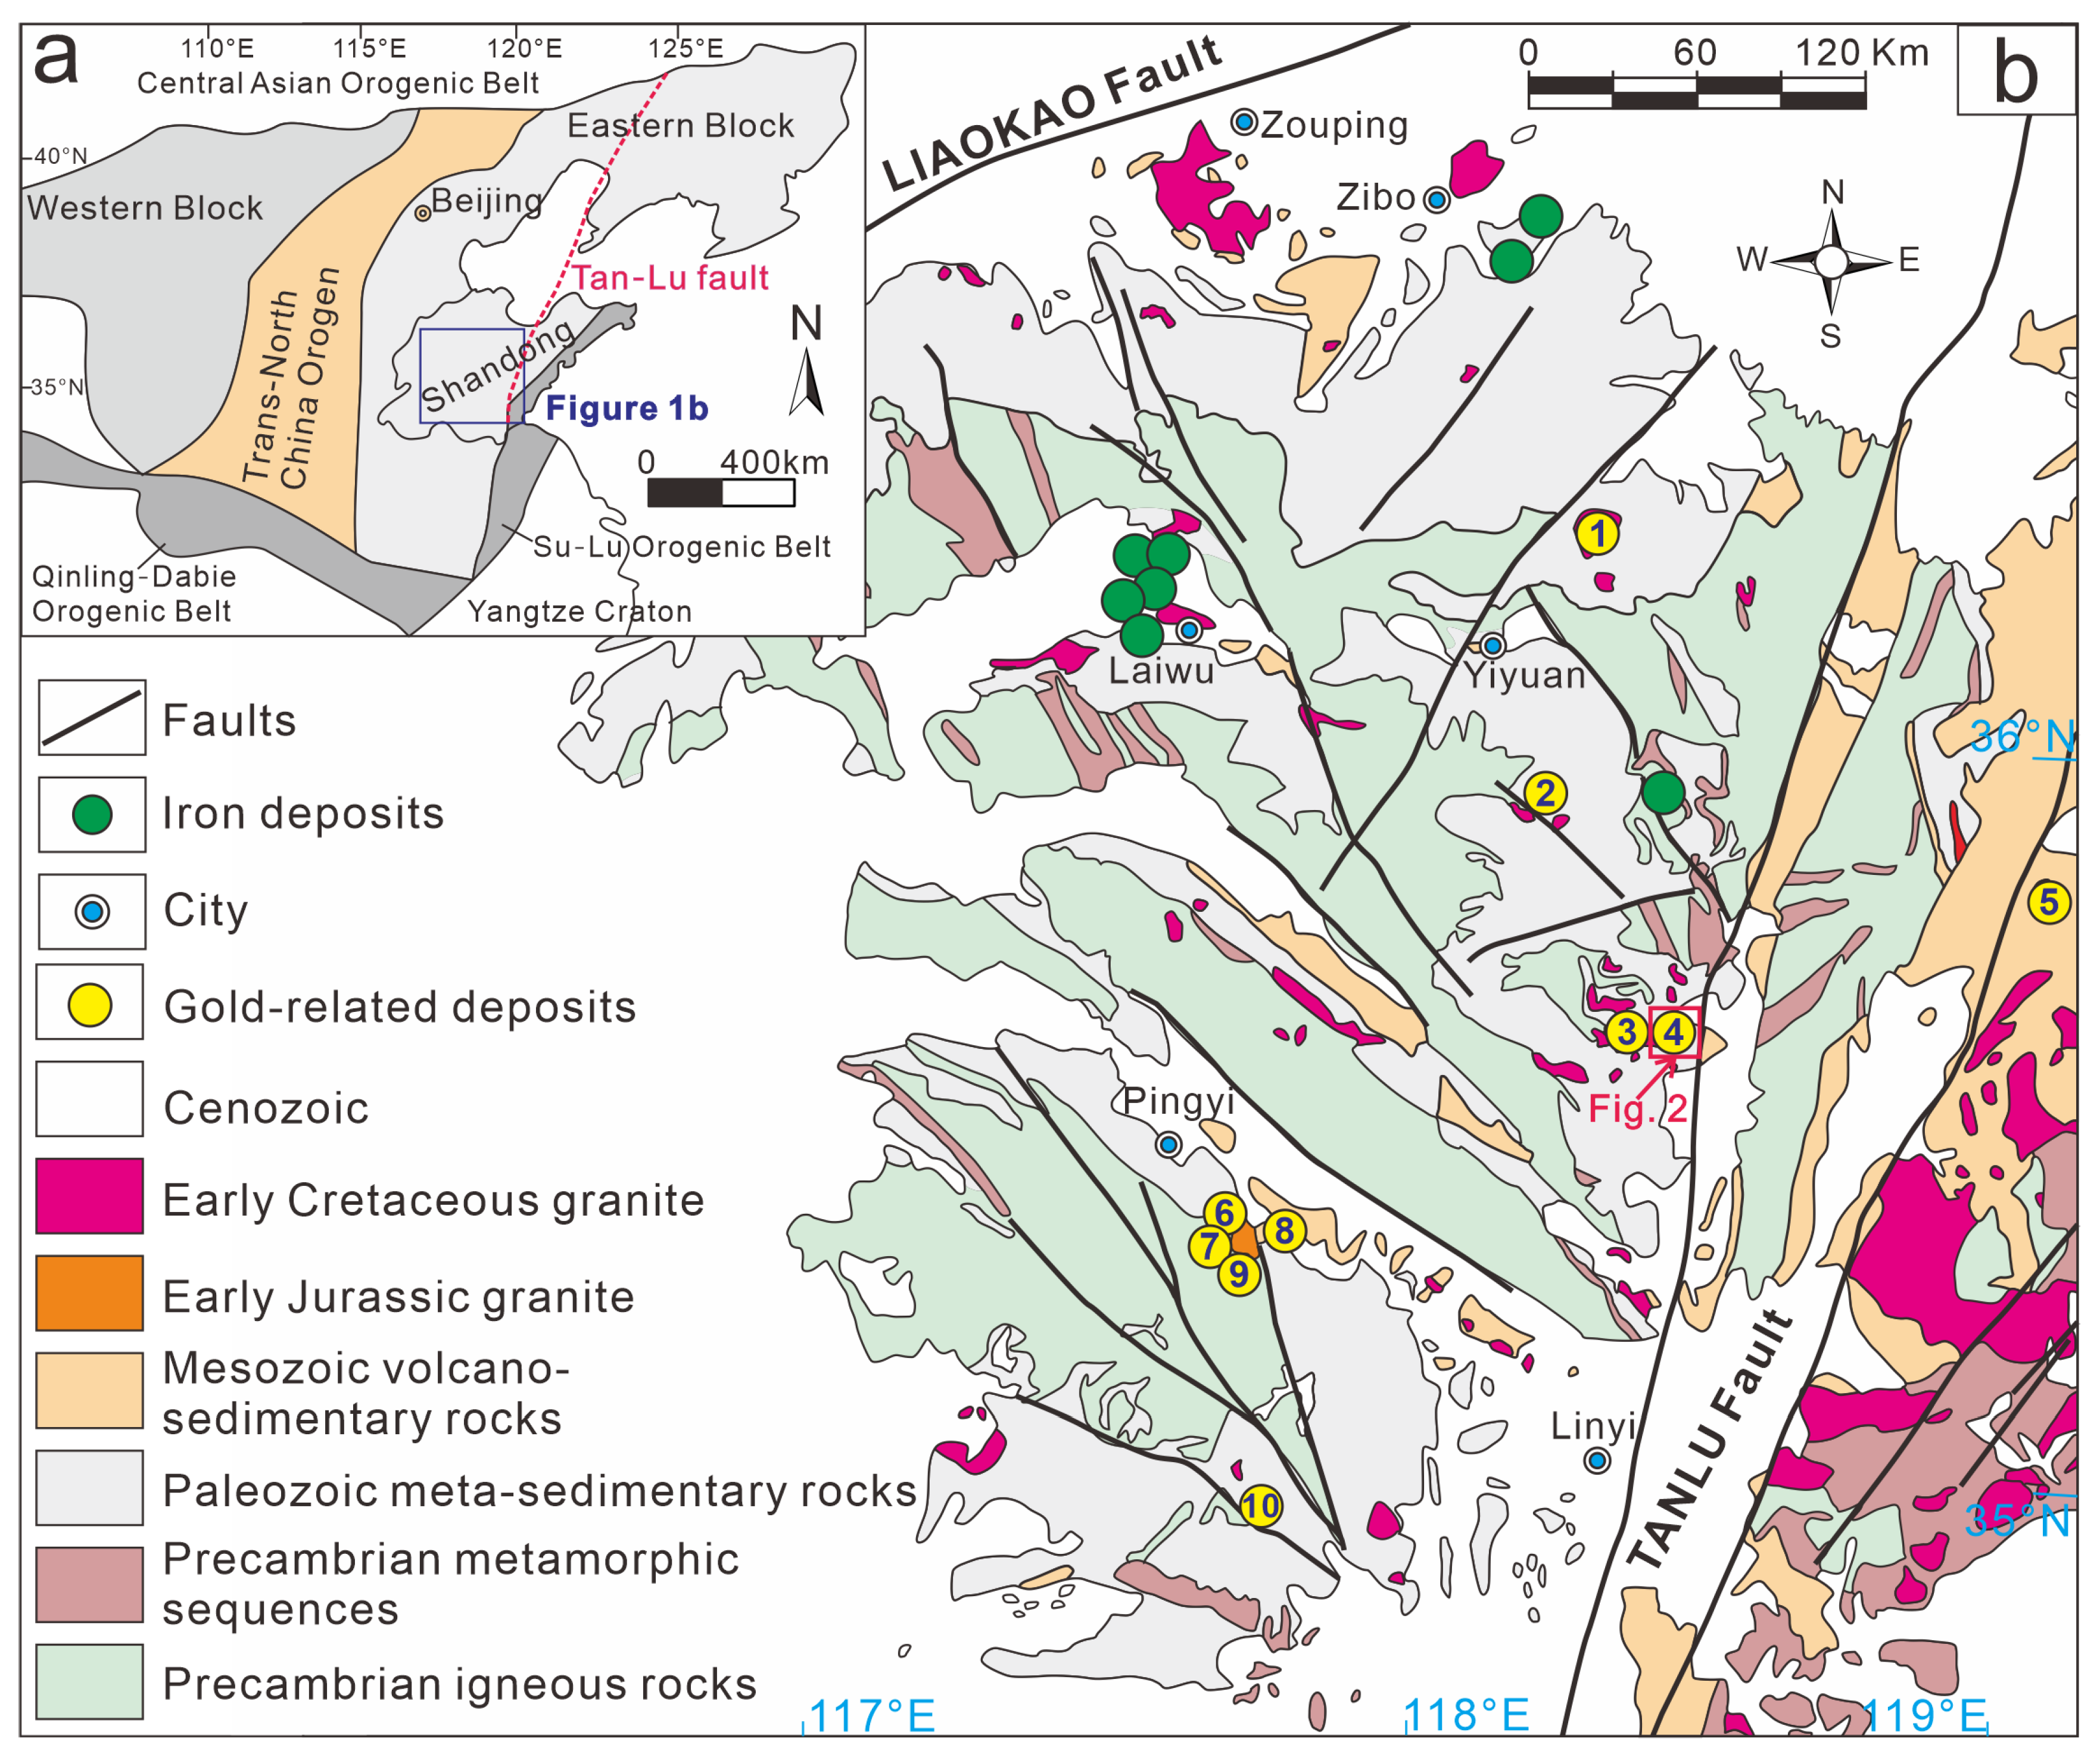
The Luxi district, situated in the eastern part of the North China Craton (NCC) (Figure 1a), is well-known for hosting several skarn deposits containing Fe and Au–Cu ores (Figure 1b). These deposits demonstrate a close association with early cretaceous intermediate magmatic rocks such as diorite and diorite porphyry [5,11,12,13]. However, the factors regulating the precipitation of Au–Cu by magmatic fluids in this area are not comprehensively understood. The Yi’nan Tongjing Au–Cu deposit, located in the central-southern part of the Luxi district (Figure 1b and Figure 2), constitutes a typical skarn deposit that provides a promising avenue to explore the interplay between magmatic/hydrothermal fluid evolution and Au–Cu mineralization. It has attracted significant scholarly attention and represents an exemplary Au–Cu deposit in the Luxi district [5,14,15,16,17,18,19,20,21]. Despite past research efforts, a comprehensive understanding of the evolution path of ore-forming fluids and crucial information pertaining to the physicochemical conditions of mineralization is still lacking.
In this study, we present a systematic classification of the mineralization stages observed in the Yi’nan Tongjing Au–Cu deposit. Subsequently, we employ fluid inclusion petrography and microthermometry analyses on transparent minerals (garnet, quartz, and calcite) from each stage to elucidate the physicochemical conditions, including temperature, salinity, pressure, and depth, as well as the geochemical properties of the ore-forming fluids. Furthermore, we investigate the origin of these fluids using hydrogen and oxygen isotopes. The findings of our research contribute significantly to a more comprehensive understanding of the genesis of skarn deposits in the Luxi district, particularly with regard to the evolution of ore-forming fluid.

2. Geological Setting

The NCC is the largest and oldest craton in China (Figure 1a) with a vast extent covering approximately 1.5 million km2 [22]. It comprises Archean cores dating back to around 3.8 Ga ago [23,24,25]. The NCC is bounded by several significant orogenic belts, including the Central Asian Orogenic Belt (CAOB) in the north and the Su-Lu and Qinling-Dabie Orogenic Belts in the south (Figure 1a; [26]). The basement of the NCC can be divided into the western block and the eastern block (Figure 1a). These blocks amalgamated and collided along the Trans-North China Orogen at ~1.85 Ga ago [27]. Following this tectonic event, the NCC experienced a period of relative stability until the late Mesozoic. However, during this period, a significant process known as decratonization occurred, involving substantial lithospheric thinning and extensive lithosphere replacement [28,29,30].
Located in the eastern part of the NCC, Shandong Province is separable into two distinct regions by the Tan–Lu fault zone, namely the Luxi Block and the Jiaodong Peninsula (Figure 1b). To the east and west of the Luxi Block lie the Tan–Lu and Liaokao faults, respectively (Figure 1b) [31,32,33]. It is composed of a Precambrian crystalline basement, Phanerozoic sedimentary cover, and Mesozoic magmatic rocks (Figure 1b) [5,33]. The Precambrian crystalline basement mainly comprises the Mesoarchean Yishui group, Neoarchaean Taishan group (amphibolite and biotite granulite with minor TTG gneisses [34,35]), and Paleoproterozoic granitoids [36,37]. Following the decratonization of the NCC, the Luxi district transitioned to a stable marine sedimentary environment [38,39]. The Neoproterozoic Tumen group formed in the vicinity of the Tan–Lu fault zone while extensive Paleozoic strata consisting of carbonate, shale, and clastic rocks are widely exposed in the Luxi district [15,33,40]. During the Mesozoic, with the decratonization of the NCC, the Luxi district underwent a process of fault basin formation, terrestrial volcanic-sedimentary rock construction, and intrusive rock emplacement [33,41,42] overlain by Cenozoic strata.
Figure 1. (a). Simplified geological map of the North China Craton (modified after Zhao et al. [27]); (b) Simplified geological map of the Luxi district marking the major gold-related and iron deposits (modified after Deng et al. [40]). Deposits: 1-Tiezhai Au deposit; 2-Jinxingtou Au–Cu deposit; 3-Yi’nan Jinchang Au deposit; 4-Yi’nan Tongjing Au deposit; 5-Qibaoshan Au–Cu deposit; 6-Zhuojiazhuang Au–Te deposit; 7-Mofanggou Au–Te deposit; 8-Guilaizhuang Au–Te deposit; 9-Lifangou Au–Te deposit; 10-Longbaoshan Au–REE deposit.
Minerals 13 01348 g001
The Luxi district is distinguished by numerous, although relatively smaller-scale, Mesozoic intrusive occurrences that display clear tectonic influences [11]. In the early Jurassic, a series of crust-derived granites and alkaline rocks were generated in the extensional stage after the collision of the Yangtze Craton and the NCC [38]. This process is exemplified by the Tongshi complex (ca. 185–180 Ma; [43]) within the Luxi district. During the early Cretaceous, there was a shift in the direction of subduction of the paleo-Pacific plate, resulting in significant magmatic and tectonic activities [44]. Within the Luxi district, this is primarily represented by rock bodies such as Ji’nan, Yi’nan, Tietonggou, and Jinling, consisting mainly of gabbro, gabbro-diorite, and diorite [11]. These rock formations are known to be favorable for the formation of iron and gold deposits [45,46,47,48].

3. Deposit Geology

The Yi’nan Tongjing Au–Cu deposit (E118°28′03″–118°28′50″ and N35°35′20″–35°36′12″) is situated 65 km north of Linyi City in Luxi district (Figure 1b). The stratigraphy of the Tongjing ore district primarily consists of the Neoarchaean Taishan group, Neoproterozoic Tumen group, and Cambrian sequences (Figure 2 and Figure 3a). The Taishan group is overlain by the Tumen group (Tongjiazhuang formation) in an unconformable contact (Figure 3a) and both are concealed strata [15]. The Tongjiazhuang formation is composed of alternating layers of sandstone and shale with thin-bedded limestone exhibiting localized skarnization (Figure 3a). The ore district extensively exposes the Cambrian sequences (Changqing and Jiulong groups) which serve as the primary host rocks for mineralization (Figure 2 and Figure 3a; [49]). The Changqing group (Zhushadong and Mantou formations) and Jiulong group (Zhangxia and Gushan formations) consist mainly of sandstone and shale intercalated with thick-bedded dolomite and (dolomitic) limestone (Figure 3a; [15]). These strata extend in a NW–SE (300°) direction and dip 10–30° SW [5]. Major structures include NNE-, NW-, and SN-trending faults (Figure 2) affected by the Tan–Lu fault. The NNE-trending faults strike 10–40° and incline to the northwest at angles of 62–80° whilst the NW-trending faults strike 300–345° and incline to the southwest at angles of 65–85° [15]. The NNE-trending faults intersect the NW-trending faults, characterized by multi-stage activities [5], and the magmatic intrusion (e.g., Tongjing intrusive complex) formed at the intersections of these fault sets [5]. The Tongjing complex comprises pyroxene/quartz diorite and hornblende/quartz diorite porphyry, primarily distributed in the eastern part of the ore district (Figure 2) and formed during the early Cretaceous (136–126 Ma; [11,12,13,19,50]). The Tongjing deposit consists of six ore segments: Shanzijian, Gongquan, Jinlong, Gongquandong, Duijinshan, and Tonghanzhuang (Figure 2). These mineralized segments are predominantly located within the contact zone between the Tongjing complex and Proterozoic to Cambrian sequences (Figure 3a).
Numerous significant ore bodies were discovered within the contact zone where carbonate strata intersect with diorite porphyry, particularly in areas of structural weakness such as unconformities and fracture/slip zones between layers. These ore bodies also occur in the internal and external regions of cis-layered diorite porphyry (Figure 3a; [5]). The spatial distribution of these ore bodies exhibits a circular pattern surrounding the intrusive rocks [5]. The ore body is lenticular and layered (Figure 3b) with lengths of 15–240 m along strike and 12–210 m along dip and a thickness of 0.5–25 m [5,15]. However, it should be noted that individual ore bodies are typically of a limited scale (Figure 3b). For example, the No. T001 ore body is characterized by its layered occurrence near the contact zone between diorite porphyry and marl of the Tongjiazhuang group. The ore body strikes nearly E–W and dips at 0–8° to the south [5]. It has a length of 195 m along the strike and 92 m along the dip and a thickness of 0.93–4.61 m. The average grades of Au and Cu in the ore body are 1.64 g/t and 0.35%, respectively [5].
Figure 2. Geological map of the Yi’nan Tongjing gold–copper deposit (after Cai et al. [5]). The cross-section of the exploration line (b-b’) is shown in Figure 3b.
Minerals 13 01348 g002
Figure 3. (a). Schematic diagram of the occurrence of ore bodies in the Yi’nan gold–copper deposit (after Gu et al. [16]); (b). Geological cross-section along exploration line 12 of the Jinlong ore segment (after Cai et al. [5]).
Minerals 13 01348 g003
According to field and petrographic observations, the Tongjing deposit has undergone three stages: (I) thermal metamorphism, (II) prograde alteration, and (III) retrograde alteration (Figure 4 and Figure 5). The intrusion of magma caused thermal effects that resulted in the metamorphic recrystallization (I) of impure carbonate units, including shale, sandstone, siltstone, and limestone. This recrystallization process led to the formation of (calc-silicate) hornfels or marble (Figure 4a,h,i), with minimal to no significant introduction of chemical constituents. The hornfels exhibit an extremely fine-grained texture and primarily consist of minerals such as pyroxene, garnet, and biotite while simultaneously preserving the original sedimentary textures, such as laminations or bedding (Figure 4h,i).
During the prograde alteration stage (II), a large-scale exchange of components between magmatic and carbonate rocks occurred at high temperatures. This process resulted in the deposition of anhydrous garnet, diopside, and wollastonite, termed early skarn. These skarn minerals are predominantly present in striped, massive, and scarce precursor forms within the Au–Cu ore or ore body (Figure 4c,d). As the retrograde alteration stage (III) followed at consecutively lower temperatures, it involved introduction of components in an aqueous phase from both magma and sedimentary strata. Stage III is further subdivided into four sub-stages: late skarn (III-1), oxide (III-2), sulfide (III-3), and late quartz–calcite (III-4). The late skarn sub-stage (III-1) is characterized by the occurrence of epidote, tremolite, actinolite, and magnetite which are widely distributed in strips or veins (Figure 4a,g). The gap between magnetite particles is filled by late hematite, chalcopyrite, sphalerite, and calcite (Figure 5d). Additionally, the oxide sub-stage (III-2) is predominantly characterized by the presence of banded and lumpy hematite and specularite, which are scarce relics within Au–Cu ores (Figure 4c,d) and scarce relics in Au–Cu ores (Figure 4f,h). Moreover, it is primarily acicular (Figure 5b) and cut the skarn in veinlets (Figure 4d).
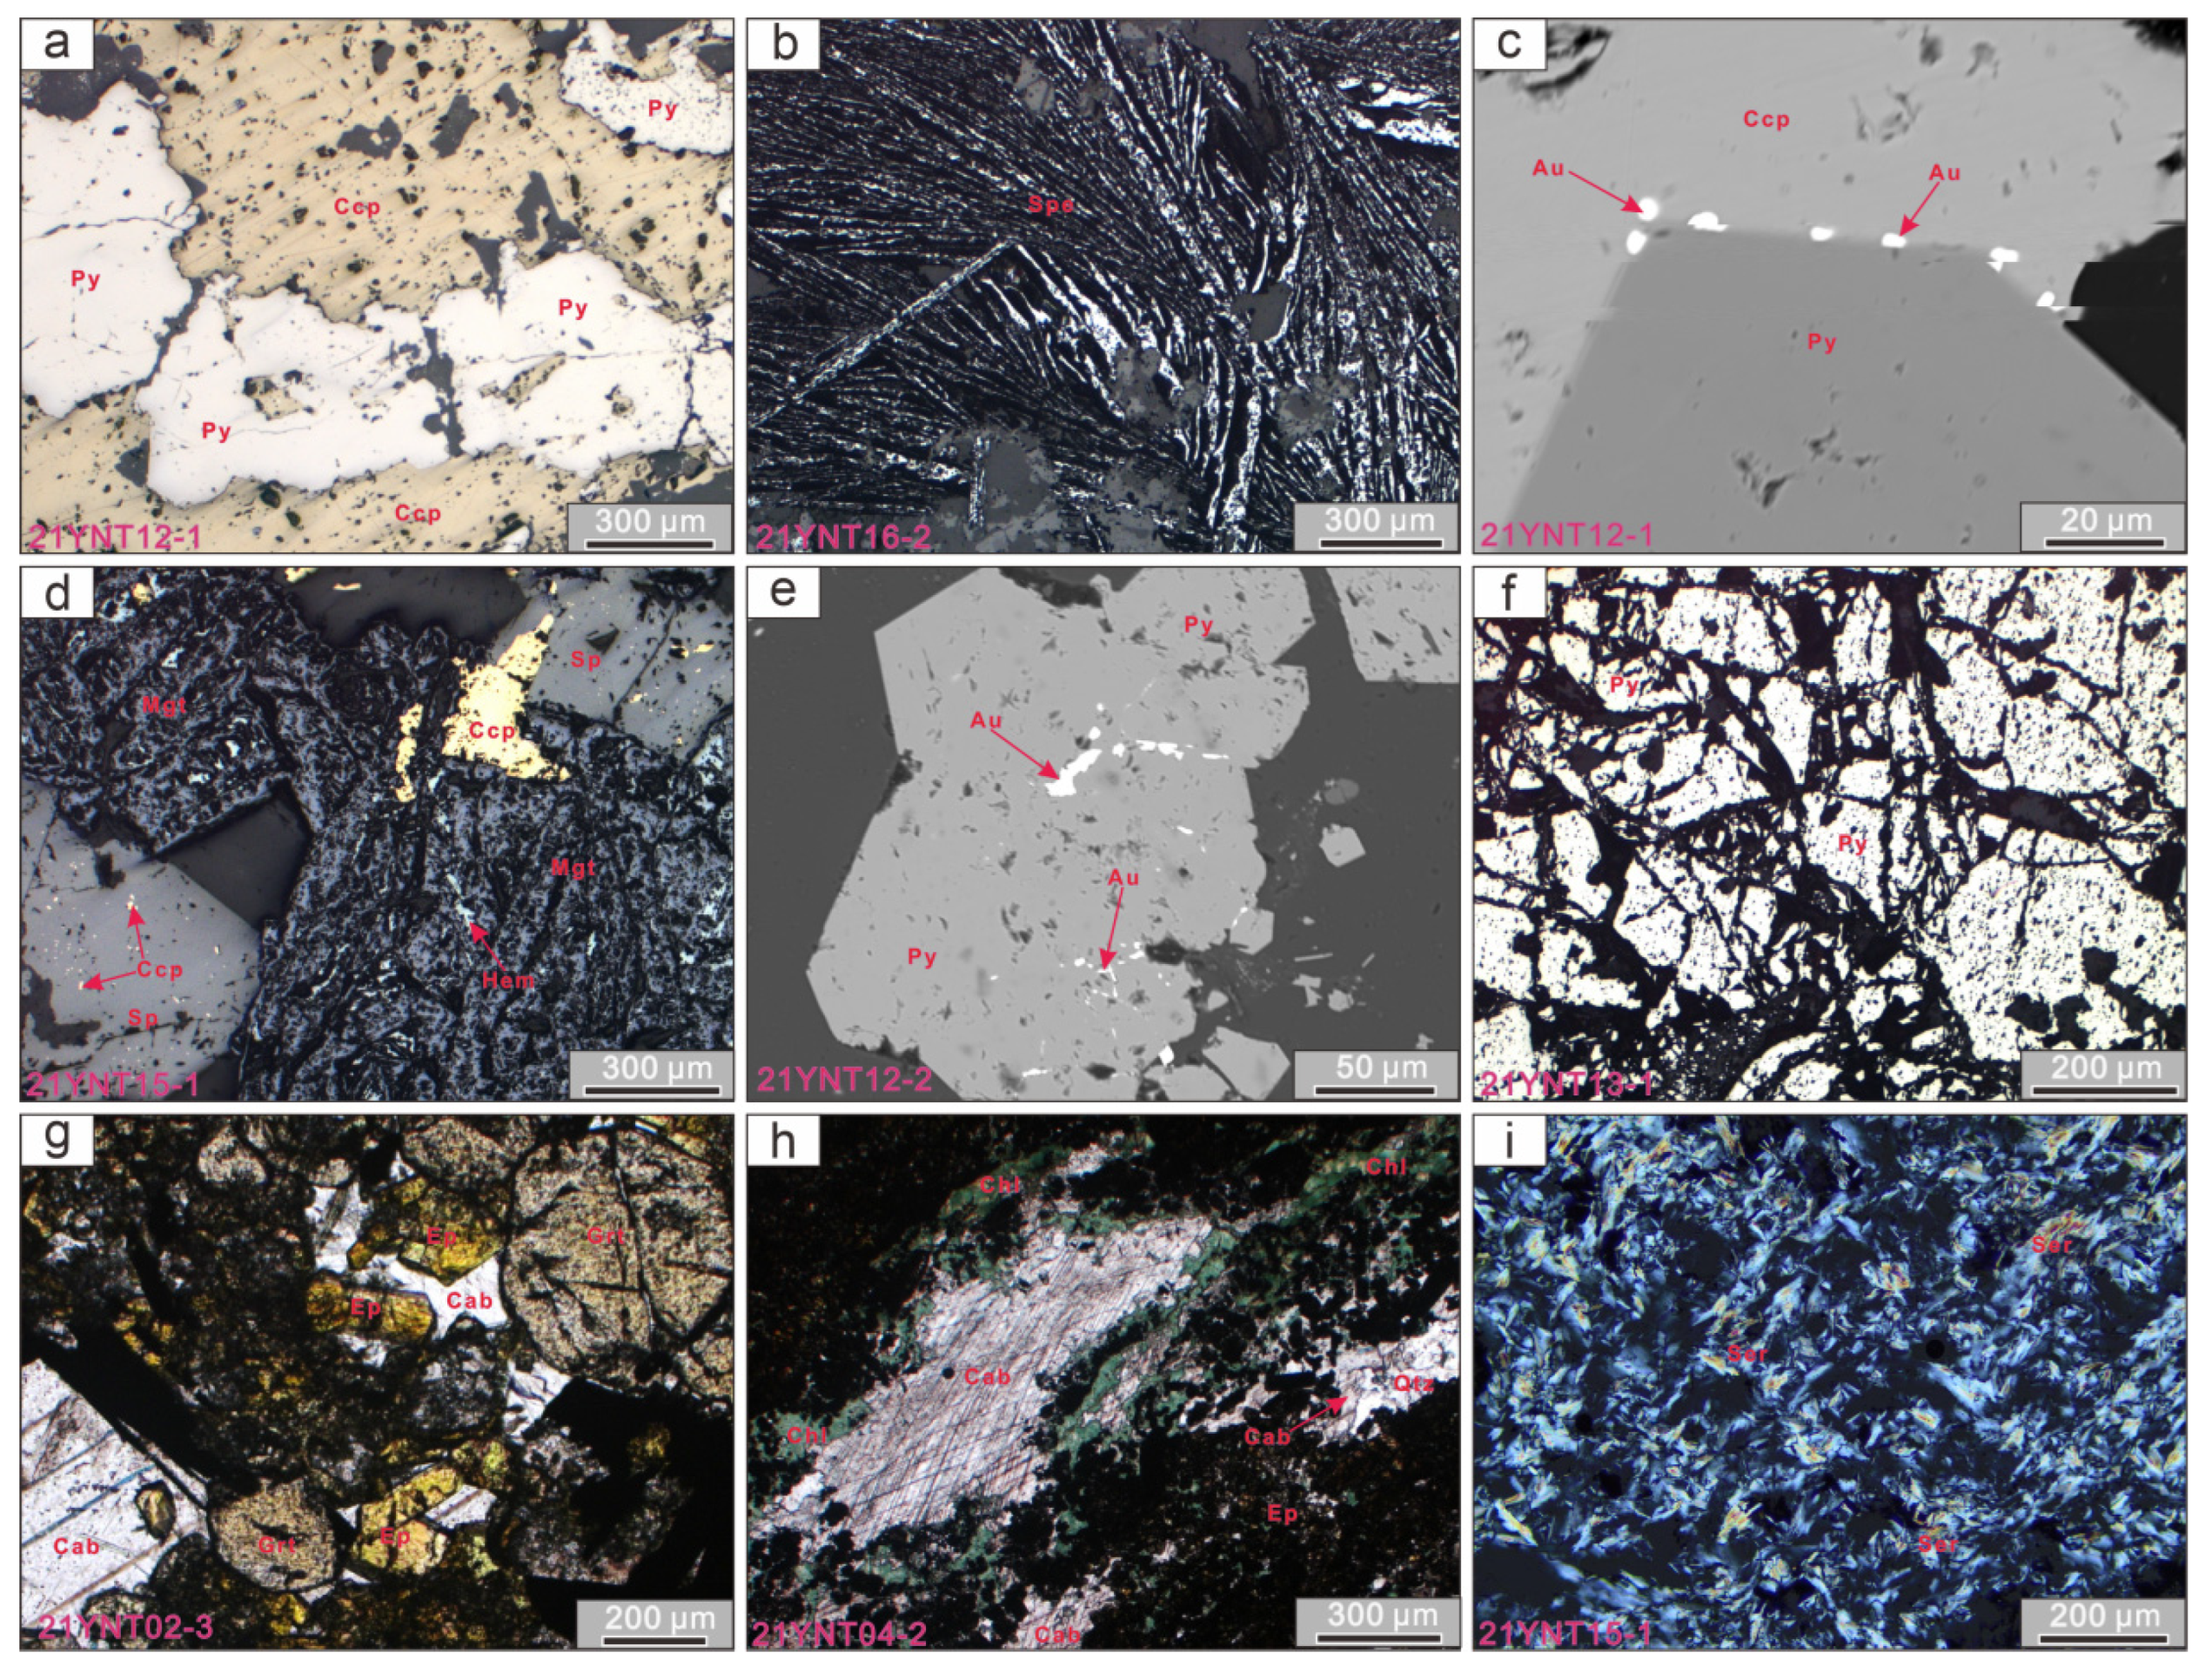
The sulfide sub-stage (III-3) is distinguished by the significant presence of pyrite and chalcopyrite along with minor sphalerite and bornite (Figure 5a,c–f). These minerals usually occur in massive, banded, and striped forms, replacing hornfels and skarn (Figure 4b,f–h) or cutting through strata in pyrite–quartz veins (Figure 4e). The gangue minerals in III-3 sub-stage consist of chlorite, quartz, sericite, and calcite (Figure 5g–i). Gold–Cu mineralization mainly occurs in this sub-stage where native gold is closely, spatially, and genetically related to chalcopyrite and pyrite. Gold is found encapsulated within pyrite and chalcopyrite in either granular or irregular shapes (Figure 5e). It primarily occurs along the edges of well-formed pyrite crystals (Figure 5c) or within quartz veins. The quartz–calcite veins (III-4) are characterized by the scarcity of sulfides which cut early hornfels, skarn, and Au–Cu ores (Figure 4b,f,i).

4. Samples and Analytical Methods

During a field geological investigation, a total of 22 samples (21YNT01 to 21YNT22) were collected from the Jinlong ore segment −526 m level and the Gongquandong ore segment −180 m level. Subsequent geochemical characterization of ore-forming fluids was performed on a total of 23 doubly polished thin sections with thicknesses ranging from 50 to 100 μm. Additionally, 13 samples were selected for hydrogen and oxygen isotope analysis.

4.1. Fluid Inclusions

Petrographic examination and microthermometric analyses of fluid inclusions in garnet (stage II), quartz (stage III-3 and III-4), and calcite (stage III-4) were carried out at the Laboratory of Geological Fluid, Jilin University, Changchun, China. Representative fluid inclusions (assemblage) were selected for microthermometric analyses on a Linkam THMS-600 heating–freezing stage. The temperature range for analysis varied from −195 to 600 °C. Heating and freezing rates were 1–5 °C/min, decreasing to 0.1 °C/min as the phase transition approached. The temperature is measured with an accuracy of ±0.2 °C during freezing and ±2 °C during heating. Ice-melting temperatures (Tm, ice), halite dissolution temperatures (Tm, d), and total homogenization temperatures (Th) were measured and salinities are expressed as weight percent NaCl equivalent (wt% NaCl eqv.).

4.2. Hydrogen and Oxygen Isotopic Analyses

A total of 15 quartz and calcite samples were selected for hydrogen and oxygen isotopic analyses at the Beijing GeoAnalysis Co. Ltd., China, using a Finnigan MAT253 mass spectrometer. The samples were crushed to a 40–60 mesh (H-isotope analysis) and 200 mesh (O-isotope analysis) and then dried in an oven at 90 °C and 105 °C for 12 h, respectively. The dried samples for hydrogen isotopic analysis were placed into a Thermo Scientific FlashEA Elemental Analyzer at 1420 °C to decrepitate the fluid inclusions and loaded into the mass spectrometry in pure helium [51]. The oxygen was extracted through a BrF5 reaction under vacuum and high-temperature (580 °C) conditions and then collected by a 5 Å molecular sieve sample tube [52]. The analytical precision was ±0.2‰ and ±1‰ for δ18O and δD, respectively.

5. Results

5.1. Fluid Inclusions

5.1.1. Fluid Inclusion Petrography

In Tongjing, the identification of primary, pseudosecondary, and secondary fluid inclusions (FIs) was carried out employing the classification criteria outlined by Roedder [53]. For the purposes of this study, our analysis focused solely on primary FIs that were observed in isolated grains or along growth zones. Based on the phases observed at room temperature (~25 °C) and their behavior during microthermometric analysis, three distinct types of primary FIs were identified (Table S1; Figure 6).
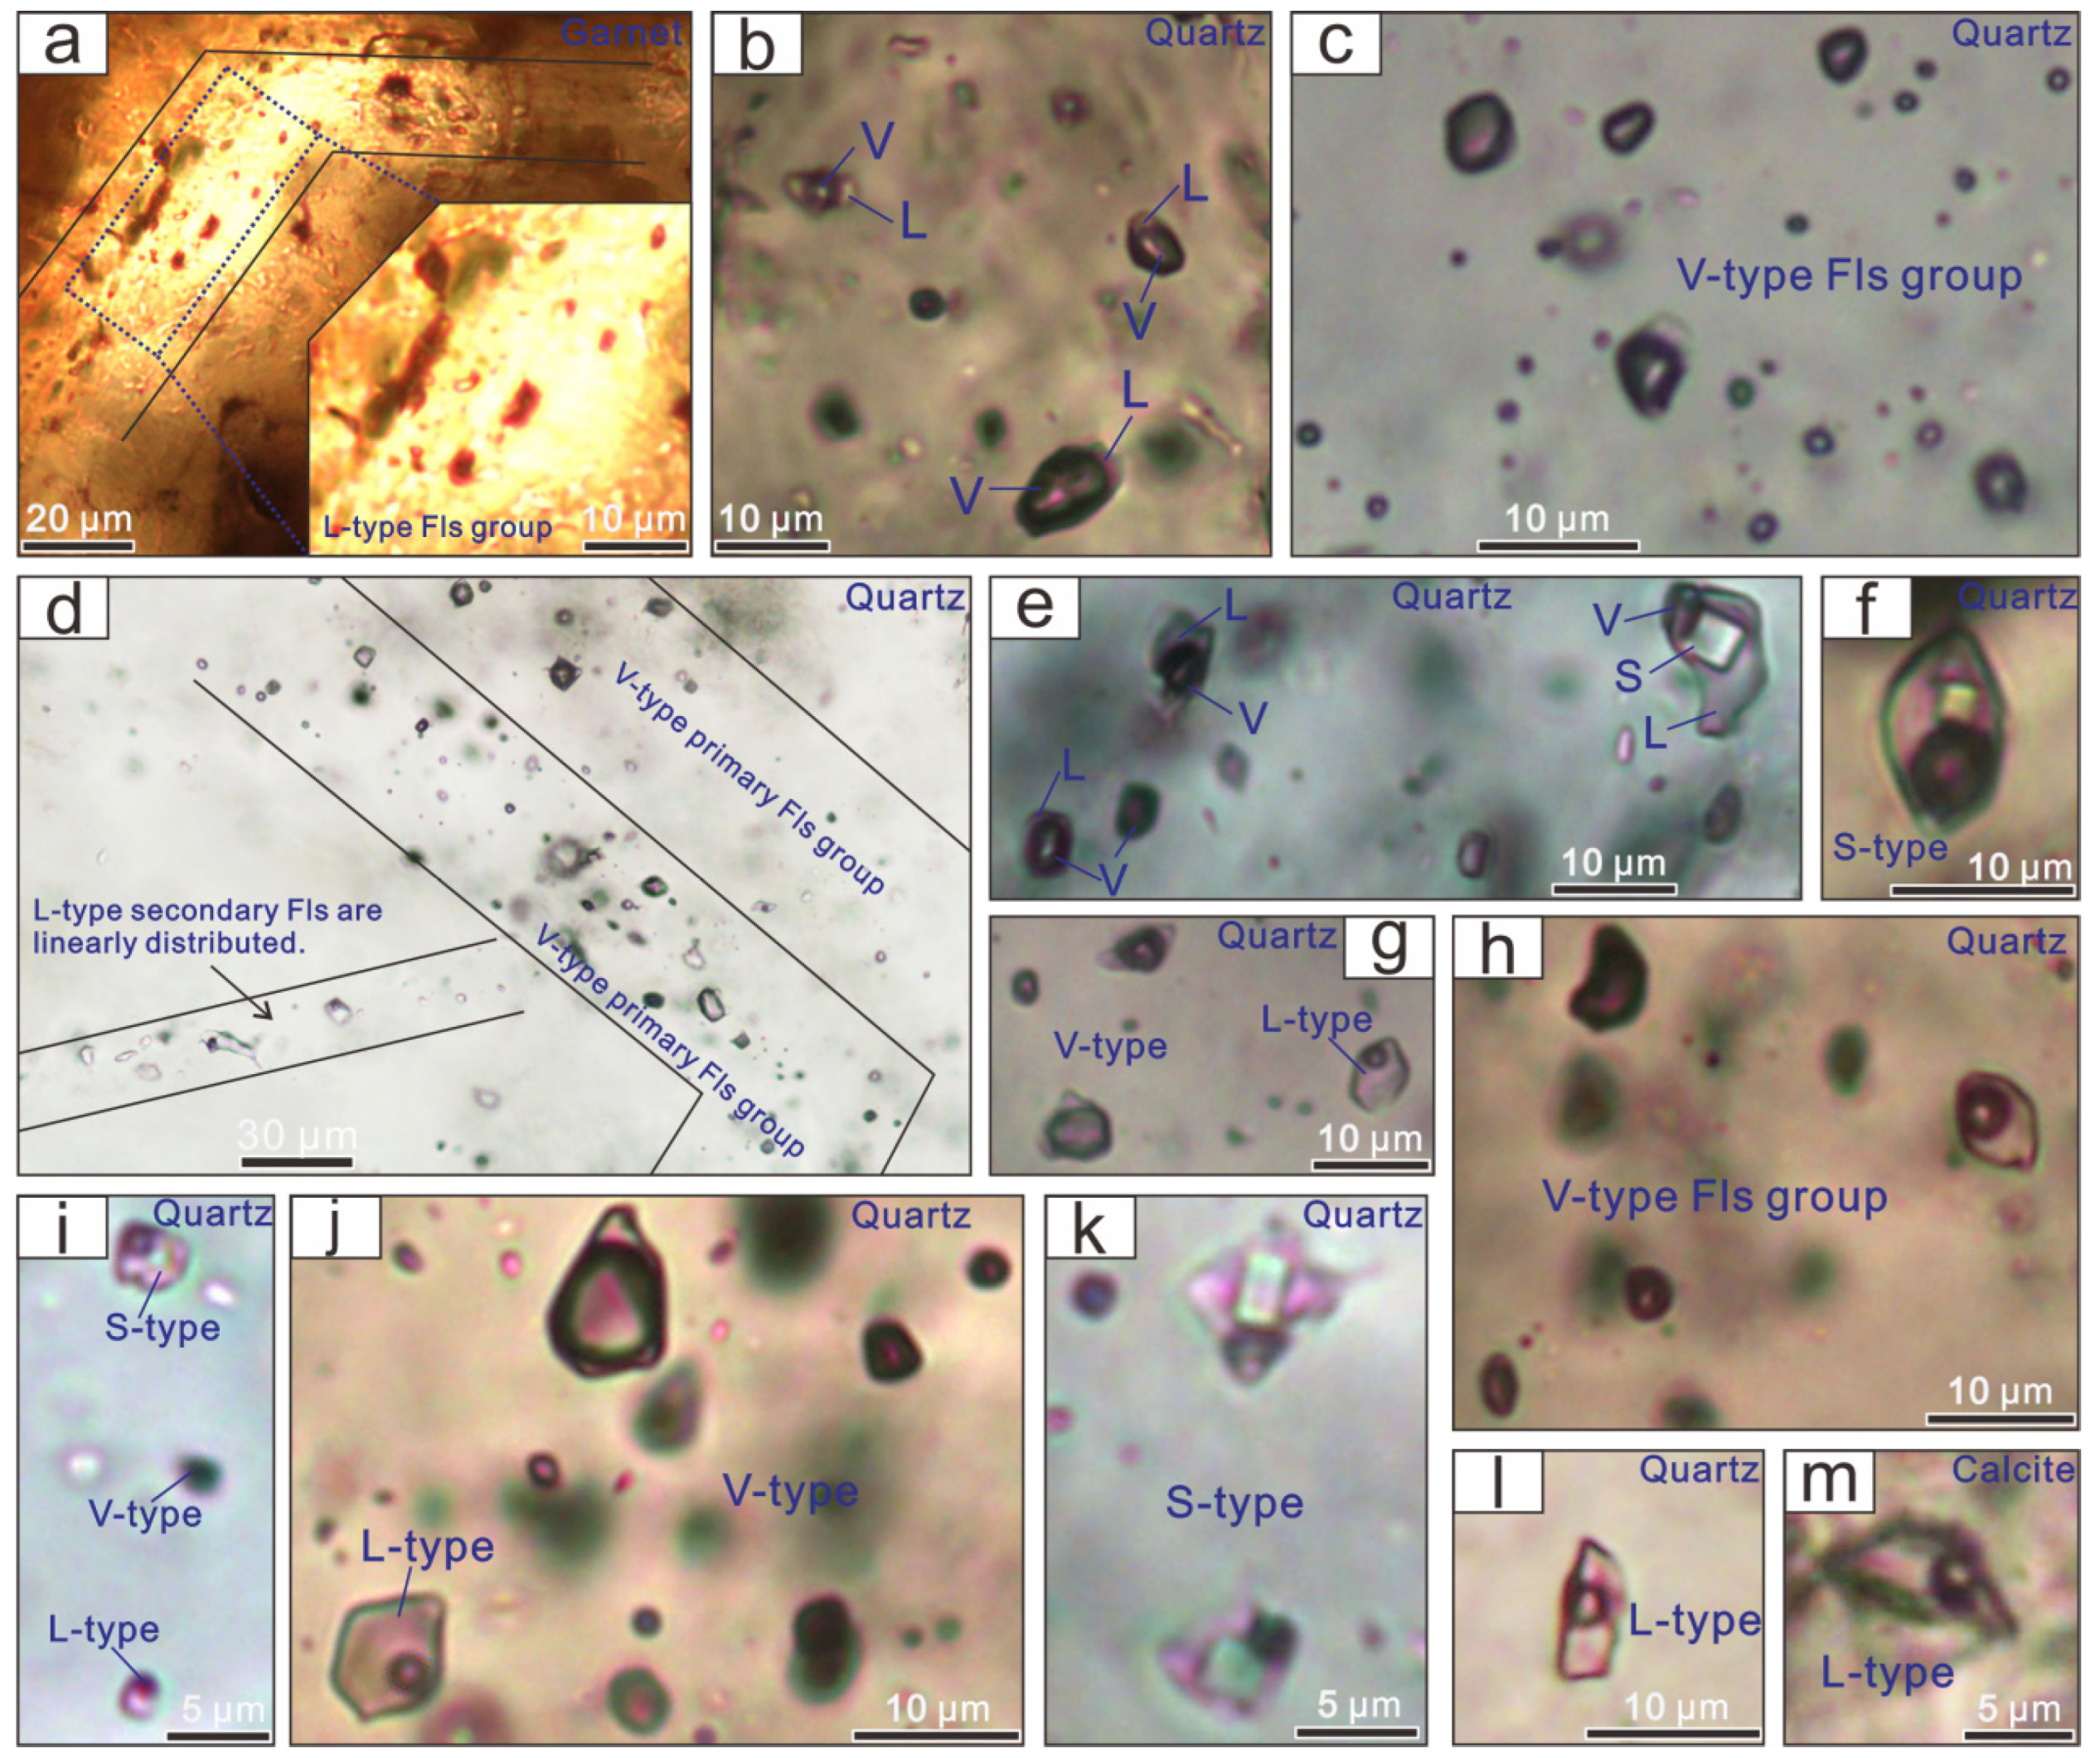
Liquid-rich two-phase aqueous FIs (L-type; Figure 6) have a VH2O/(VH2O + LH2O) water volume ratio of <50 vol% and homogenize to the liquid (mainly hosted in ganet, quartz, and calcite). These FIs vary from <5 to 20 μm in size (Figure 6a,e,g,I,j,l,m) and generally have ellipsoidal, elongate, or irregular shapes. The growth zone of garnet (Figure 6a) reveals the occurrence of L-type Fls which coexist alongside V-type and S-type FIs within quartz (Figure 6e,i).
Vapor-rich two-phase aqueous FIs (V-type; Figure 6) have a vapor water volume of up to 55–95% and homogenize to the vapor (mainly hosted in quartz). These FIs are typically spherical and elliptical-shaped with a diameter of 6–20 μm (Figure 6b–d,h). They are generally clustered in the growth zones of sub-stage III-3 quartz (Figure 6d) and coexist with L-type and S-type FIs as boiling FI assemblages (Figure 6e,i).
Halite-bearing multi-phase FIs (S-type; Figure 6) contain brine liquid, a vapor bubble, and one cubic halite at room temperature (mainly hosted in quartz). They exhibit ellipsoidal, irregular, or negative crystal shapes and generally have a diameter of 5–25 μm with the vapor volume percentage 5–40% (Figure 6e,f,i,k). They are commonly clustered and isolated in the growth zones of sub-stage III-3 quartz.

5.1.2. Fluid Inclusion Microthermometry

The microthermometric results are presented in Table S1 and Figure 7. The salinities were estimated using the final melting temperatures of ice in L-type and V-type FIs following the methodology of Bodnar [54]. As for S-type FIs, we employed the methodology developed by Bodnar and Vityk [55] to evaluate the corresponding salinities.
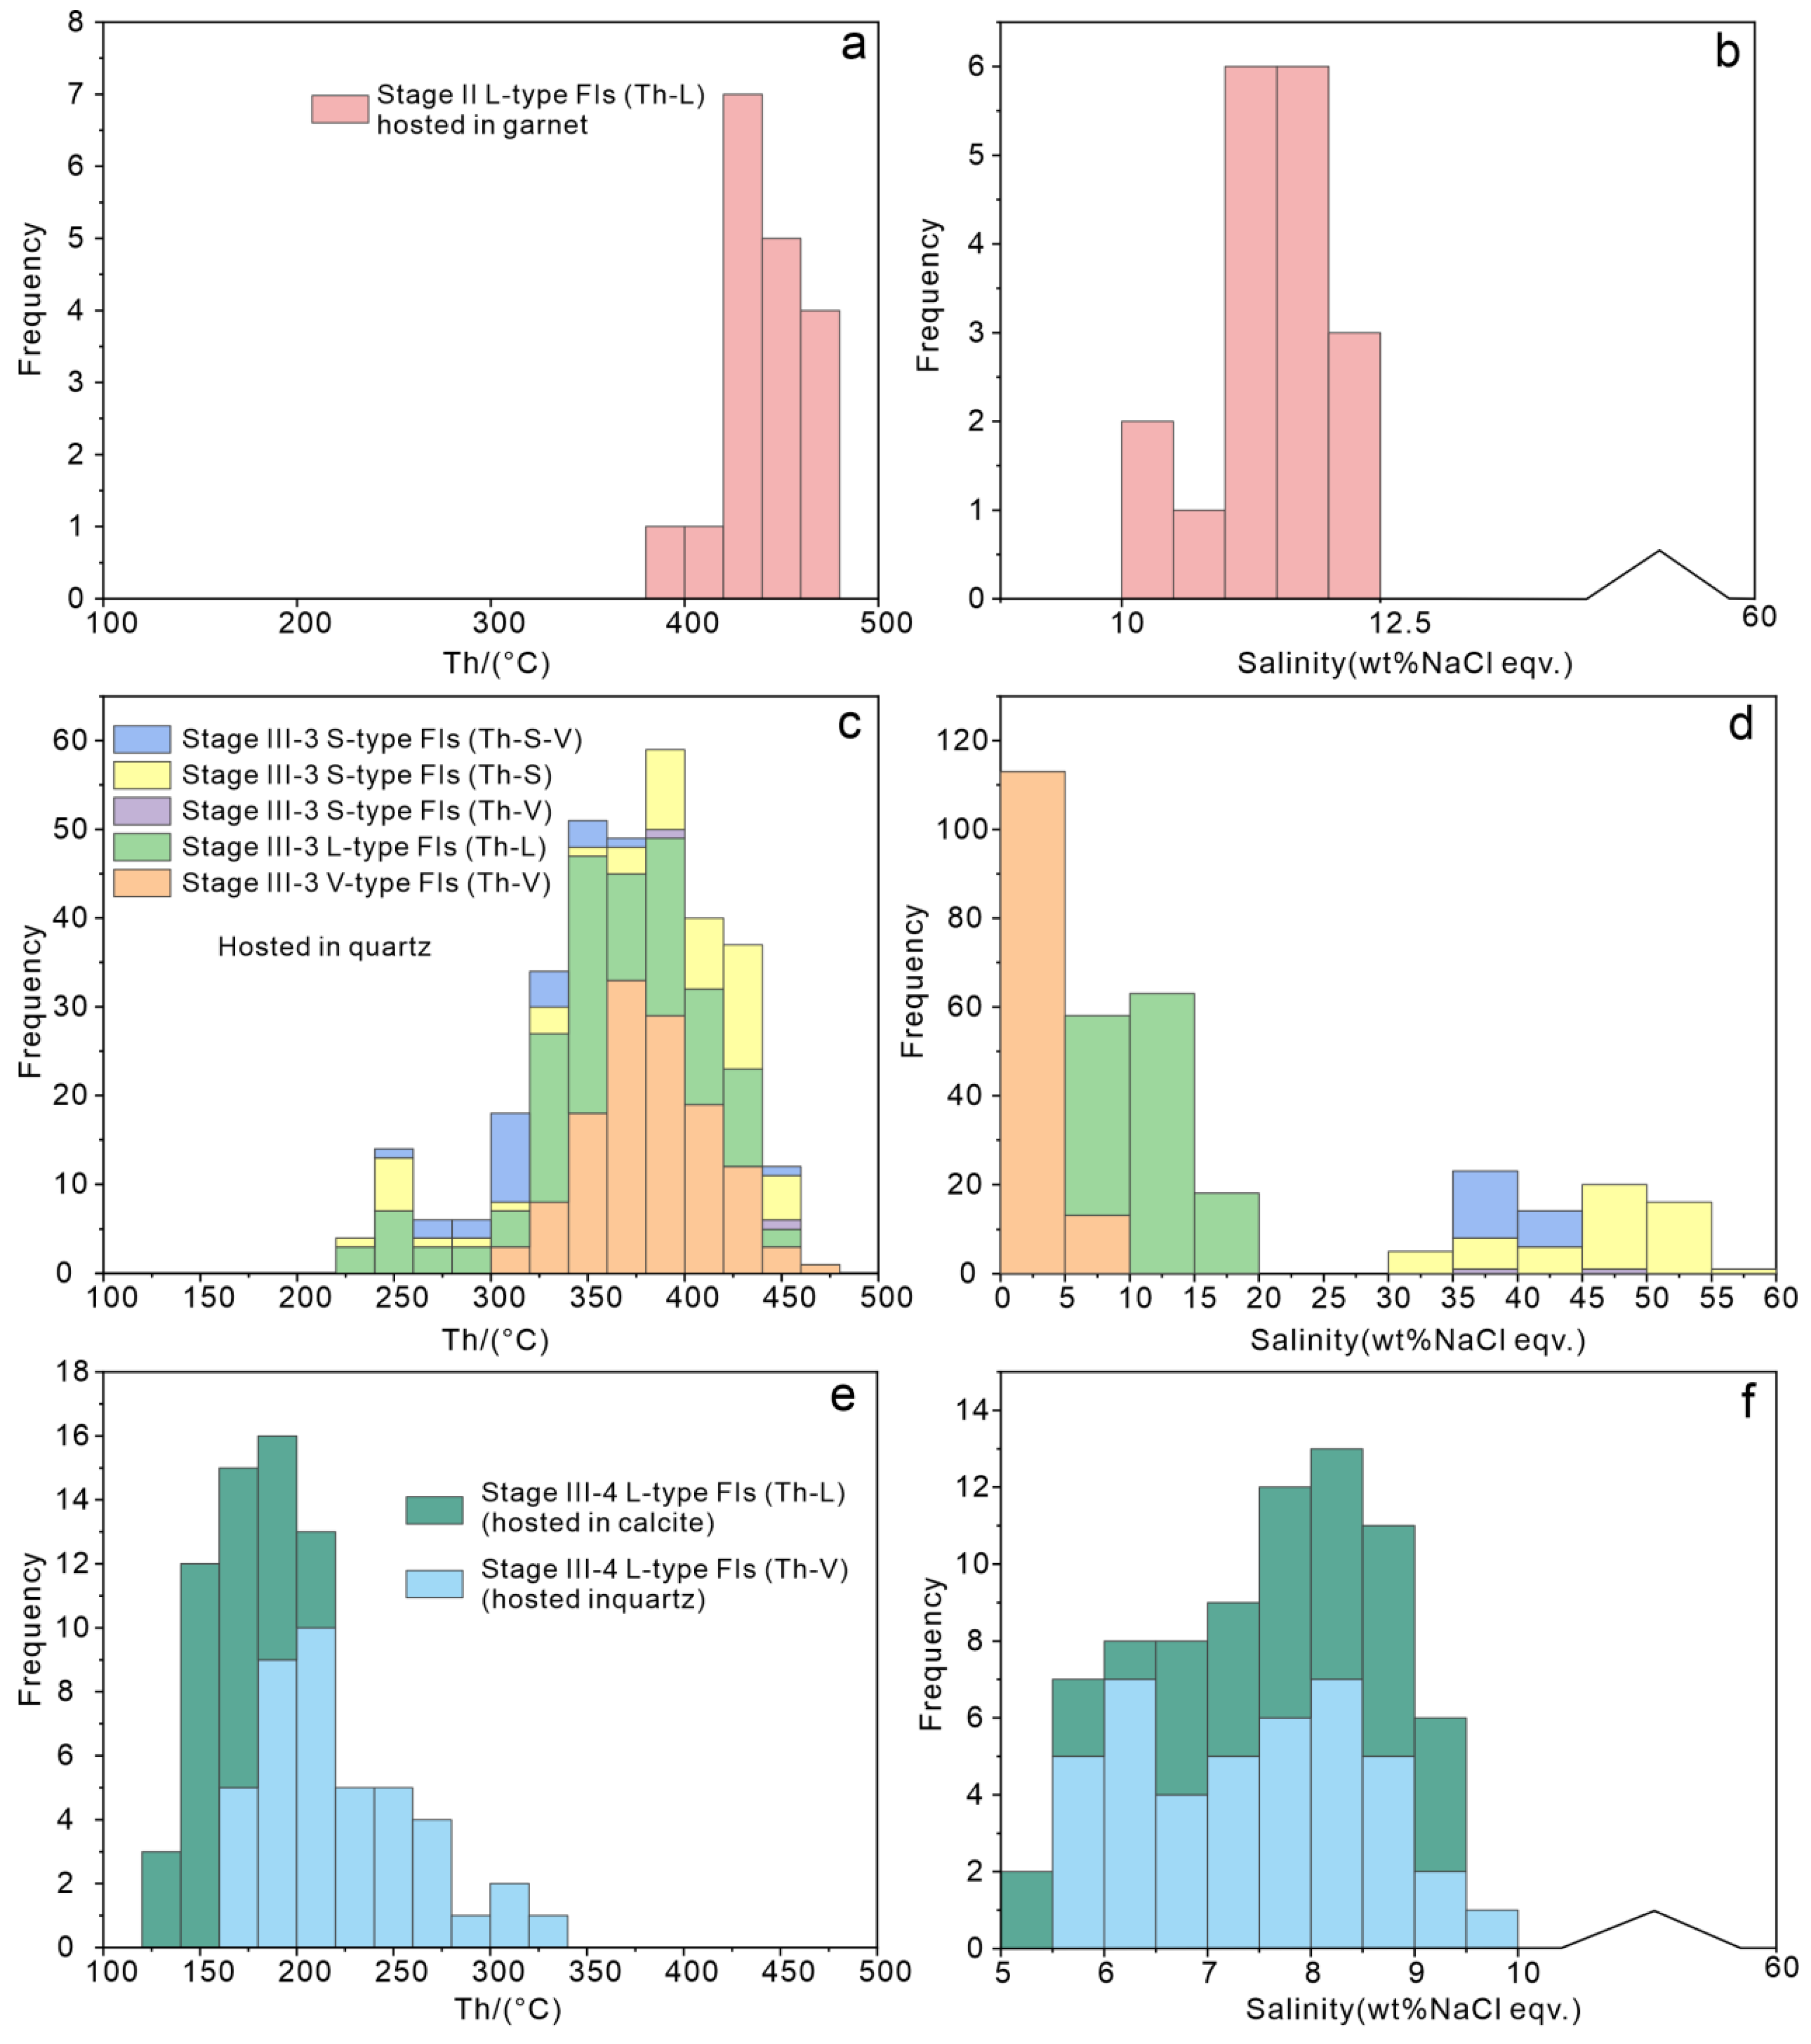
Stage II: Only L-type FIs were observed and homogenized to the liquid phase at temperatures (Th-v) of 388–474 °C. The FIs found in garnet are primarily randomly distributed along oscillation zones. The frequency peak of these FIs occurred at temperatures between 430–457 °C, based on the first to third quartiles (Figure 7a; Table S1). They yielded Tm-ice values of −8.6 to −6.9 °C corresponding to salinities of 10.4 to 12.4 wt% NaCl eqv. (Figure 7b).
Sub-stage III-3: L-type, V-type, and S-type FIs exhibit an isolated or clustered distribution in quartz crystals (Table S1). The L-type FIs (homogenized to liquid phase) have Tm-ice values of −13.2 to −4.2 °C, salinities of 6.7–17.2 wt% NaCl eqv., and Th-v values of 239–445 °C (frequency maximum at 335–395 °C, first to third quartiles) (Table S1; Figure 7c,d).
Isolated or clustered V-type FIs undergo homogenization into a vapor phase within a temperature range of 313 to 465 °C (concentrated at 362–407 °C, first to third quartiles) (Table S1; Figure 7c). They have Tm-ice = −3.5 to −1.5 °C and salinity = 2.6–5.7 wt% NaCl eqv. (Figure 7d).
There are three homogenization modes for randomly distributed S-type FIs: vapor disappearance prior to daughter minerals (mainly), daughter minerals disappearance prior to vapor (rare), and simultaneous disappearance of both (minor). The vapor disappears at temperatures of 95 to 447 °C and they are completely homogenized at temperatures from 231 to 465 °C (Table S1). The halite daughter minerals dissolved at temperatures of 232 to 452 °C (concentrated at 313–423 °C, first to third quartiles) (Table S1; Figure 7c), corresponding to salinities of 33.6 to 59.8 wt% NaCl eqv. (concentrated at 39.2–49.5 wt% NaCl eqv.) (Figure 7d).
Sub-stage III-4: Only L-type FIs with an isolated distribution were observed within quartz and calcite crystals (Figure 6l, m) and they exhibited homogenization into a liquid phase (Table S1). The L-type FIs exhibited Tm-ice values ranging from −6.4 to −3.2 °C and calculated salinities of 5.3–9.7 wt% NaCl eqv. (Figure 7f). Furthermore, they underwent homogenization into a liquid phase at Th-v within the range of 131–320 °C, with a frequency maximum between 166–215 °C (first to third quartiles) (Table S1; Figure 7e).

5.2. Hydrogen and Oxygen Isotopic Analysis

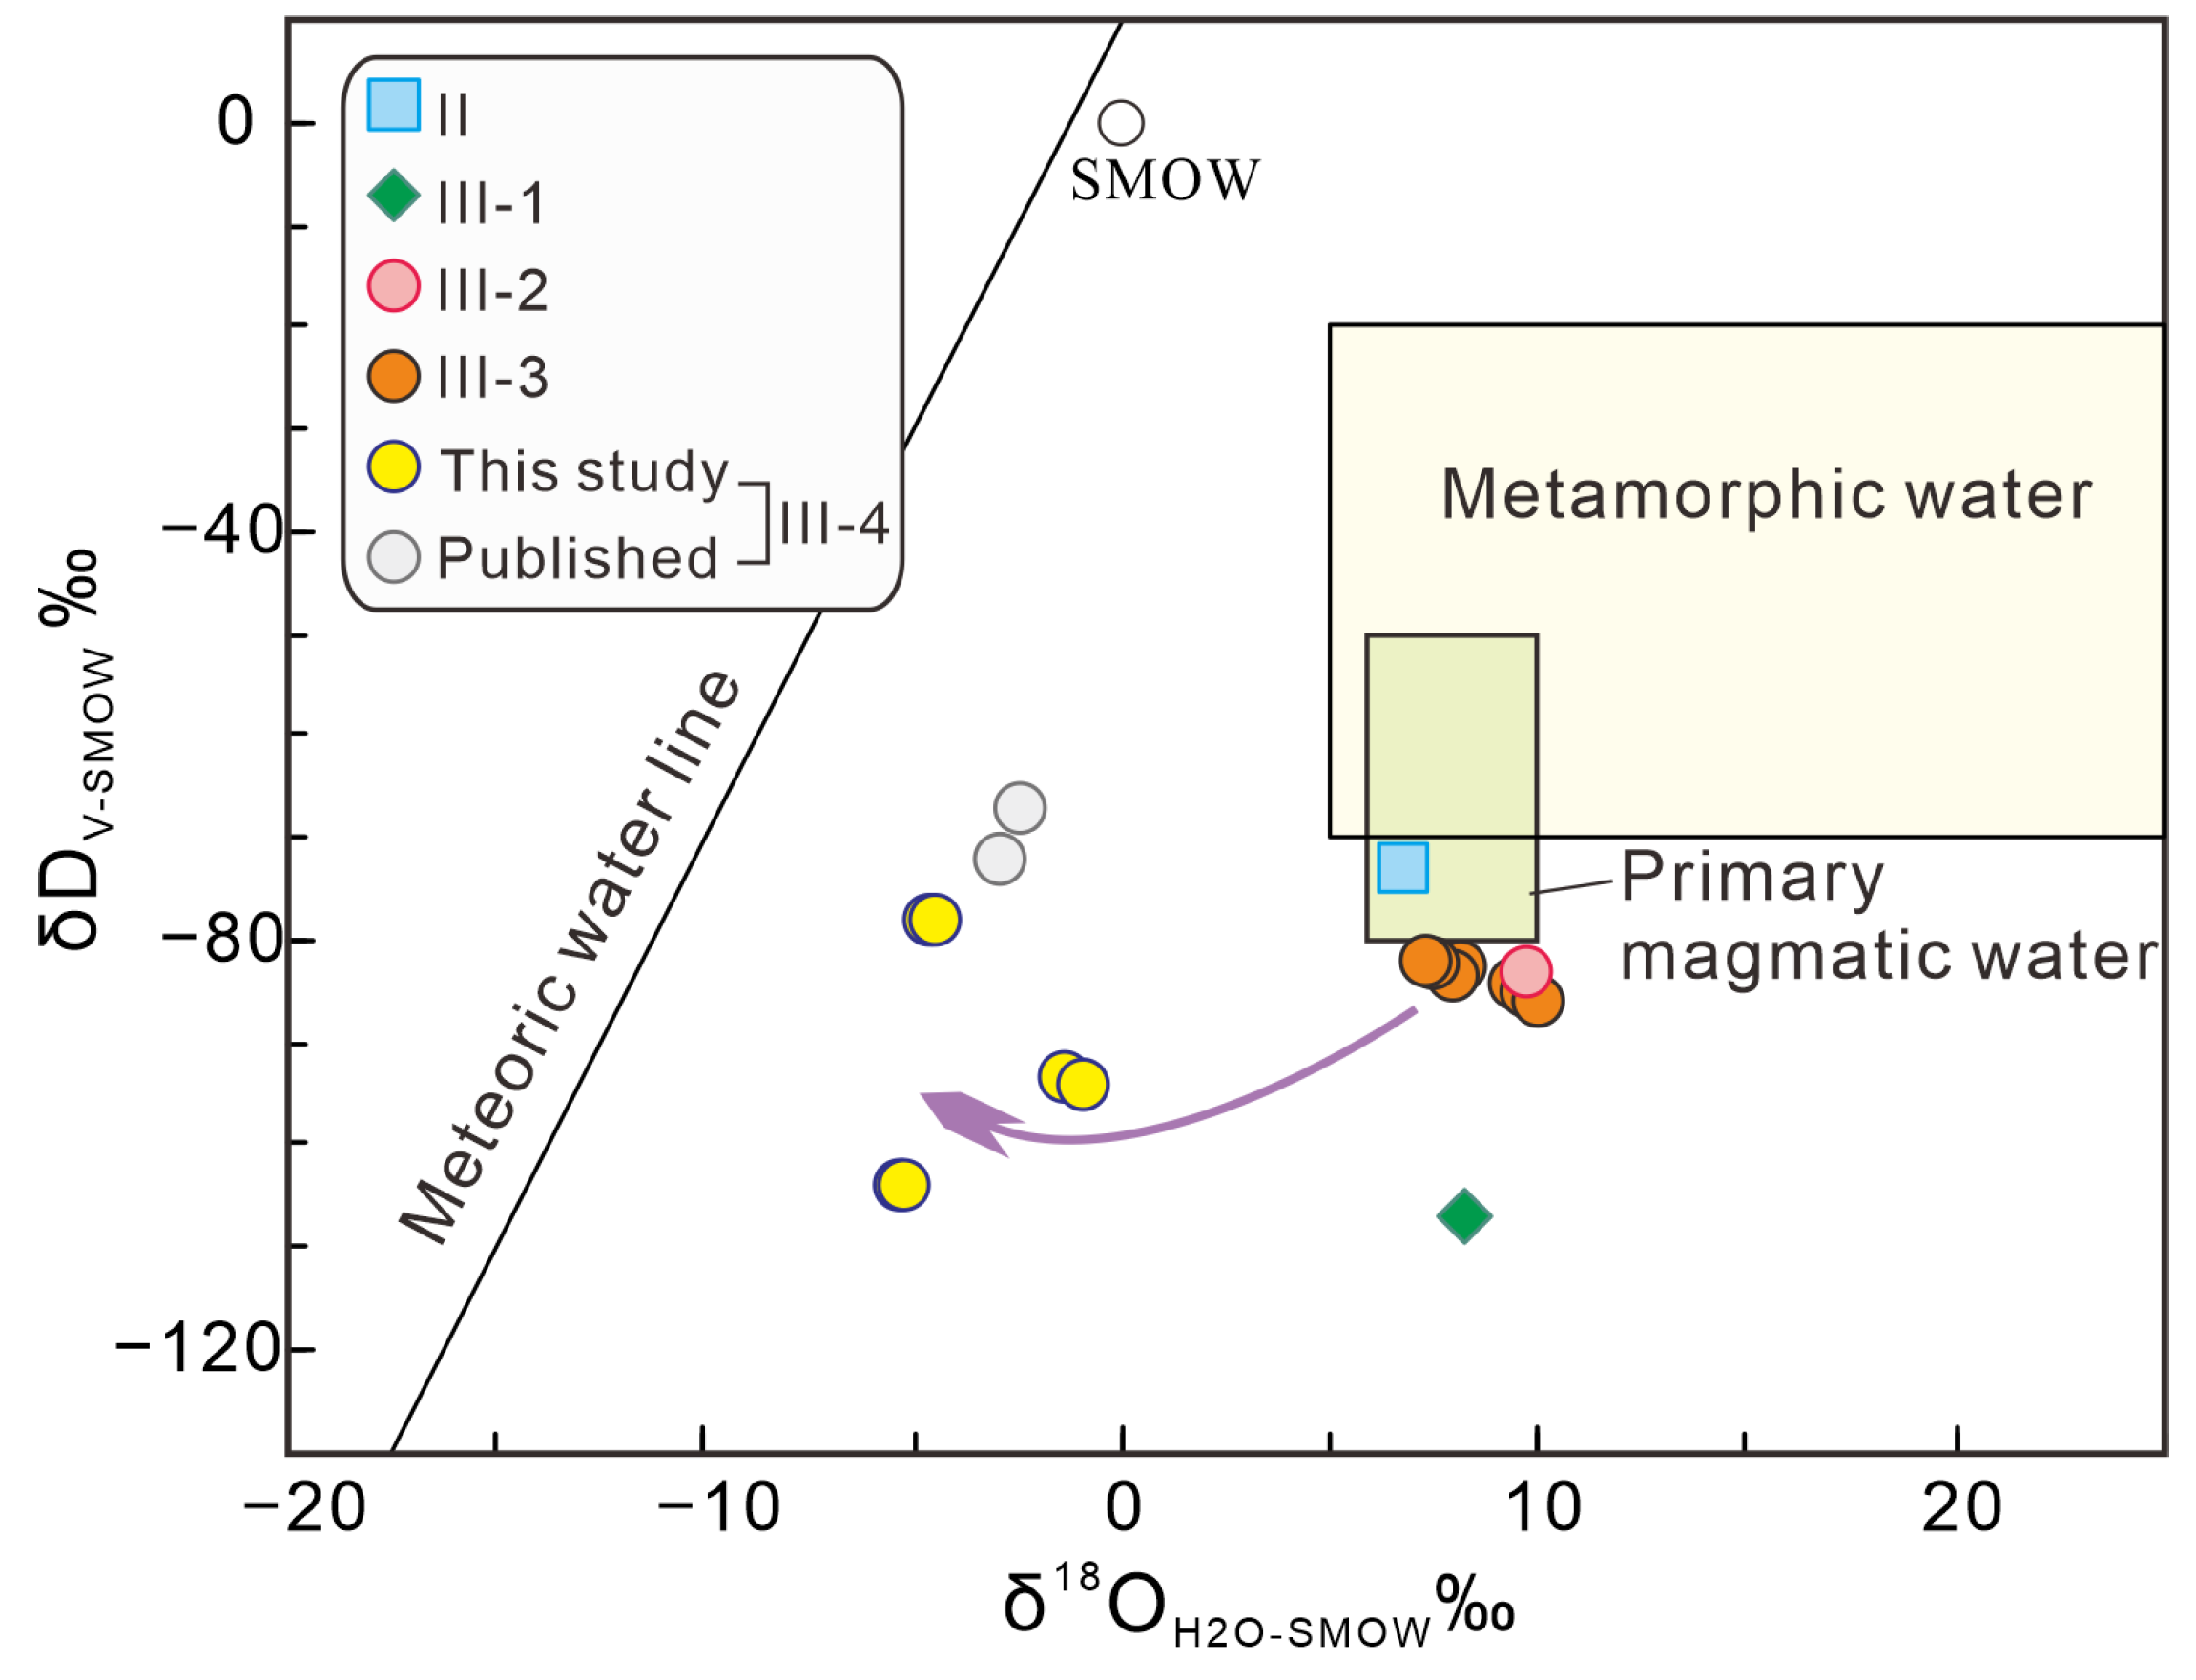
The oxygen and hydrogen isotopic data are listed in Table S2 and plotted in Figure 8. Seven quartz samples have δ18OV-SMOW = 10.92 to 13.64‰ and δDV-SMOW = −85.8 to −81.9‰ and six calcite samples have δ18OV-SMOW = 11.57 to 15.98‰ and δDV-SMOW = −103.8 to −77.9‰. The δ18OH2O values were calculated using the following two equations: 1000 lnαQtz-H2O = 3.38 × 10⁶/T2 – 3.40 (Clayton et al. [52]) and 1000 lnαCal-H2O = 2.78 × 10⁶/T2 – 3.39 (O’Neil et al. [56]) where T = average temperature of FIs from the different sub-stages. The calculated δ18OH2O = 7.32 to 10.03‰ (in quartz sample) and −5.30 to −0.90‰ (in calcite sample).

6. Discussion

6.1. Fluid Nature and Depth Estimation

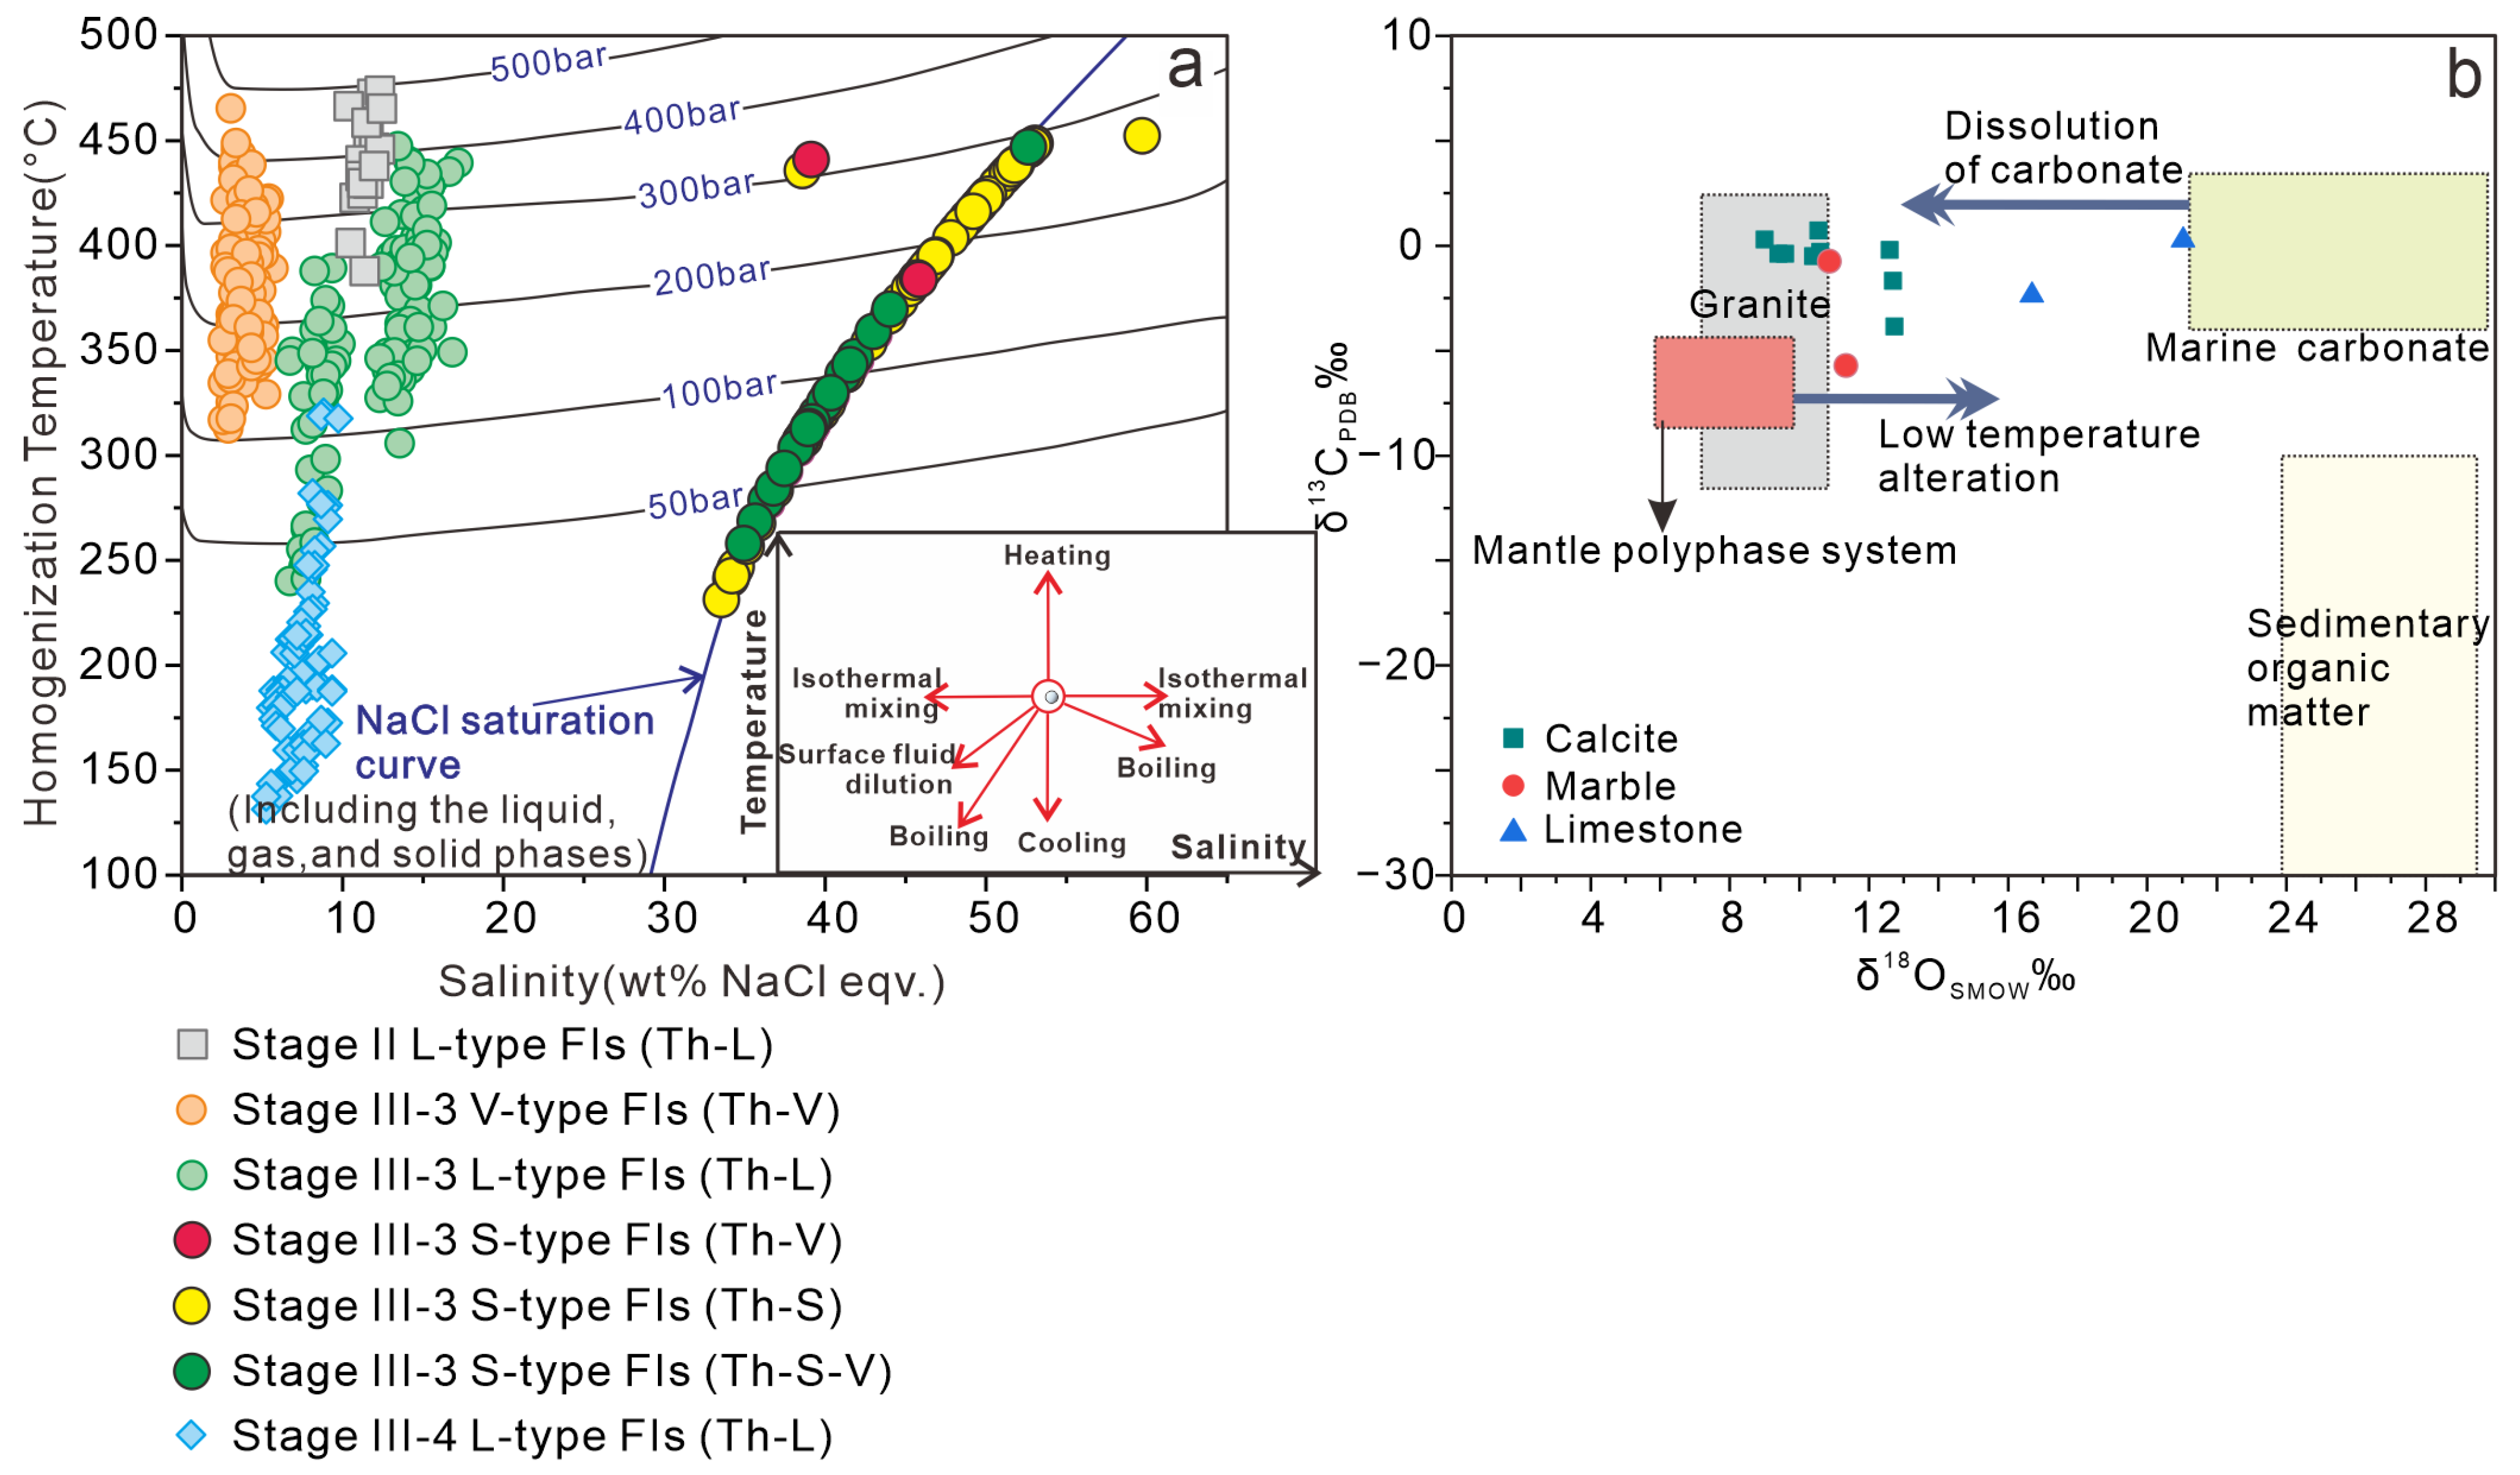
In the pre-ore stage II, the garnet contained exclusively L-type Fls. These Fls displayed a concentrate homogeneous temperature range of 430–457 °C and a salinity of 10.4–12.4 wt% NaCl eqv. (Table S1; Figure 7a,b). These observations strongly suggests that the early ore-forming fluid was a single-phase fluid distinguished by elevated temperature and medium salinity in the NaCl–H2O system (Figure 9a). In the syn-ore sub-stage III-3, L-, V-, and S-types Fls emerged in identical quartz grains (Figure 6e,i). L-type and S-type Fls showed homogeneity in the liquid phase while V-type Fls exhibited homogeneity in the gas phase (Figure 9a). Such variation implies that these Fls were trapped from a heterogeneous fluid source, as previous studies suggested [58,59]. Despite their distinct homogenization behaviors, the concentration range for homogenization temperature (341–406 °C; Table S1) remained relatively steadfast. This indicates that the ore-forming fluid underwent boiling [60], as illustrated in Figure 9a, and suggests a change in its physical and chemical properties, including temperature, pressure, and oxygen fugacity [61]. Consequently, gold and copper were discharged from the fluid during this process [3,62]. During the post-ore sub-stage, only L-type FIs were observed (Figure 6l,m). These Fls had a homogenization temperature range of 166–215 °C and a salinity of 5.3–9.7 wt% NaCl eqv. These results suggest that the late-stage ore-forming fluid was a NaCl–H2O system which was characterized by medium-low temperatures and low salinity (Figure 9a).
Within the Au mineralization sub-stage (III-3), a notable fluid boiling occurred (Figure 9a), establishing a close correspondence between the trapping temperatures and homogenization temperatures [65]. This correlation enables us to estimate the trapping pressures [66]. However, the absence of evidence for boiling during stages II and III-4 restricts us to estimating only the minimum trapping temperature and pressure of the fluid. In Tongjing, the ore-forming fluid can be described as a relatively simple NaCl–H2O system. To estimate the minimum trapping pressure, we utilized the HOKIE_FLINCS_H2O-NACL spreadsheet developed by Steele-MacInnis et al. [67]. During the pre-ore (II) stage, the trapping pressure was predominantly within the range of 342–428 bar (Figure 9a). Assuming lithostatic pressure with a rock density of 2.7 g/cm3, this corresponds to a minimum formation depth of 1.27 km. However, considering hydrostatic pressure, the minimum formation depth would be 3.42 km. For the Au mineralization (III-3) sub-stage, the trapping pressure is mainly concentrated between 133 and 250 bar (Figure 9a). Under hydrostatic pressure, this indicates a depth range of 1.33–2.50 km for the formation of Au mineralization. In the post-ore sub-stage (III-4), the trapping pressure exhibits significant drops to values below 50 bar (Figure 9a). This signifies the minimum capture pressure during this specific sub-stage according to Roedder and Bodnar [65].

6.2. Source of Ore-Forming Fluids and Materials

The hydrogen and oxygen isotope compositions of garnet samples from stage II fall within the range of the primary magmatic water, as depicted in Figure 8 and outlined in Table S2. This indicates typical magmatic sources consistent with previous research [3,57,62,68]. The δ18OH2O values of sub-stages III-1, III-2, and III-3 range from 7.32‰ to 9.74‰ (excluding 11.6‰ and 10.03‰; Table S2), which falls within the typical range of δ18OH2O values for primary magma water (5.5‰ to 10‰; Taylor, [57]). However, the δD values (−107‰ to −81.9‰; Table S2) are lower than those of the primary magmatic water (−50‰ to −85‰; Barnes [69]). Therefore, the δD and δ18O values of these three sub-stages in Tongjing are observed to lie below the box representing the compositions of primitive magmatic water in Figure 8.
Magma degassing, the water–rock reaction, and mixing of meteoric water can all contribute to a decrease in δD values [70,71,72]. Previous research has revealed that certain δ13CPDB and δ18OSMOW values of the hydrothermal calcite fall within the range represented by granite (Figure 9b) while others fall between the granite and marine carbonate rocks (Figure 9b; [15,49]). This suggests that the carbon primarily originated from magma but underwent interaction with water and rocks. Consequently, there is a slight deviation in the δ13CPDB and δ18OSMOW values towards the wall rocks (marine carbonatites) (Figure 9b). The interaction between the ore-forming fluid and marine carbonate rocks (with δ18O values of 20–30‰; Figure 9b) led to an increase in δ18OH2O values and a decrease in the δD values of the fluid [73].
Furthermore, it has been demonstrated through previous investigations that the process of magma degassing, specifically Rayleigh fractionation, plays a significant role in causing a substantial reduction in δD (up to 80%) within the remaining water, while δ18O values exhibit relatively little change [62,74,75]. Therefore, it becomes evident that neither water–rock interaction nor magma degassing alone can adequately account for the observed variations in the δ18OH2O and δD values of ore-forming fluids. Additionally, the presence of meteoric water not only contributes to a decrease in the δD value of the ore-forming fluid but also leads to a noticeable decrease in its δ18OH2O value [72]. Consequently, the combined influence of the water–rock interaction and the mixing of meteoric water serves as a potential explanation for the minimal changes in the δ18OH2O value of the ore-forming fluids during the three sub-stages (III-1, III-2, and III-3). Furthermore, the δD value falls below the typical range associated with magmatic water although this does not negate the possibility of magma degassing occurring.
The significant shift in δ18O (from −5.3‰ to −0.9‰) and δD (from −103.8‰ to −67‰) values observed for sub-stage III-4 towards the meteoric water line (Table S2; Figure 8) signals a considerable contribution from meteoric water, implying an open-system mineralization system. Notably, the ore-forming fluid during the later part of sub-stage III-4 exhibited low temperatures and low salinity (Table S1, Figure 7e,f), resulting in a NaCl–H2O system. As the temperature and pressure of the fluid system continued to decrease, quartz and carbonates were precipitated from such fluids (Figure 5g,h).
The pyrite in the Tongjing deposit has undergone He–Ar isotope analysis, as conducted by Liu et al. [49] and Zhu et al. [21], yielding crucial insights into the composition of the ore-forming fluid. The investigation revealed that the 3He/4He ratio falls within the range of 0.11–1.11 Ra, indicating a distribution between crustal fluids (0.01–0.05 Ra) and a transitional range between crustal and mantle fluids (6–9 Ra) consistent with previous studies by Simmons et al. [76], Stuart et al. [77], and Hu et al. [78]. Furthermore, the 40Ar/36Ar ratio in the ore-forming fluid falls within the range of 364 to 826 [21,49], surpassing meteoric water values (295.5) but lower than those of mantle fluids (>40,000), as indicated by Burnard et al. [79]. These findings suggest that the ore-forming fluid in the Tongjing exhibits characteristics of a mixture between crustal and mantle fluids. Therefore, it can be inferred that the initial ore-forming fluid in the Tongjing originated predominantly from magma. As mineralization progressed, water–rock interaction and the mixing of meteoric water occurred, resulting in the formation of a fluid with a combination of both crustal and mantle origins.
In accordance with previous investigations, the sulfur isotopic distribution range of metal sulfides within the Tongjing deposit falls between −1.73 and 4.27‰, with a concentration between 0.28‰ and 1.2‰ and an average value of 0.9‰ [5,20,49,80]. This isotopic composition strongly suggests a magmatic source (δ34S = −3 to 3‰; [81,82]). Importantly, it should be highlighted that individual sulfur values exceeding 4‰ may potentially signify a minor contribution of marine carbonate derived from the wall-rock, wherein δ34S could reach up to ~30‰ according to Hoefs [83]. Concerning the Pb isotope composition of metal sulfides in the Tongjing deposit, it follows a linear distribution pattern primarily falling between the mantle curve and the upper crust curve [5,20,49,80]. This observation implies that the materials involved in the formation of the ore deposit originate from a mixed source combining both crustal and mantle components. Additionally, the Pb isotope composition overlaps with that of the diorite porphyry [5], indicating contributions from both Tongjing complex and carbonate strata in the ore-forming materials. These results consistently support the findings obtained from sulfur isotope analysis.

6.3. Ore Genesis

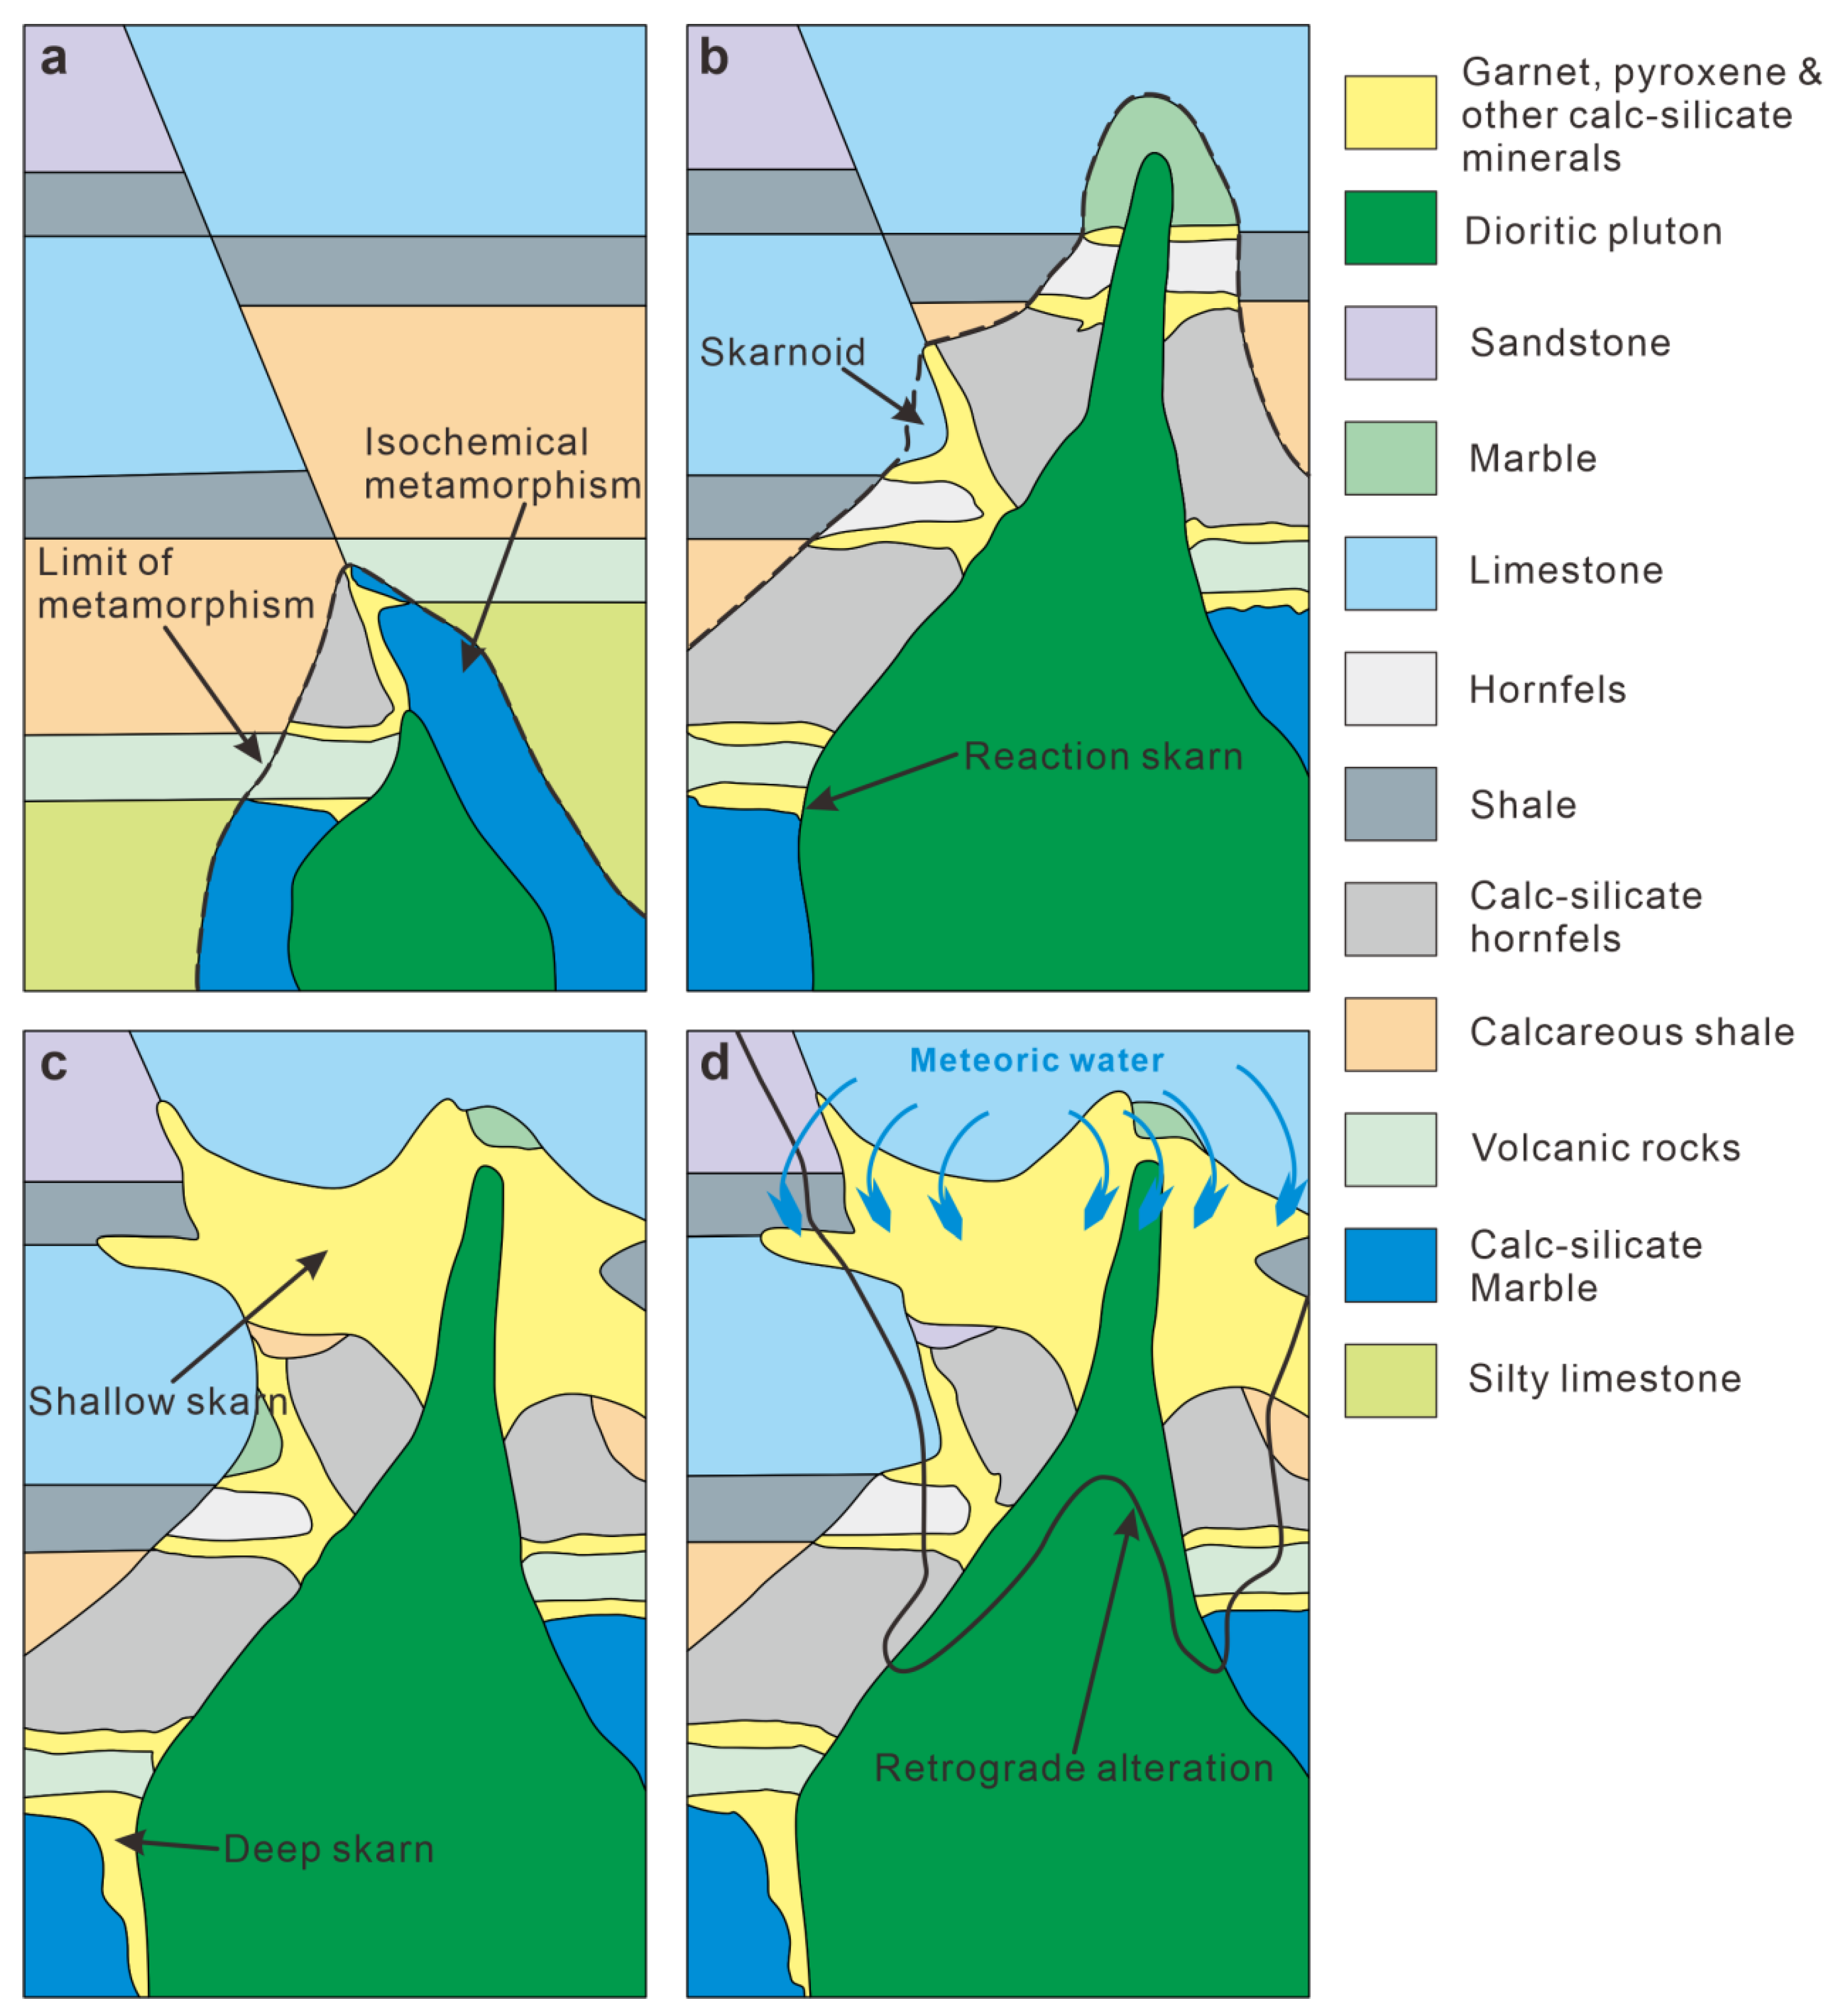
During the early Cretaceous, the Tongjing complex assimilated and intruded into the shallow crust. Upon reaching the host rock in the Tongjing deposit, the ascent of the intrusion triggered isochemical metamorphism by producing heat [84]. Isochemical metamorphism involves recrystallization and stabilization without significant mass transfer [3]. As a result, (calc-silicate) marble and hornfels were formed (Figure 10a) while preserving the layered structure of the protolith (Figure 4h,i). Nonetheless, in impure lithologies with limited mass transfer through small-scale fluid movement, such as thinly interbedded shale and carbonate units, reaction skarns and skarnoid can form (Figure 10b; [3,84]). Skarnoid is a term that describes pale-colored and fine-grained calc-silicate rocks that have a low iron content (Figure 4f). The composition of the skarnoid is influenced by the composition of the protolith [85].
Upon reaching a depth of 4 to 5 km, the Tongjing complex underwent a state of saturation, resulting in the exsolution of the fluid and the formation of a supercritical fluid with a moderate salinity of 6 to 8 wt% NaCl eqv. [86,87,88]. As the exsolved magmatic fluid ascended, concurrent intrusions or dykes, such as hornblende diorite porphyry (Figure 2), facilitated the transfer of thermal energy to the fluid, thereby impeding a significant decrease in temperature [89]. Subsequently, at a depth of 1 to 3 km, the initial supercritical fluid experienced evolution into a single-phase fluid with a temperature of ~474 °C and a salinity of 10 to 12 wt% NaCl eqv. (Figure 9a), signifying the onset of the prograde alteration stage (Figure 10c). The skarn can exhibit either coarse-grained or fine-grained textures (Figure 5g; e.g., Burisch et al. [90]) that may not necessarily correspond closely to the composition or texture of the protolith [3]. Instead, their characteristics primarily stem from the fluid composition and infiltration pathways that influenced their formation [84]. It is generally observed that deeper skarns tend to be smaller in size compared to their shallower counterparts (Figure 10c). The elevated temperature (>400 °C) of the fluid during this stage resulted in the ductile behavior of wall-rocks [62], effectively isolating the interaction between primary magmatic water and meteoric water [91]. Consequently, the fluid during this stage exhibits characteristics typical of magmatic water (Figure 8).
As the cooling and crystallization of the magma chamber progressed, continuous exsolution and ascent of the fluid occurred, primarily along fault pathways [92]. Notably, a significant phase separation (fluid boiling) occurred when the late-stage exsolved fluid reached a depth of 1–2 km, influenced by water–rock reaction and/or fluid mixing. This process resulted in the formation of high salinity fluids (39.2–49.5 wt% NaCl eqv.) and low-density vapor (0.4–0.7 g/cm3), as illustrated in Figure 9a and Table S1. The fluids of the syn-ore sub-stage (III-3) commonly superimposed the prograde alteration skarns, particularly those situated at shallow skarns (Figure 10d). Within this sub-stage, the ore-forming system under consideration has experienced a cooling process (Figure 9a), which is evident from the homogenization temperatures falling predominantly below 400 °C (Table S1). This temperature range has a significant impact on the behavior of the host rocks, which tend to undergo fracturing and faulting rather than folding [3]. The intrusive contacts exhibit marked discordance with bedding [93], while the skarn and sulfide formations cut across the bedding and extensively replace favorable beds (Figure 4h). The shallow-level intrusions are associated with intense hydraulic fracturing, thereby greatly enhancing the permeability of the host rocks. Consequently, this promotes the migration of both magmatic and potentially later meteoric fluids, thereby augmenting the extent of water–rock interaction processes [94,95]. Fragmentation plays a crucial role in facilitating the migration of ore-forming fluids [72]. Furthermore, the pressure decrease and the infiltration of meteoric water triggered by fragmentation bring about significant modifications in the physical and chemical properties of these fluids [6,61]. Consequently, these alterations create favorable conditions for the deposition of gold and copper [3,62]. In the post-ore stage, the fluid evolution proceeded towards a low-temperature and low-salinity system, overlapping with the stages of thermal metamorphism (I), prograde alteration (II), and syn-ore formation (III-3) (Figure 4b,f,i). The Tongjing complex, together with the carbonate host rocks, plays a fundamental role as a primary reservoir for essential ore-forming constituents. Moreover, the sources of both ore-forming minerals and fluids exhibit distinct characteristics indicating crust-mantle mixing processes.
The schematic illustration in Figure 10 provides a simplified representation of the dynamic nature of the skarn Au–Cu system, showcasing only four critical stages. However, it should be emphasized that this depiction is a mere approximation of a more intricate system that involves several layers of different skarn and retrograde alteration stages, arising from multiple intrusions into the parent magma chamber, along with the presence of shallow dykes. Fluctuations in the water table caused by structural, paleosurface, and climatic changes (e.g., Simmons [96]) introduce additional complexity to these systems.

7. Conclusions

1. Three distinct stages of mineralization were identified in the Yi’nan Tongjing deposit: thermal metamorphism (I), prograde alteration (II), and retrograde alteration (III). The retrograde alteration stage can be further subdivided into four sub-stages: late skarn (III-1), oxide (III-2), sulfide (III-3), and late quartz-calcite (III-4). Notably, gold–copper mineralization is dominantly concentrated in the III-3 sub-stage;
2. Magmatic water constitutes the primary source of ore-forming fluids in the Tongjing deposit, with a minor contribution from meteoric water during the retrograde alteration stage. The ore-forming fluid demonstrates characteristics that suggest a combination of crustal and mantle fluids;
3. During the prograde alteration stage, a high-temperature and medium-salinity single-phase NaCl–H2O system developed at a depth of 1–3 km. Afterward, the ore-forming fluid underwent the process of water–rock interactions as well as the mixing of meteoric water at a depth of 1–2 km. These events played a crucial role in triggering phase separation (boiling) which, in turn, caused extensive precipitation of Au–Cu mineralization.

Supplementary Materials

The following supporting information can be downloaded at: https://www.mdpi.com/article/10.3390/min13101348/s1, Table S1: Summary of microthermometric data and calculated parameters for fluid inclusions from the Tongjing Au–Cu deposit; Table S2: Hydrogen and oxygen isotope compositions of fluid inclusions in the Tongjing Au–Cu deposit.

Author Contributions

Conceptualization, W.C.; methodology, W.C. and Z.Z.; software, X.L., M.M. and M.L.; data curation, W.C., Q.C., J.G. and Y.S.; investigation, W.C., Y.L. and Z.Z.; project administration, Z.Z. All authors have read and agreed to the published version of the manuscript.

Funding

This research was funded by the “Shandong Natural Science Foundation, grant number ZR2021QD106”, “Open Project Fund of Key Laboratory of Gold Mineralization Processes and Resource Utilization, MNR, grant number Kfkt202108 and Kfkt202124”, and the “Early Cretaceous Magmatism and Metallogenesis in TYD-ZS Fault, grant number KC202005 and KC202102”.

Data Availability Statement

Data are contained within the Supplementary Materials.

Conflicts of Interest

The authors declare no conflict of interest.

References

  1. Einaudi, M.T.; Meinert, L.D.; Newberry, R.J. Skarn deposits. In Economic Geology: Seventy-Fifth Anniversary Volume; Skinner, B.J., Ed.; Society of Economic Geologists: Littleton, CO, USA, 1981; pp. 317–391. [Google Scholar]
  2. Hedenquist, J.W.; Lowenstern, J.B. The role of magmas in the formation of hydrothermal ore deposits. Nature 1994, 370, 519–527. [Google Scholar] [CrossRef]
  3. Meinert, L.D.; Dippl, G.M.; Nicolescu, S. World skarn deposits. Econ. Geol. 2005, 100, 299–366. [Google Scholar]
  4. Chang, Z.S.; Shu, Q.H.; Meinert, L.D. Skarn deposits of China. SEG Spec. Pub. 2019, 22, 189–234. [Google Scholar]
  5. Cai, W.Y.; Zhang, Z.L.; Liu, X.; Gao, J.L.; Ma, M.; Li, Y.; Song, Y.X.; Li, Z.S. Metallogeny of the Yi’nan Tongjing Au–Cu skarn deposit, Luxi district, North China Craton: Perspective from in-suit trace elements, sulfur and lead isotopes of sulfides. Front. Earth Sci. 2023, 10, 1084212. [Google Scholar] [CrossRef]
  6. Chen, Y.J.; Chen, H.Y.; Zaw, K.; Pirajno, F.; Zhang, Z.J. Geodynamic settings and tectonic model of skarn gold deposits in China: An overview. Ore Geol. Rev. 2007, 31, 139–169. [Google Scholar] [CrossRef]
  7. Xie, J.C.; Zhang, X.; Huang, S.; Ge, L.K.; Li, Q.Z.; Sun, W.D. Genesis of Chaoshan skarn Au deposit, Tongling, eastern China: Insights from mineral geochemistry. J. Geochem. Explor. 2022, 241, 107055. [Google Scholar] [CrossRef]
  8. Chao, N.; Chen, X.; Wu, J.H.; Wang, X.Y.; Lin, Y.B.; Lin, D.C.; Li, J.B.; Gu, Y.; Li, M.; Lu, J.L.; et al. Age and compositions of garnet in a magnesian skarn Au-Cu deposit, Tibet, implications for ore-fluid evolution. Ore Geol. Rev. 2023, 152, 105248. [Google Scholar] [CrossRef]
  9. Gao, X.Q.; Sun, X.M.; Fu, Y.; Liu, Q.F. Garnet geochemistry of the giant Beiya gold–polymetallic deposit in SW China: Insights into fluid evolution during skarn formation. Ore Geol. Rev. 2022, 150, 105198. [Google Scholar] [CrossRef]
  10. Cai, W.Y.; Wang, K.Y.; Li, J.; Fu, L.J.; Li, S.D.; Yang, H.; Yassa, K. Genesis of the bagenheigeqier Pb–Zn skarn deposit in inner Mongolia, NE China: Constraints from fluid inclusions, isotope systematics and geochronology. Geol. Mag. 2021, 158, 271–294. [Google Scholar] [CrossRef]
  11. Xu, Y.G.; Wu, X.Y.; Luo, Z.Y.; Ma, J.L.; Huang, X.L.; Xie, L.W. Zircon Hf isotope compositions of Middle Jurassic-early Cretaceous intrusions in Shandong Province and its implications. Acta Petrol. Sin. 2007, 23, 307–316, (In Chinese with English abstract). [Google Scholar]
  12. Wang, Y.; Fan, H.R.; Hu, F.F.; Lan, T.G.; Jiao, P.; Wang, S.P. ZirconU-Pb ages and geoche mistry of ele ments and isotopes of the diorite from Tongjing, Yinan, Western Shandong Province. Miner. Petrol. 2011, 30, 553–566, (In Chinese with English abstract). [Google Scholar]
  13. Duan, Z.; Gleeson, S.A.; Gao, W.S.; Wang, F.Y.; Li, J.W. Garnet U-Pb dating of the Yinan Au-Cu skarn deposit, Luxi District, North China Craton: Implications for district-wide coeval Au-Cu and Fe skarn mineralization. Ore Geol. Rev. 2020, 118, 103310. [Google Scholar] [CrossRef]
  14. Qiu, J.S.; Wang, D.Z.; Ren, Q.J. Geological geochemical characteristics and Genesis of the Jinchang skarn type gold-copper deposit. Yinan City. Shandong Prov. Miner. Depos. 1996, 15, 330–340, (In Chinese with English abstract). [Google Scholar]
  15. Dong, S.Y. Metallogenesis, Metallogenic Laws and Metallogenic Prediction of the Yinan Gold Deposit, Shandong Province. Ph.D. Thesis, China University of Geosciencese, Wuhan, China, 2008; pp. 60–68, (In Chinese with English abstract). [Google Scholar]
  16. Gu, X.X.; Dong, S.Y.; Wang, Y.H.; Hu, G.Z.; Du, S.H.; Jiao, P. A new example of unconformity-related endogenic metalization: The Yinan Au-Cu-Fe deposit, Shandong Province, China. Geoscience 2008, 22, 151–161. [Google Scholar]
  17. Li, K.; Gu, X.X.; Dong, S.Y. Isotopic geochemistry of yinan Au-Cu-Fe deposit in shandong province. Miner. Depos. 2009, 28, 93–104, (In Chinese with English abstract). [Google Scholar]
  18. Wang, Y. Late Mesozoic Magmatism and Gold-Coppermineraliztion in the Southwestern Part of Shandong Province. Ph.D. Thesis, Chinese Academy of Sciences, Beijing, China, 2010; pp. 1–199. (In Chinese). [Google Scholar]
  19. Li, H.K.; Geng, K.; Li, Y.F.; Zhuo, C.Y. Zircon SHRIMP U-Pb age of Tongjing gold deposit in Yinan County, Shandong and its geological significance. Mineral. Depos. 2011, 30, 497–503, (In Chinese with English abstract). [Google Scholar]
  20. Tian, J.X.; Li, X.Z.; Song, Z.Y.; Liu, H.D.; Huang, Y.B.; Zhu, D.C. Environment formation age and material sources of mesozoic golddeposits in Western shandong a synthesis. Acta Geol. Sin. 2015, 89, 1530–1537, (In Chinese with English abstract). [Google Scholar]
  21. Zhu, D.C.; Tian, R.C.; Tian, J.X.; Yu, X.F.; Yang, Z.Y.; Yang, S.P. He-Ar Isotopic Determination of Skarn Type Copper Gold Deposits in Western Shandong and Its Geological Significance-Taking Tongjing Type Copper Gold Deposits in Yinan Area as an Example. Shandong Land Resour. 2018, 34, 1–5, (In Chinese with English abstract). [Google Scholar]
  22. Zhao, G.; Wilde, S.A.; Cawood, P.A.; Sun, M. Archean blocks and their boundaries in the North China Craton: Lithological, geochemical, structural and P-T path constraints and tectonic evolution. Precambrian Res. 2001, 107, 45–73. [Google Scholar] [CrossRef]
  23. Wu, F.Y.; Yang, J.H.; Liu, X.M. Geochronological Framework of the Mesozoic Granitic Magmatism in the Liaodong Peninsula, Northeast China. Geol. J. China Univ. 2005, 11, 305–317, (In Chinese with English abstract). [Google Scholar]
  24. Zhao, G.C.; Cawood, P.A.; Li, S.Z.; Wilde, S.A.; Sun, M.; Zhang, J.; He, Y.H.; Yin, C.Q. Amalgamation of the North China Craton: Key issues and discussion. Precambrian Res. 2012, 222–223, 55–76. [Google Scholar] [CrossRef]
  25. Santosh, M.; Liu, D.Y.; Shi, Y.R.; Liu, S.J. Paleoproterozoic accretionary orogenesis in the North China Craton: A SHRIMP zircon study. Precambrian Res. 2013, 227, 29–54. [Google Scholar] [CrossRef]
  26. Dong, Y.P.; Santosh, M. Tectonic architecture and multiple orogeny of the Qinling Orogenic Belt, Central China. Gondwana Res. 2016, 29, 1–40. [Google Scholar] [CrossRef]
  27. Zhao, G.C.; Sun, M.; Wilde, S.A.; Li, S.Z. Late Archean to Paleoproterozoic evolution of the North China Craton: Key issues revisited. Precambrian Res. 2005, 136, 177–202. [Google Scholar] [CrossRef]
  28. Xu, Y.G.; Li, H.Y.; Pang, C.J.; He, B. On the timing and duration of the destruction of the North China Craton. Chin. Sci. Bull. 2009, 54, 3379–3396. [Google Scholar] [CrossRef]
  29. Zhu, R.X.; Xu, Y.G.; Zhu, G.; Zhang, H.F.; Xia, Q.K.; Zheng, T.Y. Destruction of the North China Craton. Sci. China Earth Sci. 2012, 55, 1565–1587. [Google Scholar] [CrossRef]
  30. Zhu, R.X.; Yang, J.H.; Wu, F.Y. Timing of destruction of the North China Craton. Lithos 2012, 149, 51–60. [Google Scholar] [CrossRef]
  31. Liu, S.; Hu, R.Z.; Zhao, J.H.; Feng, C.X. K–Ar geochronology of Mesozoic mafic dikes in Shandong Province, Eastern China: Implications for crustal extension. Acta. Geol. Sin. 2004, 78, 1207–1213. [Google Scholar]
  32. Zhang, H.F. Destruction of ancient lower crust through magma underplating beneath Jiaodong Peninsula, North China Craton: U–Pb and Hf isotopic evidence from granulite xenoliths. Gondwana Res. 2012, 21, 281–292. [Google Scholar] [CrossRef]
  33. Guo, P.; Santosh, M.; Li, S.R. Geodynamics of gold metallogeny in the Shandong Province, NE China: An integrated geological, geophysical and geochemical perspective. Gondwana Res. 2013, 24, 1172–1202. [Google Scholar] [CrossRef]
  34. Xu, G.Z.; Zhou, R.; Wang, Y.F.; She, H.Q.; Li, B.; Du, B.M.; Song, M.C. The intrinsic factors caused the significant differences in Mesozoic mineralization between Jiaodong and Luxi areas. Geoscience 2002, 16, 9–17, (In Chinese with English abstract). [Google Scholar]
  35. Hu, H.B.; Mao, J.W.; Niu, S.Y.; Li, Y.F.; Li, M.W. Geology and geochemistry of telluride-bearing Au deposits in the Pingyi area, western Shandong, China. Mineral. Petrol. 2006, 87, 209–240. [Google Scholar] [CrossRef]
  36. Song, M.C.; Li, H.K. Study on regional geological structural evolution in Shandong Province. Shandong Geol. 2001, 17, 12–21, (In Chinese with English abstract). [Google Scholar]
  37. Shi, K.X.; Wang, C.M.; Santosh, M. New insights into Neoarchean–Paleoproterozoic crustal evolution in the North China Craton: Evidence from zircon U–Pb geochronology, Lu–Hf isotopes and geochemistry of TTGs and greenstones from the Luxi Terrane. Precambrian Res. 2019, 327, 232–254. [Google Scholar] [CrossRef]
  38. Shi, W.J. The Late Mesozoic Tectonic-Magematic Evolution Process in the Yishu Fault Zone and Adjacent Regions, Shandong Province: Implication for Gold Mineralization. Ph.D. Thesis, China University of Geosciences, Wuhan, China, 2014; pp. 1–142, (In Chinese with English abstract). [Google Scholar]
  39. Guo, P. Geodynamic Setting of Mesozoic Gold Metallogeny in the Western Shandong Province. Ph.D. Thesis, China University of Geosciencese, Wuhan, China, 2014; pp. 60–68, (In Chinese with English abstract). [Google Scholar]
  40. Deng, J.; Wang, C.; Bagas, L.; Santosh, M.; Yao, E. Crustal architecture and metallogenesis in the south-eastern North China Craton. Earth Sci. Rev. 2018, 182, 251–272. [Google Scholar] [CrossRef]
  41. Niu, S.Y.; Hu, H.B.; Mao, J.W.; Sun, A.Q.; Xu, C.S.; Hou, Q.L. Structure in western Shandong and its genetic mechanism. Geol. China 2004, 31, 34–39, (In Chinese with English abstract). [Google Scholar]
  42. Zhu, G.; Jiang, D.Z.; Zhang, B.L. Destruction of the eastern North China Craton in a backarc setting: Evidence from crustal deformation kinematics. Gondwana Res. 2012, 22, 86–103. [Google Scholar] [CrossRef]
  43. Lan, T.G.; Fan, H.R.; Santosh, M.; Hu, F.F.; Yang, K.F.; Yang, Y.H. Early Jurassic high-K calc-alkaline and shoshonitic rocks from the Tongshi intrusive complex, eastern North China Craton: Implication for crust–mantle interaction and post-collisional magmatism. Lithos 2012, 140, 183–199. [Google Scholar] [CrossRef]
  44. Maruyama, S.; Isozaki, Y.; Kimura, G.; Terabayashi, M. Paleogeographic maps of the Japanese Islands: Plate tectonic synthesis from 750 Ma to the present. Island Arc. 1997, 6, 121–142. [Google Scholar] [CrossRef]
  45. Qiu, J.; Lo, C.H.; McInnes, B.I.A.; Zhou, J. Potash-rich magmatism and associated Gold-Copper mineralization in the Yishu deep fault zone and its vicinity, eastern China. Resour. Geol. 2000, 50, 269–280. [Google Scholar] [CrossRef]
  46. Kong, Q.Y.; Zhang, T.Z.; Yu, X.F.; Xu, J.X.; Pan, Y.L.; Li, X.S. Deposits in Shandong Province; Shandong Science and Technology Press: Jinan, China, 2006; pp. 1–902. (In Chinese) [Google Scholar]
  47. Hu, F.F.; Wang, Y.; Fan, H.R.; Zheng, X.L.; Jiao, P. Geochronology and ore-forming fluids in the Jinchang skarn goldcopper deposit, Yinan County, western Shandong Province. Acta. Petrol. Sin. 2010, 26, 1503–1511, (In Chinese with English abstract). [Google Scholar]
  48. Duan, Z.; Li, J.W. Zircon and titanite U-Pb dating of the Zhangjiawa iron skarn deposit, Luxi district, North China Craton: Implications for a craton-wide iron skarn mineralization. Ore Geol. Rev. 2017, 89, 309–323. [Google Scholar] [CrossRef]
  49. Liu, Y.; Santosh, M.; Li, S.R.; Guo, P. Stable isotope geochemistry and Re-Os ages of the Yinan gold deposit, Shandong Province, northeastern China. Int. Geol. Rev. 2014, 56, 695–710. [Google Scholar] [CrossRef]
  50. Gao, M.B.; Gao, J.L.; Zhang, Y.M. Petrogenesis of Early Cretaceous Intrusive Rocks in Yinan Area of the Western Shandong, China: Implication for Crust-mantle Interaction Beneath North China Block. J. Earth Sci. Environ. 2022, 44, 723–749, (In Chinese with English abstract). [Google Scholar]
  51. Gong, B.; Zheng, Y.F.; Chen, R.X. An online method combining a thermal conversion elemental analyzer with isotope ratio mass spectrometry for the determination of hydrogen isotope composition and water concentration in geological samples. Rapid Commun. Mass Spectrom. 2007, 21, 1386–1392. [Google Scholar] [CrossRef] [PubMed]
  52. Clayton, R.N.; Mayeda, T.K. The use of bromine pentafluoride in the extraction of oxygen from oxides and silicates for isotopic analysis. Geochim. Cosmochim. Acta 1963, 27, 43–52. [Google Scholar] [CrossRef]
  53. Roedder, E. Fluid inclusions. Reviews in mineralogy, Michigan. Mineral. Soc. Am. 1984, 12, 644. [Google Scholar]
  54. Bodnar, R.J. Revised equation and table for determining the freezing point depression of H2O-NaCl solutions. Geochim. Cosmochim. Acta 1993, 57, 683–684. [Google Scholar] [CrossRef]
  55. Bodnar, R.J.; Vityk, M.O. Fluid Inclusions in Minerals, Methods and Applications. Interpretation of Microthermometric Data for H2O-NaCl Fluid Inclusions; Virginia Polytechnic Institute and State University: Blacksburg, VA, USA, 1994; pp. 117–130. [Google Scholar]
  56. O’Neil, J.R. Oxygen isotope fractionation in divalent metal carbonates. J. Chem. Phys. 1969, 51, 5547–5558. [Google Scholar] [CrossRef]
  57. Taylor, H.P. The application of oxygen and hydrogen isotope studies to problems of hydrothermal alteration and ore deposition. Econ. Geol. 1974, 69, 843–883. [Google Scholar] [CrossRef]
  58. Shepherd, T.J.; RaKin, A.; Alderton, D.H.M. A Practical Guide to Fluid Inclusion Studies; Blackie and Son Limited: Glasgow, UK; London, UK, 1985; pp. 1–154. [Google Scholar]
  59. Wang, Z.L.; Yang, L.Q.; Guo, L.N.; Marsh, E.; Wang, J.P.; Liu, Y.; Zhang, C.; Li, R.H.; Zhang, L.; Zheng, X.L.; et al. Fluid immiscibility and gold deposition in the Xincheng deposit, Jiaodong Peninsula, China: A fluid inclusion study. Ore Geol. Rev. 2015, 66, 701–717. [Google Scholar] [CrossRef]
  60. Simmons, S.F.; White, N.C.; John, D.A. Geological characteristics of epithermal precious and base metal deposits. Econ. Geol. 2005, 100, 485–522. [Google Scholar]
  61. Shu, Q.H.; Lai, Y.; Wei, L.M.; Sun, Y.; Wang, C. Fluid inclusion study of the Baiyinnuoer Zn-Pn deposit south segment of the Great Xing’an Mountain, northeastern China. Acta. Petrol. Sin. 2011, 27, 1467–1482, (In Chinese with English abstract). [Google Scholar]
  62. Meinert, L.D.; Hedenquist, J.W.; Satoh, H. Formation of anhydrous and hydrous skarn in Cu-Au ore deposits by magmatic fluids. Econ. Geol. 2003, 98, 147–156. [Google Scholar] [CrossRef]
  63. Driesner, T.; Heinrich, C.A. The system H2O-NaCl. Part I: Correlation formulae for phase relations in temperature-pressure-composition space from 0 to 1000 °C, 0 to 5000 bar, and 0 to 1 XNaCl. Geochim. Cosmochim. Acta 2007, 71, 4880–4901. [Google Scholar] [CrossRef]
  64. Wilkinson, J.J. Fluid inclusions in hydrothermal ore deposits. Lithos 2001, 55, 229–272. [Google Scholar] [CrossRef]
  65. Roedder, E.; Bodnar, R. Geologic pressure determinations from fluid inclusion studies. Annu. Rev. Earth Planet. Sci. 1980, 8, 263–301. [Google Scholar] [CrossRef]
  66. Brown, P.E.; Hagemann, S.G. MacFlincor and its application to fluid in Archean lode-gold deposits. Geochim. Cosmochim. Acta 1995, 59, 3943–3952. [Google Scholar] [CrossRef]
  67. Steele-MacInnis, M.; Lecumberri-Sanchez, P.; Bodnar, R.J. HOKIEFLINCS_H2O-NaCl: A Microsoft Excel spreadsheet for interpreting microthermometric data from fluid inclusions based on the PVTX properties of H2O-NaCl. Comput. Geosci. 2012, 49, 334–337. [Google Scholar] [CrossRef]
  68. Palinkas, S.S.; Palinkas, L.A.; Renac, C.; Spangenberg, J.E.; Luders, V.; Molnar, F.; Maliqi, G. Metallogenic model of the Trepča Pb-Zn-Ag skarn deposit, Kosovo: Evidence from fluid inclusions, rare earth elements, and stable isotope data. Econ. Geol. 2013, 108, 135–162. [Google Scholar] [CrossRef]
  69. Barnes, H.L. Solubilities of ore minerals. In Geochemistry of Hydrothermal Ore Deposits; Barnes, H.L., Ed.; Wiley: New York, NY, USA, 1979; pp. 404–460. [Google Scholar]
  70. Rye, R.O. The evolution of magmatic fluids in the epithermal environment: The stable isotope perspective. Econ. Geol. 1993, 88, 733–752. [Google Scholar] [CrossRef]
  71. Harris, A.C.; Golding, S.D. New evidence of magmatic-fluid-related phyllic alteration: Implications for the genesis of porphyry Cu deposits. Geology 2002, 30, 335–338. [Google Scholar] [CrossRef]
  72. Lu, H.Z.; Fan, H.R.; Ni, P.; Ou, G.X.; Shen, K.; Zhang, W.H. Fluid Inclusions; Science Press: Beijing, Ghina, 2004; pp. 1–487. [Google Scholar]
  73. Charef, A.; Sheppard, S.M.F. Pb-Zn mineralization associated with diapirism: Fluid inclusion and stable isotope (H, C, O) evidence for the origin and evolution of the fluids at Fedj-el-Adoum, Tunisia. Chem. Geol. 1987, 61, 113–134. [Google Scholar] [CrossRef]
  74. Taylor, B.E. Magmatic volatiles: Isotopic variation of C, H, and S. Rev. Miner. Geochem. 1986, 16, 185–225. [Google Scholar]
  75. Shmulovich, K.I.; Landwehr, D.; Simon, K.; Heinrich, W. Stable isotope fractionation between liquid and vapour in water-salt systems up to 600 °C. Chem. Geol. 1999, 157, 343–354. [Google Scholar] [CrossRef]
  76. Simmons, S.F.; Sawkins, F.J.; Schlutter, D.J. Mantlederived helium in two Peruvian hydrothermal ore deposits. Nature 1987, 6138, 429–432. [Google Scholar]
  77. Stuart, F.M.; Burnard, P.G.; Taylor, R.P. Resolving mantle and crustal contributions to ancient hydrothermal fluids: He-Ar isotopes in fluid inclusions from Dae Hwa W-Mo mineralisation, South Korea. Geochim. Cosmochim. Acta 1995, 22, 4663–4673. [Google Scholar] [CrossRef]
  78. Hu, R.Z.; Bi, X.W.; Turner, G.; Burnar, P. He–Ar isotopes geochemistry of oreforming fluid on gold ore belt in Ailao Mountains. Sci. China 1999, 4, 321–330, (In Chinese with English abstract). [Google Scholar]
  79. Burnard, P.G. Mantle, crustal and atmospheric noble gases in Ailaoshan gold deposits, Yunnan Province, China. Geochim. Cosmochim. Acta 1999, 63, 1595–1604. [Google Scholar] [CrossRef]
  80. Li, K. Isotopic Geochemistry of the Yinan Au-Cu-Fe Deposit in Shandong Province China. Master’s Thesis, China University of Geosciencese, Wuhan, China, 2009; pp. 1–68, (In Chinese with English abstract). [Google Scholar]
  81. Ohmoto, H.; Rye, R.O. Isotopes of sulfur and carbon. In Geochemistry of Hydrothermal Ore Deposits, 2nd ed.; Barnes, H.L., Ed.; John Wiley: New York, NY, USA, 1979; pp. 509–567. [Google Scholar]
  82. Chaussidon, M.; Lorand, J.P. Sulphur isotope composition of orogenic spinel lherzolite massifi from Ariege (North-Eastern Pyrenees, France): An ion microprobe study. Geochim. Cosmochim. Acta 1990, 54, 2835–2846. [Google Scholar] [CrossRef]
  83. Hoefs, J. Stable Isotope Geochemistry, 4th ed.; Springer: Berlin, Germany, 1997; p. 201. [Google Scholar]
  84. Meinert, L.D. Variability of skarn deposits—Guides to exploration, In Revolution in the Earth Sciences; Boardman, S.J., Ed.; Kendall-Hunt: Dubuque, IA, USA, 1983; pp. 301–316. [Google Scholar]
  85. Zharikov, V.A. Skarns. Int. Geol. Rev. 1970, 12, 541–559, 619–647, 760–775. [Google Scholar] [CrossRef]
  86. Burnham, C.W. Magmas and hydrothermal fluids. In Geochemistry of Hydrothermal Ore Deposits, 2nd ed.; Barnes, H.L., Ed.; John Wiley and Sons: New York, NY, USA, 1979; pp. 71–136. [Google Scholar]
  87. Yang, K.; Bodnar, R.J. Magmatic-hydrothermal evolution in the “bottoms” of porphyry copper systems: Evidence from silicate melt and aqueous fluid inclusions in granitoid intrusions in the Gyeongsang basin, South Korea. Int. Geol. Rev. 1994, 36, 608–628. [Google Scholar] [CrossRef]
  88. Bodnar, R.J. Fluid-inclusion evidence for a magmatic source for metals in porphyry copper deposits. Mineral. Assoc. Can. Short Course Ser. 1995, 23, 139–152. [Google Scholar]
  89. Shinohara, H.; Hedenquist, J.W. Constraints on magma degassing beneath the Far Southeast porphyry Cu-Au deposit, Philippines. J. Petrol. 1997, 38, 1741–1752. [Google Scholar] [CrossRef]
  90. Burisch, M.; Bussey, S.D.; Landon, N.; Nasi, C.; Kakarieka, A.; Gerdes, A.; Albert, R.; Stein, H.J.; Gabites, J.A.; Friedman, R.M.; et al. Timing of Magmatism and Skarn Formation at the Limon, Guajes, and Media Luna Gold ± Copper Skarn Deposits at Morelos, Guerrero State, Mexico. Econ. Geol. 2023, 118, 695–718. [Google Scholar] [CrossRef]
  91. Fournier, R.O. The influences of depth of burial and the brittle-ductile transition on the evolution of magmatic fluids. Geol. Surv. Jpn. Rep. 1992, 277, 57–59. [Google Scholar]
  92. Fournier, R.O. Conceptual models of brine evolution in magmatic-hydrothermal systems. U.S. Geol. Surv. Prof. Pap. 1987, 1350, 1487–1506. [Google Scholar]
  93. Einaudi, M.T. Descriptions of skarn associated with porphyry copper plutons, southwestern North America. In Advances in Geology of the Porphyry Copper Deposits, Southwestern North America; Titley, S.R., Ed.; University of Arizona Press: Tucson, AZ, USA, 1982; pp. 139–184. [Google Scholar]
  94. Shelton, K.L. Composition and origin of ore-forming fluids in a carbonate-hosted porphyry copper and skarn deposit: A fluid inclusion and stable isotope study of Mines Gaspé, Quebec. Econ. Geol. 1983, 78, 387–421. [Google Scholar] [CrossRef]
  95. Clechenko, C.C.; Valley, J.W. Oscillatory zoning in garnet from the Willsboro wollastonite skarn, Adirondack Mts, New York: A record of shallow hydrothermal processes preserved in a granulite facies terrane. J. Metamorph. Geol. 2003, 21, 771–784. [Google Scholar] [CrossRef]
  96. Simmons, S.F. Hydrologic implications of alteration and fluid inclusion studies in the Fresnillo district, Mexico: Evidence for a brine reservoir and a descending water table during the formation of hydrothermal Ag-Pb-Zn orebodies. Econ. Geol. 1991, 86, 1579–1601. [Google Scholar] [CrossRef]
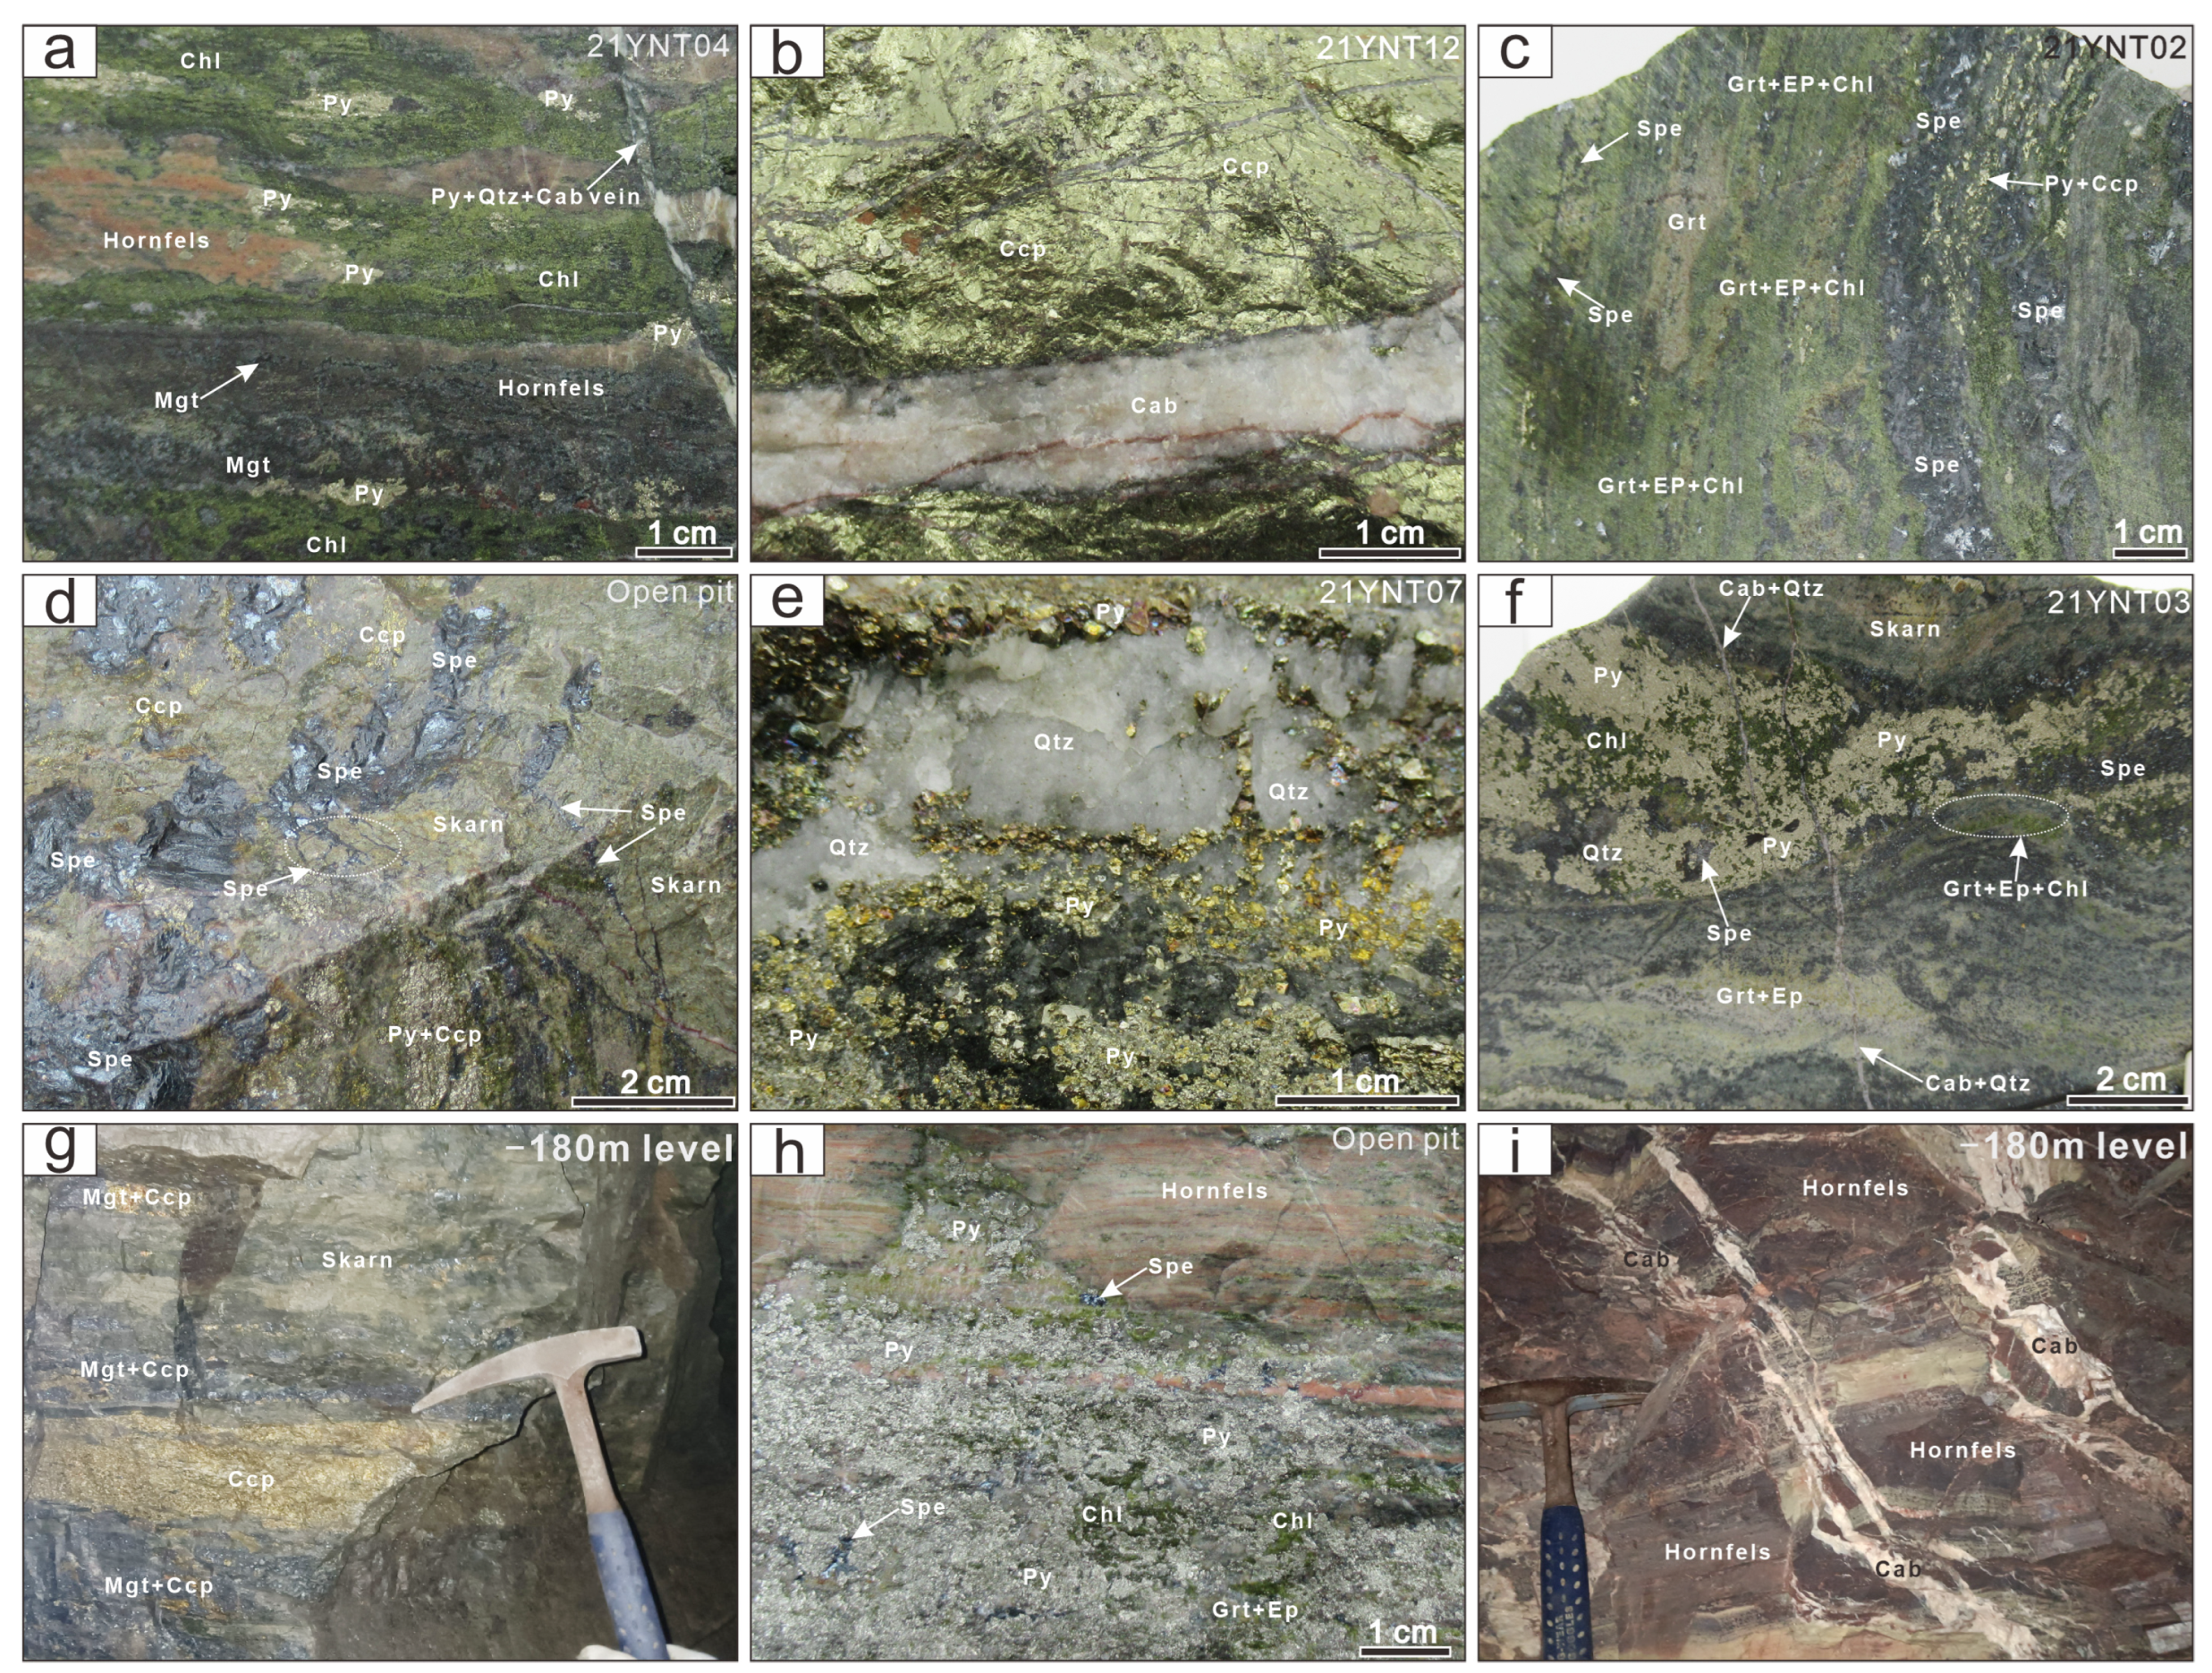
Figure 4. Photographs of hand specimens from the Tongjing gold–copper deposit. (a) Striped pyrite, magnetite, and reddish and brown hornfels precursor cut by late pyrite–quartz–carbonate vein; (b) Massive Cu ore (chalcopyrite) intersected by late carbonate veins; (c) Striped Au ore occurring with specularite, chlorite, garnet, epidote, chalcopyrite, and pyrite; (d) Massive or finely-veined specularite replacing or cutting early skarn; (e) Pyrite–quartz vein and disseminated pyrite; (f) Irregular vein (pyrite, chlorite, minor quartz, and specularite relic) cutting garnet and epidote skarn intersected by late carbonate-quartz veinlets; (g) Striped Au–Cu ore body; (h) Reddish striped hornfels replaced by pyrite and a small amount of specularite, epidote, and garnet; (i) Late carbonate veins cutting grey and brown hornfels. Abbreviations: Cab–carbonate; Ccp–chalcopyrite; Chl–chlorite; Ep–epidote; Grt–garnet; Mgt–magnetite; Py–pyrite; Qtz–quartz; Spe–specularite.
Minerals 13 01348 g004
Figure 5. Photomicrographs of gold–copper mineralization in Tongjing gold–copper deposits. (a). Pyrite replaced by chalcopyrite along the outer edges or inside of pyrite; (b). Acicular specularite; (c). Native gold as irregular particles occurring along the outer edge of euhedral pyrite; they are wrapped by chalcopyrite in BSE image; (d). Hematite, chalcopyrite, and sphalerite fill along the gap of subhedral magnetite and tiny chalcopyrite inclusions in sphalerite; (e). Irregular striped native gold appearing in cracks within euhedral pyrite in BSE image; (f). Pyrite crushed into small fragments in situ; (g). Filling of late carbonate minerals along gaps in subhedral garnet or chlorite; (h). Chlorite, carbonate, quartz, and epidote alterations; (i). Sericite alteration. Abbreviations: Hem–hematite; Ser–Sericite; Sp–sphalerite; Au–native gold; other abbreviations as for Figure 4.
Minerals 13 01348 g005
Figure 6. Photomicrographs of representative FIs in garnet, quartz, and calcite crystals from the Tongjing deposit. (a). L-type FIs along the garnet growth zone of stage II; (b,c,h). V-type FIs randomly distributed in clusters in quartz of the sub-stage III-3; (d). In the stage III-3 quartz particles, V-type FIs are observed along their growth zones while secondary L-type FIs exhibit a linear distribution pattern; (e,i). Coexisting L-type, V-type, and S-type FIs in quartz of the sub-stage III-3; (f,k). S-type FIs in quartz of the sub-stage III-3; (g,j). Coexisting L-type and V-type FIs in quartz of the sub-stage III-3; (l). L-type FIs in quartz of the sub-stage III-4; (m). L-type FIs in calcite of the sub-stage III-4.
Minerals 13 01348 g006
Figure 7. Histograms of homogenization temperatures (a,c,e) and salinities (b,d,f) of FIs in the Tongjing deposit.
Minerals 13 01348 g007
Figure 8. δD vs. δ18OH2O plot for ore-forming fluids of the Tongjing deposit. (Base map after Taylor, [57]; SMOW = standard mean ocean water; Published data are from Dong [15]).
Minerals 13 01348 g008
Figure 9. Summary plot of the homogenization temperatures and salinities of Fls at various stages of the Tongjing Au–Cu deposit. (a). The FIs in sub-stage III-3 were trapped under boiling conditions, allowing the estimated pressures to represent the actual trapping pressures for these inclusions. However, no boiling assemblages were observed during the stage II and sub-stage III-4, resulting in only the minimum trapping pressures of the fluids being estimable. Isobars were calculated using the equations of Driesner and Heinrich [63]; fluid evolution trends are from Wilkinson, [64]; (b). δ18OSMOW vs. δ18CPDB diagram (incl: calcite, marble, and limestone) (data from Dong, [15]; Liu et al. [49]).
Minerals 13 01348 g009
Figure 10. Schematic diagrams depicting the formation of the Tongjing Au–Cu deposit [3]. (a) During the process of thermal metamorphism, the Proterozoic to Cambrian sequences experienced elevated temperatures, resulting in recrystallization and changes in mineral stability without significant mass transfer. These transformations ultimately resulted in the development of calc-silicate marble and hornfels. (b) In impure lithology, particularly in the contact zone between thin shale and limestone units, mass transfer is restricted due to localized fluid movement. This localized fluid flow can give rise to the formation of reaction skarn and skarnoid. (c) As the magma melt reached a state of saturation, fluids exsolved and moved upwards. This event caused the generation of high-temperature single-phase fluids which played a significant role in the formation of multiple skarns in the contact zone between the Tongjing complex and the carbonate formation, as well as in the surrounding vicinity. Notably, the shallow skarns exhibit a larger scale compared to the deep ones. (d) The introduction of meteoric fluids and the water–rock reaction triggered the phase separation of ore-forming fluids, a process commonly referred to as boiling, and subsequently led to retrograde alteration. This phenomenon is frequently observed in shallow skarn and exhibits a broader spatial extent.
Minerals 13 01348 g010
Disclaimer/Publisher’s Note: The statements, opinions and data contained in all publications are solely those of the individual author(s) and contributor(s) and not of MDPI and/or the editor(s). MDPI and/or the editor(s) disclaim responsibility for any injury to people or property resulting from any ideas, methods, instructions or products referred to in the content.