Abstract
The WMI (weak muddy intercalation) is a typical weak structural surface in the red-bedded rock mass; ensuring slope stability by increasing the strength of the WMIs helps reduce project costs and carbon emissions. With the advantages of energy saving, high efficiency, and green, microwave technology has attracted scholars’ attention to geotechnical material property improvement. However, the mineral composition of the WMIs is complex and variable, and the applicability of microwave technology needs further evaluation. In this paper, the effects of microwave temperature and clay mineral types and content on the physical and mechanical properties of the WMIs were evaluated. The results show that microwave heating can substantially improve the uniaxial compressive strength of the WMIs, regardless of the types and content of clay minerals. Dehydration, dehydroxylation of clay minerals, and local melting of albite occurring in the specimens under microwave heating enhanced the strength of the soil particles and the interparticle joints. The strength increase ratios of the WMI specimens increased with the temperature increase. With the increase in clay mineral content, the strength increase ratio of kaolinite WMIs and illite WMIs decreased, while the strength increase ratios of montmorillonite WMIs increased. The present multiple regression analysis methods are used to establish the strength prediction models of the WMI microwave-reinforced specimens, which can guide the engineering application.
1. Introduction
Red beds are clastic sedimentary rocks dominated by red continental deposits, primarily mudstone, sandstone, and siltstone. It is widely distributed worldwide, such as in Southwest China, the Alps, and the Colorado Plateau [1,2,3,4]. The WMI (weak muddy intercalation) is a fragile structural surface between the upper and lower rock layers, which controls the stability of the red-bedded slope. Generally, landslides are less likely to occur when the dip angle of a rock formation is less than the angle of internal friction. However, the red-bedded slopes are prone to slip instability even if the dip of the rock formation is less than 10° [5,6]. Under the disturbance of external factors, the WMIs are prone to softening, causing multi-stage progressive sliding instability in red-bedded slopes [7]. The traditional methods of slope reinforcement primarily utilize retaining structures composed of steel bars, cement, sand, and stone to mitigate the potential sliding of the upper rock mass (As shown in Figure 1a). However, the production processes involved in manufacturing steel bars and cement result in significant carbon emissions, while excessive utilization of sand and stone can lead to the depletion of natural resources. Therefore, enhancing the strength of the weak muddy intercalation would ensure slope stability while minimizing material usage and subsequently reducing carbon emissions.
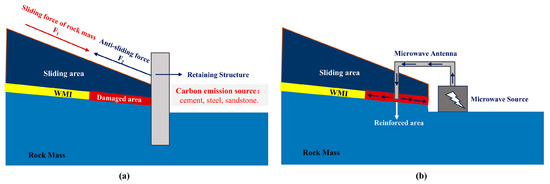
Figure 1.
The traditional retaining and microwave reinforcement method of red bed slope: (a) retaining structure; (b) microwave reinforcement.
The red-bedded WMI mainly contains quartz, feldspar, hematite, and clay minerals such as Mt (montmorillonite), Kaol (kaolinite), and I (illite). The gradual alteration of feldspar under the water–rock interaction in the natural environment forms the clay minerals in the WMI. The higher the content of clay minerals in the weak interlayer, the lower the feldspar content [8,9,10]. Clay minerals control the engineering performances of geotechnical materials. Rocks and soils with high clay mineral content usually have poor mechanical strength and water stability [11,12,13]. Conversely, clay minerals have lower strength values than rock-forming minerals. The elastic modulus of the clay minerals ranged from 2 GPa to 17.79 GPa, and the quartz ranged from 66.54 to 121 GPa [14,15,16,17]. On the other hand, when clay minerals are exposed to water, water molecules enter the interlayer space of clay crystals, resulting in a reduction in mineral particle strength [18,19,20,21,22]. In addition, water molecules will also combine on the surface of clay mineral grains to form bound water films, further weakening the strength of intergranular connections [23,24,25,26,27]. Theoretically, the performance of WMIs can be fundamentally improved by changing the nature of the clay minerals and increasing the association between soil particles. Researchers have carried out more extensive research work in soil consolidation; some researchers have used polypropylene cement, fiber, blast furnace slag, and calcium carbide residue to reinforce soils [28,29,30,31,32]. Other researchers have proposed a greener microbial reinforcement method based on the principle that microbial metabolism produces calcium carbonate crystals to fill tiny cracks and pores in rocks. However, it is less efficient and cannot be used for slopes that need urgent reinforcement [33,34,35,36]. As the red-bedded WMI has high water sensitivity, the slurry injection will cause its strength to decrease. The freezing method is to form a plus solid around the frozen pipe by heat exchange between liquid nitrogen or low-temperature brine and the soil. This method is suitable for a variety of soils, such as water-rich silt, soft ground, and sandy soil, but it can only be used as a temporary support measure for the soils [37,38,39]. Although the high-temperature roasting method can improve the resilience of geotechnical bodies, it has not been used on a large scale due to its drawback of high energy consumption [40,41,42,43].
A microwave has a wavelength of 0.01–1 m and a frequency of 0.3–300 GHz of ultra-high frequency electromagnetic waves and has a short wavelength and high-frequency characteristics. The commonly used microwave heating frequency is 0.915, 2.45 GHz. Microwave heating is through electromagnetic waves in the material’s internal loss of continuous conversion into the system’s internal energy. Compared with grouting, roasting, freezing, and other methods of geotechnical material improvement, microwave technology consumes only electric energy, does not produce secondary pollutants in the treatment process, and has the advantages of low energy consumption, high efficiency, and environmental friendliness [44,45,46]. As shown in Figure 1b, the microwave heating system is mainly composed of a microwave source and a microwave antenna. In practical engineering applications, microwave sources can be arranged on the ground, and microwave antennas can be used to transmit microwaves to the underground. Microwaves are absorbed and converted into heat energy in rocks and soil, and the field strength and power of microwaves decrease with the increase in transmission distance. The depth range of microwaves is related to the microwave’s power, frequency, operating time, and the dielectric parameters of geomaterials. Scholars have conducted research in areas such as the treatment of contaminated soil and the extraction of tight oil and gas and have substantiated the viability of microwave technology through field experiments and numerical simulations [47,48,49]. The heating efficiency of microwaves is mainly related to the mineral composition of the soils. Quartz and feldspar have low complex dielectric constants and are considered microwave-transparent minerals. Pyrite, hematite, biotite, and other minerals containing iron have a high dielectric constant and are quickly microwave-heated [50,51,52]. The laminar structure of the clay minerals allows charge carriers to appear on the surface of the electromagnetically activated lattice. The current formed inside the material allows for a significant increase in microwave heating efficiency [53]. The high clay mineral and hematite content in the red-bedded WMI provides the material basis for its microwave reinforcement. Kaol, Mt, and the red-bedded mudstone WMI has been demonstrated in our previous studies [54,55,56]. However, the effect of the mineral composition on microwave reinforcement has not been clarified, resulting in limited engineering application of the technology.
This paper produced simulated specimens with different clay mineral types and contents. The effects of mineral composition and microwave treatment temperature on the crystal phases, physical properties, and mechanical strength of the WMI specimens were investigated.
2. Materials and Methods
2.1. Origin Materials
The kaolin, illite ore, bentonite, and feldspar are high-purity powders, and the SiO2 and Fe2O3 powders are analytical reagents. The elemental compositions of the origin materials were measured via a Netherlands Axios X-ray Fluorescence spectrometer (XRF), as shown in Table 1. Feldspar mainly contains Na, Si, and Al, typical sodium albite constituent elements. Kaol lattice substitutions are probably mainly Mg2+ and Na+. Na+ in illite occupies part of the coordination of Al3+ in octahedra sheets, and the interlayer cation is K+. The Mt should be calcium-based.

Table 1.
The chemical composition of the original minerals.
The XRD (X-ray diffraction) patterns of the original materials are shown in Figure 2. Kaolin powder mainly comprises 90% kaolinite and 10% quartz. Illite powder primarily consists of 50% illite-2M1, 37% quartz, and 13% albite. Bentonite mainly comprises 10% Ca-montmorillonite and 10% quartz. Feldspar powder mainly consists of 90% albite and 10% quartz.
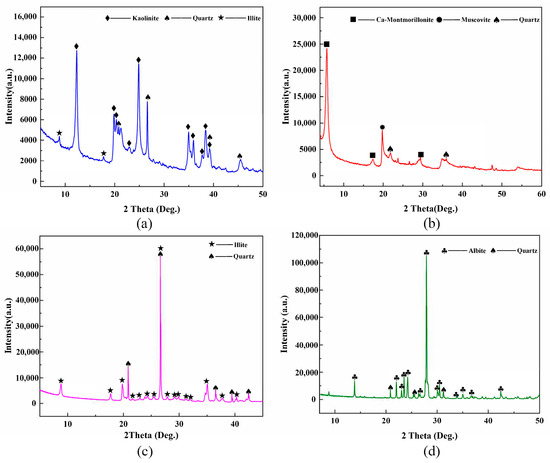
Figure 2.
The XRD patterns of the original materials: (a) Kaolin powder; (b) Bentonite powder; (c) Illite ore powder; and (d) Feldspar powder.
2.2. Mix Design
The clay minerals content of the red-bedded WMIs are generally 10%–50%, and the hematite contents are 5%–15%. In this paper, the percentages of clay mineral content were set to 20%, 30%, and 40%, and nine types of WMI-simulated specimens were produced. Table 2 demonstrates the mineral mass percentages of the specimens. The mineral powders were heated at 105 °C for 72 h to remove water. Subsequently, dry powders were ground to 200 mesh and mixed with deionized water at a mass ratio of 1:0.2. The prepared powders were sealed in a polyethylene box and left to stand for 48 h at 25 °C to ensure uniform moisture distribution. As shown in Figure 3, the wet powder was pressed into cylindrical specimens with a density of 2.0 g·cm−3, diameter of 50 mm, and height of 50 mm.

Table 2.
The mineral composition of WMI-simulated specimens.
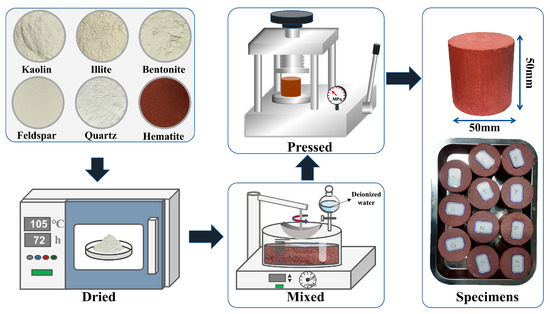
Figure 3.
The simulated specimens of WMIs.
2.3. Specimen Process
A self-designed microwave heating apparatus was employed, as shown in Figure 4. It is mainly composed of a high voltage power supply, continuous wave magnetron, BJ26 waveguide, furnace chamber, infrared temperature sensor, and alumina insulation material. The temperature sensor test range was 0 °C to 1000 °C, and the measurement accuracy was ±1 °C. The initial moisture content of the specimens was 20%. To avoid the condensation of water vapor from the evaporated specimens on the surface of the infrared temperature sensor affecting the temperature measurement accuracy, the specimens were dried to constant weight in a constant temperature drying oven (set at 105 °C) before microwave treatment. In this paper, the microwave heating rate was set to 5 °C/min, and the microwave power adjustment range was set to 250–800 W. The specimens were heated to set temperature (i.e., 300, 500, and 700 °C) and then kept for 60 min. Then, the specimens were allowed to cool naturally in the air atmosphere.
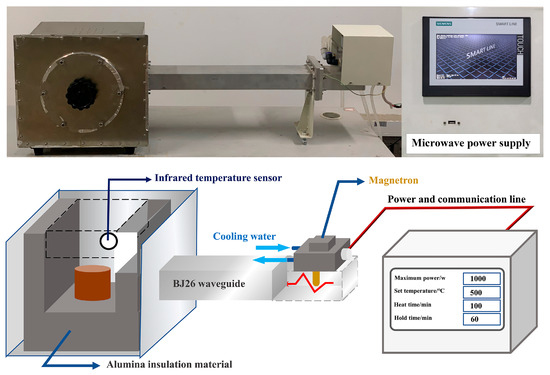
Figure 4.
The schematic diagram of the microwave treatment WMI specimens.
2.4. Characterization of the Specimens
The thermophysical properties of the specimens were obtained by SDT Q600 (25–1000 °C, at a heating rate of 10 °C/min, in air atmosphere), and the density and water content of the specimens were tested according to GBT50123-1999. Uniaxial compression tests were carried out on the original specimens and the specimens treated with different microwave temperatures, respectively, by a microcomputer-controlled electronic universal testing machine (the loading rate was 0.5 MPa/min). The XRD patterns were recorded at 2θ by X’Pert PRO X-ray powder diffraction and Cu-Kα irradiation (λ = 1.54184 Å) in the range of 3 to 70° at a scanning speed of 2°/min. The XRD data were analyzed using JADE software to determine the specimens’ crystalline phases and structural parameters. Table 3 shows the basic physical and mechanical properties of the original specimens.

Table 3.
The mineral composition of WMI-simulated specimens.
3. Results and Discussion
3.1. Thermophysical Properties
The mass losses of the K-WMI specimens were divided into three stages, as shown in Figure 5a: (i) 25–400 °C: the specimens’ mass loss rates were relatively flat due to the almost absence of hydrated cations between kaolinite interlayer space; (ii) 400–620 °C: the peak temperature range of the DTG (derivative thermogravimetry) curves was 480 °C to 492 °C, indicating that the hydroxyl groups on the octahedra sheets were combined into water molecules to be removed; he specimens’ mass loss rates gradually increased with the increase in the Kaol content [57]; and (iii) 620–900 °C: the specimens’ mass loss slowly leveled.
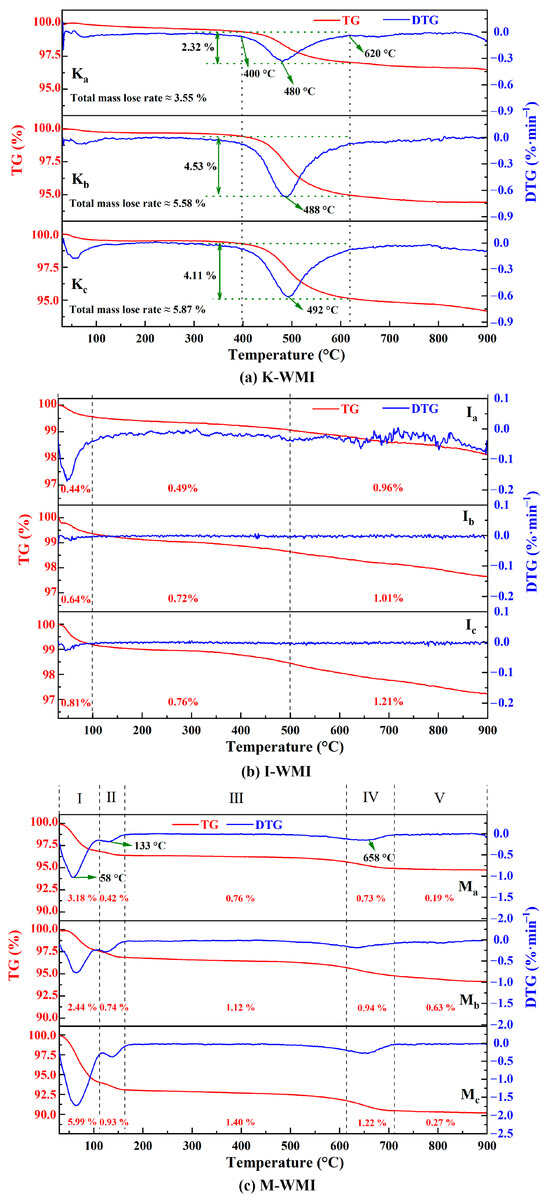
Figure 5.
The TG-DTG patterns of the WMI specimens: (a) K-WMI; (b) I-WMI; and (c) M-WMI.
The I-WMI specimens’ TG-DTG (thermogravimetry-derivative thermogravimetry) curves have smoother mass loss rates than K-WMI but can also be divided into three stages (Figure 5b): (i) 25–100 °C: the specimens mainly lose free water and part of the bound water; (ii) 100–550 °C: the slower mass loss rates of the specimens are primarily due to K+ binds the interlayer space of illite tightly together, and there is less interlayer water; and (iii) 550–900 °C: the DTG curves are not significant peaks due to the lower percentage of hydroxyl groups in illite than kaolinite [58].
The M-WMI specimens’ mass loss process can be divided into five stages (seen in Figure 5c): (i) 25–110 °C: the specimens showed the most mass loss due to Mt being the most hydrophilic of the three clay minerals; (ii) 110–160 °C: the interlayer water in the lattice of Mt is adsorbed by the free cations, and the water cannot escape from the cations below 100 °C; the desorption temperature is higher than that of free and bound water [59]; (iii) 160–500 °C: there are no changes in the mass of the specimens, indicating that little chemical reaction occurs in this temperature range; (iv) 500–720 °C: the apparent decline in the quality of specimens is due to the dehydroxylation of Mt [54]; and (v) 720–900 °C: the mass loss of the specimens tends to be stable.
3.2. Mass and Density
The mass loss rates of the WMI specimens showed a rising trend with microwave temperature increasing and then smoothing (Figure 6a). The higher the clay mineral content, the greater the final mass loss. At 100–300 °C, Kc, Ic, and Mc mass loss rates were 0.497%, 1.333%, and 5.948%, respectively, indicating that Mt adsorbed far more bound water than I and Kaol. At 300–500 °C, the mass loss of the specimens was intensified and reached 4.164%, 2.510%, and 6.830% for Kc, Ic, and Mc, indicating that the hydroxyl content in Mt was higher than that of Kaol and I. At 500–700 °C, the mass loss rate of the specimens gradually leveled off. It is worth noting that the microwave non-thermal effect reduces the temperature of the clay mineral dehydroxylation, resulting in similar mass loss rates of the specimens at 500 °C for microwave and 900 °C for thermogravimetric analysis [60].
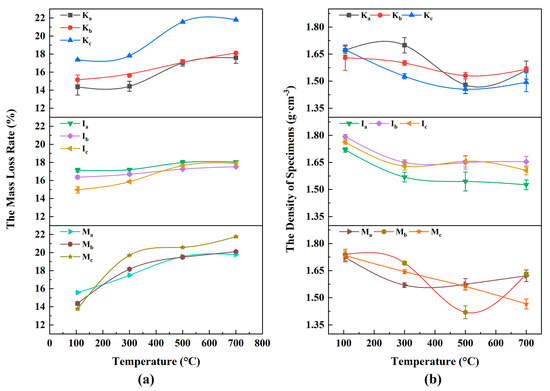
Figure 6.
The mass loss rate and density patterns of the specimens after microwave heating: (a) the mass loss rate of specimens; (b) the density of specimens.
The WMI specimens’ density first decreased and then stabilized as the microwave temperature increased. As the clay mineral content was higher, the density decreased significantly (seen in Figure 6b). (1) K-WMI: untreated specimens’ densities were about 1.63 g·cm−3 to 1.69 g·cm−3. The density decreased by 11%–13% at 500 °C but slightly increased by 2%–3% at 700 °C, mainly due to the filling of microporosity and microcracks by the metakaolin produced after Ka dehydroxylation. (2) I-WMI: specimens’ densities decreased by 10% at 300 °C and remained constant at 300–700 °C. This is mainly because the dehydroxylation reactions have less effect on the interlayer spaces of I. (3) M-WMI: Ma gradually increased to 1.62 g·cm−3. Mb decreased to 1.41 g·cm−3, followed by an increase to 1.62 g·cm−3 and a linear reduction to 1.46 g·cm−3 for the Mc. The higher the Mt content in the specimen, the lower the density of the specimens after microwave treatment. This is due to the significant cell shrinkage after dehydration of Mt, resulting in the development of pores and cracks in the specimens.
3.3. Mineral Characteristics
The XRD patterns of the K-WMI specimens after the microwave treatment are shown in Figure 7. At 300 °C, the crystal structure of minerals remains intact, and the diffraction patterns are unchanged. At 500 °C, amorphous material appeared in the specimens, and the amorphous phase content of the Kc reached 7%. This is due to the hydroxyl group in the aluminumoxygen octahedral sheets of Kaol combined with the removal of water molecules and the transformation to Mk (metakaolinite) [61]. At 700 °C, the intensity of the primary diffraction of albite (2θ ≈ 27.923) decreased, and the FWHM (full width at half maximum) increased from 0.095 to 0.144. This is due to the irregular arrangement of atoms at the mineral grain boundaries and the high interfacial energy, which results in a lower melting point out of the interface [62]. At high temperatures, the crystal edges of the albite melt, the degree of amorphization increases, and the characteristic diffraction peak peaks broaden.
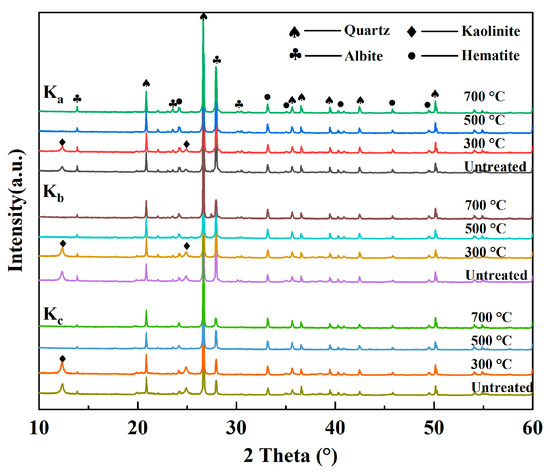
Figure 7.
The XRD patterns of the K-WMI specimens after microwave heating.
After microwave treatment, the XRD patterns of the I-WMI specimens showed that illite has a characteristic diffraction of 2θ ≈ 12.341 and a d002-value of 7.167 Å (Figure 8). When the temperature is lower than 500 °C, the reflectance intensity and d-value of the I remain unchanged, indicating that the lamellar structure of illite remains intact in this temperature range. At 500–700 °C, the FWHM of the 002 diffraction peak increased, and the peak shape changed from sharp to rounded, indicating that the interlayer structure was disrupted [63].
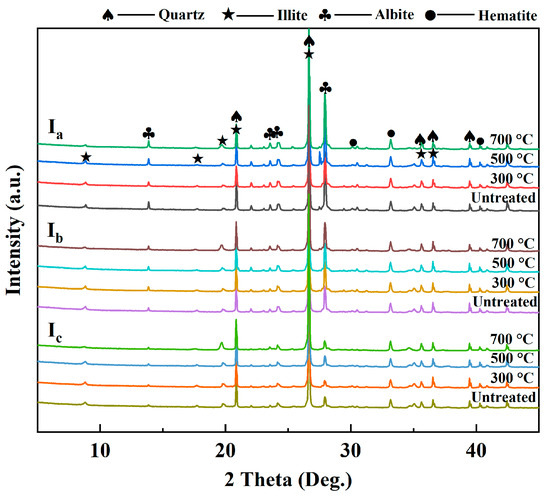
Figure 8.
The XRD patterns of the I-WMI specimens after microwave heating.
The XRD patterns of the M-WMI specimens after microwave treatment are shown in Figure 9. The characteristic diffraction peak of Mt (#PDF 97-016-1171) is 2θ ≈ 5.669°, and the d001-value is 15.58 Å. At 25–300 °C, the intensity of the characteristic diffraction peak of Mt decreased significantly, and the FWHM increased from 0.511 to 0.568 (2θ ≈ 5.669°). At the same time, a new diffraction peak also appeared (2θ ≈ 9.140°) due to the removal of interlayer water, and the interlayer space of the d001-value decreased to 9.980 Å. At 500 °C, a weak diffraction peak still exists at 2θ ≈ 9.140°. This is because the octahedral sheets of Mt are located in the middle of the tetrahedral sheets, and the dehydrogenation reaction cannot destroy its lamellar structure [64]. The intensity of the albite diffraction decreased significantly, and the FWHM increased to 0.21 (2θ ≈ 27.923). The amorphous phase contents in Ma, Mb, and Mc are 2.2%, 9.0%, and 26.7%, respectively. Compared with the I-WMIs, the decrease in albite content was not apparent, indicating that the amorphous phases in the M-WMI were mainly products formed after the dehydroxylation of Mt. In contrast, K+ in illite can substantially lower the melting point of the albite, resulting in lower albite content in I-WMI specimens at high temperatures.
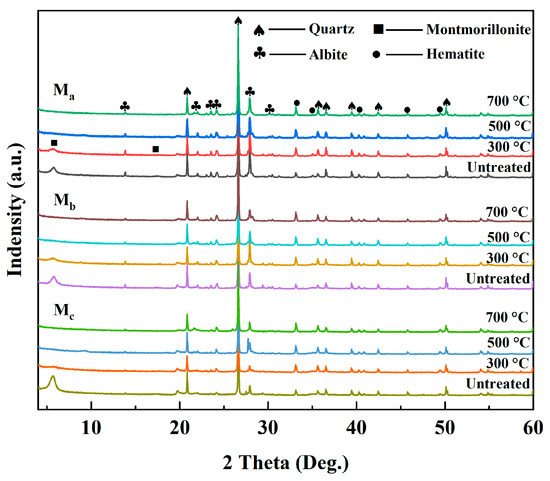
Figure 9.
The XRD patterns of the M-WMI specimens after microwave heating.
3.4. Uniaxial Compressive Strength
Figure 10 shows the typical uniaxial compression failure diagram of the specimens before and after microwave treatment. The plastic deformation of the original specimen is clearly observed during uniaxial compression, exhibiting distinct characteristics of axial compression and radial expansion. It exhibits prominent features indicative of plastic failure. The axial deformation of the dry specimen is small, and the soil in the middle of the specimen is stripped, which has typical brittle shear failure characteristics. With the elevation of microwave temperature, there was a reduction in soil detachment within the central region of the specimen, and the failure mechanism transitioned the specimen from brittle shear failure to brittle splitting failure, accompanied by a gradual increase in the failure angle β. This observation indirectly substantiates that the internal friction angle of the specimen escalates with an increase in microwave temperatures.

Figure 10.
The typical uniaxial compression failure diagrams of the WMI specimens.
Figure 11 shows the uniaxial compressive strength of the specimens before and after microwave treatment, notably at 25 °C for specimens with 20% water content and 105 °C for dry specimens. The strength of the specimens increased with the temperature, but the strength growth trend differed for three types of WMI specimens.
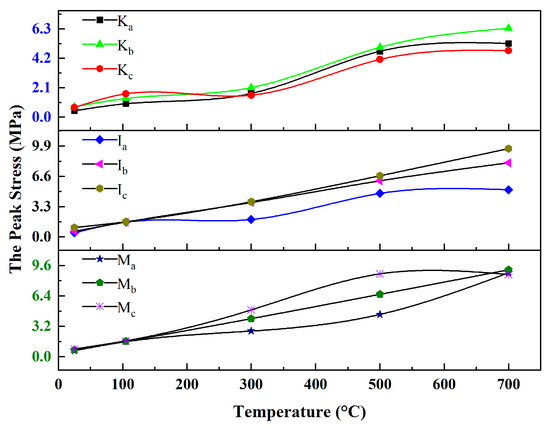
Figure 11.
The peak stress of the WMI specimens.
For the K-WMI specimens, the peak stresses of Ka and Kb were 0.45 MPa and 0.73 MPa at 25 °C, and the right amount of Kaol can glue the particles of quartz and albite together. However, when the clay content was too high, the strength of the specimens was controlled by the clay minerals, and the Kc group specimens decreased to 0.68 MPa. At 25–300 °C, the peak stresses of Ka and Kb increased to 1.68 MPa and 2.10 MPa, while Kc first increased to 1.66 MPa and then decreased to 1.56 MPa. This was due to the change from water contact to mechanical contact between the particles after the removed bonded water films, which enhanced the cohesion and internal friction angle between the particles. However, when the Kaol content was too high, more cracks and pores were generated when the specimens shrunk when dried, resulting in a decrease in the Kc specimens’ strength. At 500–700 °C, the Mk and the molten phases of albite enhanced the interparticle bonding, and the peak stresses of Ka, Kb, and Kc increased to 5.25 MPa, 6.34 MPa, and 4.74 MPa, respectively [65].
At the same water content, illite adsorbs a higher proportion of strongly bound water than kaolinite, and the strongly bound water has a specific mechanical strength [66]. Therefore, the strength of I-WMI was higher than that of K-WMI, and the I-WMI’s strength increased with the increase in illite content (with peak stresses of 0.44 MPa, 0.62 MPa, and 1.01 MPa for Ia, Ib, and Ic at 25 °C, respectively). At 105–300 °C, the hard agglomerates formed by the close bonding of illite with the surrounding particles after dehydration enhanced the strength of the specimens, and the number of agglomerates increased with the increased illite content. Therefore, the peak stresses of Ib and Ic were close to 4 MPa, while the peak stress of Ia was only 1.89 MPa. At 500–700 °C, the K+ released from the dehydroxylation of illite can lower the melting point of the mineral and induce the formation of intergranular molten film between the particles, enhancing the particles’ bonding strength. However, unlike the K-WMI specimens, group c of the I-WMI specimens had the highest peak stress of 9.82 MPa. This is because the volume shrinkage of illite during dehydroxylation is minimal. Even if the illite content is high, many pores and cracks of the specimens did not appear after high-temperature treatment [67].
Mt has a strong swelling property, which leads to its weak cementing effect on soil particles. Therefore, the effect of montmorillonite content on the strength of M-WMI specimens is small. The peak stresses of the specimens in groups a, b, and c are about 0.63–0.79 MPa at 25 °C. In the dried stage (105–300 °C), the peak stress of Ma increased from 1.58 MPa to 2.69 MPa, Mb increased from 1.63 MPa to 4.00 MPa, and Mc increased from 1.67 MPa to 4.92 MPa. Compared to I and Kaol, Mt crystals have larger interlayer space, and most water is adsorbed between interlayer spaces at the same water content. The dehydration of Mt will lead to more significant interparticle accumulation, which increases the interparticle van der Waals forces. At 500 °C, Mt in the specimens is dehydroxylated, resulting in increased lattice defects, enhanced chemical activity, and tightly bound particles at high temperatures. The peak stresses of Mc increased to 8.71 MPa. At 700 °C, the peak stresses of Ma and Mb increased to 8.82 MPa and 9.13 MPa, respectively, while Mc decreased to 8.63 MPa, which was also due to the shrinkage of the Mt volume that caused damage to the stressed structure of the specimens.
3.5. Main Influencing Factors of Mechanical Strength
The strength of the I-WMI and M-WMI specimens increased with the clay content (10%–40%) when the water content (20 wt%) was certain. While there is a turning point in the strength of K-WMI specimens when the Kaol content is less than 30%, the strength of the specimens increased with the clay mineral content increase, and the strength decreased when the kaolin content was more than 30% (seen in Figure 12a). Among the three clay minerals, Kaol has the lowest permanent negative charge. At a certain water content in the specimens, the proportion of interlayer and bound water in the I-WMI and M-WMI was higher than in the K-WMI, so K-WMI has the lowest strength. Mt has the strongest swelling when exposed to water, which breaks the connection of soil particles, so the strength of I-WMI is greater than M-WMI. Overall, illite content has the most significant effect on the strength of the specimens, followed by Mt and Kaol.
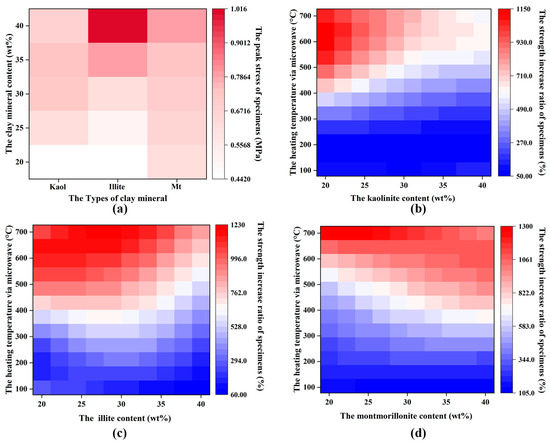
Figure 12.
The relationship between strength, microwave heating temperature, and clay mineral content of the WMI specimens: (a) original specimens; (b) K-WMI specimens; (c) I-WMI specimens; and (d) M-WMI specimens.
Natural WMIs are affected by overlying soil pressure and geological structure stress, and the strength differs even if the mineral composition of WMIs is the same. Although the strength values of the treated specimens at different temperatures were obtained, the strength values still do not directly guide the engineering, as these values are related to the strength of the untreated specimens. Therefore, the strength increase ratios of the specimens after microwave treatment were evaluated to be more beneficial for engineering applications (Figure 12b–d).
For the K-WMI specimens, the strength of the specimens was hardly affected by the Kaol content below 200 °C. Above 300 °C, the higher the Kaol content, the slower the strength increase in the specimens, mainly due to the increased pore damage caused by Kaol after dehydroxylation. For the I-WMI specimens, the strength increase ratios showed a trend of increasing and then decreasing with the increase in I content below 400 °C, and the turning point was at 30% of clay content. When the temperature exceeds 500 °C, the strength increase ratios decreased slightly with the increase in I content. For the M-WMI specimens, the strength increase ratios were the greatest for the low clay mineral content (10%) specimens at 700 °C. However, the overall strength increase ratio of specimens increased with the increase in Mt content.
In this paper, the mathematical models for strength prediction of modified specimens considering microwave heating temperature, clay mineral composition, and specimen’s initial strength were established by multiple linear regression analysis (Equations (1)–(3)). The strength increase ratios of K-WMI and I-WMI were negatively correlated with clay content and positively correlated with microwave heating temperature. In contrast, the strength increase ratios of the M-WMI were positively correlated with temperature and clay mineral content. The sensitivity of the strength increase ratios to the clay mineral content in descending order is Kaol > I > Mt, and the sensitivity to temperature in descending order is Mt > I > Kaol.
where PKf, PIf, and PMf are the uniaxial compressive strengths of microwave-treated specimens (MPa). PKo, PIo, and PMo are the uniaxial strengths of specimens with 20% water content (MPa). ωK, ωI, ωM are the mass percentages of clay minerals (%), ranging from 20% to 40%. T is the maximum microwave treatment temperature (°C), ranging from 105 °C to 700 °C.
K-WMI PKf = (−0.12968ωK + 0.01298T + 4.17904)PKo
I-WMI PIf = (−0.10922ωI + 0.01545T + 4.02991)PIo
M-WMI PMf = (0.02774ωM + 0.01744T − 0.48277)PMo
4. Conclusions
In this paper, WMI specimens containing Kaol, I, and Mt treated with different microwave heating temperatures were prepared. XRD, XRF, and TG-DTG characterized the specimens to clarify the physicochemical reaction processes of various WMI specimens after microwave heating. The influence of clay mineral type, content, and microwave temperature on the mass, density, and uniaxial compressive strengths of the specimens was revealed, and prediction models of the strength of the WMI considering microwave temperature and clay mineral content were established, which can provide a data reference for the engineering application of this technology. The following conclusions can then be drawn:
(1) The mass and density of WMI specimens first decreased and then stabilized with the increased microwave treatment temperature. The higher the clay mineral content, the more significant the decrease in mass and density of the specimens. According to the influence of the mineral type on the density and mass of the specimens in descending order, the order is Mt > I > Ka. This is mainly due to the more significant dehydroxylation reaction of Mt and I. In addition, the specimens’ mass loss at microwave heating to 500 °C almost reached the value of 900 °C in the traditional heating method, indicating that microwaves can significantly reduce the reaction temperature range of clay mineral dehydroxylation.
(2) Physical and chemical reactions such as dehydration, dehydroxylation, amorphization, and melting occurred sequentially in the WMIs under microwave heating. At 300 °C, the free water, bound water, and interlayer water of clay minerals were removed. The d001-value of Mt was reduced from 15.58 Å to 9.980 Å, and interlayer spaces of I and Kaol variations were not observed. At 300–500 °C, Kaol was dehydroxylated and transformed into Mk. At 500–700 °C, Mt and I were dehydroxylated, and the albite was locally melted to produce the glass phase.
(3) The mechanical strengths of the WMIs containing kaolinite, illite, and montmorillonite were effectively improved after microwave treatment, indicating that microwave reinforcement technology can be applied to the WMI of various mineral compositions. The strength increase ratios of K-WMIs and I-WMIs were negatively correlated with clay content and positively correlated with microwave temperature. In contrast, the strength increase ratios of M-WMIs were positively correlated with both temperature and clay mineral content. The sensitivity of the strength increase ratios to the clay mineral content is Kaol > I > Mt in descending order, and the temperature sensitivity is Mt > I > Kaol in descending order.
(4) The WMIs are typically located inside rock masses and can be rapidly heated to elevated temperatures via high-power microwaves without affecting the surrounding environment and rock strata. The prediction models of the strength of the WMI considering microwave temperature and clay mineral content were established, which can provide a reference for the preliminary evaluation of the microwave heating temperature required to achieve the expected strength index of WMI in practical engineering applications.
Author Contributions
Conceptualization, Q.H. and Y.G.; methodology, Q.H. and Y.G.; resources, Y.G.; funding acquisition, Q.H. and L.H.; writing—original draft, Y.G.; writing—review and editing, Z.L.; formal analysis, Y.G.; validation, Y.G. and J.Z.; investigation, Z.L., M.L., and W.Z.; data curation, J.Z. All authors have read and agreed to the published version of the manuscript.
Funding
This research was funded by the National Natural Science Foundation of China (Grants: 52078442 and 52178357) and the Sichuan Province Science and Technology Support Program (Grants: 2021YFSY0006 and 22CXTD0087).
Data Availability Statement
All data of this study are available within the article.
Conflicts of Interest
The authors declare that they have no known competing financial interests or personal relationships that could have appeared to influence the work reported in this paper.
References
- Kruiver, P.P.; Dekkers, M.J.; Langereis, C.G. Secular variation in Permian red beds from Dôme de Barrot, SE France. Earth. Planet. Sci. Lett. 2000, 179, 205–217. [Google Scholar] [CrossRef]
- Tanner, L.H.; Lucas, S.G. The Moenave Formation: Sedimentologic and stratigraphic context of the Triassic–Jurassic boundary in the Four Corners area, southwestern USA. Palaeogeogr. Palaeoclim. Palaeoecol. 2007, 244, 111–125. [Google Scholar] [CrossRef]
- Huang, K.; Kang, B.; Zha, F.; Li, Y.; Zhang, Q.; Chu, C. Disintegration characteristics and mechanism of red-bed argillaceous siltstone under drying-wetting cycle. Environ. Earth. Sci. 2022, 81, 336. [Google Scholar] [CrossRef]
- Marat, A.R.; Tămaş, T.; Samşudean, C.; Gheorghiu, R. Physico-mechanical and mineralogical investigations of red bed slopes (Cluj-Napoca, Romania). Bull. Eng. Geol. Environ. 2022, 81, 78. [Google Scholar] [CrossRef]
- Zhang, H.; Liu, J. Microstructures, mineral compositions, and mechanical properties of red-layers in southern China. Adv. Mater. Sci. Eng. 2018, 2018, 9601386. [Google Scholar] [CrossRef]
- Leng, Y.; Kong, X.; He, J.; Xing, A.; Zhang, Y.; Wang, Q. The July 10, 2020, red-bed landslide triggered by continuous rainfall in Qianxi, Guizhou, China. Landslides 2022, 19, 1421–1433. [Google Scholar] [CrossRef]
- Xu, Q.; Liu, H.; Ran, J.; Li, W.; Sun, X. Field monitoring of groundwater responses to heavy rainfalls and the early warning of the Kualiangzi landslide in Sichuan Basin, southwestern China. Landslides 2016, 13, 1555–1570. [Google Scholar] [CrossRef]
- Zhu, S.; Yin, Y.; Li, B.; Wei, Y. Shear creep characteristics of weak carbonaceous shale in thick layered Permian limestone, southwestern China. J. Earth. Syst. Sci. 2019, 128, 128. [Google Scholar] [CrossRef]
- Liu, J.; Xu, Q.; Wang, S.; Siva Subramanian, S.; Wang, L.; Qi, X. Formation and chemo-mechanical characteristics of weak clay interlayers between alternative mudstone and sandstone sequence of gently inclined landslides in Nanjiang, SW China. Bull. Eng. Geol. Environ. 2020, 79, 4701–4715. [Google Scholar] [CrossRef]
- Li, A.; Deng, H.; Zhang, H.; Liu, H.; Jiang, M. The shear-creep behavior of the weak interlayer mudstone in a red-bed soft rock in acidic environments and its modeling with an improved Burgers model. Mech. Time-Depend. Mater. 2021, 27, 1–18. [Google Scholar] [CrossRef]
- Hu, D.W.; Zhang, F.; Shao, J.-F.; Gatmiri, B. Influences of mineralogy and water content on the mechanical properties of argillite. Rock. Mech. Rock. Eng. 2014, 47, 157–166. [Google Scholar] [CrossRef]
- Yuan, J.; Liu, Z.; Hu, G.; Fang, Y. Experimental analysis of the influence of soil composition on strength characteristics. Soil. Mech. Found. Eng. 2018, 55, 325–332. [Google Scholar] [CrossRef]
- Zhang, C.; Pan, Z.; Yin, H.; Ma, C.; Ma, L.; Li, X. Influence of clay mineral content on mechanical properties and microfabric of tailings. Sci. Rep. 2022, 12, 10700. [Google Scholar] [CrossRef] [PubMed]
- Zhang, F.; Guo, H.; Hu, D.; Shao, J.-F. Characterization of the mechanical properties of a claystone by nano-indentation and homogenization. Acta. Geotech. 2018, 13, 1395–1404. [Google Scholar] [CrossRef]
- Lu, Y.; Li, Y.; Wu, Y.; Luo, S.; Jin, Y.; Zhang, G. Characterization of shale softening by large volume-based nanoindentation. Rock. Mech. Rock. Eng. 2020, 53, 1393–1409. [Google Scholar] [CrossRef]
- Xu, J.; Tang, X.; Wang, Z.; Feng, Y.; Bian, K. Investigating the softening of weak interlayers during landslides using nanoindentation experiments and simulations. Eng. Geol. 2020, 277, 105801. [Google Scholar] [CrossRef]
- Sun, C.; Li, G.; Gomah, M.E.; Xu, J.; Rong, H. Experimental investigation on the nanoindentation viscoelastic constitutive model of quartz and kaolinite in mudstone. Int. J. Coal. Sci. Technol. 2021, 8, 925–937. [Google Scholar] [CrossRef]
- Schmidt, S.R.; Katti, D.R.; Ghosh, P.; Katti, K.S. Evolution of mechanical response of sodium montmorillonite interlayer with increasing hydration by molecular dynamics. Langmuir 2005, 21, 8069–8076. [Google Scholar] [CrossRef]
- Zheng, Y.; Zaoui, A. Mechanical behavior in hydrated Na-montmorillonite clay. Phys. A Stat. Mech. Appl. 2018, 505, 582–590. [Google Scholar] [CrossRef]
- Asaad, A.; Hubert, F.; Ferrage, E.; Dabat, T.; Paineau, E.; Porion, P.; Savoye, S.; Gregoire, B.; Dazas, B.; Delville, A. Role of interlayer porosity and particle organization in the diffusion of water in swelling clays. Appl. Clay Sci. 2021, 207, 106089. [Google Scholar] [CrossRef]
- Li, Q.; Li, R.; Shi, W. Cation adsorption at permanently (montmorillonite) and variably (quartz) charged mineral surfaces: Mechanisms and forces from subatomic scale. Appl. Clay Sci. 2021, 213, 106245. [Google Scholar] [CrossRef]
- Kang, X.; Zou, X.; Sun, H.; Ma, X.; Chen, R. Molecular dynamics simulations of microstructure and dynamic shearing behaviors of kaolinite-water-salt system. Appl. Clay Sci. 2022, 218, 106414. [Google Scholar] [CrossRef]
- Lin, M.L.; Jeng, F.S.; Tsai, L.S.; Huang, T.H. Wetting weakening of tertiary sandstones—Microscopic mechanism. Environ. Geol. 2005, 48, 265–275. [Google Scholar] [CrossRef]
- Dolinar, B.; Macuh, B. Determining the thickness of adsorbed water layers on the external surfaces of clay minerals based on the engineering properties of soils. Appl. Clay Sci. 2016, 123, 279–284. [Google Scholar] [CrossRef]
- Min, T.; Gao, Y.; Chen, L.; Kang, Q.; Tao, W. Changes in porosity, permeability and surface area during rock dissolution: Effects of mineralogical heterogeneity. Int. J. Heat Mass. Transf. 2016, 103, 900–913. [Google Scholar] [CrossRef]
- Zhao, J.; Lu, C.; Deng, L.; Liu, G. Impacts of simulated acid solution on the disintegration and cation release of purple rock (mudstone) in Southwest China. Geomorphology 2018, 316, 35–43. [Google Scholar] [CrossRef]
- Zhou, C.; Cui, G.; Yin, H.; Yu, L.; Xu, G.; Liu, Z.; Zhang, L. Study of soil expansion characteristics in rainfall-induced red-bed shallow landslides: Microscopic and macroscopic perspectives. PLoS ONE 2021, 16, e0246214. [Google Scholar] [CrossRef] [PubMed]
- Jiang, N.J.; Du, Y.J.; Liu, S.Y.; Wei, M.L.; Horpibulsuk, S.; Arulrajah, A. Multi-scale laboratory evaluation of the physical, mechanical, and microstructural properties of soft highway subgrade soil stabilized with calcium carbide residue. Can. Geotech. J. 2015, 53, 373–383. [Google Scholar] [CrossRef]
- Salimi, M.; Ghorbani, A. Mechanical and compressibility characteristics of a soft clay stabilized by slag-based mixtures and geopolymers. Appl. Clay Sci. 2020, 184, 105390. [Google Scholar] [CrossRef]
- Tiwari, N.; Satyam, N.; Singh, K. Effect of curing on micro-physical performance of polypropylene fiber reinforced and silica fume stabilized expansive soil under freezing thawing cycles. Sci. Rep. 2020, 10, 7624. [Google Scholar] [CrossRef]
- Shen, Y.S.; Tang, Y.; Yin, J.; Li, M.P.; Wen, T. An experimental investigation on strength characteristics of fiber-reinforced clayey soil treated with lime or cement. Constr. Build. Mater. 2021, 294, 123537. [Google Scholar] [CrossRef]
- Yuan, B.; Chen, W.; Zhao, J.; Li, L.; Liu, F.; Guo, Y.; Zhang, B. Addition of alkaline solutions and fibers for the reinforcement of kaolinite-containing granite residual soil. Appl. Clay Sci. 2022, 228, 106644. [Google Scholar] [CrossRef]
- Minto, J.M.; MacLachlan, E.; el Mountassir, G.; Lunn, R.J. Rock fracture grouting with microbially induced carbonate precipitation. Water Resour. Res. 2016, 52, 8827–8844. [Google Scholar] [CrossRef]
- Jiang, N.-J.; Tang, C.-S.; Yin, L.-Y.; Xie, Y.-H.; Shi, B. Applicability of microbial calcification method for sandy-slope surface erosion control. J. Mater. Civil. Eng. 2019, 31, 04019250. [Google Scholar] [CrossRef]
- Liu, D.; Shao, A.; Li, H.; Jin, C.; Li, Y. A study on the enhancement of the mechanical properties of weak structural planes based on microbiologically induced calcium carbonate precipitation. Bull. Eng. Geol. Environ. 2020, 79, 4349–4362. [Google Scholar] [CrossRef]
- Gupta, G.; Datta, M.; Ramana, G.V.; Alappat, B.J. MSW incineration bottom ash (MIBA) as a substitute to conventional materials in geotechnical applications: A characterization study from India and comparison with literature. Constr. Build. Mater. 2021, 308, 124925. [Google Scholar] [CrossRef]
- Hu, J.; Liu, Y.; Wei, H.; Yao, K.; Wang, W. Finite-element analysis of heat transfer of horizontal ground-freezing method in shield-driven tunneling. Int. J. Geomech. 2017, 17, 04017080. [Google Scholar] [CrossRef]
- Kong, B.; Xia, F.; Yu, B.; Xia, T.; Ding, Z. Pore size changes in marine soft soil under various freezing conditions. J. Mar. Sci. Eng. 2020, 8, 170. [Google Scholar] [CrossRef]
- Zhou, F.; Zhou, P.; Li, J.; Ge, T.; Lin, J.; Wang, Z. Key Parameters Design Method of AGF Method for Metro Connecting Passage in Water-Rich Coastal Area. KSCE J. Civ. Eng. 2022, 26, 5301–5317. [Google Scholar] [CrossRef]
- Thomaz, E.L. Realistic soil-heating gradient temperature linearly changes most of the soil chemical properties. Soil Sci. Plant Nutr. 2017, 63, 84–91. [Google Scholar] [CrossRef]
- Guo, Y.M.; Zhang, G.Z.; Liu, S.Y. Temperature effects on the in-situ mechanical response of clayey soils around an energy pile evaluated by CPTU. Eng. Geol. 2020, 276, 105712. [Google Scholar] [CrossRef]
- Wang, W.S.; Li, C.; Li, Y.Z.; Yuan, M.; Li, T. Numerical Analysis of Heat Transfer Performance of In Situ Thermal Remediation of Large Polluted Soil Areas. Energies 2019, 12, 4622. [Google Scholar] [CrossRef]
- Wang, F.H.; Kong, L.W.; Zhou, Z.H. Study on Pore Structure and Mechanical Property of Expansive Soil under Different Dehydration Conditions. Appl. Sci. 2022, 12, 5981. [Google Scholar] [CrossRef]
- Zhang, S.; Shu, X.; Chen, S.; Yang, H.; Hou, C.; Mao, X.; Chi, F.; Song, M.; Lu, X. Rapid immobilization of simulated radioactive soil waste by microwave sintering. J. Hazard. Mater. 2017, 337, 20–26. [Google Scholar] [CrossRef]
- El-Feky, M.S.; Kohail, M.; El-Tair, A.M.; Serag, M.I. Effect of microwave curing as compared with conventional regimes on the performance of alkali activated slag pastes. Constr. Build. Mater. 2020, 233, 117268. [Google Scholar] [CrossRef]
- Yao, H.; Lu, J.; Bian, H.; Zhang, Z. Influence of microwave heating on the swelling properties of expansive soil in Hefei. Case. Stud. Therm. Eng. 2022, 39, 102466. [Google Scholar] [CrossRef]
- Zhu, J.; Yi, L.; Yang, Z.; Li, X. Numerical simulation on the in situ upgrading of oil shale reservoir under microwave heating. Fuel 2021, 287, 119553. [Google Scholar] [CrossRef]
- Li, H.; Lin, B.; Yang, W.; Hong, Y.; Wang, Z. A fully coupled electromagnetic-thermal-mechanical model for coalbed methane extraction with microwave heating. J. Nat. Gas Sci. Eng. 2017, 46, 830–844. [Google Scholar] [CrossRef]
- Krouzek, J.; Durdak, V.; Hendrych, J.; Masin, P.; Sobek, J.; Spacek, P. Pilot scale applications of microwave heating for soil remediation. Chem. Eng. Process.-Process. Intensif. 2018, 130, 53–60. [Google Scholar] [CrossRef]
- Zeng, J.; Hu, Q.; Chen, Y.; Shu, X.; Chen, S.; He, L.; Tang, H.; Lu, X. Experimental investigation on structural evolution of granite at high temperature induced by microwave irradiation. Miner. Pet. 2019, 113, 745–754. [Google Scholar] [CrossRef]
- Zheng, Y.L.; Zhao, X.B.; Zhao, Q.H.; Li, J.C.; Zhang, Q.B. Dielectric properties of hard rock minerals and implications for microwave-assisted rock fracturing. Geomech. Geophys. Geo-Energy Geo-Resour. 2020, 6, 22. [Google Scholar] [CrossRef]
- Zhao, Q.H.; Zhao, X.B.; Zheng, Y.L.; Li, J.C.; He, L.; He, J.L.; Zou, C.J. Heating characteristics of igneous rock-forming minerals under microwave irradiation. Int. J. Rock. Mech. Min. 2020, 135, 104519. [Google Scholar] [CrossRef]
- Reinosa, J.J.; García-Baños, B.; Catalá-Civera, J.M.; Fernandez, J.F. A step ahead on efficient microwave heating for kaolinite. Appl. Clay Sci. 2019, 168, 237–243. [Google Scholar] [CrossRef]
- He, L.; Qiu, J.; Hu, Q.; Wang, H.; Feng, S.; Gu, Y.; Zeng, J. Micro-mechanism of Shear Strength and Water Stability Enhancement of Montmorillonite by Microwave Heating. Mater. Res-Ibero-Am. J. 2021, 25, 20210260. [Google Scholar] [CrossRef]
- Hu, Q.; Gu, Y.; Zeng, J.; He, L.; Tang, H.; Wei, G.; Lu, X. Microwave irradiation reinforcement of weak muddy intercalation in slope. Appl. Clay Sci. 2019, 183, 105324. [Google Scholar] [CrossRef]
- Hu, Q.; Yong, Q.; He, L.; Gu, Y.; Zeng, J. Structural evolution of kaolinite in muddy intercalation under microwave heating. Mater. Res. Express. 2021, 8, 105503. [Google Scholar] [CrossRef]
- Gadikota, G.; Zhang, F.; Allen, A. In Situ Angstrom-to-Micrometer Characterization of the Structural and Microstructural Changes in Kaolinite on Heating Using Ultrasmall-Angle, Small-Angle, and Wide-Angle X-ray Scattering (USAXS/SAXS/WAXS). Ind. Eng. Chem. Res. 2017, 56, 11791–11801. [Google Scholar] [CrossRef]
- Yan, C.; Zheng, H. A coupled thermo-mechanical model based on the combined finite-discrete element method for simulating thermal cracking of rock. Int. J. Rock. Mech. Min. 2017, 91, 170–178. [Google Scholar] [CrossRef]
- Mazo, M.A.; Manevitch, L.I.; Gusarova, E.B.; Berlin, A.A.; Balabaev, N.K.; Rutledge, G.C. Molecular Dynamics Simulation of Thermomechanical Properties of Montmorillonite Crystal. II. Hydrated Montmorillonite Crystal. J. Phys. Chem. C 2008, 112, 17056–17062. [Google Scholar] [CrossRef]
- Li, S.X.; Gao, X.J. Acceleration mechanism of nonisothermal microwave heating on strength development of mortar. Compos. Struct. 2022, 279, 114765. [Google Scholar] [CrossRef]
- Sperinck, S.; Raiteri, P.; Marks, N.; Wright, K. Dehydroxylation of kaolinite to metakaolin-a molecular dynamics study. J. Mater. Chem. 2011, 21, 2118–2125. [Google Scholar] [CrossRef]
- Geng, J.; Sun, Q. Effects of high temperature treatment on physical-thermal properties of clay. Thermochim. Acta 2018, 666, 148–155. [Google Scholar] [CrossRef]
- Wang, G.Y.; Wang, H.J.; Zhang, N. In situ high temperature X-ray diffraction study of illite. Appl. Clay Sci. 2017, 146, 254–263. [Google Scholar] [CrossRef]
- Andrini, L.; Toja, R.M.; Gauna, M.R.; Conconi, M.S.; Requejo, F.G.; Rendtorff, N.M. Extended and local structural characterization of a natural and 800 °C fired Na-montmorillonite–Patagonian bentonite by XRD and Al/Si XANES. Appl. Clay Sci. 2017, 137, 233–240. [Google Scholar] [CrossRef]
- Qiang, S.; Zhang, W.; Qian, H. Effects of high temperature thermal treatment on the physical properties of clay. Environ. Earth. Sci. 2016, 75, 610. [Google Scholar] [CrossRef]
- Lai, T.M.; Shi, K.; Huang, P. Effect of water thin film on the adhesion force between two silica surfaces using AFM. J. Adhesion. 2020, 96, 691–716. [Google Scholar] [CrossRef]
- Hulan, T.; Trnik, A.; Stubna, I.; Bacik, P.; Kaljuvee, T.; Vozar, L. Development of Young’s Modulus of Illitic Clay during Heating up to 1100 degrees C. Mater. Sci. 2015, 21, 429–434. [Google Scholar] [CrossRef][Green Version]
Disclaimer/Publisher’s Note: The statements, opinions and data contained in all publications are solely those of the individual author(s) and contributor(s) and not of MDPI and/or the editor(s). MDPI and/or the editor(s) disclaim responsibility for any injury to people or property resulting from any ideas, methods, instructions or products referred to in the content. |
© 2023 by the authors. Licensee MDPI, Basel, Switzerland. This article is an open access article distributed under the terms and conditions of the Creative Commons Attribution (CC BY) license (https://creativecommons.org/licenses/by/4.0/).