Article

X-ray Computed Tomography of PGE-Rich Anorthosite from the Main Reef of the Yoko–Dovyren Layered Massif

by
Ivan V. Pshenitsyn
1,
Alexey A. Ariskin
1,2,*,
Dmitry V. Korost
2,
Sergei N. Sobolev
1,
Vasily O. Yapaskurt
2,
Georgy S. Nikolaev
1 and
Evgeny V. Kislov
3
1
Vernadsky Institute of Geochemistry and Analytical Chemistry, Russian Academy of Sciences, Kosygin Str. 19, 119991 Moscow, Russia
2
Faculty of Geology, Lomonosov Moscow State University, Leninskie Gory 1, 119234 Moscow, Russia
3
Dobretsov Geological Institute, Siberian Branch of the Russian Academy of Sciences, 670047 Ulan-Ude, Russia
*
Author to whom correspondence should be addressed.
Minerals 2023, 13(10), 1307; https://doi.org/10.3390/min13101307
Submission received: 14 July 2023 / Revised: 3 October 2023 / Accepted: 4 October 2023 / Published: 9 October 2023

Abstract

:
For the first time, we present results of a detailed X-ray computed tomography of mineralized anorthosite from the main low-sulfide PGE-rich horizon of the Yoko–Dovyren intrusion in Southern Siberia. These studies were carried out in three stages with the acquisition of information on different scales. At the first stage, a 5 × 6 cm size sample was scanned with a resolution as high as 200 µm; at the second stage, two 10 mm cores were drilled out of its most sulfide-rich zones, in which probable platinum group minerals (PGM) were found; the third stage included drilling out 3 mm cores in the areas potentially enriched in PGMs. Such a systematic study made it possible to visualize the distribution of sulfide in the volume of the plagioclase matrix, as well as to establish the spatial relationships of sulfides and PGMs. The mineralized layers of the anorthosite are characterized by a heterogeneous distribution of sulfides within 1 cm, while their contents do not exceed 10 vol.%. Most PGMs look like sub-isometric ones, as they are confined to the edges of sulfide segregations, less often occurring inside them; their size does not exceed 135 µm. Based on the results of stereological reconstructions, two small polished mounts were prepared that exposed the two largest grains of the probable PGMs. According to the results of SEM studies, one grain 35 µm in diameter in association with chalcopyrite and epidote at the margin of a sulfide segregation was identified as moncheite, and an elongated 135 µm long grain in the intergrowth with cubanite was identified as electrum.

1. Introduction

Over the past 15 years, there has been some progress in the X-ray computed tomography (CT) of mafic to ultramafic rocks from large layered intrusions, particularly due to the implementation of CT in ore-bearing rocks, including Cu-Ni sulfide ores, low-sulfide horizons enriched in platinum group elements (PGE), and chromitites [1,2,3,4]. This method has been applied to large (hundreds cm3) and small (up to several mm3) samples allowing for the non-invasive study of rock samples in an attempt to reconstruct the three-dimensional characteristics of their texture, and to obtain both the qualitative and quantitative structural relationships between various minerals, including the morphology and distribution features of phases with high X-ray absorption [3,4].
It is known that common optic methods of studying rock-forming minerals or their associations include the extrapolation of 2D information to the volume bulk “image” of the rock, that can lead to significant distortions of the real 3D structures and distributions due to variations in the shape and sizes of mineral individuals and their agglomerations. This is particularly true for sulfide blebs/globules and chromite crystals irregularly distributed in the silicate matrix of the rock. Using CT developments, these errors can be minimized when applied to samples of different sizes and varying resolutions from a few hundreds to several microns. These differences determine the specifics of the macro and micro X-ray computed tomography used in our study of a PGE-mineralized anorthosite from the Yoko–Dovyren massif in Southern Siberia (hereafter YDM or simply the Dovyren intrusion).

1.1. Short Notes on Previous CT Studies of Sulfide-Mineralized Rocks

An important aspect of CT studies includes obtaining statistically based quantitative information on the distribution of the mineral grains with high X-ray absorption, which seems to generate insight into the mechanisms of their origin and accumulation. E.g., on the basis of the morphological analysis of sulfides and their connectivity, the authors of [3] made a conclusion about the probable percolation of immiscible sulfide liquid (in the absence of silicate melt) in olivine cumulates from komatiite flows of the Norsman-Viluna greenstone belt in Western Australia. This is consistent with experimental study on the wetting behavior of minerals in sulfide-silicate systems [5]. Note that the term “connectivity” in CT studies is attributed to a fraction of the largest coherent object in the overall volume of a given phase. In a subsequent paper by Barnes et al. [2], they concluded that there were several generations of sulfides in olivine cumulates: some of them were originated in situ, while others were the result of percolation and accumulation. A significant part of this study was focused on statistical data on the size distribution (CSD) of sulfide globules, as well as on the degree of their “sphericity”.
In a fundamental review [6], the authors discussed the results of CT studies of disseminated sulfide mineralization from the Sunrise Dam gold mine in Eastern Australia and from the Mount Kit Cu-Ni deposit, focusing on the CSD of sulfides in terms of their equivalent sphere diameter. This parameter is useful for the statistical comparison of ensembles of individual grains that have slightly different shapes. In this case, each grain is interpreted to have a diameter of a sphere identical to the volume of the selected object [4]. Using such an approach, the authors could separate sulfide blebs into several genetic types.
Based on a petrographic and CT examination of samples from the Merensky Reef (Bushveld Complex, South Africa), it was concluded that the lower chromitite layer of the MR may play a crucial role as a physical barrier that prevents the sulfide liquid percolation from above, thus leading to its accumulation [7]. The low degree of sulfide connectivity in chromitite interlayers (in contrast to MR melanorite), and the overall distribution of sulfide segregations within the Merensky Reef is consistent with the experimental studies on the wetting of minerals in sulfide-chromite-silicate systems [8]. Further studies were focused on the distribution of platinum group minerals in the Merensky Reef, which were discovered as a result of CT reconstructions [9]. A number of important observations have been made combining data on the size, shape, quantities, and spatial association of PGMs with chromite, sulfides, and silicates. In particular, based on the similarity of these characteristics for PGMs from the upper and lower chromitite layers in the MR, it was concluded that the formation of two chromitite layers did not affect PGMs, which were originated as a result of a long-standing evolution of the original sulfide liquid solutions, including both their crystallization history and, probably, post-cumulus late-stage processes [9]. Other groups of researchers came to similar conclusions after CT investigations of the low-sulfide rocks from the Platinova reef in the Skaergaard intrusion [10,11].
In addition, the quantitative parameters which resulted from the CT studies (see above) allow one to better understand the possible fluid dynamics of sulfide-saturated magmas and the dynamics of the transfer of sulfide blebs through the cumulate piles. Thus, different shapes of the reconstructed CSD for sulfide globules and agglomerations, in combination with computer simulations, make it possible to propose a generalized genetic scheme of the formation and disintegration of sulfides depending on the style of magma dynamics (laminar or turbulent) [12].

1.2. X-ray Computed Tomography of the YDM Rocks

CT studies of the ore-bearing ultramafic and gabbroic rocks in Russia are still sporadic. The first systematic examination was carried out for the mineralized plagiodunites from the Yoko–Dovyren massif (Southern Siberia, Russia), for which an efficient technique to discriminate sulfides from chromite was proposed [4]. In addition, these results established differences in sulfide grains based on their CSD, in several cases with signatures of spatial orientation indicating the probable direction of the percolation and accumulation of original sulfide liquids.
Important results were obtained for the near-bottom apophysis of the Dovyren intrusion [13,14]: data for differently mineralized gabbronorite demonstrated that almost all mineralized rocks are characterized by an increase in the sulfide connectivity from 25 to 95%, in parallel to a complementary increase in their contents in the rocks. Combining these characteristics with a visual analysis of the 3D reconstructions of sulfides, we specified the structural and morphological trend for the studied rocks, ranging from those hosting separate sulfide globules to rich net-textured ores. Further geochemical-mineralogical studies, supported by modeling using the sulfide version of COMAGMAT, allowed for the quantitative interpretation of this trend as characterizing different stages of the compositional evolution of sulfides during progressive silicate-sulfide immiscibility in protocumulate systems [14].
Below we present the new results of a multi-scale CT study of PGE-rich Dovyren anorthosite, with a particular focus on searching for PGMs in samples followed by SEM studies. We hope that both the results and their interpretations will provide a better understanding of the origin of the PGE-rich low-sulfide mineralization of the reef style in layered intrusions.

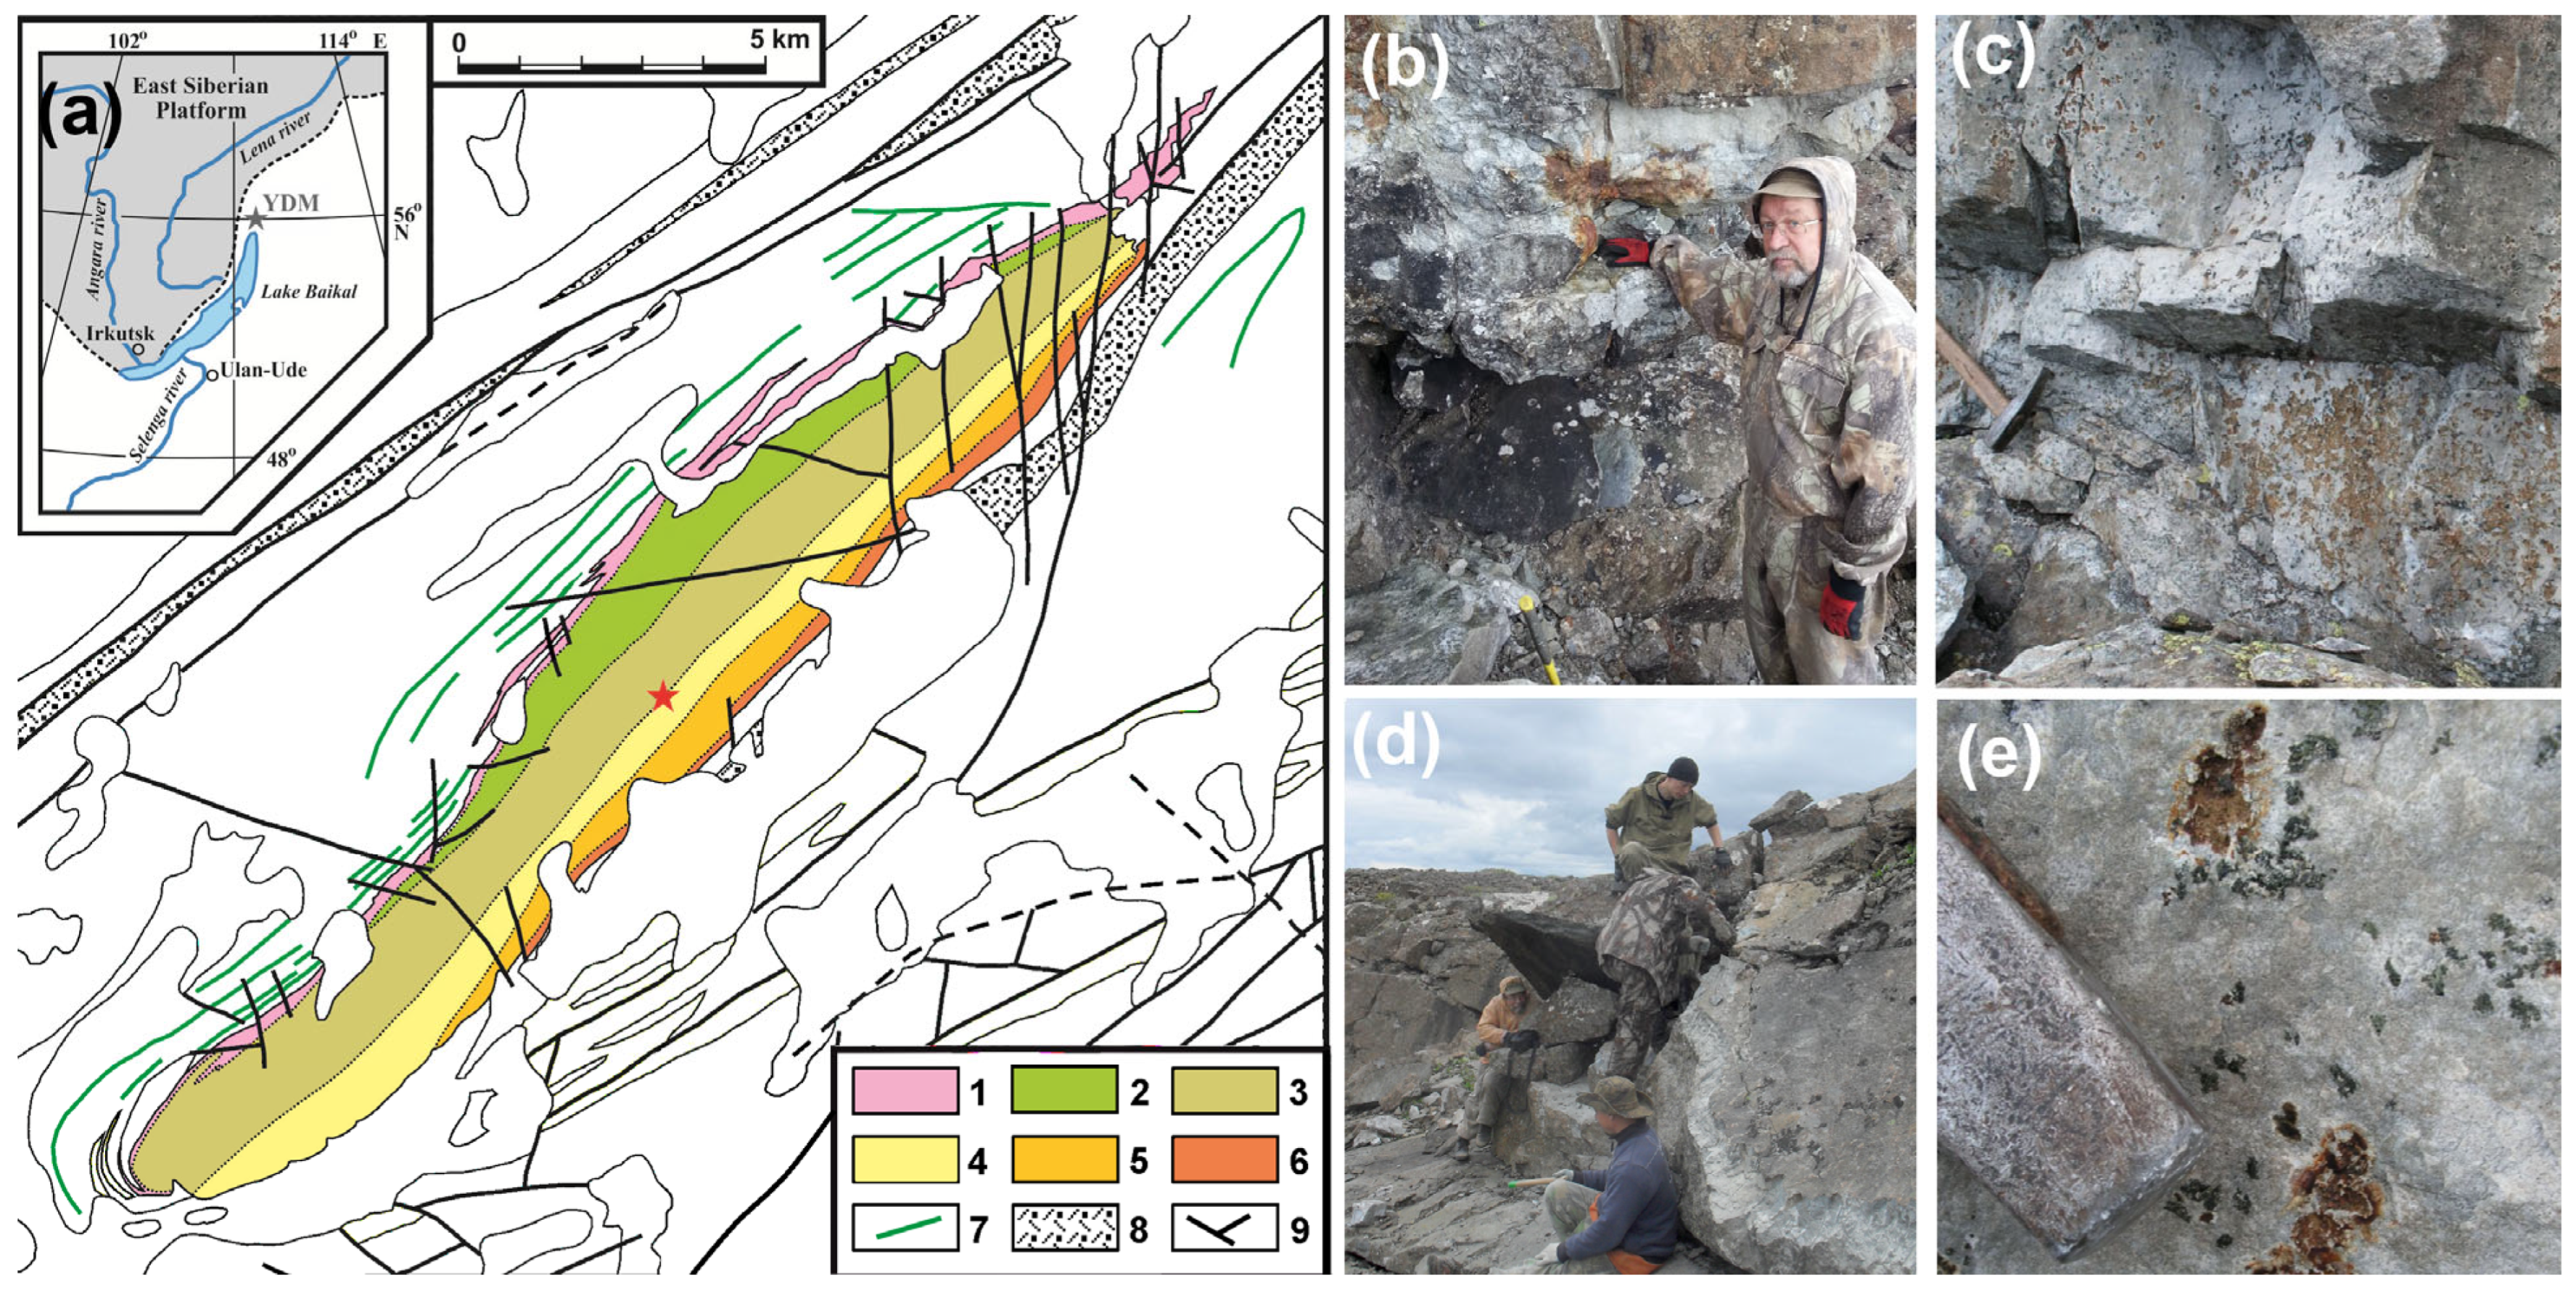
2. Geology, Stratigraphic Units, and the Structure of the YDM

The Yoko–Dovyren layered peridotite-dunite-troctolite-gabbronorite massif is located in the Northern Transbaikalia, 60 km away from the Lake Baikal, in a folded framing of the southern part of the Siberian Craton. The massif forms a ridge extending to the northeast at 40°–50°, which separates the basins of the Tyya, Ondoko, and Olokit rivers. With the surface size ~26 × 3.5 km, the Dovyren intrusion can be traced to a depth of 4.5 km, according to geophysical data [15]. The massif is sub-conformed with the host rocks; turned almost vertically relative to the initial bedding. It is characterized by a contrasting modal layering: from plagioperidotites and dunites in its lower part, to troctolite in the central zone, and to olivine gabbro and gabbronorite at higher stratigraphic levels (Figure 1a).
In fact, this large intrusive body belongs to the Dovyren Intrusive Complex of the Synnyr-Patom rifting area, which represents a back-arc spreading zone of the Upper Proterozoic age [16]. In addition to the main intrusion, it includes underlying sills and dykes of mafic and ultramafic rocks, as well as comagmatic gabbroic sills found above the upper contact of the massif [15,17]. The spatial relationships between the intrusive bodies and the volcanic rocks of the Synnyr rift suggest that this volcano–plutonic association was formed during magmatic activity that finished the evolution of the southwestern part of the Olokit-Bodaibo trough in the Late Riphaean age [15,16,17]. Reliable age estimates for the intrusion and associated volcanics were presented in [18]: 728.4 ± 3.4 Ma for the YDM and 722 ± 7 Ma for the associated rhyolites.
The Dovyren massif contains various types of sulfide mineralization, ranging from disseminated sulfides and massive ores of the Baikal deposit in the basal zone, to low-sulfide PGE—“reefs”—in its middle and upper parts [15,19,20].
Figure 1. General structure of the YDM with examples of outcrops of PGE-rich and barren anorthosites: (a) simplified map of the studied area (after [21] with changes), where the red star marks the location of the Main Reef anorthosites: 1 plagioperidotite, 2 plagiodunite and dunite, 3 troctolite, 4 olivine gabbro, 5 olivine gabbronorite, 6 quartz- and pigeonite-bearing gabbronorite, 7 mafic to ultramafic sills and dykes, 8 high-Ti basaltic flows, 9 faults; (be) two main outcrops of the Main Reef, the so-called (b) “northern” schlieren (E.V. Kislov is in the photo) and (d) “southern” schlieren; (c) the outcrop of barren anorthosites from the same stratigraphic horizon; and (e) locally mineralized anorthosite in more detail.
Minerals 13 01307 g001

2.1. Cumulate Succession of the Dovyren Rocks

The main sampling cross-section is located in the central part of the YDM, where the lower contact between the massif and the host rocks is exposed [15,18]. The main stratigraphic units correspond to the successive changes of the cumulus mineral assemblages: plagioperidotite (as Ol + Chr orthocumulate) → dunite (Ol + Chr adcumulate) → troctolite (Ol + Pl ± Chr adcumulate) → olivine gabbro (Pl + Ol + Cpx cumulate) → gabbronorites (Pl + Cpx + Opx ± Ol cumulate).
Plagioperidotites (commonly classified as plagioclase lherzolite [15,22]) form a 150 m thick horizon above quenched near-contact rocks ranging from fine-grained gabbronorite to picrodolerite. These types of rocks precede the main layered series. The average whole-rock composition of plagioperidotite is close to the average weighted composition of the YDM [18]; locally they contain copper-nickel sulfide mineralization. The layered series begins with plagiodunite, which contains up to 10%–12% plagioclase (An76–67), as well as minor amounts of clino- and orthopyroxene, phlogopite, and interstitial sulfides. This relatively thin horizon (~80 m) gradually changes to the dunite zone, which begins with alternating layers of plagiodunite and Pl-bearing dunite. Most dunites represent meso- to adcumulates which contain 80%–97% olivine (Fo86–89). The most Mg-rich olivine (Fo92–98) was found in the upper dunite sequence near the boundary with xenoliths of Mg-skarns after carbonates. These intensely metamorphosed brucite-serpentine xenoliths, up to 150 m in size [15], are confined to the central parts of the intrusion.
Towards higher horizons, the dunite zone is transitioned to a stratum of interbedding plagioclase-bearing dunite and troctolite, which differ in their content of leucocratic (plagioclase) and melanocratic (olivine) minerals. In the upper levels, the troctolite zone (as much as 900 m thick) changes to an interbedding with the olivine gabbro, which demonstrates a decrease in the amount of olivine in parallel to the increase in clinopyroxene and plagioclase. Anorthosite lenses and veinlets begin to occur at this transition horizon, sometimes forming anorthosite schlieren, including the PGM-rich occurrences. The next cumulate unit composed of olivine gabbro is quite homogeneous in mineral proportions and chemical composition. These rocks differ from the underlying leucotroctolite by the appearance of the first cumulus augite. This zone is irregularly transitioned into olivine gabbronorite and olivine-bearing (in some places Ol-free) gabbronorite with large oikocrysts of intercumulus bronzite. Cumulus minerals include olivine (Fo < 74), plagioclase (An60–50), clino- and orthopyroxene. The main cross-section is completed by quartz-bearing gabbro and granophyre gabbronorite, which are similar in their mineralogy and chemistry to the gabbroic dykes below the base of the massif.

2.2. Anorthosites of the Main Reef

A distinctive feature of the transition zone from troctolite to olivine gabbro is the presence of the anorthosite schlieren, as much as several meters thick, often surrounded by an irregular marginal zone of gabbro-pegmatite. In some places they contain low-sulfide mineralization occurring as relatively large domains or lenses of disseminated sulfides (Figure 1b), which may appear on a smaller scale as a sequence of 1 cm size veinlets, locally containing up to 10 vol.% sulfides in the plagioclase matrix. A number of PGMs are associated with the sulfide assemblages, producing high concentrations of noble metals in the rocks, with maximum values ranging from 12 ppm Pt + Pd and 3.2 ppm gold [23,24] to somewhat lower estimates of 7.8 ppm total PGE and 0.88 ppm Au [19]. Following on from formal analogues with other fertile layered intrusions, this schlieren-containing horizon was classified as a reef [20,21,24]. Detailed mineralogical studies allowed us to attribute this mineralization to the so-called “Stillwater type”, characterized by a predominance of moncheite and kotulskite with minor amounts of tetraferroplatinum, tulaminite, zvyagintsevite, rustenburgite, and other PGMs, see [19]. In fact, within this transition zone there are several other types of platinum-bearing rocks with markedly lower but still elevated PGE concentrations: low-mineralized gabbro-pegmatite, taxitic troctolite, and olivine leucogabbronorite. This heterogenous horizon can be traced along the strike of the YDM at high distances, generally conforming to the main layering of the massif [15].

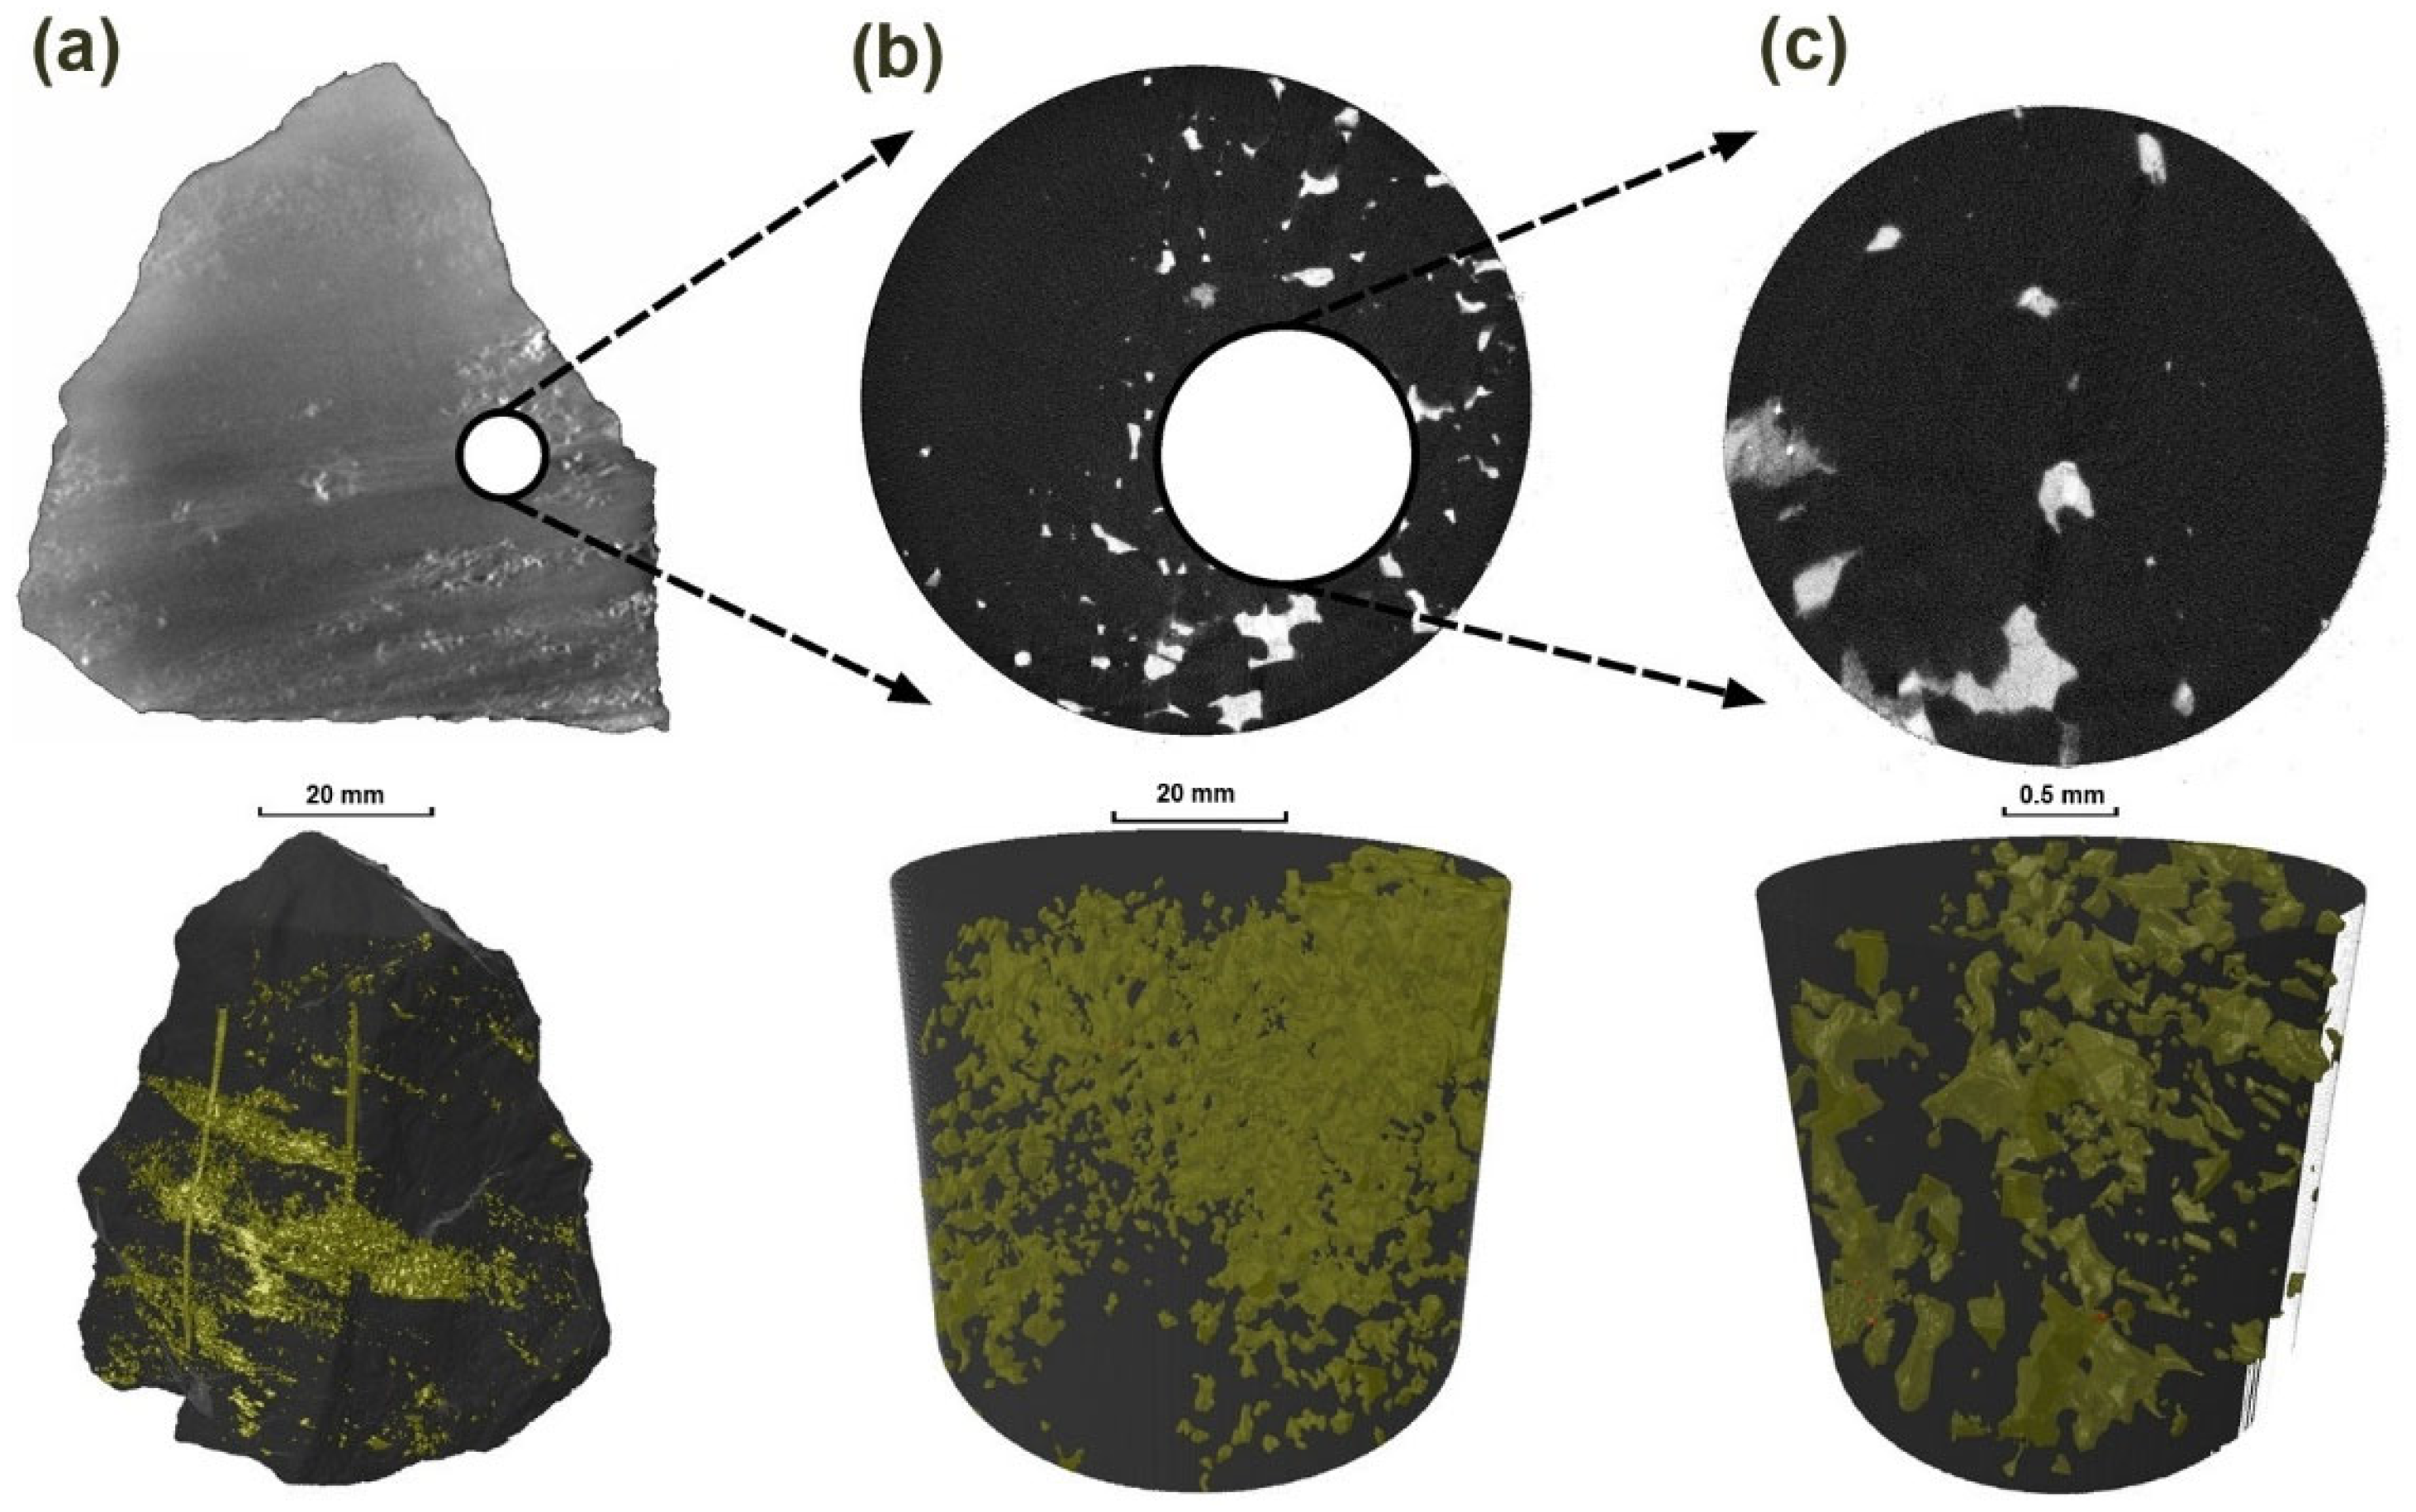
3. Samples and Methods

The main collection of PGE-mineralized samples was taken from two anorthosite outcrops that are exposed along the cliff of the glacier cirque (Figure 1a, the red star), conditionally the “northern” and “southern” ones (Figure 1b,d). Both outcrops have an irregularly rounded shape and a size of approximately 1.5 × 1.5 m. The northern schlieren is located almost directly on the cliff, whereas the southern one is about 5 m from the cliff precipice. Figure 2 shows both petrographic and mineralogical features of the sample 13DV539-9 taken from the “southern” schlieren and used in this study (Figure 1d).

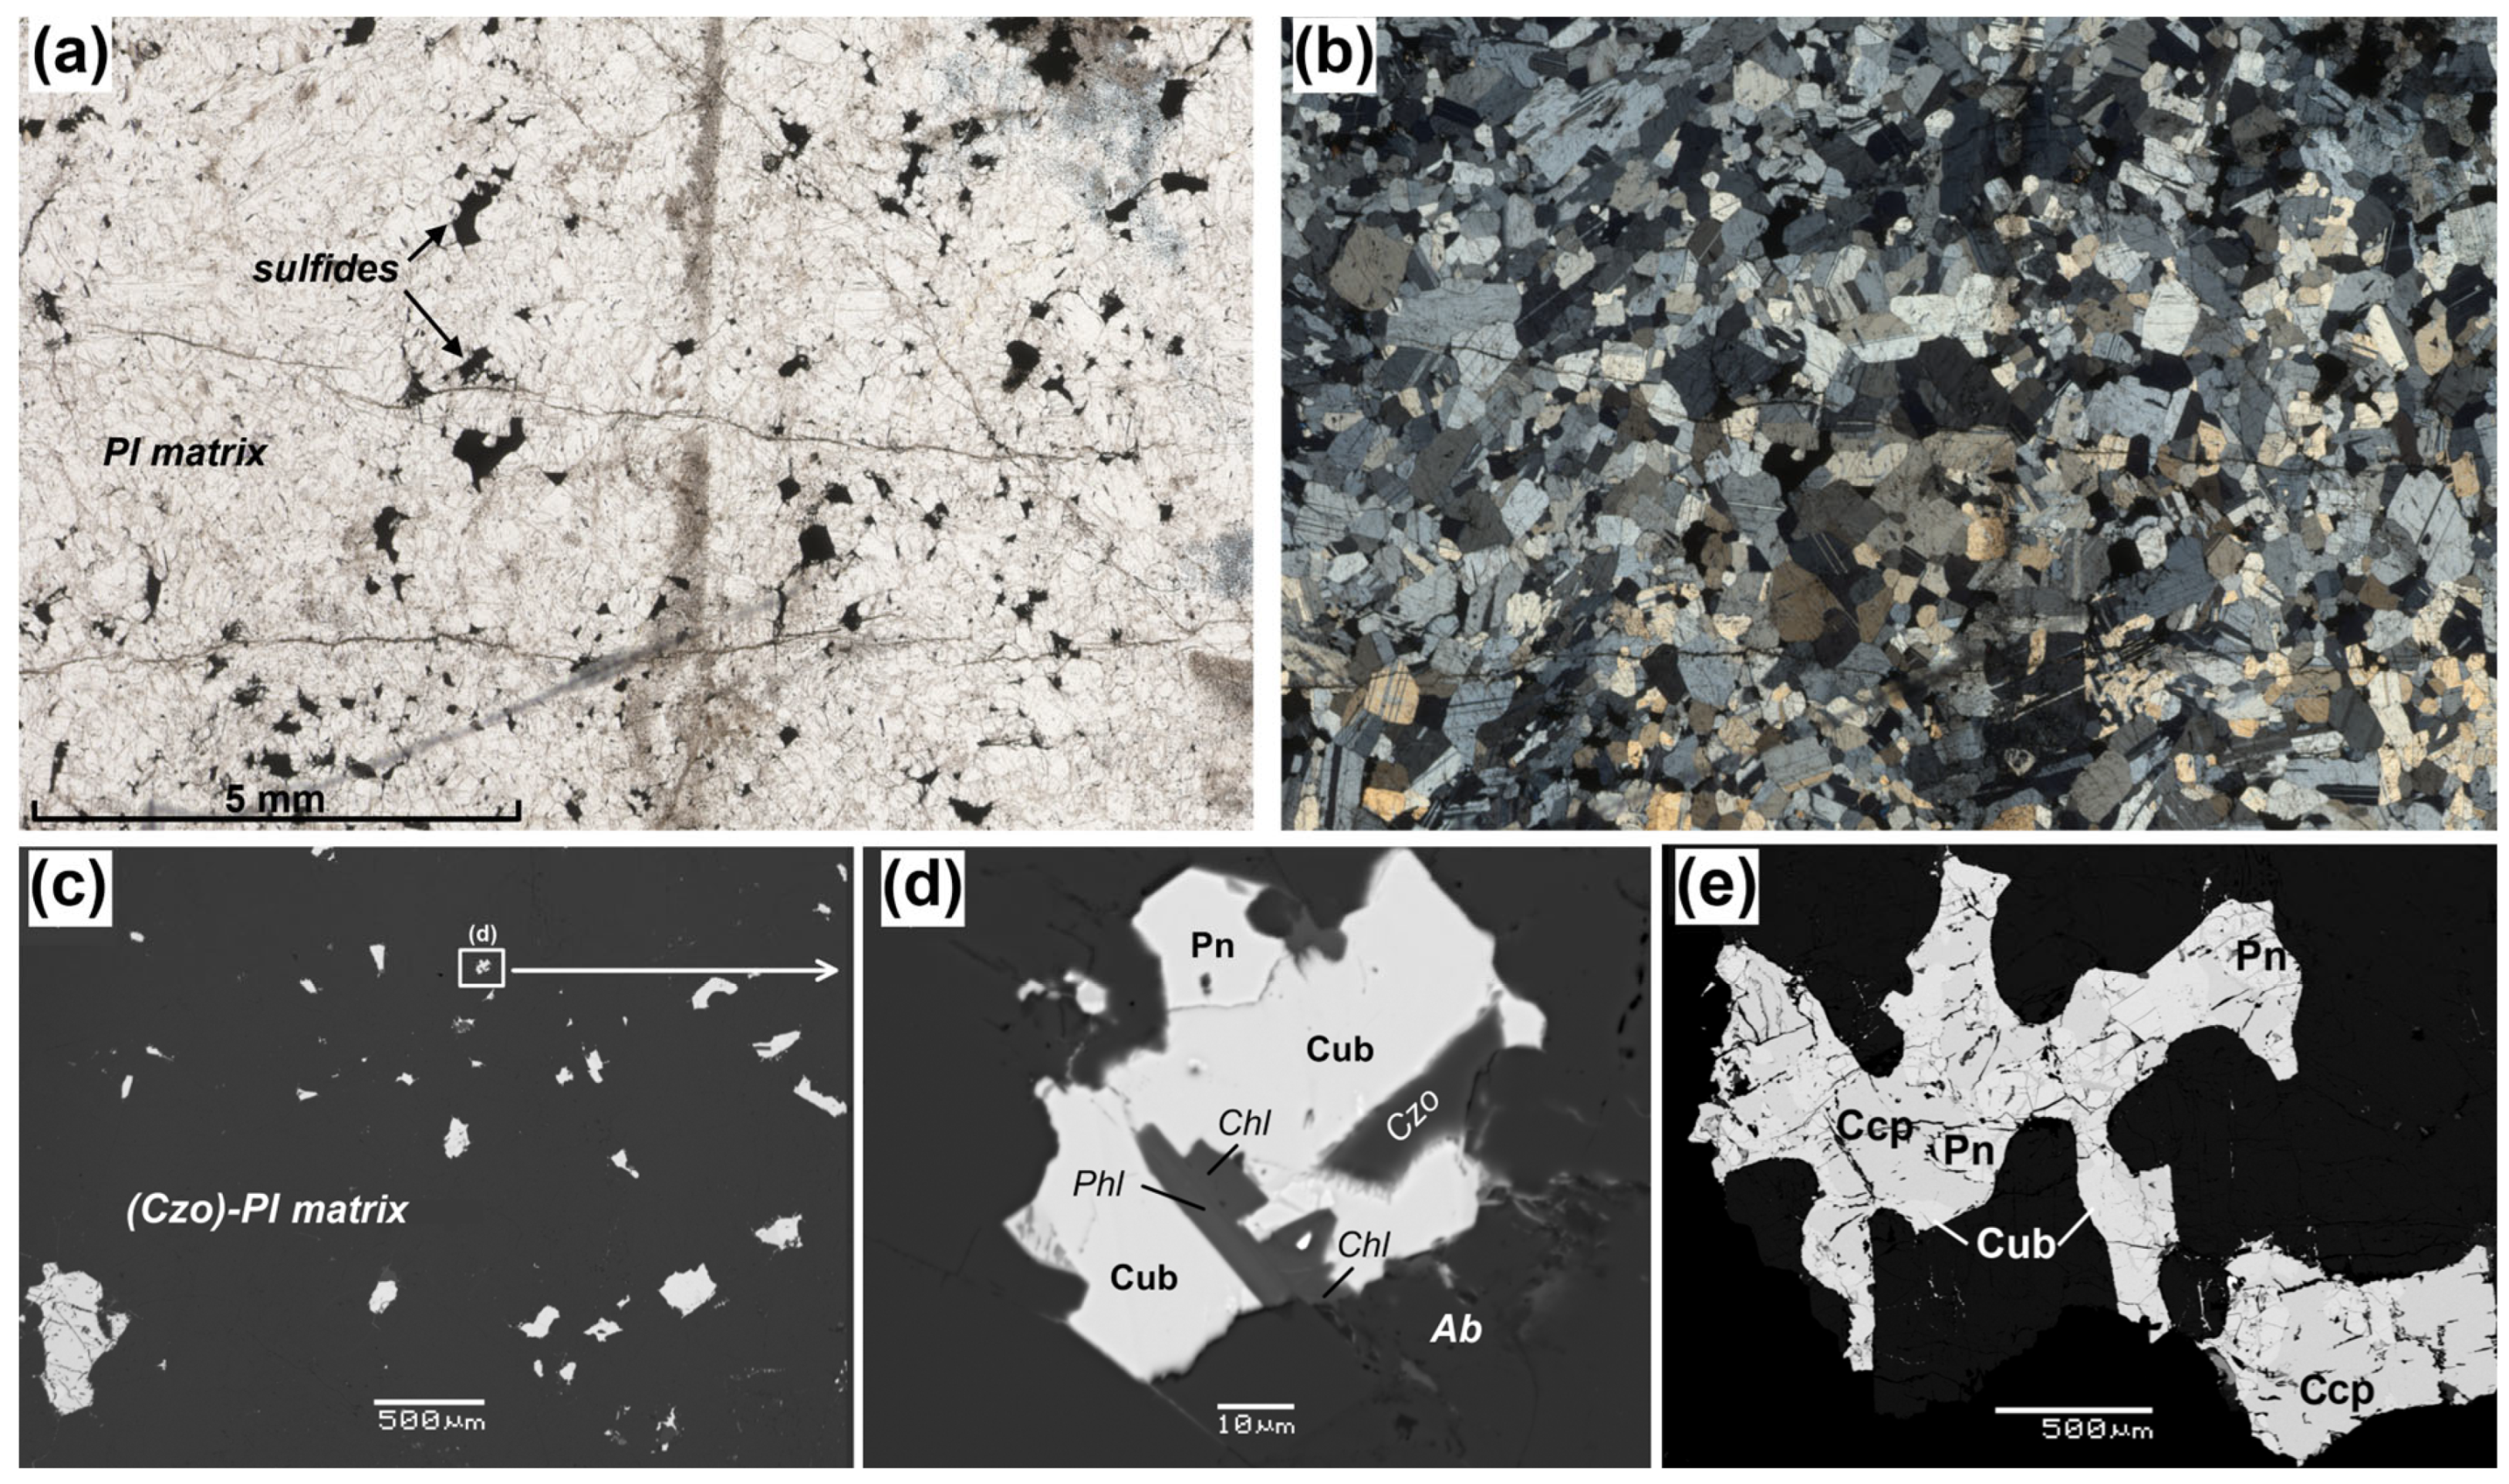
3.1. Mineralogy of the Studied Anorthosite

Figure 2a,b confirm this rock is a classic almost monomineral anorthosite, with a panidiomorphic-granular structure (Figure 2b), and containing only minor amounts of other minerals except plagioclase. The CIPW composition of an analyzed fragment of 13DV539-9 corresponds to 95 wt.% plagioclase, 0.9% olivine, and 2.1% sulfide, with a total S of 0.77 wt.% and 4689 ppm Cu. The average plagioclase composition is An85.9 ± 0.6, sometimes with Ca-bytovnite rims, which contain up to 88%–90% anorthite. In the case of the sulfide-rich domains, a significant part of the plagioclase is replaced by clinozoisite (as much as half of the total grains in some areas) and prenite (usually less than 1%), see Figure 2c,d. Secondary minerals in this sample include clinopyroxene, orthopyroxene, aluminochromite, and olivine; accessories are represented by chlorapatite, titanomagnetite, zircon, thorite, and baddeleyite.
Despite such a plagioclase-dominated composition (in the scale of 5–6 cm for the sample 13DV539-9), larger blocks of the 13DV539 outcrop locally have a taxitic, heterogeneous texture, due to variations in the size of the plagioclase crystals, the presence of areas of slightly different melanocraticity, and the irregular occurrences of sulfides. This mineralization is observed as disseminated sulfides filling interstices between plagioclase crystals rarely fill between intercumulus grains of clinopyroxene and plagioclase.
The sulfide assemblages include cubanite, pentlandite, chalcopyrite, troilite, and pyrrhotite. The size of the sulfide grains usually does not exceed 1.5 mm. Data of MLA measurements [20] indicate the variable relative proportions of the sulfide minerals ranging from around 20% pyrrhotite/troilite and pentlandite, to ~52% cubanite, and 8% chalcopyrite. For the further consideration, it is important that PGMs in the sample often occur as intergrowths with chalcopyrite and cubanite or observed as small separate grains in a metasomatized halo around the sulfide interstices.
In addition, note the presence of multiphase low-temperature mineral assemblages Czo + Chl ± Ab ± Pre ± Phl, which are observed along the periphery and, sometimes, inside relatively large sulfide grains (Figure 2e), as well as a part of the small heterogenous interstices between plagioclase crystals (Figure 2d).

3.2. Microprobe Studies

The petrographic description and micro-photographs were taken with Altami MET 1C (Altami, Saint Petersburg, Russia) and CARL ZEISS AXIO LAB.A1 (ZEISS Russia & CIS, Moscow, Russia) optical microscopes at the Faculty of Geology (Lomonosov MSU).
Microprobe studies of the mineral compositions were carried out in the Laboratory of Local Methods of Studying Matter (the Faculty of Geology, Lomonosov MSU, Moscow) on a JSM-6480LV electron microscope with a tungsten thermionic cathode equipped with an X-Max-N50 energy dispersive spectrometer (Oxford Instruments, High Wycombe, UK). Standards and samples were analyzed in the focused probe mode at an accelerating voltage of 20 kV and a probe current of 10 nA. In this case, the standards for metals, stoichiometric oxides, and sulfides were used. To process the measurement results using the XPP correction algorithm, the INCA shell (Oxford Instruments, version 21b) was used, which ensured the accuracy of the concentration of the major elements in the range of 0.5–2 rel.%.

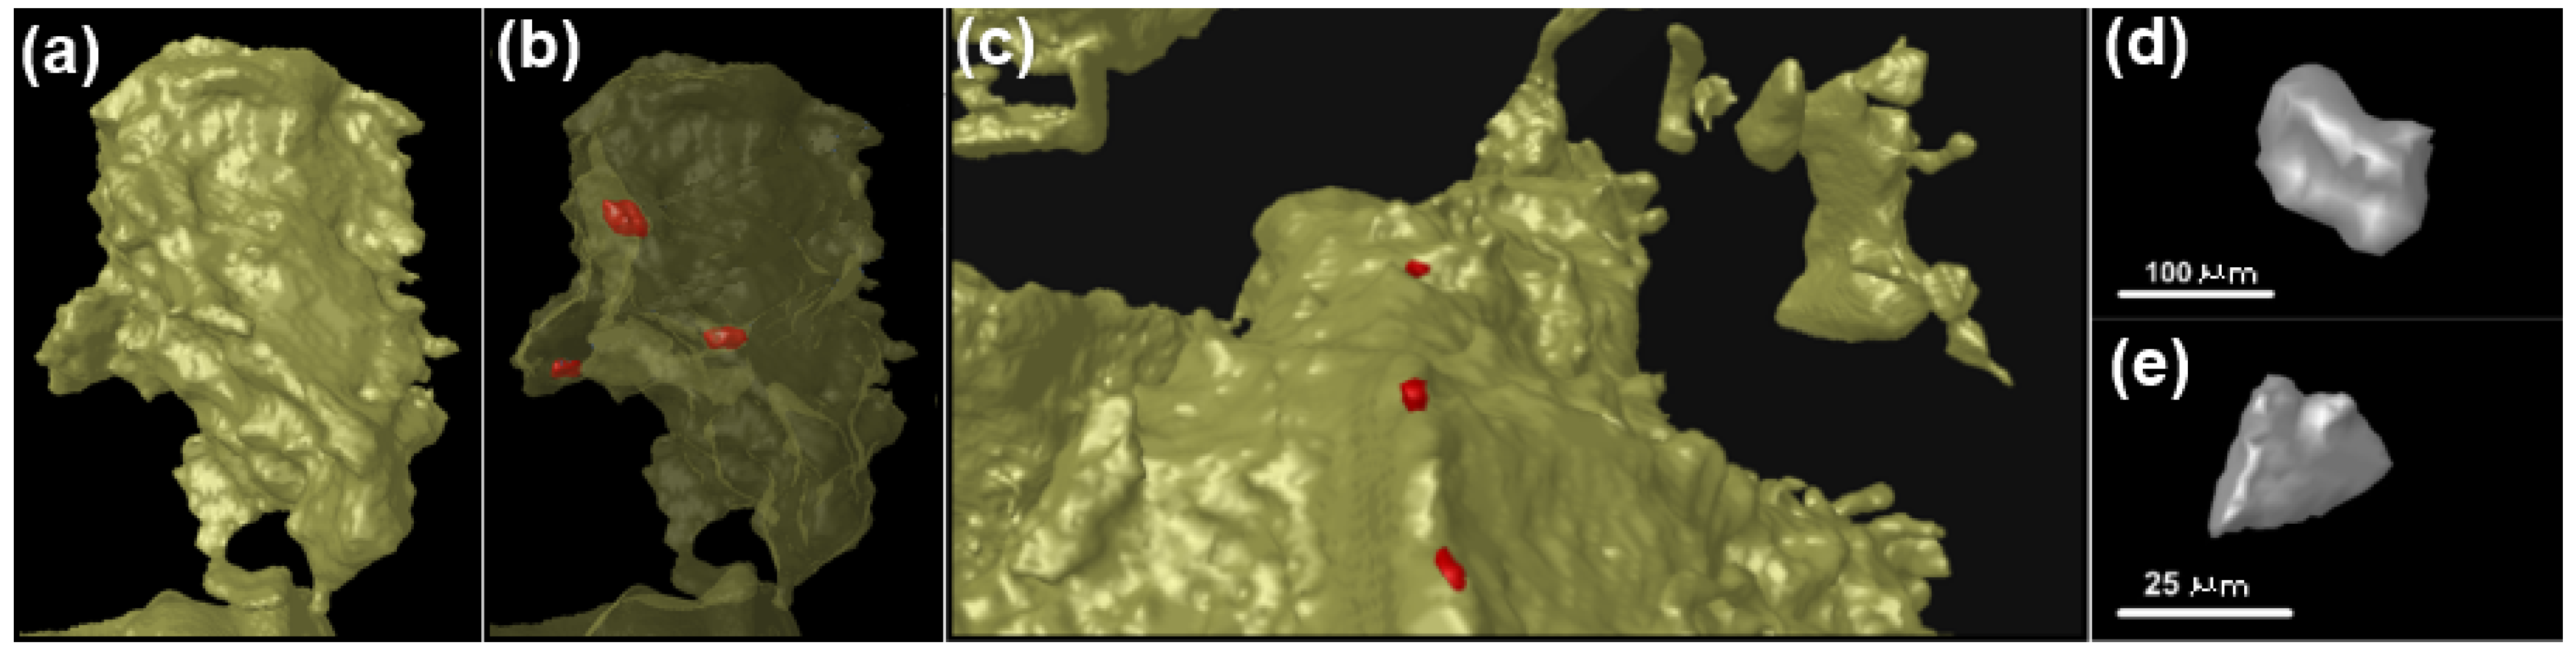
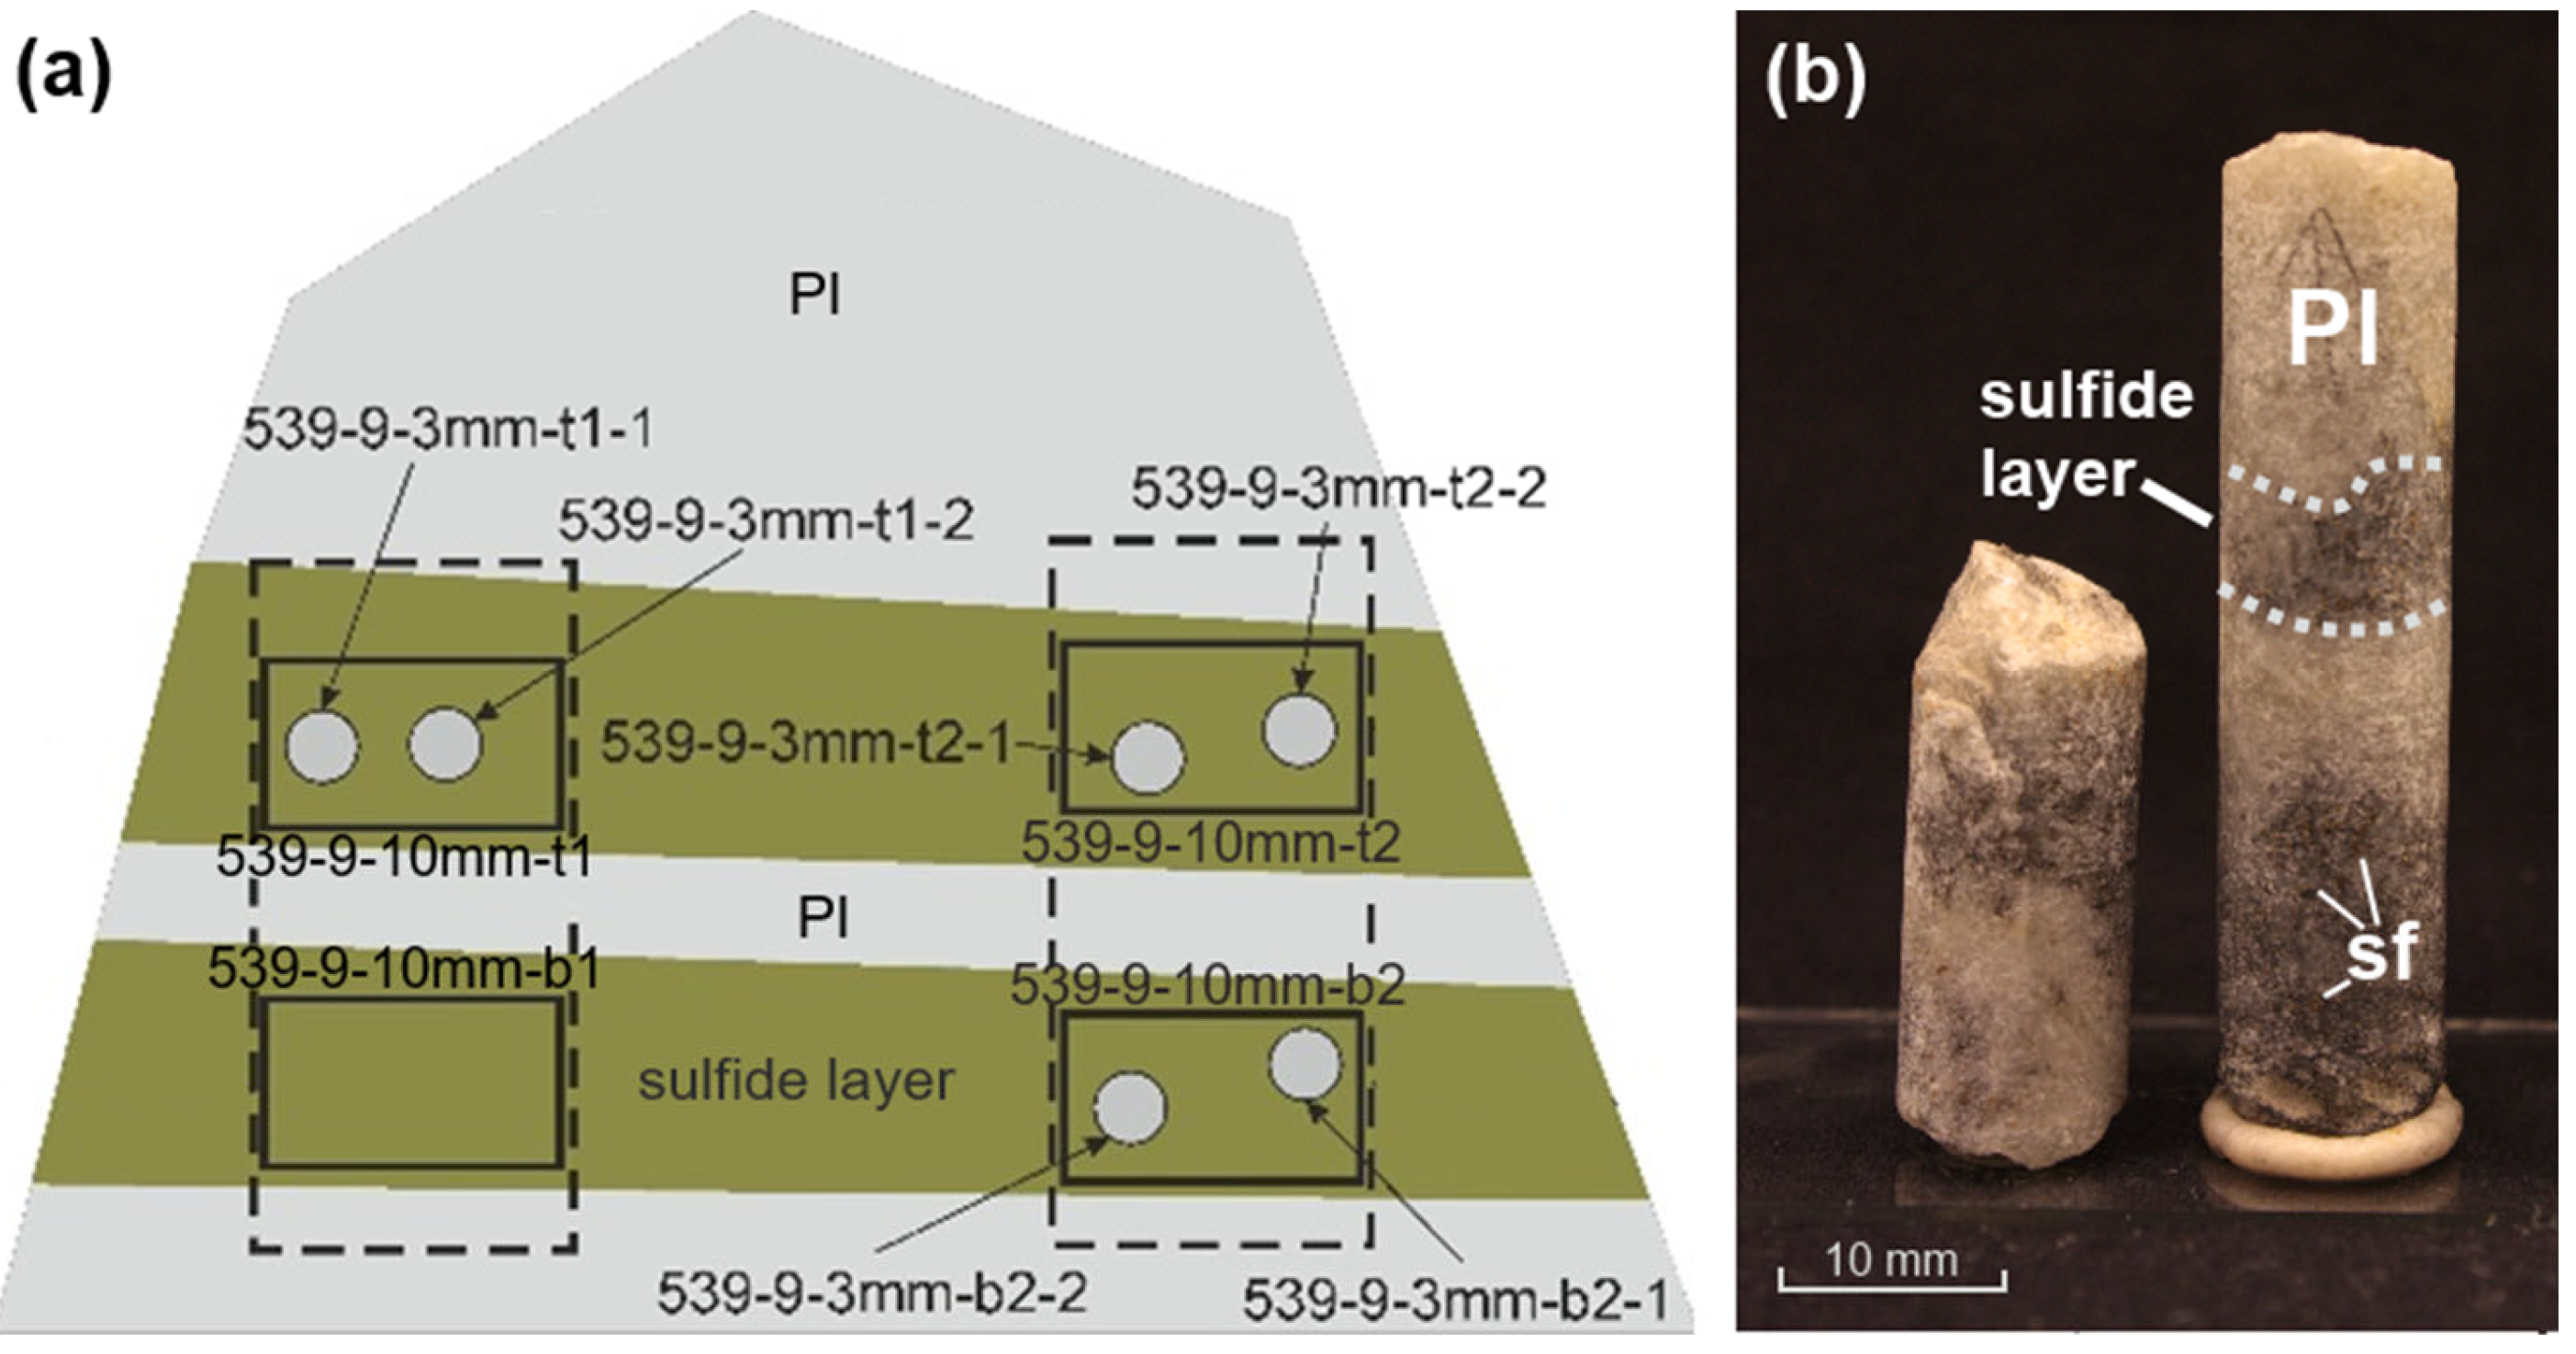
3.3. Three Stages of X-ray Computed Tomography

The original sample was approximately 5 × 6 × 4.5 cm in size, and composed of relatively unaltered plagioclase and including two certain 5–8 mm sublayers enriched in sulfides (Figure 3). The CT examination was carried out using three instrumental systems, providing data of different resolutions and information. At an initial stage, the whole sample 13DV539-9 was scanned using an RKT-180 tomography scanner (manufactured by Geologika, Novosibirsk, Russia) with a resolution of 100–200 µm. Based on the obtained results, two 10 mm cores were drilled out across its most sulfide-rich zones (see two green bands in Figure 3a). These cores were then studied on a Phoenix v|tome|x m300 scanner (Wunstorf, GE, USA) with a resolution of 40–70 µm.
The third stage included preparation of several additional 3 mm cores drilled out from the 10 mm cores normal to their elongation, i.e., approximately along the sulfide-rich areas, which are potentially enriched in PGMs. The smallest cores were scanned using the SkyScan-1172 scanner (Bruker, Mannheim, Germany), which made it possible to obtain data stacks with a resolution of 1–3 μm. The schematic presentation of the studied sample 13DV539-9 with approximate location of all drilled cores is shown in Figure 3.
Table 1. Contents of phases with high X-ray absorption in the volume of 10 mm and 3 mm cylinders.
SamplePl-Dominated
Silicate Matrix
SulfidesPhase 3
(Probable “PGM”)
vol.%Content, vol.%Connectivity, %Content, vol.%
13DV539-9
10mm-t194.395.6540.01
10mm-b191.18.98-
10mm-t295.394.6410.01
10mm-b294.595.4200.01
3mm-t1-199.10.912-
3mm-t1-289.0910.9890.01
3mm-t2-195.694.3410.01
3mm-t2-295.794.2630.01
3mm-b2-195.784.270.02
3mm-b2-296.04.012-
Table 2. Parameters of Phase 3 (probable PGMs) in the volume of the drilled samples.
SampleQuantity,
vol.%
Quantity,
Numbers
Max. Linear Size, µmSphericity *
13DV539-9
10mm-t10.01581150.81
10mm-t20.01411240.82
10mm-b20.0121800.84
3mm-t1-20.011431080.83
3mm-t2-10.011021350.83
3mm-t2-20.0111440.77
3mm-b2-10.021431040.80
* The sphericity is calculated as the ratio S1/S2, where S2 is the particle surface and S1 is the surface of a virtual ball of the same volume.

4. Results

Examples of scans of the whole sample 13DV539-9 and both types of the drilled cores are shown in Figure 4, Figure 5 and Figure 6 and two figures in the Discussion. The most important characteristics of sulfides and probable PGMs; including their volume percentage; connectivity; total number of X-ray contrasting phases; the maximum linear size of these particles and their average sphericity, which were calculated during processing of the original CT information, are listed in Table 1 and Table 2. Figure 4 is presented to provide insight into these original data, which come directly from the results of the CT scanning as a data stack including 1.5–2 thousand individual 2D plane images, allowing one to distinguish between mineral phases with different X-ray absorption. Thus, an example of just one rounded section to the left in Figure 4 and its enlarged fragment to the right show that this rock is mostly composed of plagioclase and its alteration products (the “dark phase 1”, ~90%), intercumulus sulfides (the “gray phase 2”, ~10%), and very rare individual particles of the “bright phase 3”, which seem to represent the probable PGM.
Combining these individual sections into a single vertical sequence of CT images enables 3D reconstructions, which provide information on the volume distribution of these minerals, such as those shown in the cylinders in Figure 5b,c. Results of the corresponding calculations for all drilled cores/cylinders indicates that these rock fragments contain 89%–99% plagioclase, and sulfides in an amount of 1% to 11%, whereas the content of the potential PGM does not exceed 0.02% (Table 1).

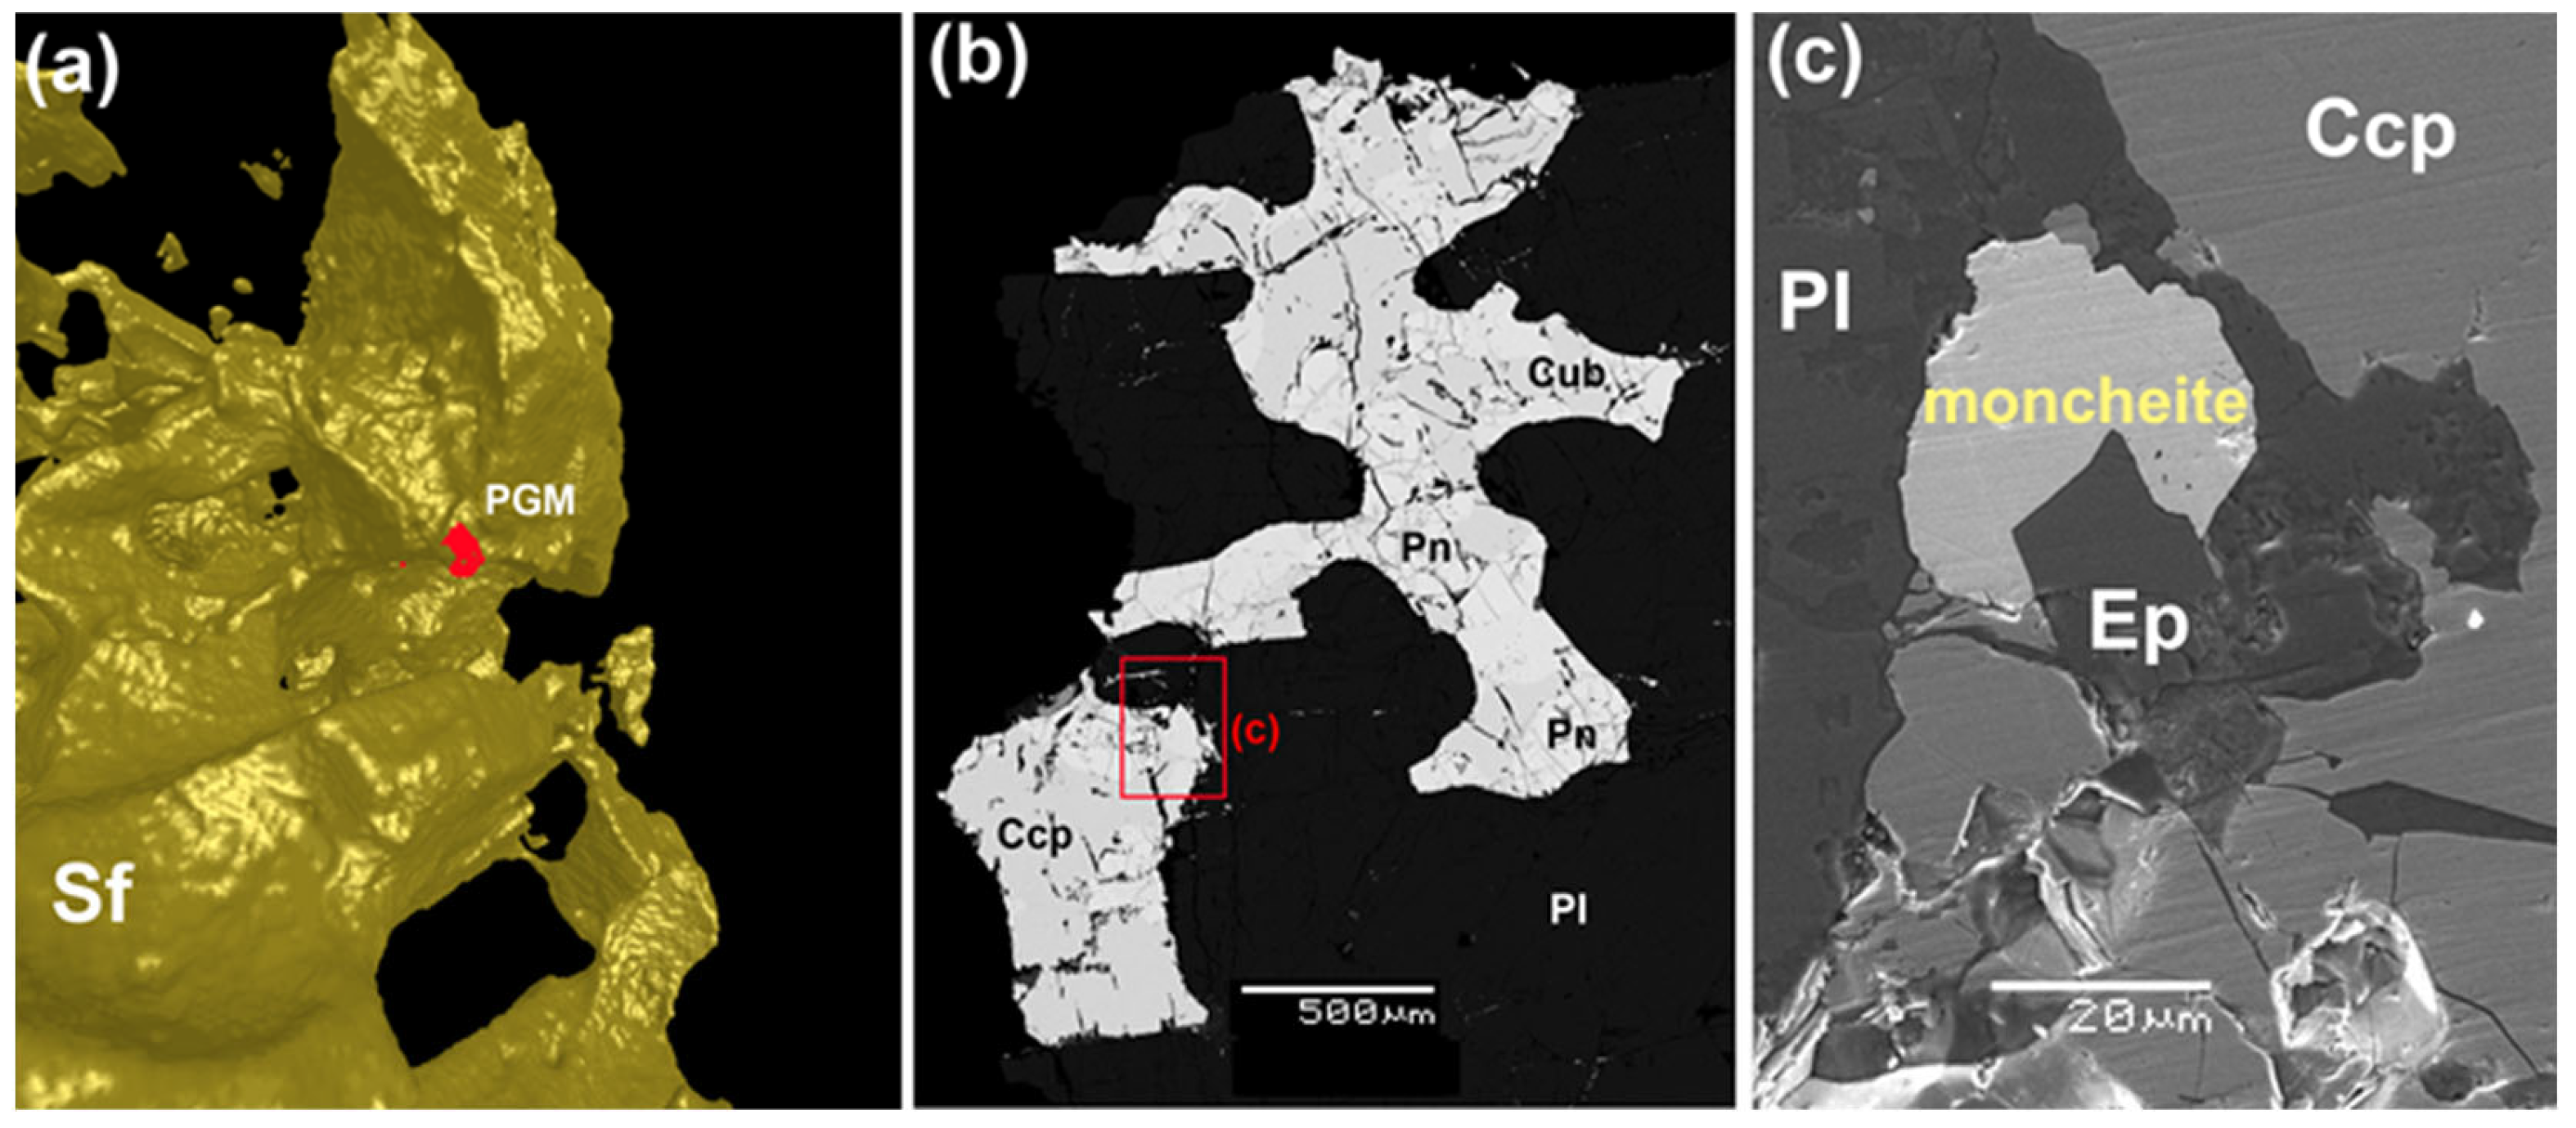
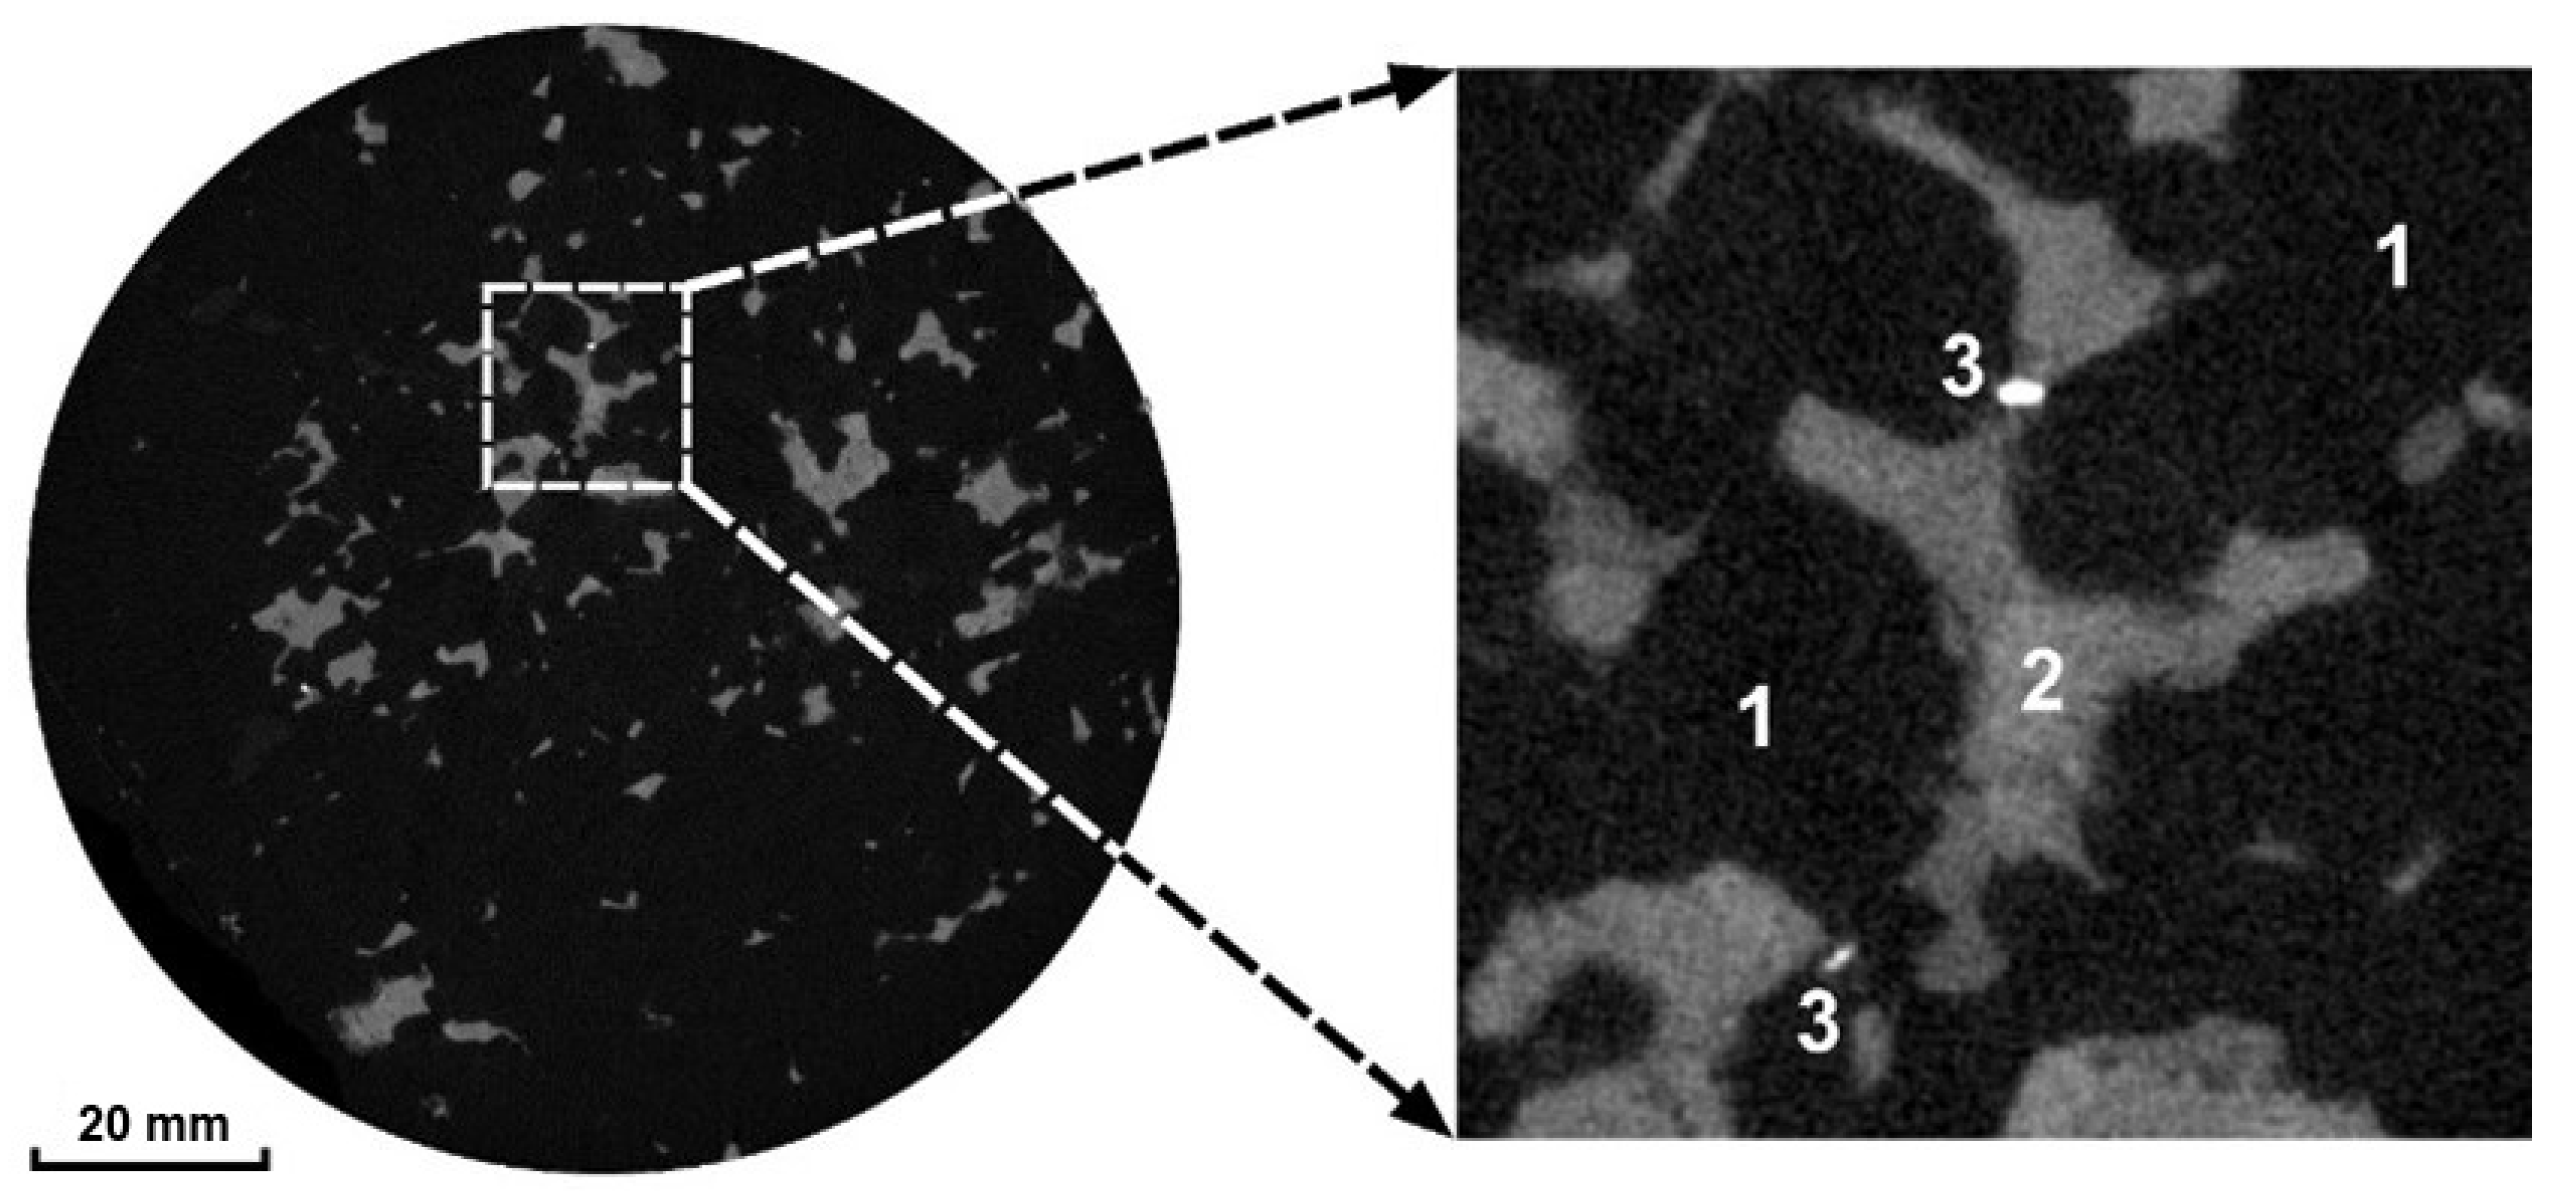
Searching for PGE Minerals and Their Characteristics

Due to the rather small size of the individual PGM grains (whose X-ray images in only a few cases reached a hundred µm across the side), their search and identification were carried out in two stages. At the beginning, each of the two 10 mm cores was visually analyzed in the CTVox program by highlighting the most X-ray contrasting phases in the sample volume (the so-called “Phase 3” in Table 1 and Table 2). After finding phases with extremely high X-ray absorption in the 10 mm cores, 3 mm diameter mini-cylinders were drilled out across the (visually) “PGM-rich” areas to be used for additional high-resolution scanning via the SkyScan-1172 scanner. As a result, the presence of the probable PGMs was established in four of six 3 mm core samples, with Phase 3 characteristics listed in Table 1 and Table 2. Using the results of the final scanning, both sulfide (Phase 2) and Phase 3 characteristics were again calculated. In the absence of the Phase 3 as a potential PGM, the data stack was analyzed only with respect to peculiar properties of the sulfide phase, and this specific sample was excluded from the further work. We believe that the data for 10 mm cylinders are more representative for estimating the number of the PGMs, while those for 3 mm cylinders more accurately characterize the size and morphology of these grains (Table 1 and Table 2).
As it follows from Table 1, the maximum size of potential PGMs does not exceed 100–200 µm, whereas data with the highest resolution of 1–3 μm indicate a more certain range of maximum linear sizes 44–135 μm (Table 2). Relatively high values of the sphericity in Table 2 (0.77–0.84) suggest a sub-isometric form of the “PGM” grains, which indeed demonstrate some diversity (Figure 6d,e). A unique result of the complex study is that we succeeded in the determination of the accurate location of the two largest PGMs in 3 mm cores, followed by very tiny planar cuts for exposing them and the preparation of two small polished sections. These samples were then studied using SEM. It is noteworthy that both the largest potential PGMs were found in the same 10 mm-b2 core.

5. Discussion

5.1. Regarding Sulfide Connectivity

It is seen in Table 1 that the “connectivity” of sulfides (as the proportion of the largest single cluster in the total volume of Phase 2) varies in a wide range, however, it does not correlate with the amount of sulfides in the rock. In the case of samples with such an uneven distribution of sulfides, the possibility of extrapolating these observations to the whole anorthositic sample critically depends upon the selected drilled core diameter. For example, in a 3 mm cylinder (see 3mm-t1-2 in Table 1), the calculated connectivity reaches as much as 90%, which is close to the characteristics of net-textured ores [14], however, the real sulfide content in this anorthosite is not so high and rarely exceeds 10%. One could suggest that very similar characteristics might be obtained as a result of the presence of a relatively large sulfide globule in the core (or its fragments) isolated from the main dispersed mineralization, however, visual analysis of 3D models does not confirm this. For this reason, we suggest that the specific 3 mm core was drilled out of a local domain, where most sulfides were connected through the porous space between plagioclase crystals.
These speculations give rise to the conclusion that it is difficult to obtain a confident estimate of the bulk value of sulfide connectivity in PGE anorthosite, so one can only state that the sulfides are to be distributed rather unevenly within the mineralized layers. Those can form domains with relatively high sulfide contents, but with their connectivity low (e.g., sample 10mm-b1), or produce local domains (probably up to the first mm in size) with a very high degree of the sulfide connectivity.

5.2. Associations of Potential PGMs and Sulfides

Visualization of the spatial relationships between the largest grains of Phase 3 (as potential PGM) and Phase 2 (sulfide) showed that the “PGM” grains are mostly confined to the elongated marginal edges of sulfide grains, often contacting both the sulfide and plagioclase (in about 85% of their total occurrences), see Figure 6c. In this case, often they have the most isometric sub-idiomorphic shape (Figure 6d). Less often, the individual “PGMs” are located on the edges of such sulfide blebs (with their shape closer in the “pyramid”, Figure 6e). The “PGMs” can also be found in relatively narrow isthmuses between sulfide grains and plagioclase, as well as inside the sulfide grains or small globules. In this case, their shape is the most asymmetric, mostly elongated, similar to those shown in Figure 6b. It is noteworthy that the majority of the “PGM” particles, which are confined to the sulfide edges, stand apart from each other (Figure 6c). In some cases, when such small “PGM” grains are found in the internal volume of sulfides (Figure 6a,b), those seem to be grouped and spaced from each other at a distance not exceeding 100–150 µm.
The described relationships of the PGMs and sulfides evidence their genetic link, obviously due to the original sulfide liquids that were the main carriers of the noble metals tellurium and bismuth [9,10,11,14,20]. However, these observations do not provide a certain answer to the question about the probable mechanisms of the formation of the PGE minerals. Some insight into this problem comes from the results of the SEM studies of the “PGM”-sulfide assemblages.

5.3. SEM Studies of the Potential PGMs

Chemical studies and mineralogical diagnostics of two relatively large grains of Phase 3 were carried out using a JSM-6480LV electron microscope equipped with an X-Max-N50 EDS. Two small polished sections resulting from cutting samples 3mm-t2-1 and 3mm-t2-2 were used, with the size of the potential PGMs 135 µm and 35 µm, respectively. In the first case a grain of moncheite Pt(Te, Bi, Pb)2 was identified (Figure 7), whereas the other one proved to be electrum in intergrowth with cubanite (Figure 8).
The moncheite grain varies in its chemical composition within 43.2–50.9 wt.% Te, 39.5–41.0 wt.% Pt, 1.9–2.9 wt.% Pb, and 4.5–9.9 wt.% Bi, due to a partial isomorphic substitution of the tellurium with bismuth, which is typical for Dovyren moncheite [19,20] (see representative compositions in Table 3). Accounting for the moncheite intergrowth with a similar-size grain of epidote (Figure 7c), we argue that the PGE mineral was finally formed at a late, low-temperature magmatic stage, probably under the effect of a hydrous residual fluid.
On the opposite side, the grain of Ag-rich electrum is extremely homogeneous, with a predominance of gold over silver (Table 3). This discovery of so large a Ag-rich electrum intergrowth with intercumulus cubanite deserves a special attention. As we know, this occurrence has been discovered for the first time in the history of mineralogical studies of the Dovyren PGE-rich anorthosites [19]. The electrum grain, as shown in Figure 8c, connects two pretty large cubanite grains, without any occurrence of associated hydrous minerals. At the same time, the occurrence of the electrum itself may evidence a low-temperature process [25], proceeding at a late stage of the evolution of the original sulfide-bearing assemblages in the pore space of the solidifying anorthositic adcumulates.
Thus, based on the results of X-ray computed tomography and related mineralogical examinations of only two large grains with the highest X-ray absorption, it is not possible to give an unambiguous answer about mechanisms of the PGM formation in mineralized anorthosites from the Main Reef of the Yoko–Dovyren massif. On the one hand, we provide arguments for a post-magmatic fluid-controlled formation of the observed grain of the moncheite, almost contemporaneously with the crystal of epidote (Figure 7c). On the other hand, the observed aggregate of electrum and cubanite (Figure 8c) may evidence a similar contemporaneous low-temperature origin of these minerals in the absence of the fluid influence.

6. Conclusions

Results of the multiscale X-ray computed tomography of the sulfide and PGE-mineralized anorthosite from the Main Reef of the Yoko–Dovyren massif supported previous conclusions on the close spatial association of sulfides and noble metal minerals, including a 3D visualization of their relationships, as well quantification of a number of structural parameters, such as the extent of the sulfide connectivity, morphology, and CSD for a number of the potential PGMs.
The detailed studies of two large grains of moncheite and electrum, revealed during CT and SEM investigations, suggest two related processes responsible for the formation of the noble metal minerals. An initial stage includes the accumulation of immiscible sulfides in the pore space of highly crystallized anorthositic precursors (which, probably, have been formed as schlieren in the olivine-dominated cumulate pile), followed by their prolonged crystallization and subsolidus transformations at decreasing temperatures. The final part of their history suggests the important role of low-temperature processes, probably under the effect of late-stage residual fluids, which are responsible for the final distribution and morphology of the sub-idiomorphic grain of moncheite in association with epidote and the occurrence of the aggregate of Ag-rich electrum and cubanite.
To make definitive conclusions about the role of the late-stage processes in the origin of PGMs in Dovyren anorthosites, a more representative dataset is necessary, including the results of additional X-ray computed tomography examinations at different scales and detailed SEM studies of the observed PGE minerals and other noble metal minerals.

Author Contributions

Conceptualization and methodology, I.V.P., D.V.K. and A.A.A.; investigation (including field work), I.V.P., A.A.A., D.V.K., S.N.S., V.O.Y., G.S.N. and E.V.K.; writing—original draft preparation, I.V.P. and A.A.A.; writing—review and editing, A.A.A., I.V.P. and E.V.K. All authors have read and agreed to the published version of the manuscript.

Funding

The final version of the manuscript was supported by the RSF grant No 23-77-01036.

Data Availability Statement

The data supporting the reported results can be provided by the corresponding author upon request.

Acknowledgments

Initial versions of this paper were prepared within the scope of the government-financed research project FMUS-2019-0004 at the Vernadsky Institute of Geochemistry and Analytical Chemistry (RAS, Moscow) and supported by GIN SB RAS (Ulan-Ude) Project No AAAA-A21-121011390003-9. We are grateful for the careful editing, suggestions, and constructive comments from anonymous reviewers, which greatly improved the presentation of the research results.

Conflicts of Interest

The authors declare no conflict of interest.

References

  1. Baker, D.R.; Mancini, L.; Polacci, M.; Higgins, M.D.; Gualda, G.A.R.; Hill, R.J.; Rivers, M.L. An introduction to the application of X-ray microtomography to the three-dimensional study of igneous rocks. Lithos 2012, 148, 262–276. [Google Scholar] [CrossRef]
  2. Barnes, S.J.; Mungall, J.E.; Le Vaillant, M.; Godel, B.; Lesher, M.C.; Holwell, D.; Peter, C.; Lightfoot, P.C.; Krivolutskaya, N.; Wei, B. Sulfide–silicate textures in magmatic Ni–Cu-PGE sulfide ore deposits: Disseminated and net-textured ores. Am. Mineral. 2017, 102, 473–506. [Google Scholar] [CrossRef]
  3. Barnes, S.J.; Fiorentini, M.L.; Austin, P.; Gessner, K.; Hough, R.M.; Squelch, A.P. Three dimensional morphology of magmatic sulfides sheds light on ore formation and sulfide melt migration. Geology 2008, 36, 655–658. [Google Scholar] [CrossRef]
  4. Korost, D.V.; Ariskin, A.A.; Pshenitsyn, I.V.; Khomyak, A.N. X-Ray computed tomography as a method for reproducing 3D characteristics of sulfides and spinel disseminated in plagiodunites from the Yoko-Dovyren intrusion. Petrology 2019, 27, 370–385. [Google Scholar] [CrossRef]
  5. Mungall, J.E.; Su, S. Interfacial tension between magmatic sulfide and silicate liquids: Constraints on kinetics of sulfide liquation and sulfide migration through silicate rocks. Earth Planet. Sci. Lett. 2005, 234, 135–149. [Google Scholar] [CrossRef]
  6. Pearce, M.A.; Godel, B.M.; Fisher, L.A.; Schoneveld, L.E.; Cleverley, J.S.; Oliver, N.H.S.; Nugus, M. Microscale data to macroscale processes: A review of microcharacterization applied to mineral systems. Geol. Soc. London: Spec. Publ. 2017, 453, 7–39. [Google Scholar] [CrossRef]
  7. Godel, B.M.; Barnes, S.-J.; Maier, W.D. 3-D distribution of sulfide minerals in the Merensky Reef (Bushveld Complex, South Africa) and the J-M Reef (Stillwater Complex, USA) and their relationship to microstructures using X-ray computed tomography. J. Petrol. 2006, 47, 1853–1872. [Google Scholar] [CrossRef]
  8. Rose, L.A.; Brenan, J.M. Wetting properties of Fe–Ni–Co–Cu–O–S melts against olivine: Implications for sulfide melt mobility. Econ. Geol. 2001, 96, 145–157. [Google Scholar] [CrossRef]
  9. Godel, B.M.; Barnes, S.J.; Barnes, S.-J.; Maier, D. Platinum ore in three dimensions: Insights from high-resolution X-ray computed tomography. Geology 2010, 38, 1127–1130. [Google Scholar] [CrossRef]
  10. Godel, B.M.; Rudashevsky, N.S.; Nielsen, T.F.D.; Barnes, S.J.; Rudashevsky, V.N. New constraints on the origin of the Skaergaard intrusion Cu–Pd–Au mineralization: Insights from high-resolution X-ray computed tomography. Lithos 2014, 190, 27–36. [Google Scholar] [CrossRef]
  11. Holwell, D.A.; Barnes, S.J.; Le Vaillant, M.; Keays, R.R.; Fisher, L.A.; Prasser, R. 3D textural evidence for the formation of ultra-high tenor precious metal bearing sulphide microdroplets in offset reefs: An extreme example from the Platinova Reef, Skaergaard Intrusion, Greenland. Lithos 2016, 256–257, 55–74. [Google Scholar] [CrossRef]
  12. Robertson, J.C.; Barnes, J.S.; Le Vaillant, M.L. Dynamics of magmatic sulphide droplets during transport in silicate melts and implications for magmatic sulphide ore formation. J. Petrol. 2016, 56, 2445–2472. [Google Scholar] [CrossRef]
  13. Pshenitsyn, I.V.; Ariskin, A.A.; Nikolaev, G.S.; Kislov, E.V.; Korost, D.V.; Yapaskurt, V.O.; Sobolev, S.N. Morphology, Mineralogy, and Composition of Sulfide Droplets in Picrodolerite from a Near-Bottom Apophysis of the Yoko-Dovyren Layered Intrusion. Petrology 2020, 28, 246–262. [Google Scholar] [CrossRef]
  14. Pshenitsyn, I.V.; Ariskin, A.A.; Nikolaev, G.S.; Korost, D.V.; Yapaskurt, V.O.; Kislov, E.V.; Sobolev, S.N.; Kubrakova, I.V.; Tyutyunnik, O.A. Geochemistry and petrology of protosulfide melts in an ore-bearing apophysis of the Yoko-Dovyren intrusion. Geochem. Int. 2022, 60, 235–255. [Google Scholar] [CrossRef]
  15. Kislov, E.V. The Yoko-Dovyren layered massif Rus.; BNTs SD RAN: Ulan-Ude, Russia, 1998; p. 265. [Google Scholar]
  16. Rytsk, E.Y.; Shalaev, V.S.; Rizvanova, N.G.; Krymsky, R.; Makeev, A.F.; Rile, G.V. Olokit zone of the Baikal folded region: New isotope-geochronological and petrochemical data Rus. Geotectonics 2002, 1, 29–41. [Google Scholar]
  17. Konnikov, E.G. Differentiated Ultrabasic-Basic Complexes in the Precambrian Rocks of Transbaikalia; Rus. Nauka: Novosibirsk, Russia, 1986; Volume 127. [Google Scholar]
  18. Ariskin, A.A.; Kostitsyn, Y.A.; Konnikov, E.G.; Danyushevsky, L.V.; Meffre, S.; Nikolaev, G.S.; McNeill, A.; Kislov, E.V.; Orsoev, D.A. Geochronology of the Dovyren Intrusive Complex, Northwestern Baikal area, Russia, in the Neoproterozoic. Geochem. Int. 2013, 51, 859–875. [Google Scholar] [CrossRef]
  19. Orsoev, D.A. Anorthosites of the low-sulfide platiniferous horizon (Reef I) in the upper Riphean Yoko-Dovyren massif (Northern Cisbaikalia): New data on the composition, PGE–Cu–Ni mineralization, fluid regime, and formation conditions. Geol. Ore Depos. 2019, 61, 306–332. [Google Scholar] [CrossRef]
  20. Ariskin, A.A.; Danyushevsky, L.V.; Fiorentini, M.L.; Nikolaev, G.S.; Kislov, E.V.; Pshenitsyn, I.V.; Yapaskurt, V.O.; Sobolev, S.N. Petrology, geochemistry, and origin of sulfide-bearing and PGE- mineralized troctolites from the Konnikov zone in the Yoko-Dovyren layered intrusion. Russ. Geol. Geophys. 2020, 61, 611–633. [Google Scholar] [CrossRef]
  21. Ariskin, A.A.; Danyushevsky, L.V.; Nikolaev, G.S.; Kislov, E.V.; Fiorentini, M.L.; McNeill, A.; Kostitsyn, Y.A.; Goemann, K.; Feig, S.; Malyshev, A. The Dovyren intrusive complex (Southern Siberia, Russia): Insights into dynamics of an open magma chamber with implications for parental magma origin, composition, and Cu–Ni- PGE fertility. Lithos 2018, 302, 242–262. [Google Scholar] [CrossRef]
  22. Orsoev, D.A.; Mekhonoshin, A.S.; Kanakin, S.V.; Badmatsyrenova, R.A.; Khromova, E.A. Gabbro–peridotite sills of the Late Riphean Dovyren plutonic complex (northern Baikal region). Russ. Geol. Geophys. 2018, 59, 472–485. [Google Scholar] [CrossRef]
  23. Distler, V.V.; Stepin, A.G. Low-Sulfide PGE-bearing unit of the Yoko–Dovyren layered ultrabasic-basic intrusion (Northern Baikal region). Doklady Akademii Nauk 1993, 328, 498–501. (In Russian) [Google Scholar]
  24. Konnikov, E.G.; Meurer, W.P.; Neruchev, S.S.; Prasolov, E.M.; Kislov, E.V.; Orsoev, D.A. Fluid Regime of platinum group elements (PGE) and gold-bearing reef formation in the Dovyren mafic–ultramafic layered complex, Eastern Siberia, Russia. Miner. Depos. 2000, 35, 526–532. [Google Scholar] [CrossRef]
  25. Spiridonov, E.M. Review of the gold mineralogy in the main types of Au-mineralization. In Gold of the Kola Peninsula and Adjacent Regions; Voitekhovsky, Y.A., Ed.; K&M: Apatity, Russia, 2010; pp. 143–171. [Google Scholar]
Figure 2. Petrographic and mineralogical features of sample 13DV539-9 used in this study: (a,b) panorama images of the thin section; (ce) BSE images of sulfide occurrences within this sample. Note, in small sulfide interstices’ low-temperature associations Czo + Chl ± Ab ± Pre ± Phl were established: Pl—plagioclase, Czo—clinozoisite, Chl—chlorite, Ab—albite, Pre—prenite, Phl—phlogopite, Pn—pentlandite, Cub—cubanite, Ccp—chalcopyrite.
Minerals 13 01307 g002
Figure 3. The scheme of preparing small cores from the studied anorthosite 13DV539-9: (a) the relative location of the boreholes and their designations are in Table 1 and Table 2; (b) examples of drilled 10 mm cores, in which sulfide-rich veinlets are clearly seen due to their darker color.
Minerals 13 01307 g003
Figure 4. Example of one X-ray 2D scan of a 10 mm drilled sample (539-9-10mm-t1) and its enlarged fragment: Phase 1 is Pl-dominated silicate matrix with its alteration products, Phase 2 is sulfide, Phase 3 is potential PGM.
Minerals 13 01307 g004
Figure 5. Examples of multi-scale CT data, including X-ray 2D scan sections (upper images) and 3D models of sulfides (Phase 2, bottom images): (a) initial sample 13DV539-9 and plane slices for (b) a 10 mm drilled cylinder and (c) a 3 mm cylinder along a sulfide-rich veinlet. Plagioclase with minor pyroxenes are shown in dark gray, whereas sulfides are shown using white color on the 2D scanned sections and golden on the 3D reconstructions of the samples.
Minerals 13 01307 g005
Figure 6. Relationships of potential PGMs (red colored) with associated sulfides: (a,b) example of the location of the potential PGM inside the sulfide gain (gold-colored), (c) example of three grains of potential PGMs confined to the edges of the sulfide grain, (d,e) two examples of the potential PGM morphology.
Minerals 13 01307 g006
Figure 7. Association of moncheite with chalcopyrite, plagioclase, and epidote (Ep) at different scales: (a) from CT scanning with highest resolution of 1–3 µm; (b,c) BSE images of the selected area.
Minerals 13 01307 g007
Figure 8. Association of electrum with cubanite and plagioclase at different scales: (a) from CT scanning with resolution of 1–3 µm; (b,c) BSE images of the selected area.
Minerals 13 01307 g008
Table 3. Compositions of moncheite and electrum shown in Figure 7 and Figure 8.
Moncheite Points Te,
wt.%
Pt,
wt.%
Pb,
wt.%
Bi,
wt.%
Total
wt.%
539-9-2a_3250.9241.021.894.4598.28
539-9-2a_3446.5638.982.637.4495.61
539-9-2a_3545.1739.382.869.6897.09
Electrum PointsAg,
wt.%
Au,
wt.%
Total
wt.%
539-9-141.8355.1296.95
539-9-240.9954.3295.31
539-9-343.9255.3599.27
Disclaimer/Publisher’s Note: The statements, opinions and data contained in all publications are solely those of the individual author(s) and contributor(s) and not of MDPI and/or the editor(s). MDPI and/or the editor(s) disclaim responsibility for any injury to people or property resulting from any ideas, methods, instructions or products referred to in the content.

