Article

Changes in Physicochemical Properties of Coal and Their Mechanism Due to Supercritical CO2–H2O Treatment

1
Jiangsu Key Laboratory of Coal-Based Greenhouse Gas Control and Utilization, Carbon Neutrality Institute, China University of Mining and Technology, Xuzhou 221008, China
2
Key Laboratory of Coalbed Methane Resource & Reservoir Formation History, Ministry of Education, School of Resource and Geoscience, China University of Mining and Technology, Xuzhou 221008, China
*
Author to whom correspondence should be addressed.
Minerals 2023, 13(10), 1262; https://doi.org/10.3390/min13101262
Submission received: 18 July 2023 / Revised: 13 September 2023 / Accepted: 26 September 2023 / Published: 27 September 2023
(This article belongs to the Special Issue Micro-Mechanism and Characteristics of Coal Reservoirs)

Abstract

:
The dissolution of supercritical carbon dioxide (ScCO2) in water forms a ScCO2–H2O system, which exerts a transformative influence on the physicochemical characteristics of coal and significantly impacts the CO2-driven enhanced coalbed methane (CO2-ECBM) recovery process. Herein, the effect of ScCO2–H2O treatment on the physicochemical properties of coal was simulated in a high-pressure reactor. The migration of major elements, change in the pore structure, and change in the CH4 adsorption capacity of coal after the ScCO2–H2O treatment were detected using plasma emission spectroscopy, the low-temperature liquid nitrogen adsorption method, and the CH4 adsorption method, respectively. The results show that (1) the ScCO2–H2O treatment led to mineral reactions causing a significant migration of constant elements in the coal. The migration of Ca ions was the most significant, with an increase in their concentration in treated water from 0 to 16–970 mg·L−1, followed by Na, Mg, and K. Al migrated the least, from 0 to 0.004–2.555 mg·L−1. (2) The ScCO2–H2O treatment increased the pore volume and pore-specific surface area (SSA) of the coal via the dissolution and precipitation of minerals in the coal pores. The total pore volume increased from 0.000795–0.011543 to 0.001274–0.014644 cm3·g−1, and the total pore SSA increased from 0.084–3.332 to 0.400–6.061 m2·g−1. (3) Changes in the CH4 adsorption capacity were affected by the combined effects of a mineral reaction and pore structure change. The dissolved precipitates of the minerals in the coal pores after the ScCO2–H2O treatment caused elemental migration, which not only decreased the mineral content in the coal pores but also increased the total pore volume and total pore SSA, thus improving the CH4 adsorption capacity of the coal. This study provides theoretical support for CO2 sequestration and ECBM recovery.

1. Introduction

The effects of global climate change caused by massive greenhouse gas emissions are of increasing concern to government agencies and researchers around the world [1]. Therefore, numerous strategies such as the use of renewable energy sources to replace fossil fuels [2], improved energy efficiency [3], increased soil carbon reserves [4,5], carbon dioxide (CO2) sequestration [6], and some other approaches [7,8,9] have been proposed to mitigate these causes and their effects. In China, the heavy reliance on coal makes it difficult for the country to change its energy mix in the short term; however, in response to President Xi Jinping’s dual carbon goal (carbon peak and carbon neutrality), China is exploring various options to achieve decarbonization. For example, the use of CO2-driven enhanced coalbed methane (CO2-ECBM) recovery techniques offers the potential to not only solve the problem of the low CBM recovery rate but also realize the permanent sequestration of CO2 in coal seams. According to the common notion, coal possesses varying gas adsorption capacities, with CO2 displaying a higher affinity for coal than CH4. Consequently, an injection of CO2 into coal seams is deemed to facilitate the desorption of CH4 from the coal matrix [10,11,12]. This underscores the significance of the CO2-ECBM recovery method as a pivotal approach for augmenting CBM production while concurrently mitigating atmospheric CO2 emissions.
In most cases, CO2 exists in a supercritical state (ScCO2, with a critical point of 31.1 °C and 7.38 MPa) under temperature and pressure conditions in deep coal seams [13,14]. When CO2 is injected into a coal seam, it combines with seam water to form a ScCO2–H2O system and geochemically reacts with the minerals present in the coal [15]. These reactions mainly include the dissolution of minerals [16] (e.g., the dissolution of carbonate minerals), the transformation of aluminosilicate minerals [17] (e.g., the transformation of illite to kaolinite), and the precipitation of secondary minerals [18] (e.g., the formation of andesite via the reaction of clay minerals with carbonate). Moreover, elemental migration also occurs during geochemical reactions [19]. Some studies have shown that CO2–brine–rock interactions can significantly mobilize major elements due to the dissolution of carbonate and silicate minerals, distinctly changing mineralogical compositions [20]. Several elements, including Al, Ca, Fe, and Mg, have been found to be more mobile during CO2–water–coal interaction experiments than during water-only experiments in the same samples under a CO2 partial pressure of 9.5 MPa and a temperature of 40 °C for 72 h [19].
The pores in coal act as the primary sequestration sites for CBM and are important transport channels for injected CO2 [21]. The effect of a CO2 injection on the coal pore structure is important for improving CO2 storage capacity and safety [22,23]. Many studies have focused on the changes in the coal reservoir structure after a CO2 injection [13,24,25,26,27,28,29]. For example, Liu et al. [25] and Sampath et al. [26] found that pores and fractures in coal could be expanded by dissolving reactive minerals or by extracting soluble organic matter through the ScCO2–H2O system. Massarotto et al. [13] and Wang et al. [24] found that mineral reactions could affect the pore morphology of coal by opening or breaking the ink-bottle-shaped pores. Du et al. [27] showed that the dissolution of different minerals affected pores of different sizes. Chen et al. [
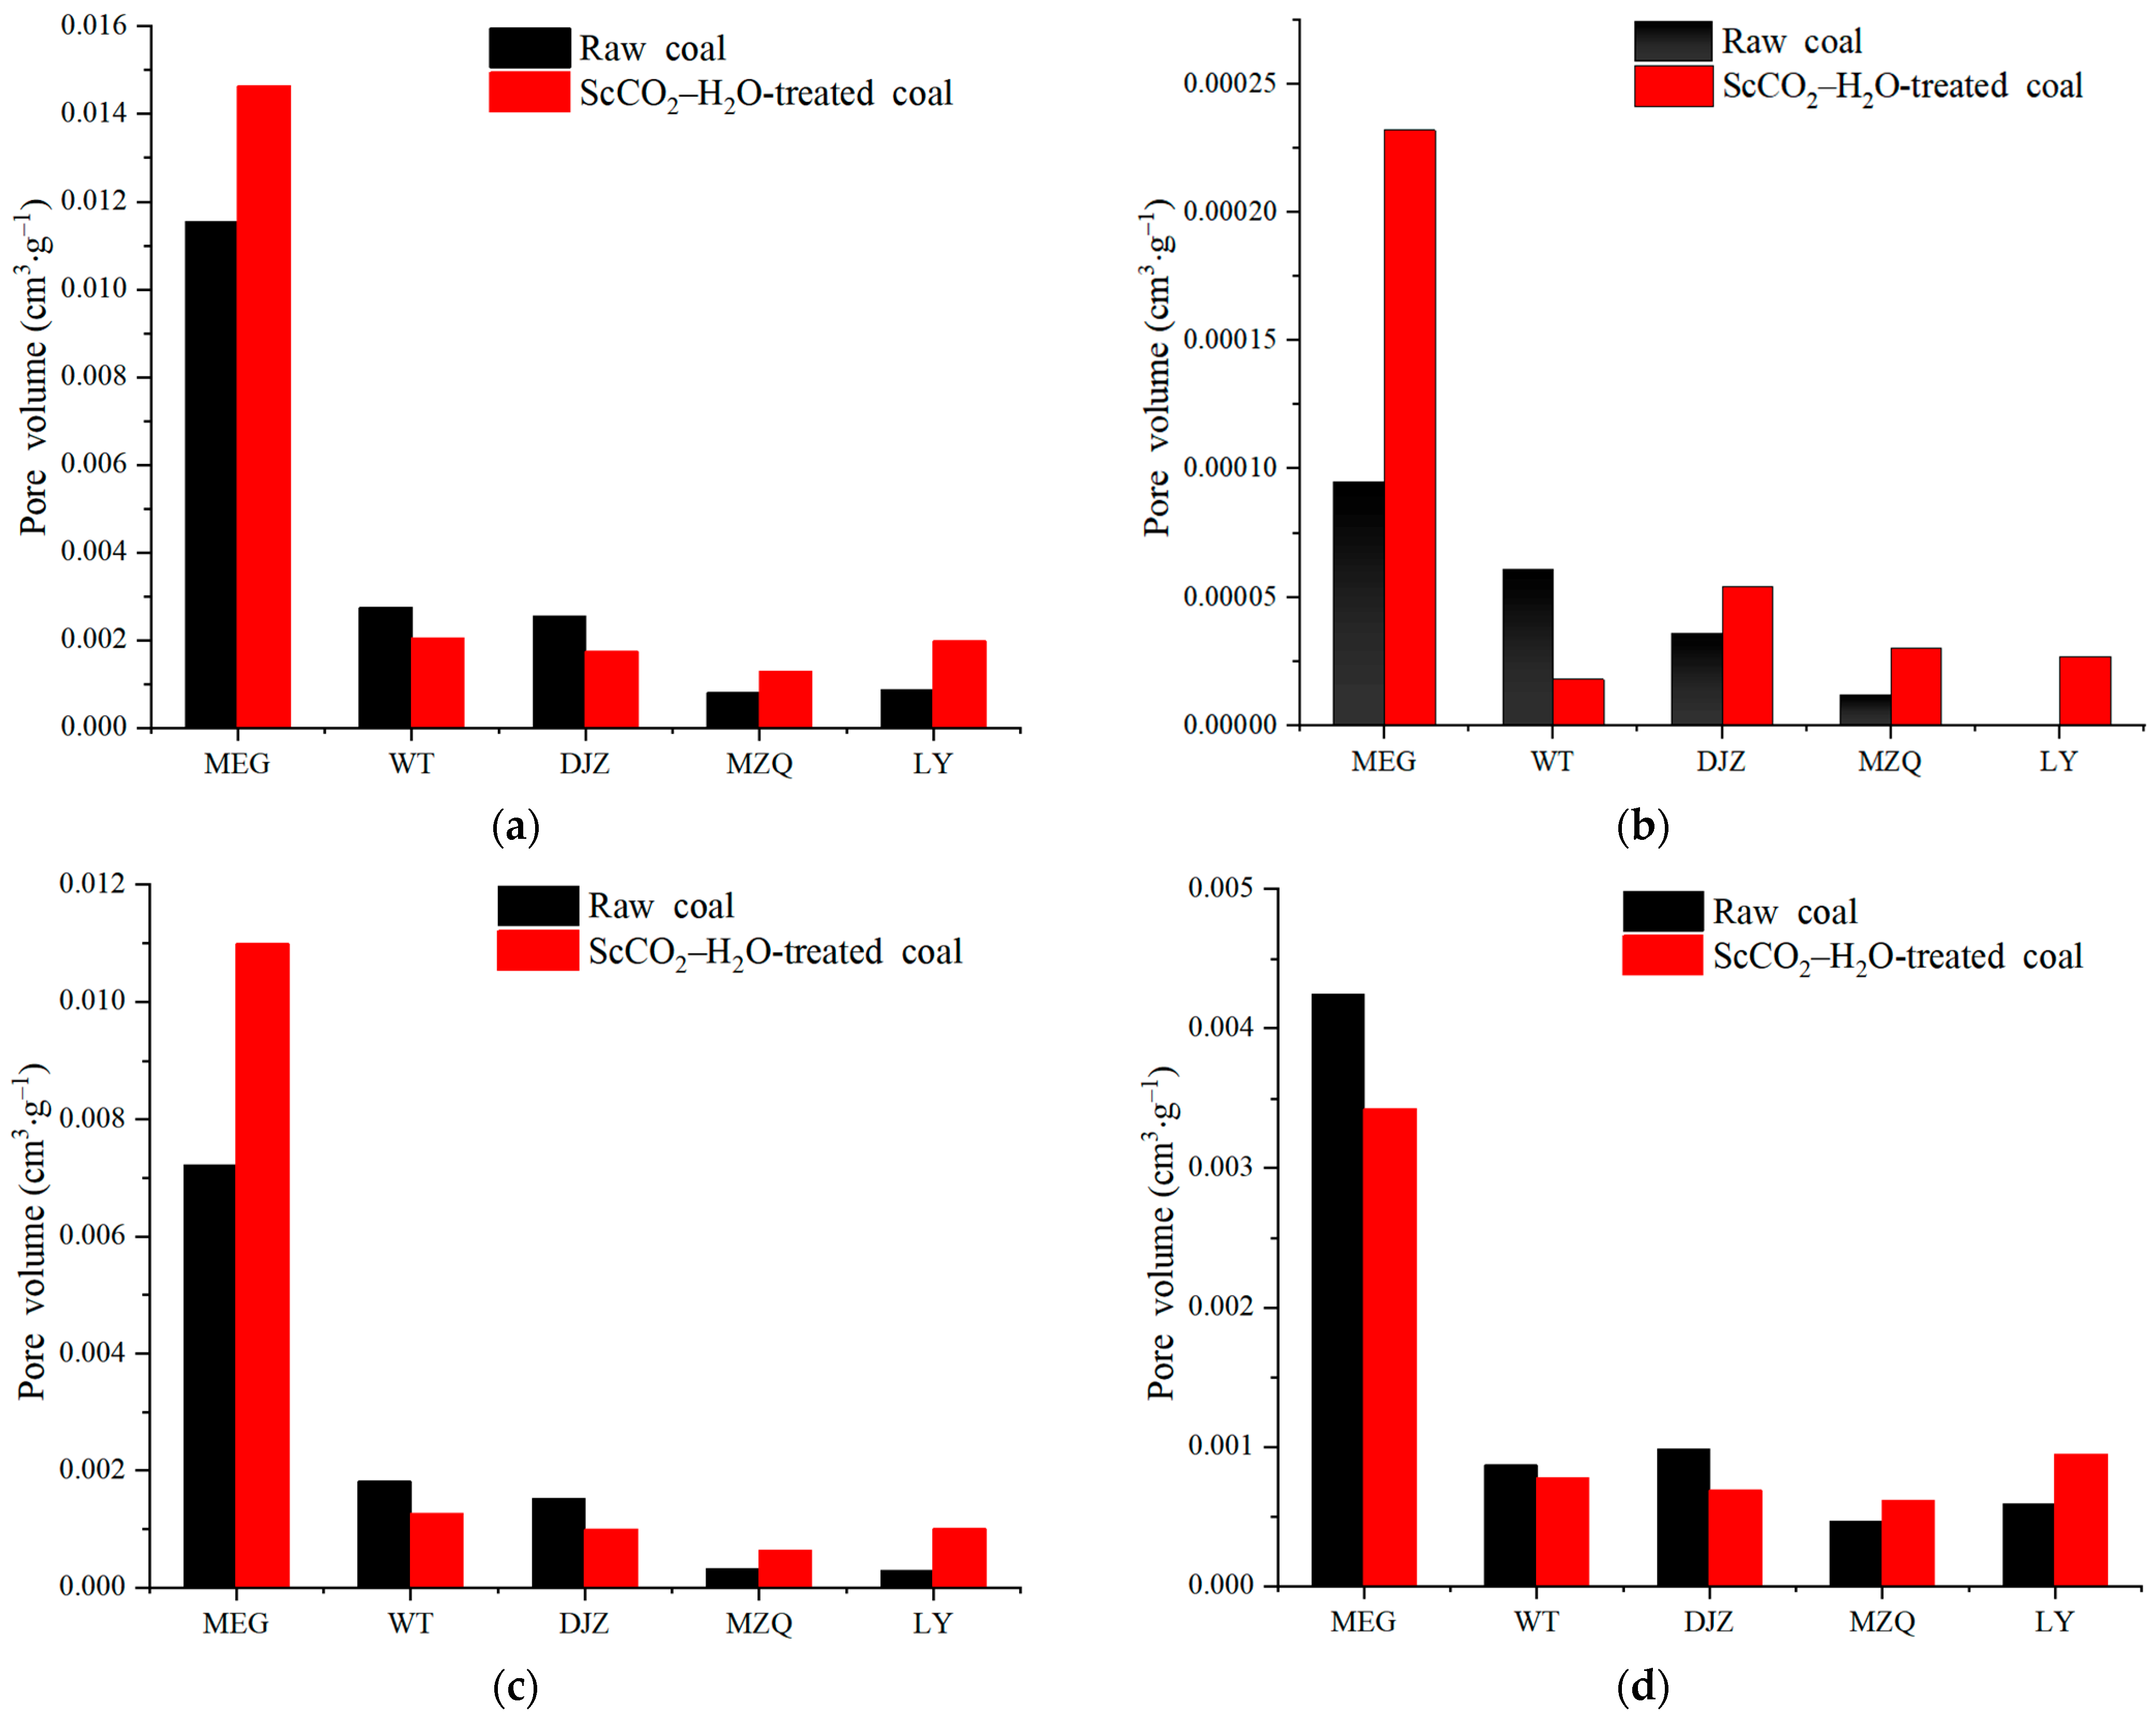
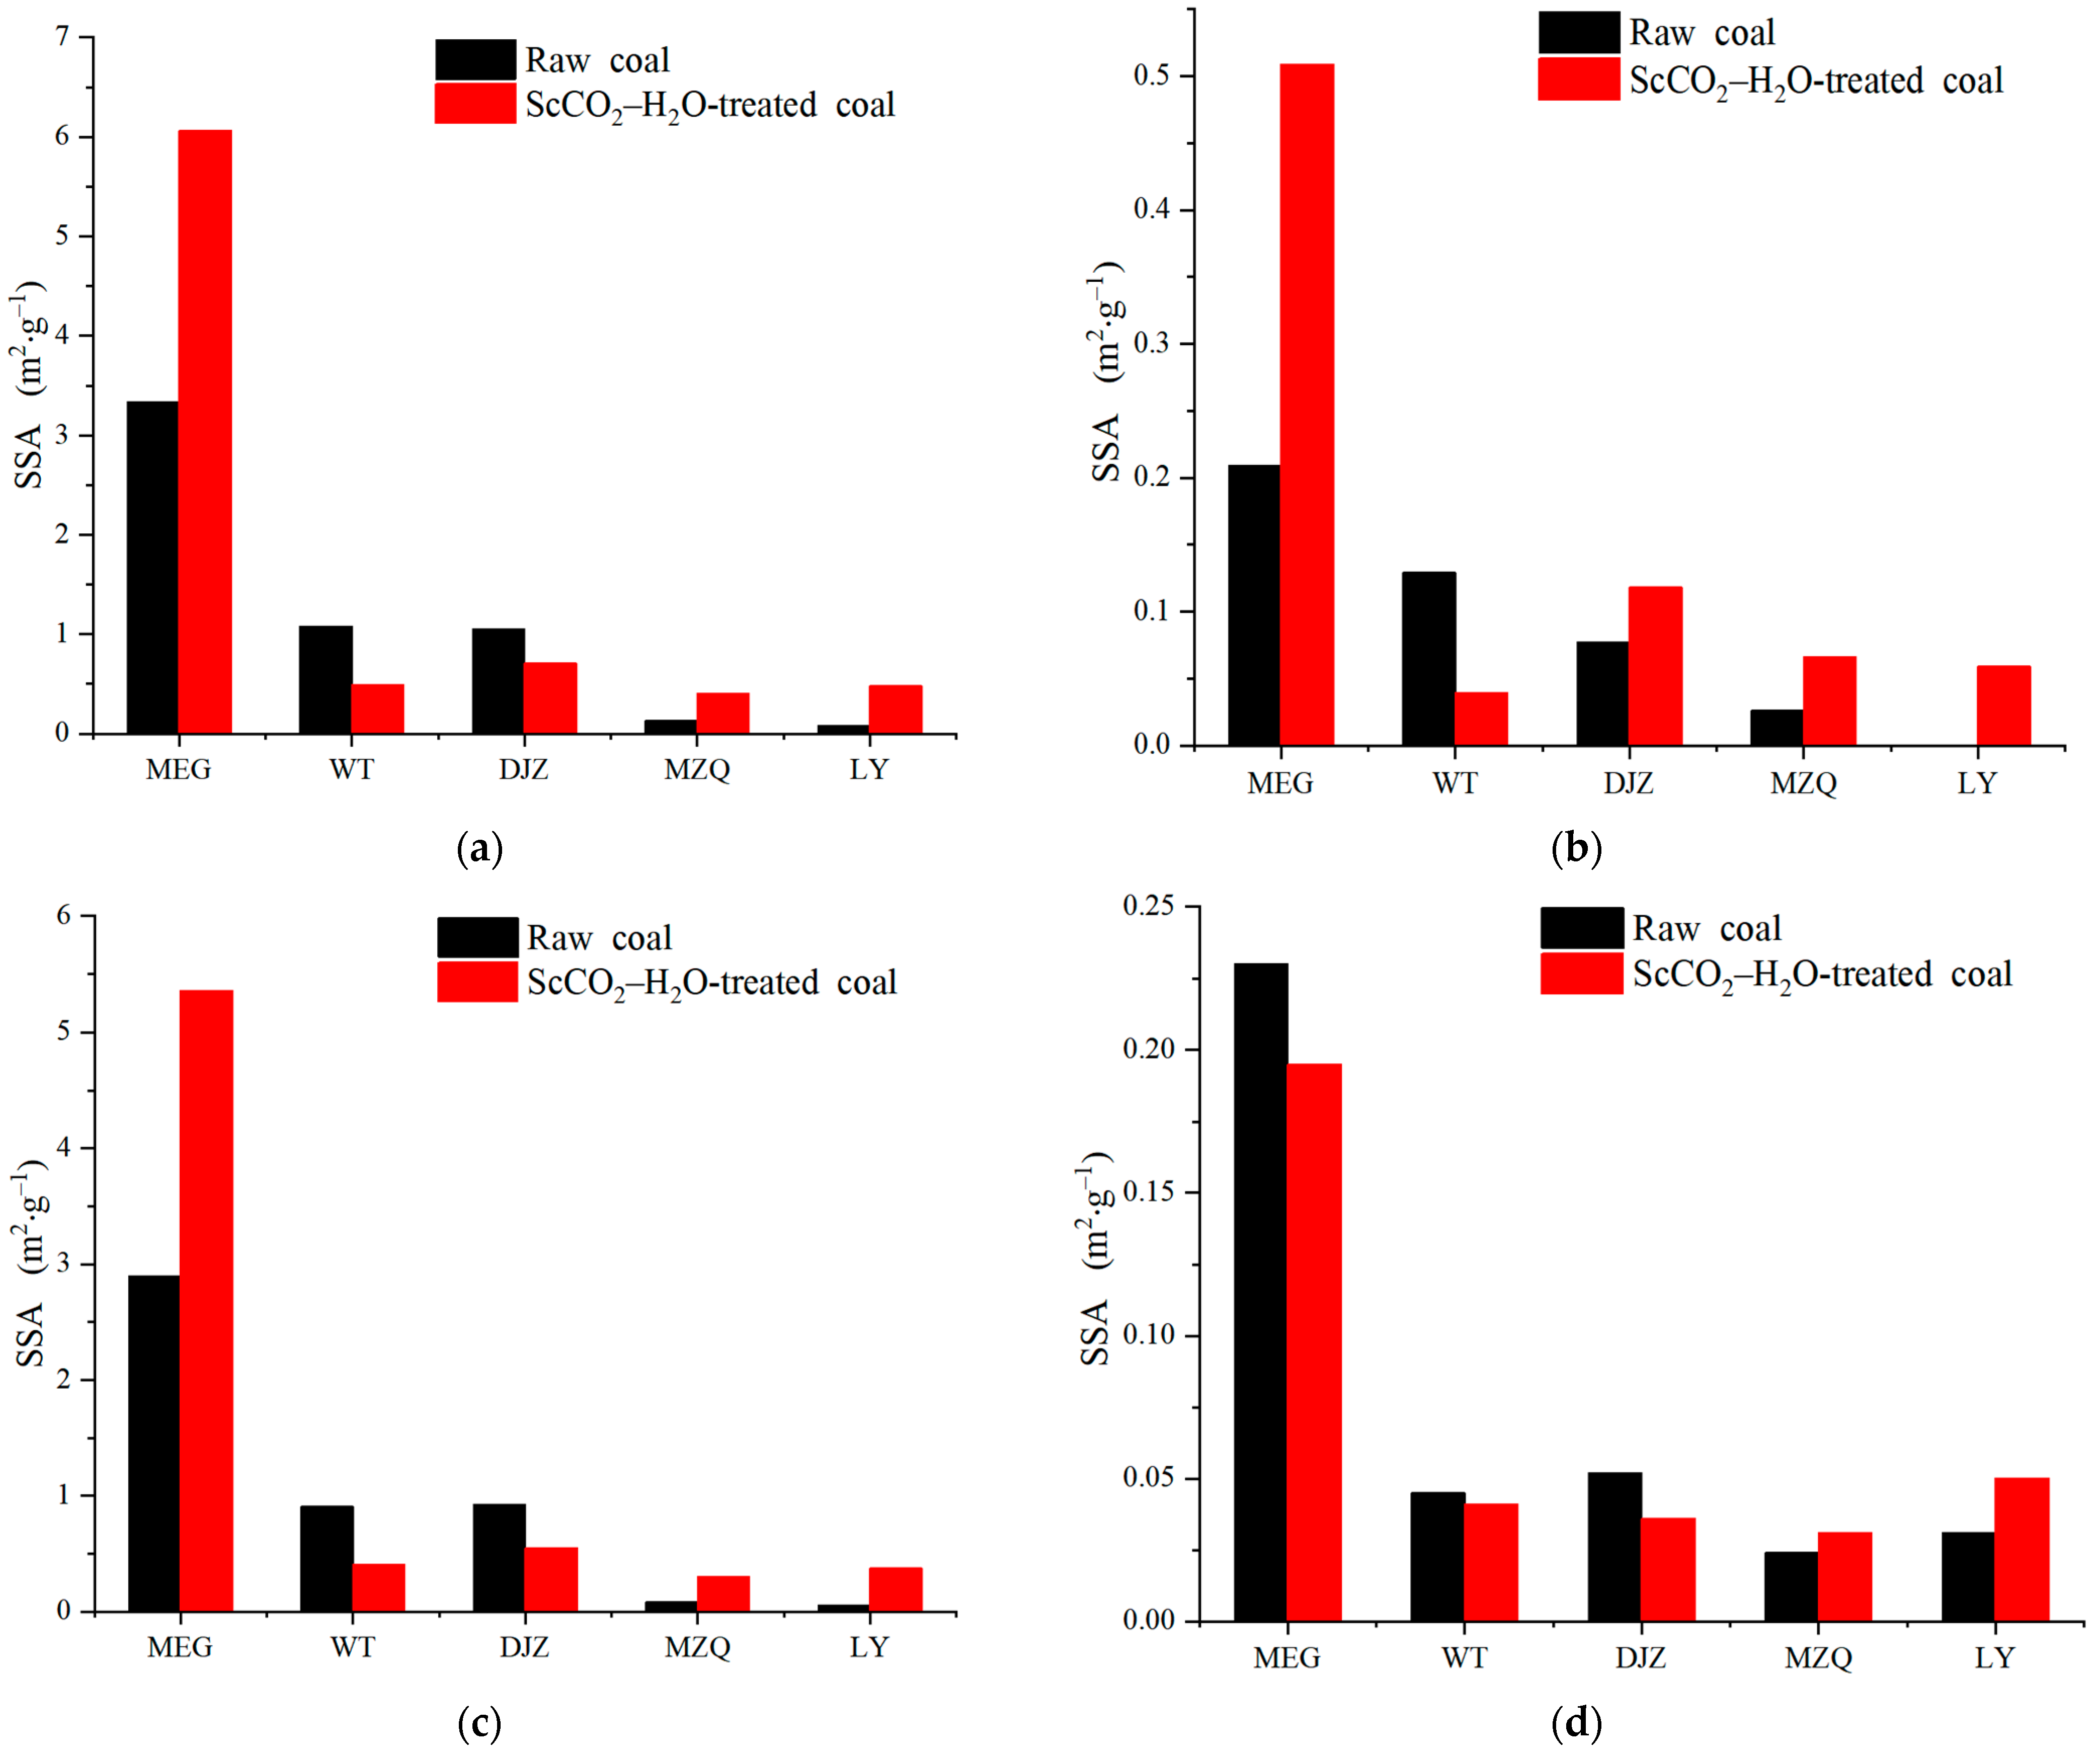
28] concluded that pore formation through mineral dissolution increased the pore volume and specific surface area (SSA) of mesopores. The dissolution of carbonate minerals with a large particle size in organic matter leads to an increase in the volume of large pores in coal [28,29]. Liu et al. [29] showed that the pore connectivity increased after the reaction of minerals in coal, and the enhancement of the connectivity of mesopores was greater than that of macropores.
The gas adsorption capacity of coal is closely related to the pore structure of coal, and gas adsorption mainly occurs in micropores, while mesopores and macropores mainly play a role in gas transportation. Therefore, a change in pore structure affects the CH4 permeation and CO2 sequestration effect [30]. Some scholars believed that the increase in the CH4 adsorption capacity of coal after ScCO2–H2O treatment was mainly due to the increase in the micropore volume, which was weakly affected by mesopores and macropores [31,32]. In contrast, the decrease in the CO2 adsorption capacity of coal resulted from the combined effect of the decrease in the mesopore volume and the increase in the micropore volume [31,32,33].
In summary, an injection of CO2 into coal seams has been found to impact mineral elements [16,17,18,19,20], alter pore structures [13,24,25,26,27,28,29], and influence the gas adsorption capacity within the pores present in coal [31,32,33]. However, the interrelationships among these three factors remain inadequately understood. This knowledge gap was addressed herein by conducting a comparative analysis using five distinct coal samples exhibiting varying degrees of metamorphism from the Ordos Basin. The analysis involved an assessment of elemental migration, changes in pore structure, and alterations in CH4 adsorption characteristics before and after ScCO2–H2O treatment. The assessment employed techniques such as plasma emission spectrometry, low-temperature liquid nitrogen adsorption, and high-pressure CH4 adsorption experiments. The main objectives of this study were to reveal the mechanism of the mineral reaction and pore structure change induced by ScCO2–H2O, and to clarify their influence on gas adsorption performance and establish the connection between them. These findings can provide theoretical support for CO2 sequestration and ECBM recovery.

2. Preparation and Experiments

2.1. Collection of Samples

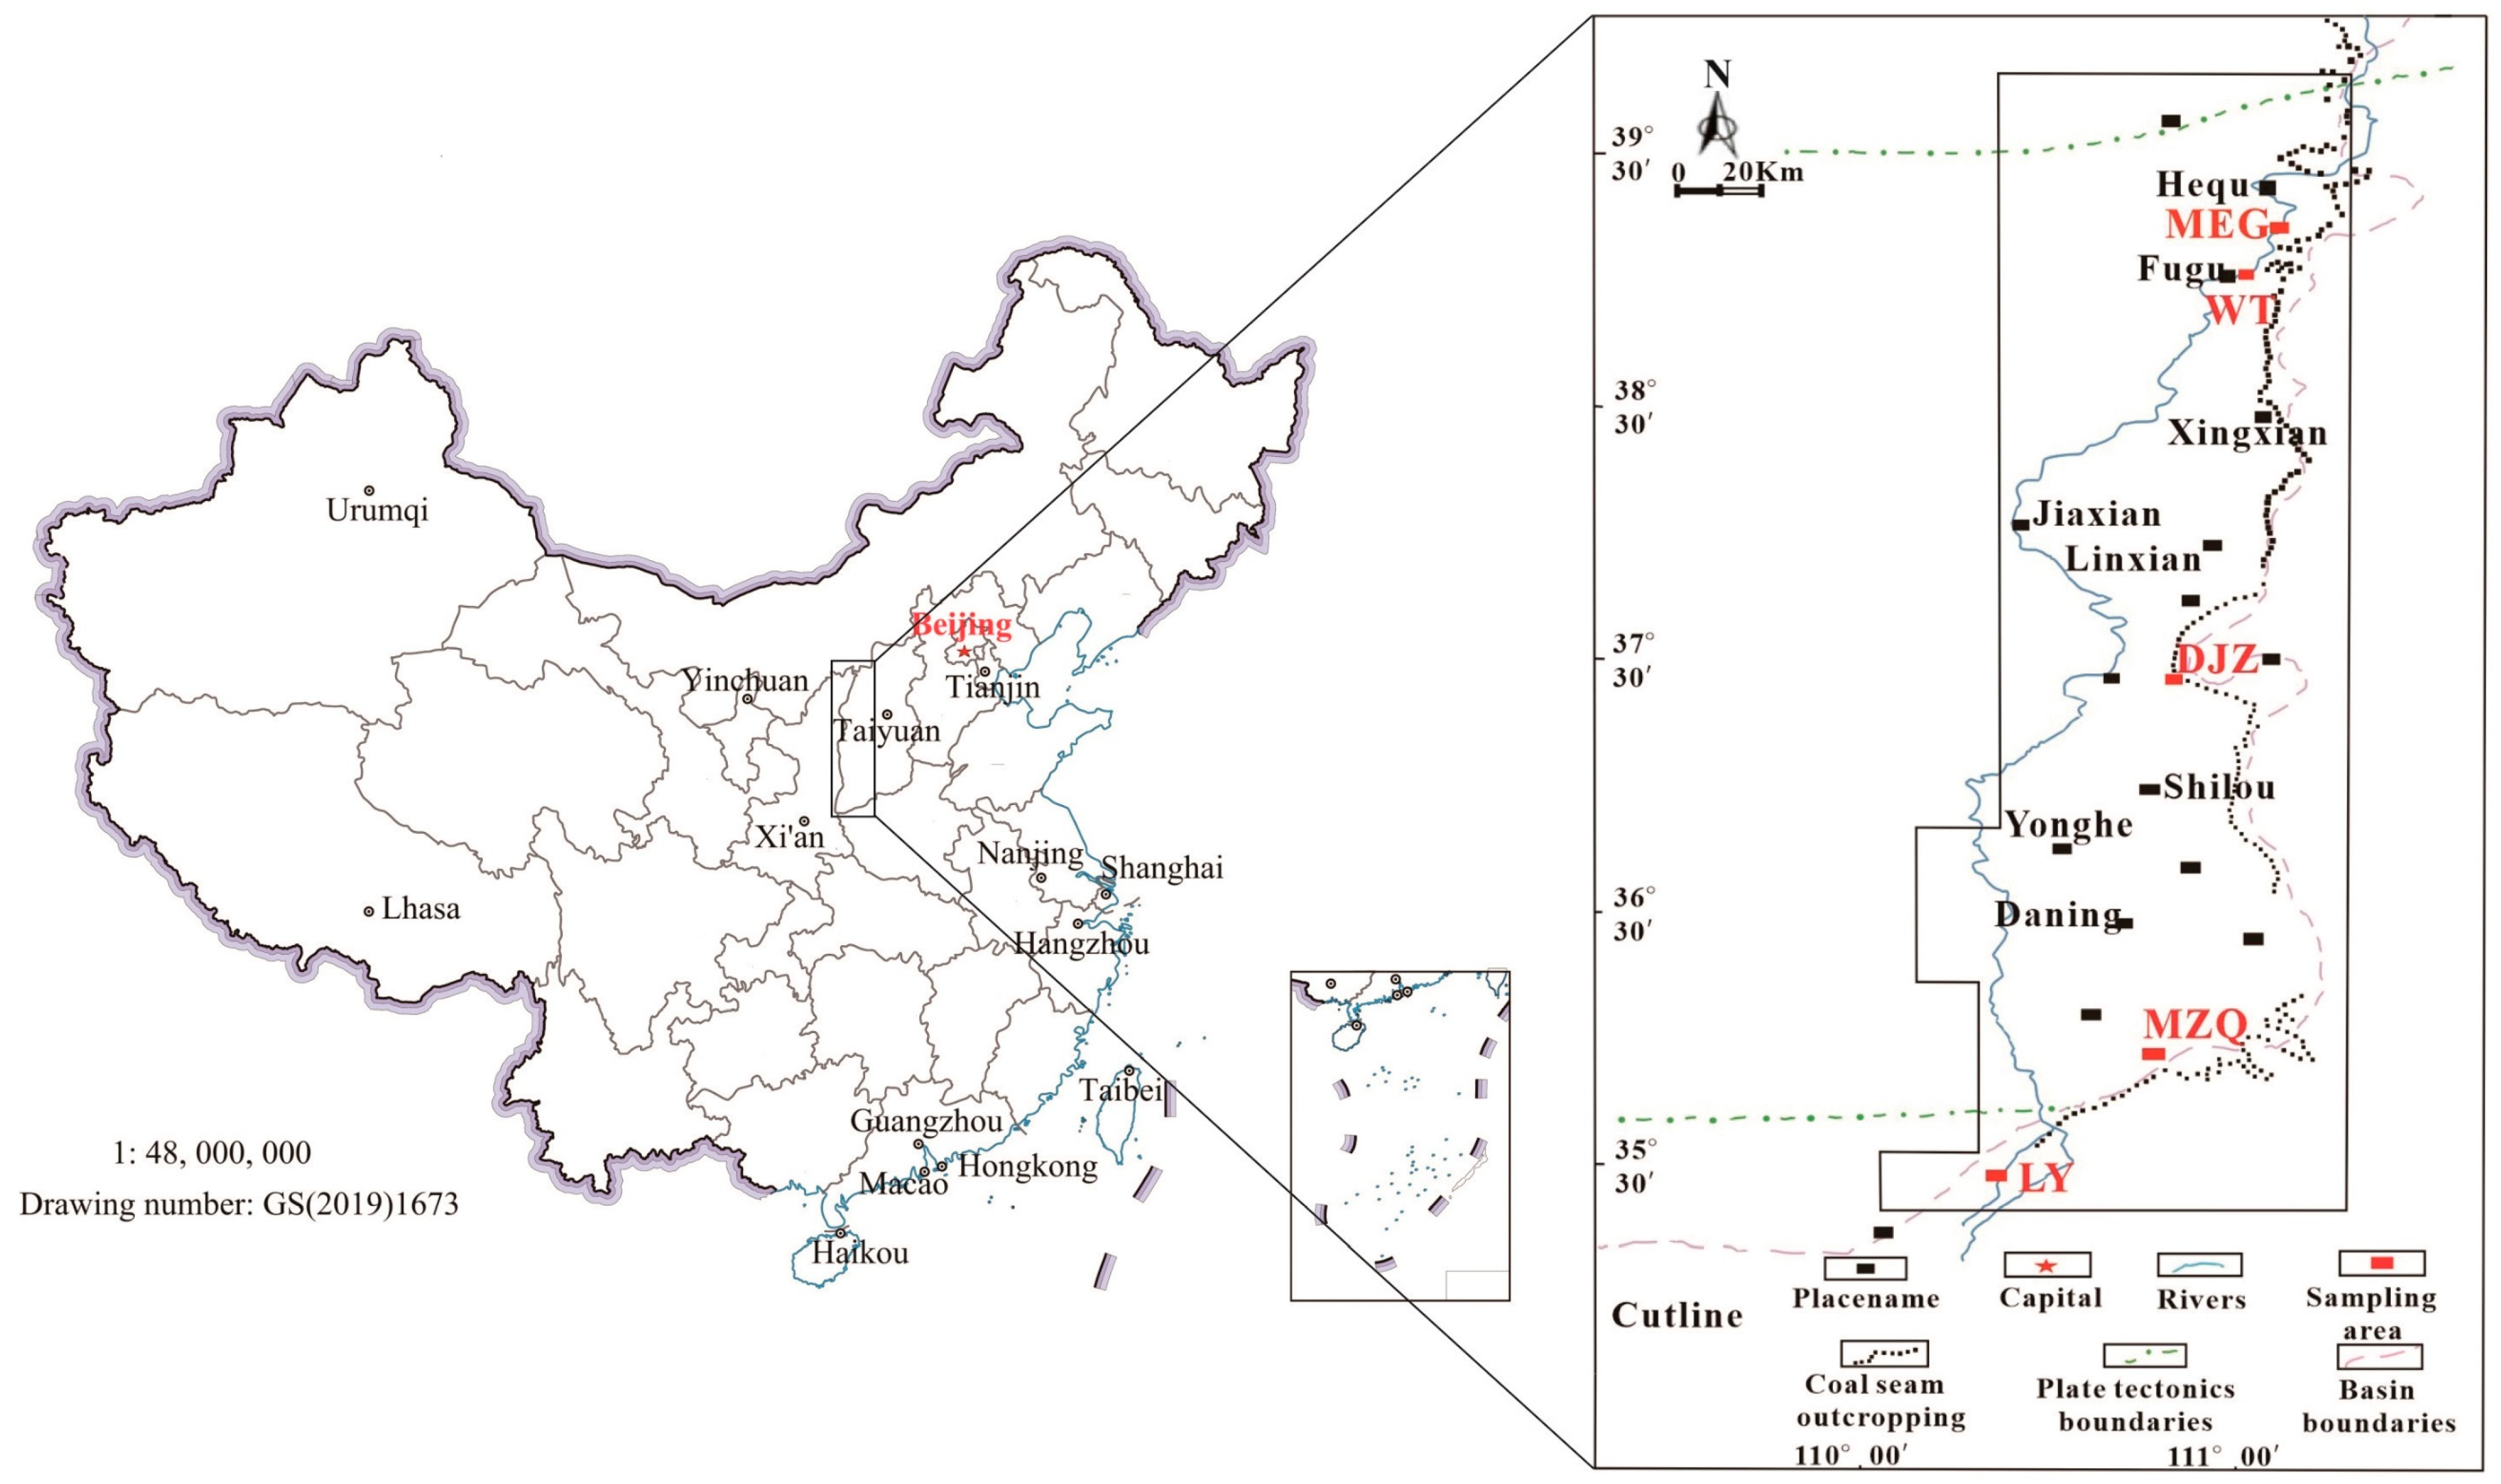
Figure 1 shows the sample collection locations, and the five types of coal samples used in this study (namely, MEG, WT, DJZ, MZQ, and LY coals) were obtained from the eastern margin of the Ordos Basin. The Ordos Basin is located in the central and western parts of the Chinese mainland. It is a cratonic hydrocarbon-bearing basin, with the characteristics of stable subsidence, depression, and migration. The main coal seams in the basin include the Upper Carboniferous Taiyuan Formation and the Lower Permian Shanxi Formation. The distribution of coal seams is stable, and the vertical coal seam development horizon is large. The coal seam is characterized by being thin in the south and thick in the north. The thickness of the coal seam in the northern region is large and changes rapidly, and that in the middle is relatively stable, while the thickness in the southern region is small and changes evenly [34]. Coal seam Nos. 4 and 5 of the Shanxi Group and Nos. 8 and 9 of the Taiyuan Group are, in particular, widely distributed in the eastern margin and exhibit stable development.
In this study, the selected samples consisted of low-to-medium metamorphic rank coals. The samples were collected and packaged in black plastic bags, sealed with tape, and transported to the laboratory. The samples were crushed to 20–60 mesh in the laboratory for a proximate analysis and a vitrinite maximum reflectance test, and the corresponding results are presented in Table 1. After the samples were prepared, they were first treated with the ScCO2–H2O system and then subjected to constant element testing, pore structure testing, and CH4 isothermal adsorption testing.

2.2. ScCO2–H2O Treatment of Coal

The ScCO2–H2O treatments of the coals were completed in a high-pressure reactor. The specific experimental conditions and materials are listed in Table 2. 
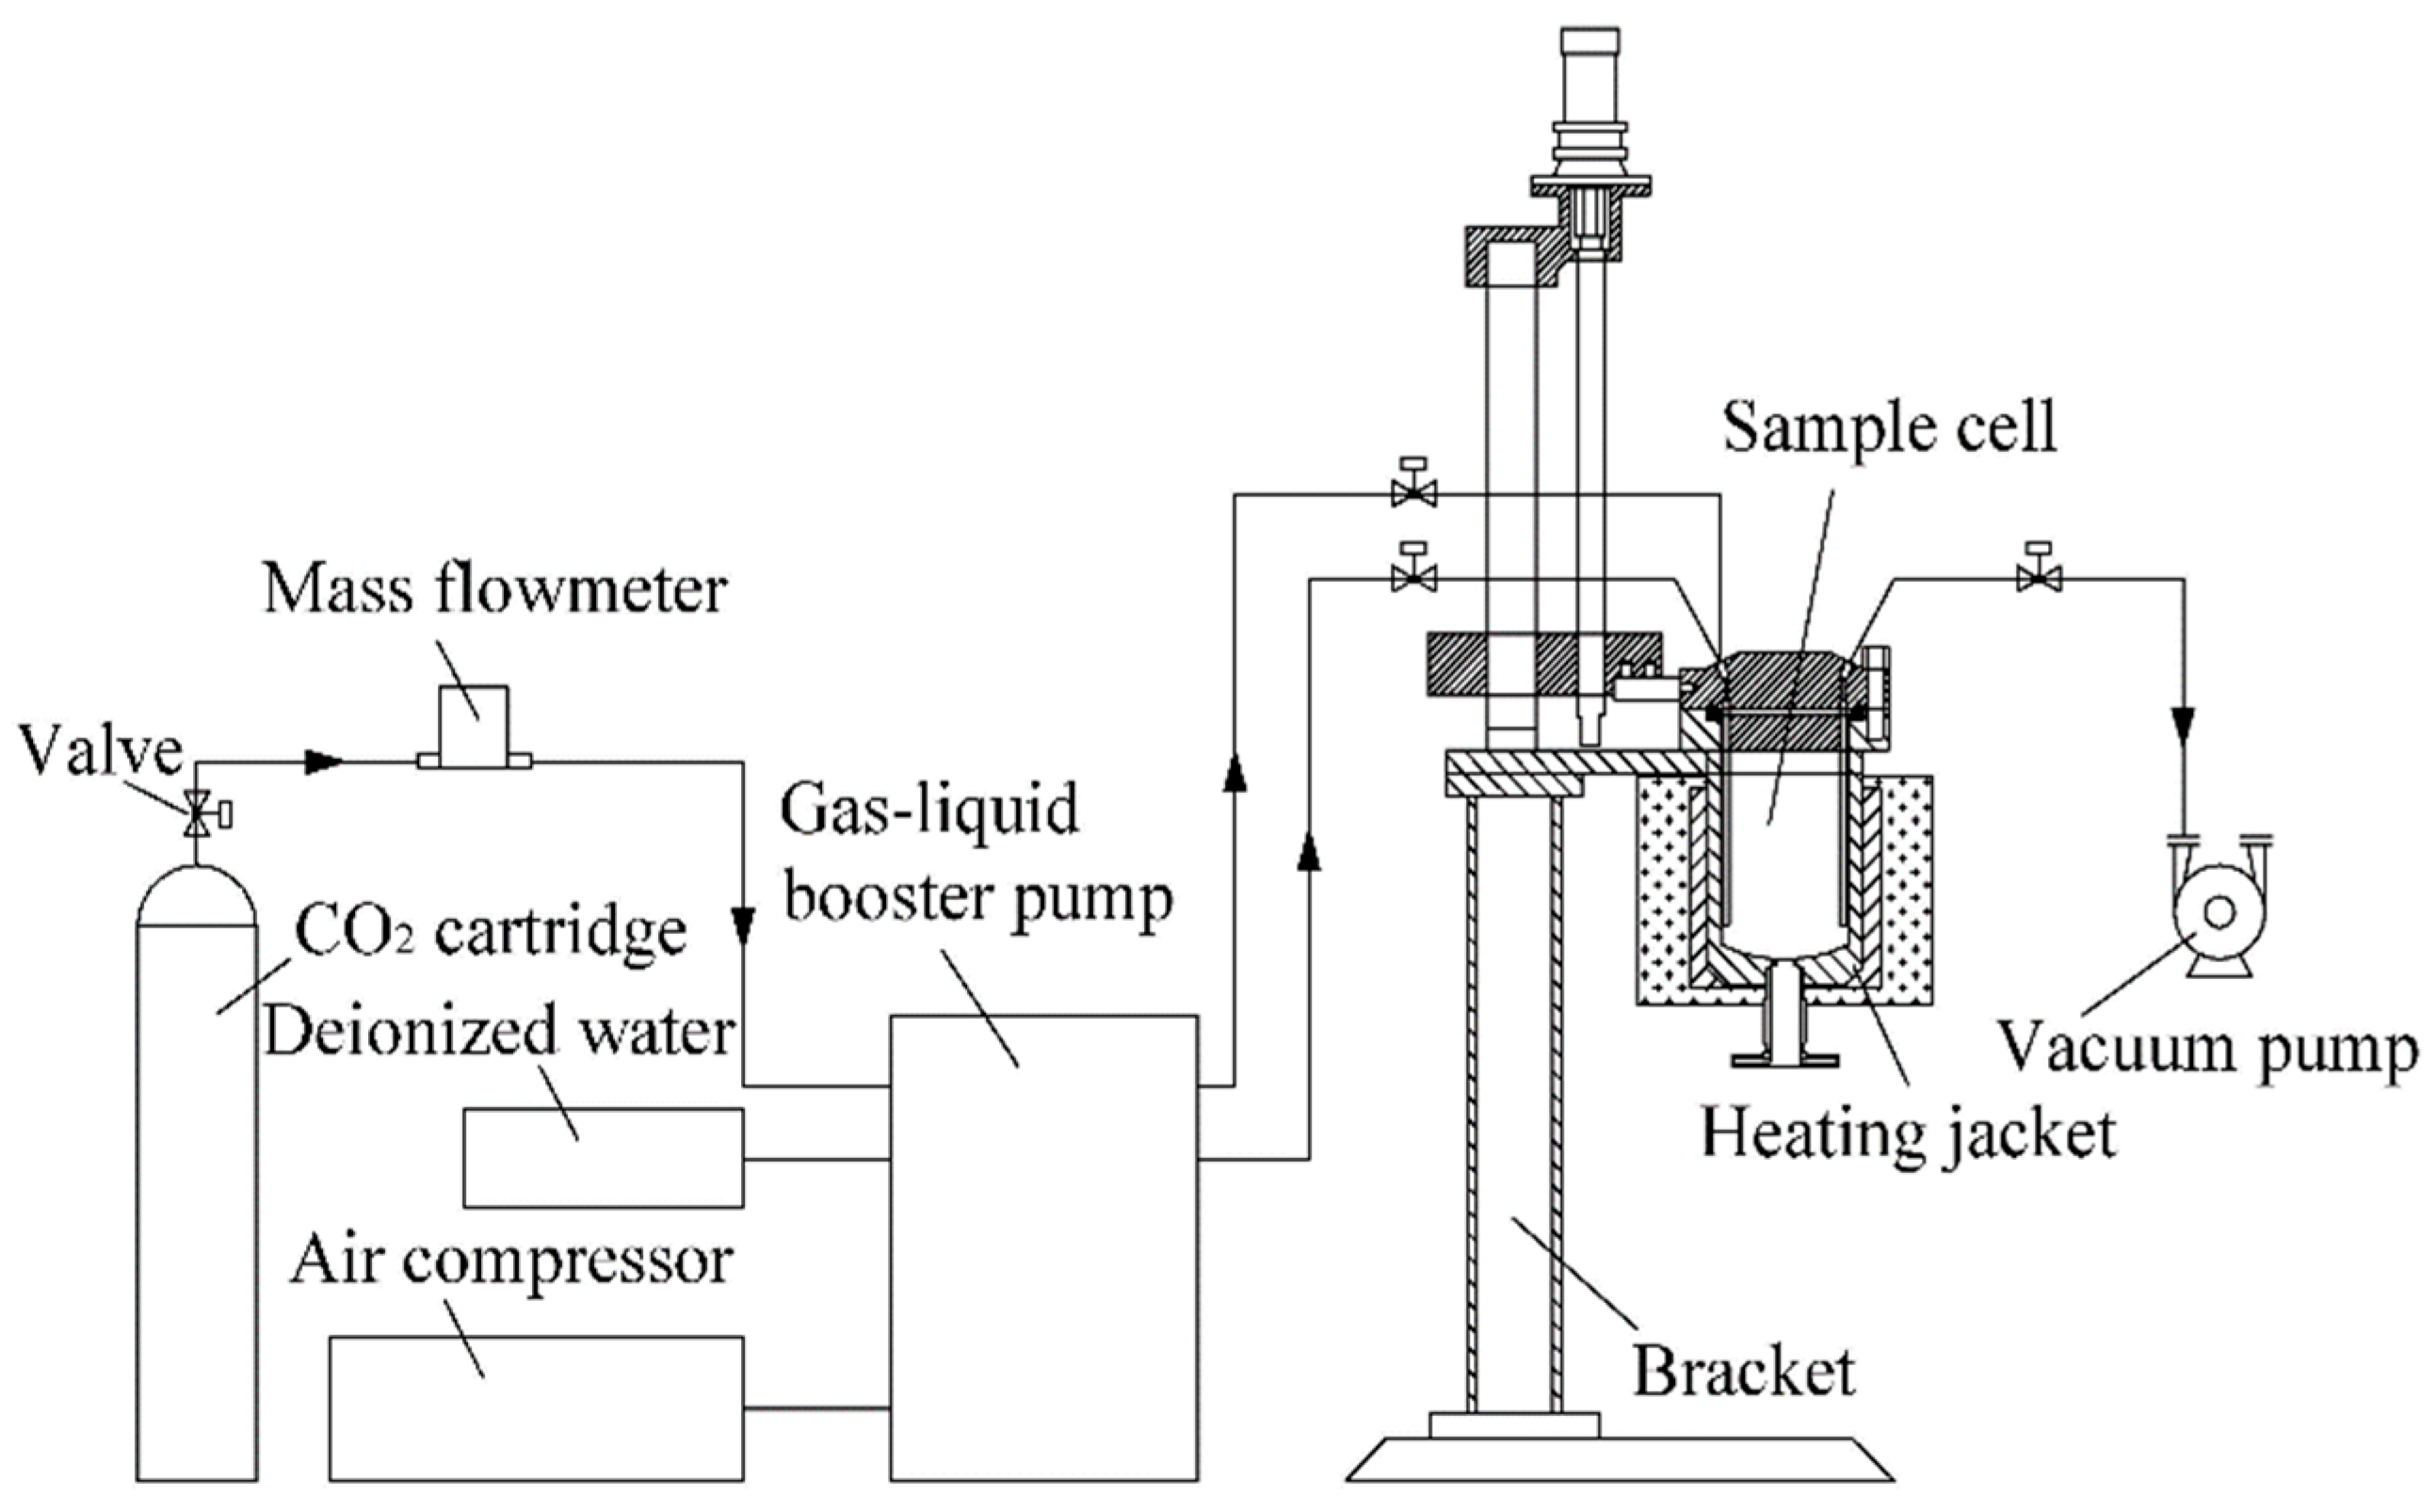
Figure 2 presents a schematic of the reactor used herein. The reactor can simulate the temperature and pressure conditions (P < 35 MPa; T < 200 °C) of the deep coal seam to ensure that CO2 is in a supercritical state to form the ScCO2–H2O–coal reaction system.
The experimental procedure was as follows: (1) First, the device seal was checked by applying a fixed pressure to the reactor and ensuring that the pressure remained stable. (2) Next, a coal sample (50 g) and deionized water were added into the reaction kettle at a mass ratio of 1:7, and the kettle was resealed. (3) CO2 was allowed to flow into the reactor to purge the air inside. (4) The autoclave was continuously pressurized with CO2 gas while simultaneously heating up the kettle until the set point of 9 MPa and 40 °C was achieved so that the CO2 in the kettle was in a supercritical state. Finally, under these experimental conditions, the coal was treated for 96 h.
After the experiment, water samples were extracted from the lower section of the reactor to assess the presence of persistent elements. The coal sample was then carefully extracted from the reactor and dried in a vacuum oven set at 80 °C. Subsequently, the dried coal samples underwent evaluation for pore structure and isothermal adsorption characteristics.

2.3. Constant Element Test

The contents of Al, Fe, Ca, Mg, K, Na, and other constant elements in the water samples before and after the ScCO2–H2O treatment were detected using inductively coupled plasma optical emission spectrometry (ICP-OES, ICAP 6300, Thermo Fisher, Waltham, MA, USA). The detection limit of the instrument was 0.1–100 ng·mL−1, a spectral purity reagent and deionized water were used, and the resistivity of the deionized water was not less than 18.0 MΩ·cm.
Before the experiment, standard series solutions of each element to be tested were prepared and mixed. Then, the mixed standard series solution was characterized using ICP-OES with a blank reagent and the sample solution to be tested. Next, the standard curve of each element was obtained to calculate the content of constant elements in the samples. The specific operations followed Chinese Industry Standard DZ/T 0064.42-2021.

2.4. Pore Structure Test

A pore structure test was conducted using the low-temperature liquid nitrogen adsorption method (Tristar II 3020, Micromeritics, Atlanta, GA, USA). The pore size analysis range of the instrument was 0.35–500 nm, and the SSA measurement range was 0.01 m2·g−1 to an uncertain upper limit. Before the test, the samples were dried and vacuumed for 24 h, and nitrogen with a purity of >99.99% was used as an adsorbent. The pore structures of the samples before and after the ScCO2–H2O treatment were tested at a low temperature (−196 °C) and low pressure (<0.127 MPa).

2.5. Isothermal Adsorption Test

The adsorption capacities of the samples before and after the ScCO2–H2O treatment were tested using an isothermal adsorption instrument (ISO-300, Terrtek, Atlanta, GA, USA). The samples before and after the ScCO2–H2O treatment were dried under equilibrium water conditions and then placed in a sealed container. The volume of CH4 adsorbed by the samples at adsorption equilibrium at 30 °C under different pressure conditions was determined. The maximum pressure of the experiment was 8 MPa, and in total, six equilibrium points were selected. For the specific operation, refer to the Chinese National Standard GB/T 19560-2008.

3. Results and Discussion

3.1. Constant Elemental Migration and Its Mechanism

Table 3 presents the content of constant elements in the water samples after the ScCO2–H2O treatment. Notably, one of the materials required for the ScCO2–H2O treatment of coal is deionized water; thus, the increase in the constant elements in the deionized water equals the migration amount of constant elements in the coal due to the ScCO2–H2O treatment. The migration of constant elements in the coal after the ScCO2–H2O treatment was significant. Table 3 shows that the amount of constant elements in the deionized water before sample treatment was zero. After the ScCO2–H2O treatment, the water samples exhibited a high content of Ca ions, which increased from 0 to 16.8–970 mg·L−1, followed by Na, Mg, and K ions (Table 3). However, the content of Al ions was relatively low, which increased from 0 to 0.004–2.555 mg·L−1. The water samples from the MEG coal contained a high content of Fe ions, 154 mg·L−1, but the content was negligible in the other samples (Table 3). These results indicate that some degree of migration of constant elements occurred in the ScCO2–H2O-treated coals, with Ca, Na, Mg, and K being the most pronounced, consistent with previous findings [19].
The migration of elements within coal is governed primarily by chemical processes, although physical mechanisms also play some role [19]. This phenomenon can be elucidated as follows: a CO2 injection into coal seams results in its dissolution within the seam water, causing the fluid to acquire a mildly acidic character, thus elevating mineral solubility. Concurrently, this injection disrupts the prevailing acid–base equilibrium of the fluid, inducing a reduction in PH. This, in turn, triggers ion-exchange interactions between the coal and the fluid. In a weakly acidic environment, the carbonate minerals in coal, such as calcite, rhodochrosite, and dolomite, are susceptible to dissolution, precipitation, and carbonation reactions, while clay minerals are susceptible to swelling and carbonation reactions [16,17,18]. It has been proposed that, in CO2–H2O systems, the carbonate minerals in coal are more reactive and susceptible to precipitation than silicates and aluminosilicates [16]. Equations 1 to 4 provide the reaction patterns of some of these minerals [35,36,37], as presented in Table 4.
The observed migration patterns of the elements within the coal indicate that the substantial migration of Ca, Mg, Na, and K ions following the ScCO2–H2O treatment is intricately related to the dissolution of carbonate and silicate minerals embedded in the coal matrix. Notably, carbonate and silicate minerals exhibited heightened susceptibility to dissolution, with the dissolution of carbonate minerals favoring the transformation of silicate minerals [17]. Some silicate minerals were converted to other minerals by reactions in the presence of ScCO2–H2O; e.g., illite was converted to kaolinite; other silicate minerals caused elemental migration in the form of precipitation [17,18]. The low migration of the total content of Al and Fe ions in the coal samples was attributed to the fact that these elements existed mainly in the form of clay minerals and crushed quartz, which are chemically more stable and much less reactive than carbonate minerals [37]. The significant migration of Al and Fe ions in a single coal sample (MEG coal) was found to be related to coal rank, coal non-homogeneity, and depositional environment, which are the main factors contributing to the significant differences in the mineral content and species in coal [38]. Therefore, the ScCO2–H2O-induced elemental migration in the coal was related to multiple factors, and it depended largely on the chemical nature of the minerals in the coal and the forms in which they existed. However, most of the carbonate and silicate minerals in coal are affected by the dissolution and erosion of ScCO2–H2O, leading to elemental migration.

3.2. The Pore Structure Change and Its Mechanism

In this study, the IUPAC pore size classification [39] was used, under which coal pores were classified as micropores (<2 nm), mesopores (2–50 nm), and macropores (>50 nm). By using the Barrett–Joyner–Halenda theory and Kelvin equation, the pore volumes of the coal samples before and after the ScCO2–H2O treatment were calculated, and the SSA of the coal was calculated by using the Brunauer–Emmett–Teller (BET) multilayer adsorption equation [28].

3.2.1. The Pore Volume Change

The pore volume statistics of the coal before and after the ScCO2–H2O treatment are presented in Table 5, and Figure 3 shows histograms of the pore volume distributions of the coal. Table 5 summarizes that the sum of the proportions of mesopores as well as macropores is more than 95%, indicating that the pore volume is mainly provided by mesopores and macropores. The pore volume distribution of the coals after the ScCO2–H2O treatment was complex, among which the total pore volume of the MEG, LY, and MZQ coals increased, while that of the WT and DJZ samples decreased (Figure 3a). The micropore volume of all the coal samples increased, except for that of the WT coals (Figure 3b). The mesopore volume increased in the MEG, MZQ, and LY coals and decreased in the WT and DJZ coals (Figure 3c). The macropore volume decreased in the MEG, WT, and DJZ coals and increased in the MZQ and LY coals (Figure 3d).
Overall, the ScCO2–H2O treatment increased the pore volume, the total pore volume increased from 0.000795–0.011543 to 0.001274–0.014644 cm3·g−1, the micropore volume increased from 0–0.00095 to 0.000018–0.00232 cm3·g−1, the mesopore volume increased from 0.000279–0.007208 to 0.000628–0.010987 cm3·g−1, and the macropore volume decreased from 0.000465–0.004241 to 0.000615–0.003425 cm3·g−1 (Table 5).

3.2.2. The Pore SSA Change

The pore SSA results of the different types of coal samples are presented in Table 6, and Figure 4 shows histograms of the distributions of the pore SSAs of the coal samples. Table 6 shows that the pore SSAs of both the raw coals and ScCO2–H2O-treated coals are concentrated in the mesopore section, accounting for 61.22% to 88.38%. The pore SSA distributions of the coals after the ScCO2–H2O treatment are complex, among which the total pore SSAs of the MEG, LY, and MZQ coals increased, while those of the WT and DJZ coals decreased (Figure 4a). The micropore SSAs of all the coals increased, except for those of the WT coal (Figure 4b). The mesopore SSAs increased in the MEG, MZQ, and LY coal and decreased in the WT and DJZ coals (Figure 4c). The macropore volume decreased in the MEG, WT, and DJZ coals and increased in the MZQ and LY coals (Figure 4d).
Overall, after the ScCO2–H2O treatment, the total pore SSAs increased from 0.084–3.332 to 0.400–6.061 m2·g−1, the micropore SSAs increased from 0–0.209 to 0.059–0.509 m2·g−1, the mesopore SSAs increased from 0.053–2.893 to 0.302–5.357 m2·g−1, and the macropore SSAs decreased from 0.024–0.230 to 0.031–0.195 m2·g−1 (Table 6).

3.2.3. The Pore Morphology Change

Based on the adsorption/desorption and coalescence theory, it was established that the distinct relative pressure disparities governing coalescence and evaporation processes delineate separate adsorption and desorption curves, thereby giving rise to a characteristic hysteresis loop. The shape of this loop, as well as the type of adsorption or desorption curves, provides insight into the pore morphology of coal [40]. Figure 5 shows the liquid nitrogen adsorption/desorption isotherms of the different coal samples. It can be seen that the hysteresis loops of the liquid nitrogen adsorption/desorption curves before and after the SccCO2–H2O treatment can be categorized into two patterns. The first hysteresis loop is wider (Figure 5a–c), and the desorption curve exhibits an obvious inflection point (desorption curve above the curve and adsorption curve below) when the relative pressure is about 0.5. These types of curves indicate that the coal samples contained a certain number of poorly connected ink-bottle-shaped pores [28,29]. The second scenario entails a narrower hysteresis loop, where the curves exhibit a rapid ascent at higher relative pressures, with the adsorption curve closely aligning with the desorption curve (Figure 5d,e). Such a curve configuration signifies the presence of a greater number of open macropores within the coal matrix, indicating improved pore connectivity [28,29]. Notably, the morphological characteristics of the liquid nitrogen adsorption/desorption curves for the coal samples remained largely consistent before and after the ScCO2–H2O treatment, with a slight expansion in the hysteresis loop observed. This result suggests that the ScCO2–H2O treatment did not significantly alter the overall pore morphology or pore connectivity.

3.2.4. The Mechanism of Pore Structure Change

The effect of the ScCO2–H2O treatment on the coal pore structure is very complex. The analysis reveals that the ScCO2–H2O treatment increased the number of pores, as well as expanding the pore diameter, in the coal samples. The increase in pore number resulted in an increase in the total pore volume and total pore SSA of the MEG, MZQ, and LY coals. The expansion of the pore diameter resulted in a decrease in the total pore volume and total pore SSA of the WT and DJZ coals. The primary driving force behind the alterations in the coal pore structure was elucidated as the result of reactions and the gradual dissolution of pores that were previously filled with minerals, facilitated by the presence of ScCO2–H2O [16]. The ScCO2–H2O fluids played a significant role in extracting dissolved minerals and certain small molecules, resulting in the opening of pre-existing closed pores within the coal matrix and the formation of new pores [24,25,26,27,28,29,41]. This contributed to an overall increase in both the pore volume and pore SSA. Moreover, some minerals underwent dissolution in the presence of the ScCO2–H2O system, followed by the formation of new minerals, thereby expanding the original pores. Simultaneously, certain minerals precipitated, potentially obstructing specific pores [16,19], leading to a reduction in the pore volume and pore SSA. Therefore, the ScCO2–H2O treatment shows the effect of increasing the number of pores, as well as expanding the diameter of pores, in coal.

3.3. CH4 Isothermal Adsorption and Its Influencing Factors

The common isothermal adsorption equations include the Freundlich isothermal adsorption equation, Langmuir isothermal adsorption equation, Zeta isothermal adsorption equation, and BET isothermal adsorption equation. The amount of CH4 adsorbed by coal is generally expressed by the Langmuir isothermal adsorption equation. The Langmuir model is calculated as follows:
V = V L p P L + p
where V is the adsorption volume, cm3·g−1; p denotes the adsorption equilibrium pressure, MPa; VL is the Langmuir volume, cm3·g−1; and PL is the Langmuir pressure, MPa.

3.3.1. CH4 Isothermal Adsorption

Figure 6 shows the isothermal adsorption curves of each tested coal sample before and after the ScCO2–H2O treatment. The results indicate that the CH4 adsorption of the coal samples increases with an increasing pressure, with the rate of increase gradually plateauing, which is consistent with the type I adsorption isotherm. The isothermal adsorption data were fitted by using the Langmuir model to obtain the adsorption constants VL and PL for the coal samples before and after the ScCO2–H2O treatment (Table 7). The physical meaning of VL is the maximum adsorption amount of a solid medium to a gas, and the physical meaning of PL reflects the time speed when the adsorption amount reaches the maximum. In this study, VL was used to judge the change in the coal adsorption capacity before and after the ScCO2–H2O treatment.
Table 7 shows that the VL of the MEG, WT, and DJZ coals increased after the ScCO2–H2O treatment and that the VL of the MZQ and LY coals decreased. Among them, the most obvious increase was found in the MEG coal, with the VL increasing by 103.21%, and the VL of the WT and DJZ coals increasing by 40.63% and 6.94%, respectively. The VL of the MZQ and LY coals decreased by 7.74% and 3.81%, respectively (Table 7). These results indicate that the ScCO2–H2O treatment led to an increase in the CH4 adsorption capacity of the MEG, WT, and DJZ coals and decreased the CH4 adsorption capacity of the MZQ and LY coals. Interestingly, it was found herein that the isothermal adsorption curve of some samples decreased under higher pressure (Figure 6), which was possibly a “negative adsorption” under higher pressure [42]. The analysis indicates that the CH4 adsorption capacity of the ScCO2–H2O-treated samples increased, as well as decreased, which was mainly related to the mineral reaction and pore structure change.

3.3.2. Pore Structure Effect on CH4 Adsorption

The adsorption capacity of CH4 in coal is affected by the pore volume and pore SSA, and previous studies have shown that the larger the pore volume and pore SSA, the stronger the CH4 adsorption capacity [31,32]. A better illustration of the effect of the changes in the coal pore structure caused by the ScCO2–H2O treatment on the CH4 adsorption capacity can be provided by defining ΔVi and ∆Si by using the following equations:
Δ V i = V B i V A i
Δ S i = S B i S A i
where ΔVi is the pore volume change caused by the ScCO2–H2O treatment with different pore size parameters, cm3·g−1; VAi and VBi denote the pore volume of the samples before and after the ScCO2–H2O treatment at that parameter, cm3·g−1, respectively; ΔSi is the pore SSA change caused by the ScCO2–H2O treatment with different pore size parameters, cm2·g−1; SAi and SBi represent the pore SSAs of the samples before and after the ScCO2–H2O treatment at that parameter, cm2·g−1, respectively.
The amount of variation in each aperture parameter calculated according to formulas 6 and 7 is presented in Table 8. The relationship between each pore size parameter and ∆VL is shown in Figure 7, demonstrating consistency between the change in each pore size parameter and ∆VL. This indicates that the change in the pore structure induced by the ScCO2–H2O treatment directly affects the CH4 adsorption capacity. According to previous studies, pore size has different effects on CH4 adsorption [31,32]. Macropores and mesopores have a weak binding capacity for CH4 molecules due to their large pore sizes, and adsorption does not easily occur; they have a small effect on CH4 adsorption, and these pores mainly play a role in gas flow. Due to their small pore size, micropores have a strong binding capacity for CH4 molecules, and micropores can provide a large specific surface area, which has a strong effect on the CH4 adsorption capacity. In this study, it is found that, with the increase in the total pore volume and total SSA, the CH4 adsorption capacity of coal also increases, and the two are correlated (Figure 7a,b). With the increase in the micropore volume and SSA, the CH4 adsorption capacity of the coal increases significantly, and the fitting effect is better (Figure 7c,d). This result reveals that the adsorption capacity of coal is affected by the change in the pore volume and pore SSA, indicating that micropores are the main factor affecting the adsorption capacity of coal, which is consistent with previous studies [31,32]. Evidently, the perturbations in the pore structure of coal exhibit a discernible impact on its adsorption capacity, with micropores assuming a dominant role in regulating this phenomenon.

3.3.3. Composition Effect on CH4 Adsorption

The pores present in coal contain a variety of inorganic mineral components, mainly including carbonate minerals, clay minerals, and other detrital minerals. Changes in the relative mineral compositions of coal rocks affect the gas adsorption capacity [13,14]. After ScCO2–H2O treatment, the minerals in the coal react, and the dissolution and precipitation of carbonates and silicates lead to a change in the mineral composition of the coal, resulting in changes in the pore volume and pore SSA and further affecting the CH4 adsorption capacity of the coal. Previous studies have concluded the presence of a negative correlation between the mineral content in coal and the gas adsorption capacity; that is, the lower the mineral content, the stronger the gas adsorption capacity [43,44]. Table 3 shows that, after the ScCO2–H2O treatment, the mineral elements in the coal migrated significantly, which led to a decrease in the mineral content in the coal, leading to the enhancement of the CH4 adsorption capacity of most of the samples. In this study, the adsorption capacity of some coal samples after the ScCO2–H2O treatment enhanced, while the adsorption capacity of some other coal samples decreased slightly, mainly due to two reasons. On the one hand, precipitation occurred after the blocking of some pores by the mineral reaction, which reduced the pore volume and pore SSA, thus decreasing the adsorption capacity of the coal. On the other hand, the mineral reaction led to the opening of some closed pores and increased the number of pores, which resulted in an increase in the pore volume and the SSA, thus improving the adsorption capacity of the coal. However, in general, the main effect of ScCO2–H2O treatment is to open the closed pores and increase the pore number, which can aid in increasing the adsorption capacity of coal.
In summary, after ScCO2–H2O treatment, the effect of minerals on the adsorption capacity is mainly manifested by a decrease in mineral content, an increase in pore volume as well as pore SSA, and an increase in the coal adsorption capacity.

4. Conclusions

In this study, five types of coal samples with different ranks from the eastern margin of the Ordos Basin were treated with the ScCO2–H2O system. Through elemental detection, a pore structure test, and CH4 adsorption experiments, the elemental migration, pore structure changes, and CH4 adsorption performance changes in the samples after the ScCO2–H2O treatment were analyzed and explored, and the following conclusions were drawn:
(1) ScCO2–H2O reacted with the minerals present in the coal pores, which resulted in elemental migration. The migration of Ca ions was the most pronounced, ranging from 0 to 16.8–970 mg·L−1, followed by the Na, Mg, and K ions. The migration of Al was low, ranging from 0 to 0.004–2.555 mg·L−1. The main reason for the difference in element migration is that the minerals in coal are mainly clay minerals and carbonate minerals, and carbonate minerals are more soluble. (2) The reaction of these minerals led to a change in the coal pore structure after the ScCO2–H2O treatment. The dissolution of minerals in the coal formed some new pores and opened some closed pores, which increased the pore volume and pore SSA. The minerals in the coal reacted and led to pore expansion; in contrast, the mineral precipitation blocked some of the pores, which reduced the pore volume and pore SSA. (3) The changes in the CH4 adsorption capacity of the coal caused by the ScCO2–H2O treatment were influenced by the reaction of the minerals in the coal and the pore structure. After the ScCO2–H2O treatment, the minerals in the coal underwent a reaction, which reduced the mineral content and improved the adsorption capacity of the coal. As the minerals reacted, the number of coal pores increased, and the pores expanded, which increased the pore volume and pore SSA, and improved the adsorption capacity of the coal. (4) These findings provide valuable theoretical underpinnings for endeavors related to CO2 sequestration and the enhancement of coalbed methane recovery.

Author Contributions

Writing—original draft preparation, R.C. and Y.Z.; writing—review and editing, R.C., Y.Z. and K.H.; supervision, R.C., T.D. and G.T. All authors have read and agreed to the published version of the manuscript.

Funding

The research was funded by the Fundamental Research Funds for the Central Universities (2019XKQYMS24).

Data Availability Statement

The original contributions presented in the study are included in the article. Further inquires can be directed to the corresponding author.

Acknowledgments

We thank the Jiangsu Key Laboratory of Coal-based Greenhouse Gas Control and Utilization (Carbon Neutrality Institute, China University of Mining and Technology) for supporting this experimental sample test.

Conflicts of Interest

The authors declare no conflict of interest.

References

  1. Godin, J.; Liu, W.Z.; Ren, S.; Xu, C.C. Advances in recovery and utilization of carbon dioxide: A brief review. J. Environ. Chem. Eng. 2021, 9, 105644. [Google Scholar] [CrossRef]
  2. Kimming, M.; Sundberg, C.; Nordberg, A.; Baky, A.; Bernesson, S.; Hansson, P.A. Replacing fossil energy for organic milk production–potential biomass sources and greenhouse gas emission reductions. J. Clean. Prod. 2015, 106, 400–407. [Google Scholar] [CrossRef]
  3. Mathew, T.J.; Narayanan, S.; Jalan, A.; Matthews, L.; Gupta, H.; Billimoria, R.; Pereira, G.S.; Goheen, C.; Tawarmalani, M.; Agrawal, R. Advances in distillation: Significant reductions in energy consumption and carbon dioxide emissions for crude oil separation. Joule 2022, 6, 2500–2512. [Google Scholar] [CrossRef]
  4. Manning, D.A.; Renforth, P. Passive sequestration of atmospheric CO2 through coupled plant-mineral reactions in urban soils. Environ. Sci. Technol. 2013, 47, 135–141. [Google Scholar] [CrossRef] [PubMed]
  5. Washbourne, C.L.; Lopez, C.E.; Renforth, P.; Ascough, P.L.; Manning, D.A. Rapid removal of atmospheric CO2 by urban soils. Environ. Sci. Technol. 2015, 49, 5434–5440. [Google Scholar] [CrossRef] [PubMed]
  6. Shaw, R.; Mukherjee, S. The development of carbon capture and storage (CCS) in India: A critical review. Carbon Capture Sci. Technol. 2022, 2, 100036. [Google Scholar] [CrossRef]
  7. Li, Q.C.; Zhao, D.F.; Yin, J.K.; Zhou, X.Y.; Li, Y.; Chi, P.; Han, Y.; Ubedullah, A.; Cheng, Y.F. Sediment Instability Caused by Gas Production from Hydrate-bearing Sediment in Northern South China Sea by Horizontal Wellbore: Evolution and Mechanism. Nat. Resour. Res. 2023, 32, 1595–1620. [Google Scholar] [CrossRef]
  8. Li, Q.C.; Zhang, C.; Yang, Y.D.; Ubedullah, A.; Han, Y.; Li, X.Z.; Cheng, Y.F. Preliminary experimental investigation on long-term fracture conductivity for evaluating the feasibility and efficiency of fracturing operation in offshore hydrate-bearing sediments. Ocean Eng. 2023, 28, 114949. [Google Scholar] [CrossRef]
  9. Zoha, D.I.; Ali, S.; Mirhasan, H.; Jalal, F.; Stefan, I.; Alireza, K. Interfacial tensions of (brine + H2 + CO2) systems at gas geo-storage conditions. J. Mol. Liq. 2023, 374, 121279. [Google Scholar]
  10. Atanu, C.; Santanu, B.; Pratik, D. CH4/CO2 binary gas interaction on some moist, high–volatile bituminous Indian coals: 2. Pure-/mixed-gas adsorption modelling. J. Pet. Sci. Eng. 2022, 208, 109673. [Google Scholar]
  11. Ronny, P.; Stefan, O.; Giuseppe, S.; Marco, M. Pure and competitive adsorption of CO2, CH4 and N2 on coal for ECBM. Energy Procedia 2009, 1, 1705–1710. [Google Scholar]
  12. Anna, P.; Mateusz, K.; Norbert, S.; Mirosław, W.; Leticia, T.P.B. Studies on the competitive sorption of CO2 and CH4 on hard coal. Int. J. Greenh. Gas Control 2019, 90, 102789. [Google Scholar]
  13. Massarotto, P.; Golding, S.D.; Bae, J.S.; Rudolph, V. Changes in reservoir properties from injection of supercritical CO2 into coal seams—A laboratory study. Int. J. Coal Geol. 2010, 82, 269–279. [Google Scholar] [CrossRef]
  14. Du, Q.H.; Liu, X.L.; Wang, E.Z.; Zuo, J.P.; Wang, W.M.; Zhu, Y.J. Effects of CO2–water interaction with coal on mineral content and pore characteristics. J. Rock Mech. Geotech. Eng. 2020, 12, 326–337. [Google Scholar] [CrossRef]
  15. Karacan, C.Ö. Heterogeneous sorption and swelling in a confined and stressed coal during CO2 injection. Energy Fuels 2003, 17, 1595–1608. [Google Scholar] [CrossRef]
  16. Zareei, D.; Rostami, B.; Kostarelos, K. Petrophysical changes of carbonate rock related to CO2 injection and sequestration. Int. J. Greenh. Gas Control 2022, 117, 103648. [Google Scholar] [CrossRef]
  17. Alemu, B.L.; Aagaard, P.; Munz, I.A.; Skurtveit, E. Caprock interaction with CO2: A laboratory study of reactivity of shale with supercritical CO2 and brine. Appl. Geochem. 2011, 26, 1975–1989. [Google Scholar] [CrossRef]
  18. Watson, M.N.; Zwingmann, N.; Lemon, N.M. The Ladbroke Grove-Katnook carbon dioxide natural laboratory: A recent CO2 accumulation in a lithic sandstone reservoir. In Proceedings of the 6th International Conference on Greenhouse Gas Control Technologies, Kyoto, Japan, 1–4 October 2002; pp. 435–440. [Google Scholar]
  19. Dawson, G.K.; Golding, S.D.; Biddle, D.; Massarotto, P. Mobilisation of elements from coal due to batch reactor experiments with CO2 and water at 40 °C and 9.5 MPa. Int. J. Coal Geol. 2015, 140, 63–70. [Google Scholar] [CrossRef]
  20. Wang, K.R.; Xu, T.F.; Tian, H.L.; Wang, F.G. Impacts of mineralogical compositions on different trapping mechanisms during long-term CO2 storage in deep saline aquifers. Acta Geotech. 2016, 11, 1167–1188. [Google Scholar] [CrossRef]
  21. Levine, J.R. Model study of the influence of matrix shrinkage on absolute permeability of coal bed reservoirs. Geol. Soc. 1996, 109, 197–212. [Google Scholar] [CrossRef]
  22. Masoudian, M.S.; Airey, D.W.; El-Zein, A. A chemo-poro-mechanical model for sequestration of carbon dioxide in coalbeds. In Bio- and Chemo-Mechanical Processes in Geotechnical Engineering: Géotechnique Symposium in Print 2013; ICE Publishing: London, UK, 2014; pp. 81–89. [Google Scholar]
  23. Mazzotti, M.; Pini, R.; Storti, G. Enhanced coalbed methane recovery. J. Supercrit. Fluids 2009, 47, 619–627. [Google Scholar] [CrossRef]
  24. Wang, X.L.; Geng, J.B.; Zhang, D.M.; Xiao, W.J.; Chen, Y.; Zhang, H. Influence of sub-supercritical CO2 on pore structure and fractal characteristics of anthracite: An experimental study. Energy 2022, 261, 125115. [Google Scholar] [CrossRef]
  25. Liu, C.J.; Wang, G.X.; Sang, S.X.; Gilani, W.; Rudolph, V. Fractal analysis in pore structure of coal under conditions of CO2 sequestration process. Fuel 2015, 139, 125–132. [Google Scholar] [CrossRef]
  26. Sampath, K.H.; Perera, M.S.; Ranjith, P.G.; Matthai, S.K. CO2 interaction induced mechanical characteristics alterations in coal: A review. Int. J. Coal Geol. 2019, 204, 113–129. [Google Scholar] [CrossRef]
  27. Du, Y.; Sang, S.X.; Wang, W.F.; Liu, S.Q.; Wang, T.; Fang, H.H. Experimental study of the reactions of supercritical CO2 and minerals in high-rank coal under formation conditions. Energy Fuels 2018, 32, 1115–1125. [Google Scholar] [CrossRef]
  28. Chen, K.; Liu, X.F.; Wang, L.K.; Song, D.Z.; Nie, B.S.; Yang, T. Influence of sequestered supercritical CO2 treatment on the pore size distribution of coal across the rank range. Fuel 2021, 306, 121708. [Google Scholar] [CrossRef]
  29. Liu, S.Q.; Ma, J.S.; Sang, S.X.; Wang, T.; Du, Y.; Fang, H.H. The effects of supercritical CO2 on mesopore and macropore structure in bituminous and anthracite coal. Fuel 2018, 223, 32143. [Google Scholar] [CrossRef]
  30. Zhang, K.; Sang, S.X.; Zhou, X.Z.; Liu, C.J.; Ma, M.Y.; Niu, Q.H. Influence of supercritical CO2-H2O-caprock interactions on the sealing capability of deep coal seam caprocks related to CO2 geological storage: A case study of the silty mudstone caprock of coal seam no. 3 in the Qinshui Basin, China. Int. J. Greenh. Gas Control 2021, 106, 103282. [Google Scholar] [CrossRef]
  31. Liu, S.Q.; Wang, H.; Sang, S.X.; Liu, T.; Zheng, S.J. Effects of pore structure changes on the CH4 adsorption capacity of coal during CO2-ECBM. Fuel 2022, 330, 125529. [Google Scholar] [CrossRef]
  32. Zhao, J.L.; Xu, H.; Tang, D.Z.; Mathews, J.P.; Li, S.; Tao, S. A comparative evaluation of coal specific surface area by CO2 and N2 adsorption and its influence on CH4 adsorption capacity at different pore sizes. Fuel 2016, 183, 420–431. [Google Scholar] [CrossRef]
  33. Liu, G.X.; Smirnov, A.V. Carbon sequestration in coal-beds with structural deformation effects. Energy Convers. Manag. 2009, 50, 1586–1594. [Google Scholar] [CrossRef]
  34. Wu, P.; Gao, J.X.; Guo, J.C. Stratigraphic and depositional characteristics of the Qiaotou Sandstone of the Taiyuan Formation in the Linxing area of the eastern margin of the Ordos Basin. Oil Gas Geol. 2018, 39, 66–76. [Google Scholar]
  35. Chen, R.; Qin, Y. Fluid-solid coupling between supercritical CO2 and minerals in coal and geological significances. Coal Sci. Technol. 2012, 40, 17–21. [Google Scholar]
  36. Harvey, O.R.; Qafoku, N.P.; Cantrell, K.J.; Lee, G.; Amonette, J.E.; Brown, C.F. Geochemical implications of gas leakage associated with geologic CO2 storage: A qualitative review. Environ. Sci. Technol. 2013, 47, 23–36. [Google Scholar] [CrossRef] [PubMed]
  37. Black, J.R.; Haese, R.R. Chlorite dissolution rates under CO2 saturated conditions from 50 to 120 °C and 120 to 200 bar CO2. Geochim. Cosmochim. Acta 2014, 125, 225–240. [Google Scholar] [CrossRef]
  38. Jason, D.S.; Sai, W.; Andrew, J.L.; Alex, J.R.; Jason, E.H.; Bhaskar, S.M. Paragenetic controls on CO2-fluid-rock interaction and weakening in a macroporous-dominated sandstone. Appl. Geochem. 2023, 156, 105744. [Google Scholar]
  39. Mudoi, M.P.; Singh, V. Pore size estimation of indian coal through low-pressure N2 adsorption. Mater. Today Proc. 2023. [Google Scholar] [CrossRef]
  40. Chen, P.; Tang, X.Y. Study of low-temperature nitrogen adsorption and microporosity characteristics in coal. J. Coal 2001, 26, 552–556. [Google Scholar]
  41. Gathitu, B.B.; Chen, W.Y.; McClure, M. Effects of coal interaction with supercritical CO2: Physical structure. Ind. Eng. Chem. Res. 2009, 48, 5024–5034. [Google Scholar] [CrossRef]
  42. Pratik, D.; Atanu, C.; Santanu, B. Isotherm characteristics and impact of the governing factors on supercritical CO2 adsorption properties of coals. J. CO2 Util. 2020, 39, 101150. [Google Scholar]
  43. Deng, C.M.; Tang, D.Z.; Liu, S.M.; Xu, H.; Tao, S. Characterization of mineral composition and its influence on microstructure and sorption capacity of coal. J. Nat. Gas Sci. Eng. 2015, 25, 46–57. [Google Scholar] [CrossRef]
  44. Gamson, P.D.; Beamish, B.B.; Johnson, D.P. Coal microstructure and secondary mineralization: Their effect on methane recovery. Geol. Soc. 1996, 109, 165–179. [Google Scholar] [CrossRef]
Figure 1. Locations of samples collected.
Minerals 13 01262 g001
Figure 2. A schematic showing the high-pressure reactor.
Minerals 13 01262 g002
Figure 3. Histograms of pore volume distributions of samples: (a) distribution of total pore volume; (b) distribution of micropore volume; (c) distribution of mesopore volume; (d) distribution of macropore volume.
Minerals 13 01262 g003
Figure 4. Histograms of pore SSA distributions of coal samples: (a) distribution of total SSA; (b) distribution of micropore SSA; (c) distribution of mesopore SSA; (d) distribution of macropore SSA.
Minerals 13 01262 g004
Figure 5. Liquid nitrogen adsorption/desorption isotherms of different coals: (a) MEG coal; (b) WT coal; (c) DJZ coal; (d) MZQ coal; (e) LY coal.
Minerals 13 01262 g005
Figure 6. Isothermal adsorption curves of different coal samples: (a) MEG coal; (b) WT coal; (c) DJZ coal; (d) MZQ coal; (e) LY coal.
Minerals 13 01262 g006
Figure 7. Relationship between pore structure and ∆VL: (a) relationship between ∆VC and ∆VL; (b) relationship between ∆SC and ∆VL; (c) relationship between ∆Vm and ∆VL; (d) relationship between ∆Sm and ∆VL.
Minerals 13 01262 g007
Table 1. The results of proximate analysis and Ro,max.
SampleProximate Analysis (%)Ro,max (%)
MadAdVdafFCd
MEG3.999.8337.4656.390.82
WT2.637.5239.3856.060.99
DJZ0.5233.5526.8748.591.33
MZQ0.668.7019.2673.721.79
LY0.359.2915.3476.791.98
Table 2. The conditions of ScCO2–H2O treatment of coal.
ItemSampleSample SizeWaterTPTimeGas
ConditionMEG, WT, DJZ, MZQ, LY coals20–60 meshdeionized water40 °C9 MPa96 h99.99% CO2
Table 3. Constant elemental content in ScCO2–H2O-treated water.
SampleContent (mg·L−1)
AlFeCaMgKNa
Deionized water000000
MEG–ScCO2–H2O-treated water2.5551543448.530.088.93
WT–ScCO2–H2O-treated water0.0170.03748.56.471.6511.3
DJZ–ScCO2–H2O-treated water0.0040.2916.83.512.4450
MZQ–ScCO2–H2O-treated water0.0410.0222688.511.1818.9
LY–ScCO2–H2O-treated water0.0060.02497013.742.4211.8
Table 4. The reaction patterns of minerals [35,36,37].
MineralsReaction PatternsReferences
claycalcite C a C O 3 + C O 2 + H 2 O C a 2 + + 2 H C O 3 [35,36]
dolomite C a M g ( C O 3 ) 2 + 2 C O 2 + 2 H 2 O C a 2 + + M g 2 + + 4 H C O 3 [35,36]
carbonatekaolinite A l 2 S i 2 O 5 O H 4 + 6 C O 2 + 5 H 2 O   2 A l 3 + + 2 H 2 S i O 4 + 6 H C O 3 [36]
chlorite F e / M g 5 A l 2 S i 3 O 10 O H 8 + 5 C a C O 3 + 5 C O 2   5 C a F e / M g C O 3 2 + A l 2 S i O 5 O H 4 + S i O 2 + H 2 O [37]
Table 5. The pore volumes of the samples.
SamplesPore
Volume (cm3·g−1)
Total Volume (cm3·g−1)Percentage of Pore Volume (%)
<2 nm2–50 nm>50 nm<2 nm2–50 nm>50 nm
MEGRaw coal0.0000950.0072080.0042410.0115430.8262.4436.74
ScCO2–H2O-treated coal0.0002320.0109870.0034250.0146441.5875.0323.39
WTRaw coal0.0000610.0018110.0008680.002742.2166.131.68
ScCO2–H2O-treated coal0.0000180.0012540.0007720.0020430.8661.3737.76
DJZRaw coal0.0000360.0015210.0009820.0025391.4259.938.68
ScCO2–H2O-treated coal0.0000540.0009910.0006860.0017313.1157.2439.64
MZQRaw coal0.0000120.0003180.0004650.0007951.4940.0458.48
ScCO2–H2O-treated coal0.000030.0006280.0006150.0012742.3749.3348.3
LYRaw coal00.0002790.0005870.000866032.2467.77
ScCO2–H2O-treated coal0.0000270.0010020.0009440.0019731.3550.8147.83
Table 6. The pore SSAs of the samples.
SamplesPore SSA (m2·g−1)Total SSA (m2·g−1)Percentage of Pore SSA (%)
<2 nm2–50 nm>50 nm<2 nm2–50 nm>50 nm
MEGRaw coal0.2092.8930.2303.3326.2786.836.90
ScCO2–H2O-treated coal0.5095.3570.1956.0618.4088.383.22
WTRaw coal0.1290.9040.0451.07811.9683.834.21
ScCO2–H2O-treated coal0.0390.4070.0410.4878.0083.618.39
DJZRaw coal0.0770.9220.0521.0517.3487.714.95
ScCO2–H2O-treated coal0.1180.550.0360.70516.8278.045.14
MZQRaw coal0.0260.0790.0240.12820.2661.2218.52
ScCO2–H2O-treated coal0.0660.3020.0310.40016.4375.697.88
LYRaw coal00.0530.0310.084063.6536.35
ScCO2–H2O-treated coal0.0590.3710.0500.48012.2677.2610.48
Table 7. VL and PL of the samples.
SamplesVL (cm3·g−1)PL (MPa)R2
MEGRaw coal9.882672.345080.99156
ScCO2–H2O-treated coal20.082141.999490.99685
WTRaw coal11.427001.992540.99770
ScCO2–H2O-treated coal18.332181.819420.99299
DJZRaw coal6.377321.370030.99413
ScCO2–H2O-treated coal7.944391.435360.96996
MZQRaw coal22.495392.035660.99529
ScCO2–H2O-treated coal20.753811.640720.99878
LYRaw coal22.868380.955300.99952
ScCO2–H2O-treated coal21.997930.980210.99081
Table 8. Amount of change in pore size parameters of coal samples after ScCO2–H2O treatment.
SamplesVL (cm3·g−1)VC (cm3·g−1)SC (m2·g−1)Vm (cm3·g−1)Sm (m2·g−1)
MEG10.199470.0031012.7290.0001370.3
WT6.90518–0.000697−0.591−0.000043–0.09
DJZ1.56707–0.000808−0.3460.0000180.041
MZQ−1.741580.0004790.2720.0000180.04
LY−0.870450.0011070.3960.0000270.059
Note: ∆VC, ∆SC, ∆Vm, and ∆Sm are the pore size parameter changes: ∆VC is the amount of change in total pore volume; ∆Vm is the amount of change in micropore volume; ∆SC is the amount of change in total pore SSA; and ∆Sm is the amount of change in micropore SSA.
Disclaimer/Publisher’s Note: The statements, opinions and data contained in all publications are solely those of the individual author(s) and contributor(s) and not of MDPI and/or the editor(s). MDPI and/or the editor(s) disclaim responsibility for any injury to people or property resulting from any ideas, methods, instructions or products referred to in the content.

