Article

Prediction of the Mechanical Performance of Cemented Tailings Backfill Using Ultrasonic Pulse Velocity Measurement

1
School of Energy and Mining Engineering, China University of Mining & Technology (Beijing), Beijing 100083, China
2
School of Civil Engineering, Shaoxing University, Shaoxing 312000, China
3
State Key Laboratory for Geomechanics and Deep Underground Engineering, China University of Mining & Technology (Beijing), Beijing 100083, China
*
Author to whom correspondence should be addressed.
Minerals 2022, 12(8), 986; https://doi.org/10.3390/min12080986
Submission received: 13 July 2022 / Revised: 27 July 2022 / Accepted: 28 July 2022 / Published: 3 August 2022
(This article belongs to the Special Issue Solid-Filling Technology in Coal Mining)

Abstract

:
Cemented tailings backfill (CTB), prepared by a mixture of tailings, binder, and water in a certain proportion, is widely applied to mines worldwide for ground support and tailings disposal. The prediction of the mechanical properties of CTB during the whole consolidation process is of great practical importance. The objective of this paper focuses on the investigation of the prediction of the mechanical performance of CTB based on the ultrasonic pulse velocity (UPV) method. The CTB samples prepared with different binder-to-water (b/w) ratios, as well as solid content were monitored by the UPV method during the curing age of 28 days. The evolution of dynamic shear modulus and dynamic elasticity modulus properties of CTB samples were studied by UPV monitoring. Meanwhile, uniaxial compressive strength (UCS) and microstructure tests were performed on CTB samples at curing times of 3, 7, and 28 days. The results showed that the UPV development follows a trend that increases fast at early curing ages and then becomes stable at the 10 d curing age. UPV and UCS increased with the increase in b/w, solid content, and curing age. From the results of microstructure tests, the increase in UPV is attributed to the low porosity and compact structure due to the increase in the b/w ratio and solid content. For the purpose of predicting the UCS of CTB utilizing UPV monitoring, the empirical equations for the relationship between UCS and UPV of CTB with variation b/w ratios and solid content were regression analyses. F-tests, as well as t-tests, were used to check the validity of the equations, which indicate that higher calculated values for CTB to predicted UCS by means of the UPV method. The main finding of this paper shows that the UPV monitoring method can be an effective way to predict the mechanical property of CTB in the field and is non-destructive and effective.

1. Introduction

Ultrasonic pulse velocity (UPV) is a method for assessing the mechanical performance of rock or cement-based materials. In general, the application of the UPV method includes shear waves (s-waves), as well as longitudinal waves (p-waves). Due to the properties of non-destructive testing, effectiveness, and quickness, the UPV method has been widely used [1]. Therefore, many investigations have been performed to investigate the relationship between UPV and the mechanical properties of cement-based materials [2]. First applied to cement-based materials in 1981 by Stepišnik [3], the UPV method was widely used and then further advanced by Valič [4]. The evolution of mechanical properties of cement-based materials at an early curing time can be effectively monitored by means of the UPV method [5,6,7]. The shear modulus and viscosity of materials, which are vital significant parameters for engineering, are measured by the monitoring of shear waves. Hence, a linear relationship between mechanical parameters and shear waves is obtained [8,9]. Furthermore, the velocity of the ultrasonic longitudinal waves was found to be closely correlated to the development of the microstructure in cement-based material, such as the hydration process of cement [10], the solid percolation [11,12], and the generation of hydration products [13]. Reinhardt and Grosse developed an ultrasonic shear waves FreshCon device which was applied in many types of research. It shows that the P-wave velocity can be effectively used for examining solidifying examine and hardening the materials [14,15,16].
Cemented tailing backfill (CTB) is principally an engineered mixture of tailings, hydraulic binder, and mixing water [17,18,19]. In the field, the CTB structure must remain stable during the extraction of adjacent stopes to ensure the safety of the mine workers. Therefore, the UCS of CTB is an important index of mechanical properties [20,21,22]. The monitoring method of the structure, mechanical properties, and hardening process of CTB is advanced along with the advances in measurement and computer technology in recent years. Among these, the UPV method is considered to be a non-destructive, economic, and effective method that is applied both in the field and lab. Hence, the UPV method has played an important role in assessing the mechanical performance of CTB which takes the place of the traditional compressive strength test. Previous studies were performed to study the relationship between the P-wave velocity and the initial setting time of different cementitious materials [2,23,24,25]. Krauss and Hariri [10] proposed a procedure for determining the end of dormancy and initial hydration by the UPV method. Many researchers try to correlate different single ultrasonic parameters to the compressive strength of CTB and estimate the compressive strength of hardened concrete by means of the velocity of ultrasonic P-waves [2,26]. G Ye used the UPV measurement to verify the simulation results of microstructure in cementitious materials [12].
However, the correlation between the velocity of ultrasonic longitudinal and the mechanical properties of CTB which is subjected to binder–water (b/w) ratio, as well as solid content has not been well understood. Therefore, this paper aims to investigate the ultrasonic properties of CTB with different b/w ratios as well as solid content during the curing age of 28 days. The dynamic shear modulus and dynamic elasticity modulus have been obtained based on the ultrasonic pulse velocity method. The evolution of microscopic structure is also investigated to explain the mechanism of strength development of CTB samples Then, a non-destructive assessment equation is determined to measure the UCS of CTB samples through the correlation between UCS and UPV. The test results may be helpful not only to the understanding of the basic mechanical performance of CTB at different curing ages, but also to the enhancement of the safety management of tailings disposal in backfill mines.

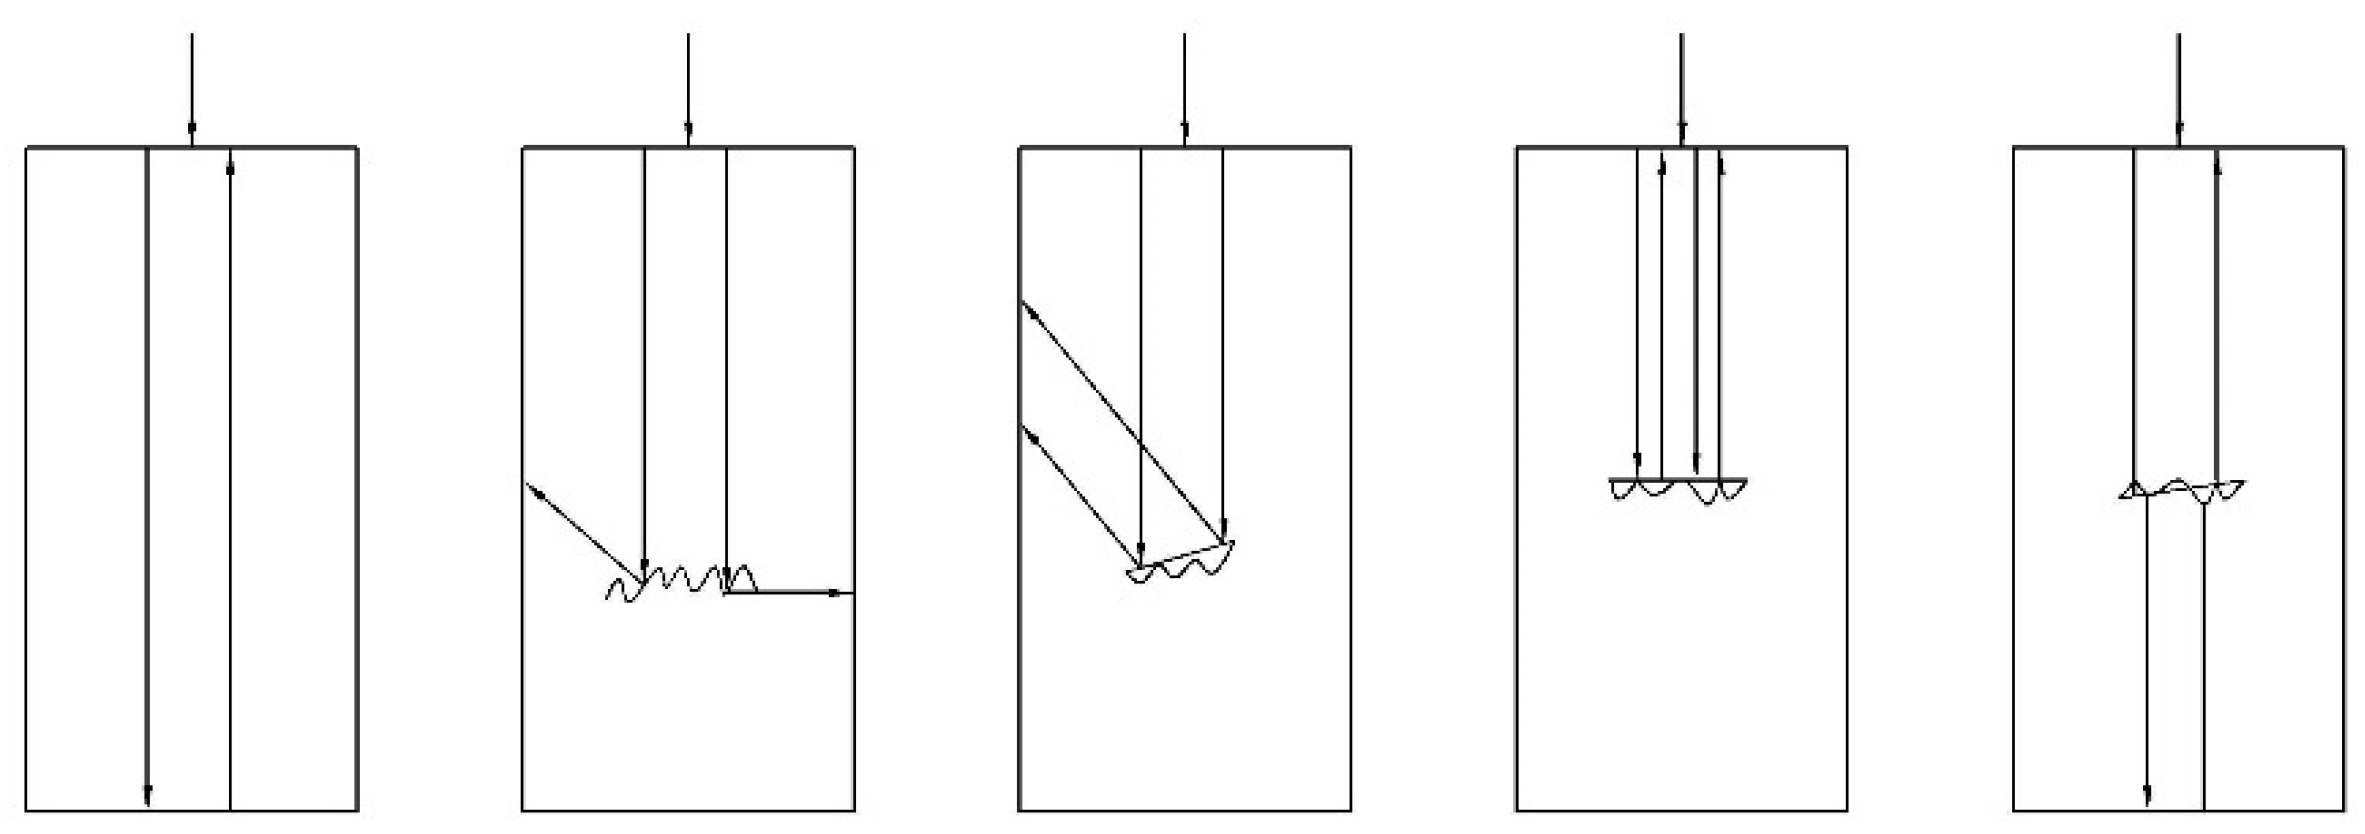
2. Theoretical Base of the Measurement

Ultrasonic pulse velocity and amplitude are the common parameters of an ultrasonic wave transmitting in the elastic medium. The elastic constants can be determined by measuring the speed of sound in solids due to the speed of ultrasonic wave propagation depending on the elastic properties of the cement-based materials. The waves propagate in the samples, which can cause reflection and refraction in the case of encountering the heterogeneous interface, so it can reflect the construction of samples, as shown in Figure 1.
According to the previous research, a plain elastic wave can be described by the d’Alembert equation [27] in an isotropic boundless body:
2 u = 1 w 2 2 u t 2
2 u x x 2 = 1 w l 2 2 u x t 2    
2 u y x 2 = 1 w t 2 2 u y t 2
where u is the displacement of the solid particle due to the wave propagation. Longitudinal and transverse waves can be obtained, where w l and w t are the longitudinal and transverse speeds of sound, respectively.
The phenomenon of wave propagation is stronger than the property that can be deformed along different axes after propagating at the base, and is related to the elasticity of the eyeball according to the following equation [28]:
w l = E ( 1 v ) ρ ( 1 + v ) ( 1 2 v )
w t = E 2 ρ ( 1 + v )  
where ρ is the density.
The value v can be between 0 and 1/2 [28], and w l is greater than w t :
w l 2 w t
Moreover, according to Equations (4) and (5), it can be seen that the elastic properties of solids depend on the longitudinal and shear sound velocities, which are related as follows [27]:
v = 1 2 ( w t w l ) 2 2 2 ( w t w l ) 2
E = 2 ρ w t 2 ( 1 + v )
G = E 2 ( 1 + v )
where G is the shear modulus.

3. Materials and Methods

3.1. Materials and Properties

Iron mining tailings which were from a mine located in the north of China were used to prepare the fresh CTB. Figure 2 shows the particle size distribution curve of the tailings material used in the test. LS-C (II A) laser particle size analyzer is used to measure the particle size distribution of tailing. Tailings are well-graded, homogeneous, and free of sulfide minerals. The fine particle (−20 μm) content of tailings was 53.7 wt.%, significantly above the threshold level of 15 wt.%. Thus, the tailings are classified as medium tailing [29].
Table 1 shows the chemical composition of unclassified tailing. The main chemical compositions of unclassified tailing are SiO2, Al2O3, CaO, Fe2O3, FeO, and MgO, the percentage of SiO2 is 79.770%, so the chemical properties of unclassified tailing are acidic.
The binder used to prepare the CTB in this paper is Portland cement type I (PCI). The properties of the PCI are provided in Table 2 and Table 3. The dominating chemical components are CaO (62.82%) and SiO2 (18.03%). The water used for mixing the CTB samples is tap water.

3.2. Specimen Preparation

In this research, the CTB samples are prepared with the b/w ratio of 1:4, 1:6, 1:8, and 1:10, and the solid content of 72% and 75%, and 78%, as shown in Table 4. The tailings, binder, and water were blended and homogenized for approximately 15 min to produce the specimen compound. The prepared specimen mixtures were poured into curing cylindrical molds with a diameter of 50mm and a height of 100 mm for the UPV monitoring, uniaxial compression strength (UCS) test, and microstructure test. The prepared molds were cured under an environmental chamber with a controlled temperature of 20 °C and 90% ± 5% relative humidity.

3.3. Test Process

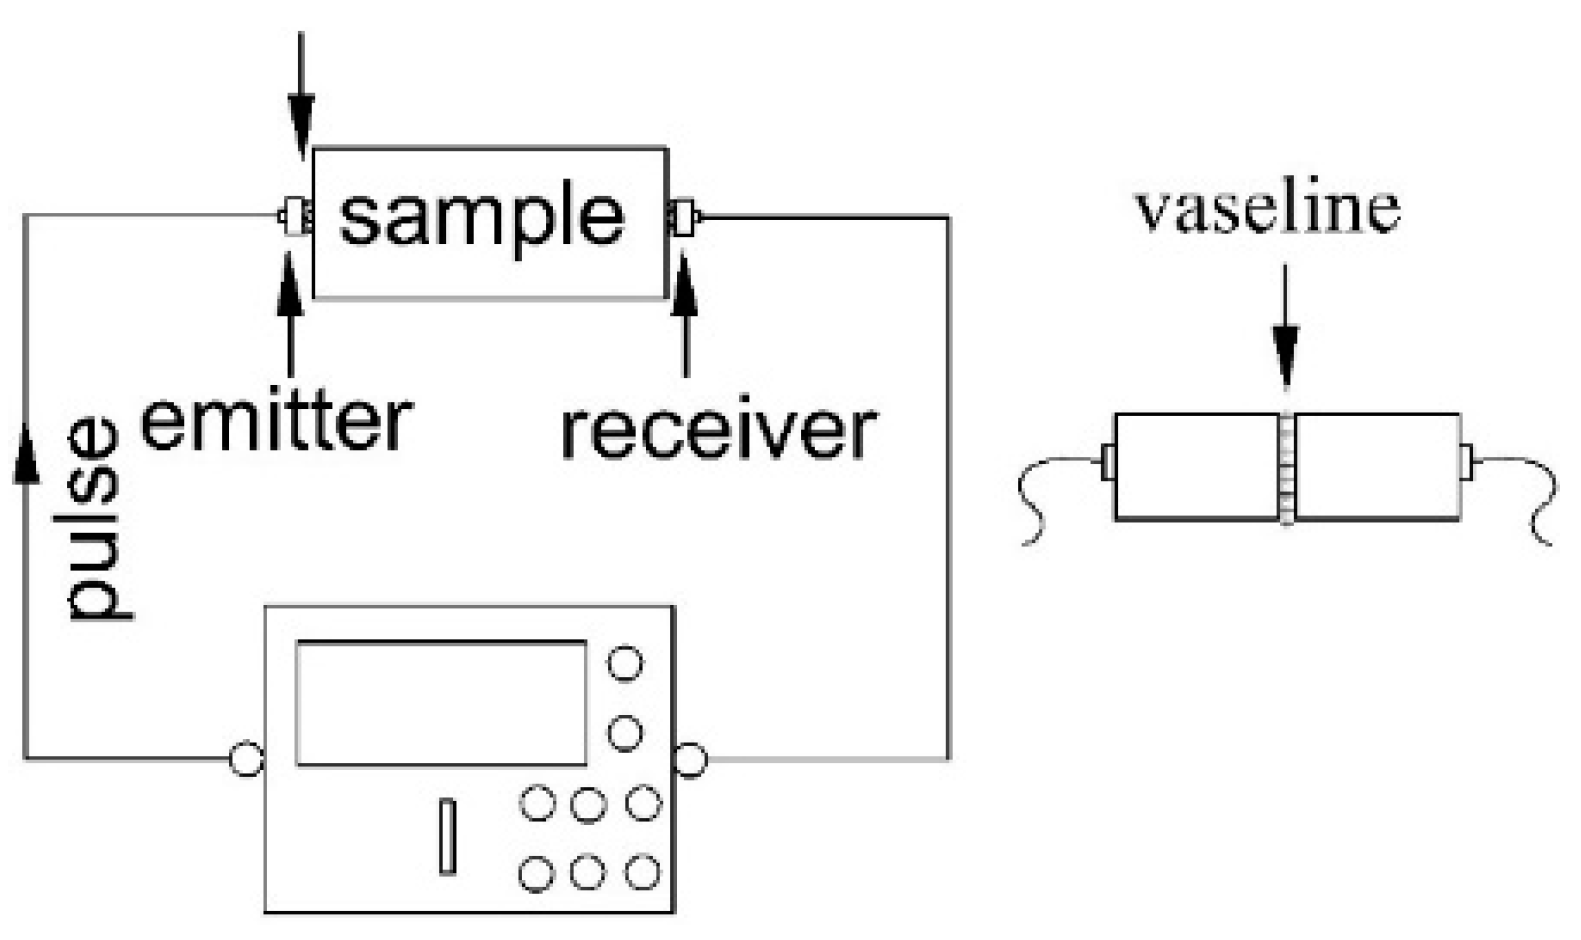
3.3.1. Ultrasonic Test

The ultrasonic parameters of the CTB samples were measured by the ZBL-U510 nonmetal ultrasonic detector, As shown in Figure 3. The end surface of the CTB specimen was made smooth and flat before measurement which aims to couple between the sensor and specimen surface. Hence, increasing the accuracy of measurement. To eliminate bubbles and ensure complete contact between the transducer and the surface of CTB samples, the transducer (transmitter and receiver) is coated with a film of Vaseline [1].

3.3.2. Uniaxial Compressive Strength (UCS) Test

The UCS tests according to ASTMC 109-02 are carried out by using a computer-controlled mechanical press, which has a normal loading capacity of 50KN. During the compressive test, the displacement rate of the press is set at 0.5 mm/min.

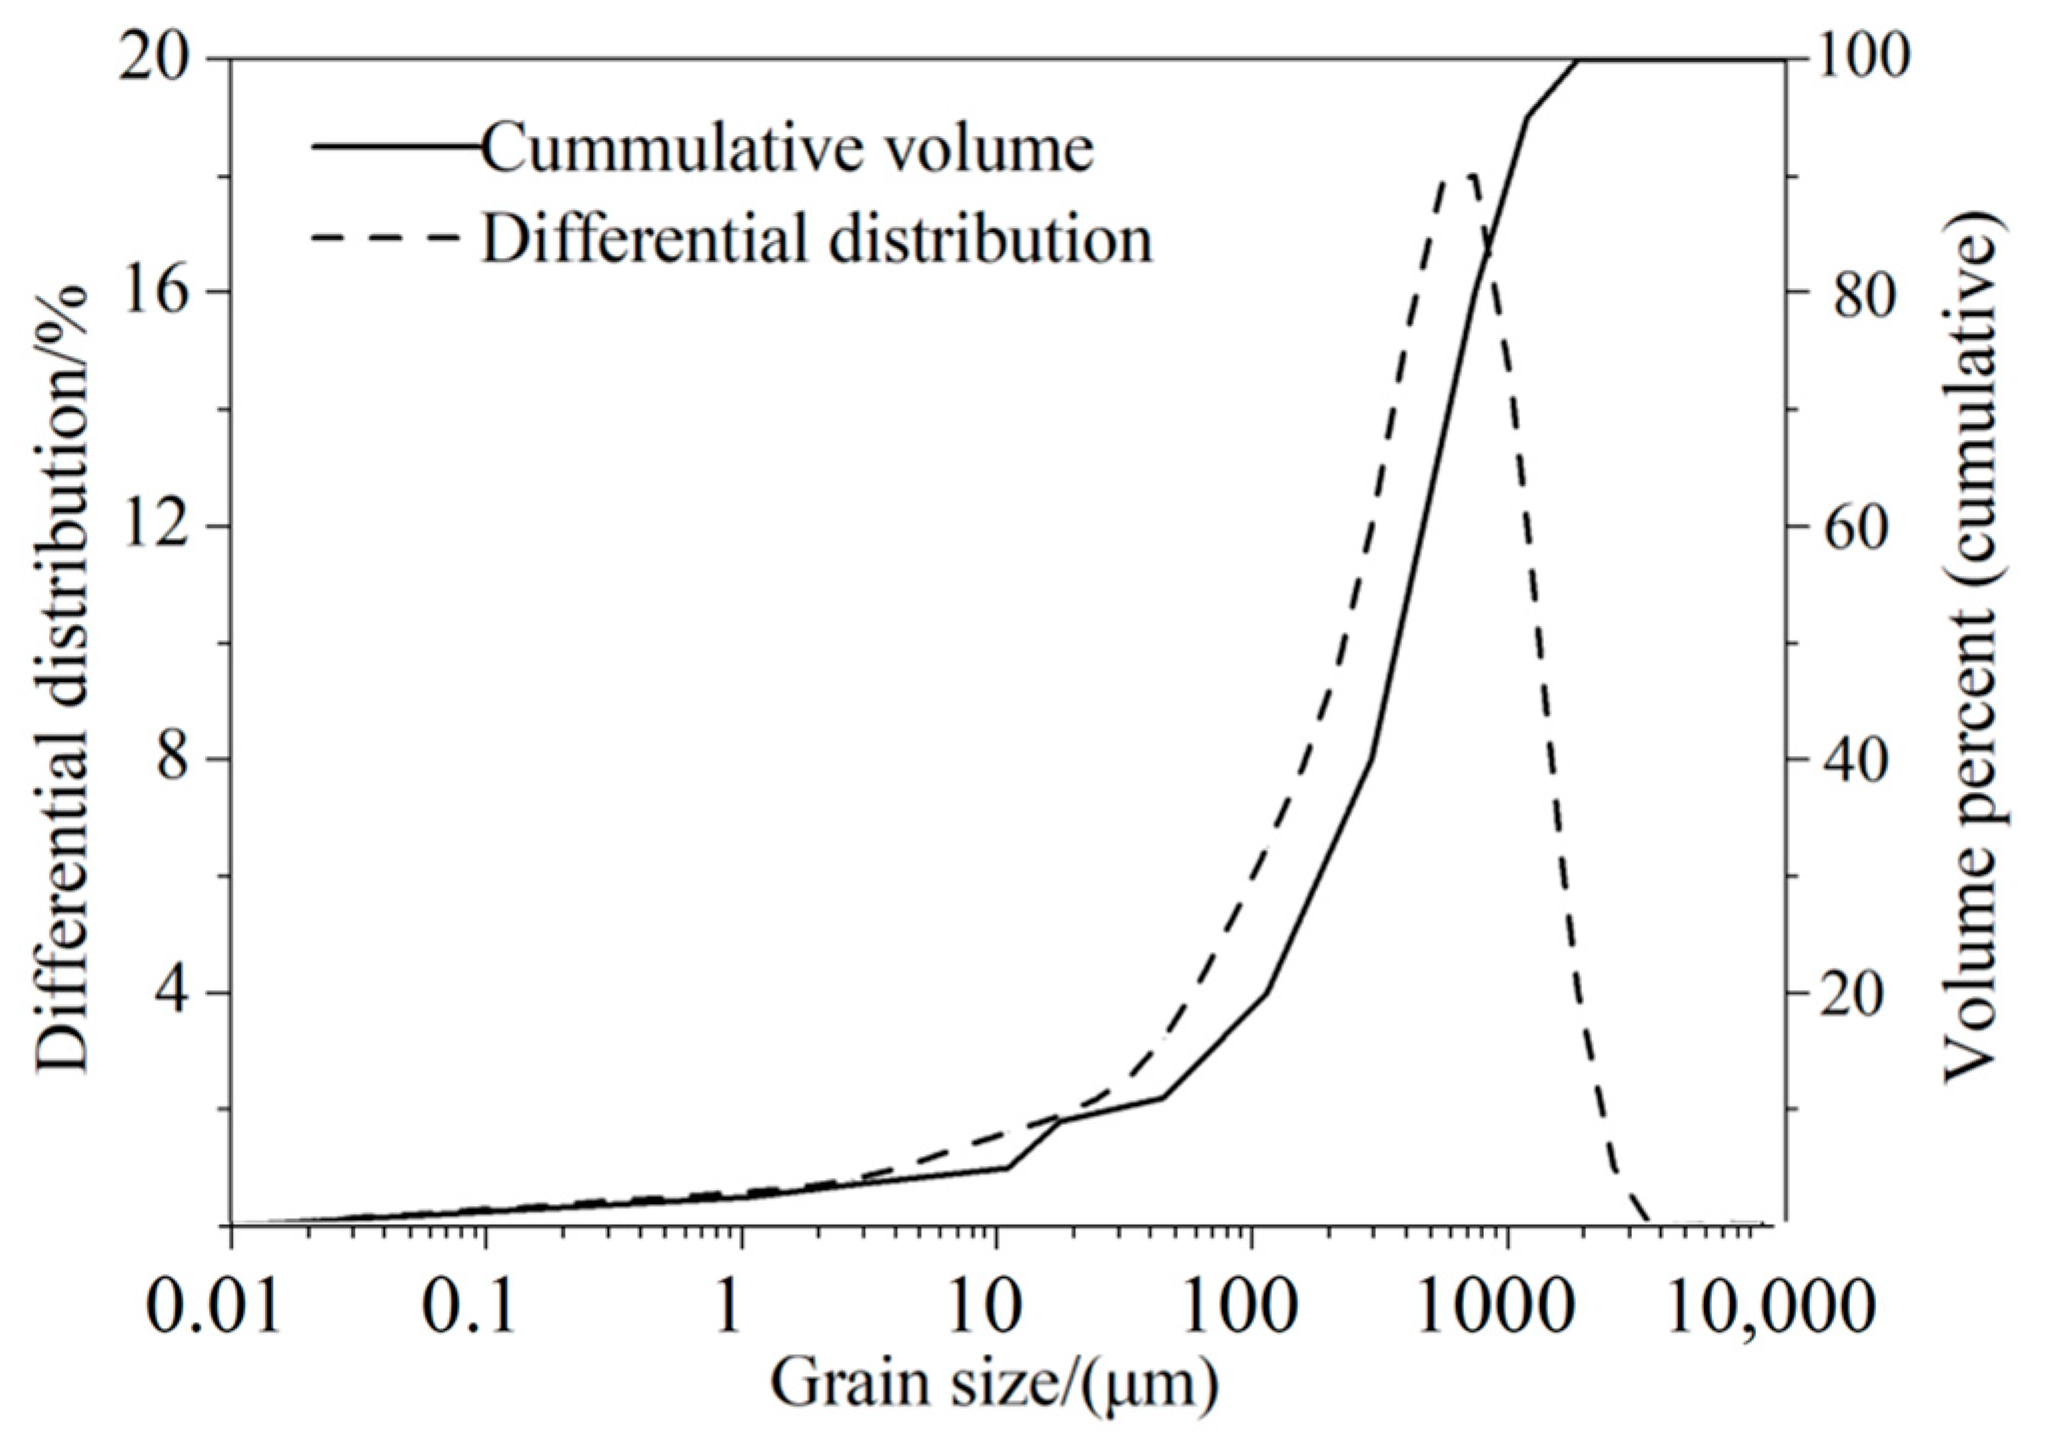
3.3.3. Microstructure Tests

In order to study the evolution of the pore structure and porosity, as well as the effect of microstructure on the UPV of CTB, mercury instruction porosimetry (MIP) tests using a Micromeritics Auto-Pore 9420 and scanning electron microscopy (SEM) using the Hitachi S4800 FEG-SEM were performed on the CTB. The CTB samples are cut into a dimension 0.8 mm × 0.8 mm × 0.8 mm in order to conduct the MIP and SEM tests. Then, the prepared samples were placed into an oven at 45 °C for 4 days to dry.

4. Results and Discussions

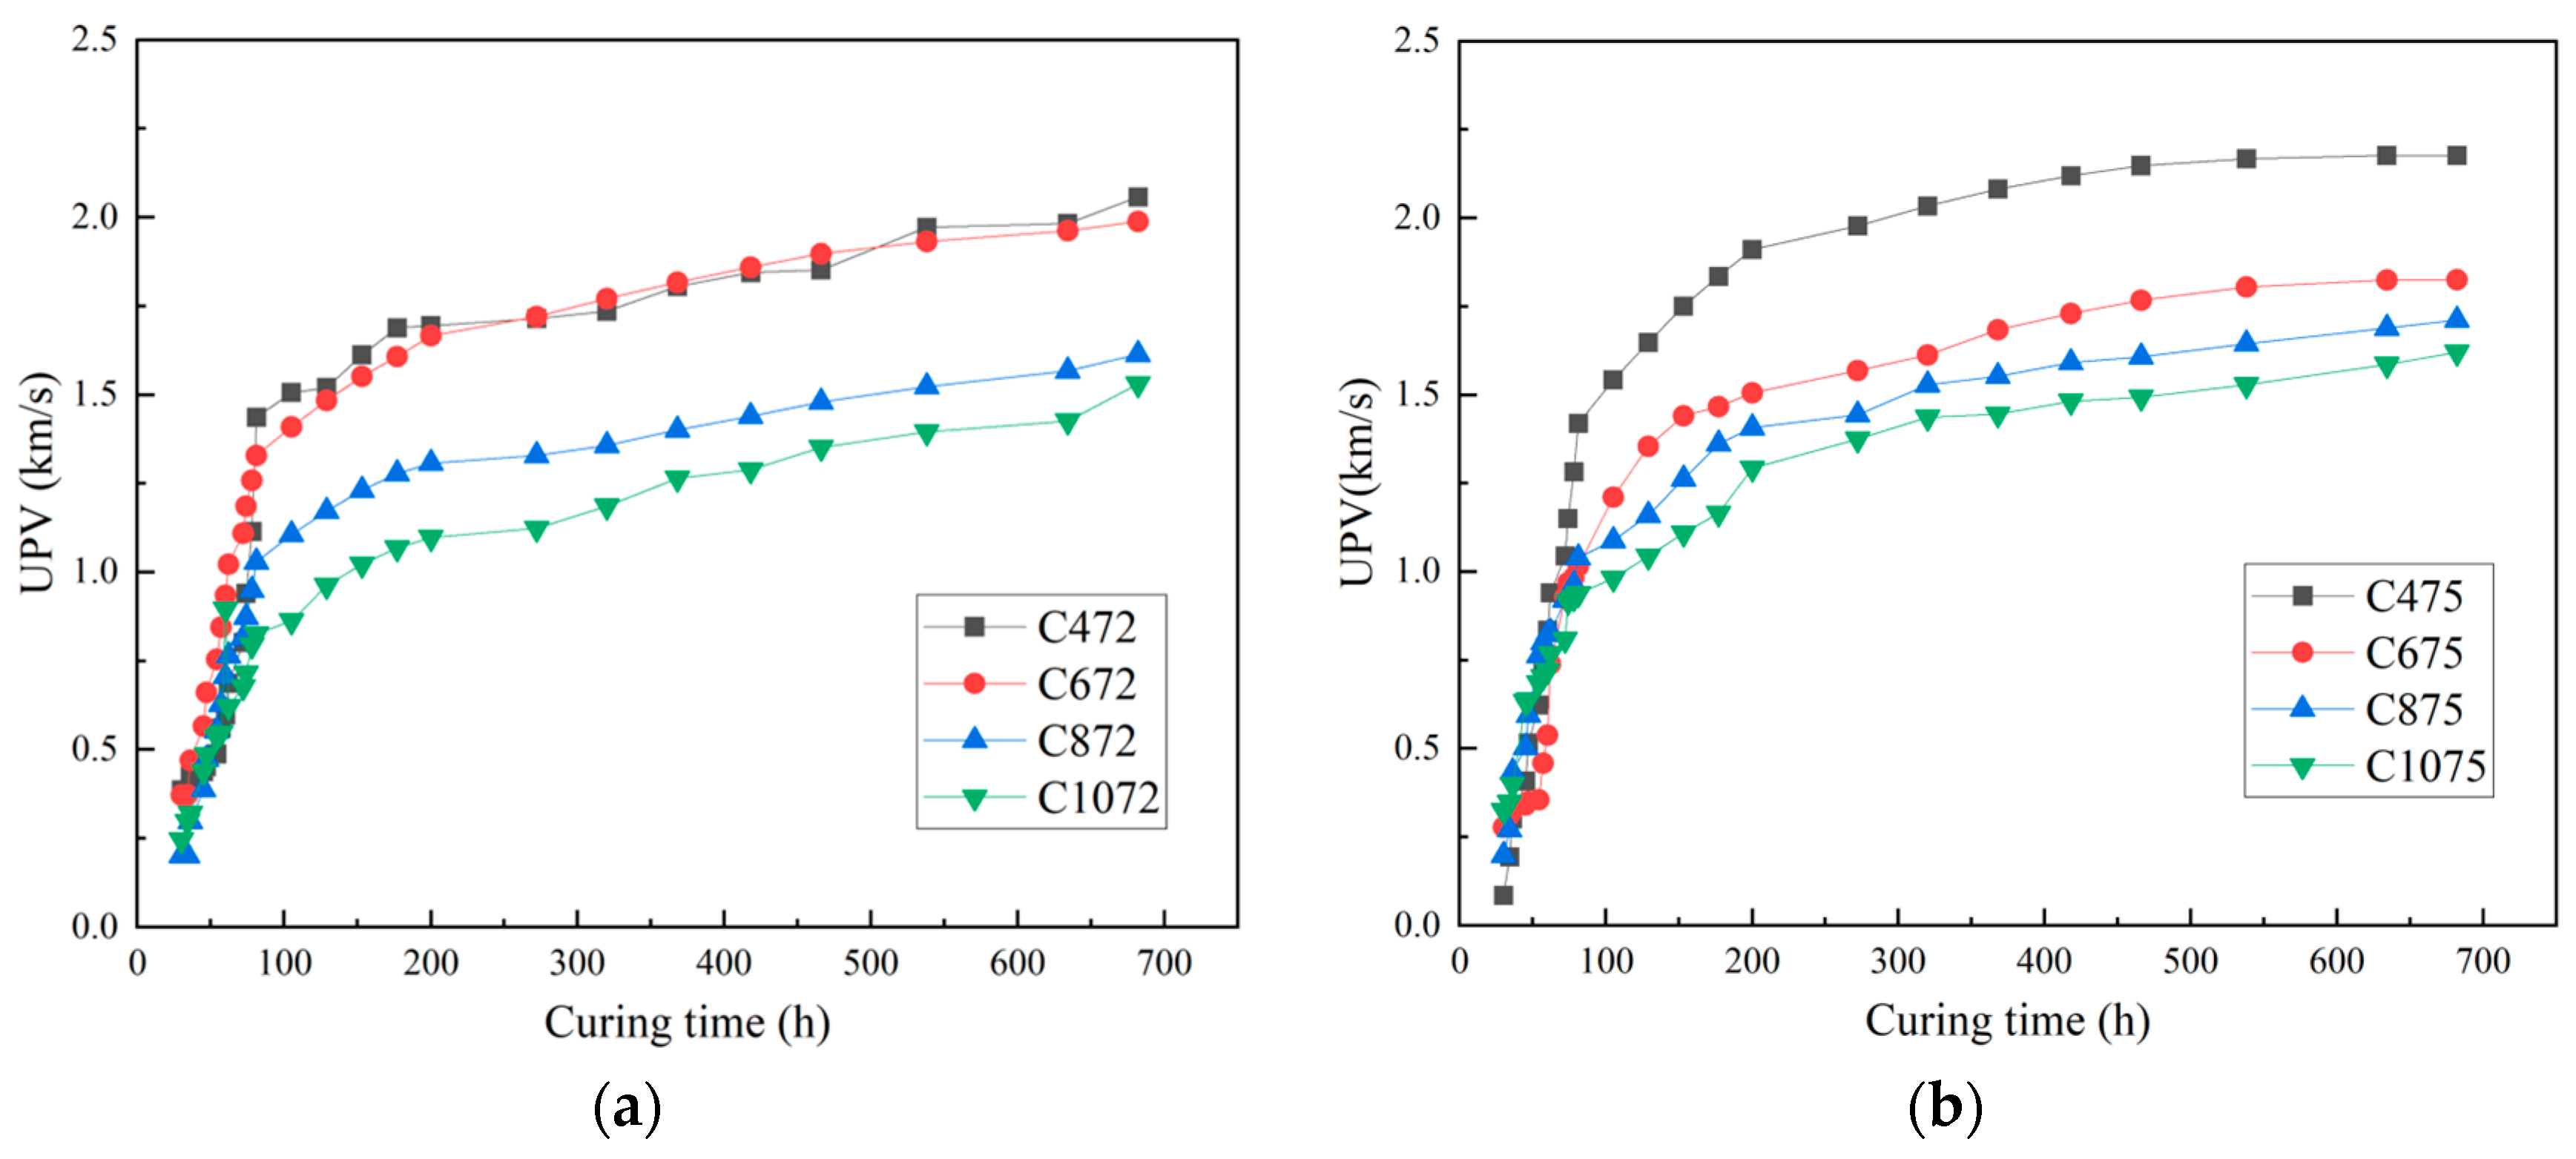
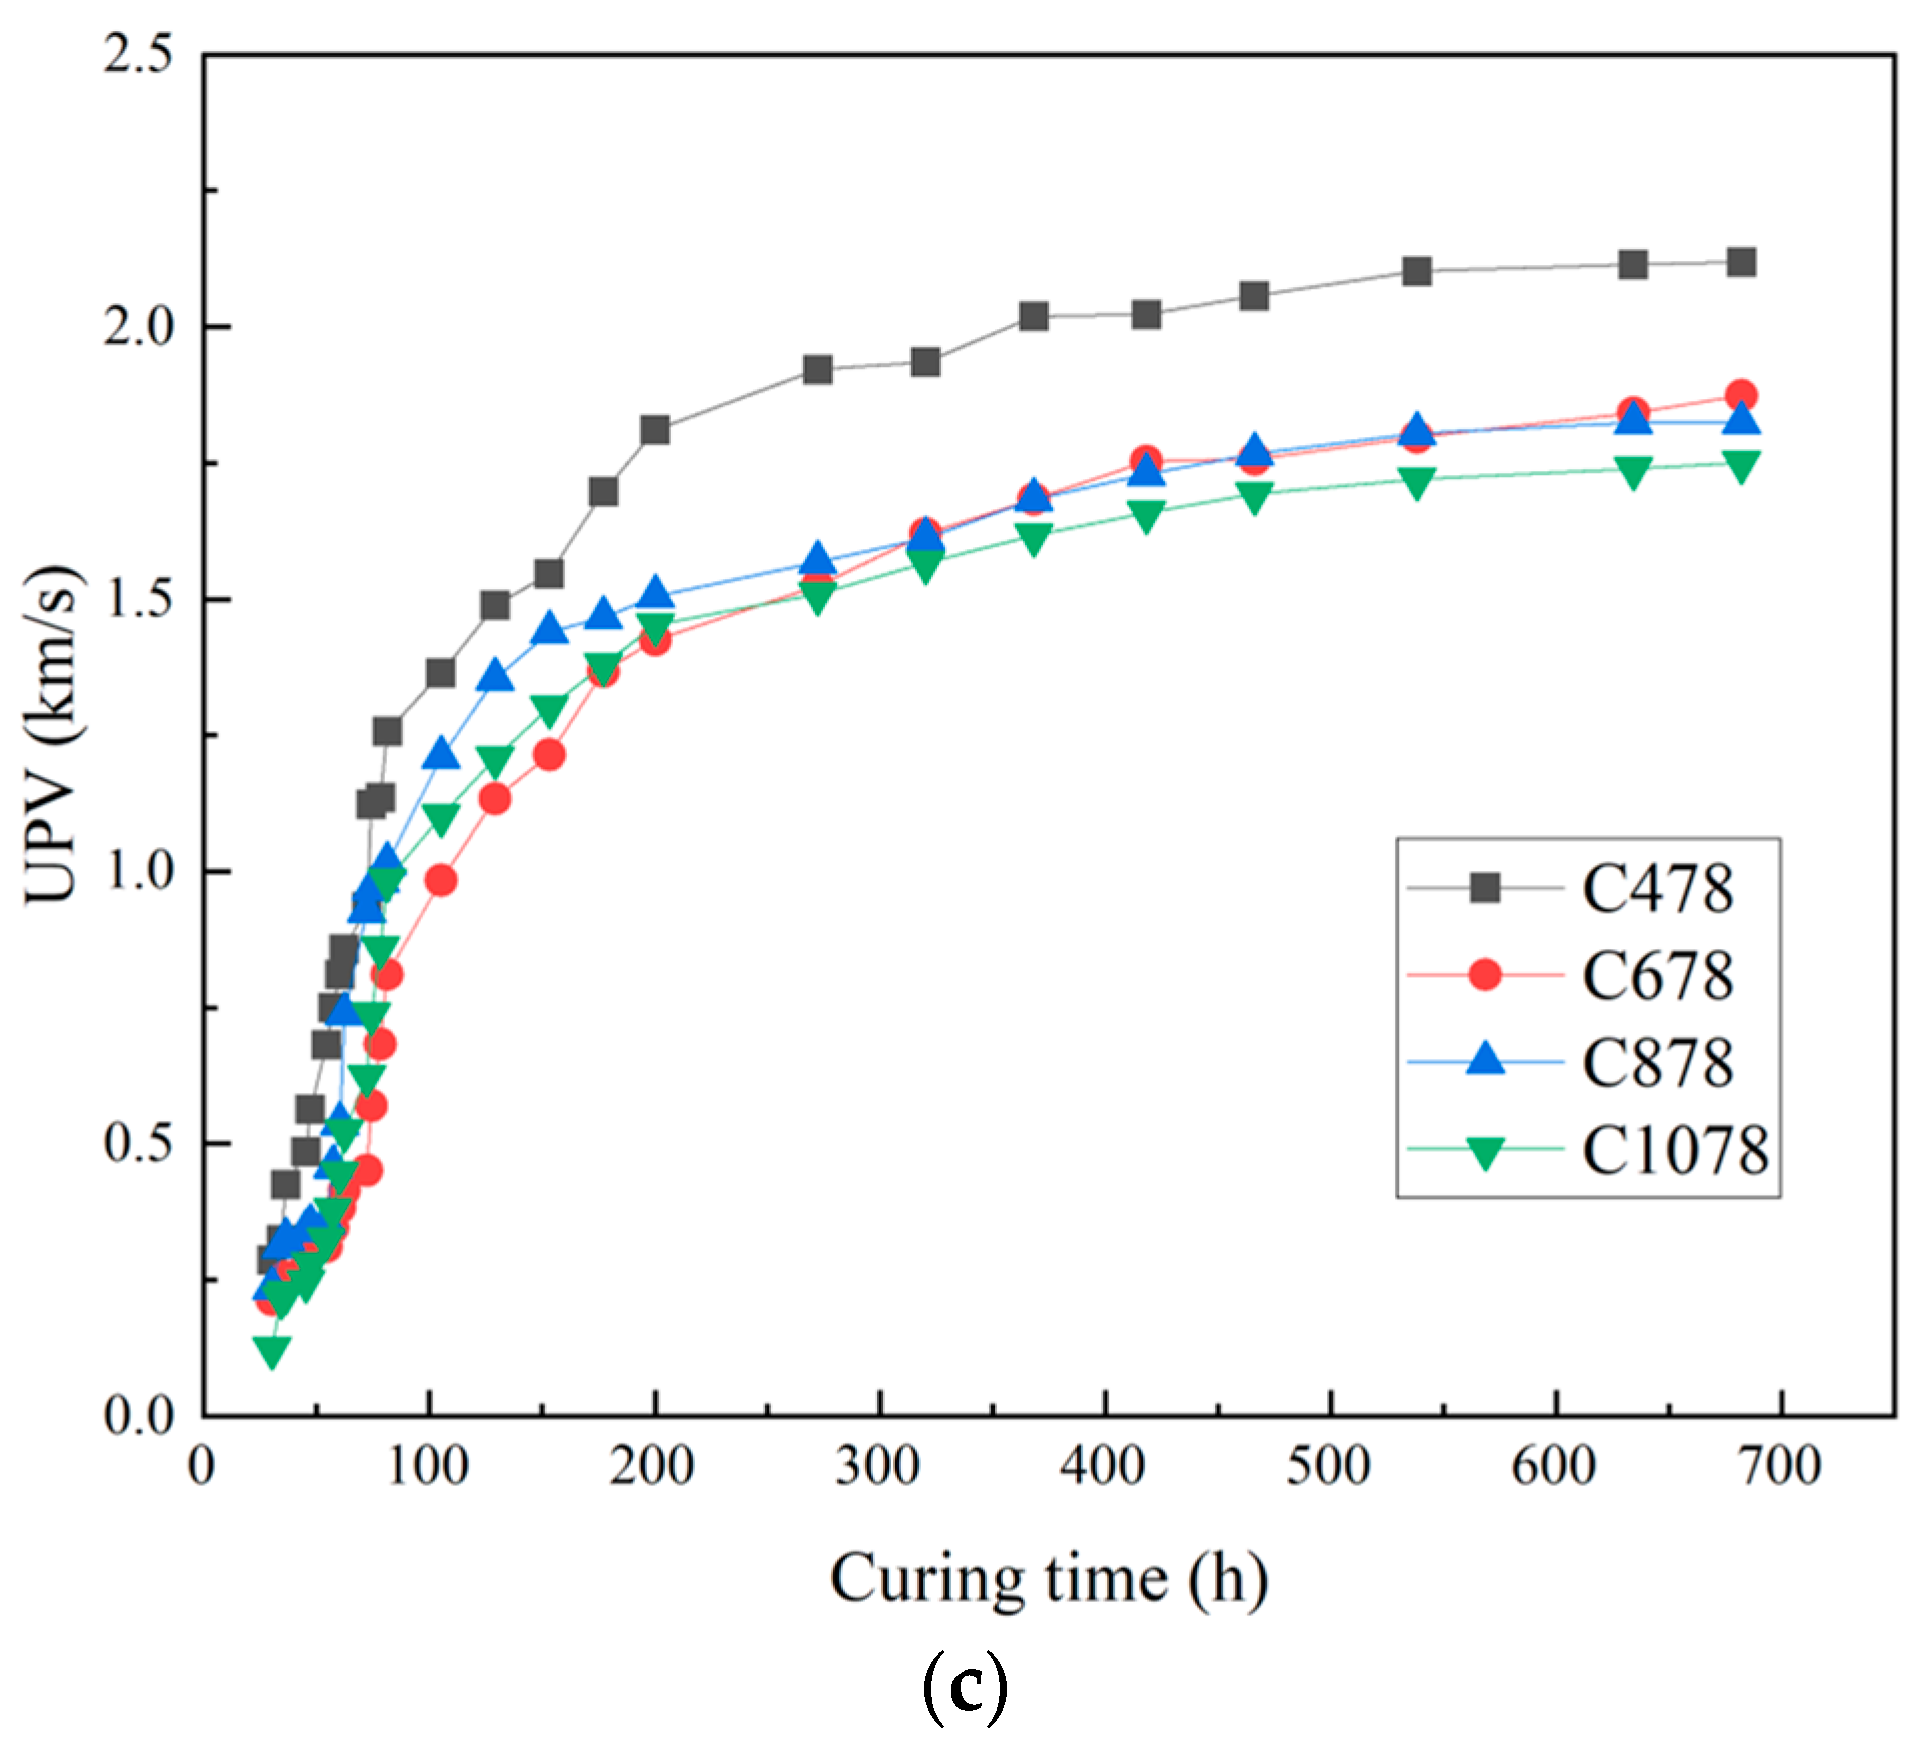
4.1. UPV Development of CTB during the 28-Day Curing Age

Figure 4 shows the UPV developments of different types of CTB during the curing age of 28 days. It can be seen that the UPV of CTB samples, regardless of b/w ratio and solid content, follows a similar trend with curing time. CTB samples had relatively low UPVs at early ages. However, with the increase in curing time, after about 72 h (about 3 days) of hydration, a rapid UPV increase and increment rate were observed. This is attributed to the high hydration intensity and strength gains within 72 h. As the curing time elapsed, hydration products were generated continuously [30]. These hydration products bonded and filled the pore space between particles of the tailing, resulting in an increase in the strength and UPV of CTB [11,31,32,33]. This phenomenon can be proved by the SEM results. After about 168 h (about 7 days), the hydration reaction was nearly completed and these products no longer increased; the UPV of CTB samples gradually came into the stabilized period. However, the UPV still increased at a tiny speed due to the evaporation of free water, as well as a decrease in porosity. This can be explained by the UPV in the solid phase being higher than those in water and air [12].
The influence of the w/b ratio on the UPV of CTB was investigated with a b/w ratio of 1:4, 1:6, 1:8, and 1:10, as shown in Figure 4 a–c. It can be seen that with the same solid content, the UPV increases with the increased w/b ratio. The higher b/w ratio has a longer setting time than that of the lower b/w, causing a rise in the amount of solid phase in the hydration products [22]. It is well known that the UPV in the solid phase is much greater than that in the liquid phase or air phase. Take CTB samples with a solid content of 75% for example. The UPV of the CTB sample with a b/w ratio of 1:4 at the curing age of 28 d is 2.17 km/s, while the CTB sample with a b/w ratio of 1:6 at the curing age of 28d is 1.826 km/s, the CTB sample with a b/w ratio of 1:8 at the curing age of 28 d is 1.712 km/s, the CTB sample with a b/w ratio of 1:10 at the curing age of 28 d is 1.621 km/s. It can be found that the UPV of CTB with a b/w ratio of 1:4 was almost 25% higher than that of CTB with a b/w ratio of 1:10. This can be explained by the higher solid phase and lower porosity of the CTB with a higher b/w ratio [12]. Meanwhile, with the increase in the b/w ratio mixed in the CTB samples, more hydration products will be generated and fill the pores between the particles of the tailings, which afterward increase the UPV through CTB. The results of MIP tests of CTB samples performed at 7-day curing age are used to investigate the pore structure of CTB, as shown in Figure 5. The CTB samples prepared with a higher b/w ratio, regardless of solid content, have a lower cumulative pore volume (Figure 5a) and more compact pore structure (Figure 5b) than those prepared with a lower b/w ratio. A previous study showed that the pore size distribution and pore structure are significantly influenced by the hydration process [22,34]. The finer pore structure of samples prepared with a higher b/w ratio is attributed to the precipitation of more hydration products in the capillary of the CTB due to the higher content of the binder [35]. The samples with a finer pore structure and lower total porosity are associated with large UPV and higher mechanical strength [36]. Thereby, the CTB prepared with a higher b/w ratio have a larger UPV and strength than those with a lower b/w ratio.
The traditional methods used to measure the elastic modulus of solids were static tensile; compressive and torsional tests. The UPV test is one of the new types of methods to measure elastic properties which has the advantages of being simple; speedy and non-destructive. For most rock and concrete; w l 1.73   w t . So, the dynamic elasticity modulus (DEM) and dynamic shear modulus (DSM) are obtained depending on Equations (8) and (9). Figure 6 and Figure 7 show the Development of DEM and DSM of different types of CTB samples.
As is shown in Figure 6 and Figure 7, a wide range of b/w ratios and the solid content of CTB samples were analyzed. The DEM and DSM have a similar trend to UPV development. DEM and DSM increased rapidly initially. Then in the following curing stage, the increasing trend continued but the growth rate of the DEM and DSM became slow. When the curing time comes to 400 h, the DEM and DSM values gradually became stable. It also can be seen that the b/w ratio and solid content have a significant effect on the development of the DEM and DSM values. A higher b/w ratio results in a more rapid hydration process and leads to a higher value of DEM and DSM. Furthermore, it can be seen that with the same b/w ratio but different solid content, the DEM and DSM rise with the increase in solid content. This can be explained by the higher b/w ratio and solid content resulting in a large number of hydration products, such as CH and C-S-H, which are considered to be the main component that forms the mechanical strength of CTB [22,37].

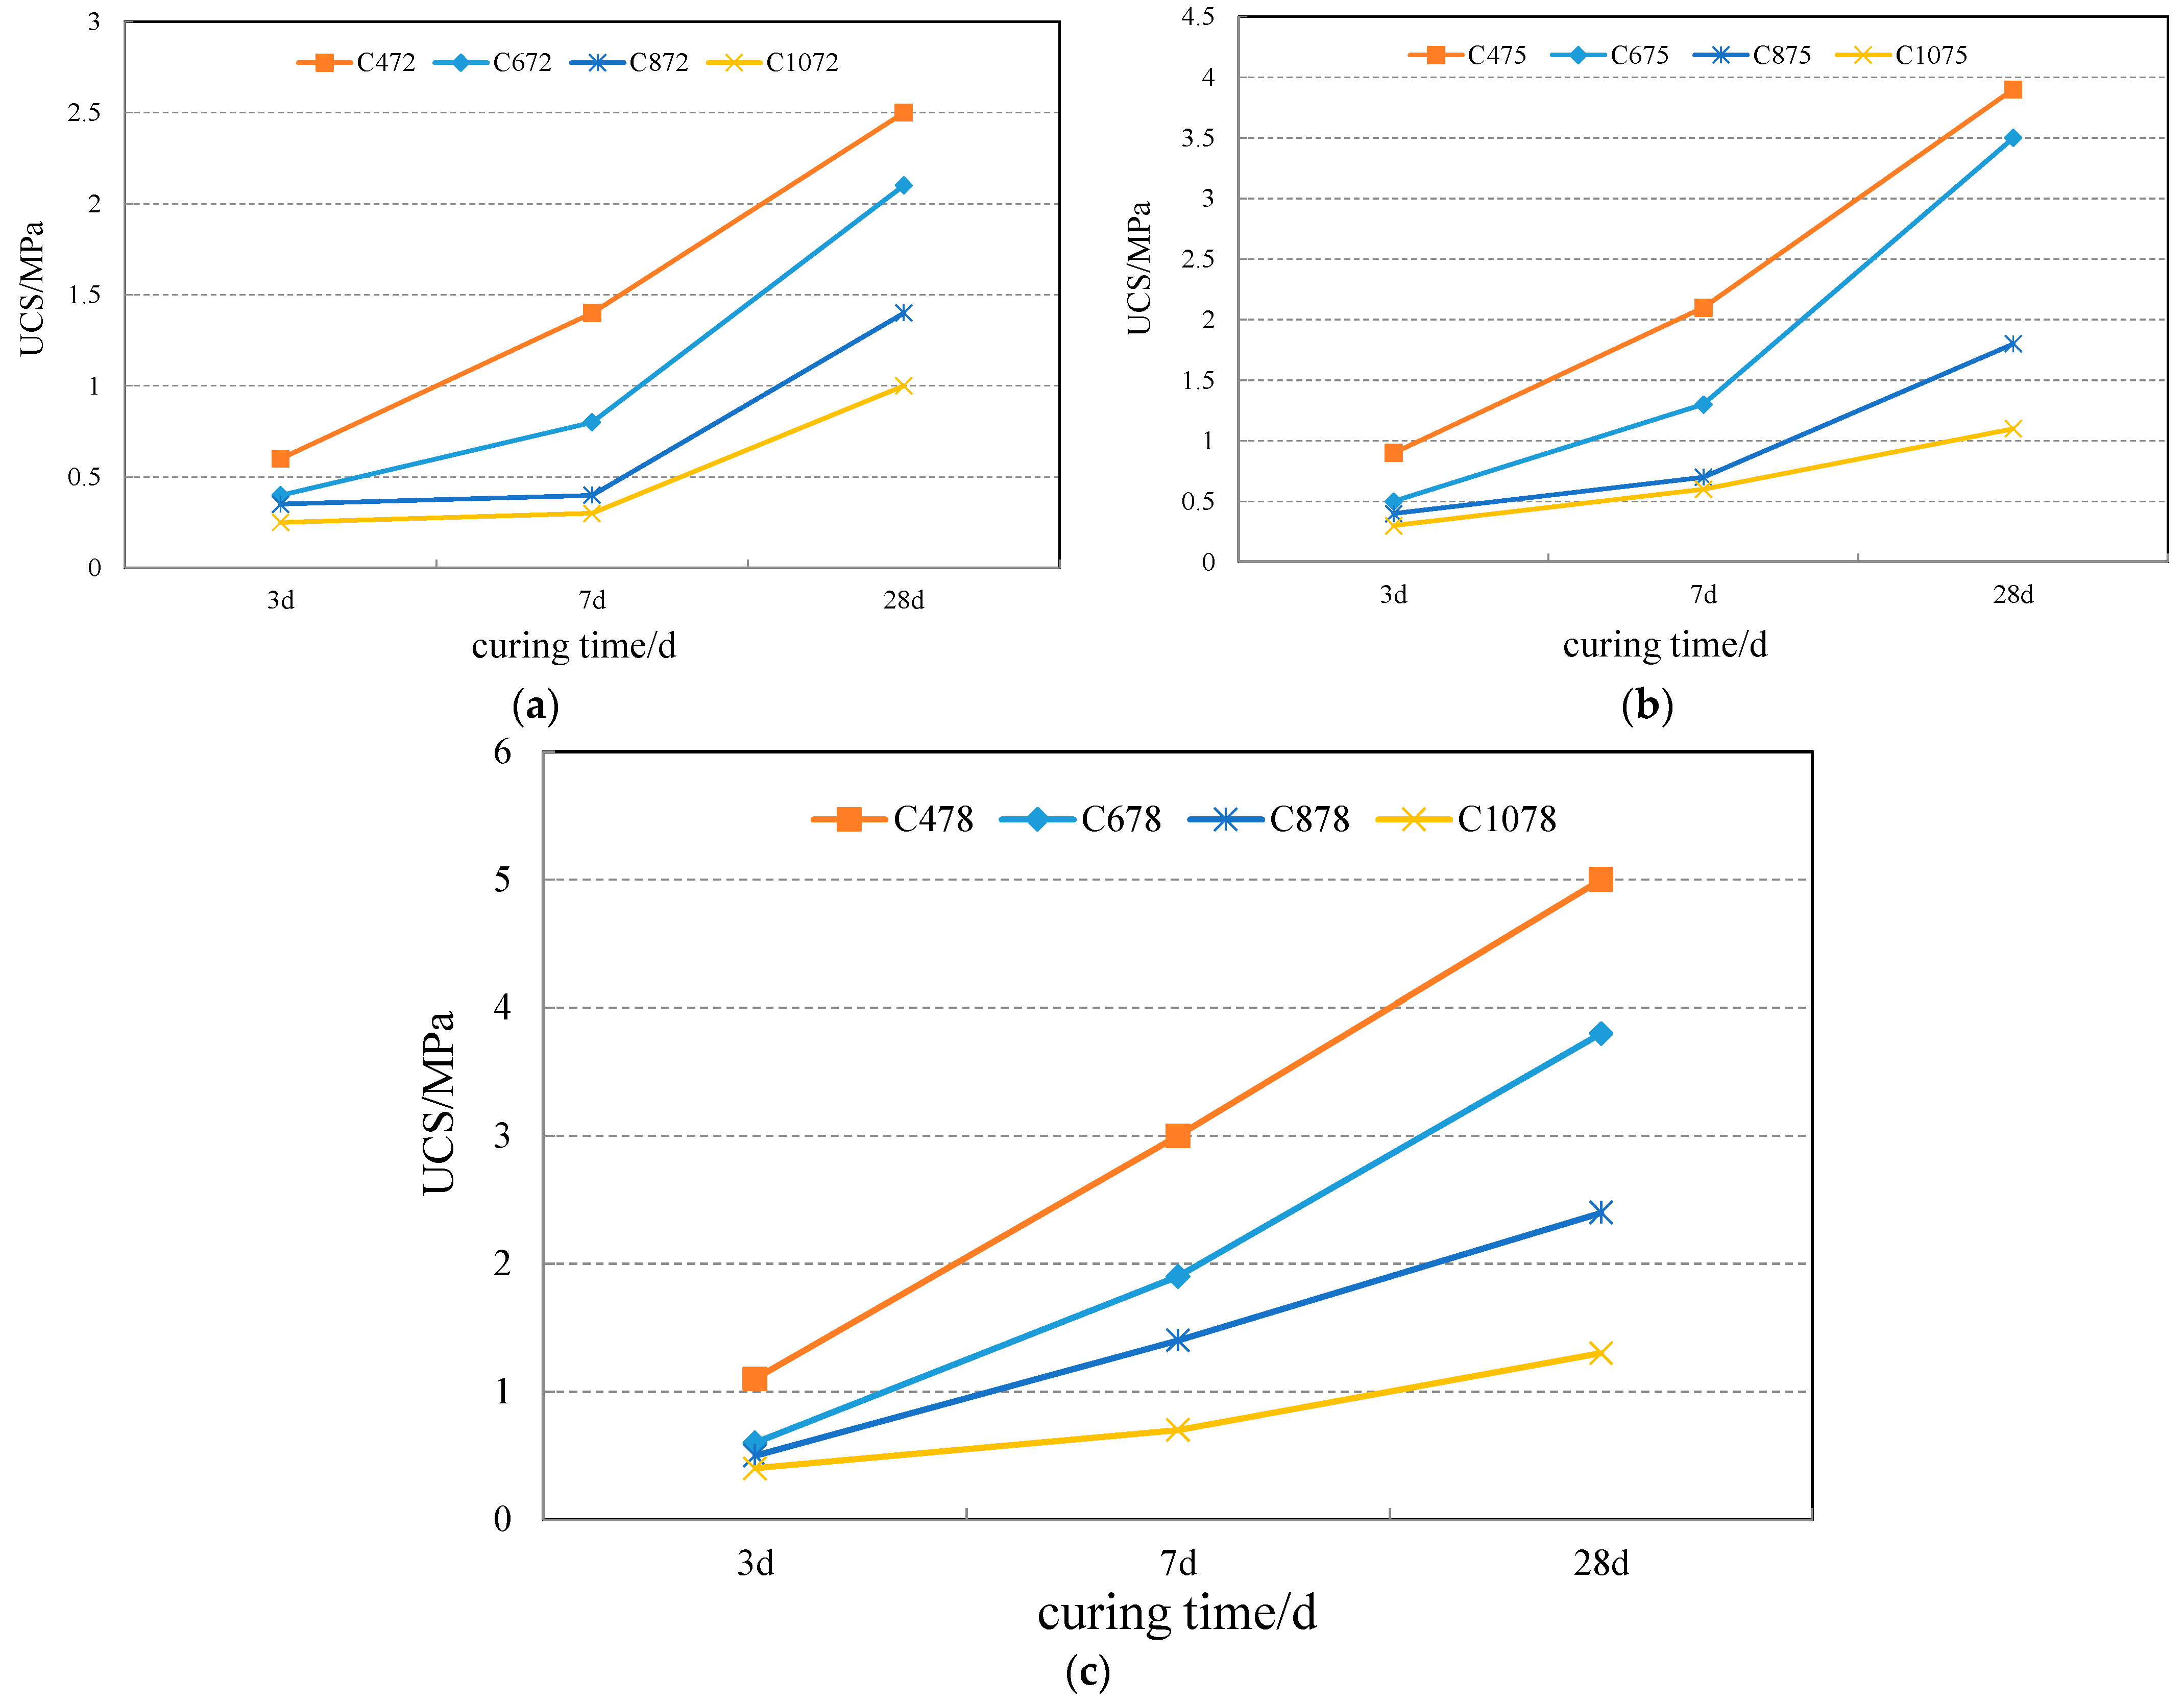
4.2. UCS Development of CTB during 28-Day Curing Age

Figure 8 shows the UCS of the CTB with different solid contents and b/w ratios at the curing times of 3, 7, and 28 days. It can be observed that the UCS of CTB samples increased with increasing curing time regardless of the solid content and b/w ratios. Figure 8a–c show the UCS development of CTB prepared with different b/w ratios and solid contents within the curing age of 28 days, respectively. It can be observed from Figure 8a that the solid content and b/w ratio have a significant effect on the UCS development of the CTB sample. A higher b/w ratio has a higher silicate (C2S + C3S) content, leading to the formation of more amounts of hydration products, such as calcium silicate hydrate (C-S-H), gypsum, ettringite, and portlandite (CH). The higher amount of hydration products is the major factor increasing the bonding ability of CTB samples [20]. The hydration products fill the void spaces or micropores within the tailing resulting in an increase in strength development and solid stiffness. It is also evident from Figure 8a–c that the CTB samples with a solid content of 72% developed lower UCSs than those of CTB samples with a solid content of 75% and 78 % (as shown in Figure 8b,c) at the same cement dosage and curing time. The higher solid content of CTB induces the formation of hydration products. The reason for this higher strength gain of CTB samples with higher solid content is that a higher solid content provided more reactants of hydration, which favors the binder hydration process. Therefore, the number of hydration products (e.g., CH and C-S-H) increases with the rise of solid content [34].
Table 5 lists the UCS gain rate of CTB samples during 28 d curing age. From the table, it can be seen that the strength gain rate of CTB reaches to peak value at the initial 3 days (0.37 MPa/d for C478). This is attributed to the hydration products generated during the 0~3 day. The strength gain rate of CTB is decreased in the following curing time. The strength gain rate decrease is due to the dilution of the concentration of soluble ions (such as Ca2+, K+, Na+, OH, SiO42+), which is attributed to the reduction in the generation of hydration products [38].

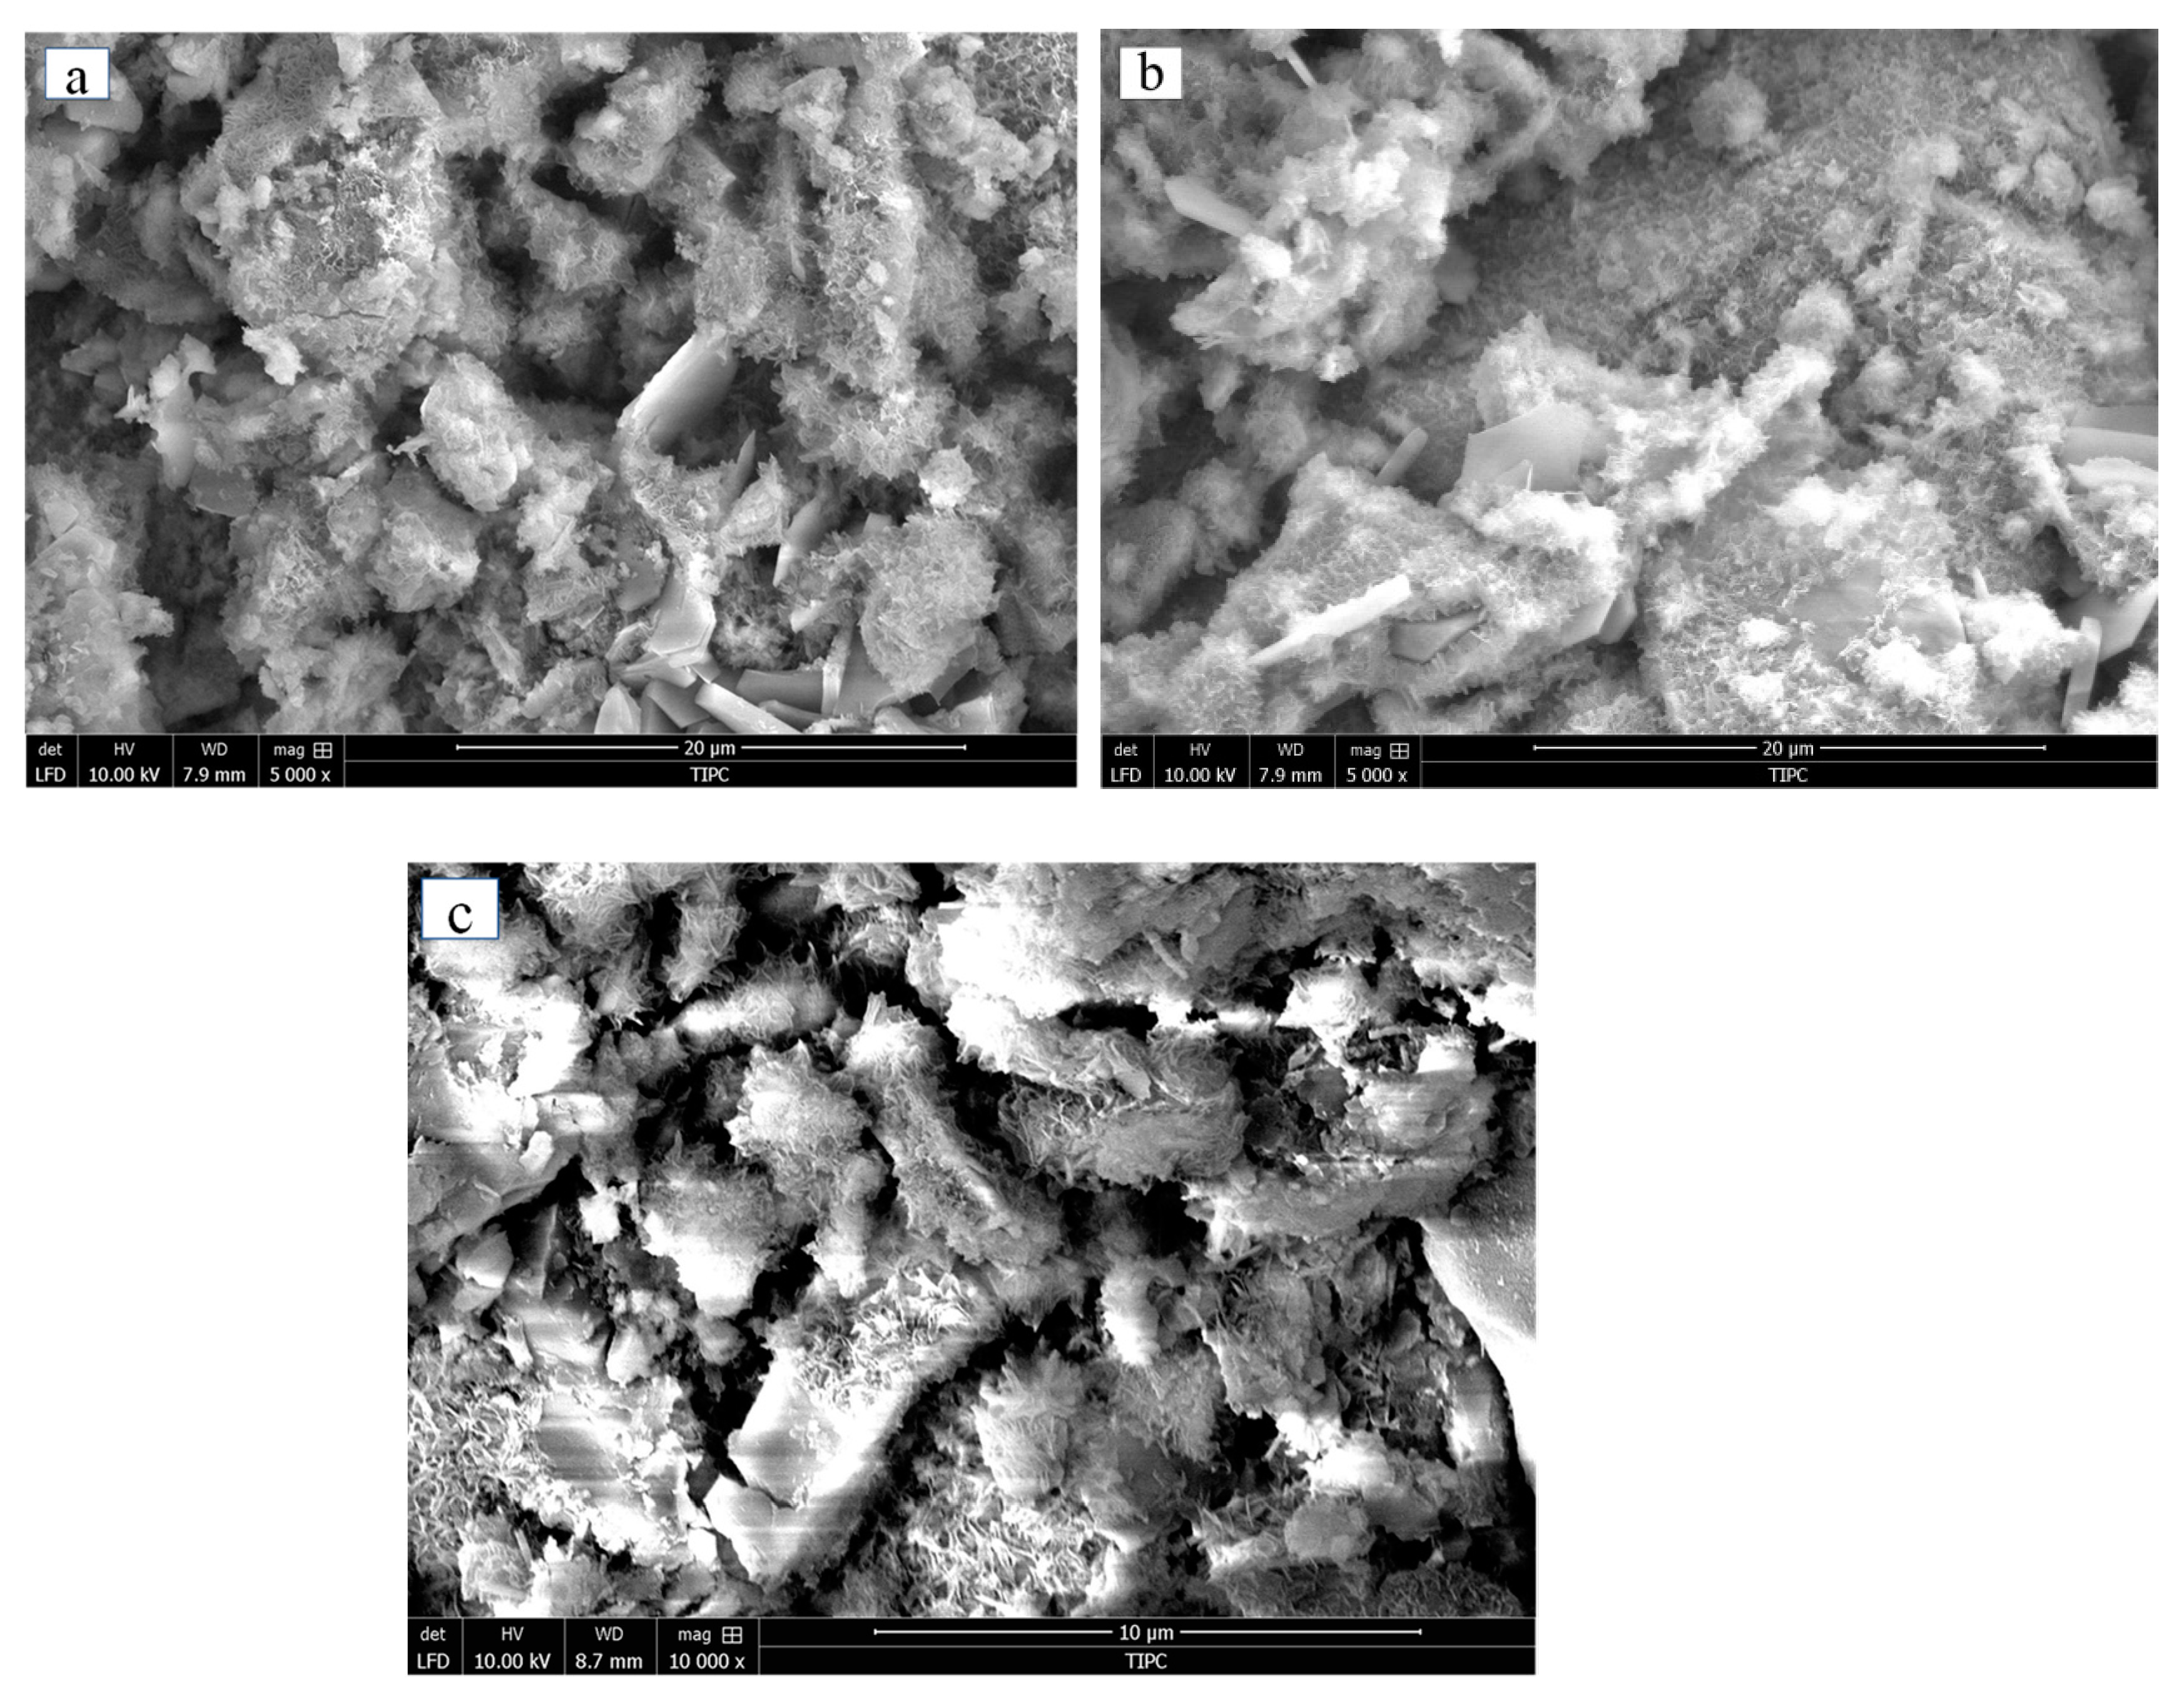
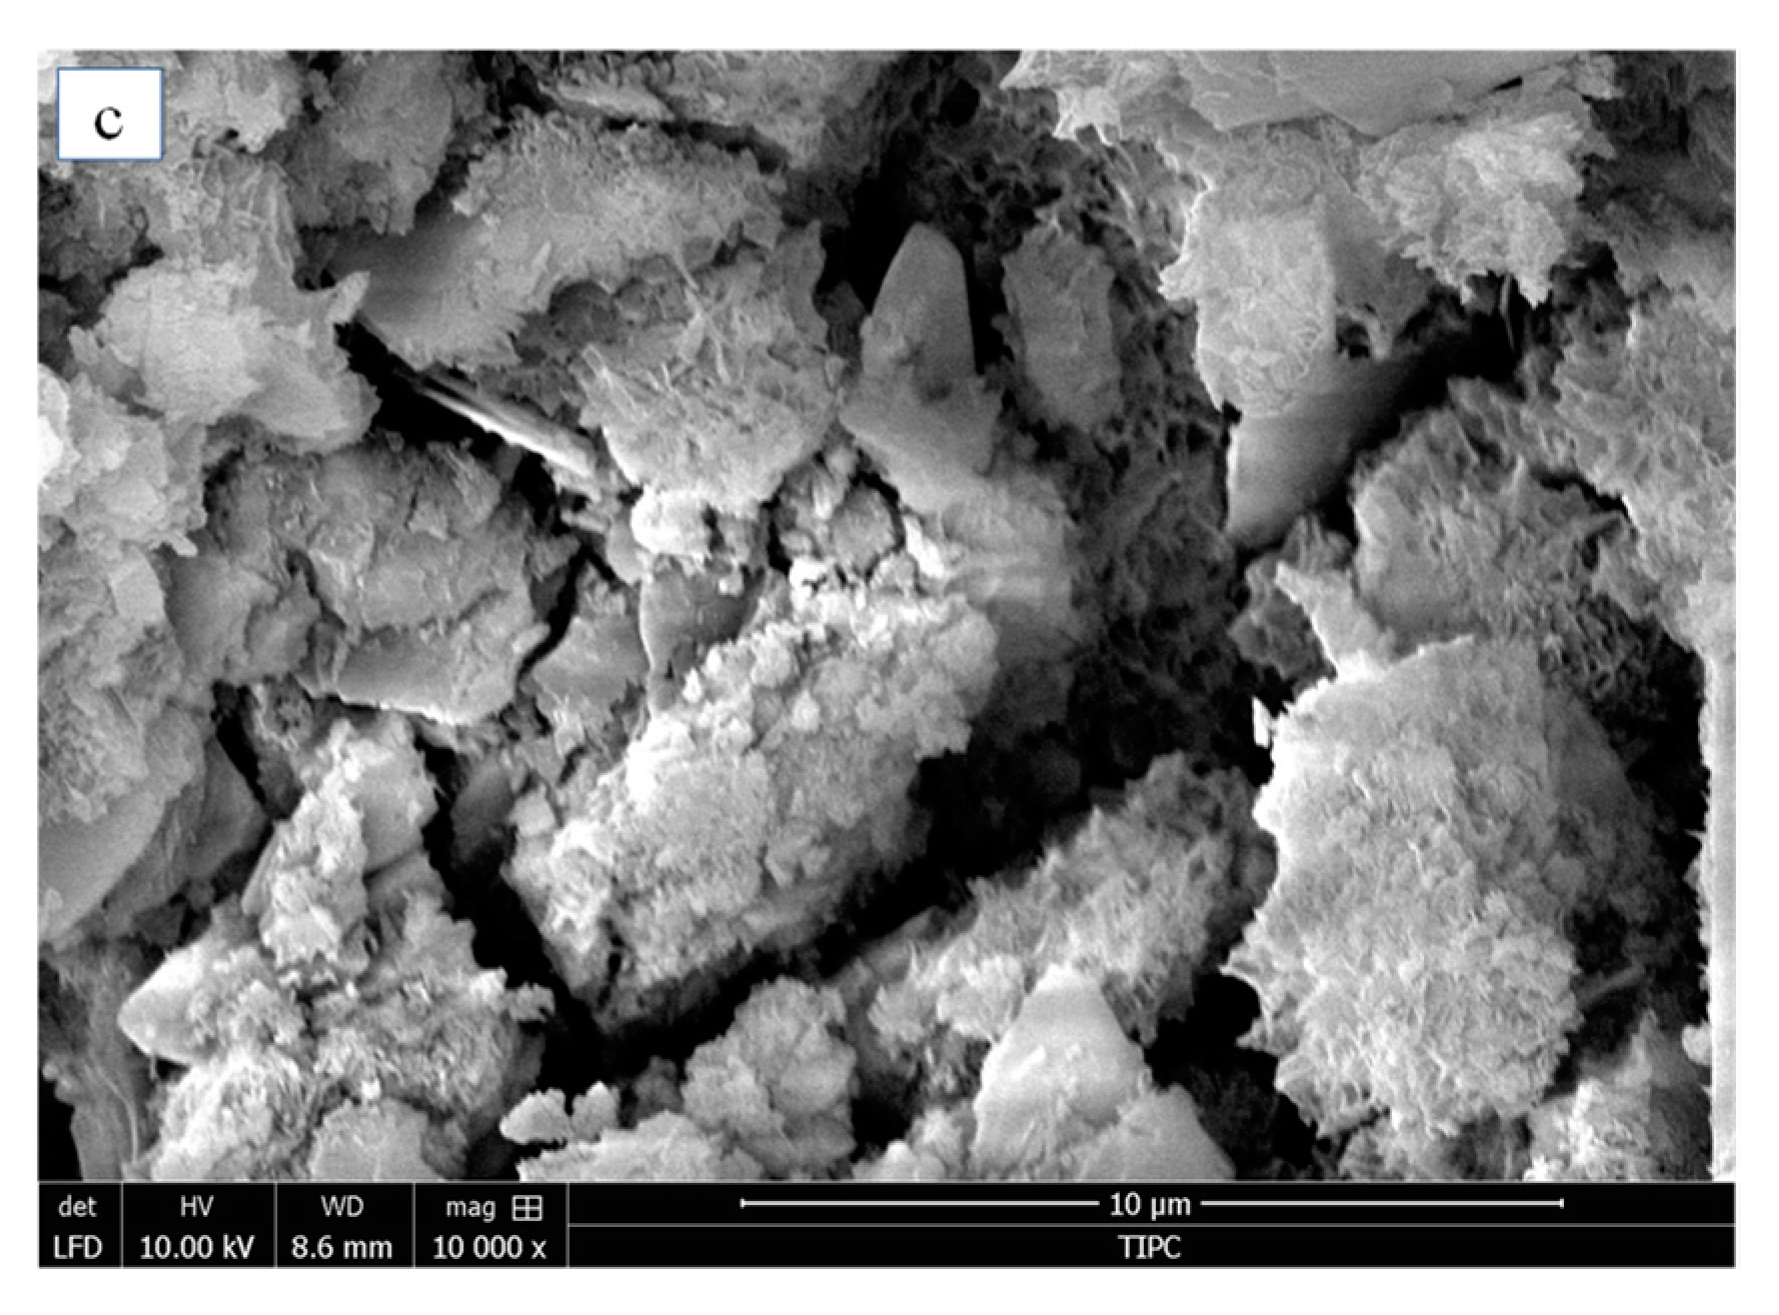
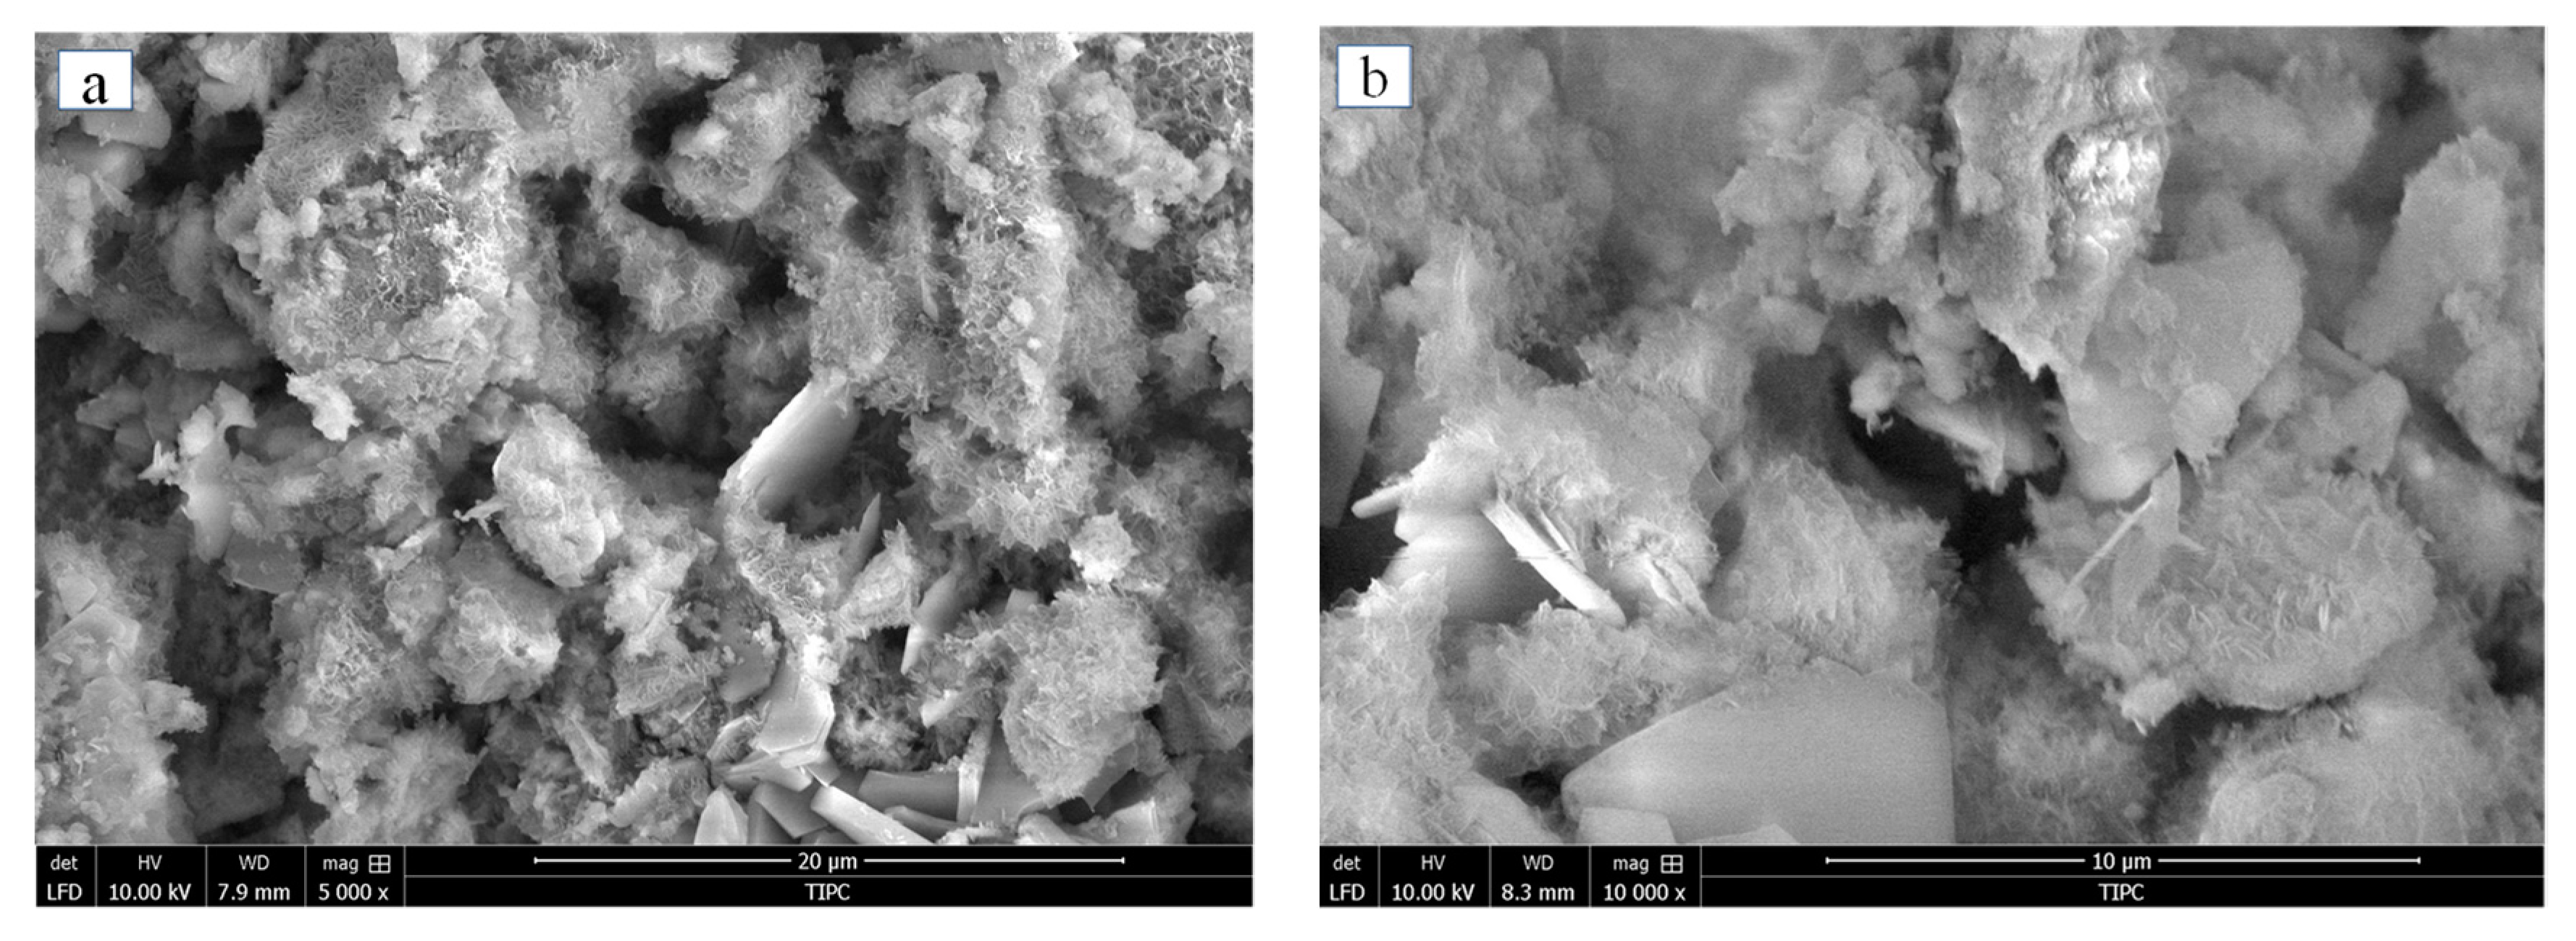
4.3. The Microstructure Evolution of CTB Samples

The Scanning Electron Microscope (SEM) analysis was performed on the CTB to investigate the microstructure evolution of CTB. Figure 9a–c illustrate the SEM of C872 at the curing age of 3 d, 7 d, and 28 d. It can be seen from these figures that the microstructure of the CTB is initially flocculent. The tailings are arranged in massive and uniform, and water evenly and finely; the hydration products are connected in filaments, as shown in Figure 9. Along with the influence of ongoing curing age, the floc structure of CTB is induced, which leads to the density of the microstructure of CTB being increased. Hence, the hydration products form a honeycomb structure that intersects with each other. Therefore, the air phase and liquid phase decreased, which contributes to the UPV of CTB increases. When the curing age is 28 d, the flocculent and honeycomb structure of CTB is instead from the structure of the block as well as the plate, as illustrated in Figure 9c. Meanwhile, the free water in the CTB turned into bound water and the hydration products interconnect for compactness. Thereby, the UPV of CTB has sustainable growth.
Figure 10a–c show the SEM of the CTB with b/w ratios of 1:4, 1:8, and 1:10 at the 7 day curing age. From these figures, it can be seen that the microstructure of CTB is significantly affected by the b/w ratio. The microstructure of CTB which has a b/w ratio of 1:4 is more extensive compared to the microstructure of CTB prepared with a b/w ratio of 1:8 and 1:10 (Figure 10b,c). Thereby, the UPV value increased due to the increase in the b/w ratio.
Figure 11a–c illustrated the SEM of CTB prepared at 72 %, 75%, and 78% solid content at the 7-day curing age. It can be seen from these figures, the microstructure of CTB samples prepared at 72% solid content has more pore structure. Meanwhile, the hydration products between the particles of CTB samples with a 72% solid content exist in the form of flocculent which is much looser than those of CTB samples with 75% (Figure 11b) and 78% (Figure 11c) solid content. Therefore, it can be concluded that a large solid content is attributed to a stable structure in CTB, by which the UPV in CTB increased.

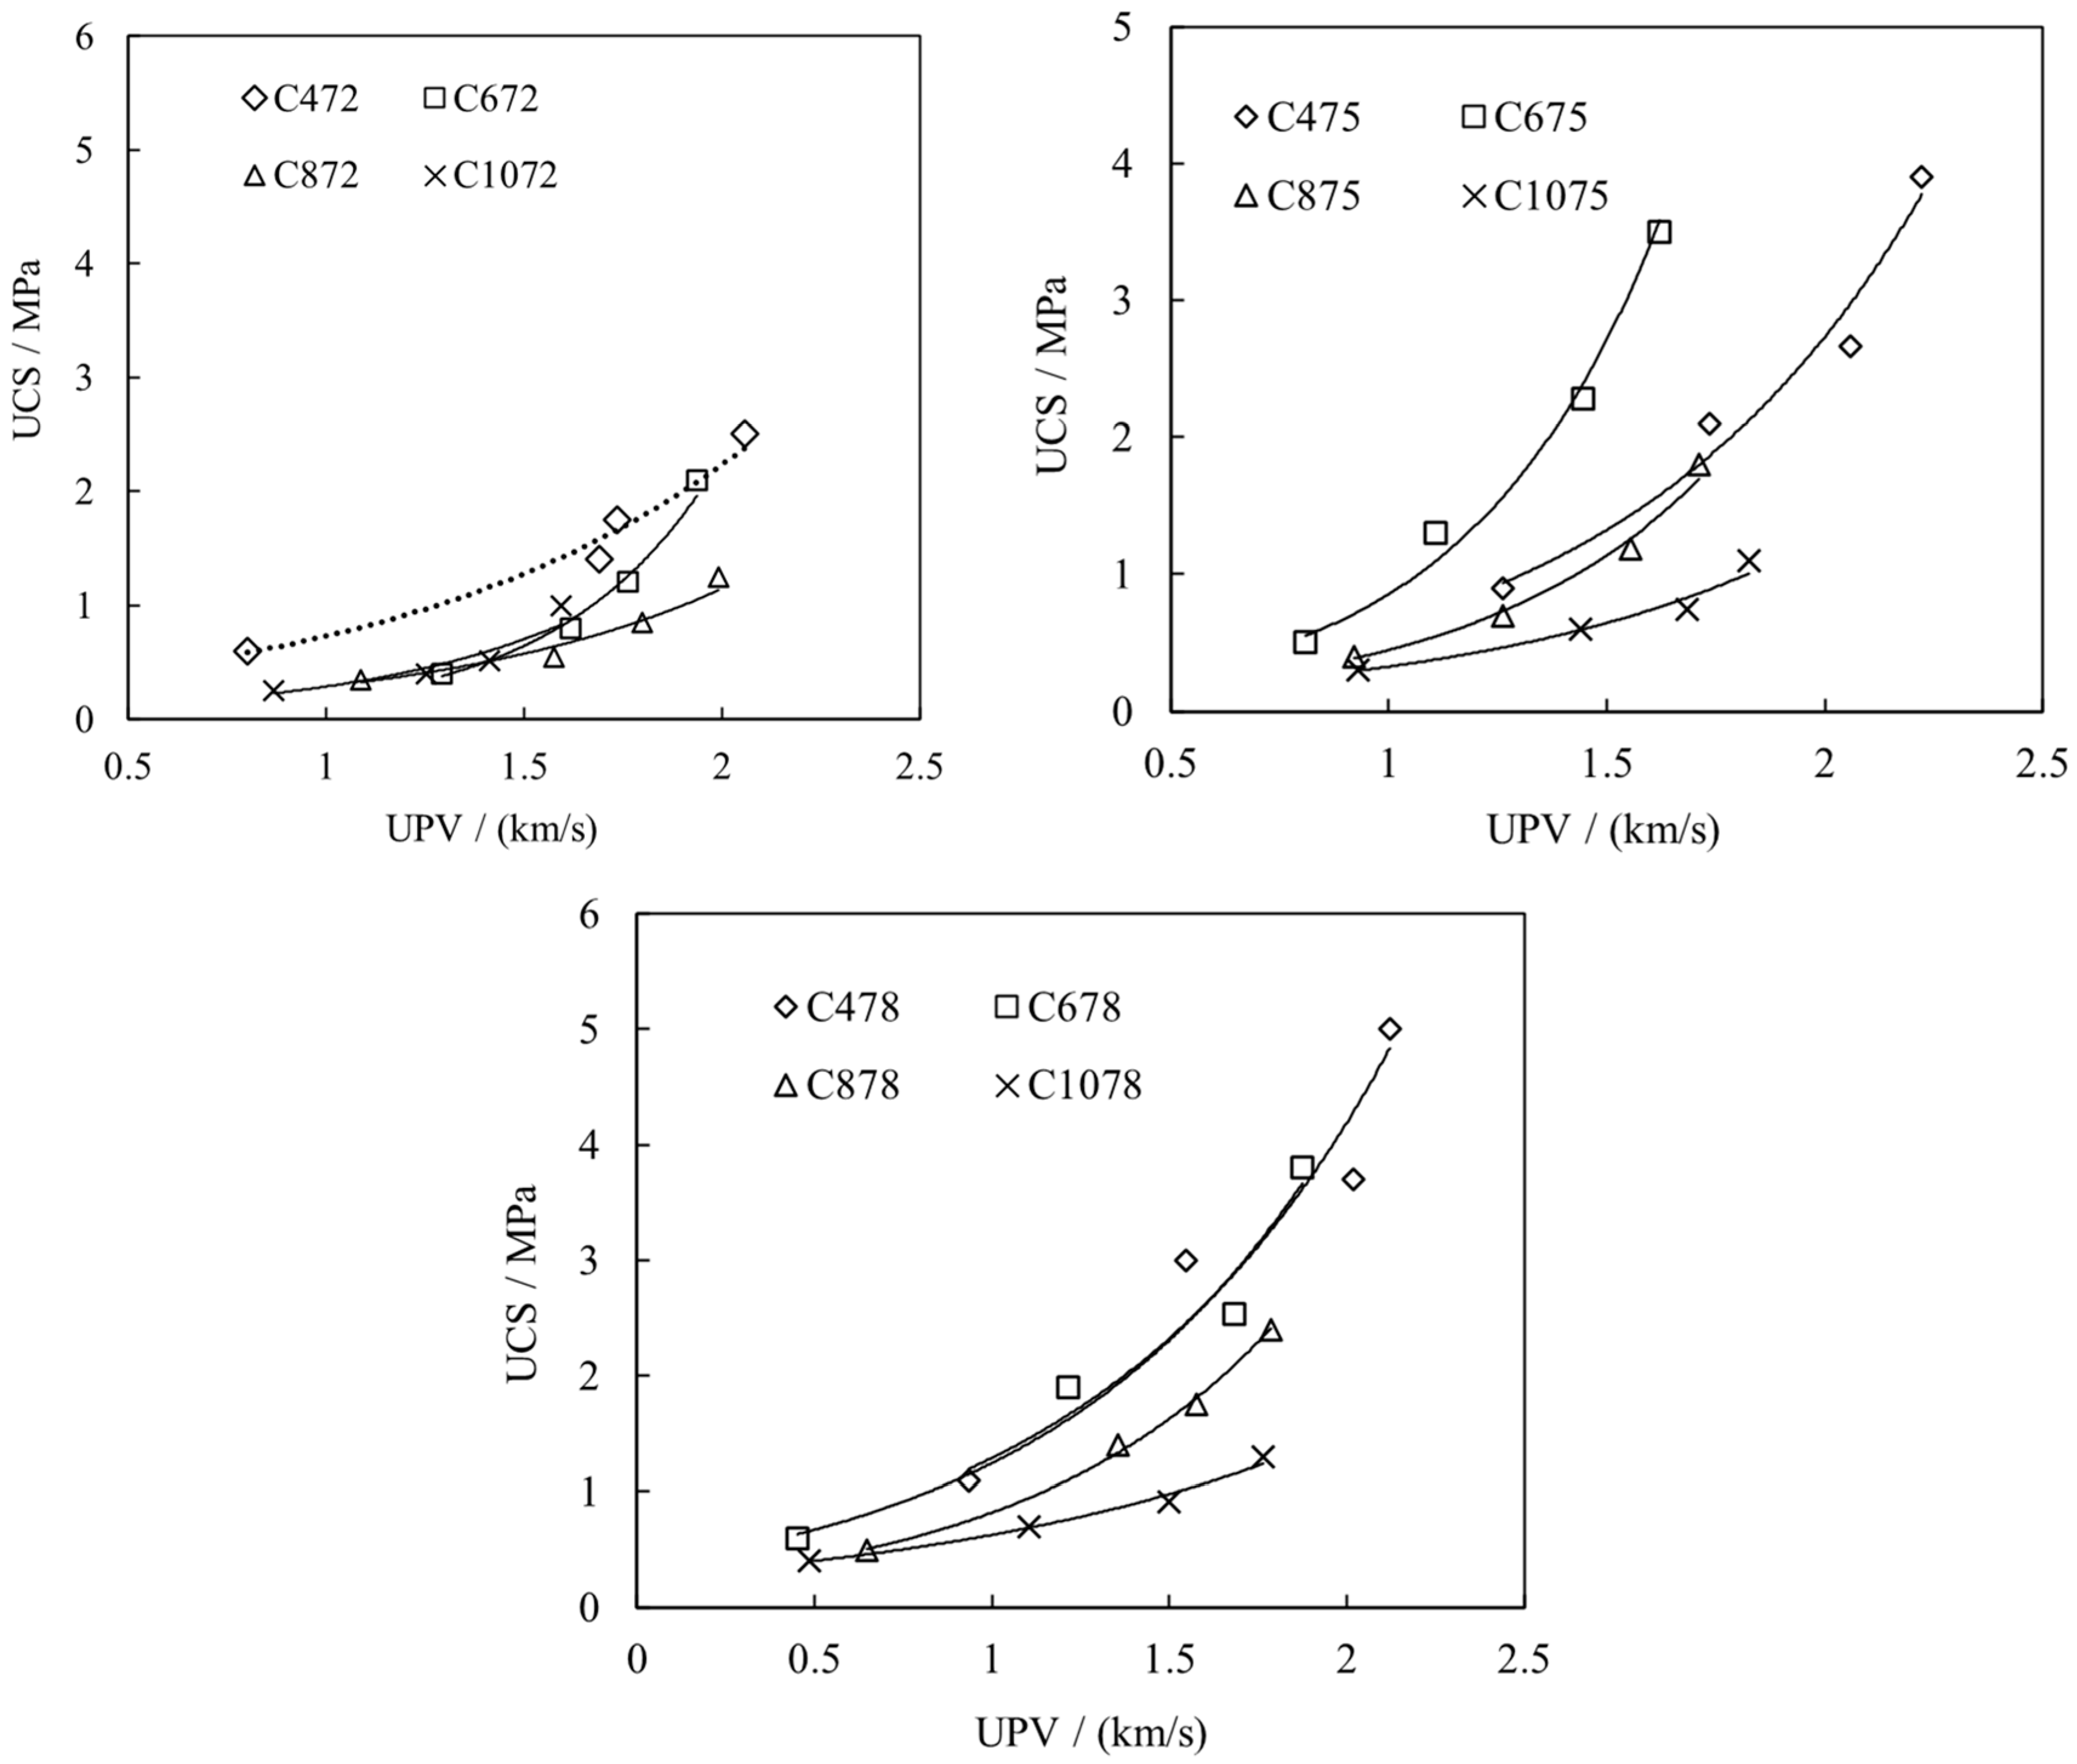
4.4. Correlation of the UCS and UPV of CTB Samples

Previous literature [39,40] has been performed to investigate the relationship between the UCS and UPV for cement-based materials (e.g., concrete). It is noticed that the mechanical performance of those cement-based materials is fundamentally related to the ultrasonic pulse velocity. However, few studies have established the correlation between UCS and UPV for CTB. Hence, in this study, our experimental study further validates this theory and extends it to CTB mixtures. Based on the experiment above, the empirical equation of the UPV and USC of CTB with different b/w ratios and the solid content was established. It shows that the correlations between the UCS and UPV of CTB samples are dependent on the cement content and curing age. As shown in Figure 12, the UPV values of the CTB with different b/w ratios (1:4, 1:6, 1:8, and 1:10) and solid content (72%, 75%, and 78%) were correlated with UCS by means of simple regression analysis. Exponential curve fitting approximations were used to find the correlation between the UCS and UPV for CTB. The approximation equations that have the best correlation coefficient are obtained for each regression. The plots of UPV versus UCS in Figure 12 demonstrate that there is an exponential relationship between the UPV and UCS for CTB samples prepared at different cement dosages and solid content. High correlation coefficients for a particular set of data collected from the same solid content were obtained.
Table 6 depicts the fitting curve of all the equations. As can be seen in the table, the correlation coefficients (R2 value) of all the equations are larger than 87%. In this regard, the general equation for assessment of the UCS of CTB samples using UPV data was determined by the following expression as given in Equation (10):
σ U C S = c + a e b V P
where, a , b and c are the fitted values, mainly depending on the b/w ratio and solid content.
Thus, it indicates that the empirical equations given in Equation (10) can calculably estimate the UCS of CTB samples by means of the UPV method.
Furthermore, to check the validity of the equations above, a t-test and F- test were conducted. The correlation coefficients (r-value) is determined by Equation (11) [1].
t = r / ( 1 r 2 ) ( n 2 )
r means the correlation coefficient, while n is the sample number.
The significance of the regression was compared with the computed t value and F. The selected level of confidence in the t- and F-test is 95%. The null hypothesis is rejected if the computed t and F values are greater than the tabulated ones [1]. Table 7 shows the results for the t-test and F-test. It can be seen that the computed t and F values were much higher than the tabulated t and F values. Therefore, predicting the UCS by means of the UPV monitoring method based on the exponential models above is reliable.

5. Conclusions

This paper aims to investigate the ultrasonic properties and mechanical strength of CTB samples prepared at different b/w ratios and solid content. The UPV monitoring, mechanical tests (UCS), and microstructure tests (MIP, SEM) are conducted on the prepared CTB samples. Based on the experimental results, the following conclusions are obtained:
(1) The evolution of the UPV in CTB samples is significantly affected by the hydration of the CTB mixture at the early curing time, regardless of the b/w ratio and solid content. The UPV value increased rapidly initially. In the following curing stage (from 3 to 7 days), the gain rate of the UPV decreased. The samples with a different solid content and b/w ratio follow a similar trend with curing time.
(2) The UPV development of CTB is significantly affected by the b/w ratio and solid content. A higher b/w ratio and solid content induces the hydration process of the CTB mixture, which leads to a lower total porosity. Hence, the UPV values of CTB increase. Meanwhile, the UPV properties of CTB samples were consistent with their dynamic elasticity modulus and dynamic shear modulus, regardless of the b/w ratio and solid content.
(3) The UCS values increased with the curing time. The b/w ratio and solid content have a significant effect on the UCS of CTB samples. A higher b/w ratio and solid content are attributed to a higher UCS value. The hydration products fill the void spaces or micropores within the tailing, resulting in a decrease in the porosity of CTB, which leads to strength development and solid stiffness. In addition, the strength gain rate of CTB samples reaches peak values at the initial 3 days.
(4) The correlation between the UPV and UCS of CTB is established according to the simple regression analysis. The F-test and t-test were performed to validate the empirical equation models, which indicate that predicting the UCS by means of the UPV monitoring method based on the exponential models above is reliable. The results obtained in this research will contribute to monitoring the mechanical properties without cumbersome, destructive, and time-consuming test methods.

Author Contributions

Conceptualization, W.X.; methodology, X.T.; validation, W.X. and X.T.; investigation, X.T.; data curation, X.T.; writing—original draft preparation, X.T.; writing—review and editing, X.T.; supervision, supervision, W.X.; project administration, W.X.; funding acquisition, W.X. All authors have read and agreed to the published version of the manuscript.

Funding

YueQi Young Scholar project (800015Z1185) and the Fundamental Research Funds for the Central Universities (2022YJSNY06).

Data Availability Statement

Not applicable.

Acknowledgments

This study is supported by the YueQi Young Scholar project (800015Z1185) and the Fundamental Research Funds for the Central Universities (2022YJSNY06), which are gratefully acknowledged.

Conflicts of Interest

The authors declare no conflict of interest.

References

  1. Yılmaz, T.; Ercikdi, B.J.N.T. Predicting the uniaxial compressive strength of cemented paste backfill from ultrasonic pulse velocity test. Nondestruct. Test. Eval. 2016, 31, 247–266. [Google Scholar] [CrossRef]
  2. Trtnik, G.; Valič, M.I.; Kavčič, F.; Turk, G.J.C. Comparison between two ultrasonic methods in their ability to monitor the setting process of cement pastes. Cem. Concr. Res. 2009, 39, 876–882. [Google Scholar] [CrossRef] [Green Version]
  3. Stepisnik, J.; Lukac, M.; Kocuvan, I. Measurement of Cement Hydration by Ultrasonics. Am. Ceram. Soc. Bulletin. 1981, 60, 481–483. [Google Scholar]
  4. Valič, M.J.C.; Research, C. Hydration of cementitious materials by pulse echo USWR: Method, apparatus and application examples. Cem. Concr. Res. 2000, 30, 1633–1640. [Google Scholar] [CrossRef]
  5. Akkaya, Y.; Voigt, T.; Subramaniam, K.; Shah, S.P.J.M. Nondestructive measurement of concrete strength gain by an ultrasonic wave reflection method. Mater. Struct. 2003, 36, 507–514. [Google Scholar] [CrossRef]
  6. Voigt, T.; Malonn, T.; Shah, S.P.J.C.; Research, C. Green and early age compressive strength of extruded cement mortar monitored with compression tests and ultrasonic techniques. Cem. Concr. Res. 2006, 36, 858–867. [Google Scholar] [CrossRef]
  7. Voigt, T.; Sun, Z.; Shah, S.P.J.C.; Composites, C. Comparison of ultrasonic wave reflection method and maturity method in evaluating early-age compressive strength of mortar. Cem. Concr. Compos. 2006, 28, 307–316. [Google Scholar] [CrossRef]
  8. Sun, Z.; Voigt, T.; Shah, S.P.J.C.; Research, C. Rheometric and ultrasonic investigations of viscoelastic properties of fresh Portland cement pastes. Cem. Concr. Res. 2006, 36, 278–287. [Google Scholar] [CrossRef]
  9. Sun, Z.; Ye, G.; Voigt, T.; Shah, S.P.; Van Breugel, K. Early Age Properties of Portland Cement Pastes Investigated with Ultrasonic Shear Waves and Numerical Simulation. In Proceedings of the RILEM International Symposium on Advances in Concrete through Science and Engineering, Evanston, IL, USA, 21–24 March 2004. [Google Scholar]
  10. Krauß, M.; Hariri, K.J.C.; Composites, C. Determination of initial degree of hydration for improvement of early-age properties of concrete using ultrasonic wave propagation. Cem. Concr. Compos. 2006, 28, 299–306. [Google Scholar] [CrossRef]
  11. Ye, G. Experimental Study and Numerical Simulation of the Development of the Microstructure and Permeability of Cementitious Materials. Ph.D. Thesis, Delft University of Technology, Delft, The Netherlands, 2003. [Google Scholar]
  12. Ye, G.; Lura, P.; Van Breugel, K.; Fraaij, A.J.C.; Composites, C. Study on the development of the microstructure in cement-based materials by means of numerical simulation and ultrasonic pulse velocity measurement. Cem. Concr. Compos. 2004, 26, 491–497. [Google Scholar] [CrossRef]
  13. Robeyst, N.; Grosse, C.U.; De Belie, N.J.C.; Composites, C. Relating ultrasonic measurements on fresh concrete with mineral additions to the microstructure development simulated by Cemhyd3D. Cem. Concr. Compos. 2011, 33, 680–693. [Google Scholar] [CrossRef]
  14. Reinhardt, H.; Grosse, C.; Herb, A.J.M. Ultrasonic monitoring of setting and hardening of cement mortar—A new device. Mater. Struct. 2000, 33, 581–583. [Google Scholar] [CrossRef]
  15. Reinhardt, H.; Grosse, C.J.C. Continuous monitoring of setting and hardening of mortar and concrete. Constr. Build. Mater. 2004, 18, 145–154. [Google Scholar] [CrossRef]
  16. Reinhardt, H.-W.; Grosse, C.; Herb, A.; Weiler, B.; Schmidt, G. Method for Examining a Solidifying and/or Hardening Material using Ultrasound, Receptacle and Ultrasound Sensor for Carrying out the Method; US Patent and Trademark Office: Detroit, MI, USA, 2003. [Google Scholar]
  17. Yilmaz, E.; Belem, T.; Benzaazoua, M.J.E.G. Effects of curing and stress conditions on hydromechanical, geotechnical and geochemical properties of cemented paste backfill. Eng. Geol. 2014, 168, 23–37. [Google Scholar] [CrossRef]
  18. Yilmaz, E.; Belem, T.; Benzaazoua, M.J.E.G. Specimen size effect on strength behavior of cemented paste backfills subjected to different placement conditions. Eng. Geol. 2015, 185, 52–62. [Google Scholar] [CrossRef]
  19. Yilmaz, E.; Benzaazoua, M.; Belem, T.; Bussière, B.J.M.E. Effect of curing under pressure on compressive strength development of cemented paste backfill. Miner. Eng. 2009, 22, 772–785. [Google Scholar] [CrossRef]
  20. Benzaazoua, M.; Fall, M.; Belem, T.J.M. A contribution to understanding the hardening process of cemented pastefill. Miner. Eng. 2004, 17, 141–152. [Google Scholar] [CrossRef]
  21. Ercikdi, B.; Kesimal, A.; Cihangir, F.; Deveci, H.; Alp, İ.J.C.; Composites, C. Cemented paste backfill of sulphide-rich tailings: Importance of binder type and dosage. Miner. Eng. 2009, 31, 268–274. [Google Scholar] [CrossRef]
  22. Fall, M.; Célestin, J.; Pokharel, M.; Touré, M. A contribution to understanding the effects of curing temperature on the mechanical properties of mine cemented tailings backfill. Eng. Geol. 2010, 114, 397–413. [Google Scholar] [CrossRef]
  23. Trtnik, G.; Gams, M.J.C.; Research, C. The use of frequency spectrum of ultrasonic P-waves to monitor the setting process of cement pastes. Cem. Concr. Res. 2013, 43, 1–11. [Google Scholar] [CrossRef]
  24. Trtnik, G.; Turk, G.J.C.; Research, C. Influence of superplasticizers on the evolution of ultrasonic P-wave velocity through cement pastes at early age. Cem. Concr. Res. 2013, 51, 22–31. [Google Scholar] [CrossRef] [Green Version]
  25. Trtnik, G.; Valič, M.I.; Turk, G.J.N.; International, E. Measurement of setting process of cement pastes using non-destructive ultrasonic shear wave reflection technique. NDT E Int. 2013, 56, 65–75. [Google Scholar] [CrossRef] [Green Version]
  26. Del Rıo, L.; Jimenez, A.; Lopez, F.; Rosa, F.; Rufo, M.; Paniagua, J.J.U. Characterization and hardening of concrete with ultrasonic testing. Ultrasonics 2004, 42, 527–530. [Google Scholar] [CrossRef] [PubMed]
  27. Lago, S.; Brignolo, S.; Cuccaro, R.; Musacchio, C.; Albo, P.A.G.; Tarizzo, P. Application of acoustic methods for a non-destructive evaluation of the elastic properties of several typologies of materials. Appl. Acoust. 2013, 75, 10–16. [Google Scholar] [CrossRef]
  28. Landriault, D. IPaste backfill mix design for Canadian underground hard rock mining. In Proceedings of the 97th Annual General Meeting of CIM. Rock Mechanics and Strata Control Session, Halifax, NS, Canada, 14–18 May 1995. [Google Scholar]
  29. Landriault, D. Backfill in underground mining. Undergr. Min. Methods Eng. Fundam. Int. Case Stud. 2001, 601–614. [Google Scholar]
  30. Tian, X.; Fall, M. Non-isothermal evolution of mechanical properties, pore structure and self-desiccation of cemented paste backfill. Constr. Build. Mater. 2021, 297, 123657. [Google Scholar] [CrossRef]
  31. Voigt, T.J.P.T. The Application of an Ultrasonic Shear Waves Reflection Method for Nondestructive Testing of Cement-Based Materials at Eraly Ages. Ph.D. Thesis, Leipzig University, Leipzig, German, 2004. [Google Scholar]
  32. Feylessoufi, A.; Tenoudji, F.C.; Morin, V.; Richard, P.J.C. Early ages shrinkage mechanisms of ultra-high-performance cement-based materials. Cem. Concr. Res. 2001, 31, 1573–1579. [Google Scholar] [CrossRef]
  33. Ye, G.; Van Breugel, K.; Fraaij, A.J.C.; Research, C. Experimental study and numerical simulation on the formation of microstructure in cementitious materials at early age. Cem. Concr. Res. 2003, 33, 233–239. [Google Scholar] [CrossRef]
  34. Abdul-Hussain, N.; Fall, M. Unsaturated hydraulic properties of cemented tailings backfill that contains sodium silicate. Eng. Geol. 2011, 123, 288–301. [Google Scholar] [CrossRef]
  35. Fang, K.; Fall, M. Effects of curing temperature on shear behaviour of cemented paste backfill-rock interface. Int. J. Rock Mech. Min. Sci. 2018, 112, 184–192. [Google Scholar] [CrossRef]
  36. Ghirian, A.; Fall, M. Strength evolution and deformation behaviour of cemented paste backfill at early ages: Effect of curing stress, filling strategy and drainage. Int. J. Min. Sci. Technol. 2016, 26, 809–817. [Google Scholar] [CrossRef]
  37. Taylor, H.F. Cement Chemistry; Thomas Telford: London, UK, 1997; Volume 2. [Google Scholar]
  38. Xu, W.; Tian, X.; Cao, P. Assessment of hydration process and mechanical properties of cemented paste backfill by electrical resistivity measurement. Nondestruct. Test. Eval. 2018, 33, 198–212. [Google Scholar] [CrossRef]
  39. Trtnik, G.; Kavčič, F.; Turk, G.J.U. Prediction of concrete strength using ultrasonic pulse velocity and artificial neural networks. Ultrasonics 2009, 49, 53–60. [Google Scholar] [CrossRef] [PubMed] [Green Version]
  40. Demirboğa, R.; Türkmen, İ.; Karakoc, M.B.J.C. Relationship between ultrasonic velocity and compressive strength for high-volume mineral-admixtured concrete. Cem. Concr. Res. 2004, 34, 2329–2336. [Google Scholar] [CrossRef]
Figure 1. Several cases of acoustic wave transmitting in CTB specimen.
Minerals 12 00986 g001
Figure 2. Particle size distribution of the tailings samples used in the tests.
Minerals 12 00986 g002
Figure 3. Acoustic wave testing of specimens.
Minerals 12 00986 g003
Figure 4. UPV development of CTB with different: (a) solid content of 72%; (b) solid content of 75% (c) solid content of 78%.
Minerals 12 00986 g004aMinerals 12 00986 g004b
Figure 5. MIP test results for samples with different b/w ratios and solid content (a) cumulative pore volume; (b) pore size distribution.
Minerals 12 00986 g005
Figure 6. Development of DEM of CTB samples: (a) DEM, solid content of 72%; (b) DEM, solid content of 75% (c) DEM, solid content of 78%.
Minerals 12 00986 g006
Figure 7. Development of DSM of CTB samples: (a) DSM, solid content of 72%; (b) DSM, solid content of 75% (c) DSM, solid content of 78%.
Minerals 12 00986 g007
Figure 8. The UCS of CTB under the same solid content during the curing age of 28 days: (a) solid content of 72%; (b) solid content of 75% (c) solid content of 78%.
Minerals 12 00986 g008
Figure 9. SEM images of samples with different solid content. (a) b/w ratio of 1:8, solid content of 72%, curing time of 3 d; (b) b/w ratio of 1:8, solid content of 72%, curing time of 7 d; (c) b/w ratio of 1:8, solid content of 72%, curing time of 28 d.
Minerals 12 00986 g009
Figure 10. SEM images of samples with different solid content. (a) b/w ratio of 1:4, solid content of 72%, curing time of 7 d; (b) b/w ratio of 1:8, solid content of 72%, curing time of 7 d; (c) b/w ratio of 1:10, solid content of 72%, curing time of 7 d.
Minerals 12 00986 g010
Figure 11. SEM images of samples with different solid content. (a) b/w ratio of 1:4, solid content of 72%, curing time of 7 d; (b) b/w o of 1:4, solid content of 75%,curing time of 7 d; (c) b/w of 1:4, solid content of 78%, curing time of 7 d.
Minerals 12 00986 g011aMinerals 12 00986 g011b
Figure 12. Relationship between UCS and UPV of CTB.
Minerals 12 00986 g012
Table 1. Chemical component of unclassified tailings.
CompositionContent CompositionContent CompositionContent
SiO279.770%MgO2.040%H2O0.061%
Al2O32.540%Cao2.780%TiO20.098%
Fe2O38.040%Na2O0.310%P2O50.050%
FeO1.160%K2O0.670%MnO0.013%
Table 2. Main chemical composition of the binders used for CTB preparation.
TypeMgO (%)CaO (%)SiO2 (%)Al2O3 (%)Fe2O3 (%)SO3 (%)Relative DensitySpecific Surface (m2/g)
PCI2.6562.8218.034.532.703.823.101.30
Table 3. Main physical and chemical characteristics of the binders used.
Element (unit)Sp (m2/g)Gs (-)S (wt%)Ca (wt%)Si (wt%)Al (wt%)Mg (wt%)Fe (wt%)Si/Ca
PCI1.323.151.544.98.42.41.61.90.2
Sp: Specific surface area; Gs: Specific gravity.
Table 4. The paste proportions for tests.
Sample No.Curing TemperatureCuring Time (days)Binder-to-Water Ratio (w/c)Solid Content/%Number of Samples
C47225 °C3, 7, 281/472%10
C47525 °C3, 7, 281/475%10
C47825 °C3, 7, 281/478%10
C67225 °C3, 7, 281/672%10
C67525 °C3, 7, 281/675%10
C67825 °C3, 7, 281/678%10
C87225 °C3, 7, 281/872%10
C87525 °C3, 7, 281/875%10
C87825 °C3, 7, 281/878%10
C107225 °C3, 7, 281/1072%10
C107525 °C3, 7, 281/1075%10
C107825 °C3, 7, 281/1078%10
Table 5. Strength increment rates of CTB samples within different curing times.
Sample No.UCS /MPaIncrement Values /MPaIncrement Rate of UCS /(MPa·day−1)
3 d7 d28 d0–3 d3–7 d7–28 d0–3 d3–7 d7–28 d
C4720.61.42.50.60.81.10.200.200.05
C6720.40.82.10.40.41.30.130.100.06
C8720.350.41.40.350.051.00.110.010.05
C10720.250.31.00.250.050.70.080.010.03
C4750.92.13.90.91.21.80.300.300.08
C6750.51.33.50.50.830.170.200.14
C8750.40.71.80.40.31.40.130.080.07
C10750.30.61.10.30.30.50.100.080.02
C4781.13.05.01.11.920.370.480.10
C6780.61.93.80.61.31.90.200.330.09
C8780.51.42.40.50.910.170.230.05
C10780.40.71.30.40.30.60.130.080.03
Table 6. Correlation between UPV and UCS.
Sample No.UCS Equation Exponent
(y = c + a·ebx )
Correlation Coefficient (r)Equation Number
C472 σ U C S = 0.2967 + 0.0832 e 1.5935 V p 0.94781
C672 σ U C S = 0.2261 + 0.0014 e 3.7022 V p 0.992
C872 σ U C S = 0.2473 + 0.0032 e 5.367 V p 0.9843
C1072 σ U C S = 0.2731 + 0.0030 e 2.894 V P 0.9964
C475 σ U C S = 0.1867 + 0.1567 e 1.9397 V P 0.9755
C675 σ U C S = 0.142 + 0.1205 e 1.5312 V P 0.896
C875 σ U C S = 0.4059 + 0.0018 e 3.8847 V P 0.9147
C1075 σ U C S = 0.2425 + 0.0063 e 2.6678 V P 0.9118
C478 σ U C S = 10.56 + 9.5674 e 0.2143 V P 0.8979
C678 σ U C S = 0.0043 + 0.3919 e 0.1842 V P 0.873510
C878 σ U C S = 0.091 + 0.2672 e 1.2458 V P 0.98911
C1078 σ U C S = 0.2456 + 0.0856 e 1.4148 V P 0.96412
Table 7. Results of t and F tests for the correlation between the UCS and UPV.
Sample No.tcomputedttabulatedFcomputedFtabulatedEquation Number
C4728.4±1.833119.06±3.181
C67219.84±1.833263.5±3.182
C87215.62±1.833299.18±3.183
C107231.52±1.833159±3.184
C47512.41±1.833155.2±3.185
C6755.52±1.83353.5±3.186
C8756.37±1.83353.9±3.187
C10756.24±1.83375.2±3.188
C4785.73±1.83361.47±3.189
C6785.07±1.83336.55±3.1810
C87818.91±1.833550±3.1811
C107810.25±1.833207.3±3.1812
Publisher’s Note: MDPI stays neutral with regard to jurisdictional claims in published maps and institutional affiliations.

