Article

Study on the Characteristics of Acoustic Emission Quiet Period in Rocks with Different Elastic Modulus

School of Resources and Environmental Engineering, Jiangxi University of Science and Technology, Ganzhou 341000, China
*
Author to whom correspondence should be addressed.
Minerals 2022, 12(8), 956; https://doi.org/10.3390/min12080956
Submission received: 2 July 2022 / Revised: 24 July 2022 / Accepted: 26 July 2022 / Published: 28 July 2022

Abstract

:
To study the characteristics of the quiet period of acoustic emission (AE) during the rock failure process, rock models with an abnormal elastic modulus were established based on PFC2D. The calibration of the mesoscopic parameters was performed by the macroscopic mechanical parameters of granite samples obtained in uniaxial compression tests. An abnormal area of 2 × 100 mm2 was set at the center of the model and had two to six times the elastic modulus of the normal area. The evolution law of cracks and the characteristics of the AE quiet period were analyzed in detail. The main conclusions are as follows: (1) The axial stress of the abnormal area rises to the maximum value before the occurrence of the main fracture; in the AE quiet period, the axial stress in the abnormal area of elastic modulus increased by 2%–5%, then decreases rapidly after the AE quiet period. (2) As the elastic modulus increases, the interval time of the AE quiet period is prolonged by one to five times. Furthermore, many cracks occurred mainly in the abnormal area, and then a few cracks were generated before the AE quiet period. Cracks mainly focus on the elastic modulus abnormal area and propagate beyond the normal area after the AE quiet period. (3) The Z value is used as the indicator of the significance of the AE quiet period, and it changes with the elastic modulus of the abnormal area. The Z value without an abnormal area is the minimum of 1.1, and the elastic modulus of the abnormal area was set to three times the normal area, the Z value reaches the maximum of 6.08, and the Z value changes with the elastic modulus. The distribution of different elastic modulus is an important factor concerned with the characteristics of the AE quiet period.

1. Introduction

Rock acoustic emission (AE) refers to the phenomenon in which local strain energy is released rapidly, and an elastic wave is generated instantaneously when the crack in rock emerges or propagates [1,2]. Prior research has shown that the AE signals generated in the process of rock deformation and subsequent failure are related to the microfracture activity of rock. By analyzing the AE generated during the rock failure process, the process of crack inoculation, development, and penetration can be inverted. The AE quiet period refers to the phenomenon in which AE is less pronounced or significantly reduced before rock failure [3,4]. The current research indicates that the quiet period of AE is objective existence [5]. The mesoscopic composition and internal structure of rock will affect the AE quiet period to different degrees. Studying the characteristics of the AE quiet period are important to learn the rock failure mechanism, and it is greatly significant for the stability prediction of the rock mass.
Many scholars have studied the characteristics of AE and its quiet period through laboratory tests [6,7,8,9,10]. Rudajev [11] found that the AE of rock during the loading process have an initial region, dense region, and falling region. Furthermore, the peak stress of rock is predicted through the quiet period of AE. The AE characteristics of granite indicate that the rock needs to accumulate a certain amount of loading energy before the crack propagation at different loading stages, and there was a certain AE quiet period during this time [12]. Li [13] found that partial rocks always have relatively AE quiet periods on six types of rocks under uniaxial compression, incremental cyclic loading and unloading, and incremental stabilized cyclic loading and unloading tests. The result of which can be used as a reference for the prediction or assessment of rock failure. Wu [14] studied the variation characteristics of wave velocity and sound emission of granite at different loading conditions and found that the most obvious period of the “relative quiet period” occurred before the instant at which the peak stress was attained. Su [15] researched granite rock burst and the plate cracking process by a true triaxial test system. The results show that The AE event and count rate suddenly increased and then decreased, which can be used to predict the precursor of the final instability of rock. With the development of computer technology, numerical simulations have become an extensively used research method in the field of rock mechanics and rock engineering. They have contributed to the quantification of the characteristics of mechanical and AE in the rock failure process [16,17,18]. The existence of the AE quiet period of rock is also found in the process of numerical simulation. Dong [19] simulated the rock failure of three stress paths under uniaxial compression by Rock Failure Process Analysis System (RFPA) and found that AE quiet periods occurred before the rock failure. The homogeneity of rock will also have a significant impact on rock mechanics and AE characteristics [20,21]. It is important that the homogeneity of rock has an influence on the rock’s mechanical and AE characteristics during the process of uniaxial compression failure [20,21]. Potyondy [22,23] considered the stiffness and strength parameters of particles and bonds as mesoscopic parameters through the two and three dimensional discontinuum programs by PFC2D and PFC3D and based on bond break, the characteristics of rock elasticity, fracturing, and AE were reproduced. Hazzard [24,25] established a method to simulate the rock of AE in conjunction with the theory of seismic moment tensors and discrete elements. Li [26] proposed a grain−based model Discrete element method (DEM) that reflected the microscale characteristics and mineral particle composition of rock materials, many external factors, such as end friction, aspect ratio, and loading rate, will affect rock fracture and AE characteristics. Liu [27] established coal−rock assemblage models with different block height ratios with the use of PFC and studied the mechanical properties and numerical characteristics of the AE of coal–rock assemblage. The results showed that the failure of the coal−rock assemblage was mainly concentrated on the coal body, and the AE evolution characteristics could be divided into stable, rapid rising, and rapid falling stages. The above contents have conducted numerous studies on the AE quiet period characteristics of rock from experiments and numerical simulations and generated an abundance of research results [28,29,30]. However, the cause of the AE quiet period from the perspective of rock mesostructure has been rarely used for simulations. It is difficult to study the intrinsic cause of the quiet period by controlling the single mesoscopic parameter variable owing to the complex internal structure of rock in the laboratory. Numerical simulations can replace this approach as an effective alternative method [31,32].
From a macroscopic point of view, the elastic modulus is an index to measure the ability of an object to resist elastic deformation. There are some abnormal areas of the elastic modulus in its internal composition because the rock is heterogeneous [33]. From a microscopic point of view, the elastic modulus is a reflection of the bond strength between particles [34,35]. With the help of PFC2D, a calibration of the mesoscopic parameters was performed by the macroscopic mechanical parameters of granite samples obtained in uniaxial compression tests. The mechanical properties and AE characteristics of rocks with different elastic modulus in the process of uniaxial compression were studied, and the crack propagation law and the mechanism of AE quiet period in the process of rock failure were studied. The research results can provide a theoretical basis for revealing the mechanism of rock failure and AE monitoring as well as the early warning signs.

2. Methods

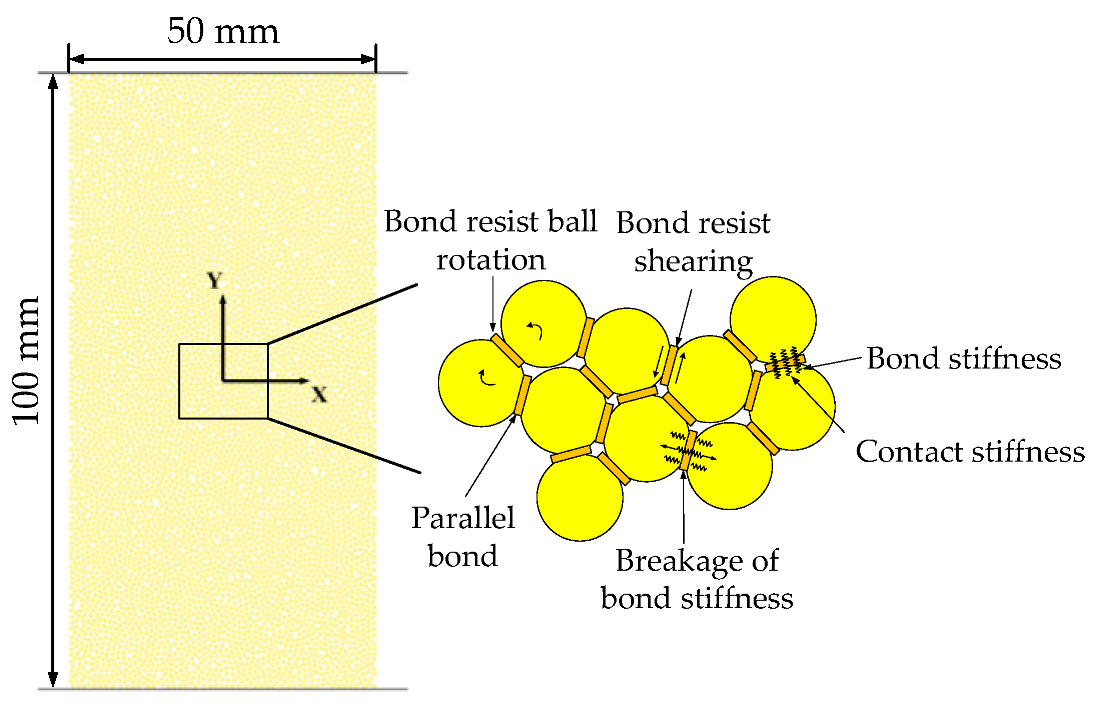
2.1. Establishment of Particle Flow Model

The rock model in PFC consists of discrete particles. To simulate the evolution process of crack propagation, the bond of the particles will break under the external force, and then the microcracks are generated. Therefore, it is very suitable for the study of the acoustic emission mechanism of rock [36].
PFC2D was used to build the equivalent numerical calculation model of rock. According to the size of rock samples in the laboratory, the size of the two−dimensional numerical model was set to 50 mm × 100 mm. The bottom and top surfaces of the model were loaded by rigid walls, and the left and right sides were free boundaries. To accurately represent the mechanical characteristics of rock, the parallel bonding model was adopted for the contact constitutive model between particles [37]. The steps were as follows. (1) the initial model was established, and particles with a random radius in the range of 2.5–5 mm were generated in the container. The radius enlargement method was used to adjust the distribution of particles until the internal stress was balanced. (2) The internal stress was adjusted, and the boundary position of the model was constantly adjusted so that the internal stress between the particle system was uniform and at a low level, the radii of the suspended particles with values less than one were enlarged, and the suspended particles contacted other particles to ensure the overall density of the model. (3) The particle bonding parameters were set, and a numerical model was generated, as shown in Figure 1.

2.2. Determination of Particle Flow Mesoscopic Parameters

The rock specimens used in the test were from deep granite obtained from a mine in inner Mongolia. These were shaped as cylindrical specimens with diameters of 50 mm and heights of 100 mm by using cutting and grinding processes, as shown in Figure 2a. The RMT−150C rock mechanics loading system was used in the test. The displacement loading method was selected, and the loading rate was 0.001 mm/s. The data on stress, displacement, and time were collected.
The parallel bond model (PBM) and the discrete element particle model can be used to simulate many types of mechanical properties of rock−like materials. The uniaxial compression test results are listed in Table 1. The experimental granite was selected as the reference for the calibration of microscopic parameters of the simulated samples, and the uniaxial compressive strength, Poisson’s ratio, and elastic modulus of the target rock samples were used as the main adjustment objects based on the use of the control variable method. The ratio of normal stiffness to shear stiffness k n / k s and the bond stiffness ratio k n ¯ / k s ¯ mainly affect the Poisson’s ratio, the effective modulus E * affects the elastic modulus, and the parallel bond strength affects the uniaxial compressive strength of the model [37,38]. Furthermore, the microscopic parameters were determined by comparison with the laboratory test results. The final parameters are listed in Table 2.
In PFC, a wall with stiffness was set to load the model. The control method adopted displacement loading in this simulation. In order to reduce the influence of the loading rate on the simulation model, the loading speeds of the top and bottom walls of the model were set to 0.1 m/s and −0.1 m/s, respectively. After the peak stress, the loading was stopped when the loading reached 50% of the peak stress. To judge whether the numerical simulation results are consistent with the experimental results, the uniaxial compressive strength, Poisson’s ratio, elastic modulus, and crack distribution in model failure were generally consistent. If these conditions are basically satisfied, the simulation results can be considered as successful [34]. Figure 2b compares the stress–strain curve of the model with the laboratory test results of H−1 granite. The black area represents the cracks of tensile failure, and the red area represents the cracks of compression shear failure. It can be observed that the simulation results of PFC were close to the experimental results in terms of stress–strain curves, mechanical parameters, and macroscopic failure forms. Thus, the mesoscopic parameters can reflect the mechanical properties of rock.

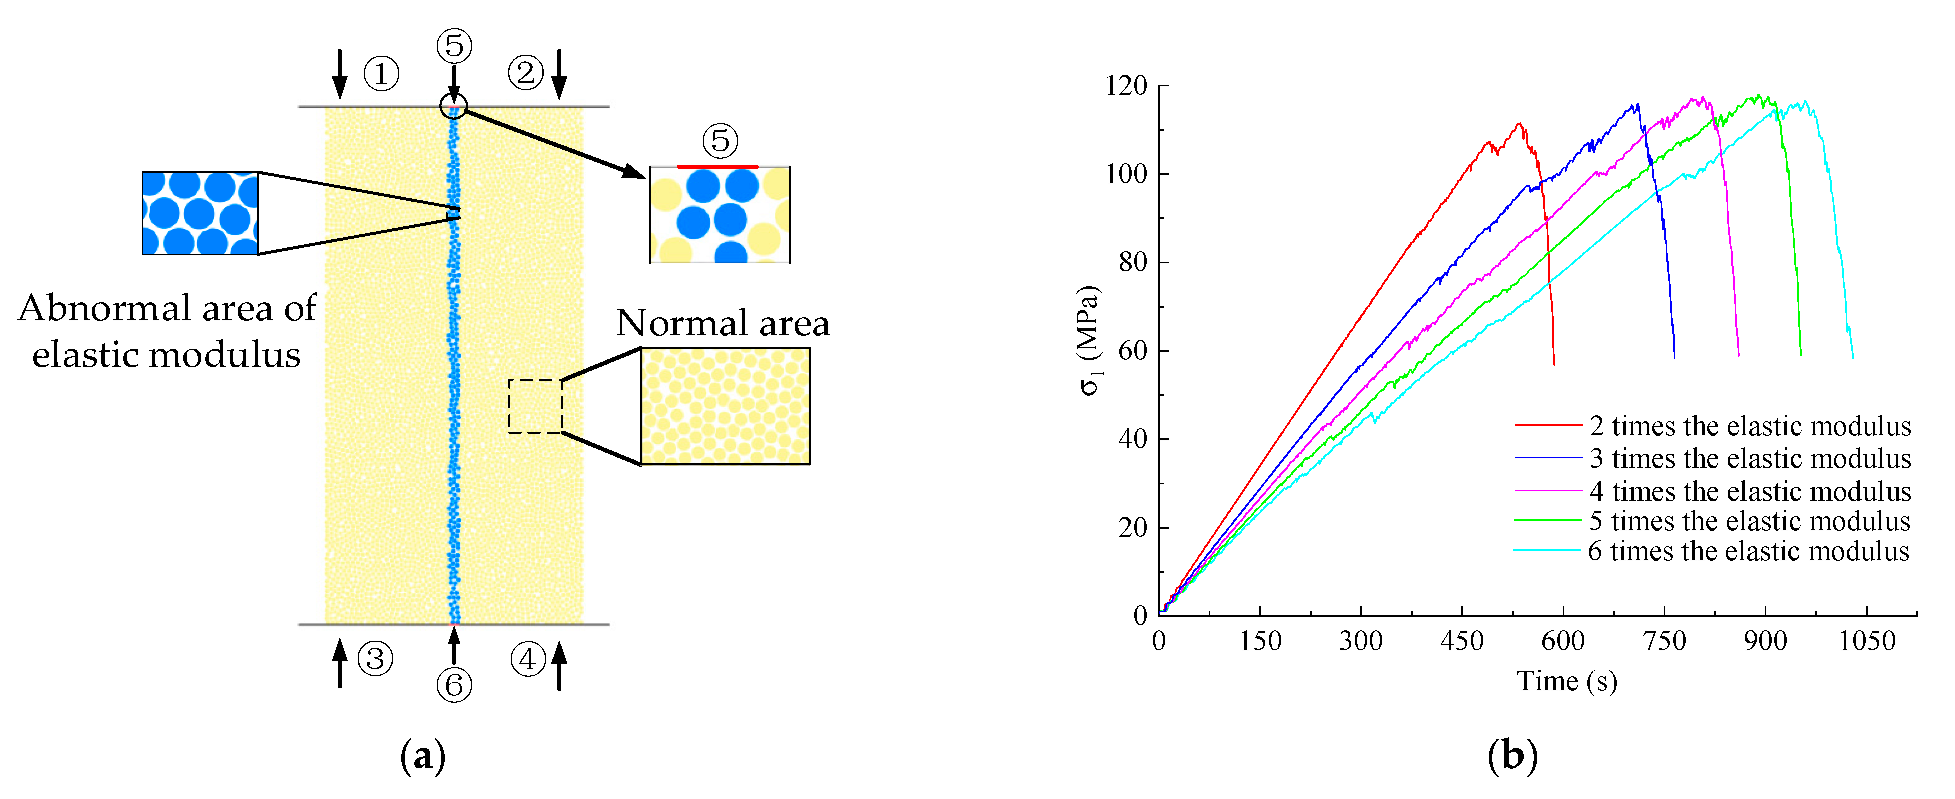
2.3. Rock Model Construction in Elastic Modulus Abnormal Area

To study the influence of the different elastic modulus on the mechanical properties and AE of rock, an area with an abnormal elastic modulus (2 mm × 100 mm) was set at the center of the rock model. The elastic modulus of the abnormal area was set to 2–6 times (40 GPa, 60 GPa, 80 GPa, 100 GPa, and 120 GPa) of the normal area. The elastic modulus of the normal and the abnormal areas are E1 and E2 (E1 < E2). The stresses σ 1 and σ 2 in the corresponding area can be obtained, respectively.
To extract the axial stress in the abnormal area of elastic modulus and the normal area, the walls on the upper and lower sides of the model were divided into six parts. Walls no. ① and ② correspond to the upper sides of the normal area of elastic mold, Walls no. ③ and ④ correspond to the lower sides of the normal area of elastic mold, and walls no. ⑤ and ⑥ control the upper and lower sides of the abnormal area of elastic mold. As the displacement control was adopted when the model was loaded, the same downward initial velocity was assigned to walls no. ①, ②, and ⑤, and the same reverse initial velocity was assigned to walls no. ③, ④, and ⑥ when the axial stress was applied. The numerical simulation model is shown in Figure 3a.
It is necessary to analyze the stress of specimens within the elastic modulus abnormal region because the physical and mechanical properties of the rock model changed. According to the uniaxial compression test time of granite, the size of the timestep was converted to obtain the axial stress of the specimen in the numerical calculation. The plot of stress variation as a function of time is shown in Figure 3b. In PFC, there is a positive linear correlation between the elastic modulus and the bond strength. The strength of the specimen did not change much following increases of the elastic modulus in the abnormal area, but the failure time of the specimen tended to be delayed, and the time to reach the peak strength increased successively.

3. Results

According to the AE theory established by the moment tensor principle and based on the PFC2D [23], the AE of rock in the failure process was simulated, and the time, space, fracture strength, and the number of cracks included in the AE could be obtained. The AE characteristics of specimens with different elastic modulus were studied by this method.
In the PFC simulation, it is usually assumed that the AE events are generated by the micro crack formed by a bond break. If the microcracks occur at a close time and spatial positions, these microcracks are considered to belong to the same AE events. The moment tensor of the contact force variation among the particles contained in the primary AE was calculated. The position is represented by coordinates x and y, and the AE events magnitude (rupture strength) M is calculated by Equation (1) [39].
M = 2 3 log M 0 6
where M0 is the peak scalar moment of the moment tensor of AE events.
Figure 4, Figure 5, Figure 6, Figure 7, Figure 8 and Figure 9 show the simulation results of the uniaxial compression AE test of the specimens in abnormal areas with different elastic modulus, and the radius represents the intensity of the AE events. Figure 4a, Figure 5a, Figure 6a, Figure 7a, Figure 8a and Figure 9a show the stress curves, AE event rate, and accumulated AE events during rock loading. The A moment was used to record the first AE event occurs, which was defined as the crack initiation strength of the rock. Point B was used to denote the AE quiet period starting point. Point C was used to denote the AE quiet period endpoint. Point D was used to denote the peak stress of the specimen. Point E was used to denote the moment at 50% of the peak stress. Figure 4b, Figure 5b, Figure 6b, Figure 7b, Figure 8b and Figure 9b shows the AE events locations in different stages. The solid blue circle represents the AE events that occurred during this stage. The solid red circle represents the new AE events occurring at this stage.
An analysis of Figure 4 shows that at the initial stage of loading, a small amount of AE is generated as the loading progresses. Some particles in the model are stressed more than the bonding tensile (shear) strength, and AE events of microcrack formation after bond breaking increase slowly; massive AE events are generated before the peak stress, then the quiet period of AE occurs. Subsequently, cracks were continuously generated and connected, forming obvious shear fracture and the model was damaged.
According to Figure 5, Figure 6, Figure 7, Figure 8 and Figure 9, the axial stress of the elastic modulus in the abnormal area and the normal areas were obtained. The failure process of these specimens under uniaxial compression can be divided into the following stages.
(a)
Before point A. There are no cracks and AE events emergence in the stage of compaction;
(b)
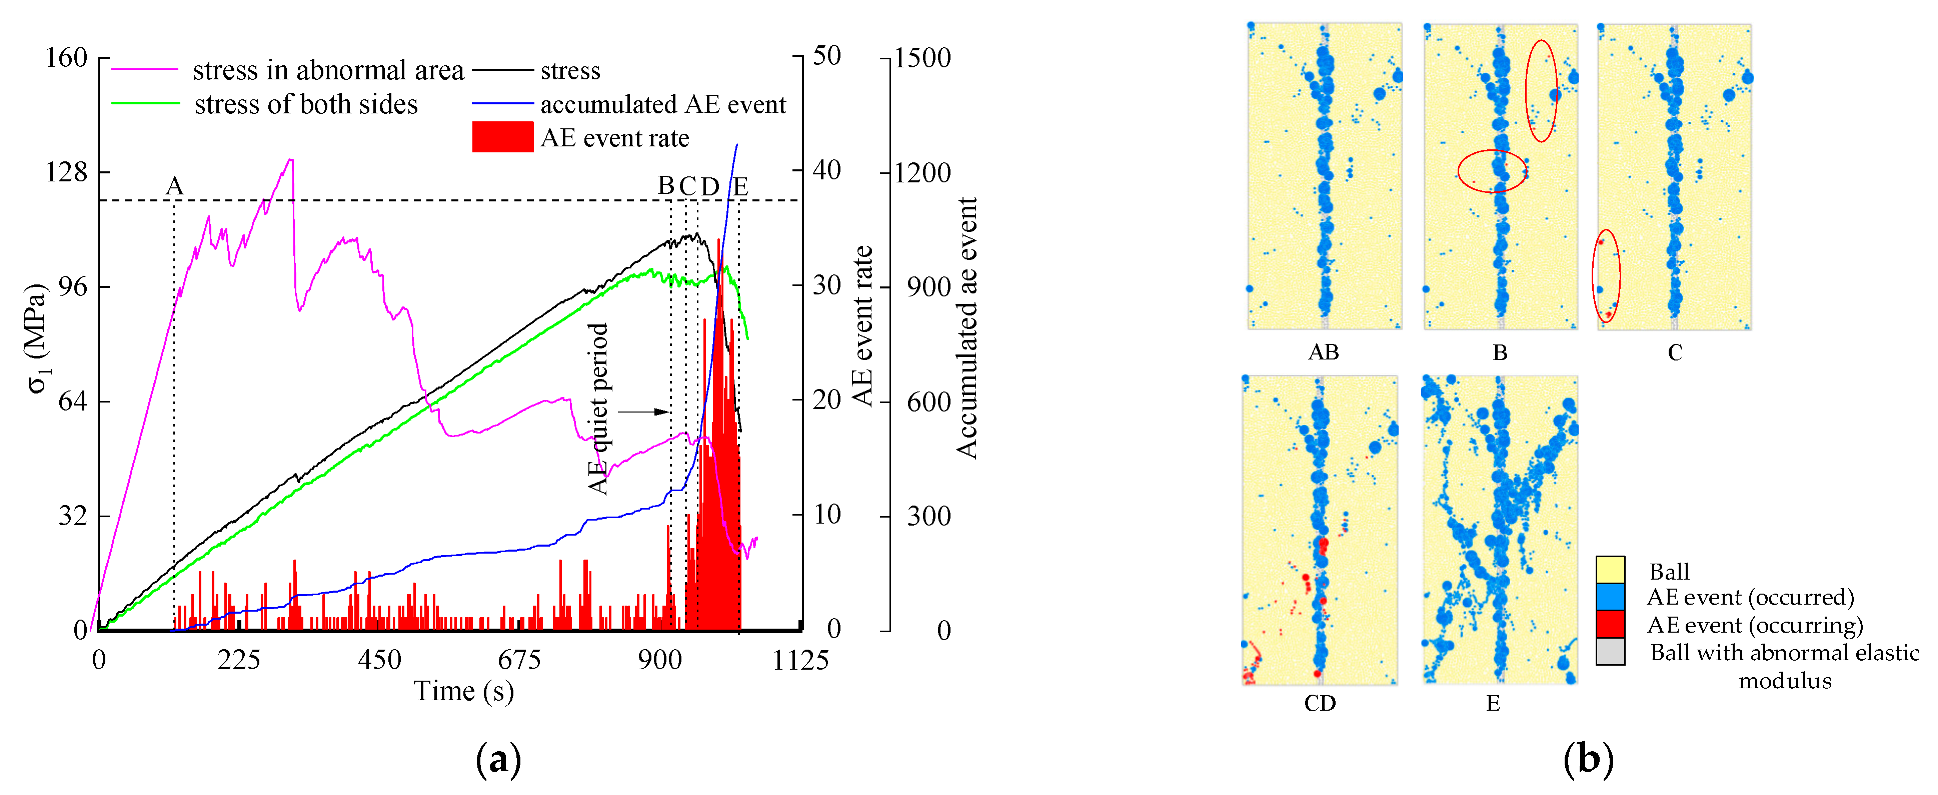
Stages A−B. The model is at the stage between the crack initiation stage and AE quiet period. In Figure 5a, Figure 6a, Figure 7a, Figure 8a and Figure 9a the axial stress of the elastic modulus abnormal area increased to the maximum value in the AB stage, the peak stress of the abnormal area is 120% of that of the model, and the time to reach the maximum stress is, respectively, 90.2%, 57.9%, 45.2%, 37.6%, and 32.4% of the peak time, then decrease gradually. In Figure 5b, Figure 6b, Figure 7b, Figure 8b and Figure 9b the AE events were mainly concentrated in the abnormal area of the elastic modulus, and a small amount of AE events was generated in the normal area; the ratio of AE quantity between the normal area and the abnormal area is about 1:20;
(c)
Point B. The moment was defined before the quiet period of AE. In Figure 5a, Figure 6a, Figure 7a, Figure 8a and Figure 9a, the axial stress in the abnormal area of the elastic modulus decreases rapidly, and the axial stress in the normal area increases gradually; this shows that the abnormal area of the elastic modulus loses more carrying capacity and mainly relies on the normal areas for support. In Figure 5b, Figure 6b, Figure 7b, Figure 8b and Figure 9b, AE events corresponding to moment B are all appeared within the normal area;
(d)
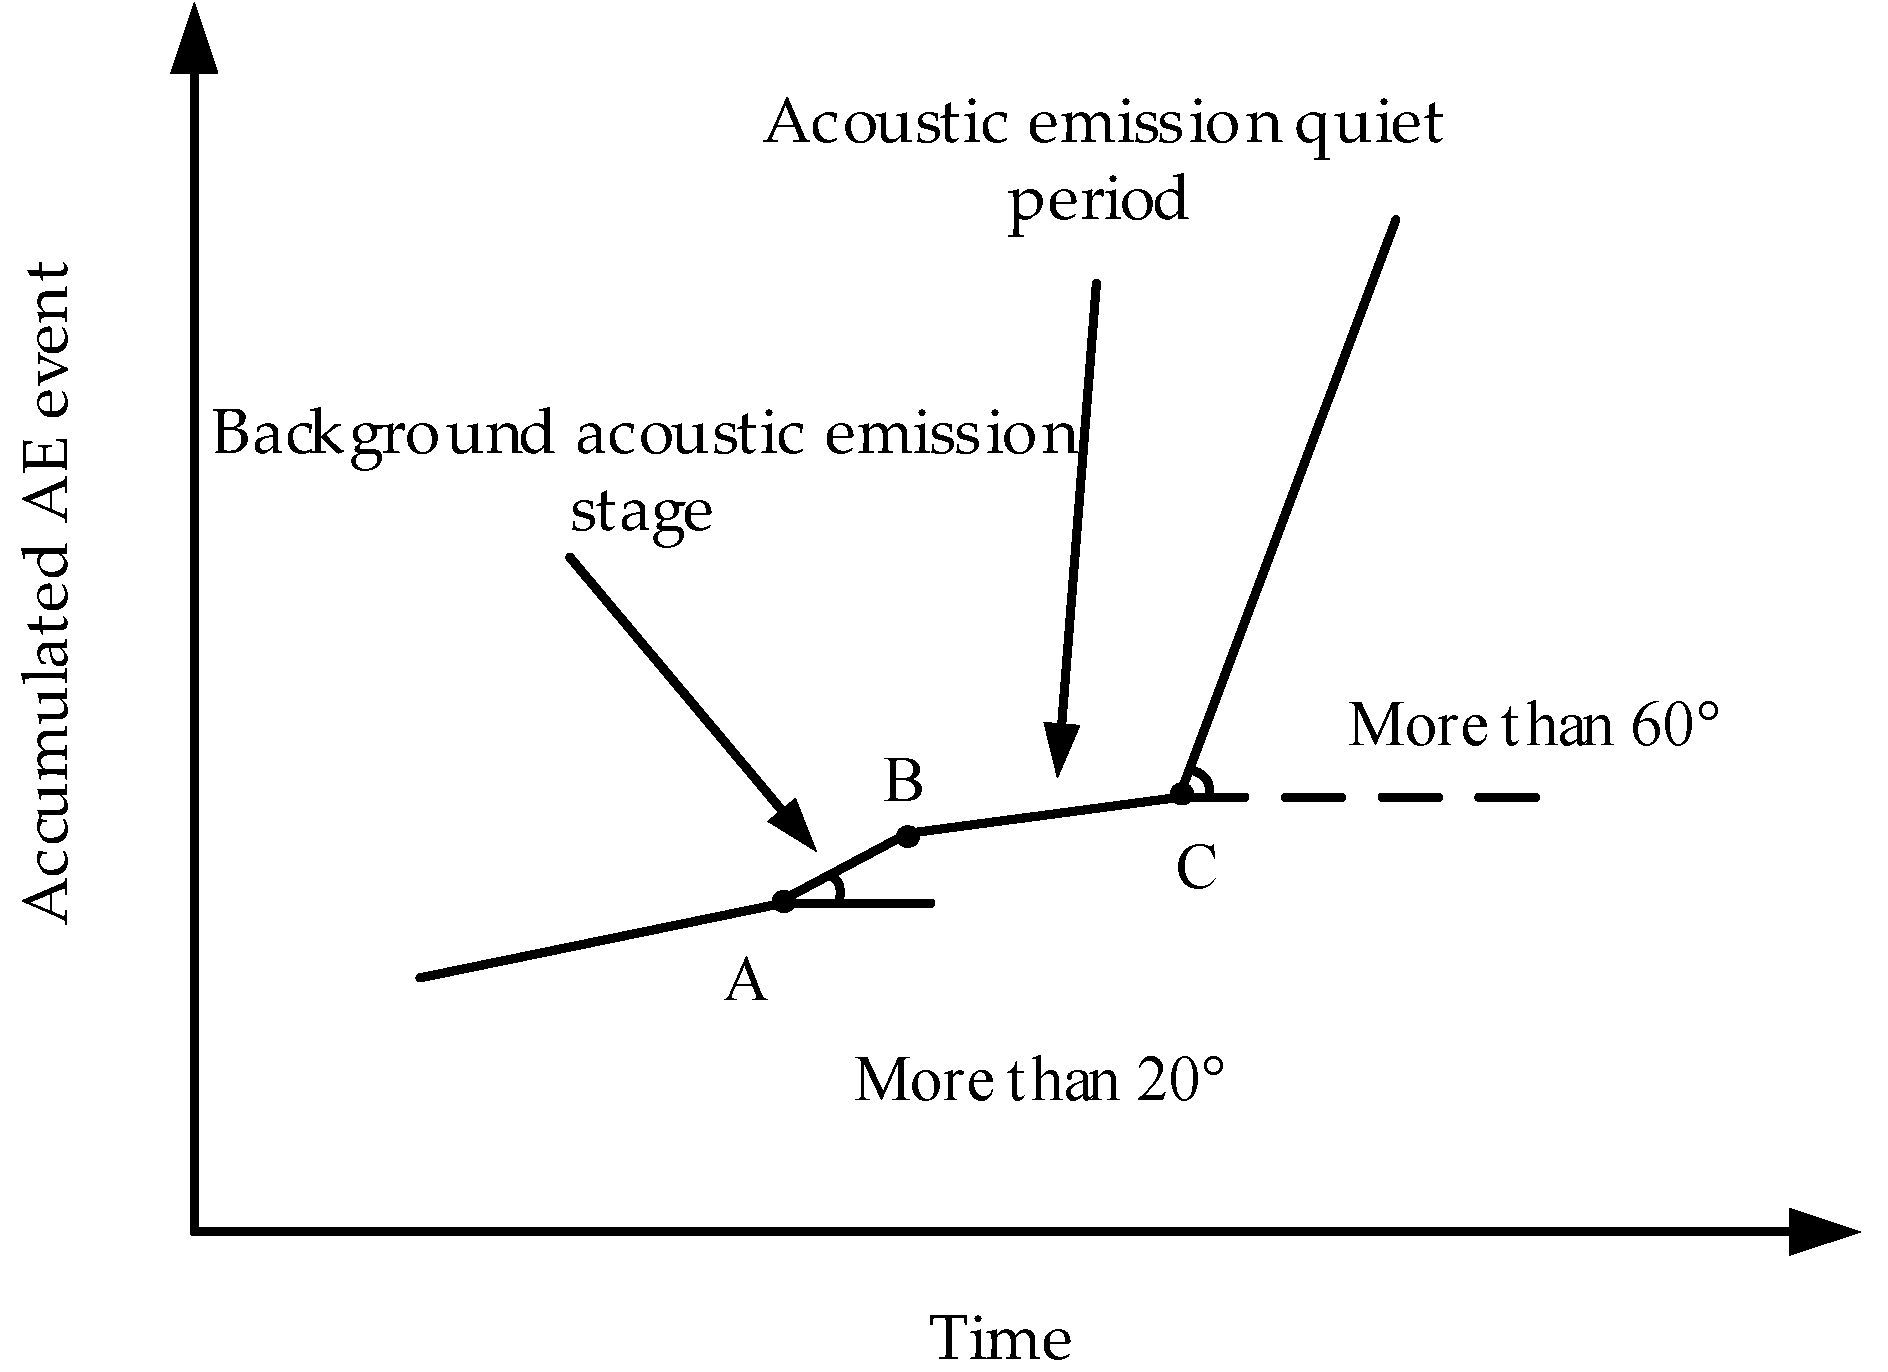
Stages B to C. The quiet period of AE occurs in this stage;
(e)
Point C. In Figure 5a, Figure 6a, Figure 7a, Figure 8a and Figure 9a, the axial stress in the abnormal area of the elastic modulus increased, and the axial stress in the normal area decreased. In Figure 5b, Figure 6b, Figure 7b, Figure 8b and Figure 9b, a small number of AE events were generated in the normal area of the elastic modulus, and a crack zone was initially formed in the abnormal area of the elastic modulus. With the increase in the elastic modulus, the formation of the crack zone became more obvious. The elastic modulus abnormal area basically loses carrying capacity;
(f)
Stages C to D. The AE quiet period was ended. In Figure 5a, Figure 6a, Figure 7a, Figure 8a and Figure 9a, the axial stress in the abnormal area of the elastic modulus decreased gradually, and the axial stress in the normal area increased rapidly. In Figure 5b, Figure 6b, Figure 7b, Figure 8b and Figure 9b, the normal area resisted the main axial pressure, and the abnormal area and the normal area produced more cracks and AE events. The shear crack was formed when the microcracks propagation and the more obvious shear cracks tended to be formed in the specimens with a larger elastic modulus;
(g)
Stages D to E. The rock model produces a macro fracture while the axial stress reaches its peak. In Figure 5a, Figure 6a, Figure 7a, Figure 8a and Figure 9a, the axial stress in the abnormal area and normal area are slowing rapidly. The AE event rate and the cumulative number of AE events increased rapidly. In Figure 5b, Figure 6b, Figure 7b, Figure 8b and Figure 9b, numerous cracks and AE events were generated, a huge fracture appeared in the center of the model, and the model was destroyed.

4. Discussion

Much research has shown the mechanical properties and the characteristics of AE in the rock plastic deformation stage, elastic–plastic deformation stage intimately connected to the AE quiet period [5,13], but there is insufficient research on the influence of the microscopic parameters on the AE quiet period. In this paper, the mechanical behavior and AE characteristics of rock in the failure process with an abnormal elastic modulus are simulated successfully, and the analysis of the simulation results follows.
In Figure 5, Figure 6, Figure 7, Figure 8 and Figure 9, whether or not the abnormal elastic modulus area exists in the center of the model, the AE quiet period exists before the peak stress. With the increase in the elastic modulus, the uniaxial compressive strength of the model has no obvious changes. When the elastic modulus was set to three times that of the normal area, the duration of the AE quiet period was the longest at 58 s. The duration of the AE quiet period without an abnormal elastic modulus area was the shortest at 9 s. The changes in the elastic modulus of the abnormal area had nearly no effect on AE events after peak stress.
At the initial stage of loading, the stress of rock was mainly concentrated in the elastic modulus abnormal area, and a quantity of AE events mainly concentrated on the abnormal elastic modulus area. The axial stress kept increasing in the normal area, but there were few cracks, and AE events appeared. As the loading continued, the abnormal area of the elastic modulus was gradually destroyed, and its axial stress was decreased. The normal area gradually appeared in AE. When the AE quiet period approached, the axial stress in the abnormal area of the elastic modulus increased slightly, which provided a certain bearing capacity. To study the stress changes in the elastic modulus abnormal area during the AE quiet period, the axial stress and strain in the abnormal area were normalized, and the results are shown in Figure 10. It can be observed that the axial stress in the abnormal area of elastic modulus increased by 2%–5% at this time. The abnormal area of the elastic modulus and the normal area were in a balanced state, and the rock was in the AE quiet period.
To quantify the AE quiet period more appropriately, based on the Z test method of the abnormal seismic activity frequency statistics [33], the AE events were accumulated to calculate the Z value variation law of the specimens in different elastic modulus abnormal areas. Before the quantification of the AE quiet period by a Z test, the AE quiet period should be defined. The cumulative AE curve can be simplified, as shown in Figure 11. Stage A to C is a period of time before the peak stress. Stage A to B is the period before the quiet period of the AE, during which the cumulative number of AE events increased slowly; this was considered the background AE stage. Stage B to C was the period of the AE quiet period in which the cumulative number of AE events remained unchanged. After point C, the cumulative number of AE events began to increase rapidly.
The Z−test quantified the significance of the quiet period mainly by evaluating the dispersion of a group of data relative to another group. It was used to describe the degree of reduction in the event rate in the quiet phase relative to the background AE stage. The Z value is used as the indicator of the significance of the AE quiet period, and it is calculated by Equation (2) [40].
Z = R 1 R 2 ( S 1 2 N 1 + S 2 2 N 2 )
where R1 is the average number of AE events in the AB stage of background AE, R2 is the average number of AE events in BC stage of quiet period, S1 is the standard deviation of the number of AE events in the AB stage of background AE, S2 is the standard deviation of AE event number in BC stage in quiet period, N1 is the total number of AE events at AB stage of back-ground AE, and N2 is the total number of AE events in the AB stage.
If Z ≤ 1.96, this indicated that there was no significant difference between the quiet period and background AE. If 1.96 ≤ Z ≤ 2.58, there was a significant difference, and if Z ≥ 2.58, there was a very significant difference.
Figure 12 shows the AE quiet period Z values of specimens with different elastic modulus. The Z value without abnormal area is the minimum of 1.1. the characteristics of the AE quiet period become less significant, the elastic modulus of the abnormal area was set to three times the normal area, the Z value reached the maximum of 6.08, and the AE quiet period is the most obvious. As the elastic modulus increases, the AE quiet period slowed down considerably and gradually tended to attain a stable value. The Z value is around 4. Therefore, combined with the mechanical properties and AE characteristics of heterogeneous components in rock, it can predict the failure of rock.

5. Conclusions

The distribution of different elastic modulus is an important factor concerned with the characteristics of the AE quiet period. An abnormal area of 2 × 100 mm2 was set at the center of the model, and it has two to six times the elastic modulus of the normal area. The evolution law of cracks and the characteristics of the AE quiet period were analyzed in detail. The main conclusions are as follows:
(1)
Before the occurrence of the main fracture of rock, the axial stress in the abnormal area increased maximum value, then decreased gradually; after the AE quiet period, it decreased rapidly. The axial stress on the normal area increased continuously;
(2)
Compared with homogeneous rocks, the AE quiet period of rocks with an abnormal elastic modulus is more significant. With elastic modulus increased, the time of rock failure and was increased, and the duration of the AE quiet period was prolonged one to five times. The Z value without abnormal area is the minimum of 1.1, and the elastic modulus of the abnormal area was set to three times the normal area, the Z value reaches the maximum of 6.08, and the AE quiet period is the most obvious. As the elastic modulus increases, the Z value is around 4. The distribution of different elastic modulus is an important factor concerning the characteristics of the AE quiet period;
(3)
At the initial stage of rock model loading, the axial stress in the abnormal area of elastic modulus increased rapidly, and the cracks and AE events were mainly concentrated on the abnormal area of the elastic modulus. The axial stress increased relatively slowly in the normal area, and a few cracks and AE events occurred. As the loading continued, the cracks gradually propagated from the abnormal area of the elastic modulus to the normal area. In the AE quiet period, the axial stress in the abnormal area of elastic modulus increased by 2%–5%. The abnormal area and normal area of elastic modulus were in the common loading state, which is the quiet period of AE.
The innovation of this study is to analyze the characteristics of AE in the process of rock failure with elastic modulus abnormal area. By extracting the stress changes of the walls during the loading process and combining the position of AE events in the model, the relationship between the different elastic modulus and the quiet period of the characteristics of AE was obtained.
This research has significance for the study of the theoretical basis of rock failure mechanisms and AE monitoring and warning. According to the difference in the elastic modulus in the rock sample, combined with the AE monitoring data, the rock with a failure precursor was identified and controlled in time to prevent major fracture failure.

Author Contributions

Conceptualization, K.Z. and W.W.; methodology, W.W.; software, W.W.; validation, W.W., P.Z.; formal analysis, P.Z.; investigation, P.Z.; resources, C.G.; data curation, W.W.; writing—original draft preparation, W.W.; writing—review and editing, W.W.; visualization, P.Z.; supervision, K.Z.; project administration, K.Z.; funding acquisition, K.Z. All authors have read and agreed to the published version of the manuscript.

Funding

This research was funded by the National Natural Science Foundation of China (grant No. 52164004, grant No. 52104086); This research was funded by Primary Research and Development Plan of Jiangxi Province (grant No. 20212BBG71009); This research was funded by Jiangxi Postdoctoral scientific research project (grant No. 2020KY39).

Institutional Review Board Statement

Not applicable.

Informed Consent Statement

Not applicable.

Data Availability Statement

Not applicable.

Acknowledgments

The authors would like to acknowledge the Jiangxi University of Science and Technology.

Conflicts of Interest

The authors declare no conflict of interest.

References

  1. Shiotani, T.; Ohtsu, M.; Ikeda, K. Detection and evaluation of AE waves due to rock deformation. Constr. Build. Mater. 2001, 15, 235–246. [Google Scholar] [CrossRef]
  2. Lockner, D. The role of acoustic emission in the study of rock fracture. Int. J. Rock Mech. Min. Sci. Geomech. Abstr. 1993, 30, 883–899. [Google Scholar] [CrossRef]
  3. Wang, T.; Wang, L.; Xue, F.; Xue, M. Identification of crack development in granite under triaxial compression based on the acoustic emission signal. Int. J. Distrib. Sens. Netw. 2021, 17, 1550147720986116. [Google Scholar] [CrossRef]
  4. Meng, Q.; Chen, Y.; Zhang, M.; Han, L.; Pu, H.; Liu, J. On the Kaiser effect of rock under cyclic loading and unloading conditions: Insights from acoustic emission monitoring. Energies 2019, 12, 3255. [Google Scholar] [CrossRef] [Green Version]
  5. Yin, X.G.; Li, S.L.; Tang, H.Y.; Pei, J.L. Study on quiet period and its fractal characteristics of rock failure acoustic emission. Chin. J. Rock Mech. Eng. 2009, 28, 3383–3390. [Google Scholar]
  6. Hardy, H.R. Application of acoustic emission techniques to rock mechanics research. In Acoustic Emission, ASTM STP; ASTM International: West Conshohocken, PA, USA, 1972; Volume 505, pp. 41–83. [Google Scholar]
  7. Liu, D.; Jiang, S.; Tang, Y. Mechanical Properties of Metasandstone under Uniaxial Graded Cyclic Loading and Unloading. Appl. Sci. 2022, 12, 6310. [Google Scholar] [CrossRef]
  8. Liu, D.; Tang, Y.; Cao, M. Nondestructive testing on cumulative damage of watery fractured rock mass under multiple cycle blasting. Eng. Fract. Mech. 2021, 254, 107914. [Google Scholar] [CrossRef]
  9. Zhong, W.; Ouyang, J.; Yang, D. Effect of the in situ leaching solution of ion-absorbed rare earth on the mechanical behavior of basement rock. J. Rock Mech. Geotech. Eng. 2021. [Google Scholar] [CrossRef]
  10. Manthei, G.; Eisenblätter, J. Acoustic emission in study of rock stability. In Acoustic Emission Testing; Springer: New York, NY, USA, 2008; pp. 239–310. [Google Scholar]
  11. Rudajev, V.; Vilhelm, J.; Lokajíček, T. Laboratory studies of acoustic emission prior to uniaxial compressive rock failure. Int. J. Rock Mech. Min. Sci. 2000, 37, 699–704. [Google Scholar] [CrossRef]
  12. Zhao, X.D.; Tang, C.A.; Li, Y.H.; Yuan, R.; Zhang, J.Y. Study on AE activity characteristics under uniaxial compression loading. Chin. J. Rock Mech. Eng. 2006, 25, 3673–3678. [Google Scholar]
  13. Li, S.L.; Zhou, M.J.; Gao, Z.P.; Chen, D.X.; Zhang, J.L.; Hu, J.Y. Experimental study on acoustic emission characteristics before the peak strength of rocks under incrementally cyclic loading-unloading methods. Chin. J. Rock Mech. Eng. 2019, 38, 724–735. [Google Scholar]
  14. Wu, Y.; Li, X.Z.; Huang, Z.; Xue, S. Effect of temperature on physical, mechanical and acoustic emission properties of Beishan granite, Gansu Province, China. Nat. Hazards 2021, 107, 1577–1592. [Google Scholar] [CrossRef]
  15. Su, G.; Gan, W.; Zhai, S.; Zhao, G. Acoustic emission precursors of static and dynamic instability for coarse-grained hard rock. J. Cent. South Univ. 2020, 27, 2883–2898. [Google Scholar] [CrossRef]
  16. Manouchehrian, A.; Sharifzadeh, M.; Marji, M.F.; Gholamnejad, J. A bonded particle model for analysis of the flaw orientation effect on crack propagation mechanism in brittle materials under compression. Arch. Civ. Mech. Eng. 2014, 14, 40–52. [Google Scholar] [CrossRef]
  17. Grasselli, G.; Zhao, Q.; Lisjak, A.; Liu, Q. Numerical simulation of acoustic emission in rocks using FEM/DEM. In Rock Dynamics and Applications-State of the Art; CRC Press: Boca Raton, FL, USA, 2013; p. 149. [Google Scholar]
  18. Yousefpour, N.; Pouragha, M. Prediction of the post-failure behavior of rocks: Combining artificial intelligence and acoustic emission sensing. Int. J. Numer. Anal. Methods Geomech. 2022, 46, 1874–1894. [Google Scholar] [CrossRef]
  19. Liang, D.; Zhang, N.; Rong, H. An Experimental and Numerical Study on Acoustic Emission in the Process of Rock Damage at Different Stress Paths. Geofluids 2021, 2021, 8047755. [Google Scholar] [CrossRef]
  20. Manouchehrian, A.; Cai, M. Simulation of unstable rock failure under unloading conditions. Can. Geotech. J. 2015, 53, 22–34. [Google Scholar] [CrossRef]
  21. Peng, J.; Wong, L.N.Y. The, C.I. Influence of grain size on strength of polymineralic crystalline rock: New insights from DEM grain-based modeling. J. Rock Mech. Geotech. Eng. 2021, 13, 755–766. [Google Scholar] [CrossRef]
  22. Potyondy, D.O.; Cundall, P.A. A bonded-particle model for rock. Int. J. Rock Mech. Min. Sci. 2004, 41, 1329–1364. [Google Scholar] [CrossRef]
  23. Potyondy, D.O. The bonded-particle model as a tool for rock mechanics research and application: Current trends and future directions. Geosystem Eng. 2015, 18, 1–28. [Google Scholar] [CrossRef]
  24. Hazzard, J.F.; Young, R.P. Simulating acoustic emissions in bonded-particle models of rock. Int. J. Rock Mech. Min. Sci. 2000, 37, 867–872. [Google Scholar] [CrossRef]
  25. Hazzard, J.F.; Young, R.P. Moment tensors and micromechanical models. Tectonophysics 2002, 356, 181–197. [Google Scholar] [CrossRef]
  26. Li, X.F.; Li, H.B.; Liu, L.W.; Liu, Y.Q.; Ju, M.H.; Zhao, J. Investigating the crack initiation and propagation mechanism in brittle rocks using grain-based finite-discrete element method. Int. J. Rock Mech. Min. Sci. 2020, 127, 104219. [Google Scholar] [CrossRef]
  27. Liu, W.; Liu, J.; Zhu, C. Multi-scale effect of acoustic emission characteristics of 3D rock damage. Arab. J. Geosci. 2019, 12, 668. [Google Scholar] [CrossRef]
  28. Bu, F.; Xue, L.; Zhai, M.; Huang, X.; Dong, J.; Liang, N.; Xu, C. Evaluation of the characterization of acoustic emission of brittle rocks from the experiment to numerical simulation. Sci. Rep. 2022, 12, 498. [Google Scholar] [CrossRef] [PubMed]
  29. Meng, Y.; Jing, H.; Liu, X.; Yin, Q.; Wei, X. Experimental and numerical investigation on the effects of bedding plane properties on the mechanical and acoustic emission characteristics of sandy mudstone. Eng. Fract. Mech. 2021, 245, 107582. [Google Scholar] [CrossRef]
  30. Wang, Z.; Li, Y.; Cai, W.; Zhu, W.; Kong, W.; Dai, F.; Wang, K. Crack propagation process and acoustic emission characteristics of rock-like specimens with double parallel flaws under uniaxial compression. Theor. Appl. Fract. Mech. 2021, 114, 102983. [Google Scholar] [CrossRef]
  31. Jafari Mohammadabadi, B.; Shahriar, K.; Jalalifar, H.; Ahangari, K. Numerical Simulation for Predicting the Anisotropy of Faryab Cromite Rock Using PFC Software. J. Anal. Numer. Methods Min. Eng. 2021, 11, 23–35. [Google Scholar]
  32. Nguyen, N.H.; Bui, H.H.; Nguyen, G.D.; Kodikara, J. A cohesive damage-plasticity model for DEM and its application for numerical investigation of soft rock fracture properties. Int. J. Plast. 2017, 98, 175–196. [Google Scholar] [CrossRef]
  33. Goodman, R.E. Introduction to Rock Mechanics; Wiley: New York, NY, USA, 1989. [Google Scholar]
  34. Davarpanah, S.M.; Ván, P.; Vásárhelyi, B. Investigation of the relationship between dynamic and static deformation moduli of rocks. Geomech. Geophys. Geo-Energy Geo-Resour. 2020, 6, 29. [Google Scholar] [CrossRef] [Green Version]
  35. Yang, X.D.; Sun, L.H.; Song, J.L.; Yang, B.S.; Lan, C.R.; He, Q.F. Study on the effect of bond strength on the failure mode of coarse-grained sandstone in weakly cemented stratum. Minerals 2022, 12, 55. [Google Scholar] [CrossRef]
  36. Vallejos, J.A.; Salinas, J.M.; Delonca, A.; Mas Ivars, D. Calibration and verification of two bonded-particle models for simulation of intact rock behavior. Int. J. Geomech. 2017, 17, 06016030. [Google Scholar] [CrossRef]
  37. Jarolin, K.; Dosta, M. Linearization-based methods for the calibration of bonded-particle models. Comput. Part. Mech. 2021, 8, 511–523. [Google Scholar] [CrossRef]
  38. Li, G.; Bodahi, F.; He, T.; Luo, F.; Duan, S.; Li, M. Sensitivity Analysis of Macroscopic Mechanical Behavior to Microscopic Parameters Based on PFC Simulation. Geotech. Geol. Eng. 2022, 40, 3633–3641. [Google Scholar] [CrossRef]
  39. Zhou, Y.; Wu, S.; Xu, X.; Sun, W.; Zhang, X. Particle flow analysis of ae characteristics during rock failure process. Chin. J. Rock Mech. Eng. 2013, 32, 951–959. [Google Scholar]
  40. Habermann, R.E. Precursory seismic quiescence: Past, present, and future. Pure Appl. Geophys. 1988, 126, 279–318. [Google Scholar] [CrossRef]
Figure 1. Bonded−particle models.
Minerals 12 00956 g001
Figure 2. Laboratory test and numerical simulation. (a) Rock specimens (b) Numerical simulation results.
Minerals 12 00956 g002
Figure 3. Rock model with abnormal elastic modulus and results of uniaxial compression test. (a) Elastic modulus abnormal area rock model; (b) Axial stress−time of rock with different elastic modulus.
Minerals 12 00956 g003
Figure 4. Numerical simulation results. (a) Stress and AE events of specimens with homogeneous rock specimens; (b) AE events distribution at different stages of the specimen.
Minerals 12 00956 g004
Figure 5. Numerical simulation results. (a) Stress and AE events of specimens with abnormal elastic modulus of 40 GPa; (b) AE events distribution at different stages of the specimen.
Minerals 12 00956 g005
Figure 6. Numerical simulation results. (a) Stress and AE events of specimens with abnormal elastic modulus of 60 GPa; (b) AE events distribution at different stages of the specimen.
Minerals 12 00956 g006
Figure 7. Numerical simulation results. (a) Stress and AE events of specimens with abnormal elastic modulus of 80 GPa; (b) AE events distribution at different stages of the specimen.
Minerals 12 00956 g007
Figure 8. Numerical simulation results. (a) Stress and AE events of specimens with abnormal elastic modulus of 100 GPa; (b)AE events distribution at different stages of the specimen.
Minerals 12 00956 g008
Figure 9. Numerical simulation results. (a) Stress and AE events of specimens with abnormal elastic modulus of 120 GPa; (b) AE events distribution at different stages of the specimen.
Minerals 12 00956 g009
Figure 10. The axial stress of abnormal area in AE quiet period.
Minerals 12 00956 g010
Figure 11. Definition of AE quiet period.
Minerals 12 00956 g011
Figure 12. Z values of different elastic modulus specimens.
Minerals 12 00956 g012
Table 1. Uniaxial compression test results.
Rock Samples NumberPeak Stress
(MPa)
Elastic Modulus
(GPa)
Poisson’s Ratio
H−1123.5729.240.21
H−2114.9729.090.18
H−3135.8430.140.20
H−4150.2236.170.23
Table 2. Meso mechanical parameters of calculation model.
Microscopic ParameterValueMicroscopic ParameterValue
Particle size ratio0.25Radius factor of PBM1
Porosity0.16Normal−shear stiffness ratio of PBM 1.8
Local damping coefficient0.7Effective modulus of PBM20
Friction coefficient0.577Tensile strength of PBM5.4 × 106
Particle density/Kg/m32500Cohesion of PBM6.4 × 106
Publisher’s Note: MDPI stays neutral with regard to jurisdictional claims in published maps and institutional affiliations.

