Article

Hyperbolic Secant Subsidence Prediction Model under Thick Loose Layer Mining Area

1
College of Geoscience and Surveying Engineering, China University of Mining and Technology-Beijing, Beijing 100083, China
2
School of Spatial Information and Geomatics Engineering, Anhui University of Science and Technology, Huainan 232001, China
3
Zhejiang Geology and Mineral Construction Co., Ltd., Geological Exploration Bureau of Zhejiang Province, Hangzhou 310052, China
4
Anhui Provincial Bureau of Coal Geology, Hefei 230088, China
*
Author to whom correspondence should be addressed.
Minerals 2022, 12(8), 1023; https://doi.org/10.3390/min12081023
Submission received: 14 July 2022 / Revised: 8 August 2022 / Accepted: 11 August 2022 / Published: 14 August 2022
(This article belongs to the Special Issue Green Mining of Coal Mine in China)

Abstract

:
In China, as a major resource, coal has made great contributions to national energy security and social development. The mining of coal resources can cause surface subsidence damage, and in particular, the mining of coal resources in thick loose layer mines is the most serious. How to accurately predict the surface subsidence caused by coal mining in thick loose layer mines has become an urgent problem to be solved. To solve this problem, numerical simulations based on the measured data were used to reveal that the thickness of the loose layer is the intrinsic mechanism that affects the value of the surface subsidence and the large range of subsidence. On this basis, the hyperbolic secant function is used as the influence function of unit mining to derive the expected model of subsidence under thick loose layer conditions: the hyperbolic secant subsidence prediction model. Compared with the probability integral method, the hyperbolic secant subsidence prediction model’s prediction accuracy RMSE value is improved by 38%. The hyperbolic secant subsidence prediction model can realize accurate estimation of the subsidence value in the thick loose layer mine area. This greatly enriches the mining subsidence prediction theory and provides a scientific basis for the assessment of surface damage and ecological environment restoration after coal seam mining under a thick loose seam mining area.

1. Introduction

In the north, central, and east of China, thick loose layer mines of different thicknesses are widely distributed [1,2]. For example, the maximum thickness of the loose layer is 200 m in the Sujiatun mine in Northeast China, 350 m in the Pingdingshan mine in central China, and 460 m in the Huainan mine in East China [3,4]. The strength of the loose layer soil is small, and the loose layer cannot play a supporting role when disturbed by mining activities or even as a load on top of the bedrock [5]. The difference in physical properties makes the surface subsidence in loose seam mines show special characteristics such as a large subsidence value and range of subsidence when affected by coal mining activities [6,7,8]. The surface subsidence of the thick loose layer mine is shown in Figure 1. The special characteristics of surface subsidence in loose seam mines cause more serious damage to surface farmland, road facilities, and buildings [9,10,11,12]. The serious damage caused by mining production has aggravated the conflict with people's lives. If the subsidence value is predicted to be too large and excessive measures are taken to protect buildings, unnecessary expenses will be added. If the prediction of the subsidence value is too small and too few measures are taken to protect buildings, the safety of people's lives and properties will be threatened. Therefore, accurate prediction of the surface subsidence value under thick loose layer mines is of great practical significance for the safe and economic protection of mine buildings.
Mine subsidence prediction is one of the core elements in the field of mining subsidence [13,14]. Commonly used methods for predicting surface subsidence mainly include empirical methods based on actual measurement data, theoretical simulation methods, and impact function methods. The empirical method can only be applied to similar mining areas. Marino used empirical methods based on surface subsidence data to make a reasonable prediction of the surface movement deformation caused by the longwall method of mining [15]. The theoretical simulation method is applied to determine the physical and mechanical parameters of the rock body. Dudek developed a finite element model of a sharply inclined coal seam based on a mine site in Spain. The surface subsidence values are predicted according to the established model, and the comparison of the subsidence values obtained from numerical simulation with the measured values verifies the feasibility of the method in the prediction of sharply inclined coal seams [16]. The influence function method is a method between the empirical method and the theoretical simulation method [17,18]. Currently, the influence function method is the more popular prediction method. Experts and scholars in the field of mining subsidence have conducted a series of studies on the mining influence function method. Liu et al. developed the probability integral method based on the stochastic medium theory. The formulas for predicting surface subsidence caused by near-surface tunnel excavation, coal seam mining, and open-pit project excavation were derived using the normal distribution function as the influence function of the mining unit [19,20]. Ghabraie proposes a conceptualized characterization of multi-seam subsidence based on a study of subsidence observations in Australian multi-seam mining and uses this characterization to improve the commonly used influence function method. The improved influence function method, Discrete-IFM, is used for surface subsidence due to multi-seam mining [21]. He et al. derived the surface subsidence prediction formula based on treating the damaged rock mass as an anisotropic compressible continuous medium. The Weibull distribution density function was used as the influence function of the mining unit, and the surface settlement prediction equation was derived [22]. Guo et al. introduced the equivalent mining height theory into the field of infill mining based on the analysis of the subsidence characteristics of coal seams mined by solid infill. The equivalence mining thickness theory was combined with the probability integral method to derive the subsidence prediction equation for infill mining [23]. Yan et al. constructed a surface subsidence prediction equation using the lognormal function as the influence function of the mining unit based on the analysis of the surface point skewed subsidence characteristics [24]. Yan et al. analyzed the phenomenon that the maximum subsidence value in loose seam mines is greater than the thickness of coal seam mining. The spatial compression theory of rock seams combined with the probability integral method was used to derive a prediction formula for surface subsidence in thick loose seam mines [25]. Dai et al. derived a prediction formula for surface subsidence under integrated mechanized mining and thick loose layer conditions [26]. Zhao et al. combined the probability integral method with the theory of rock movement to calculate the subsidence in the stratigraphic zone and the additional subsidence in the side slope zone based on the slip principle. An accurate prediction of surface subsidence is achieved based on the location of the side slope [27]. Perzylo et al. introduced time variables to construct an instantaneous surface subsidence prediction formula based on the assumption of classical influence functions [28].
However, the above formula for predicting surface subsidence was derived under the assumption that the overlying rock is a single medium. Due to the large difference in strength between the loose layer and the rock layer, using the formula under this assumption to predict the surface subsidence under a thick loose layer mine will result in the phenomenon that the maximum and boundary subsidence values are difficult to match with the actual subsidence values at the same time. In view of this, the authors treat thick loose layers and bedrock as two different media. The hyperbolic secant function is used as the basis to construct the mining unit influence function. The subsidence prediction model of the thick loose layer is constructed according to the principle of equal influence superposition: the hyperbolic secant subsidence prediction model. The model has a high prediction accuracy in the thick loose layer mining area. It provides data support for the assessment of surface damage and ecological environment restoration after coal seam mining under a thick loose seam mining area. The research not only enriches the theory of mining subsidence prediction and deepens the understanding of the basic laws of mining subsidence, but also enables reasonable protection measures to be taken to effectively deal with the surface damage.

2. Materials and Methods

2.1. Overview of the Study Area and Acquisition of Subsidence Data

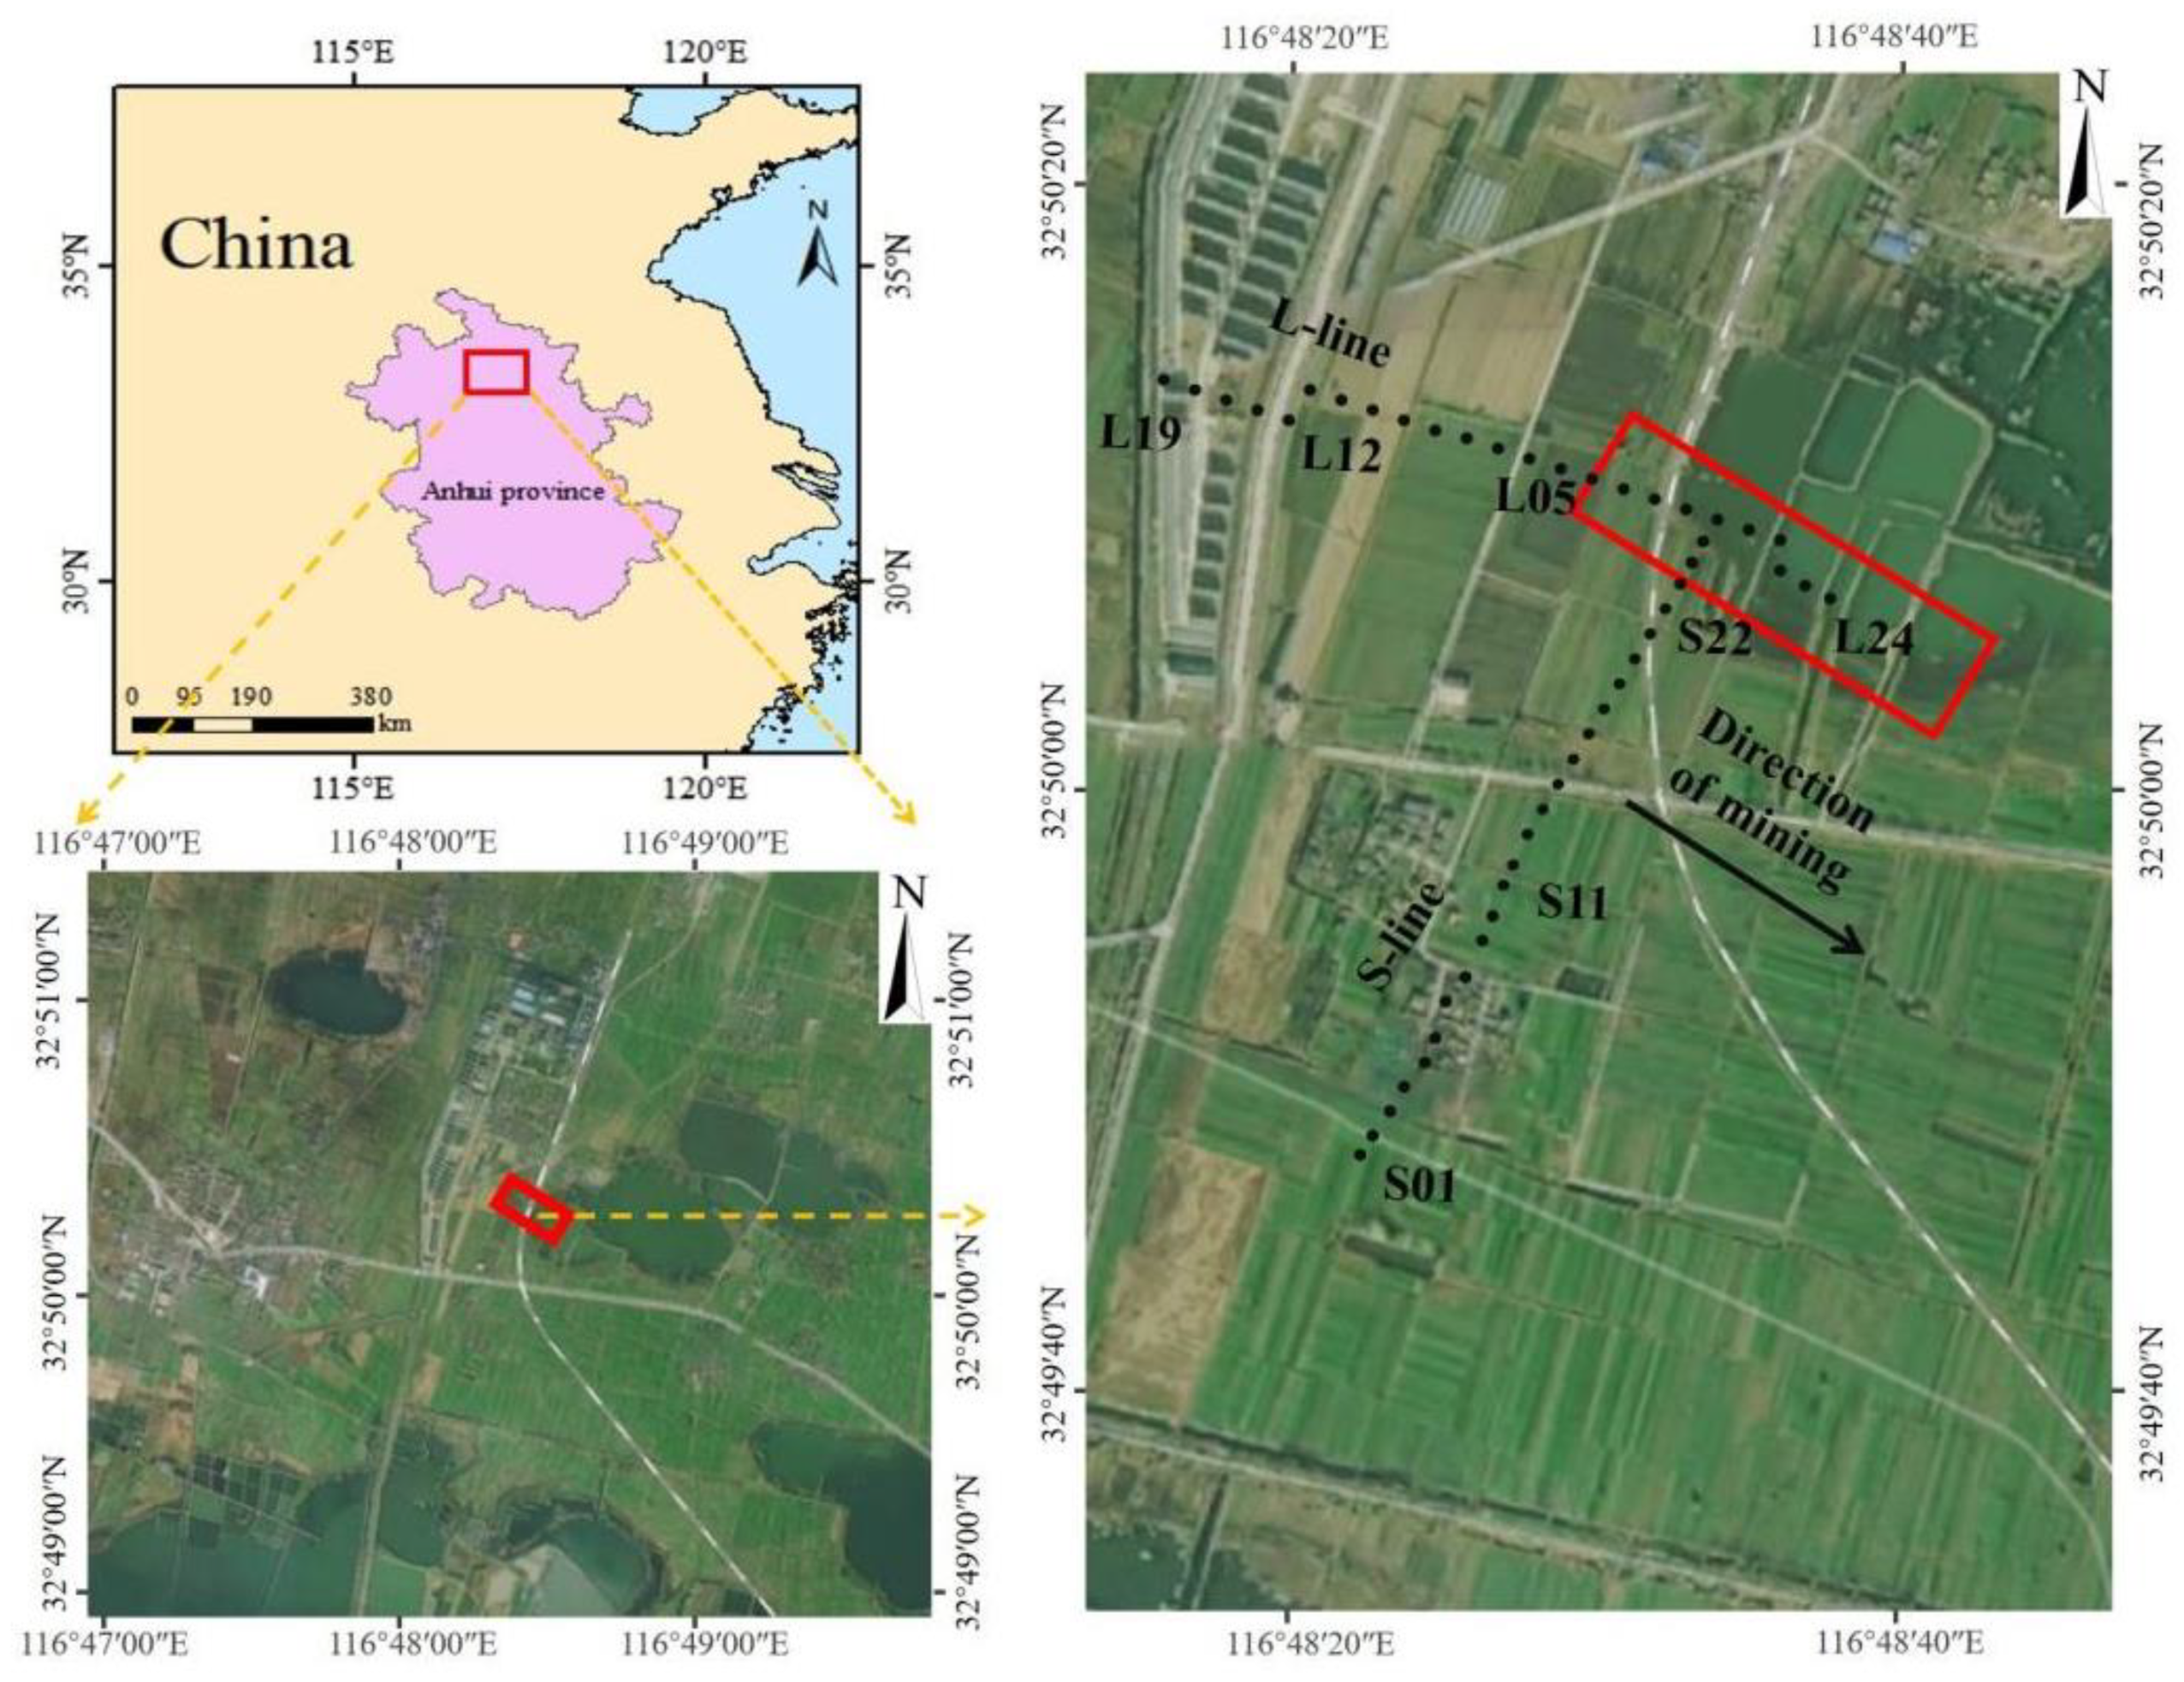
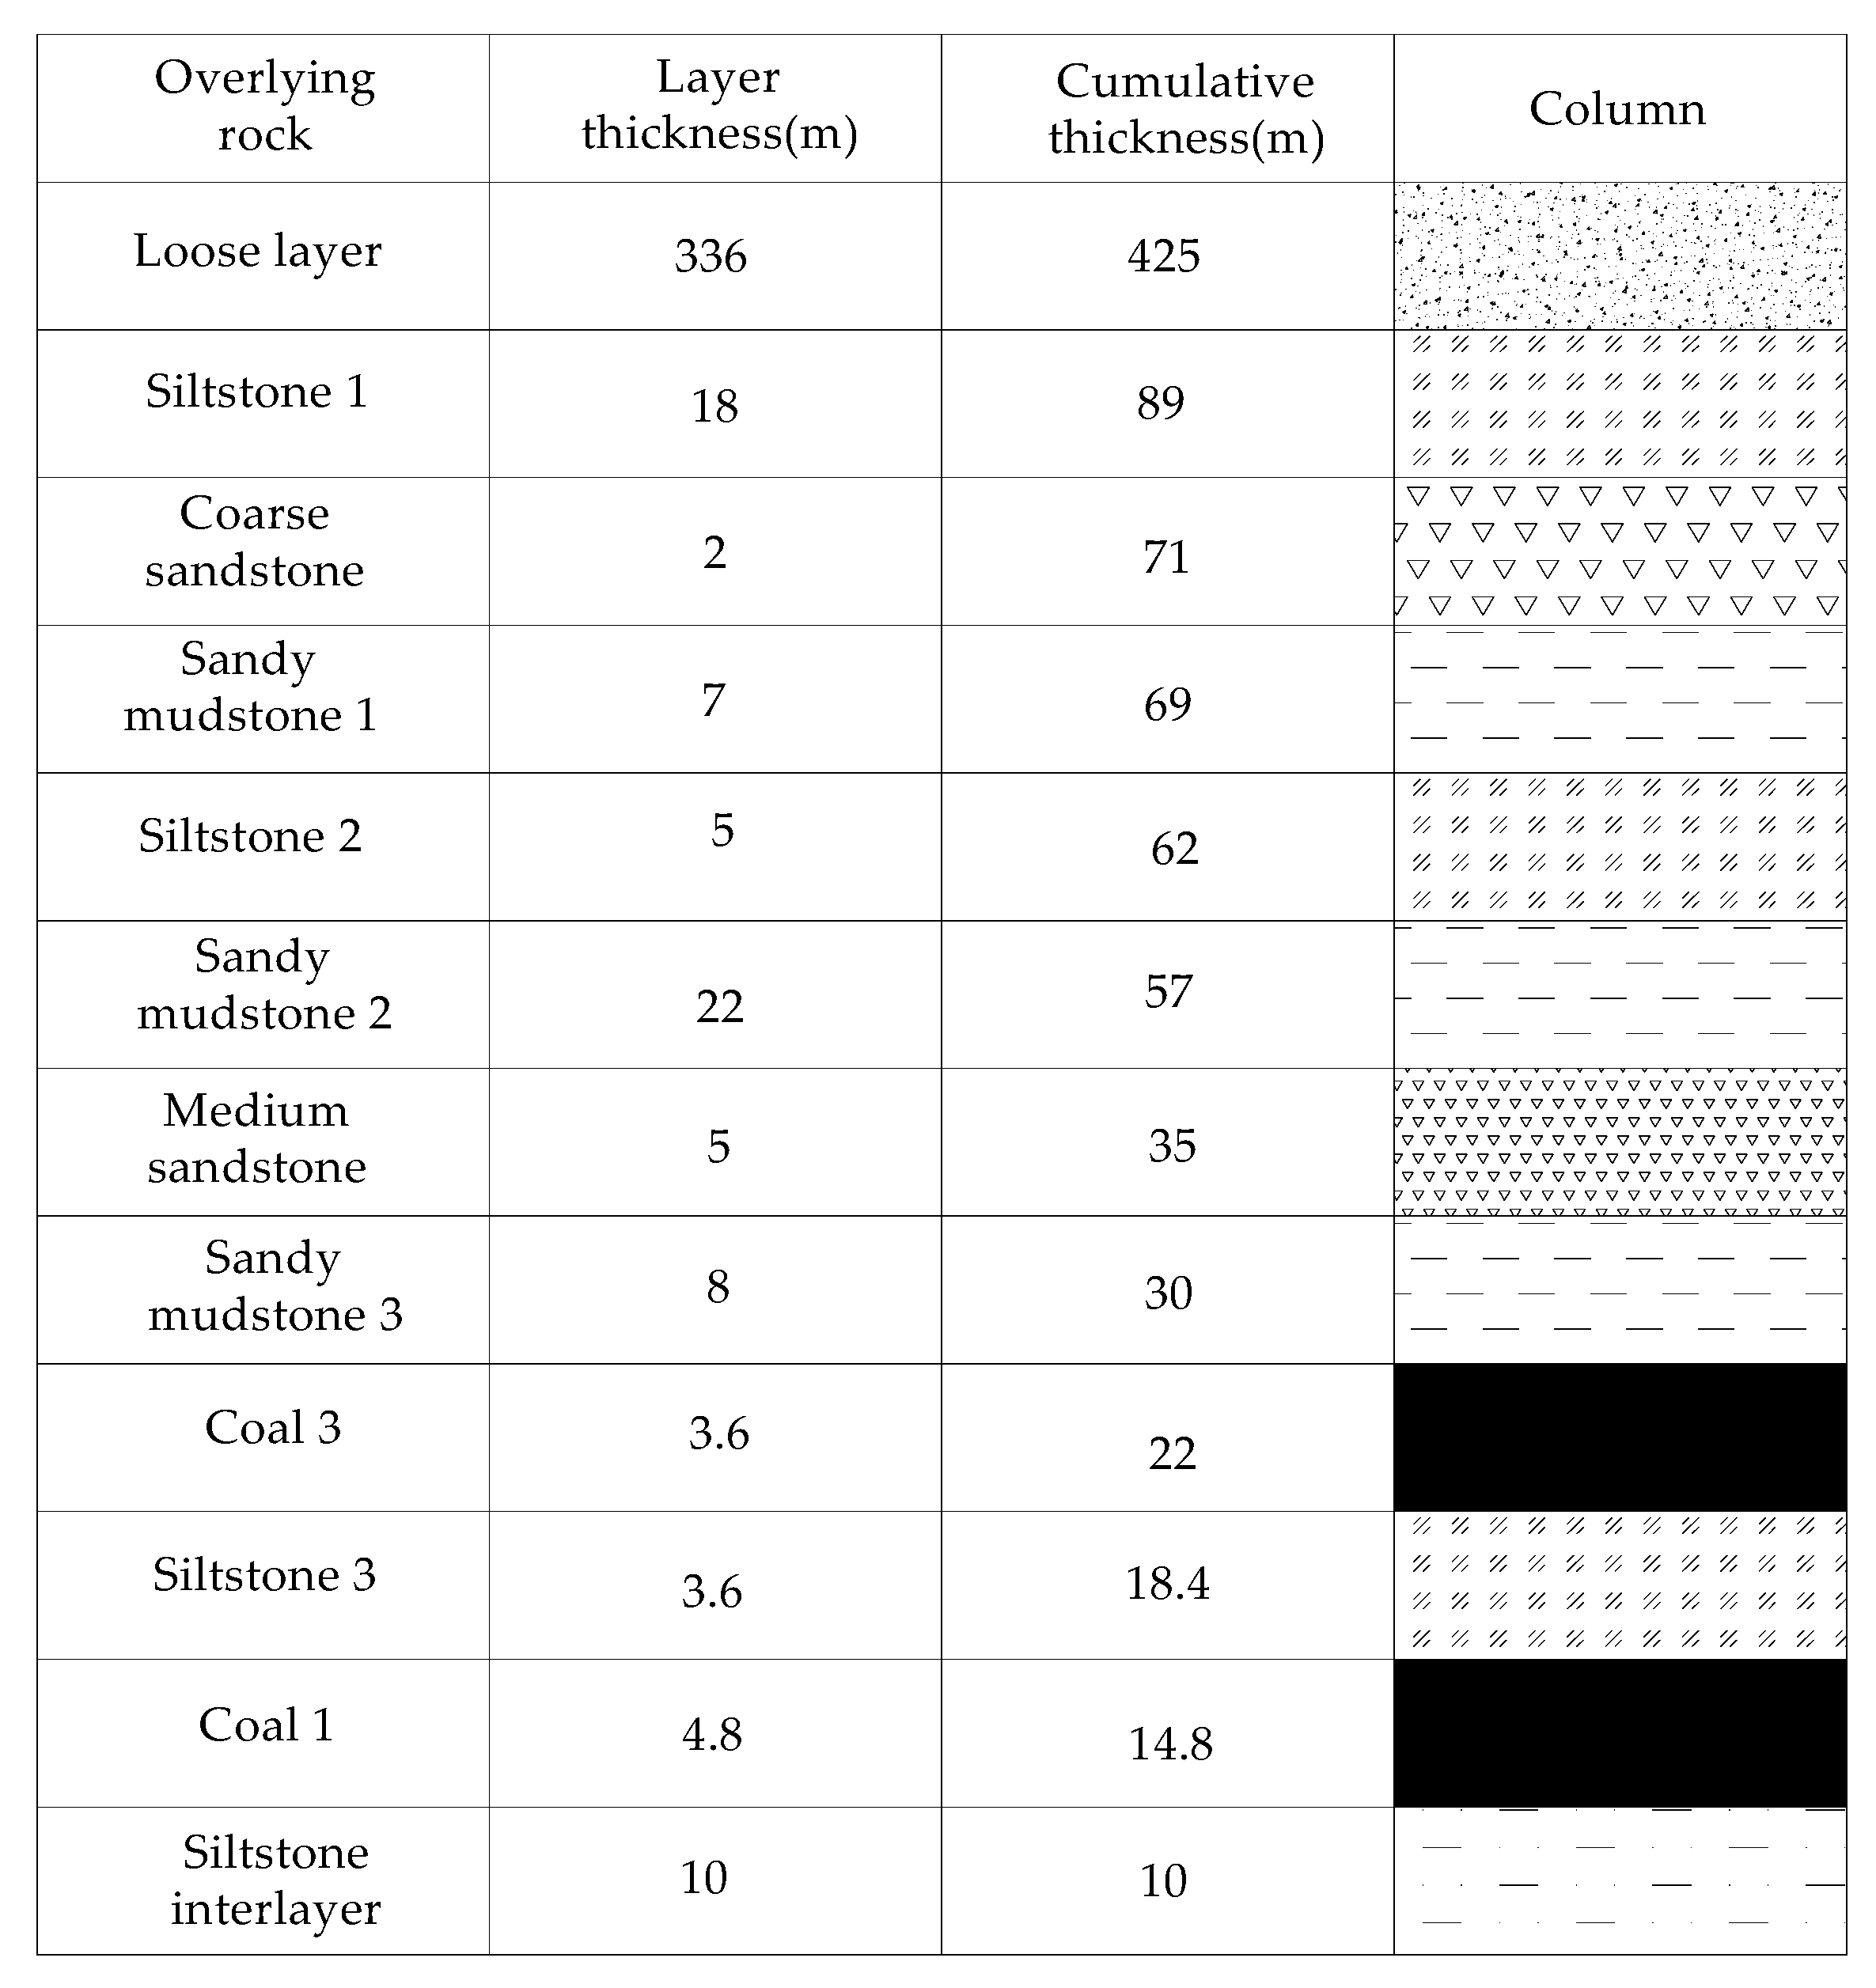
2.1.1. Overview of the Study Area

The 11111 working face of Pansidong Mine is located northwest of Huainan City, Anhui Province, China. The ground topography of the workings is simple and plain, with an average ground elevation of +22.2 m. The faults in this mine area are mainly divided into two categories: one is the reverse fault, which is in line with the direction of F66 and F72 faults, and the other is the positive fault, which is in line with the direction of F1 fault. The shallow groundwater of the Eocene Quaternary is submerged, pressurized water and is recharged by atmospheric precipitation and surface water bodies. The working face has a strike length of 410 m, an inclination width of 145 m, and a mining depth of 392~413 m, with an average of about 403 m, the thickness of the Quaternary loose layer is 336 m, and it is typical of mining under thick loose layer conditions. The working face is mined by integrated coal release, and the working face is managed by the collapse method of roofing. The dip angle of the coal seam is 6°. The average thickness of the coal seam is 4.8 m.
In order to further study the surface movement deformation law under thick loose layer conditions to provide theoretical support for the later production activities in the mine, comprehensive site conditions above the working face laid half of the strike observation line and half of the inclination observation line, and the observation line laid a total of 50 monitoring points. There were 24 monitoring points in the strike direction (L-line) and 26 monitoring points in the inclination direction (S-line) for observation of surface monitoring points during the duration of surface movement. The relative position of the working face and the monitoring points are shown in Figure 2.

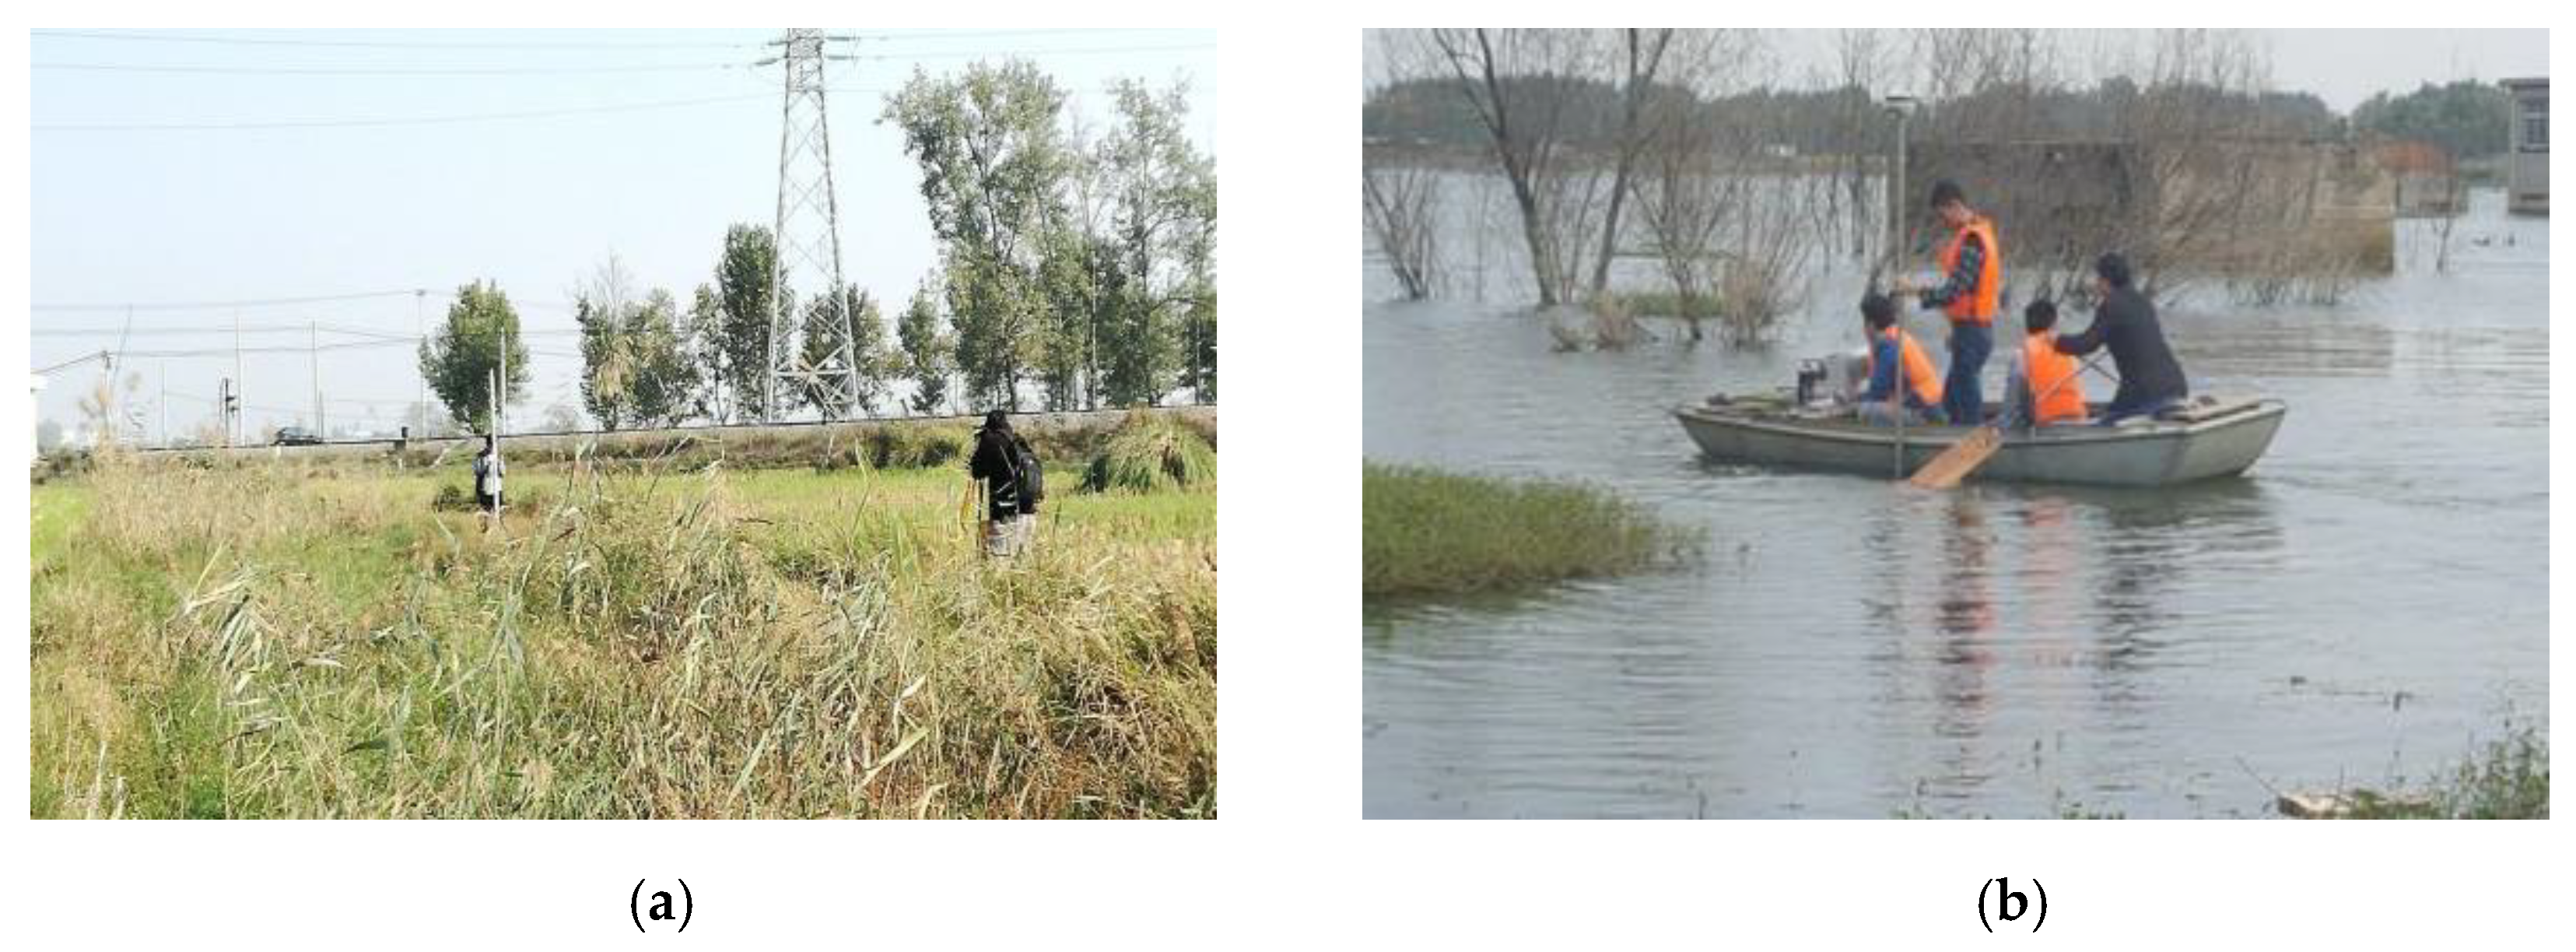
2.1.2. Acquisition of Subsidence Data

The data collection of 11111 working face monitoring points started from April 2016 to the end of the last comprehensive observation in July 2017, and the observation time lasted 427 days in total. The measurement cycle covered the whole surface movement process. A total of 15 measurement tasks were carried out during the surface movement, of which 12 were carried out by level measurement. The level measurement was carried out in accordance with the relevant specifications of the fourth class level measurement. The maximum subsidence point and nearby monitoring points were submerged in water during the late stage of monitoring point measurements. For the underwater monitoring points, a depth sounder and GPS receiver were combined to measure the underwater monitoring points. The measurement process of monitoring points is shown in Figure 3.

2.2. Hyperbolic Secant Subsidence Prediction Model Construction

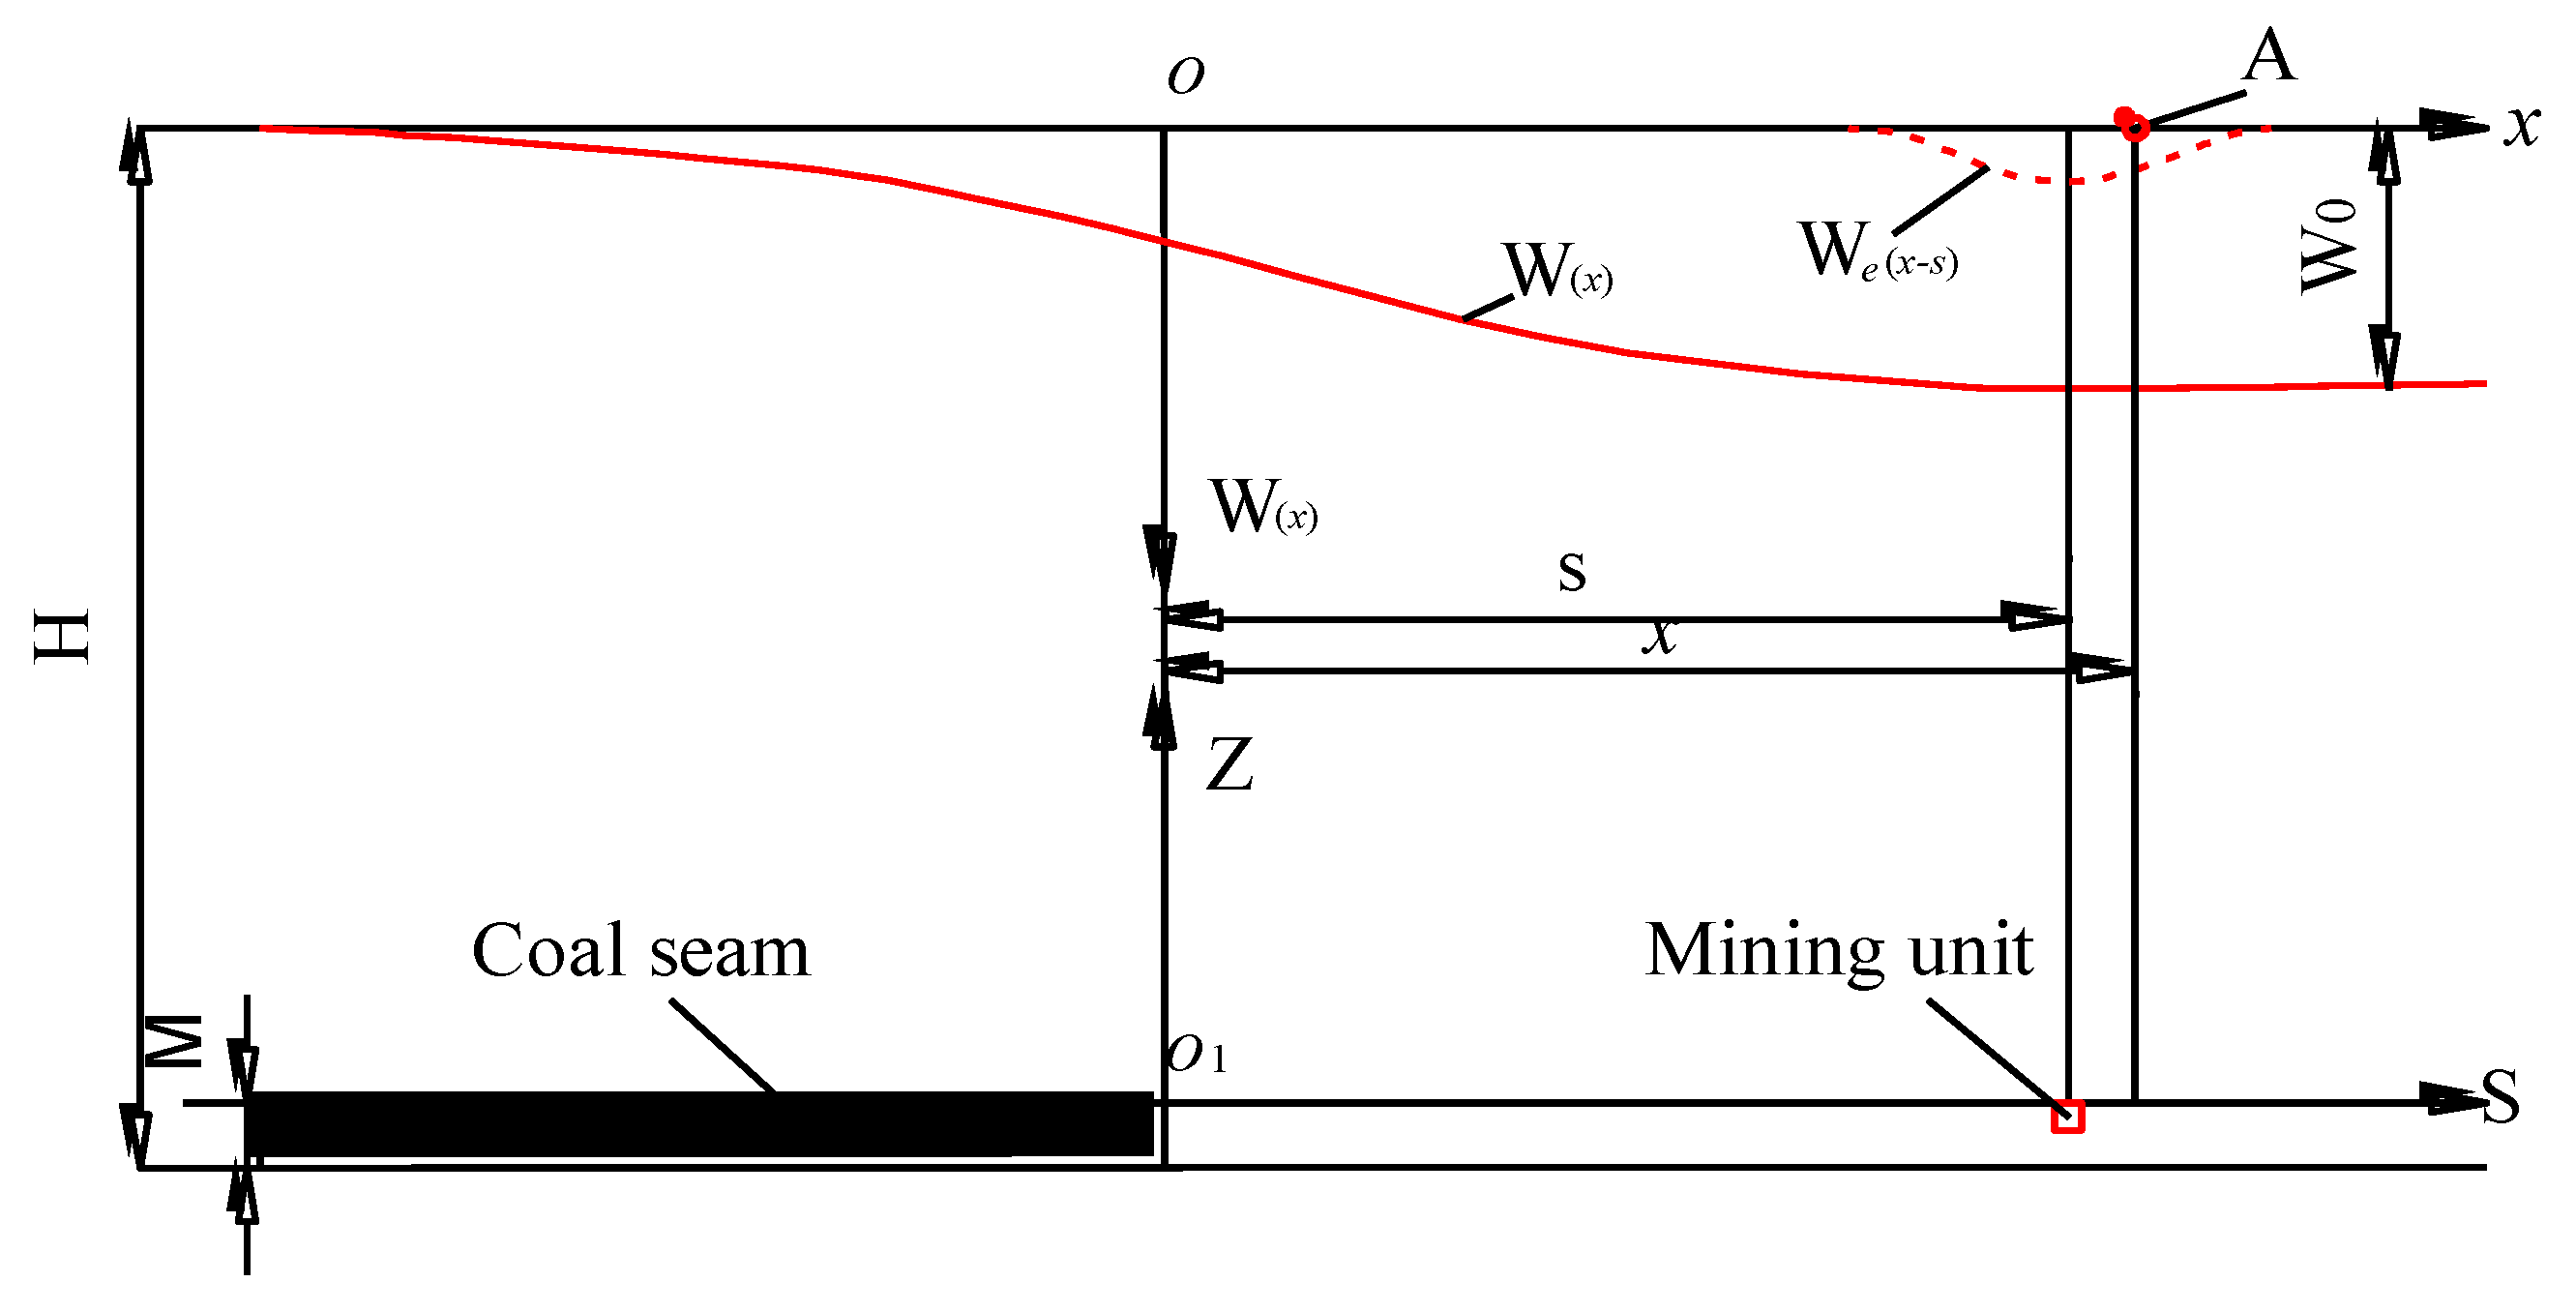
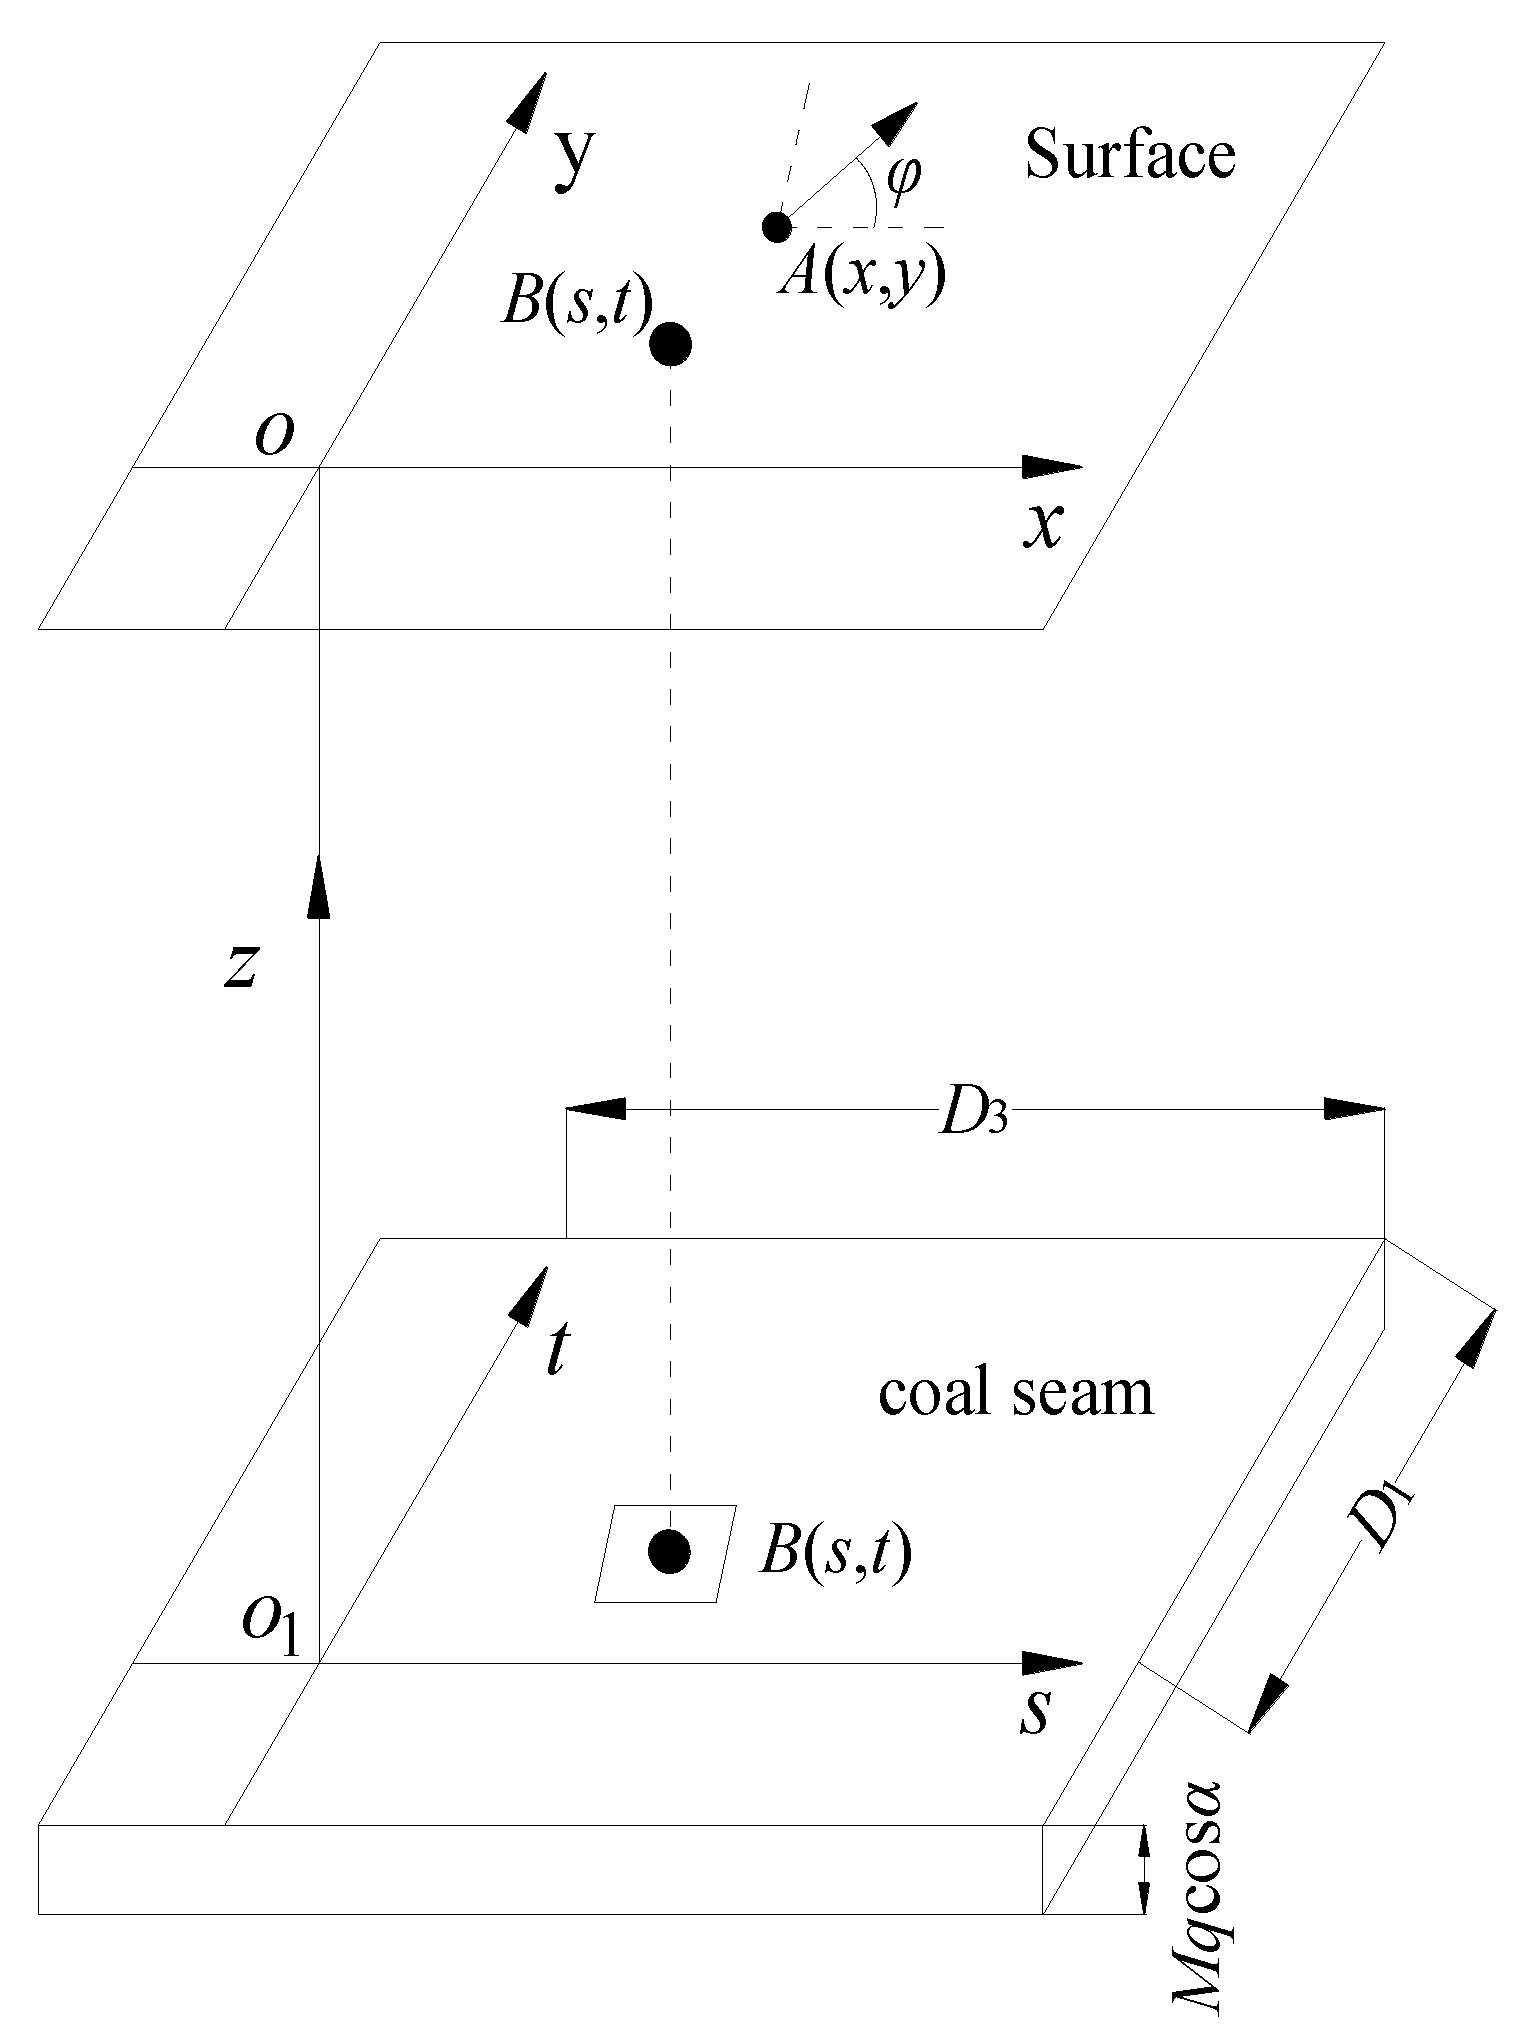
2.2.1. Surface Subsidence during Mining Unit

The hyperbolic functions are generally used for solving linear differential equations. The hyperbolic secant function is one of the hyperbolic functions and its mathematical formula is shown in Equation (1) [29]. The mining unit influence function based on the hyperbolic secant function is shown in Equation (2) [30,31].
s e c h x = 2 e x + e x
W e ( x ) = 1 R s e c h 2 ( 2 x R )
where x is the distance from the surface point to the coordinate origin, and R is the major influence radius.
In this paper, two mining unit influence functions with different parameters, R, are superimposed and combined in a linear proportion to construct a new unit mining subsidence prediction function. The constructed subsidence prediction function is shown in Equation (3).
W e ( x ) = ( 1 P ) 1 R 1 s e c h 2 ( 2 x R 1 ) + P 1 R 2 s e c h 2 ( 2 x R 2 )
where P is the ratio factor, R1 and R2 are the main influence radii of the two mining units.
The relationship between the main influence radii R1, R2, and the unit mining subsidence values is shown in Figure 4. From Figure 4, it can be seen that the maximum subsidence value and the subsidence boundary can be made to fit better at the same time by adjusting R1 and R2. It makes up for the deficiency of the probability integral method and difficulty meeting the maximum subsidence value and the better fit near the subsidence boundary at the same time in the thick loose layer mine.

2.2.2. Surface Subsidence during Semi-Infinite Mining

The schematic diagram for calculating the surface subsidence of semi-infinite mining is shown in Figure 5. The subsidence value of any point A on the surface with the horizontal coordinate x is W(x). If the horizontal coordinate of the mining unit is s, the subsidence value of any point A on the surface with the horizontal coordinate x is We(x-s). The subsidence value caused by the entire semi-infinite mining unit is Equation (4).
d W e ( x ) = ( 1 P ) 1 R 1 s e c h 2 ( 2 x R 1 ) d s + P 1 R 2 s e c h 2 ( 2 x R 2 ) d s
In semi-infinite mining, the subsidence value of any point A on the surface is the sum of the subsidence values caused by the mining of each unit in the range s = 0→+∞. The subsidence of point A is obtained by the integral transformation in Equation (5).
W ( x ) = W 0 0 + d W e ( x ) d s = ( 1 P ) W 0 1 + e 4 x / R 1 + P W 0 1 + e 4 x / R 2
where W 0 is the maximum subsidence value, W 0 has to be calculated as W 0 = M q cos α , M is the mining thickness, q is the subsidence factor, and α is the dip angle of the coal seam.

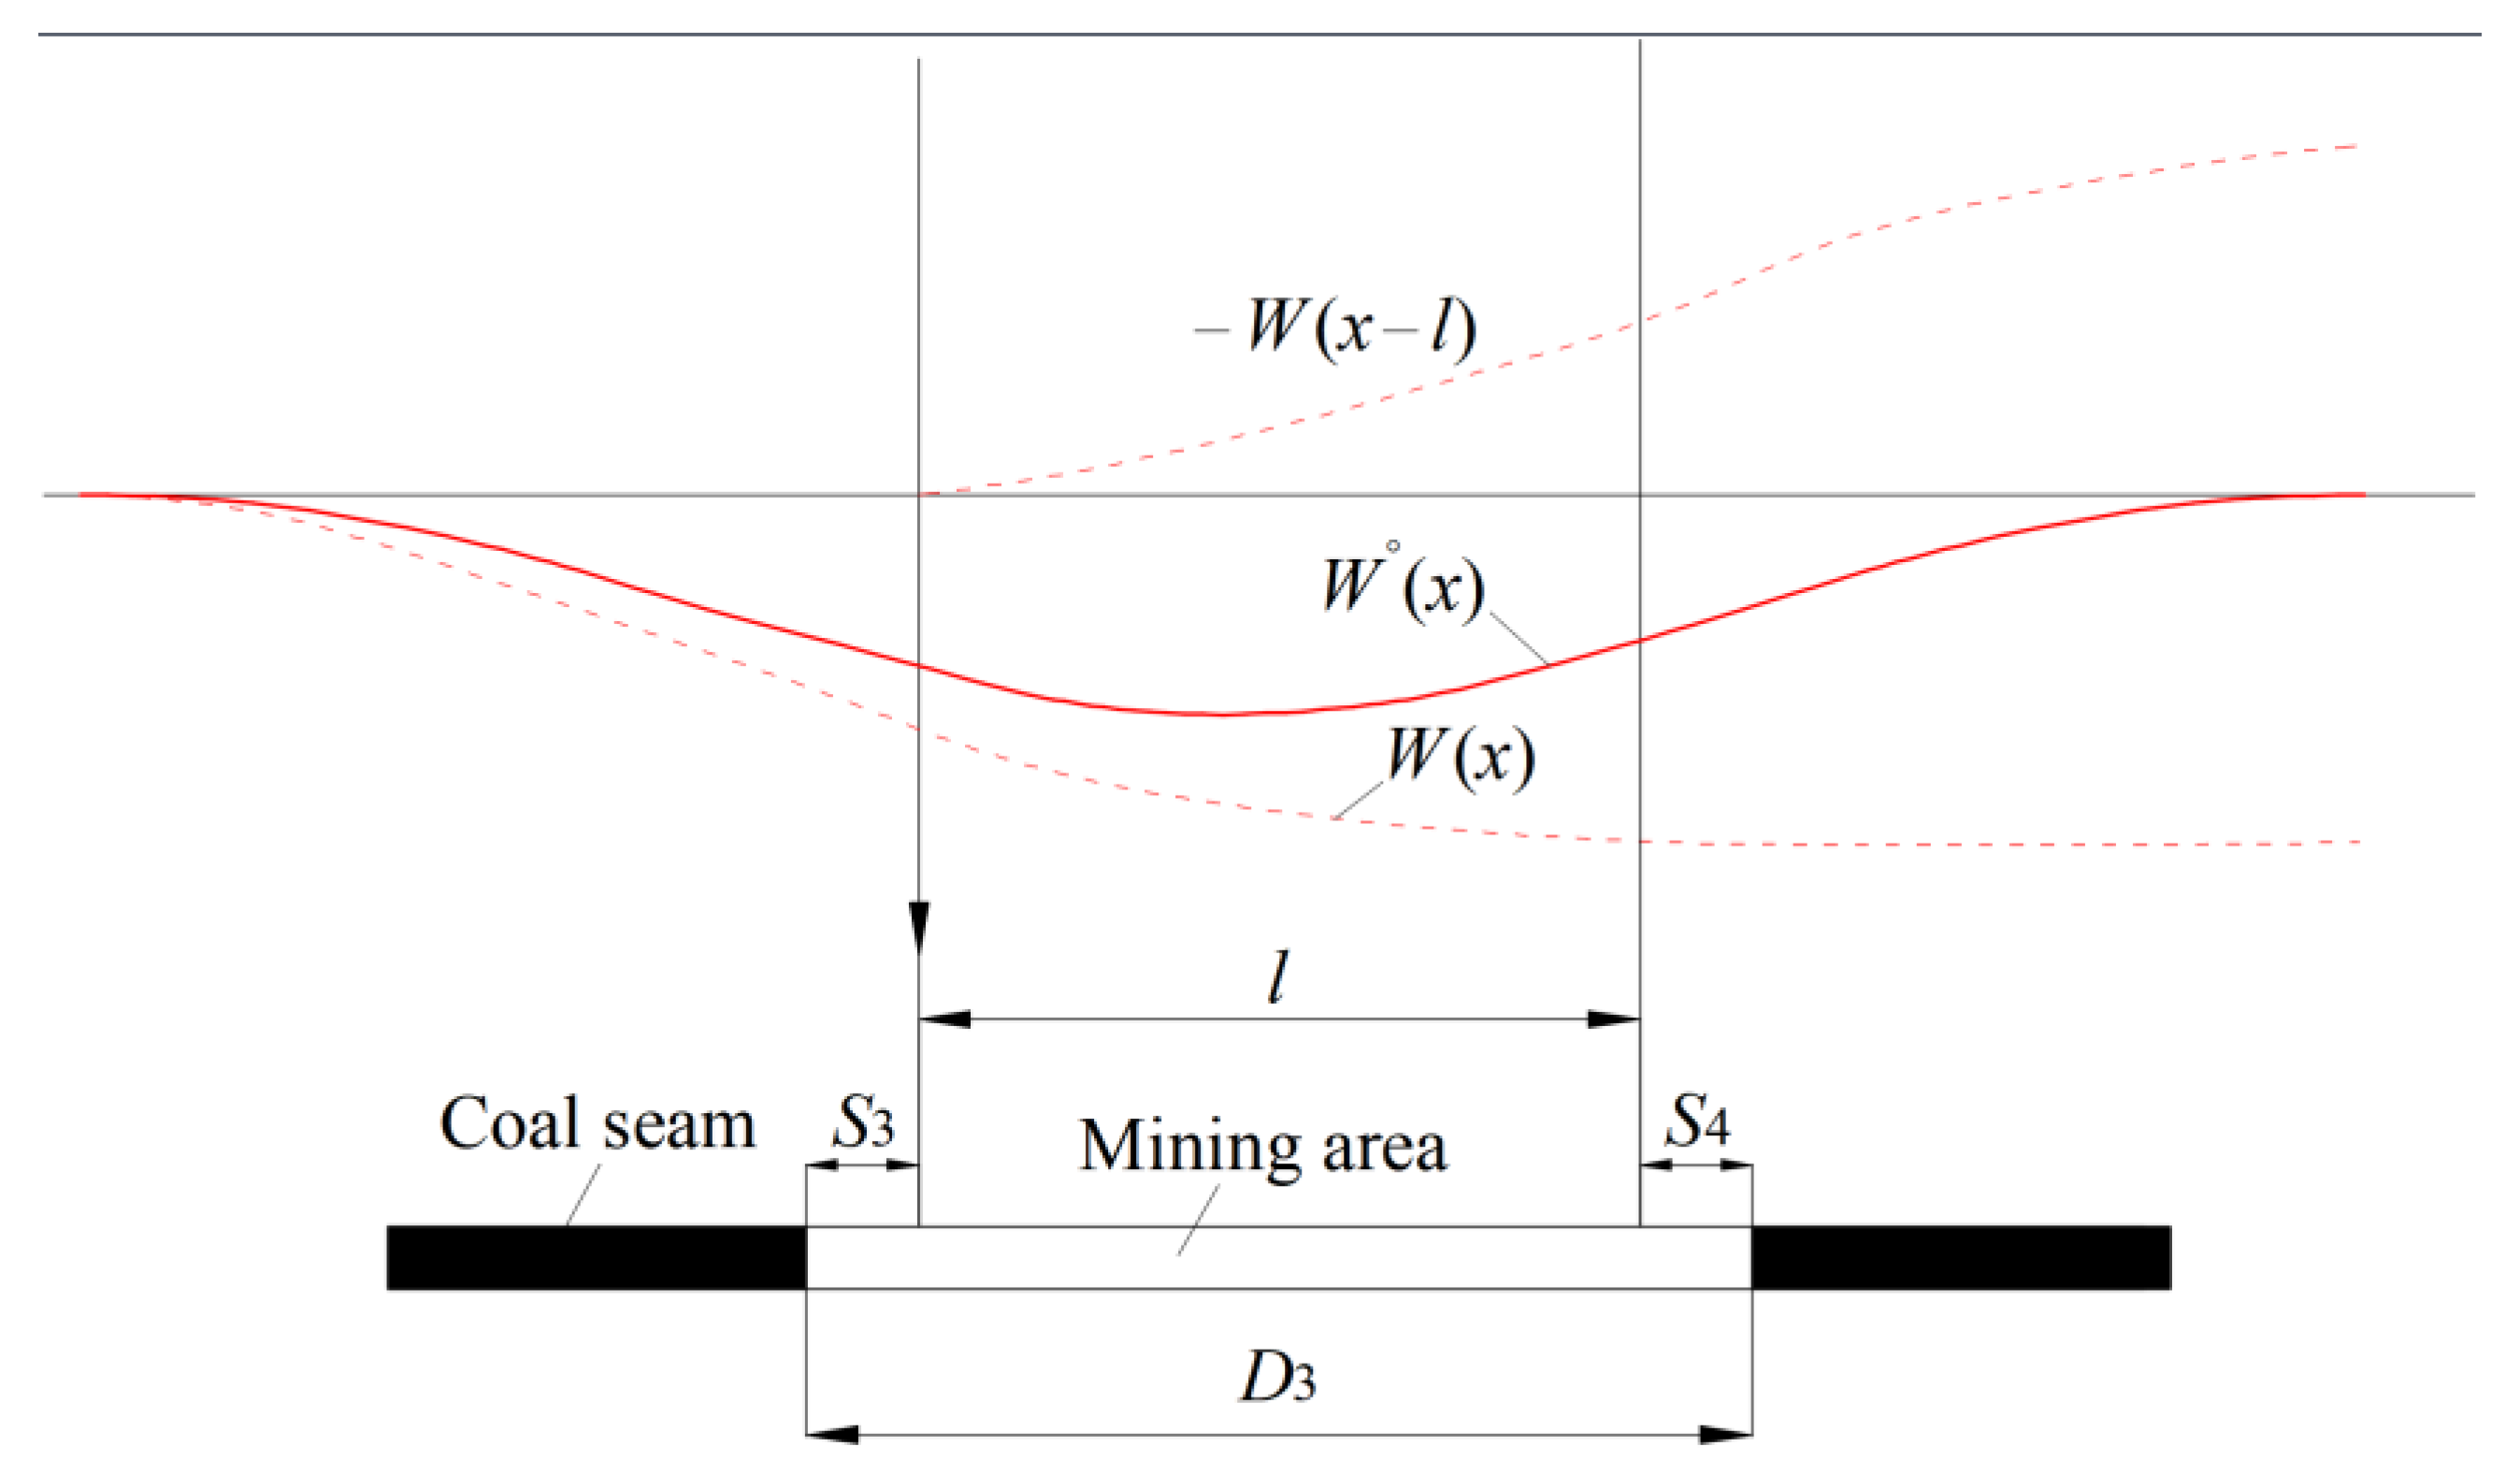
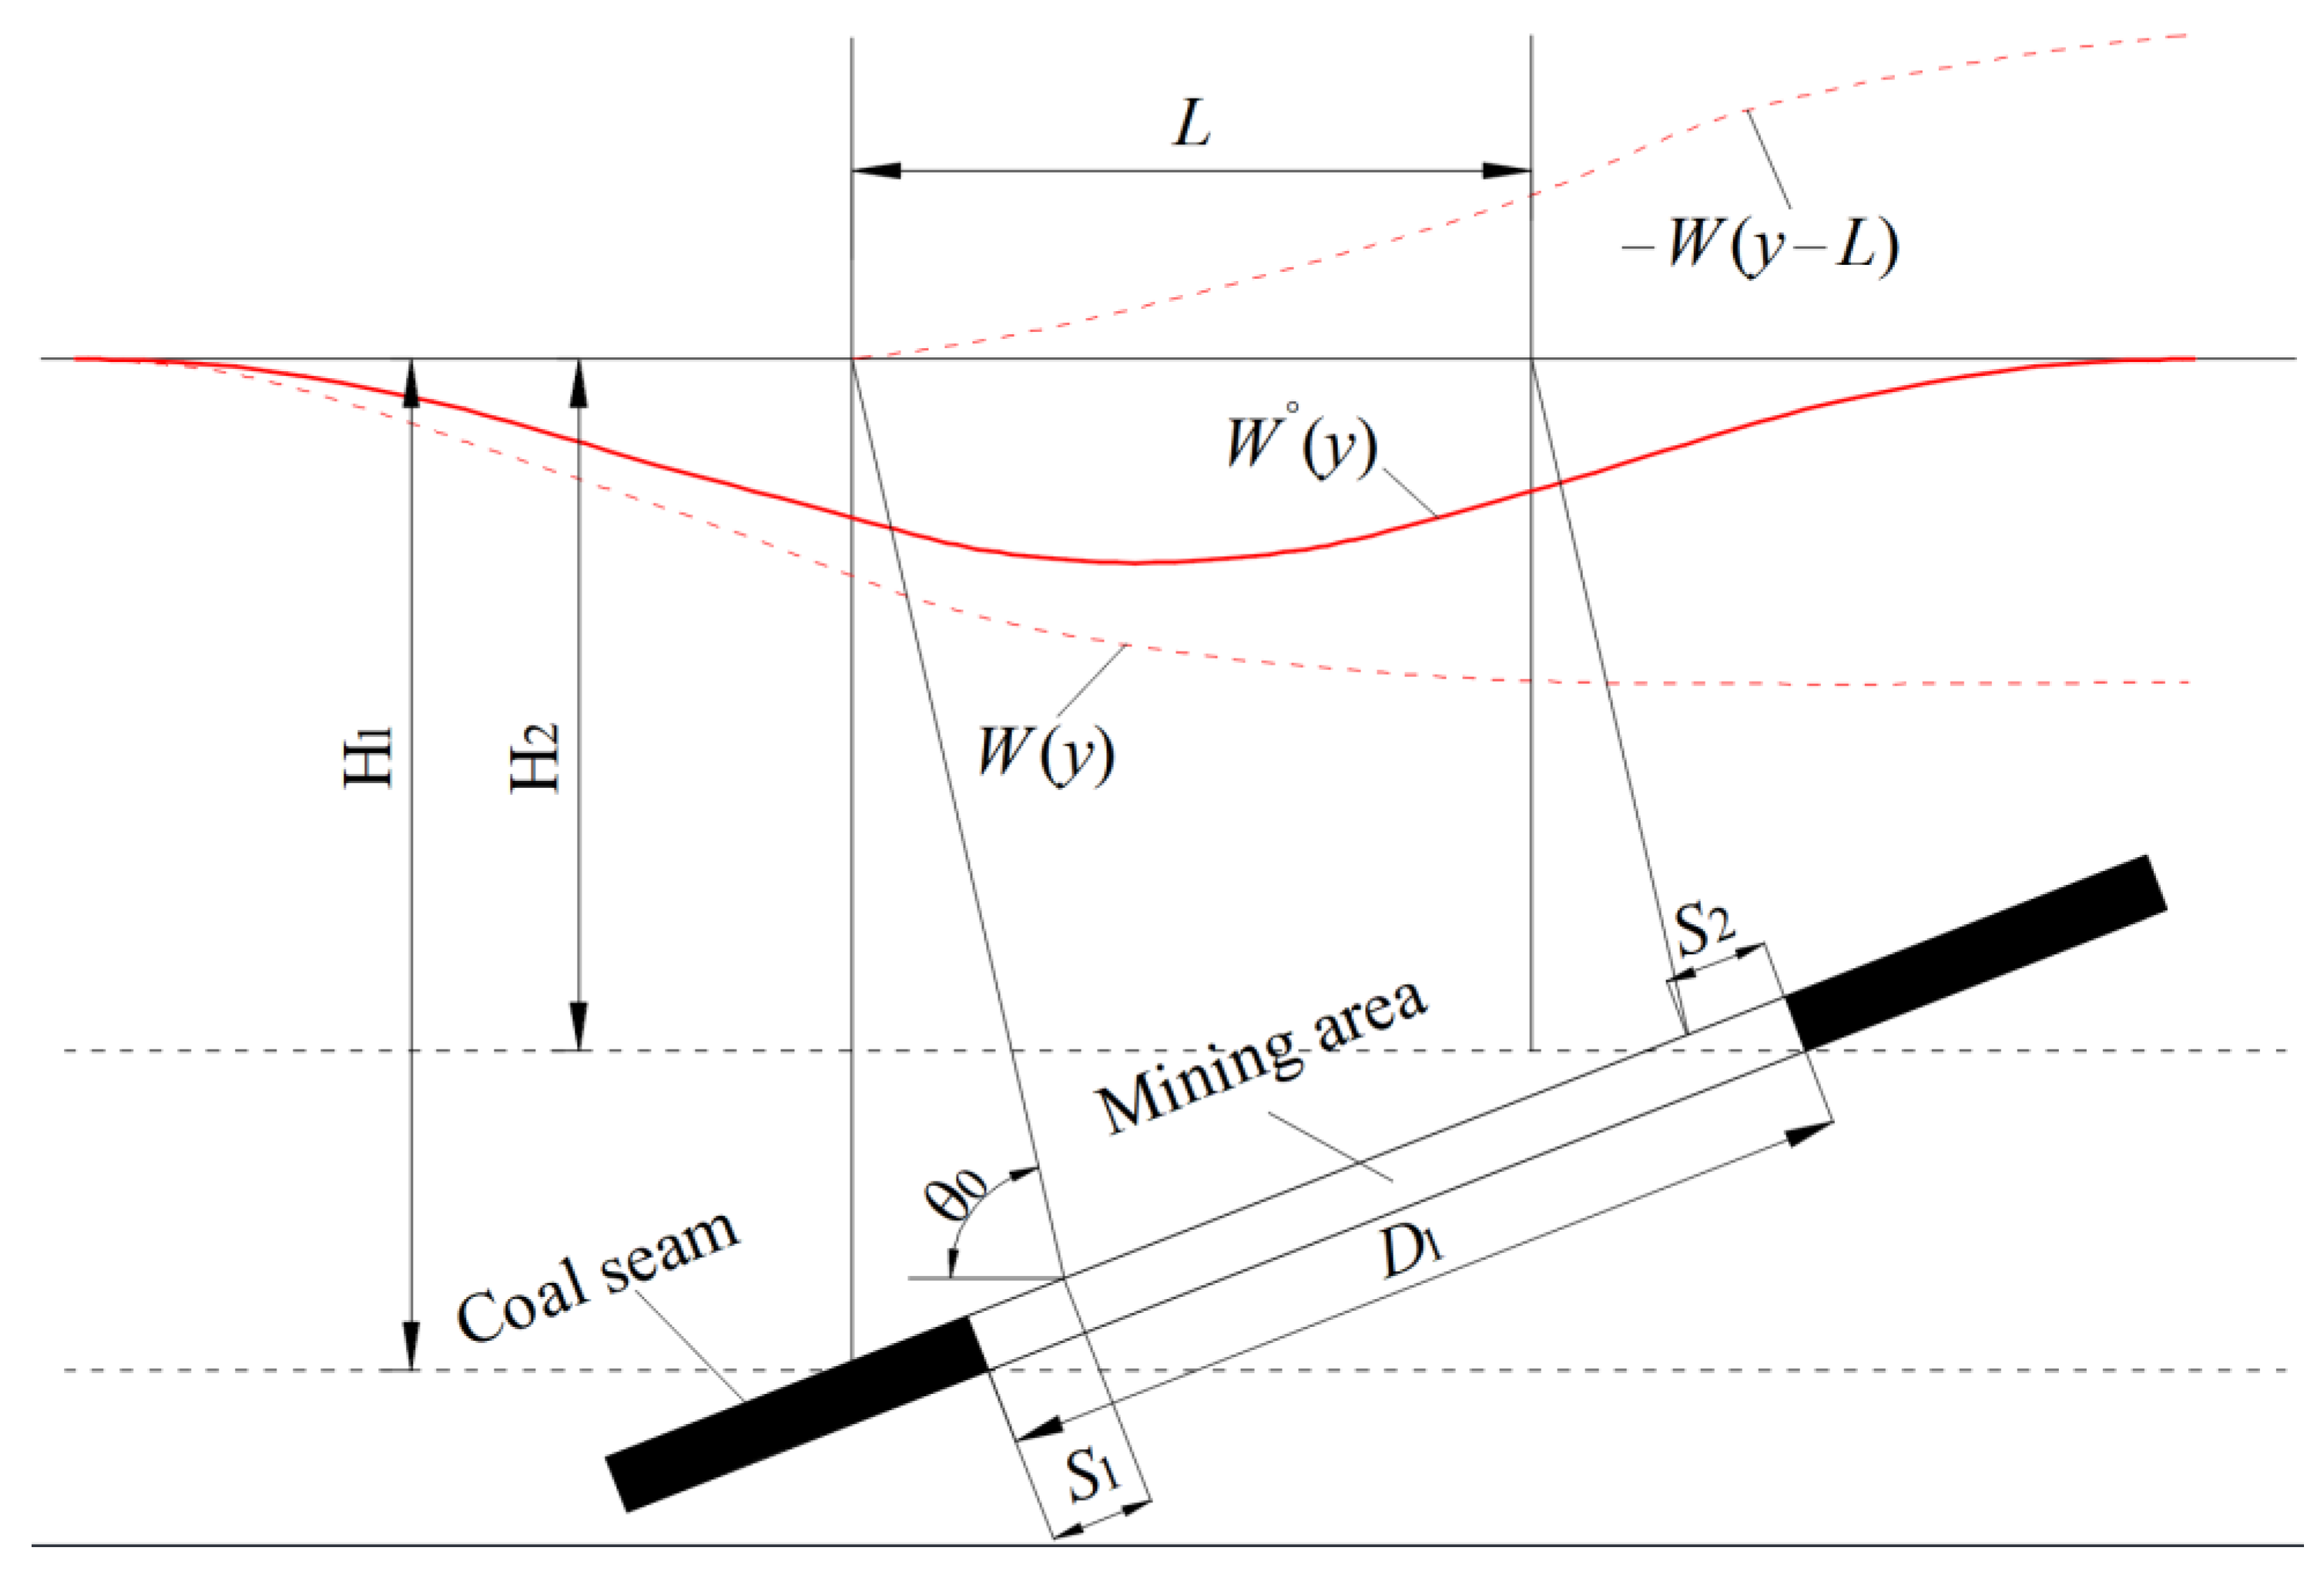
2.2.3. Surface Subsidence during Limited Mining

As shown in Figure 6, the formula for surface subsidence in the main section of the limited mining strike according to the principle of mining subsidence superposition is as follows
W ° ( x ) = W ( x ) W ( x l ) = ( ( 1 P ) W 0 1 + e 4 x / R 1 + P W 0 1 + e 4 x / R 2 ) ( ( 1 P ) W 0 1 + e 4 ( x l ) / R 1 + P W 0 1 + e 4 ( x l ) / R 2 )
where l is the calculated length in the main section of the limited mining strike, and l = D3S3S4. D3 is the strike length of the working face. S3 and S4 are the inflection offset distances of the left and right boundaries, respectively.
As shown in Figure 7, the same Equation for surface subsidence in the main section of the limited mining inclination can be obtained as follows
W ° ( y ) = W ( y ) W ( y L ) = ( ( 1 P ) W 0 1 + e 4 y / R 1 + P W 0 1 + e 4 y / R 2 ) ( ( 1 P ) W 0 1 + e 4 ( y L ) / R 1 + P W 0 1 + e 4 ( y L ) / R 2 )
of which
L = ( D 1 S 1 S 2 ) sin ( θ 0 + α ) s i n θ 0
where L is the calculated length in the main section of the limited mining inclination. D1 is the inclination length of the working face. S1 and S2 are the inflection point offset distances in the downhill and uphill directions, respectively, and θ0 is the mining influence propagation angle.

2.2.4. Surface Subsidence at Any Point

The spatial coordinate system for the subsidence of any point on the surface is shown in Figure 8. so1t is the coal seam coordinate system and xoy is the surface coordinate system. The subsidence of any point A on the surface caused by mining unit B is shown in Equation (9).
d W ( x , y ) = W 0 W e ( x s ) W e ( y t ) = W 0 ( 1 P ) 1 R 1 s e c h 2 ( 2 ( x s ) R 1 ) + W 0 P 1 R 2 s e c h 2 ( 2 ( x s ) R 2 ) + W 0 ( 1 P ) 1 R 1 s e c h 2 ( 2 ( y t ) R 1 ) + W 0 P 1 R 2 s e c h 2 ( 2 ( y t ) R 2 )
As shown in Figure 8, If the strike length of the mined area is D3 and the inclination length is D1, the Equation for the subsidence of any point A on the surface is shown below
W ( x , y ) = W 0 0 D 3 0 D 1 d W ( x , y ) = 1 W 0 [ W ( x ) W ( x D 3 ) ] [ W ( y ) W ( y D 1 ) ]
In view of the derivation for the surface subsidence of the strike and inclination main sections during finite mining, Equation (10) can be transformed as follows
W ( x , y ) = 1 W 0 [ W ( x ) W ( x l ) ] [ W ( y ) W ( y L ) ] = 1 W 0 W ° ( x ) W ° ( y )

2.3. Numerical Simulation

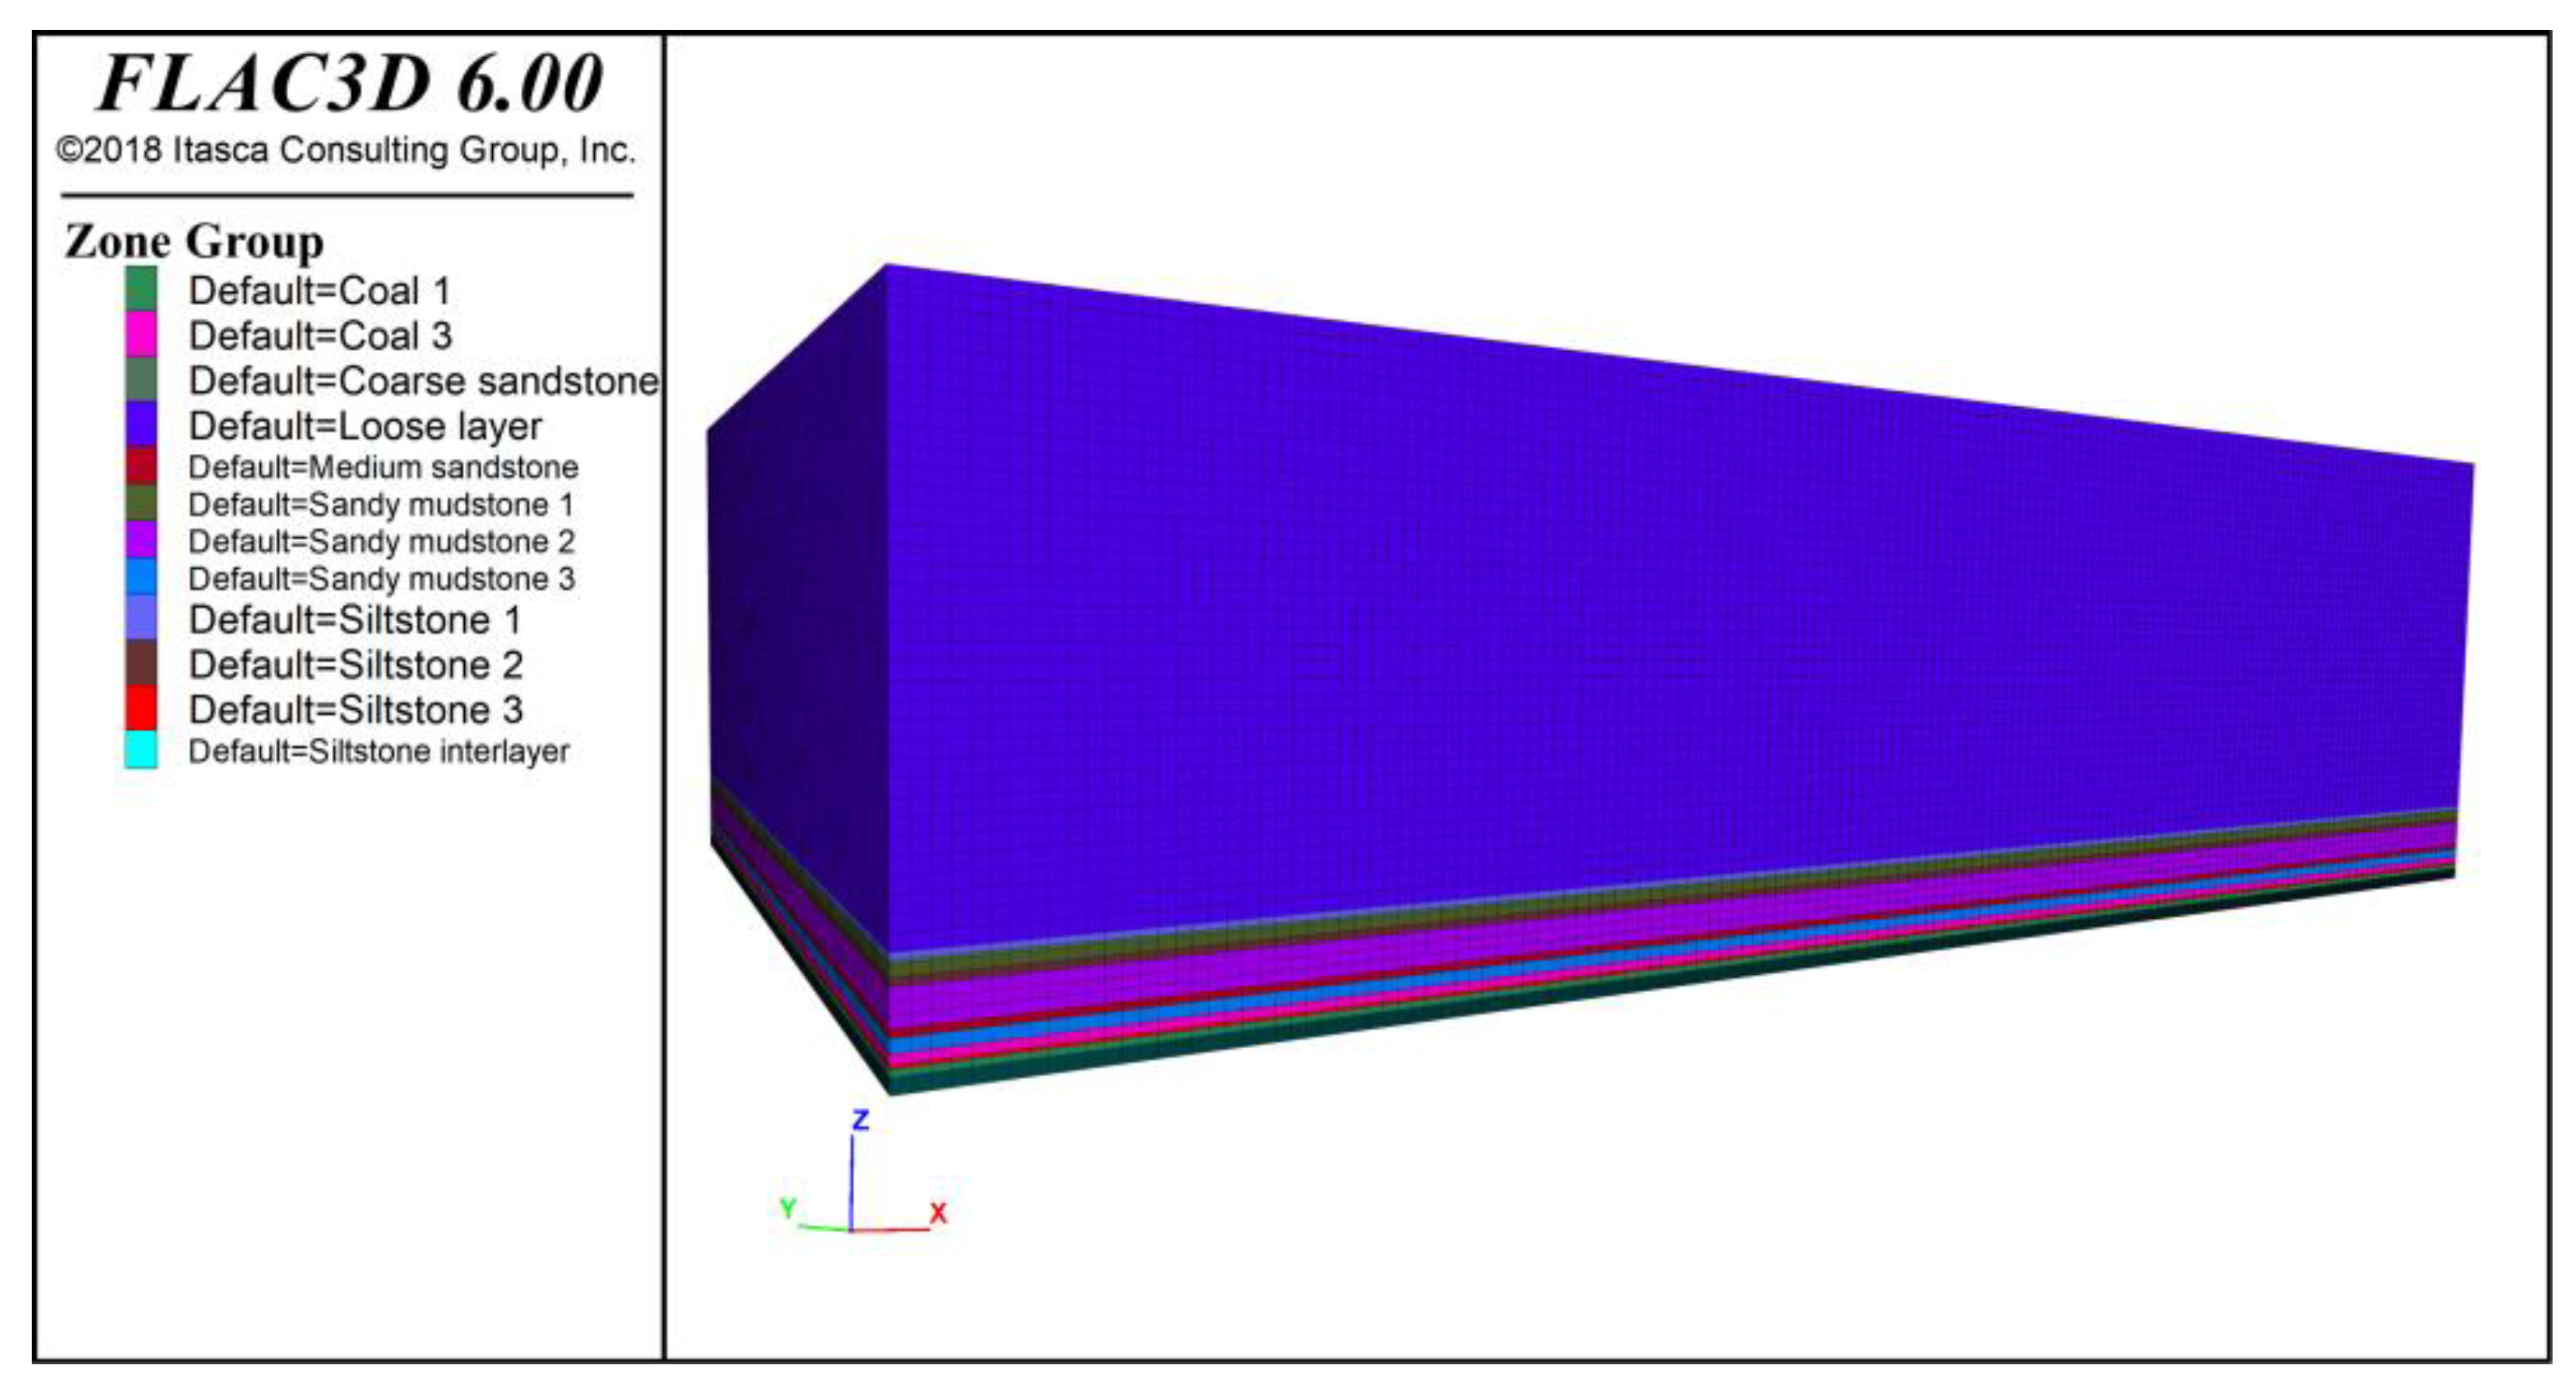
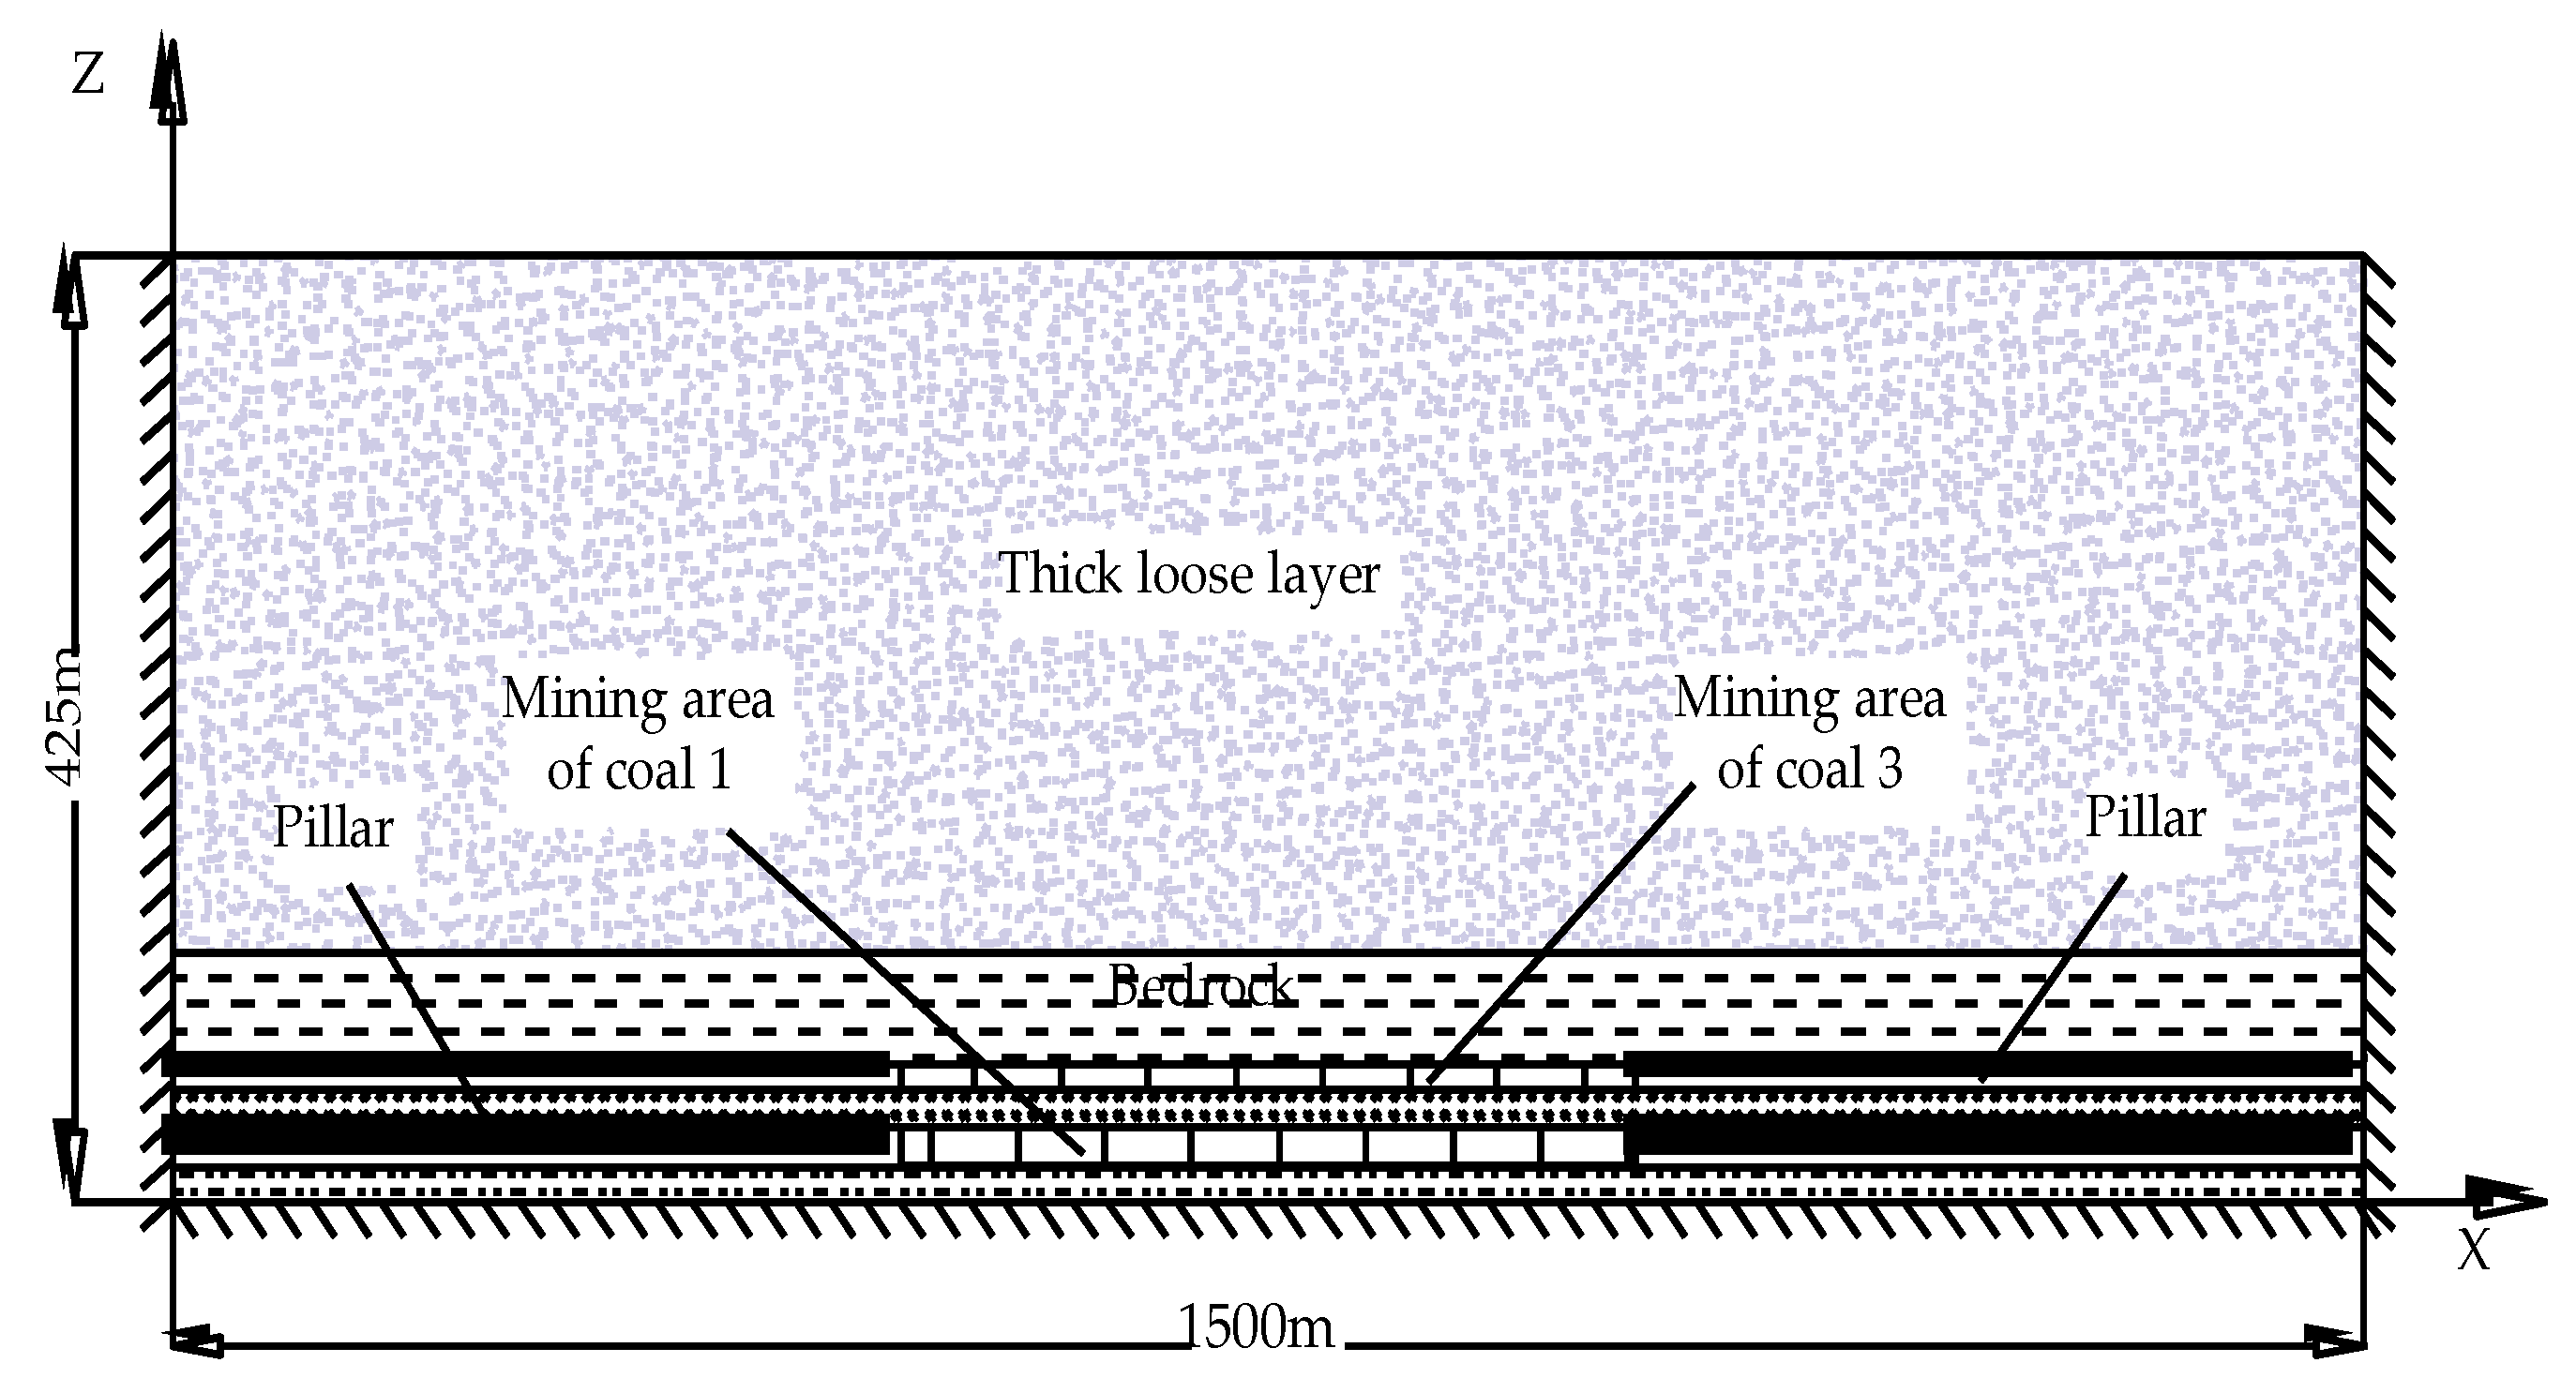
2.3.1. Model Building

FLAC3D is a numerical simulation calculation software developed by Itasca, which is based on fast Lagrangian differences and uses display differences for solving. The software can simulate progressive damage and instability problems of different materials and is particularly suitable for stability analysis of large deformation problems in geotechnical engineering [32,33]. Therefore, numerical simulation is widely used in the field of mining subsidence.
In order to study the influence of the thickness of the loose layer on the surface subsidence, the simplified and combined stratigraphic information of the working face 11111 was used as a prototype to build a numerical model using FLAC software. The stratigraphic information of the simplified and combined 11111 working face is shown in Figure 9. Seven numerical models with thicknesses of 50 m, 100 m, 150 m, 200 m, 250 m, 300 m, and 350 m were established for the loose layer. In this paper, FLAC 6.0 software was used to simulate and study the effect of loose layer thickness on surface subsidence. The model adopts the Mohr–Coulomb calculation criterion. The numerical model boundary is controlled by displacement. The displacements in the X-direction of the left and right of the model are 0. The displacements in the Y-direction of the front and back of the model are 0. The displacements in the Z-direction of the bottom of the model are 0. The Z-direction of the top of the model is a free surface. The geometry dimensions and boundary conditions are shown in Figure 10.

2.3.2. Parameters Determination

The mechanical parameters of overburden rock required for modeling mainly include tensile strength, bulk modulus, shear modulus, cohesion, angle of internal friction, and weight capacity. The relationships among bulk modulus K, shear modulus G, elastic modulus E, and Poisson’s ratio γ are shown in Equations (12) and (13). The mechanical parameters used in the numerical simulation are determined according to the mechanical parameters given in the production geology report. The physical and mechanical parameters of each rock seam in the model are shown in Table 1. The numerical model built on the prototype of 11111 working face is shown in Figure 11.
k = E 3 ( 1 2 γ )
G = E 2 ( 1 + γ )

3. Results

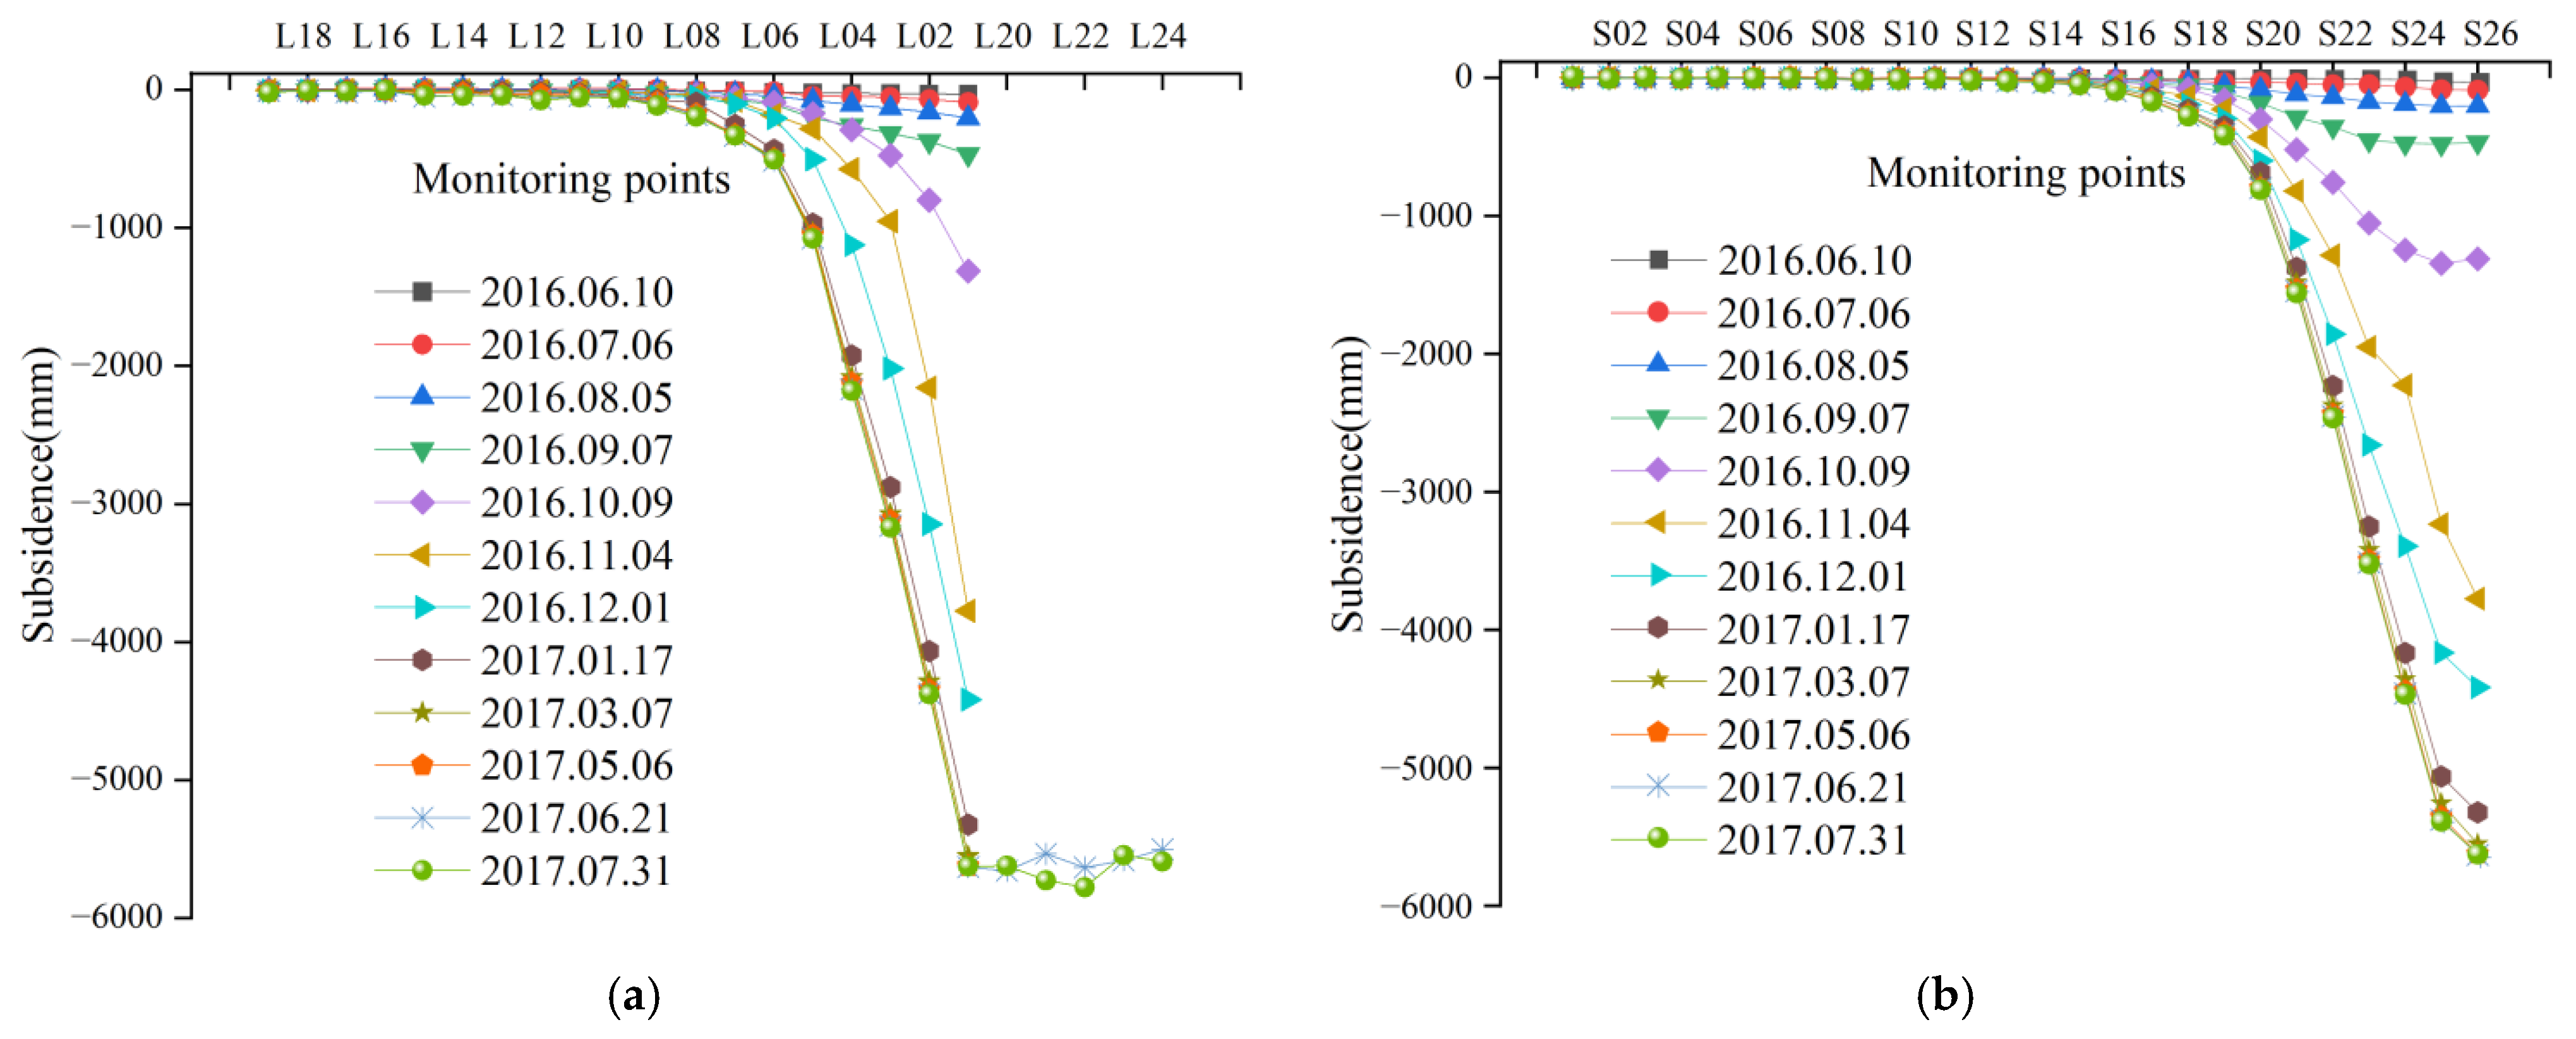
3.1. Surface Subsidence Measurement Data

The subsidence values of the surface monitoring points obtained by the level and underwater measuring equipment are shown in Figure 12. From Figure 12, it can be seen that the strike is fully mined and the inclination is not fully mined. Both the L-line and S-line monitoring points were unaffected by mining at the beginning of the working face mining. From 5 August 2016, point L01 showed obvious subsidence and the amount of subsidence increased sharply with the advancement of the working face until it reached the maximum subsidence value. The monitored maximum subsidence point was located at L22, which was basically at the center of the mining area, with a subsidence value of 5.776 m.

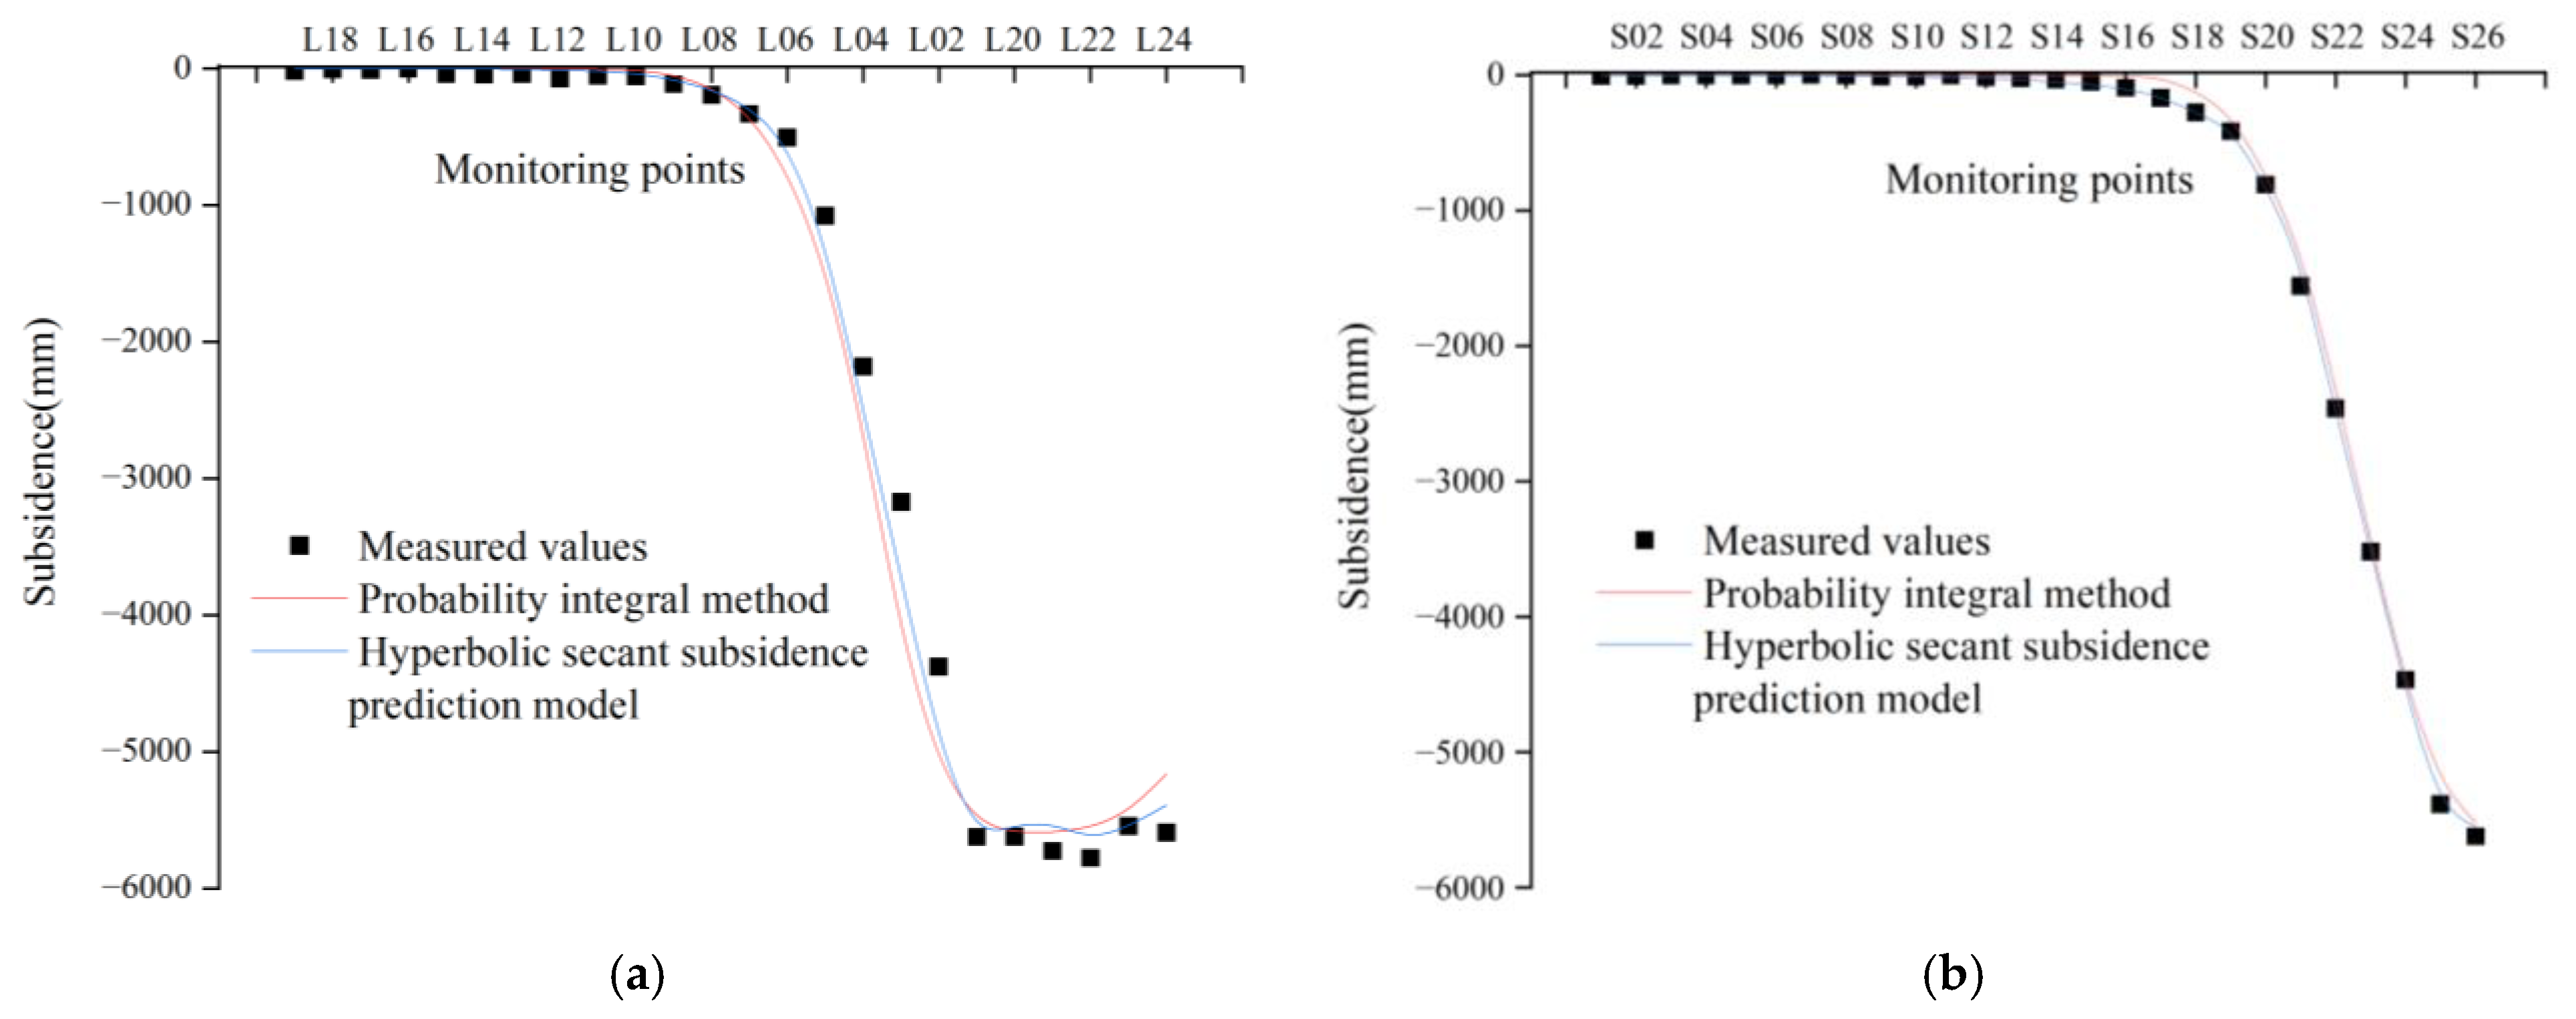
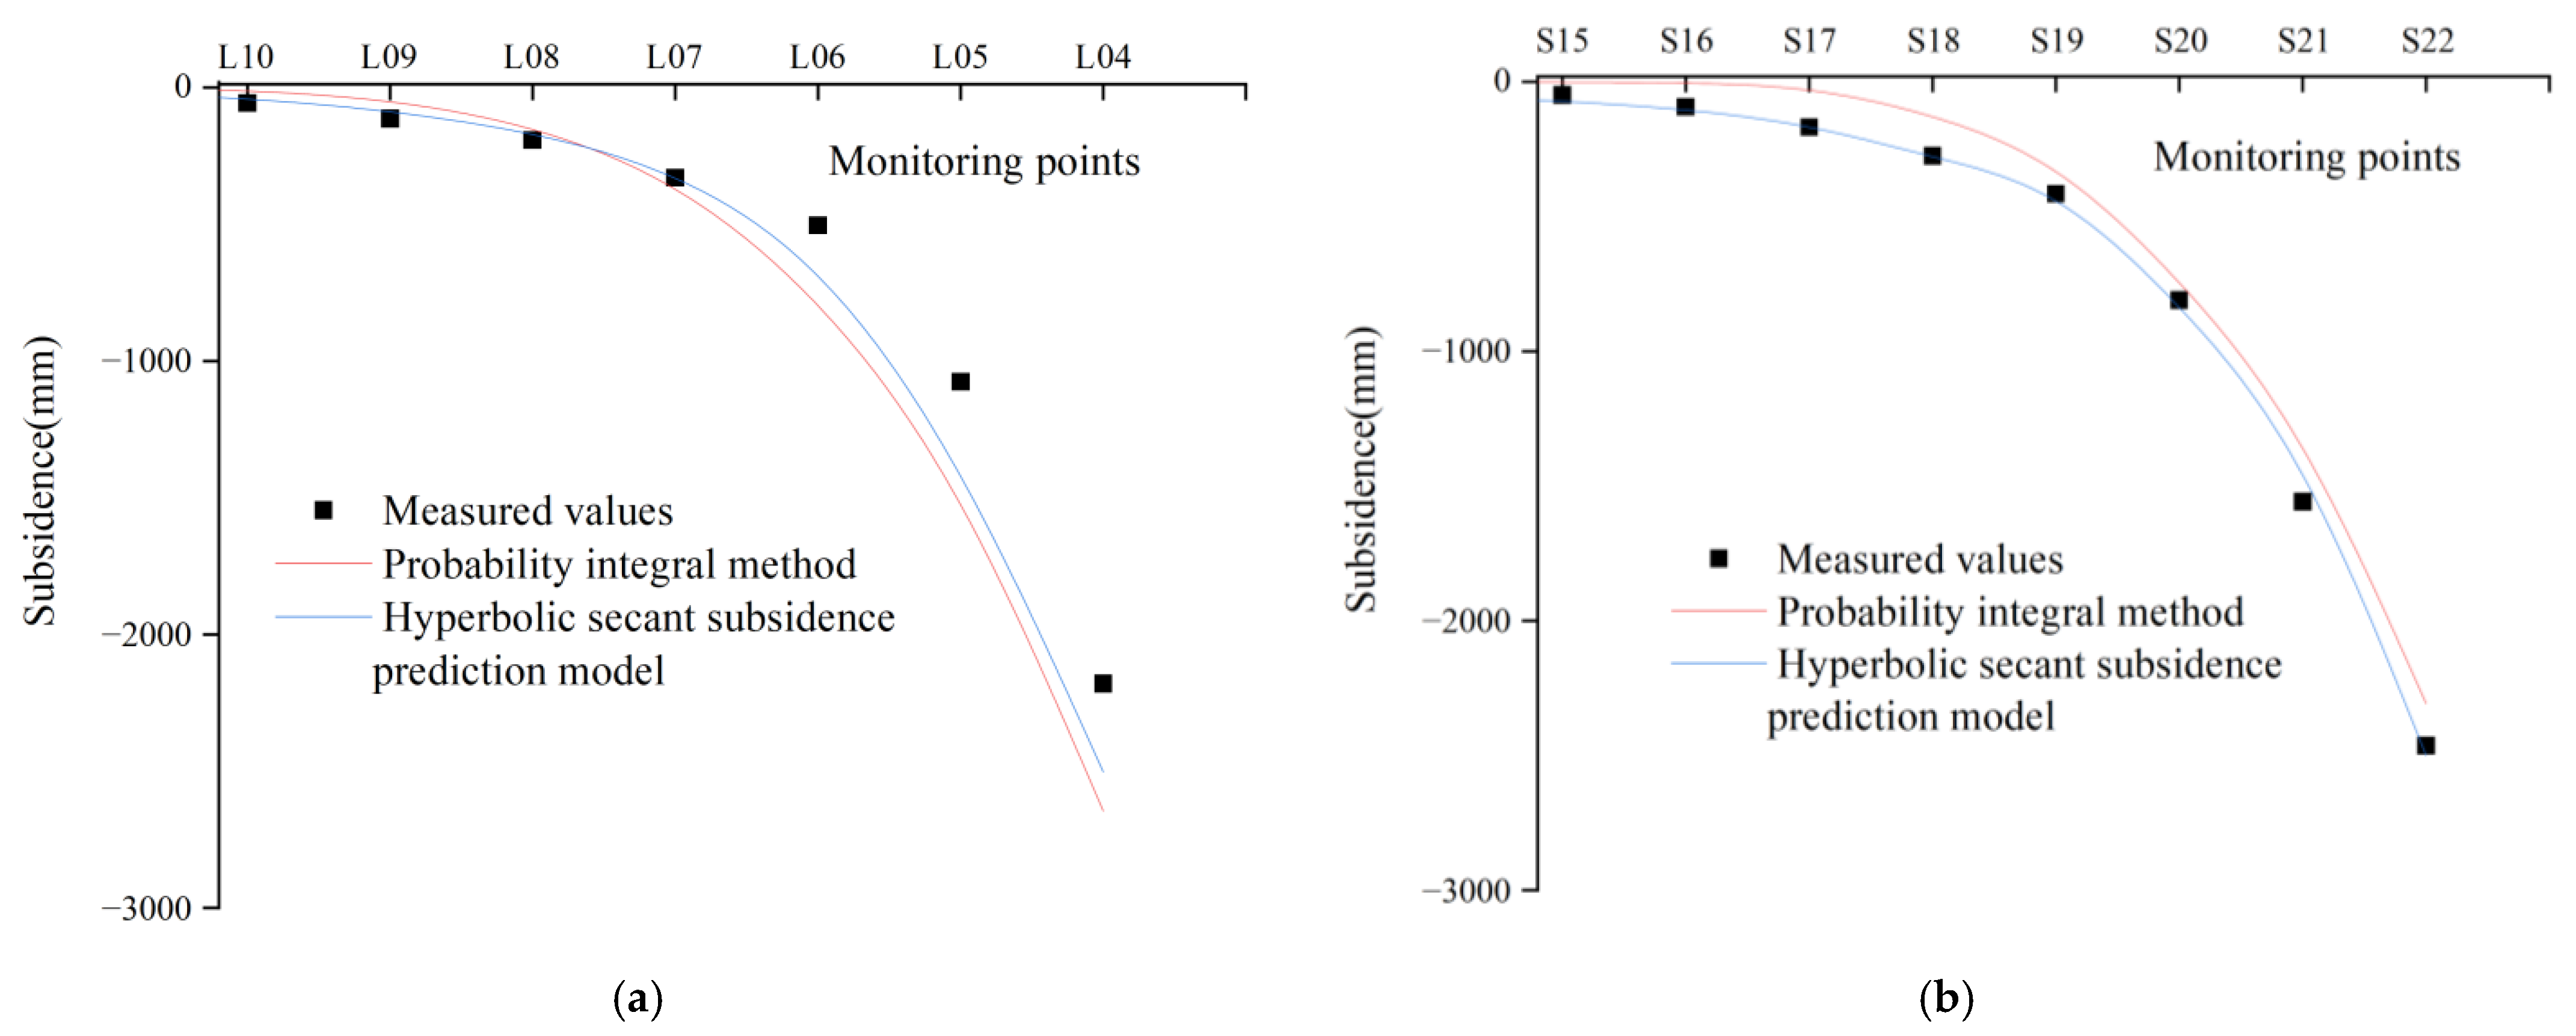
3.2. Surface Subsidence Prediction

The predicted values of L-line and S-line obtained by the probability integral method and hyperbolic secant subsidence prediction model are shown in Figure 13. And the local enlargements near the subsidence boundary of L-line and S-line are shown in Figure 14. From Figure 13, it can be seen that the predicted curves of the hyperbolic secant subsidence prediction model in both L-line and S-line are closer overall to the measured value curves compared with the predicted curves of the probability integral method. Near the maximum subsidence value and subsidence boundary, the predicted curve of the hyperbolic secant subsidence prediction model fits better with the measured value curve. It can be clearly seen from Figure 14 that the predicted curve of the hyperbolic secant subsidence prediction model fits the measured curve significantly near the subsidence boundary of L-line and S-line. From Figure 13 and Figure 14, it can be intuitively seen that the hyperbolic secant subsidence prediction model well overcomes the shortcomings of the probability integral method in terms of the low accuracy of subsidence prediction under a thick loose layer mining area.
In order to verify the superiority of the hyperbolic secant subsidence prediction model for prediction subsidence under thick loose layer conditions, the mean absolute error (MAE) and root mean square error (RMSE) were used as indicators to evaluate the superiority of prediction results. The Equations for MAE and RMSE are shown in Equations (14) and (15).
M A E = 1 m i = 1 m | y i f ( x i ) |
R M S E = 1 m i = 1 m ( y i f ( x i ) ) 2
where m is the number of monitoring points, yi is the measured value of the monitoring point, and f(xi) is the predicted value of the monitoring point.
The values of the accuracy evaluation indexes for the L-line and S-line calculated according to Figure 13 are shown in Table 2. The values of the accuracy evaluation indexes for the subsidence boundaries of L-line and S-line, calculated according to Figure 14, are shown in Table 3.
From Table 2, it can be seen that the MAE and RMSE values of the hyperbolic secant subsidence prediction model predictions are smaller than the probability integral method for both L-line and S-line. The MAE and RMSE values of the hyperbolic secant subsidence prediction model predictions are 41% and 38% higher for all points of the L-line and S-line, respectively. As can be seen from Table 3, the MAE and RMSE values predicted by the hyperbolic secant subsidence prediction model near the subsidence boundary are smaller than those of the probability integral method. At all points of the subsidence boundary, the MAE and RMSE predicted by the hyperbolic secant subsidence prediction model are improved by 51% and 37%, respectively. The results show that the hyperbolic secant subsidence prediction model has a high prediction accuracy for the subsidence prediction of the working face under the geological mining conditions of thick loose layers.

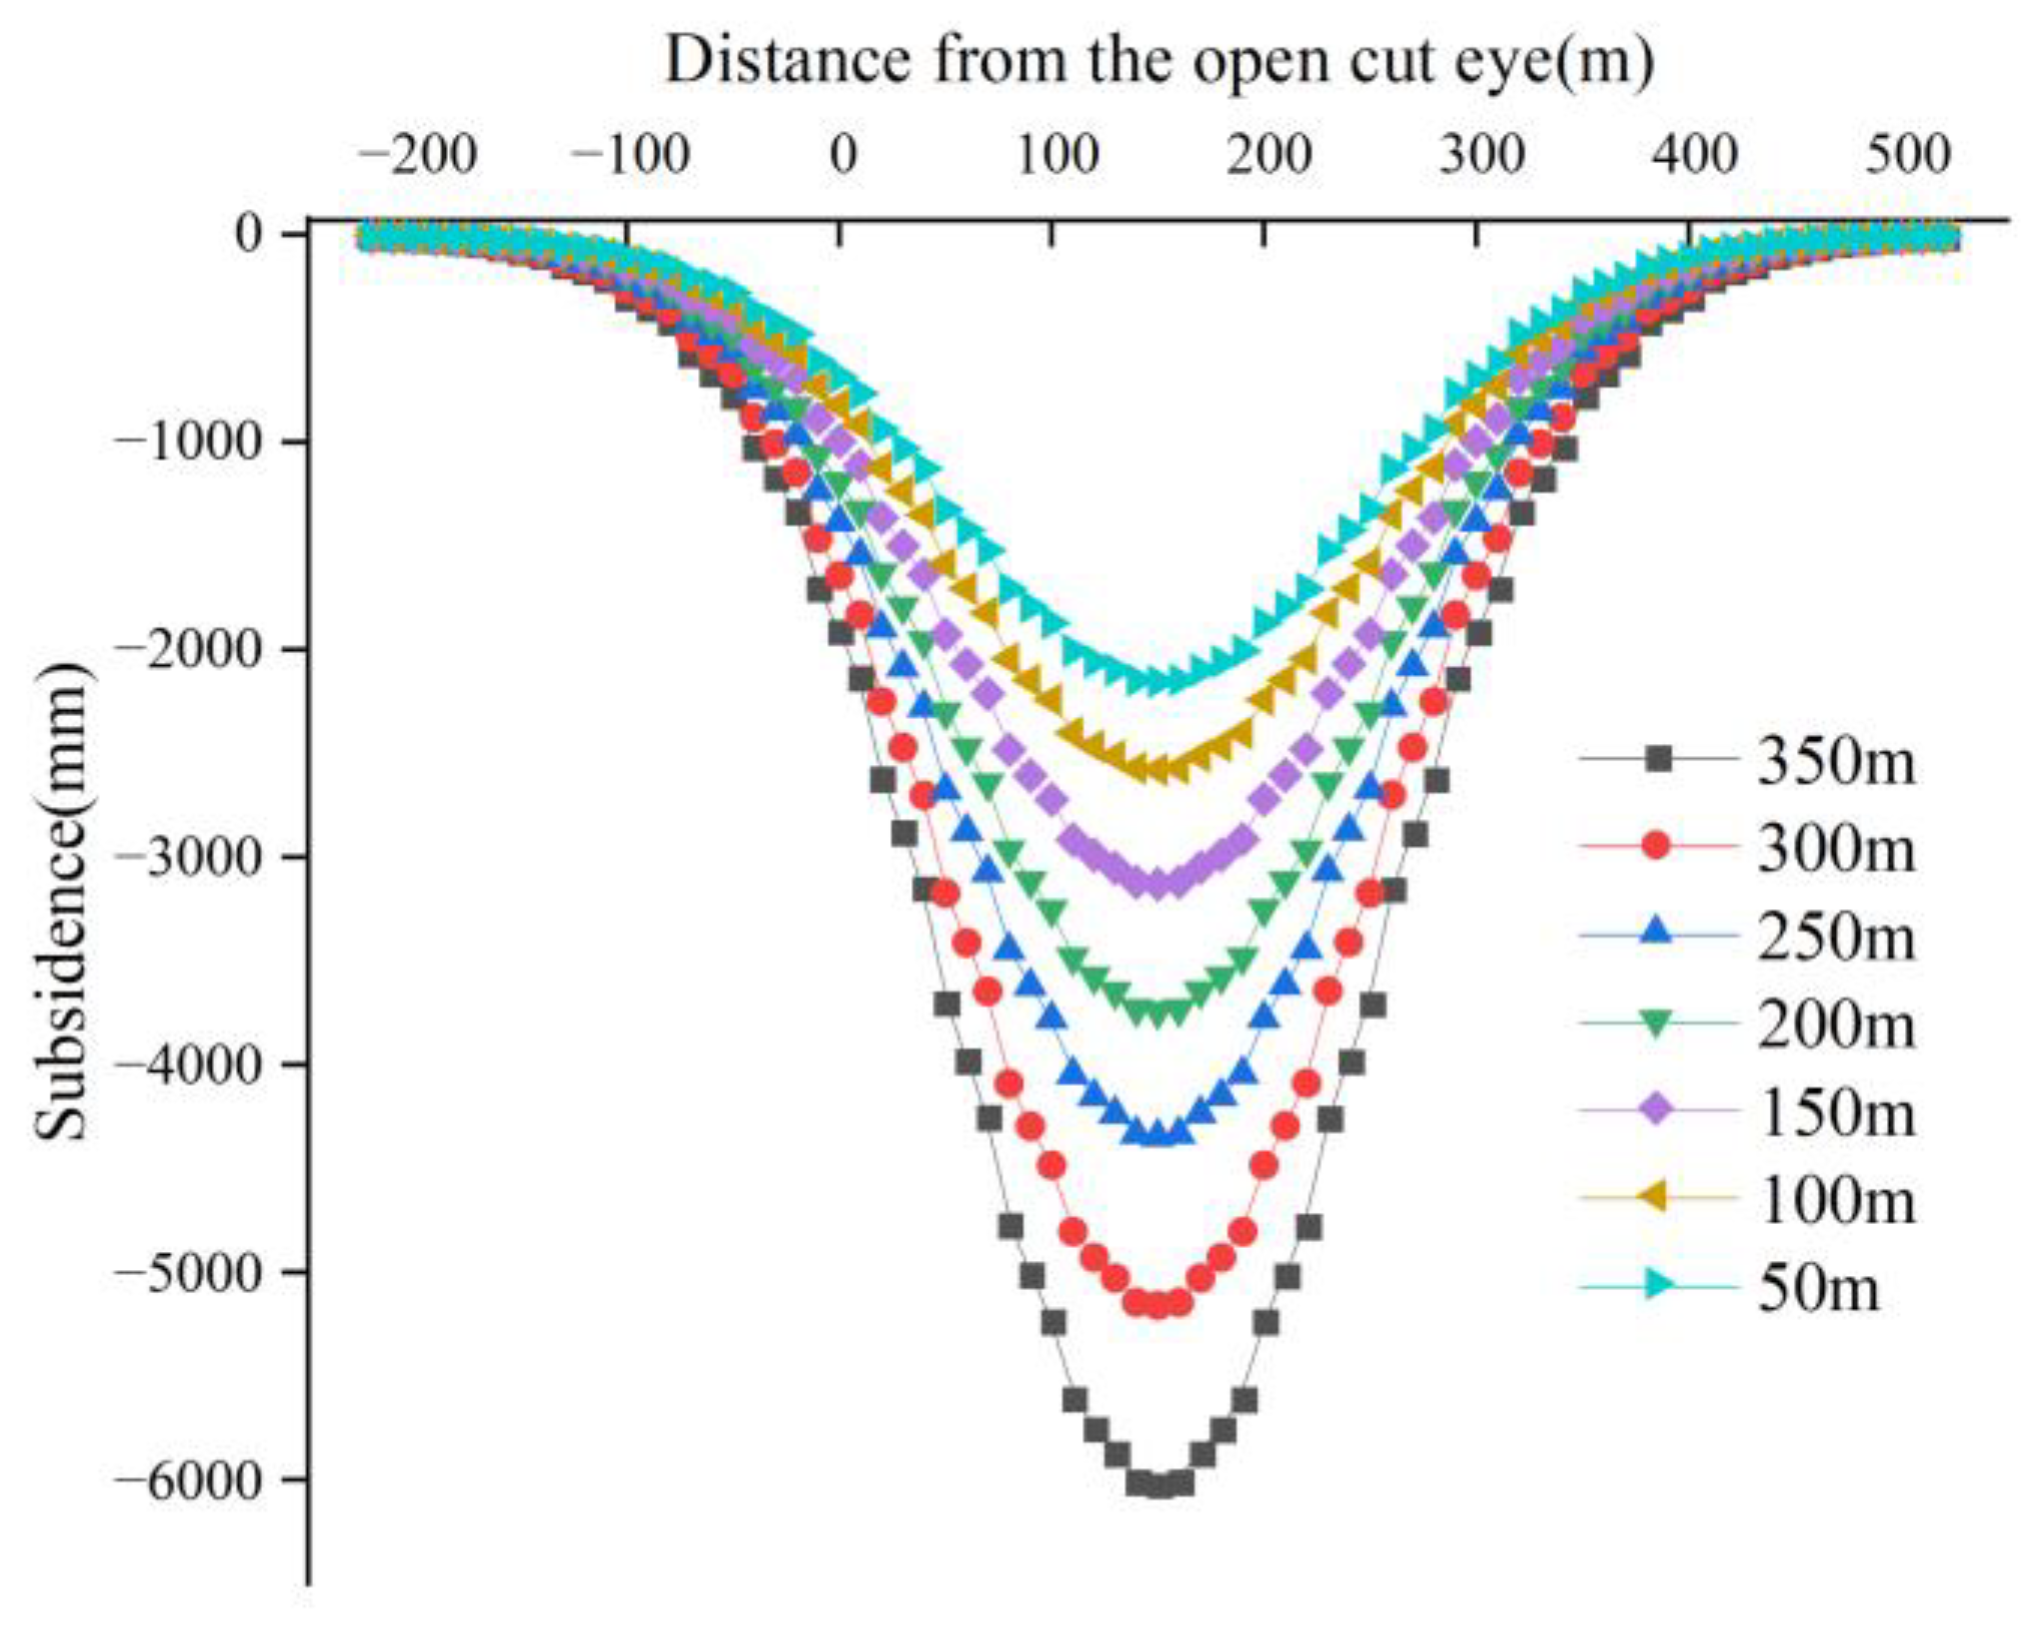
3.3. Numerical Simulation of Surface Subsidence

To study the relationship between the loose layer and surface subsidence, an observation line was laid above the model along the strike main section to monitor the surface subsidence values after excavation of the model. The surface subsidence curve is shown in Figure 15. From Figure 15, it can be seen that as the thickness of the loose layer increases, the maximum surface subsidence value increases and the subsidence process becomes more violent. It can be seen that with the increase in the thickness of the loose layer, the subsidence value near the open cut eye is larger and the surface subsidence range is greater. The loose layer has less strength and is easily damaged by mining disturbance to lose the ability to support the overlying rock, and the damaged loose layer acts as a load on the bedrock to aggravate the degree of damage to the bedrock. Therefore, the thickness of the loose layer plays a crucial role in the surface subsidence. This factor cannot be ignored in the prediction of surface subsidence in thick loose layer mines.

4. Discussion

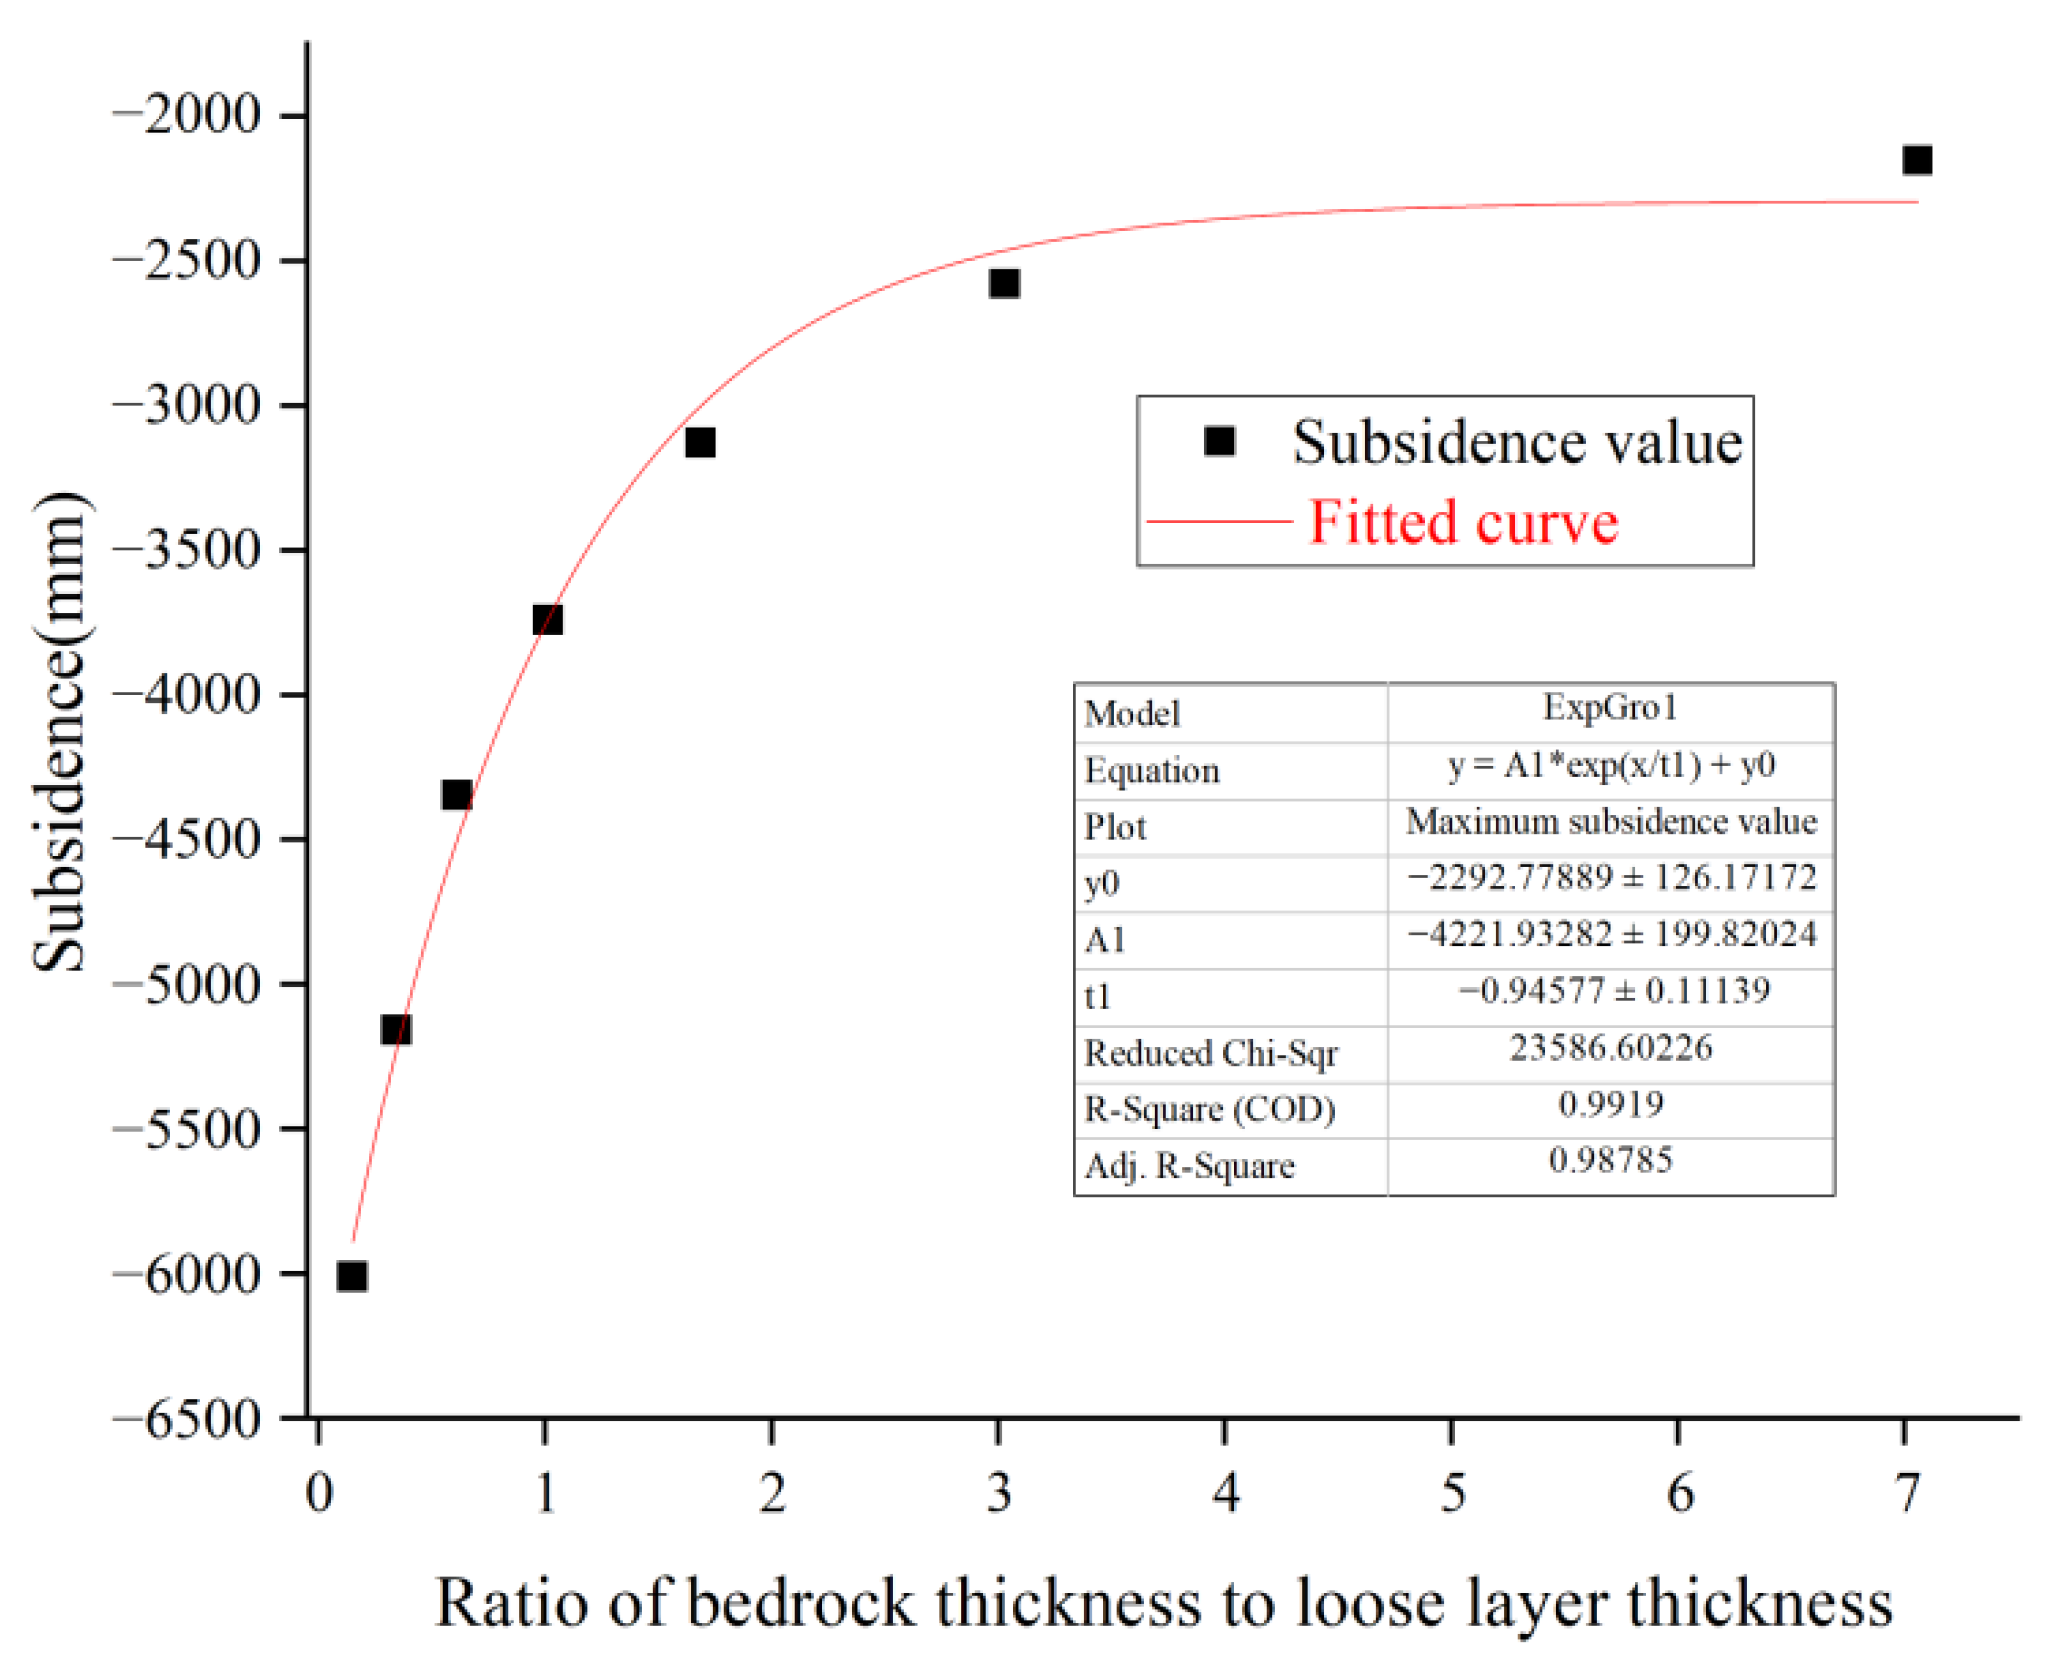
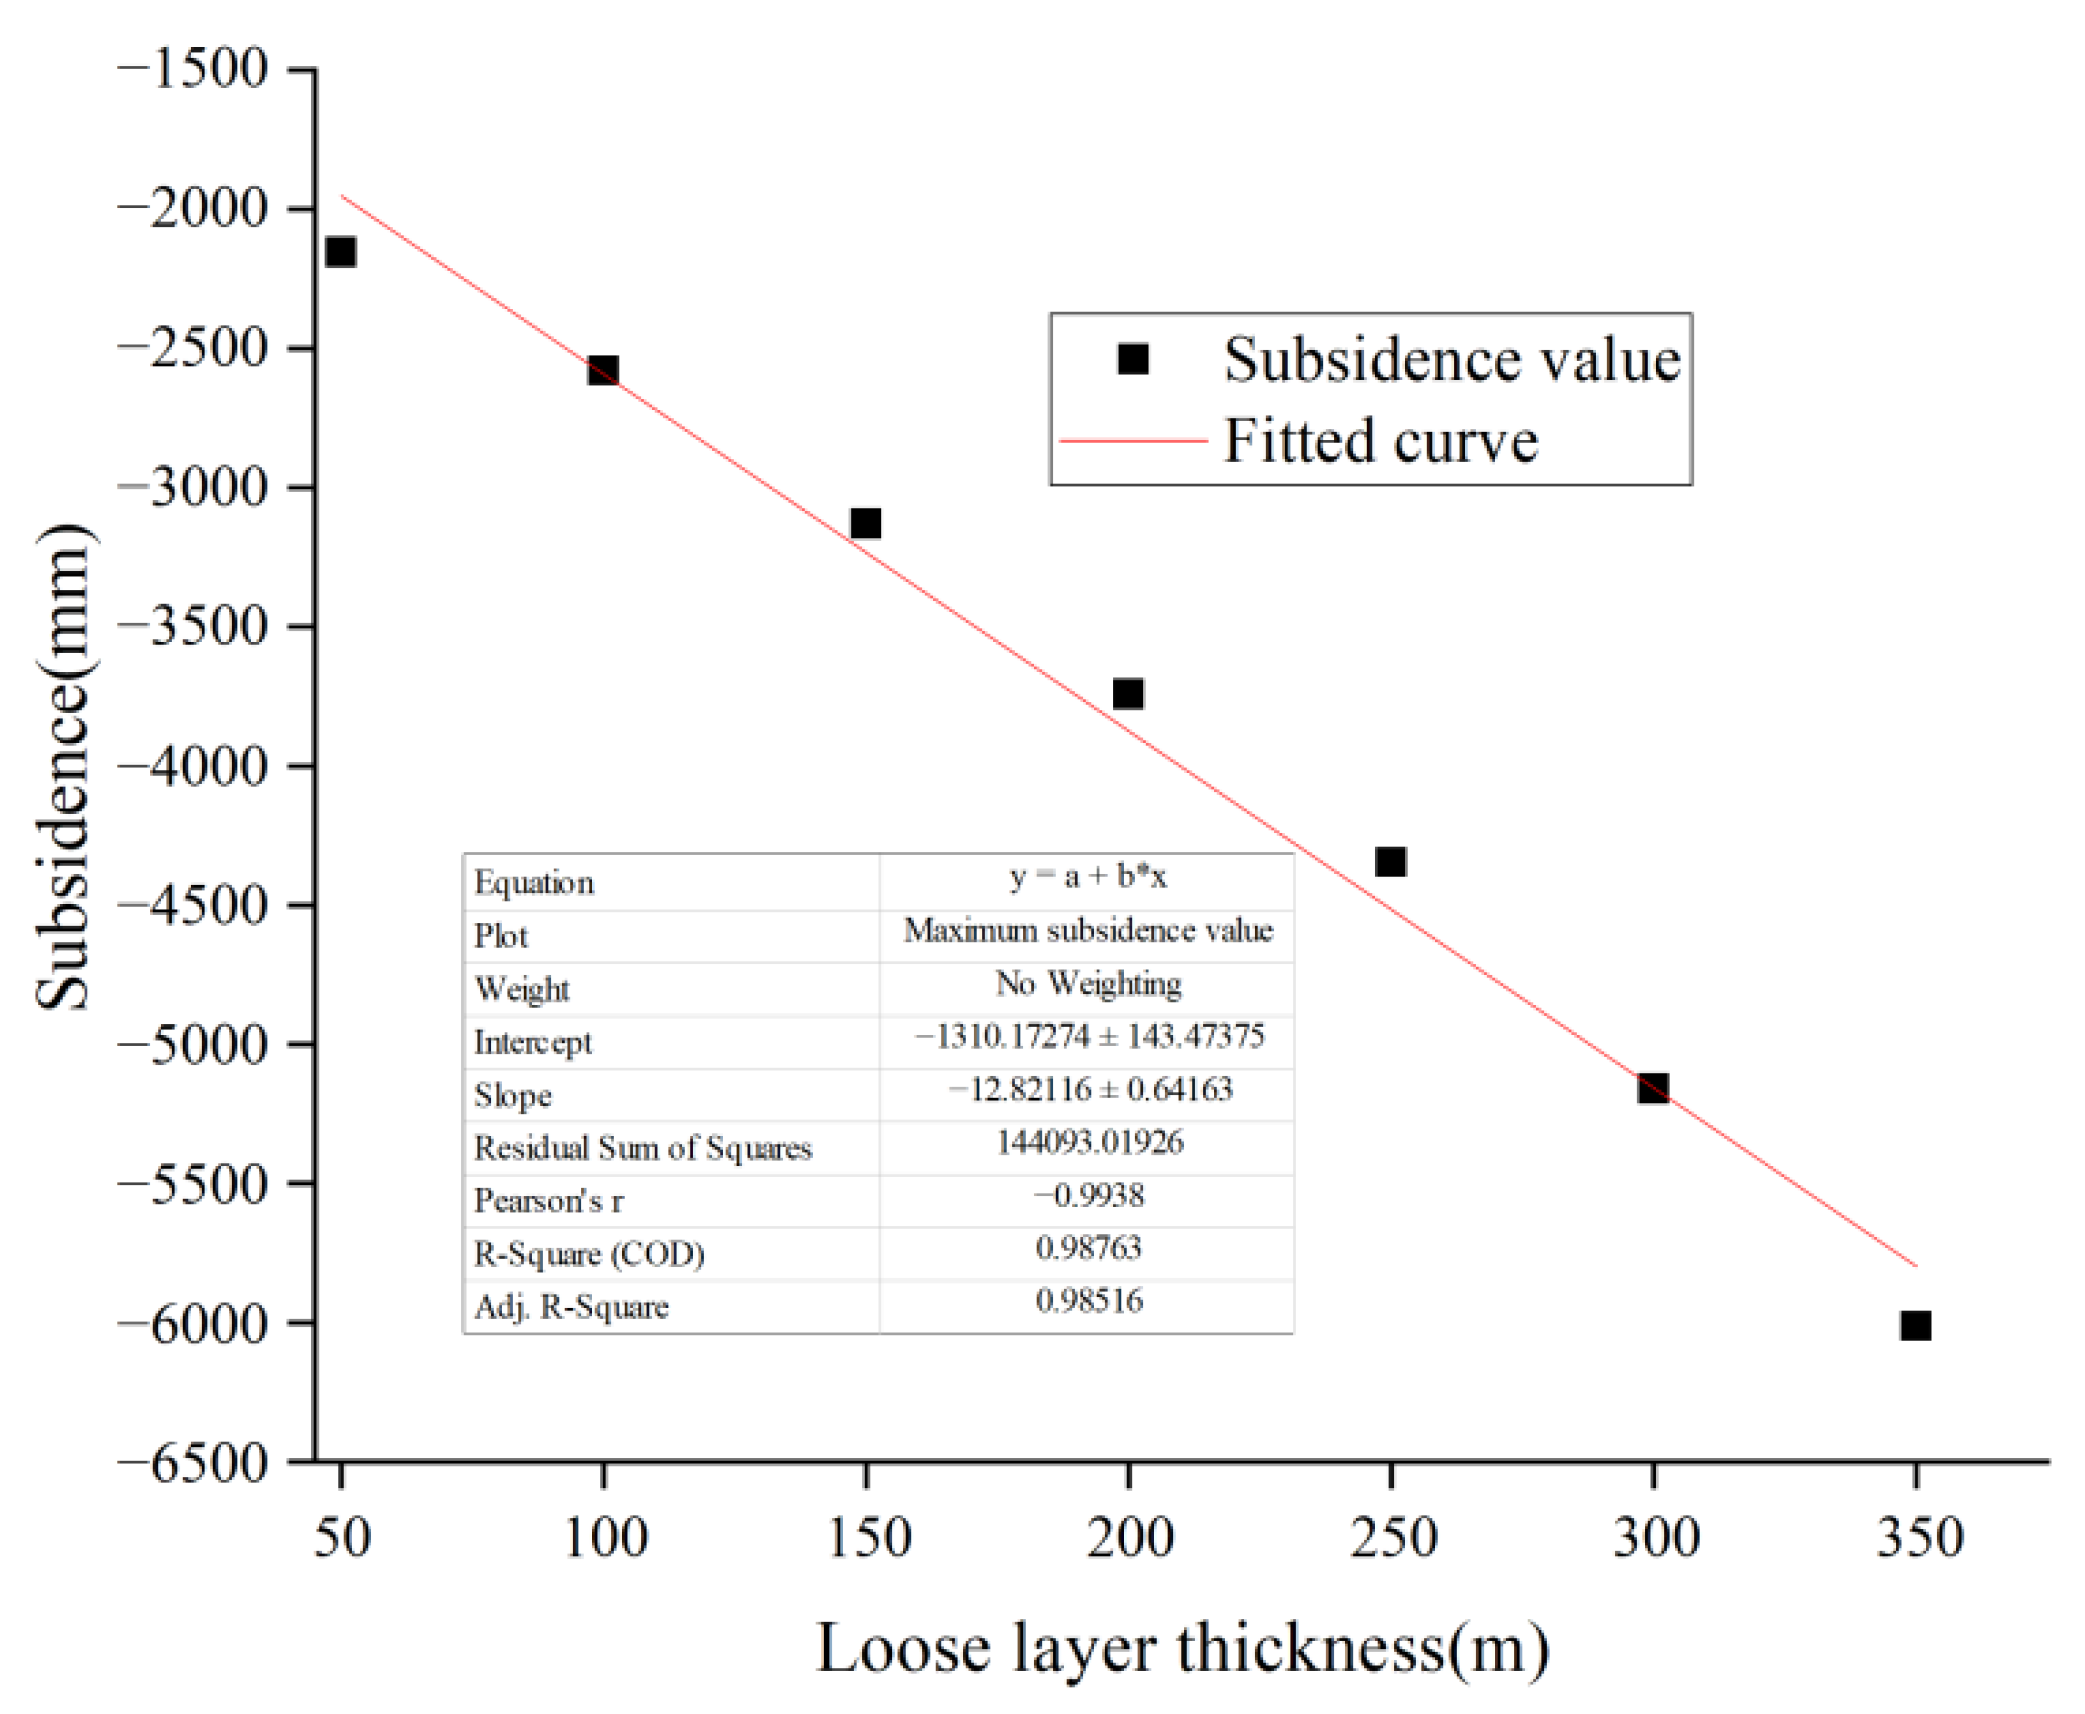
4.1. Relationship between Surface Subsidence Values and Thick Loose Layer

The relationship between the thickness of the loose layer and the subsidence value in the numerical simulation results is plotted as shown in Figure 16. From Figure 16, it can be seen that the surface subsidence value is proportional to the thickness of the loose layer when the thickness of the loose layer is the only independent variable and all other geological mining conditions are the same. The relationship between the thickness of the loose layer and the surface subsidence value under this geological mining condition is y = −1310.17274 − 12.82116x (x is the thickness of the loose layer and y is the subsidence value). The value of Adj. R-Square is 0.98516, which indicates that the relationship has a high interpretable ratio and the model fits well.
To better characterize the effect of the loose layer on surface subsidence, the ratio of the bedrock thickness to loose layer thickness was used as the independent variable and the surface subsidence value as the dependent variable to characterize the effect of the loose layer on the subsidence value (Figure 17). The surface subsidence value and the ratio of bedrock to loose layer are exponentially related, and the relationship equation is y = −4221.93282ex/−0.94577 − 2292.77889 (x is ratio of bedrock thickness to loose layer thickness and y is the subsidence value). The value of Adj. R-Square is 0.98785, which indicates that the explainable ratio of the relationship equation is high and the model fits well.
When the ratio of the bedrock thickness to loose layer thickness is less than 0.6, the loose layer plays a major role in the surface subsidence. At this stage, the value of surface subsidence decreases linearly with the increase in the ratio, and the magnitude of the decrease is large. At this stage, it is recommended to predict the surface subsidence values by using the hyperbolic secant subsidence prediction model constructed in this paper. At the ratio of bedrock thickness to the loose layer thickness of 0.6 to 3, the loose layer and bedrock play a major role in surface subsidence. At this stage, the surface subsidence value decreases non-linearly and gradually with the increase in the ratio. At this stage, it is recommended to predict the surface subsidence values by using the hyperbolic secant subsidence prediction model constructed in this paper. The bedrock plays a major role in surface subsidence when the ratio of the bedrock thickness to loose layer thickness is greater than 3. At this stage, the value of surface subsidence decreases linearly with an increasing ratio, and the decrease is very small. At this stage, the probability integral method is used to predict the surface subsidence value.

4.2. The Shortcomings of Hyperbolic Secant Subsidence Prediction Model

(1)
Multi-layered aquifers are distributed in thick loose layer mines in East China. The derivation of the hyperbolic secant subsidence prediction model in the paper does not consider the additional subsidence values caused by water loss consolidation settlement of the aquifer. The additional subsidence caused by water loss in the aquifer can be taken into account in the subsequent study.
(2)
Faulting is a geological formation frequently encountered in mining activities. The presence of a fault makes the surface subsidence of the upper and lower pans show variability. The additional subsidence caused by the slip of the fault surface is not considered in the derivation of the hyperbolic secant subsidence prediction model in the paper. The additional subsidence caused by a fault slip can be taken into account in the subsequent study.

5. Conclusions

To scientifically guide the production practice activities in loose layer mines, the special phenomenon of a large subsidence range of mining surfaces under loose layer conditions is studied by using the analysis of actual measurement data and numerical simulation. The hyperbolic secant function was proposed as the influence function of a mining unit to construct the hyperbolic secant subsidence prediction model for the prediction of subsidence values, and the hyperbolic secant subsidence prediction model was applied to the prediction of subsidence at working face 11111.
(1)
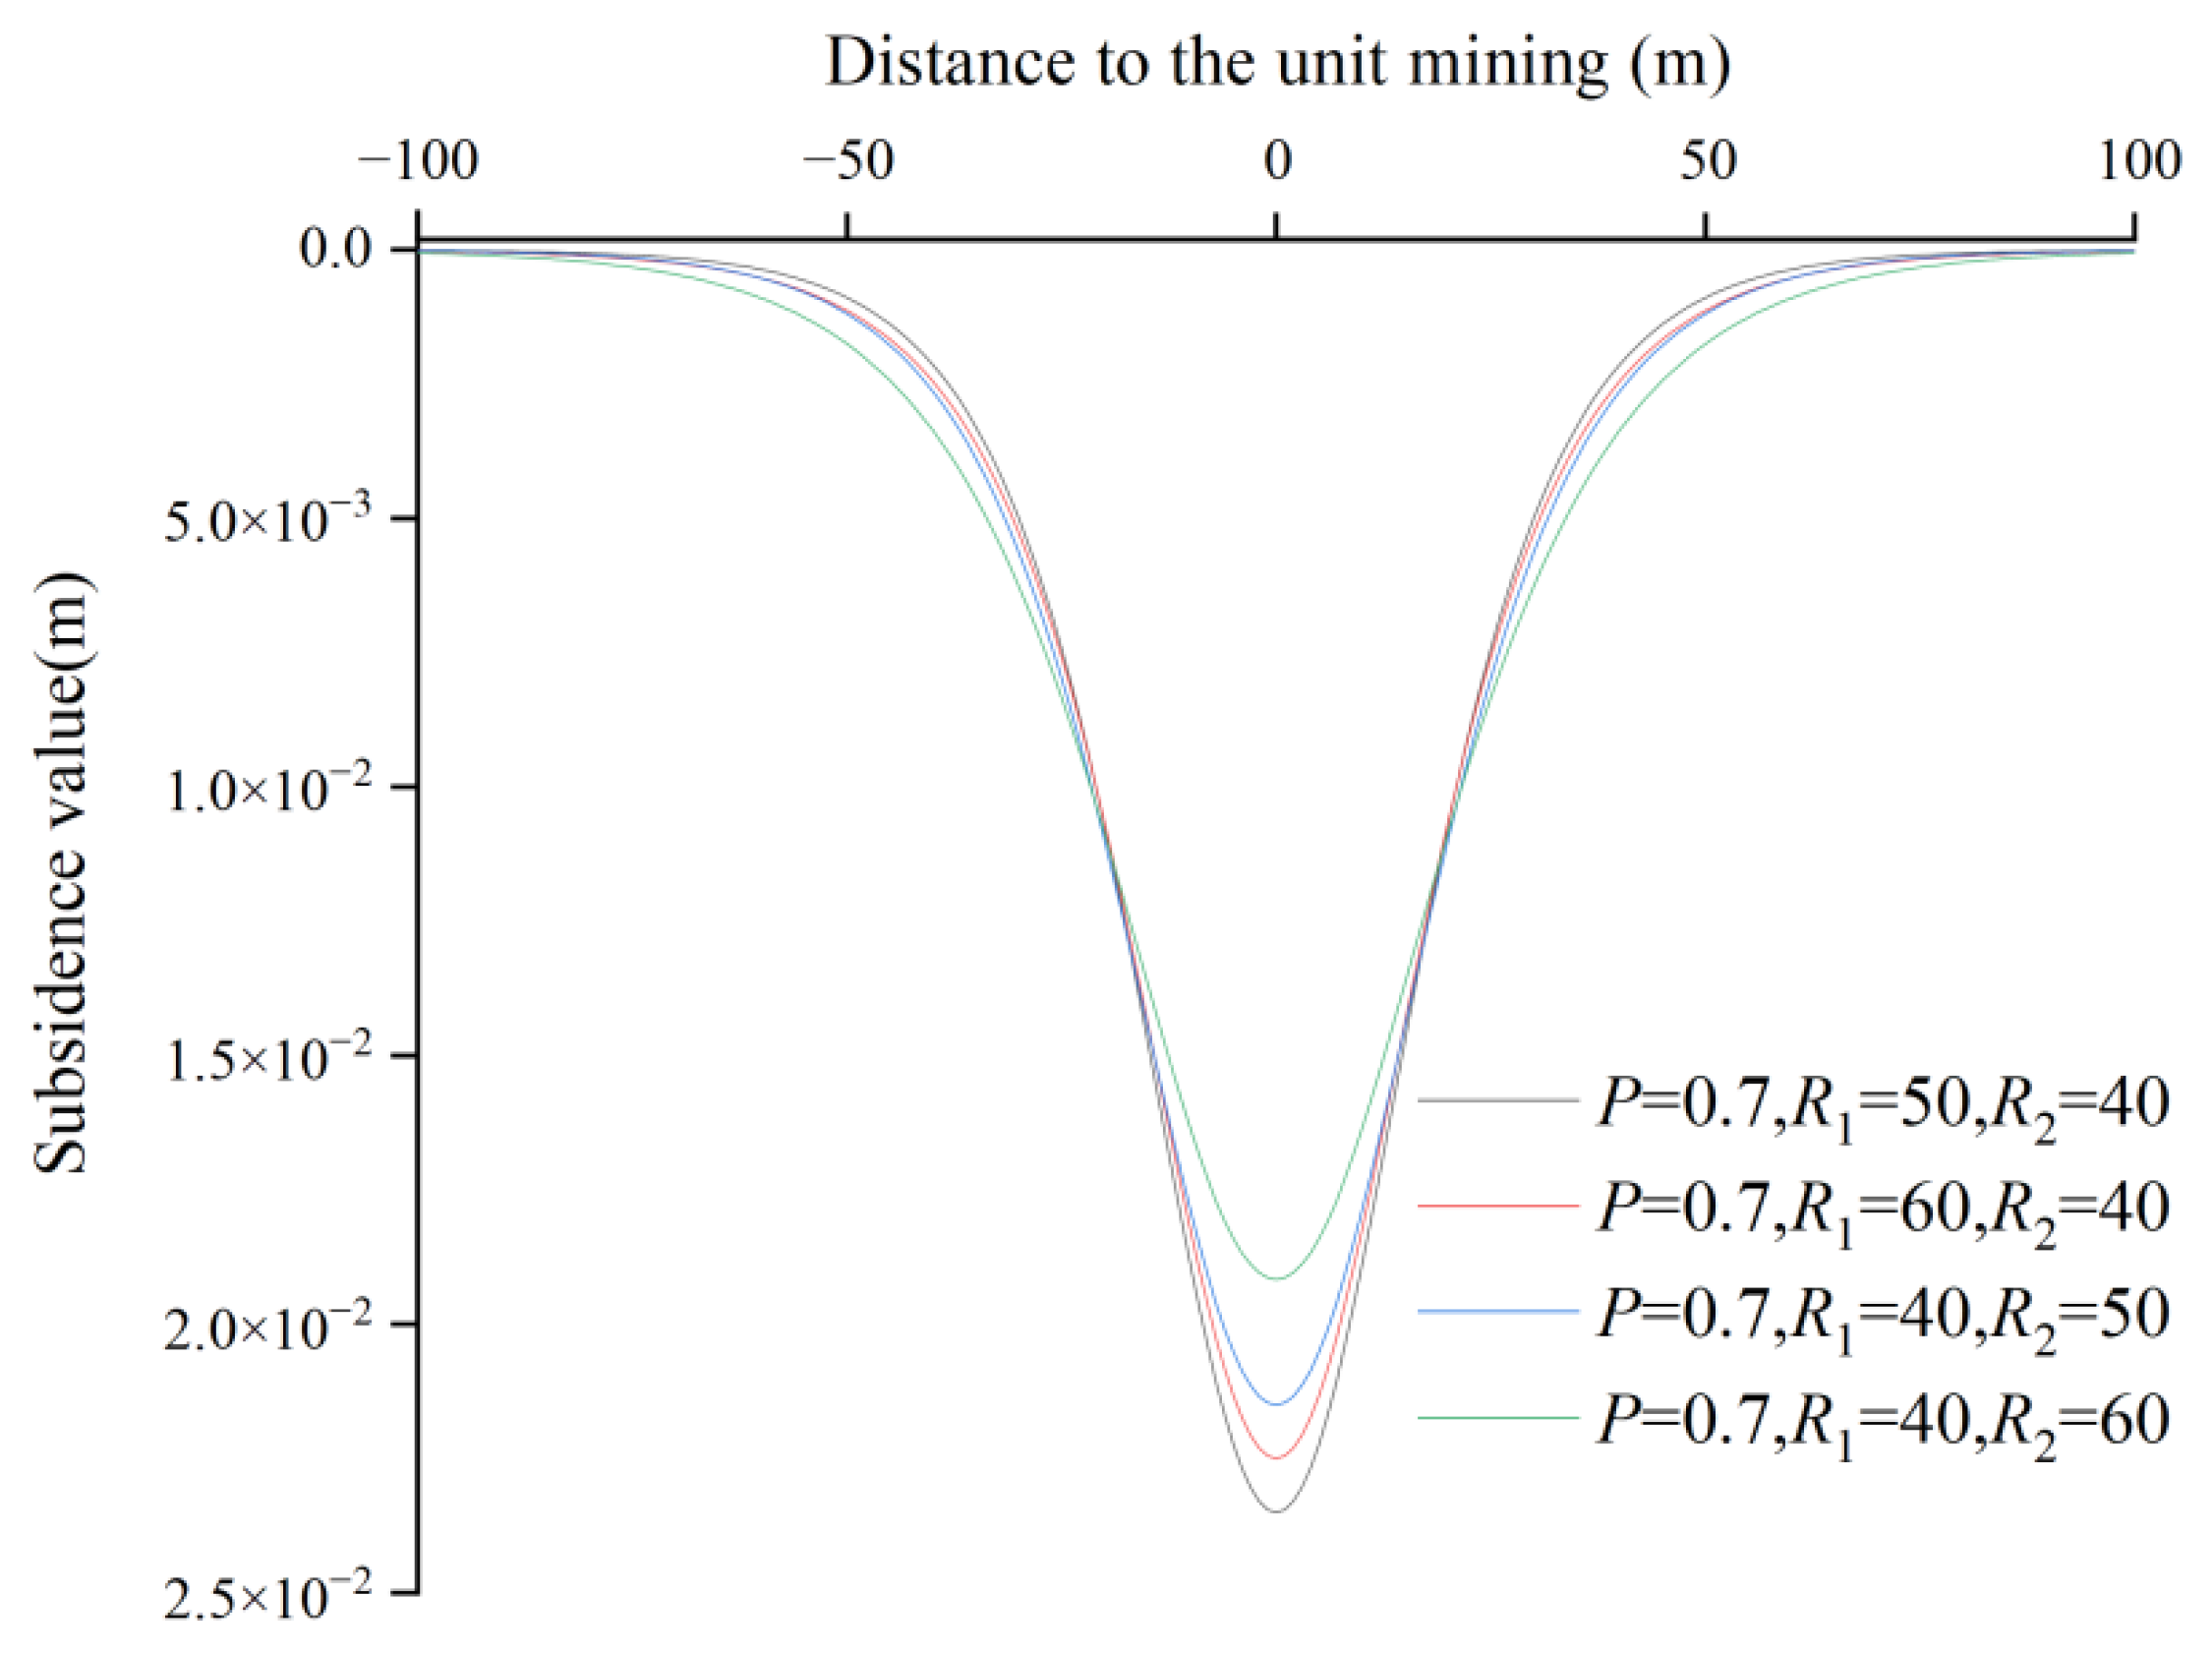
According to the measured data from the surface monitoring point of the 11111 working face, it is known that the angle parameter of the surface subsidence basin is small and the subsidence range is large. According to the numerical simulation results, it can be seen that the subsidence value and subsidence range increase with the increase in the thickness of the loose layer. The surface subsidence value is proportional to the thickness of the loose layer, and the surface subsidence value and the ratio of bedrock to the loose layer are exponentially related.
(2)
The hyperbolic secant function is used as the mining unit influence function to derive the mining unit surface subsidence estimation formula. Firstly, the surface subsidence estimation formula for semi-infinite mining is derived on the basis of unit mining, and then the surface subsidence estimation formula for the main section of finite mining is derived on the basis of semi-infinite mining. Finally, the formula for surface subsidence at any point of the surface is derived.
(3)
The hyperbolic secant subsidence prediction model constructed in this paper and the conventional probabilistic integral method are used for the subsidence prediction of the 11111 working face. The predicted values of the hyperbolic secant subsidence prediction model are closer to the measured values at the subsidence boundary and near the maximum value. The MAE and RMSE values of the hyperbolic secant subsidence prediction model are smaller than those of the conventional probability integral method. The RMSE values of the predicted values from the hyperbolic secant subsidence prediction model were improved by 38% and 37% at all monitoring points and the subsidence boundary monitoring points, respectively.

Author Contributions

Conceptualization, J.Z.; methodology, J.Z., L.X. and J.L.; software, J.Z. and Y.Y.; validation, J.Z., H.D. and R.X.; formal analysis, J.Z.; investigation, J.Z.; resources, J.Z.; data curation, J.Z. and J.L.; writing—original draft preparation, J.Z.; writing—review and editing, J.Z. and R.X.; visualization, J.Z.; supervision, J.Z.; project administration, J.Z.; funding acquisition, Y.Y. All authors have read and agreed to the published version of the manuscript.

Funding

This research was funded by the National Natural Science Foundation of China grant number [51574242] and the Fundamental Research Funds for the Central Universities grant number [2022YJSDC20,2022YJSDC19]. The APC was funded by [2022YJSDC20].

Institutional Review Board Statement

Not applicable.

Informed Consent Statement

Not applicable.

Data Availability Statement

Not applicable.

Acknowledgments

We thank Changjian Xie for his help in the derivation of the equations in the paper. We thank Zhou Bang for his comments during the revision process of the paper. We thank Huainan Mining Group for their help in our data collection process.

Conflicts of Interest

The authors declare no conflict of interest.

References

  1. Ma, J.B.; Yin, D.W.; Jiang, N.; Wang, S.; Yao, D.H. Application of a superposition model to evaluate surface asymmetric settlement in a mining area with thick bedrock and thin loose layer. J. Clean. Prod. 2021, 9, 128075. [Google Scholar] [CrossRef]
  2. Hou, D.F.; Li, D.H.; Xu, G.S.; Zhang, Y.B. Superposition model for analyzing the dynamic ground subsidence in mining area of thick loose layer. Int. J. Min. Sci. Technol. 2018, 4, 663–668. [Google Scholar] [CrossRef]
  3. Zhou, D.W.; Wu, K.; Li, L.; Diao, X.M. A new methodology for studying the spreading process of mining subsidence in rock mass and alluvial soil: An example from the Huainan coal mine, China. Bull. Eng. Geol. Environ. 2016, 75, 1067–1087. [Google Scholar] [CrossRef]
  4. Zhang, J.M. Study on Overburden Movement and Surface Movement under Water Loss Mining in Thick Loose Aquifer. Master’s Thesis, Anhui University of Science and Technology, Huainan, China, 2019. [Google Scholar]
  5. Chang, Q.L.; Yao, X.J.; Leng, Q.; Cheng, H.; Wu, F.F.; Zhou, H.Q.; Sun, Y.T. Strata movement of the thick loose layer under strip-filling mining method: A case study. Appl. Sci. 2021, 11, 11717. [Google Scholar] [CrossRef]
  6. Chi, S.S.; Wang, L.; Yu, X.X.; Lv, W.C.; Fang, X.J. Research on dynamic prediction model of surface subsidence in mining areas with thick unconsolidated layers. Energy Explor. Exploit. 2021, 39, 927–943. [Google Scholar] [CrossRef]
  7. Xu, Z.H.; Li, Q.S.; Li, X.B. Overburden migration and failure characteristics in mining shallow buried coal seam with thick loose layer. Adv. Mater. Sci. Eng. 2020, 8, 9024751. [Google Scholar] [CrossRef]
  8. Shi, W.P.; Li, K.X.; Yu, S.W.; Zhang, C.Z.; Li, J.K. Analysis on subsidence law of bedrock and ultrathick loose layer caused by coal mining. Geofluids 2021, 8, 8849955. [Google Scholar] [CrossRef]
  9. Cui, X.M.; Zhao, Y.L.; Wang, G.R.; Zhang, B.; Li, C.Y. Calculation of residual surface subsidence above abandoned longwall coal mining. Sustainability 2020, 12, 1528. [Google Scholar] [CrossRef]
  10. Guzy, A.; Witkowski, W.T. Land subsidence estimation for aquifer drainage induced by underground mining. Energies 2021, 14, 4658. [Google Scholar] [CrossRef]
  11. Yu, X.Y.; Li, B.B.; Li, R.B.; Duan, W.S.; Liu, P.L. Analysis of mining damage in huge thick collapsible loess of western china. J. China Univ. Min. Technol. 2008, 37, 43–47. [Google Scholar]
  12. Nakamura, N.; Akita, S.; Suzuki, T.; Koba, M.; Nakamura, S.; Nakano, T. Study of ultimate seismic response and fragility evaluation of nuclear power building using nonlinear three-dimensional finite element model. Nucl. Eng. Des. 2010, 1, 166–180. [Google Scholar] [CrossRef]
  13. He, G.Q.; Yang, L.; Li, G.D.; Jia, F.C.; Hou, D. Mining Subsidence Science, 1st ed.; China University of Mining and Technology Press: Xuzhou, China, 1991; pp. 116–187. [Google Scholar]
  14. Tzampoglou, P.; Loupasakis, C. Numerical simulation of the factors causing land subsidence due to overexploitation of the aquifer in the Amyntaio open coal mine, Greece. HydroResearch 2019, 3, 8–24. [Google Scholar] [CrossRef]
  15. Marino, G.; Osouli, A.; Elgendy, M.; Karimpour, M. Utilization of historical subsidence data for prediction of adverse subsidence conditions over trona mine. Int. J. Geomech. 2017, 2, 2017. [Google Scholar] [CrossRef]
  16. Dudek, M.; Tajdus, K. FEM for prediction of surface deformations induced by flooding of steeply inclined mining seams. Geomech. Energy Environ. 2021, 11, 100254. [Google Scholar] [CrossRef]
  17. Li, C.Y.; Ding, L.Z.; Cui, X.M.; Zhao, Y.L.; He, Y.H.; Zhang, W.Z.; Bai, Z.H. Calculation model for progressive residual surface subsidence above mined-out areas based on logistic time function. Energies 2022, 15, 5024. [Google Scholar] [CrossRef]
  18. Sun, Y.J.; Zuo, J.P.; Karakus, M.; Liu, L.; Zhou, H.W.; Yu, M.L. A new theoretical method to predict strata movement and surface subsidence due to inclined coal seam mining. Rock Mech. Rock Eng. 2021, 54, 2723–2740. [Google Scholar] [CrossRef]
  19. Liu, B.C. Stochastic medium theory and its application to excavation-induced ground subsidence problems. Chin. J. Nonferrous Met. 1992, 9, 8–14. [Google Scholar] [CrossRef]
  20. Liu, B.C.; Dai, H.Y. Research development and origin of probability integral method. Coal Min. Technol. 2016, 21, 1–3. [Google Scholar] [CrossRef]
  21. Ghabraie, B.; Ren, G.; Barbato, J.; Smith, J.V. A predictive methodology for multi-seam mining induced subsidence. Int. J. Rock Mech. Min. Sci. 2017, 3, 280–294. [Google Scholar] [CrossRef]
  22. He, G.Q. The Weber-distribution method for calculating mining subsidence. J. China Univ. Min. Technol. 1988, 17, 8–15. [Google Scholar]
  23. Guo, G.L.; Zhu, X.J.; Zha, J.F.; Wang, Q. Subsidence prediction method based on equivalent mining height theory for solid backilling mining. Trans. Nonferrous Met. Soc. China 2014, 24, 3302–3308. [Google Scholar] [CrossRef]
  24. Yan, W.T.; Chen, J.J.; Yan, Y.G. A new model for predicting surface mining subsidence: The improved lognormal function model. Geosci. J. 2019, 23, 165–174. [Google Scholar] [CrossRef]
  25. Yan, Y.G.; Yan, W.T.; Liu, J.B.; Guo, J.T. The prediction model of super large subsidence in high water table coal mining areas covered with thick unconsolidated layer. Geofluids 2021, 3, 5520548. [Google Scholar] [CrossRef]
  26. Dai, H.Y.; Lian, X.G.; Liu, J.Y.; Liu, Y.X.; Zhou, Y.M.; Deng, W.N.; Cai, Y.F. Model study of deformation induced by fully mechanized caving below a thick loess layer. Int. J. Rock Mech. Min. Sci. 2010, 47, 1027–1033. [Google Scholar] [CrossRef]
  27. Zhao, B.C.; Guo, Y.X.; Mao, X.W.; Zhai, D.; Zhu, D.F.; Huo, Y.M.; Sun, Z.D.; Wang, J.B. Prediction method for surface subsidence of coal seam mining in loess donga based on the probability integration model. Energies 2022, 15, 2282. [Google Scholar] [CrossRef]
  28. Perzylo, D. A new model for forecasting of land surface subsidence caused by underground extraction of deposits. Int. J. Environ. Sci. Technol. 2022, 5, 2022. [Google Scholar] [CrossRef]
  29. Yang, B.C.; Chen, Q. A half-discrete hardy-hilbert-type inequality related to hyperbolic secant function. J. Inequal. Appl. 2015, 12, 405. [Google Scholar] [CrossRef]
  30. Zhang, X.D.; Zhao, Y.H.; Liu, S.J. A new method of calculating surface subsidence and deformations under thick alluvial soil. Chin. J. Nonferrous Met. 1999, 9, 435–440. [Google Scholar] [CrossRef]
  31. He, P.; Wang, D.P.; Gao, B.B. Applying hyperbolic function to predict the surface movement and deformation in the conditionof thick alluvium. Coal Min. Technol. 2005, 10, 3–5. [Google Scholar]
  32. Li, P.X.; Tan, Z.X.; Yan, L.L. A shaft pillar mining subsidence calculation using both probability integral method and numerical simulation. CMES-Comput. Model. Eng. Sci. 2018, 117, 231–250. [Google Scholar] [CrossRef]
  33. Wang, G.R.; Li, P.X.; Wu, Q.; Cui, X.M.; Tan, Z.X. Numerical simulation of mining-induced damage in adjacent tunnels based on FLAC3D. Adv. Civ. Eng. 2021, 1, 9855067. [Google Scholar] [CrossRef]
Figure 1. Schematic diagram of the subsidence of thick loose layer.
Minerals 12 01023 g001
Figure 2. The relative position of working face and monitoring point.
Minerals 12 01023 g002
Figure 3. The measurement process of monitoring points. (a) Surface monitoring point measurement. (b) Underwater monitoring point measurement.
Minerals 12 01023 g003
Figure 4. The relationship between the main influence radii R1, R2, and the unit mining subsidence values.
Minerals 12 01023 g004
Figure 5. Surface subsidence during semi-infinite mining.
Minerals 12 01023 g005
Figure 6. Surface subsidence in the main section of the limited mining strike.
Minerals 12 01023 g006
Figure 7. Surface subsidence in the main section of the limited mining inclination.
Minerals 12 01023 g007
Figure 8. The spatial coordinate system for the subsidence of any point.
Minerals 12 01023 g008
Figure 9. Stratigraphic information of the working face 11111.
Minerals 12 01023 g009
Figure 10. Geometric dimensions and boundary conditions.
Minerals 12 01023 g010
Figure 11. Numerical simulation model.
Minerals 12 01023 g011
Figure 12. Measured subsidence value of main section of 11111 working face. (a) Measured values of strike main section. (b) Measured values of inclination main section.
Minerals 12 01023 g012
Figure 13. Comparison of predicted values of different models. (a) Predicted values of L-line. (b) Predicted values of S-line.
Minerals 12 01023 g013
Figure 14. Comparison of predicted values of subsidence boundaries of different models. (a) Predicted values of L-line. (b) Predicted values of S-line.
Minerals 12 01023 g014
Figure 15. Numerical simulation of subsidence curve.
Minerals 12 01023 g015
Figure 16. Relationship between surface subsidence value and thickness of loose layer.
Minerals 12 01023 g016
Figure 17. Relationship between surface subsidence values and the ratio of bedrock to loose layer.
Minerals 12 01023 g017
Table 1. Model physical and mechanical parameters.
Overlying RocksTensile Strength (Mpa)Elastic Modulus (Gpa)Poisson's RatioCohesionInternal Friction Angle (°)Weight Capacity (kN/m3)
Loose layer0.250.0450.250.011818.24
Siltstone 10.8112.90.253.22826.98
Coarse sandstone1.55.10.223.83325.6
Sandy mudstone 10.7912.50.261.72526.88
Siltstone 20.8112.90.253.22826.98
Sandy mudstone 20.7912.50.261.72526.88
Medium sandstone1.312.90.261.23325.8
Sandy mudstone 30.7912.50.261.72526.88
Coal 30.0310.31.052714.6
Siltstone 30.8112.90.253.22826.98
Coal 10.0310.31.052714.6
Siltstone interlayer2.815.20.255.23427.21
Table 2. Model prediction error.
ModelsAll PointsL-LineS-Line
MAE (mm)RMSE (mm)MAE (mm)RMSE (mm)MAE (mm)RMSE (mm)
Probability integral method116.768220.179178.061302.94360.19192.270
Hyperbolic secant subsidence prediction model68.900135.856118.847189.99522.79546.609
Accuracy improvement rate41%38%33%37%62%49%
Table 3. Model prediction error.
ModelsBoundary of All PointsBoundary of L-LineBoundary of S-Line
MAE (mm)RMSE (mm)MAE (mm)RMSE (mm)MAE (mm)RMSE (mm)
Probability integral method150.226194.623163.875230.148136.576150.955
Hyperbolic secant subsidence prediction model73.237122.770107.334157.57039.14072.914
Accuracy improvement rate51%37%35%32%71%52%
Publisher’s Note: MDPI stays neutral with regard to jurisdictional claims in published maps and institutional affiliations.

