Article

Mechanical Properties and Failure Mechanism of the Weakly Cemented Overburden in Deep Mining

1
School of Surveying and Geo-Informatics, Shandong Jianzhu University, Ji’nan 250101, China
2
Post-Doctoral Workstation of Technology Research Institute, Shandong Energy Group Co., Ltd., Ji’nan 250101, China
3
School of Environmental Science and Spatial Informatics, China University of Mining and Technology, Xuzhou 221116, China
4
Technology Research Institute, Shandong Energy Group Co., Ltd., Ji’nan 250101, China
5
School of Civil Engineering, Shandong Jianzhu University, Ji’nan 250101, China
*
Author to whom correspondence should be addressed.
Minerals 2022, 12(10), 1276; https://doi.org/10.3390/min12101276
Submission received: 4 September 2022 / Revised: 30 September 2022 / Accepted: 7 October 2022 / Published: 10 October 2022
(This article belongs to the Special Issue Green Mining of Coal Mine in China)

Abstract

:
With increases in the mining depth and area in the Ordos coal field, the failure law of the super thick sandstone in the Zhidan group leads to frequent disasters, such as rock bursts and mine earthquakes, which have become a significant issue, restricting large-scale continuous mining. To adequately understand the movement mechanism of the super-thick and weakly cemented overburden, and to promote the large-scale mining of the coal resources under it, this study analyzes the physical and mechanical properties, along with the microstructural characteristics, of the weakly cemented overburden of the Yingpanhao Coal Mine through mechanics tests, scanning electron microscope tests (SEM) and hydrolysis experiments. A two-dimensional discrete element model of the survey region is then built to explore the temporal and spatial evolution laws of the overburden failure. The results show that, even though poorly cemented strata such as the Cretaceous Zhidan group sandstone and the Zhiluo group sandstone are weak in lithology, their unique mineral composition and microstructural characteristics give them a greater rigidity when their thickness reaches a certain value. The surface subsidence exhibits a sudden increase, and the dynamic disaster range of the overlying strata is wide when deep multi-face mining was carried out under the super-thick and weakly cemented overburden. The temporal and spatial evolution laws of the strata subsidence and influence boundary are closely related to their depth, and their relationships evolve into the Boltzmann function and Boltzmann–parabolic function, respectively. The failure mode of the super-thick and weakly cemented overburden is ‘beam–arch shell–half arch shell’, and the failure boundary exhibits arch fractures.

1. Introduction

The Ordos Basin is one of the five energy bases of China, and its deep coal resources are of strategic significance for China’s national energy development. However, the failure mechanism of its weakly cemented overburden differs from that of the weak rock and hard strata in other regions, which significantly limits the large-scale mining of deep coal resources in the area.
At present, most research focuses on the physical and mechanical properties of weakly cemented sandstone. For example, by carrying out SEM and mechanical tests, Li et al. found that both dissolution and cementation have a significant influence on a rock’s strength [1]. By studying the influence of hydration on the physical and mechanical properties of weakly cemented sandstone in the Ordos Basin, Zhao et al. discovered that rock with increased stratification or joints will form pores and crevices owing to mineral shedding during water injection. The porosity can increase by up to 2.2 times, suggesting that the influence of hydration on the physical and mechanical properties of weakly cemented sandstone cannot be ignored [2]. After collecting samples of Zhidan group sandstone from the Xutuan and Zhaoji Coal Mines, Jin et al. observed their microstructure using an electron microscope. It was determined that this kind of rock has a lower compaction degree, weaker cementation, unconsolidated structure with poor conformity, and a higher volume of highly linked micron-sized porosity [3]. Park et al. used the discrete element method to assess the fracture mechanics behavior of weakly cemented sandstone and discussed variations in the fracture toughness with particle size, notch length, and specimen size [4]. Li et al. also collected the weakly cemented sandstone in Bultai Coal Mines and carried out uniaxial compression, triaxial compression, and Brazilian split tests. They discovered that the weakly cemented sandstone is characterized by a lower cement content and larger pores between the cemented sandstone particles. Further, weakly cemented sandstone is mainly fractured along the grain boundary, which is I-shaped from a macroscopic perspective [1]. Li et al. used X-ray diffraction instruments and environmental scanning electron microscopes to study the composition and microstructure of weakly cemented sandstone, finding that the compressive strength and the modulus of elasticity are much smaller than those of conventional sandstone. However, the peak strain was found to be 1.6 times that of conventional sandstone [5]. Zhang et al. carried out triaxial compression tests and creep tests on weakly cemented sandstone, finding that it has significant creep properties. Next, based on the test data, an improved Burgers creep model was built to describe the creep properties [6].
Significant advancements have been made in research on the failure mechanism of weakly cemented strata in western China. For example, Zhen et al. used the Wanli No. 1 Coal Mine as an example to analyze the surrounding rock stability of argillaceous cementation sandstone during large-span caving mining. In addition, according to the roadway supporting conditions, several reasonable and effective supporting countermeasures and key parameters have been proposed [7]. Sun et al. carried out crushing experiments and disintegration tests to study the physical and mechanical properties of weakly cemented overburdens, conducting a difference analysis of mid-east rocks. Then, the discrete element numerical model of the research area was formulated to study the failure mechanism of the weakly cemented overburden, ascertaining the distribution characteristics of the caving zone and its collaborative evolution law with the fracture zone of the large mining height work face [8]. Using the measured data, Lin found a smaller surface subsidence in the Yingpanhao Coal Mine and then explored the structural characteristics of the overburden based on the key stratum theory. They believed that the combined action of multi-key layers is one of the main reasons for the special strata movement [9]. By assessing the physical and mechanical parameters along with SEM tests, Gao found that the Tuha coalfield overburden has typical weak cementation characteristics such as low mechanical strength, poor cementation (primarily particle contact cementation), high porosity, and a loose structure. Furthermore, it was found that the development of water-conducting fracture zones in the weakly cemented overburden is still half-space shaped, and its development height conforms to a general empirical formula [10]. Zhang et al. took 21,103 fully mechanized caving workfaces in the No.4 Mine in Yili, Xinjiang, as an example to study the movement rule of the weakly cemented overburden. They found that when there is no obvious key strata structure in the weakly cemented overburden, the mining-induced fractures in the overburden develop upward synchronously with the advancement of the working face, which manifests as the temporal and spatial evolution laws of fracture development-main roof breakdown-crack closure [11]. Zhang et al. used digital photography to monitor the similarity material model and study the movement law of a super-thick and weakly cemented overburden, finding that the first breaking span of the immediate roof reached 240 m and that the cyclic fracturing length was about 60 m [12,13]. Lu et al. studied the mining thickness effect of the water-conducting fractured zone in thick coal seam mining through field coring and laboratory mechanical tests, finding that the fracture zone exhibited linear growth and the collapse zone presented a stepwise growth pattern [14]. Li et al. explored a non-hydrophilic simulation material and carried out physical simulation tests to study the spatial distribution and dynamic evolution of the fractured zone in a weakly cemented overburden [15]. Du et al. used small baseline subset interferometric synthetic aperture radar (SBAS-InSAR) technology to study the surface subsidence law of deep mining under a weakly cemented overburden and found that the surface subsidence boundary followed a circular-parallelogram-trapezoidal shape [16]. Gong et al. established a refined numerical model to study the surface subsidence law of deep mining under the weakly cemented overburden and suggested that the surface was fully mined when the goaf length and width both reached about 3.3 h (where h is the average mining depth) [17]. Gong et al. also studied the setting method for vertical joint spacing in Universal Distinct Element Code (UDEC) and suggested that with increases in the vertical joint spacing, the maximum surface subsidence first drops, then rises, and reaches a minimum when the vertical joint spacing is set at approximately 7× the bed thickness [18]. Zhang et al. explored the surface movement rule and the influence of overburden characteristics on strata movement through field measurements and numerical simulation, suggesting that the Zhidan group sandstone has a strong control effect, whose first breakage results in the surface sinking in a fractured manner [19].
Based on the aforementioned research, it can be concluded that the physical and mechanical properties, along with the mineral composition of the weakly cemented sandstone, have been fully understood, consisting of the failure characteristics of the weakly cemented overburden in shallow coal seams. Some researchers have studied the overburden movement law in deep mining through field monitoring and numerical simulation, but little research has focused on the failure mechanism of high-level, super-thick, and weakly cemented overburdens of deep mining.
Therefore, based on our research on the physical and mechanical properties of weakly cemented sandstone in the Yingpanhao Coal Mine, this study builds a two-dimensional discrete element model of 22 mining areas to elucidate the movement rule and failure characteristics of super-thick and weakly cemented overburdens in deep mining. Finally, a theoretical basis is provided for strata movement control.

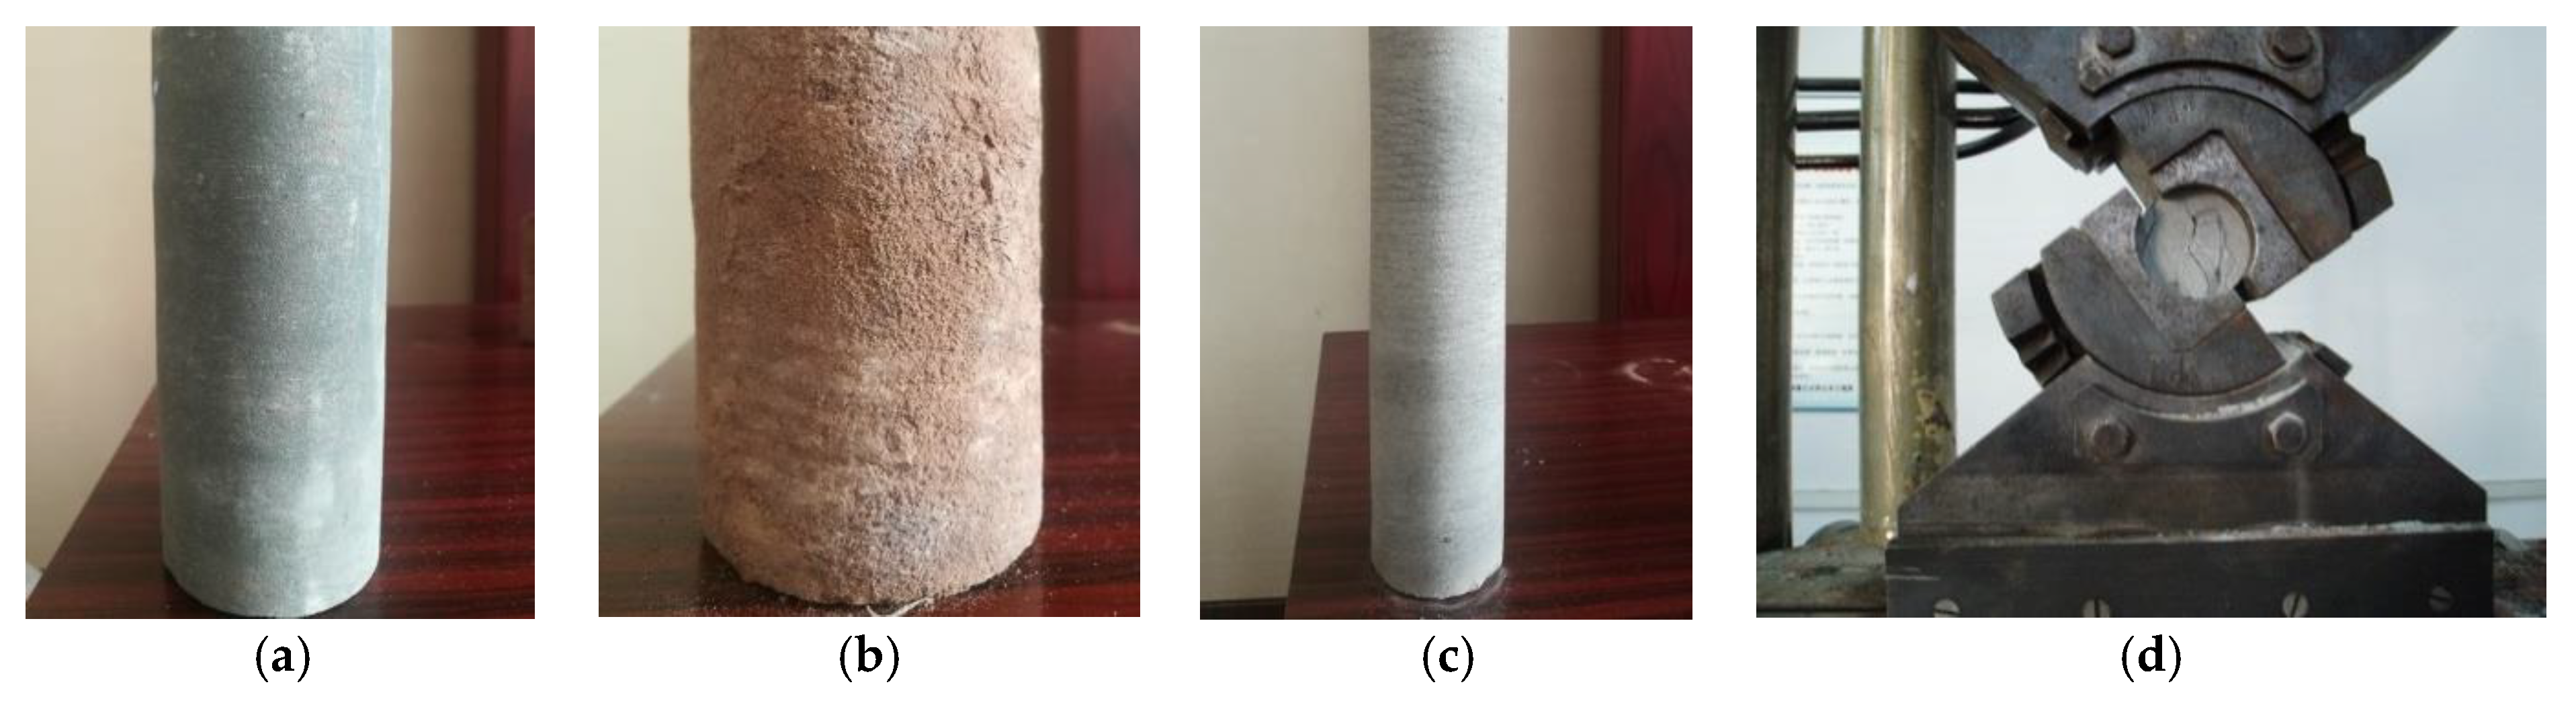
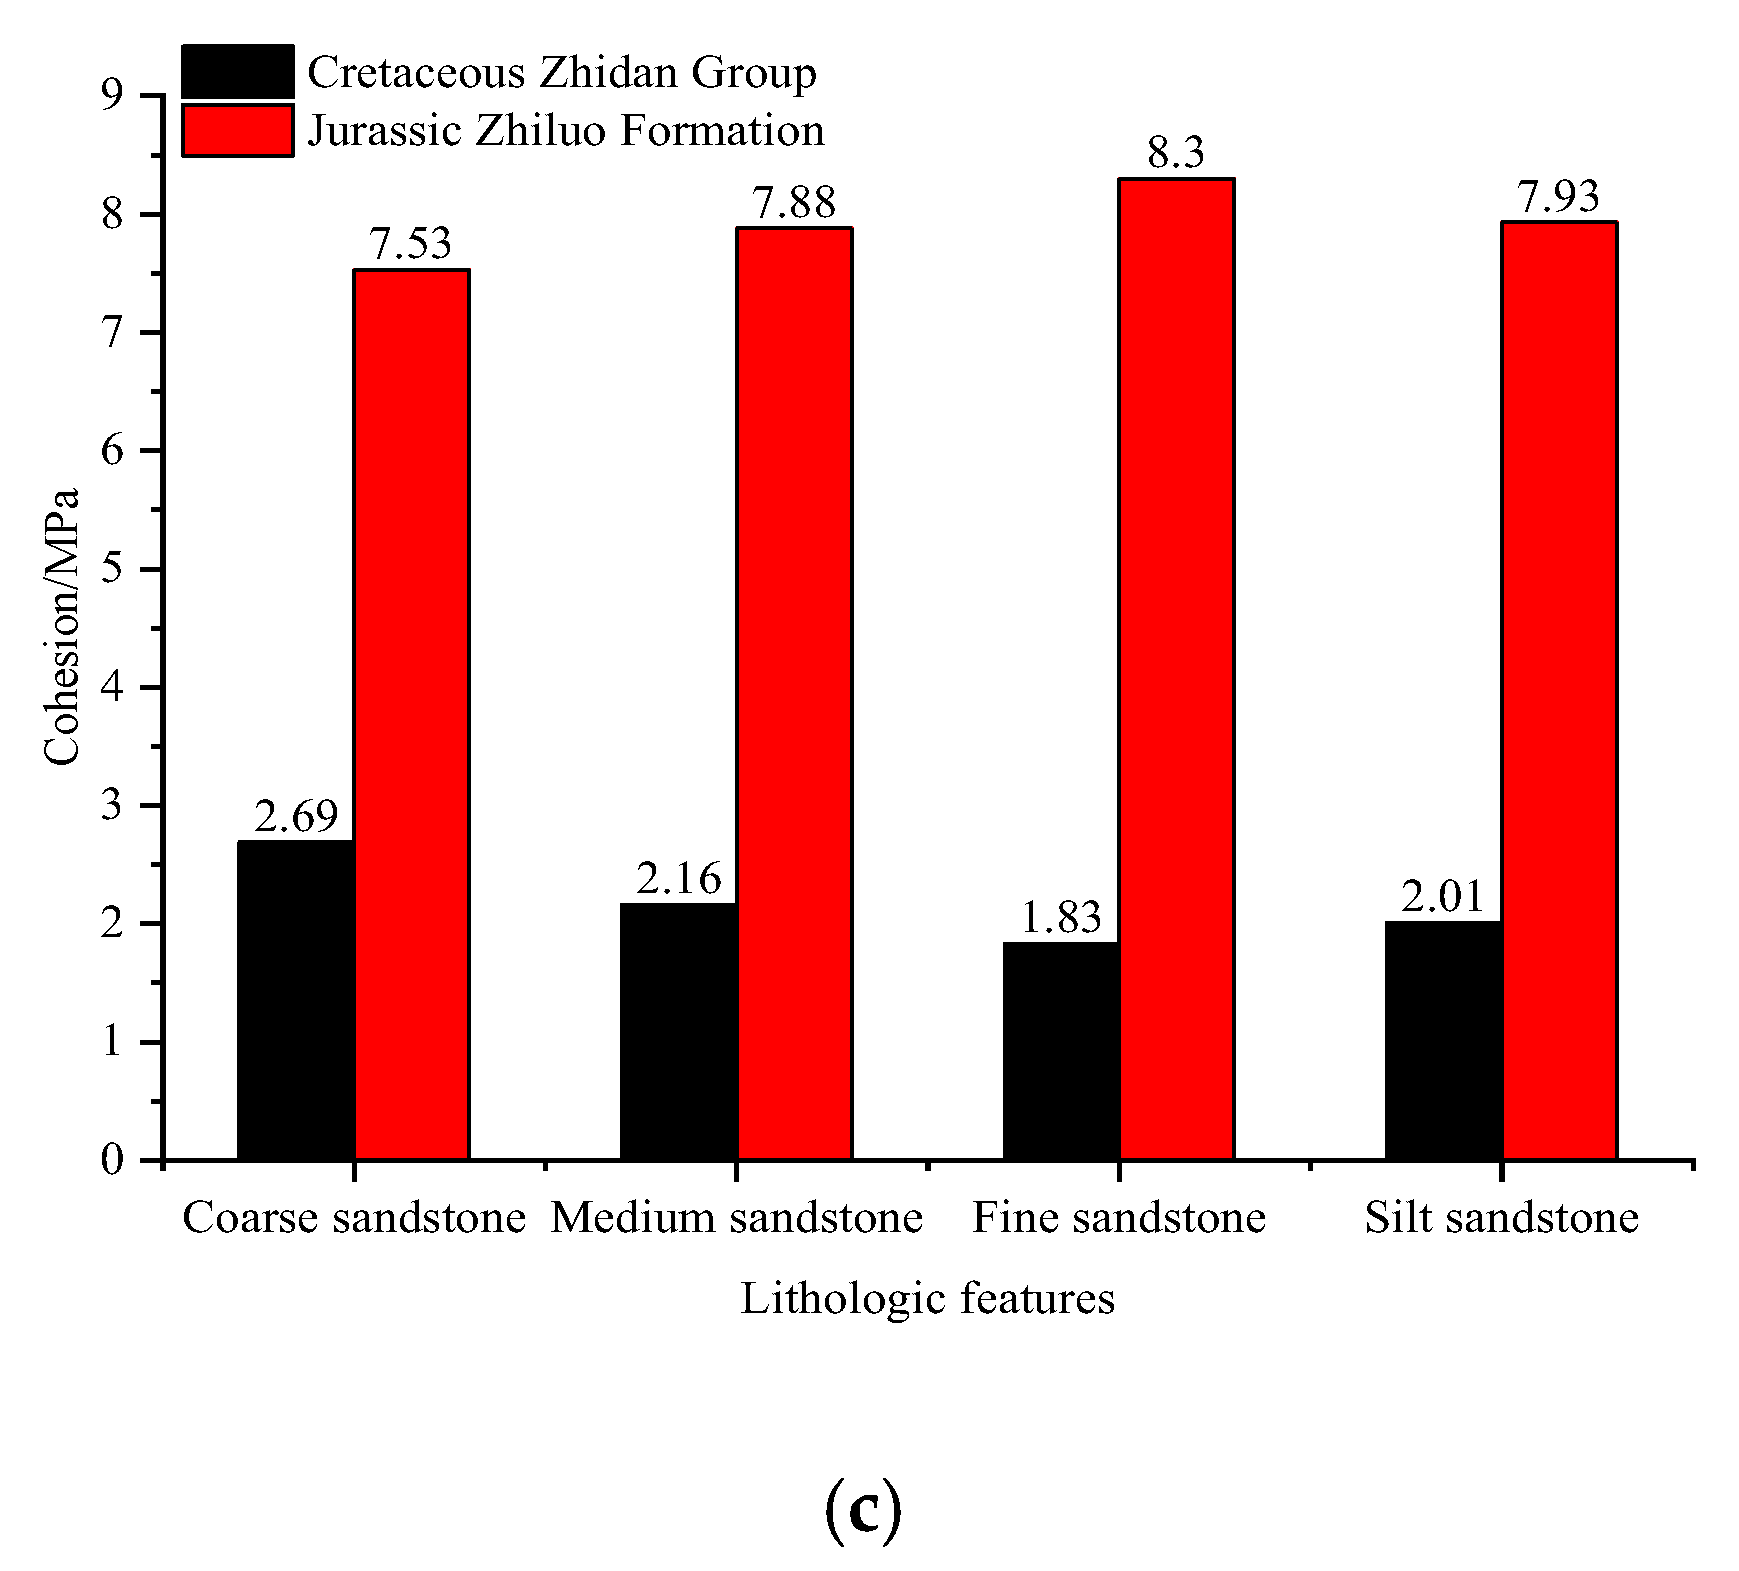
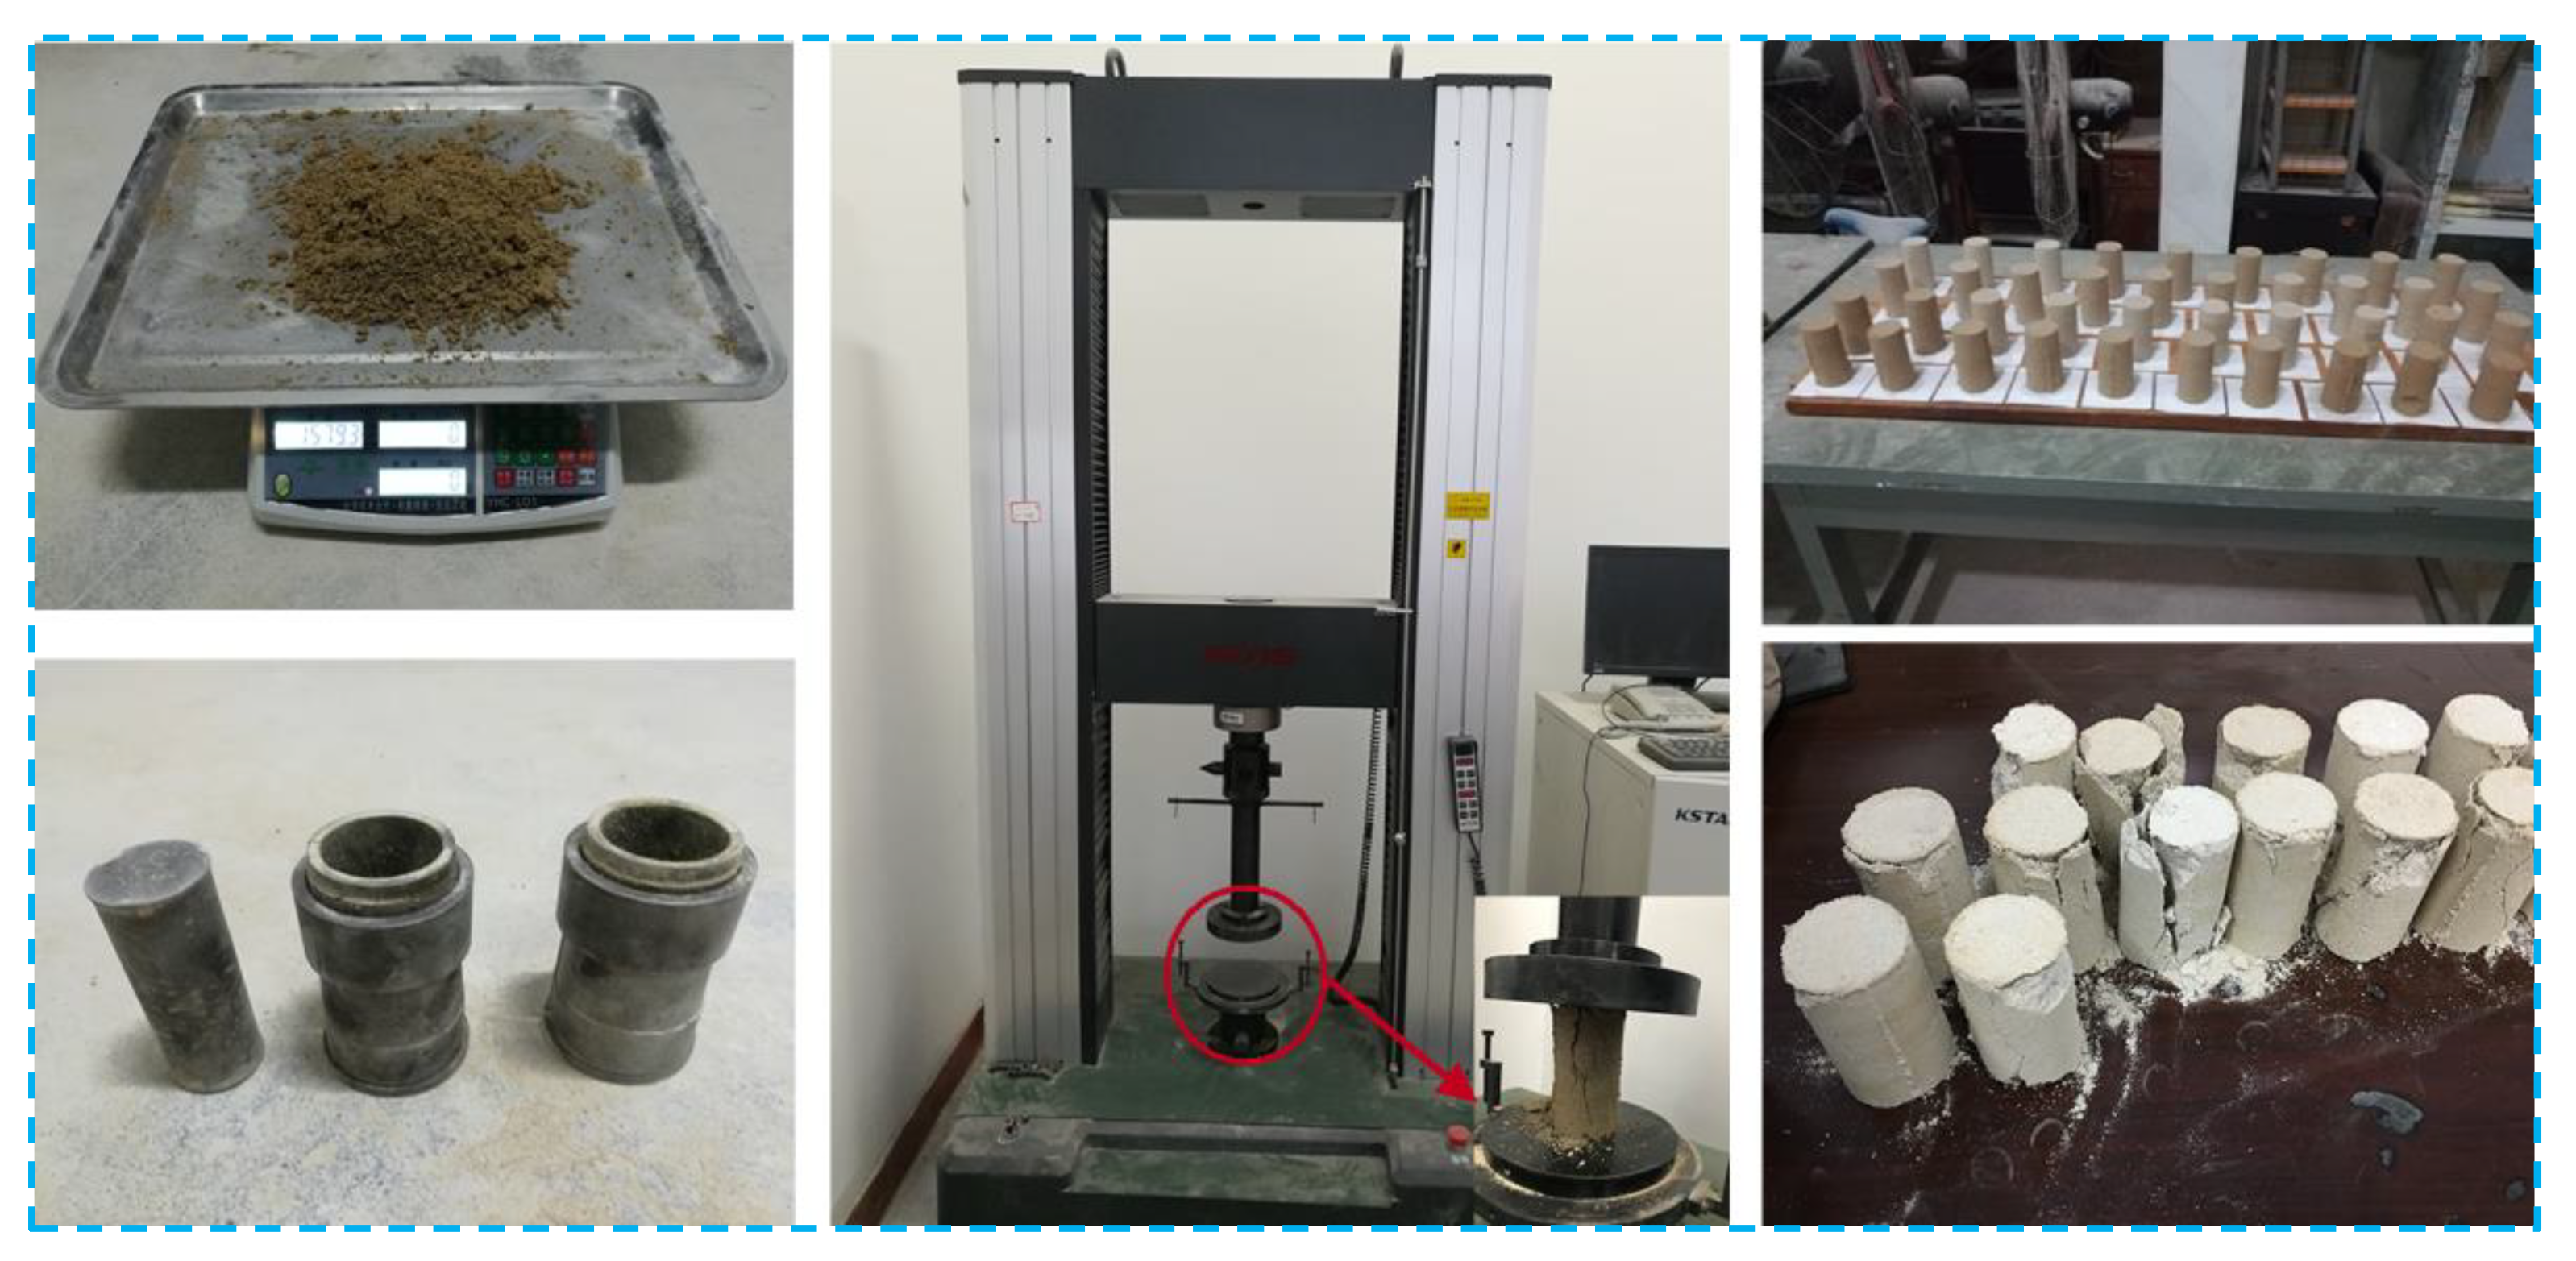
2. Mechanical Properties of Weakly Cemented Sandstone

To gain insights into the failure mechanism of super-thick and weakly cemented overburdens, we collected sandstone from the Zhidan group, Zhiluo group, and Yan’an formation from rock holes 1, 2, and 3 in the Yingpanhao Coal Mine. They were processed into multiple standard test blocks for mechanics experiments. The mechanical parameters of the partial sandstone are shown in Table 1, and pictures of partial sandstone samples are shown in Figure 1.
As can be seen from Table 1 and the corresponding data regarding other types of weak cementation rock, the compressive strength of the weak cementation rock was determined to be between 10.10 and 44.02 MPa, the elastic modulus was between 777.77–9467.59 MPa, the Poisson’s ratio was between 0.21 and 0.34, the cohesion was between 1.31 and 11.15 MPa, the internal friction angle was between 23 and 29 degree, and the density was between 1.93 and 2.55 g/cm3.
Figure 2 helps analyze the lithologies of different strata. It can be seen that the compressive strength, elastic modulus, and cohesion of the coarse sandstone, medium sandstone, fine sandstone, and silt sandstone of the Cretaceous Zhidan group were all found to be smaller than those of the corresponding strata of the Jurassic Zhiluo group. In the Cretaceous Zhidan and Jurassic Zhiluo groups, the compressive strength and elastic modulus of coarse sandstone, medium sandstone, fine sandstone, and silt sandstone were reduced accordingly. The cohesion of coarse sandstone, medium sandstone, fine sandstone, and siltstone decreased in the Jurassic Zhiluo group but increased in the Cretaceous Zhidan group.
The rock microstructure is the reason why the rock mechanics properties of the above strata differ from what is conventionally known. In the following sections, the microstructural characteristics of weakly cemented sandstone are studied through detailed experiments.

3. Physical Structural Characteristics of Weakly Cemented Sandstone

In this paper, some sandstone samples of the Zhidan group, Anding group, Zhiluo group, and Yan’an group in the Yingpanhao Coal Mine were collected. Then, scanning electron microscope (SEM) tests and mineral composition identification tests were carried out.

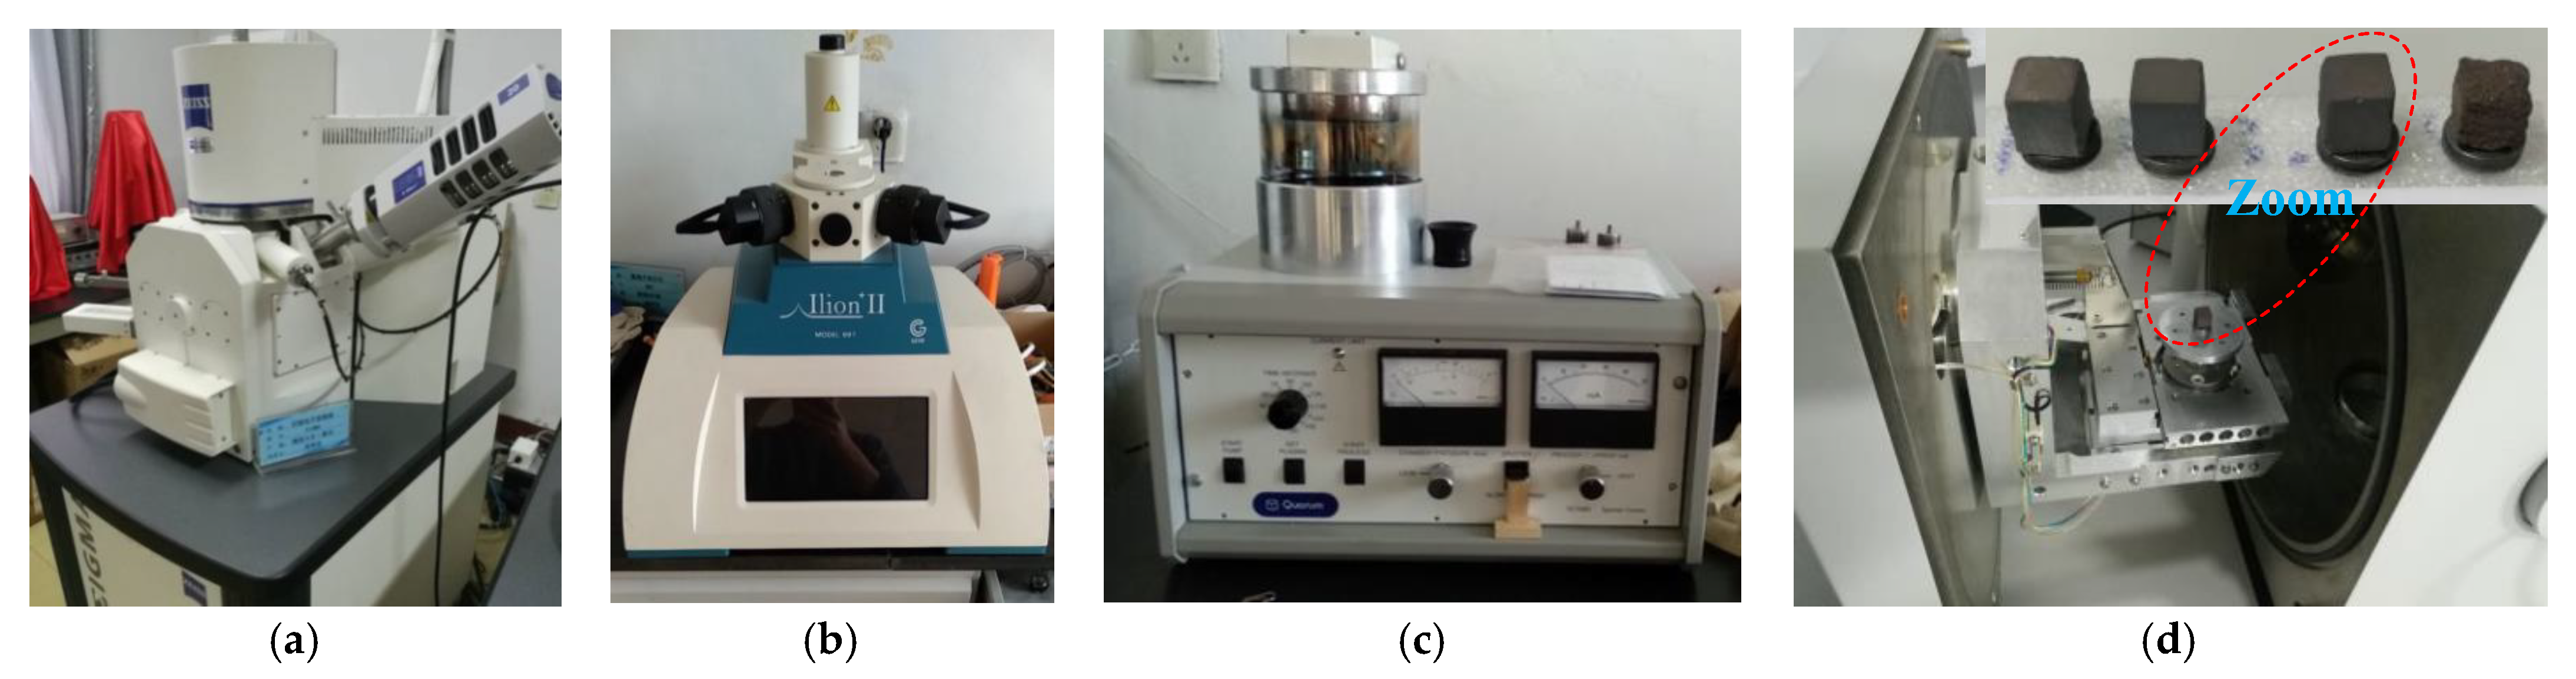
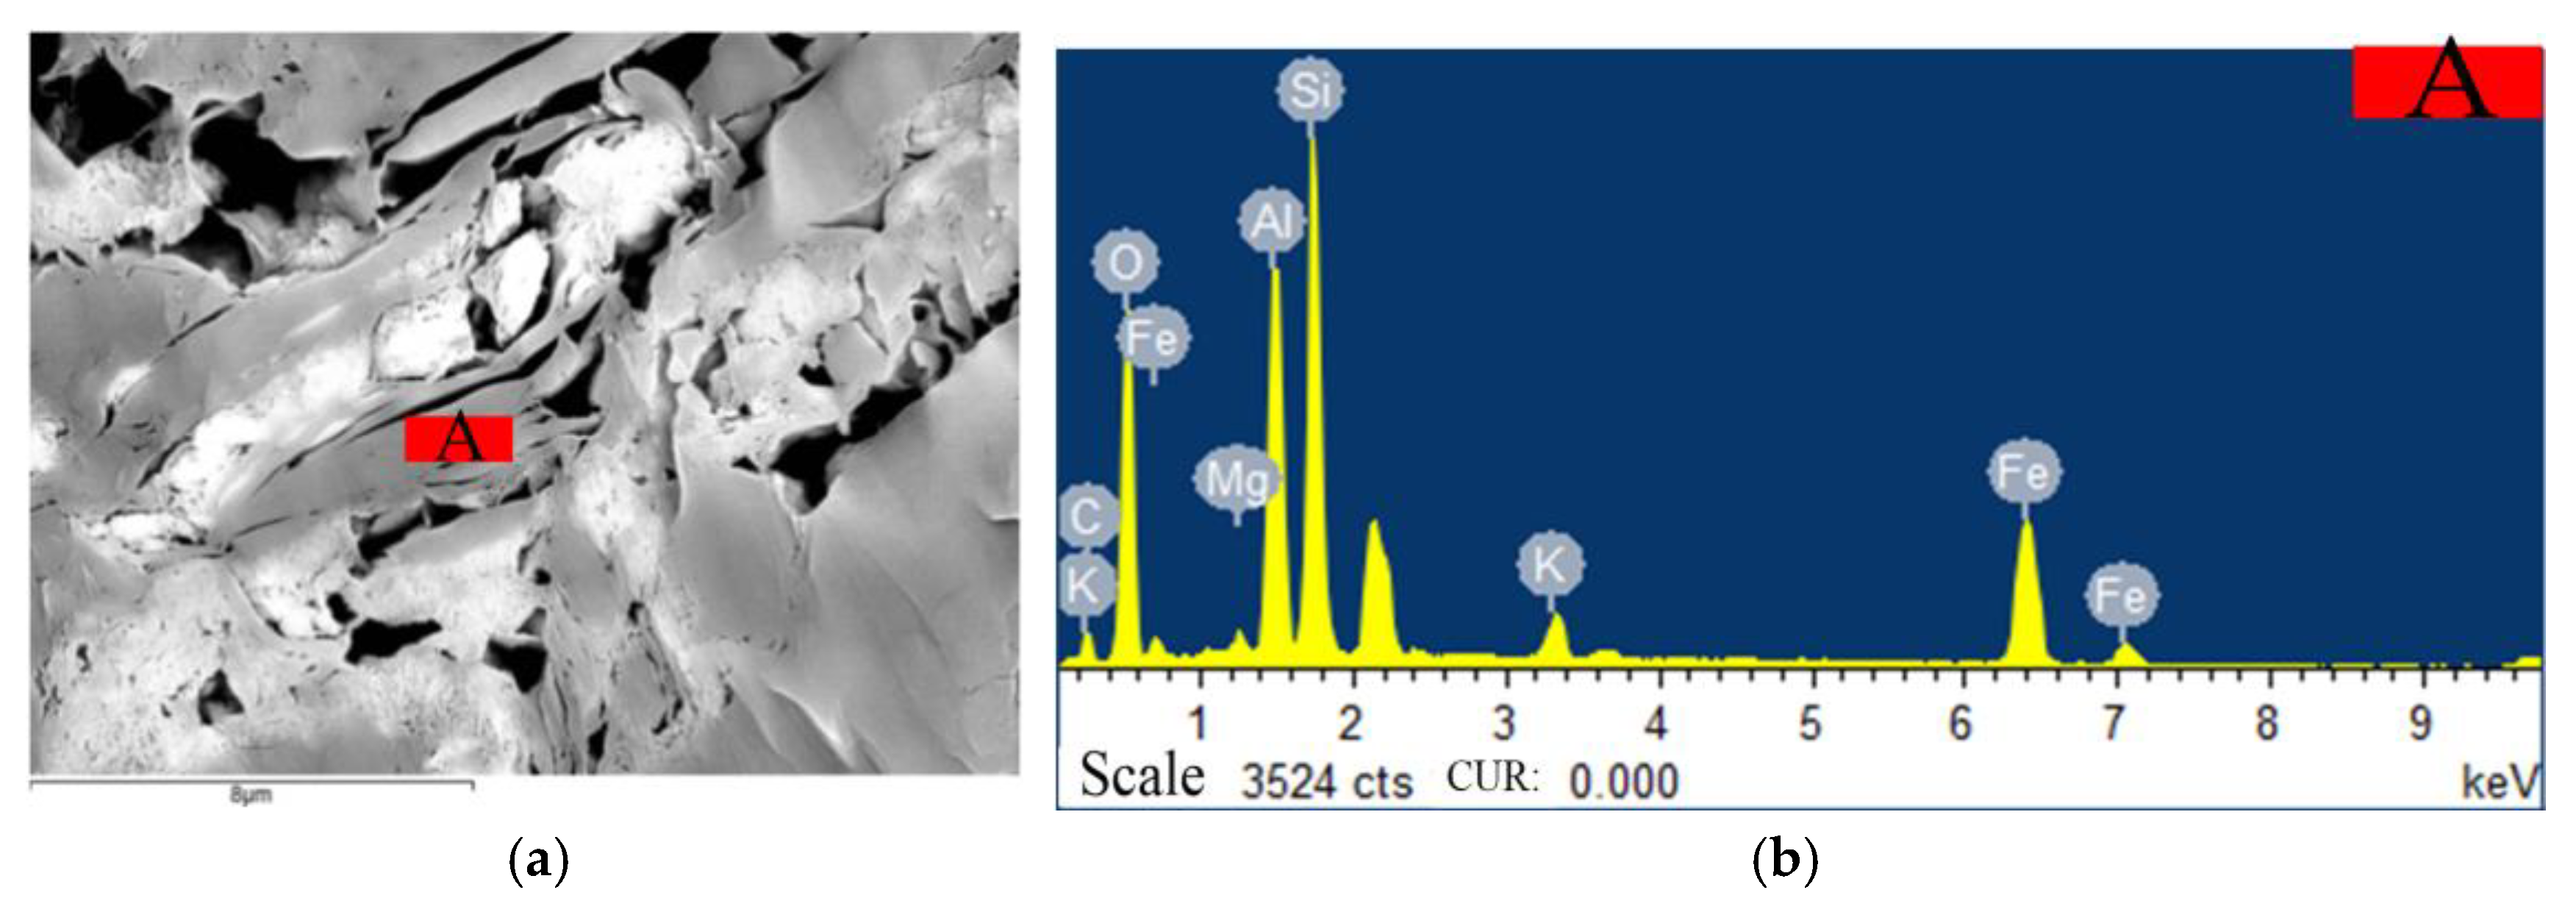
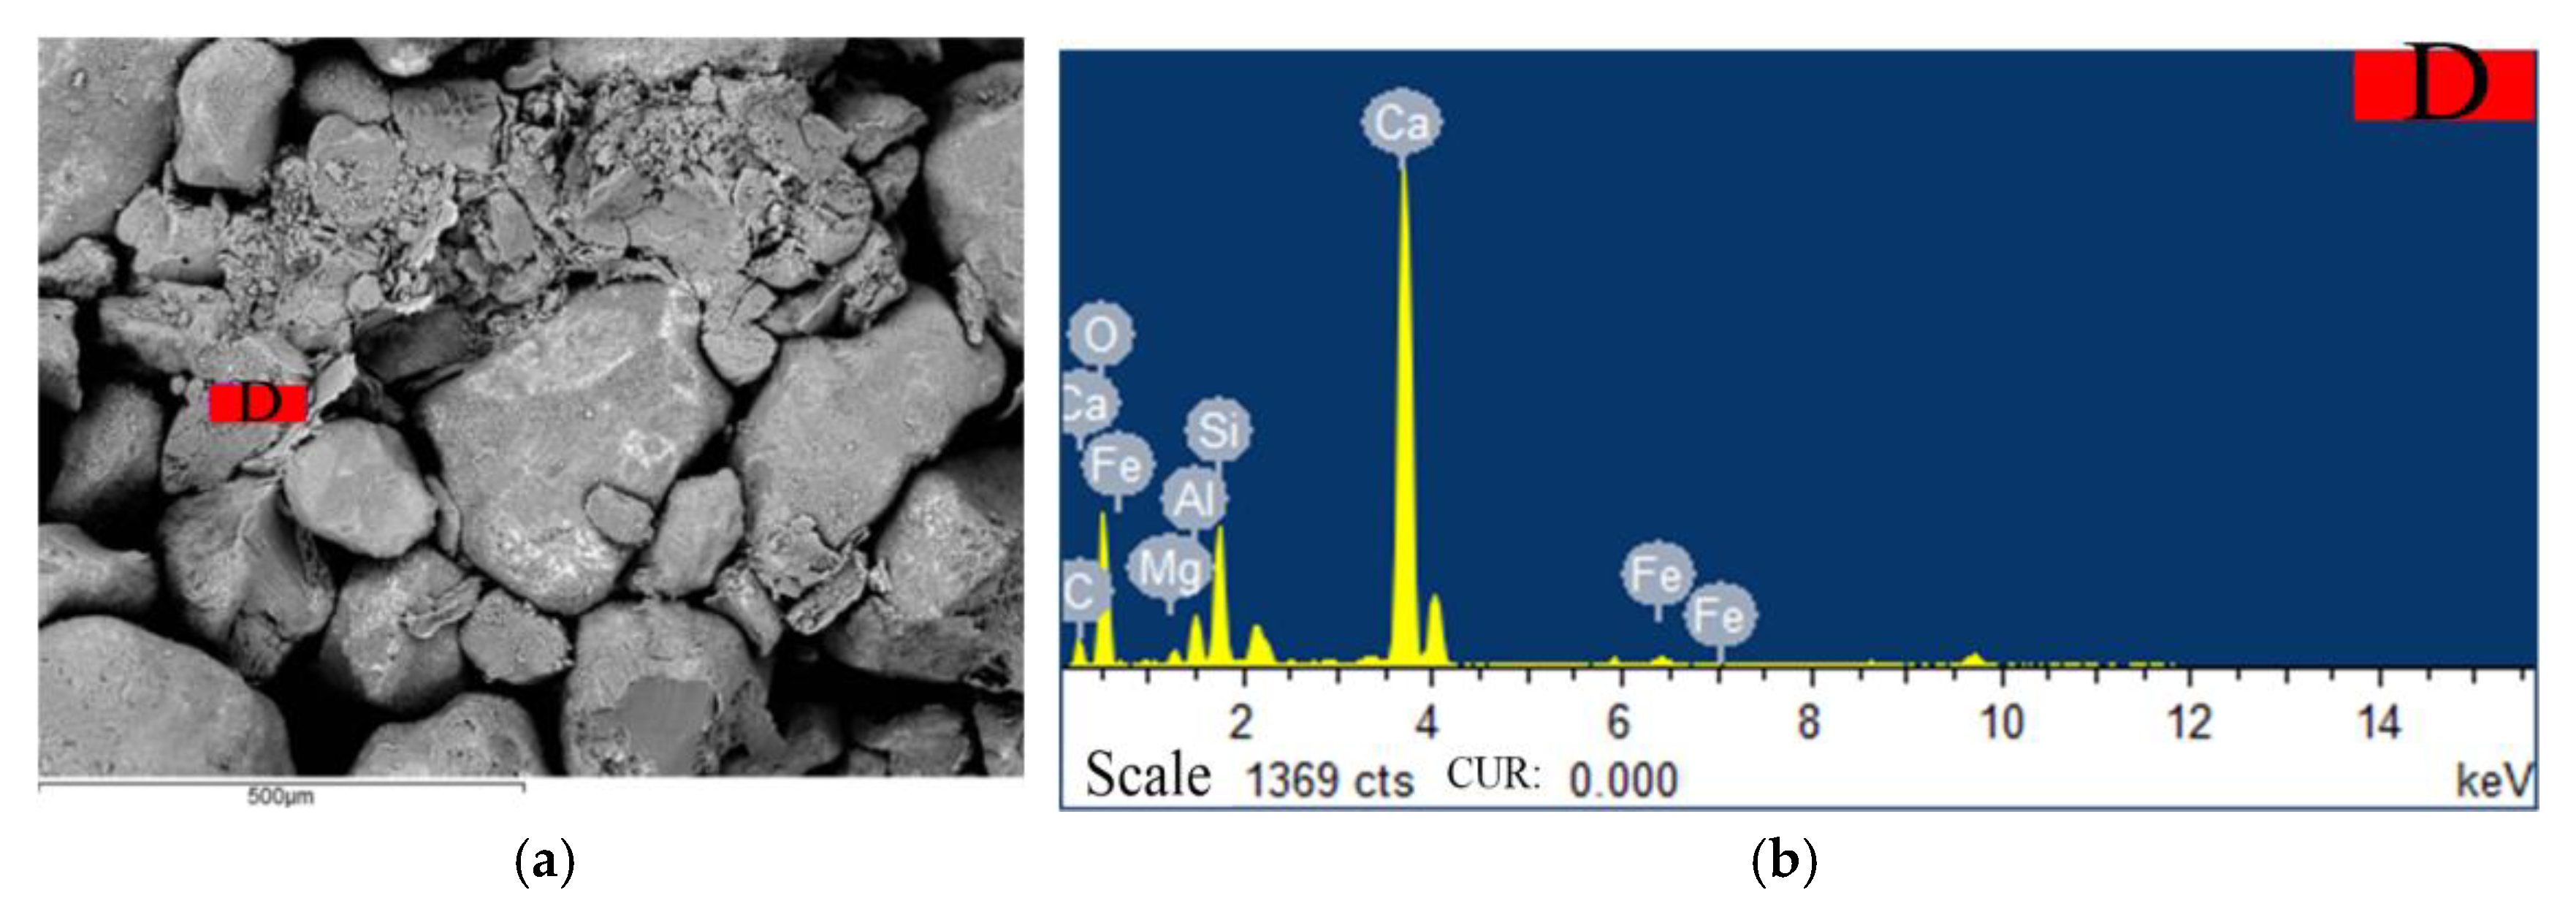
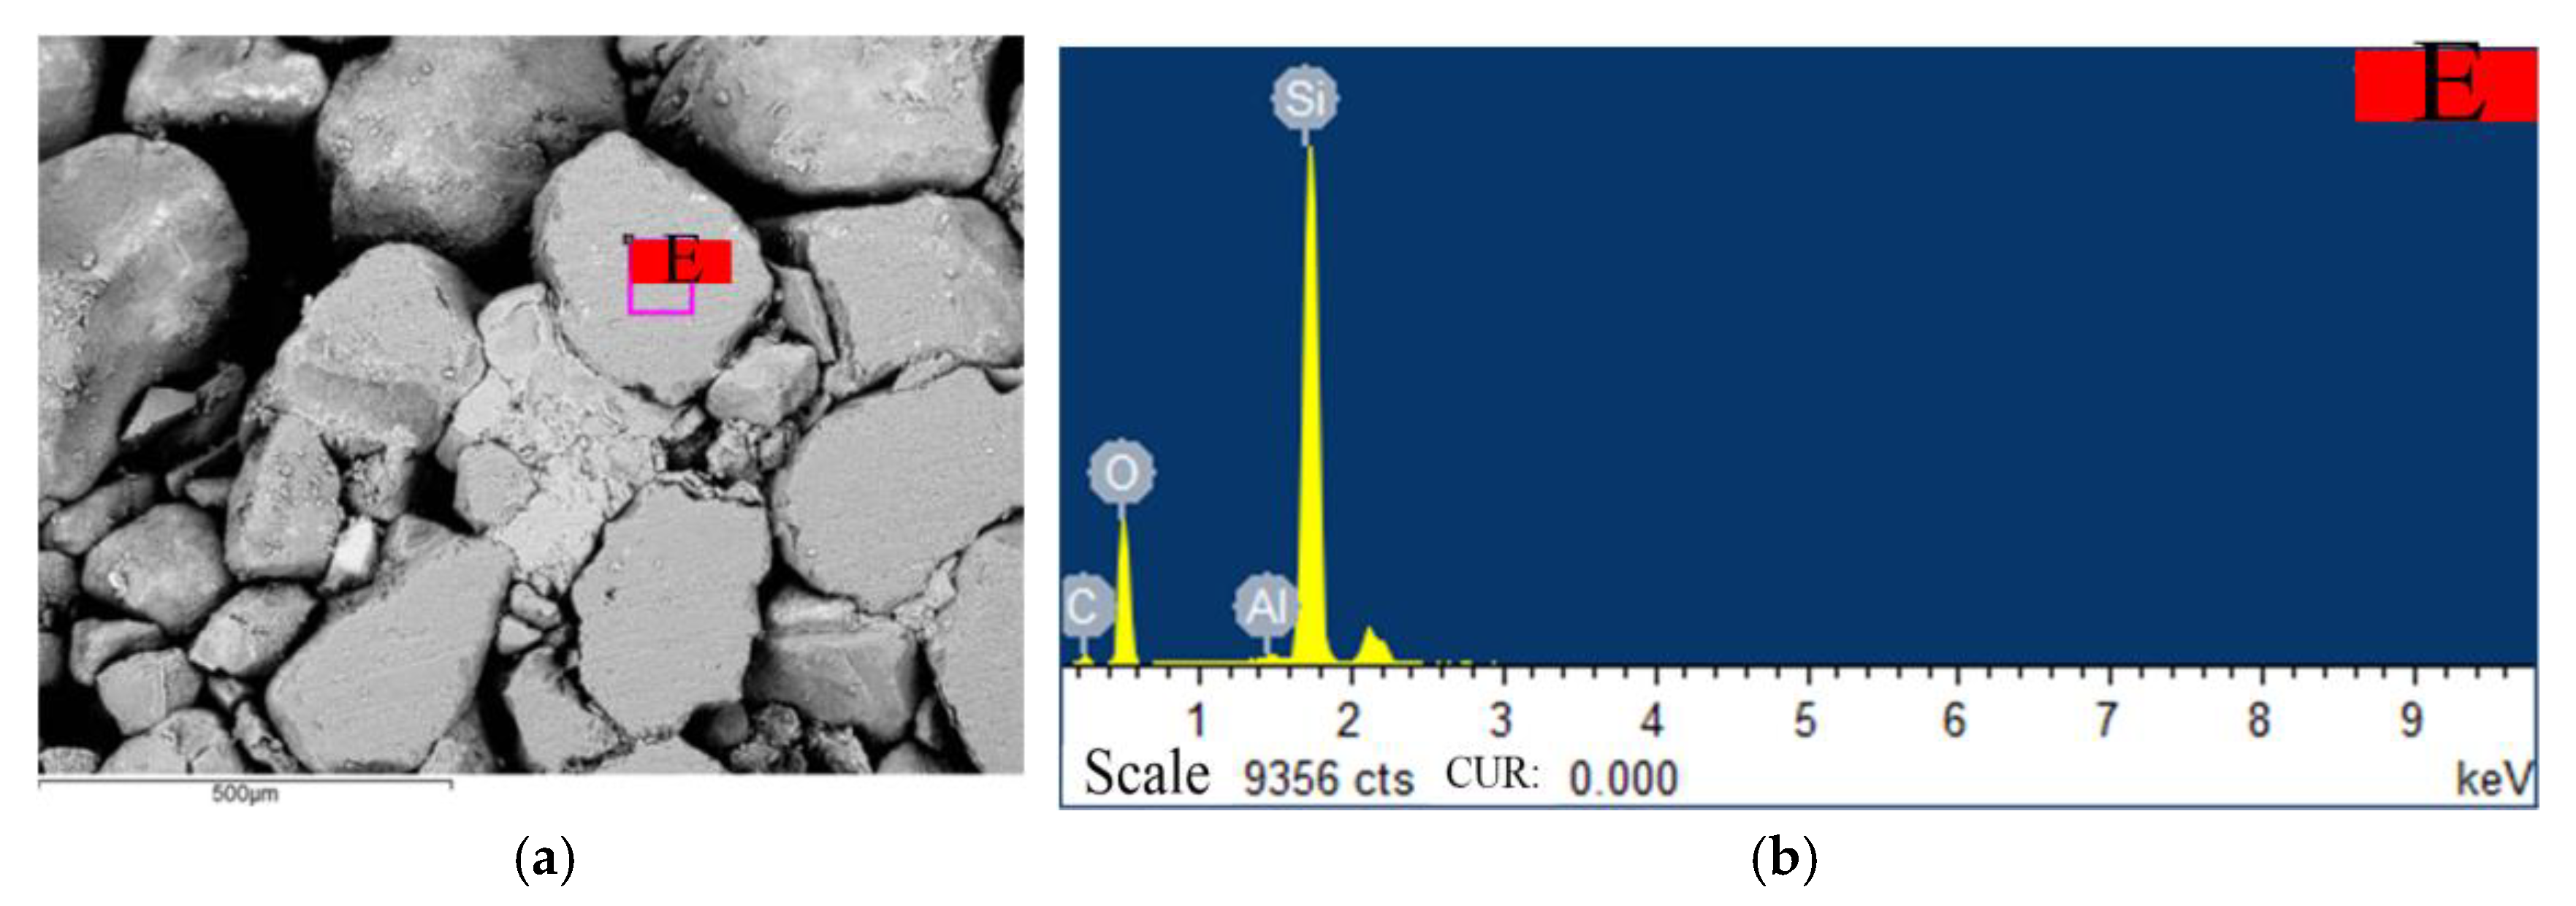
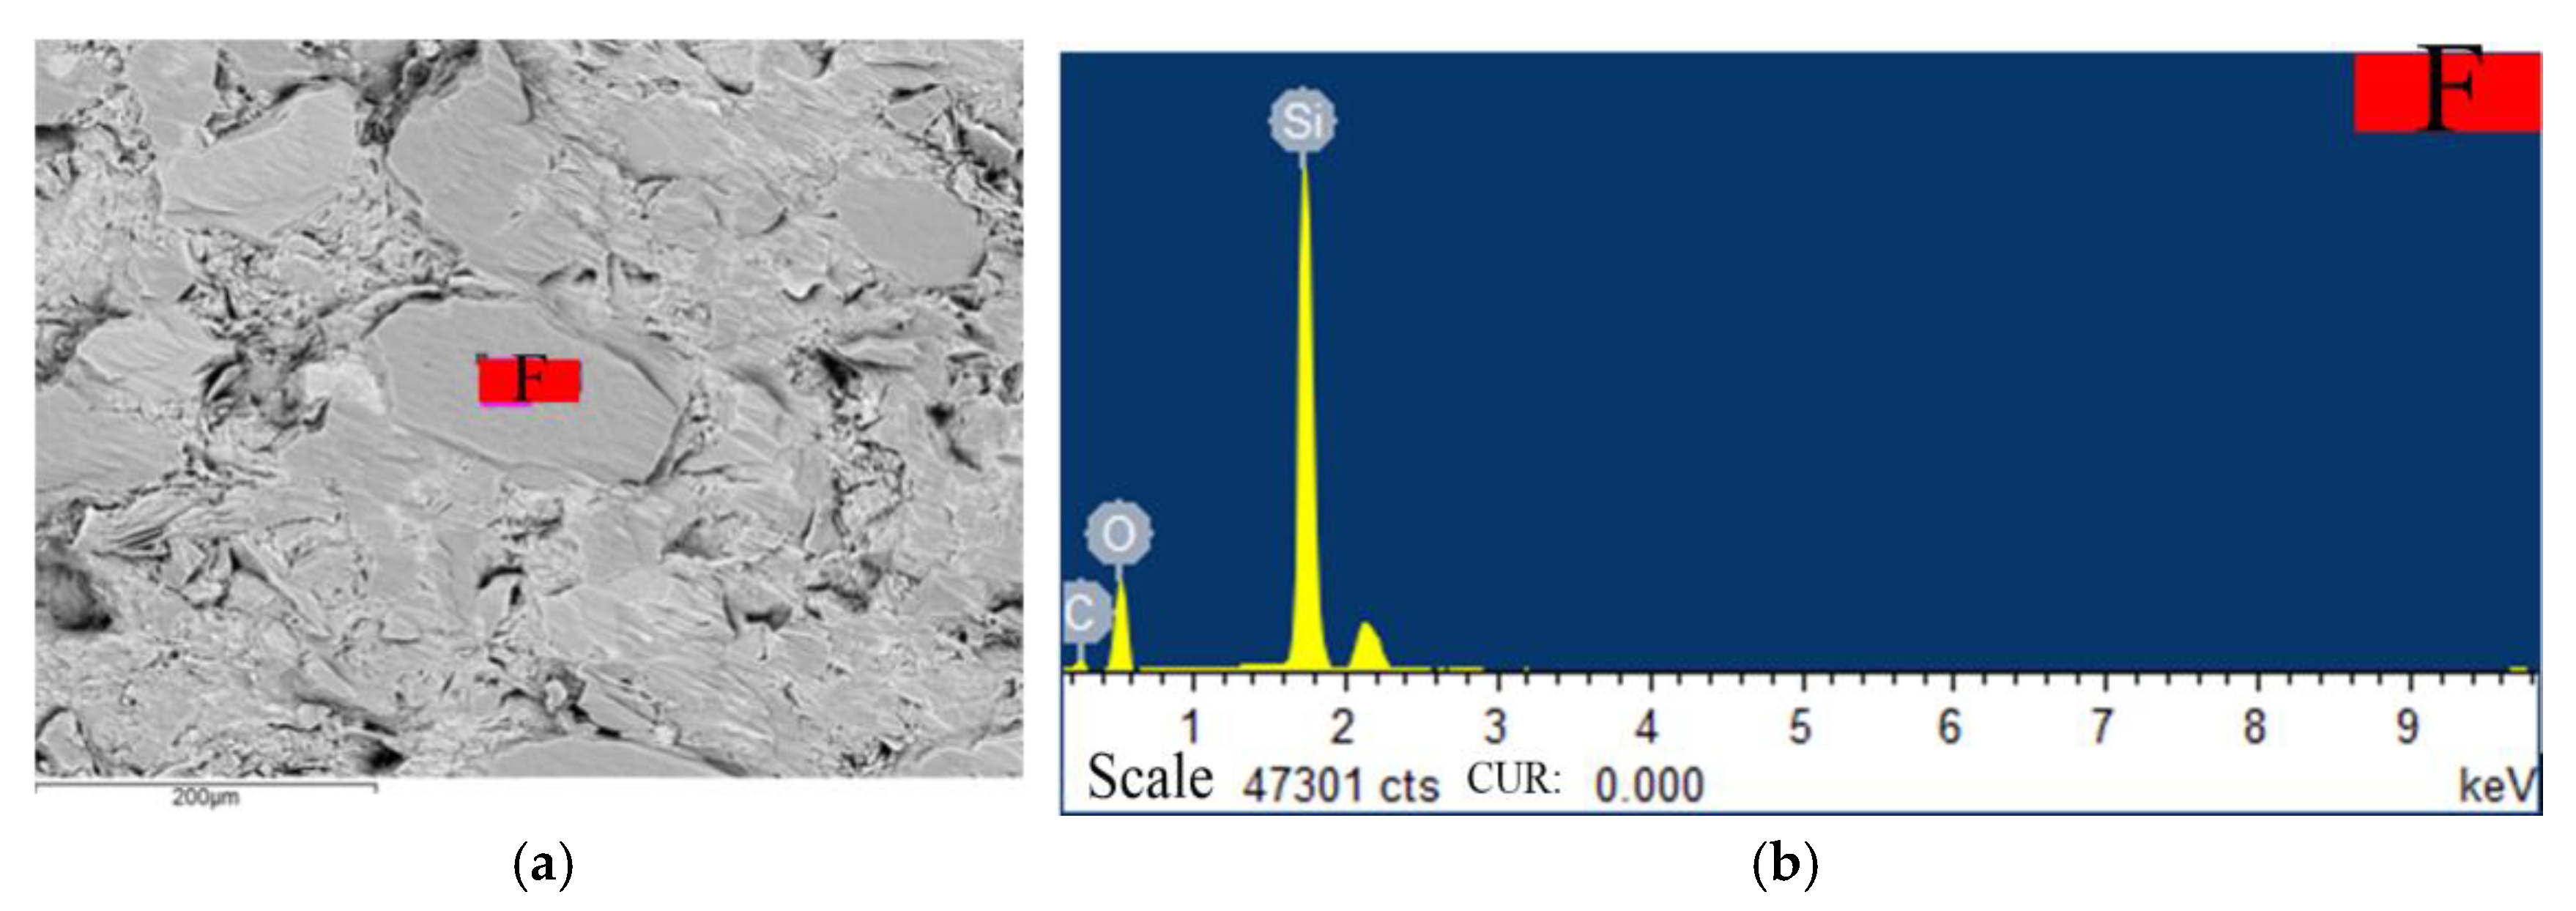
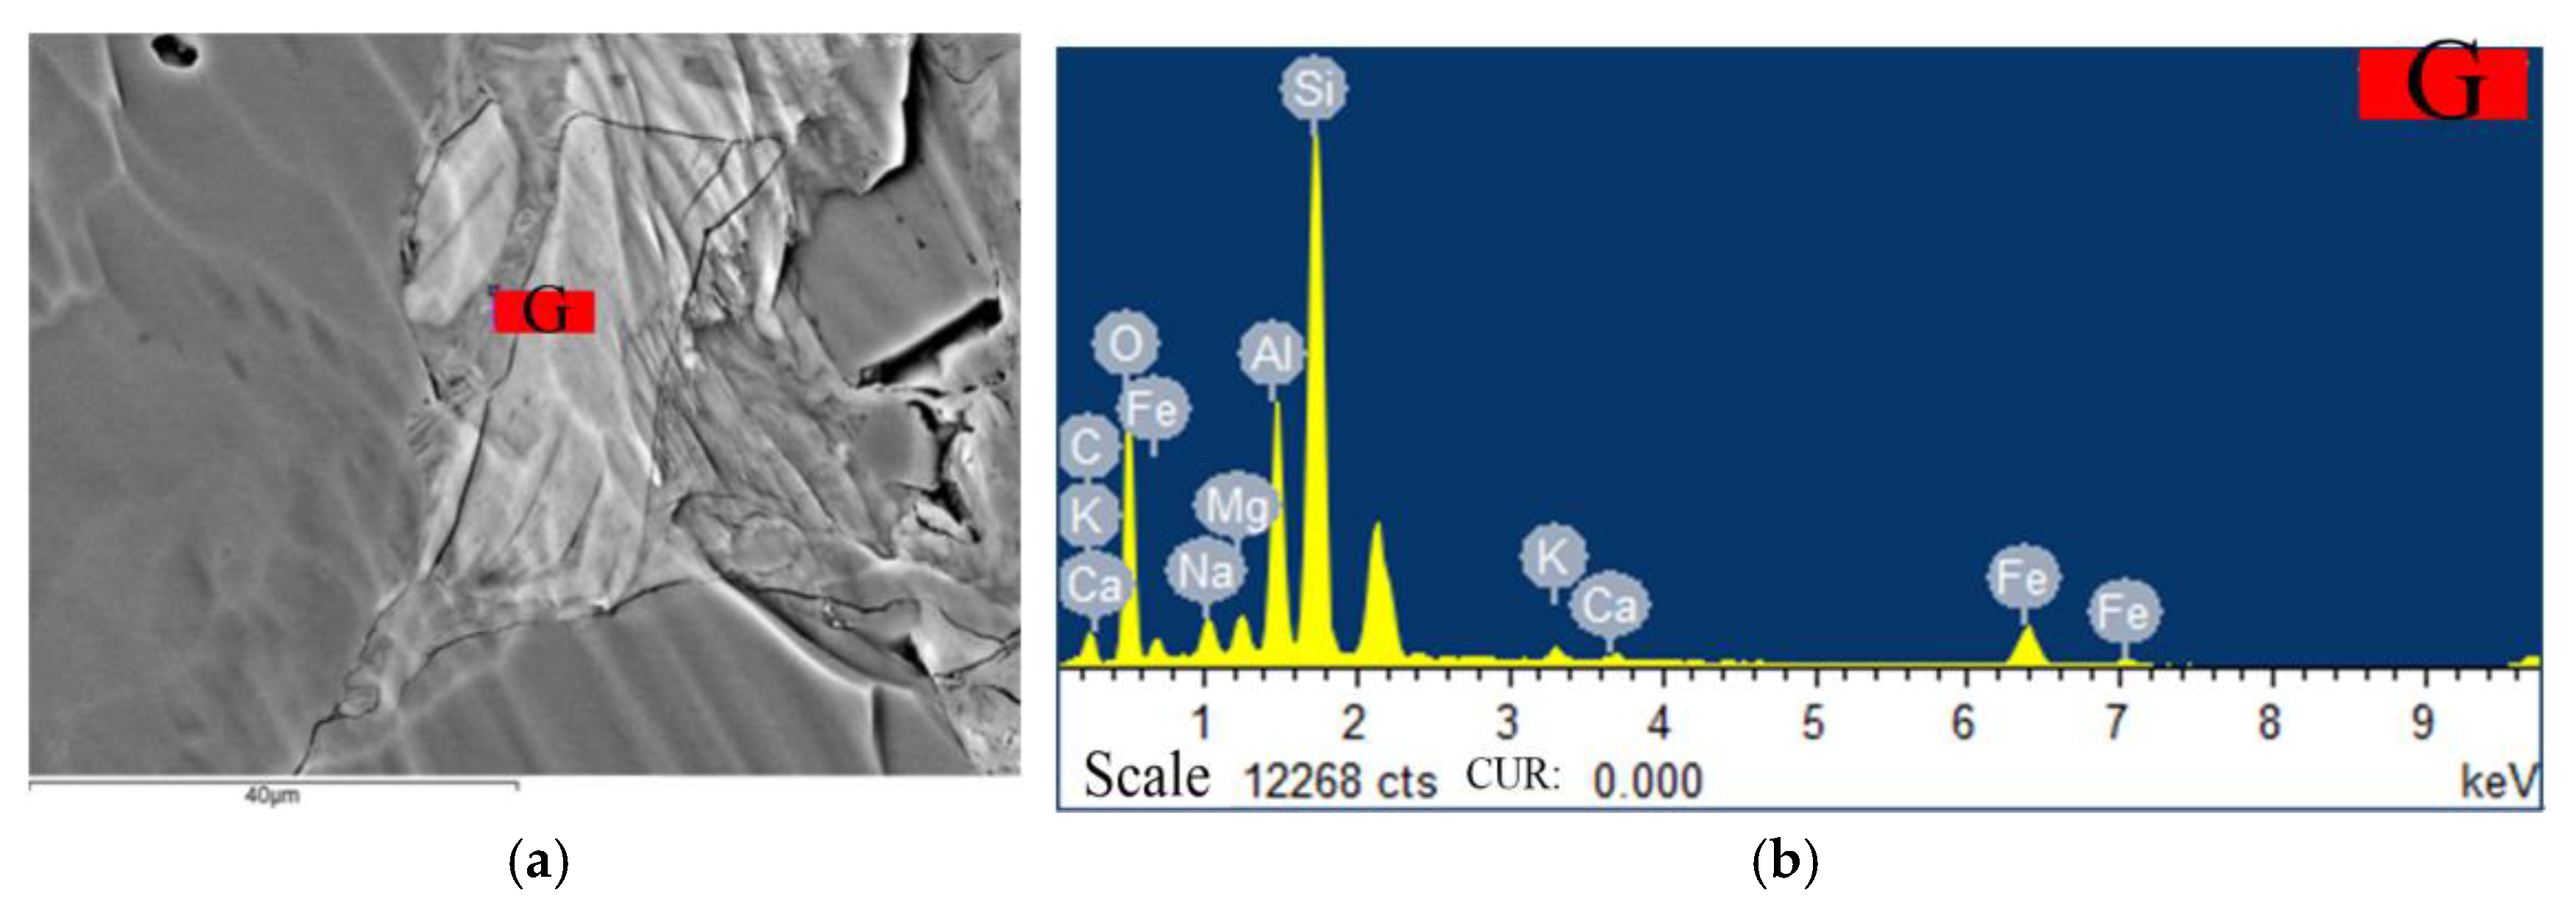
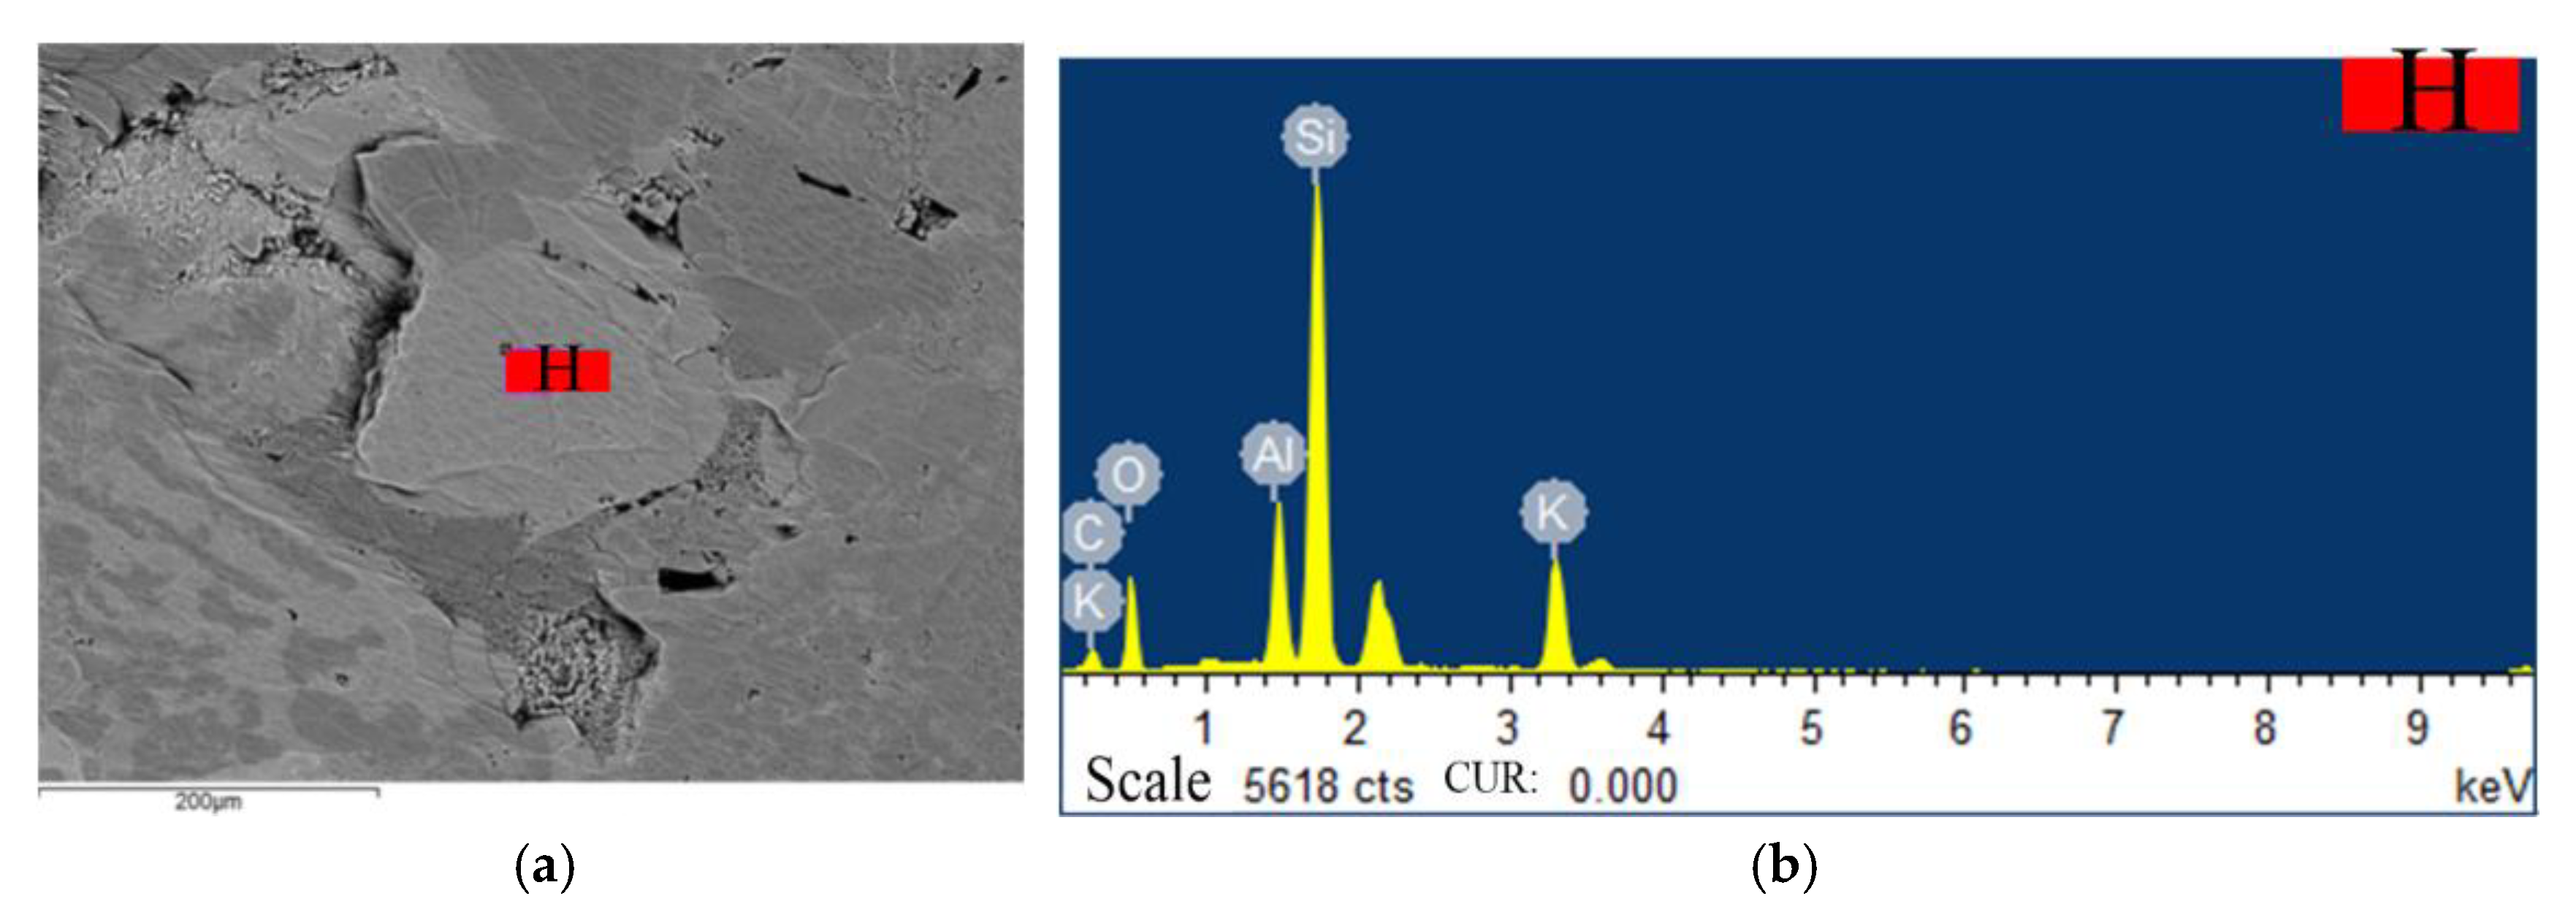
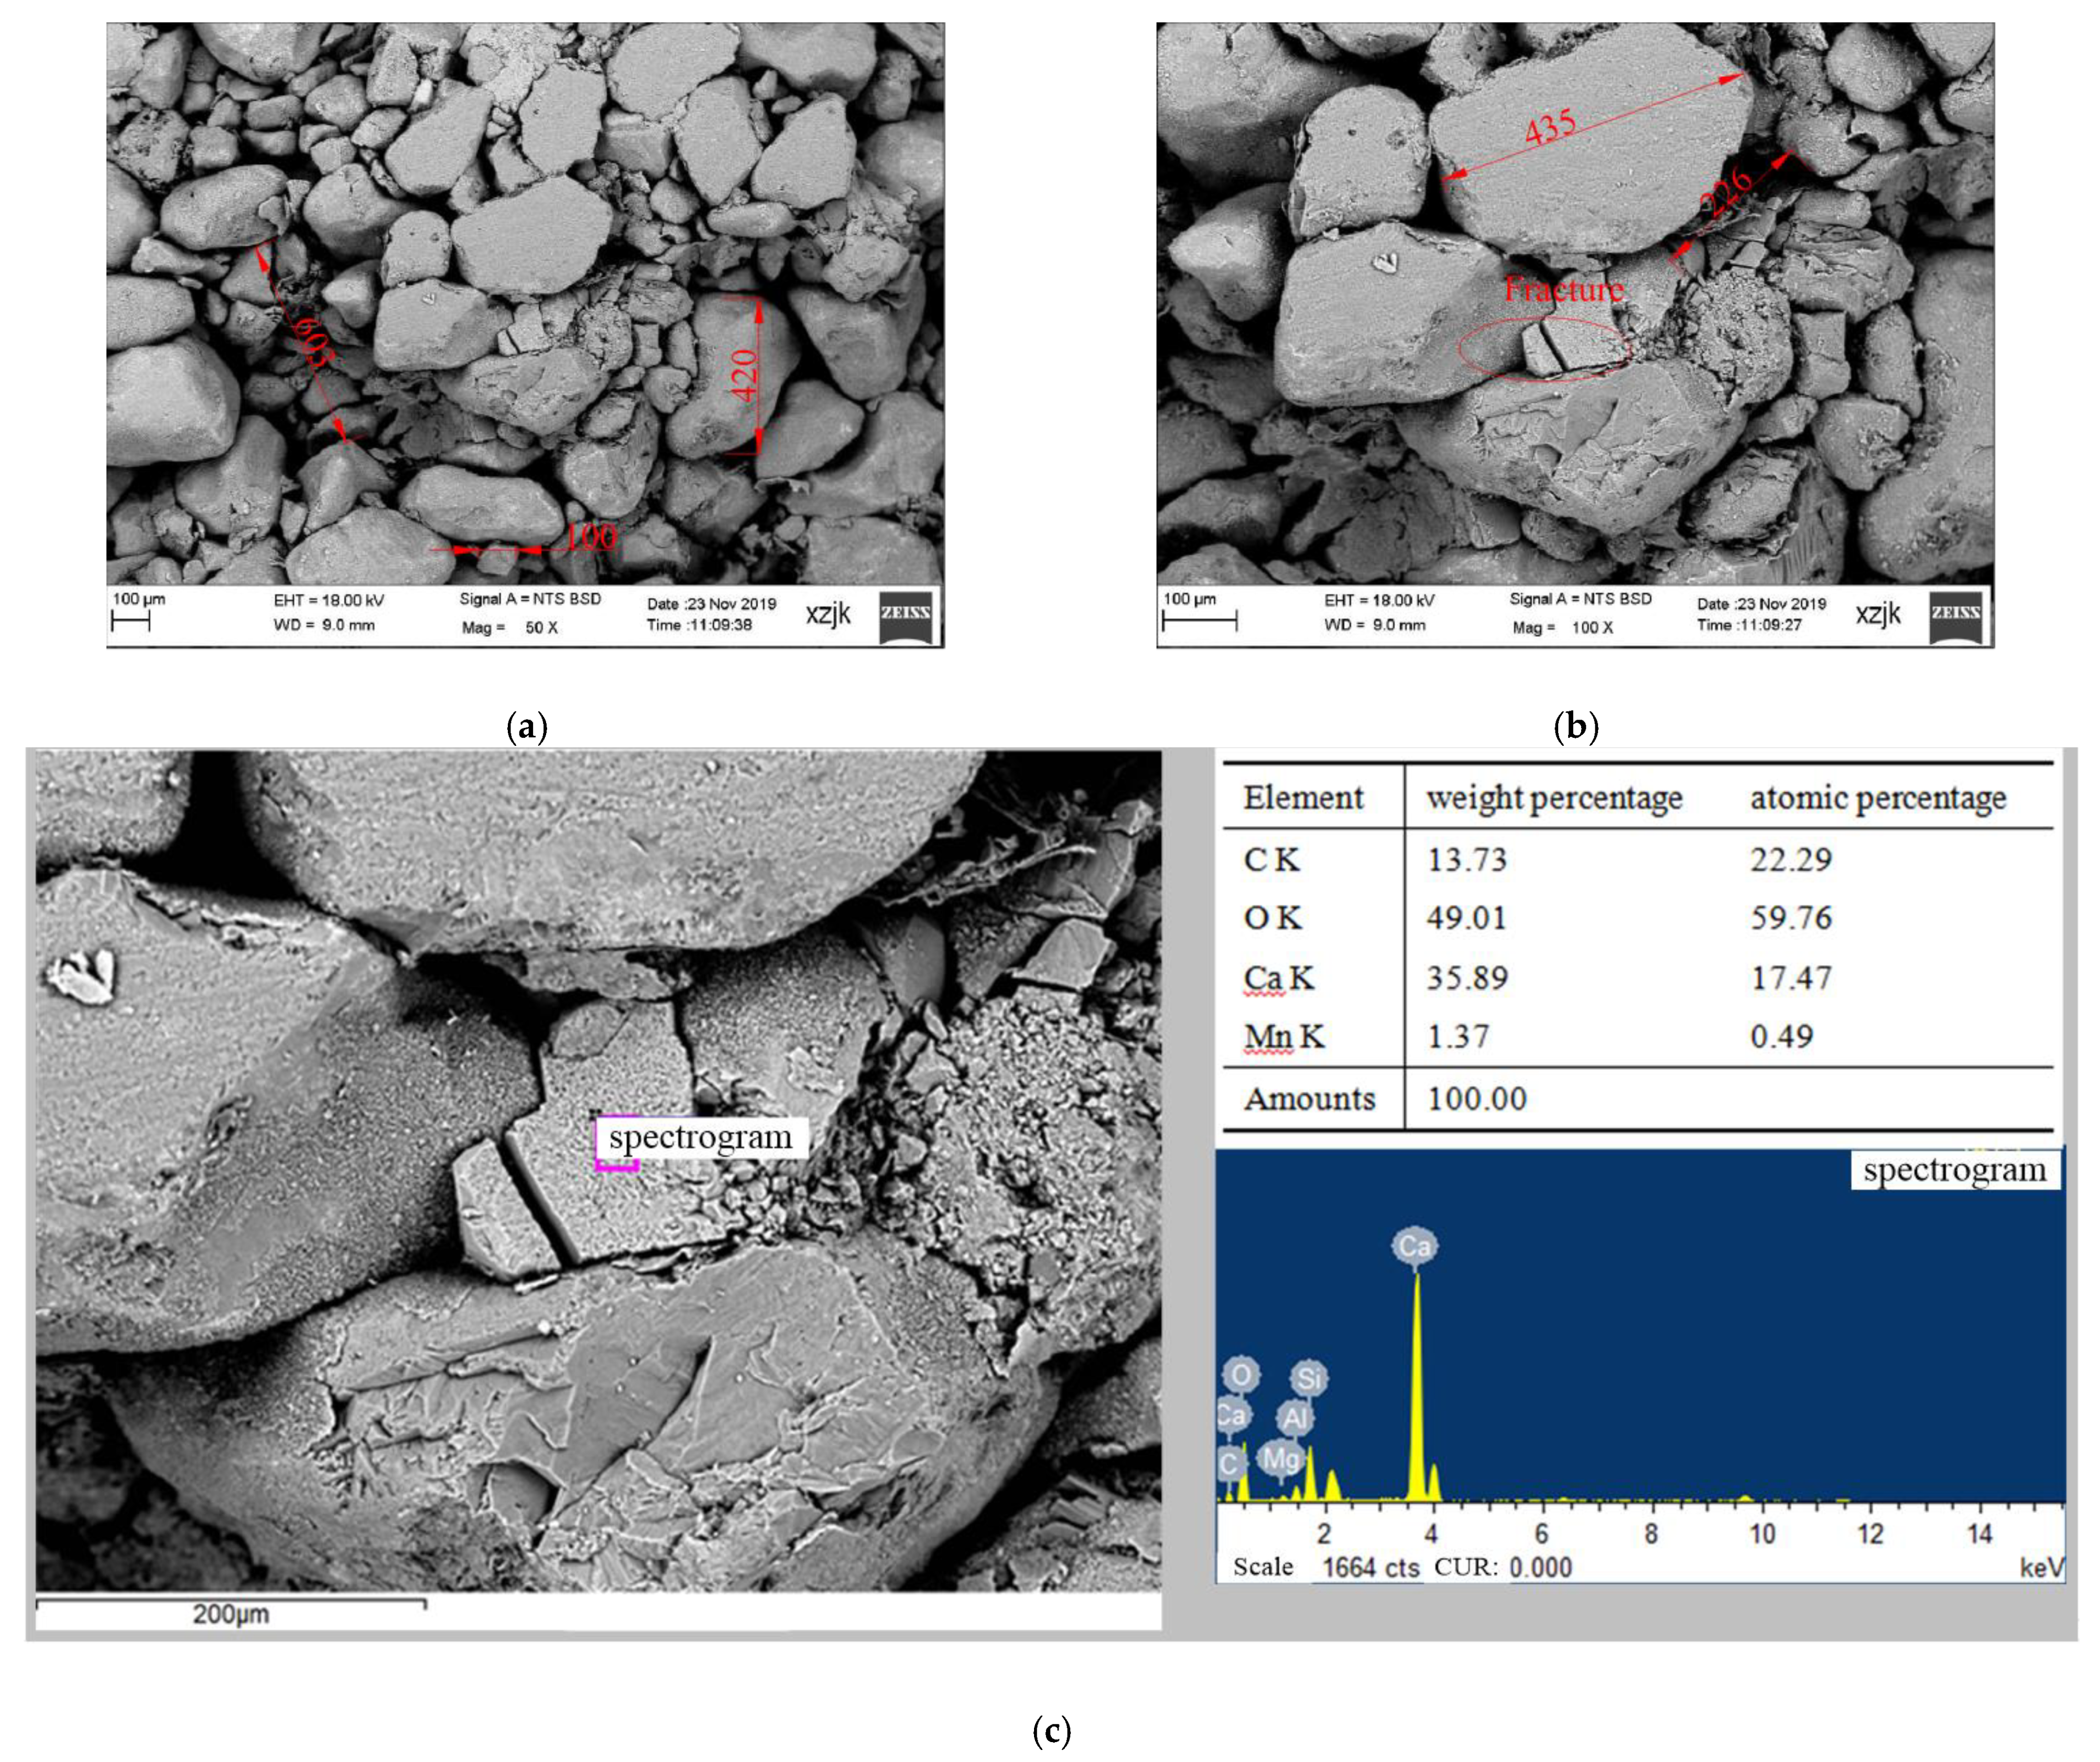
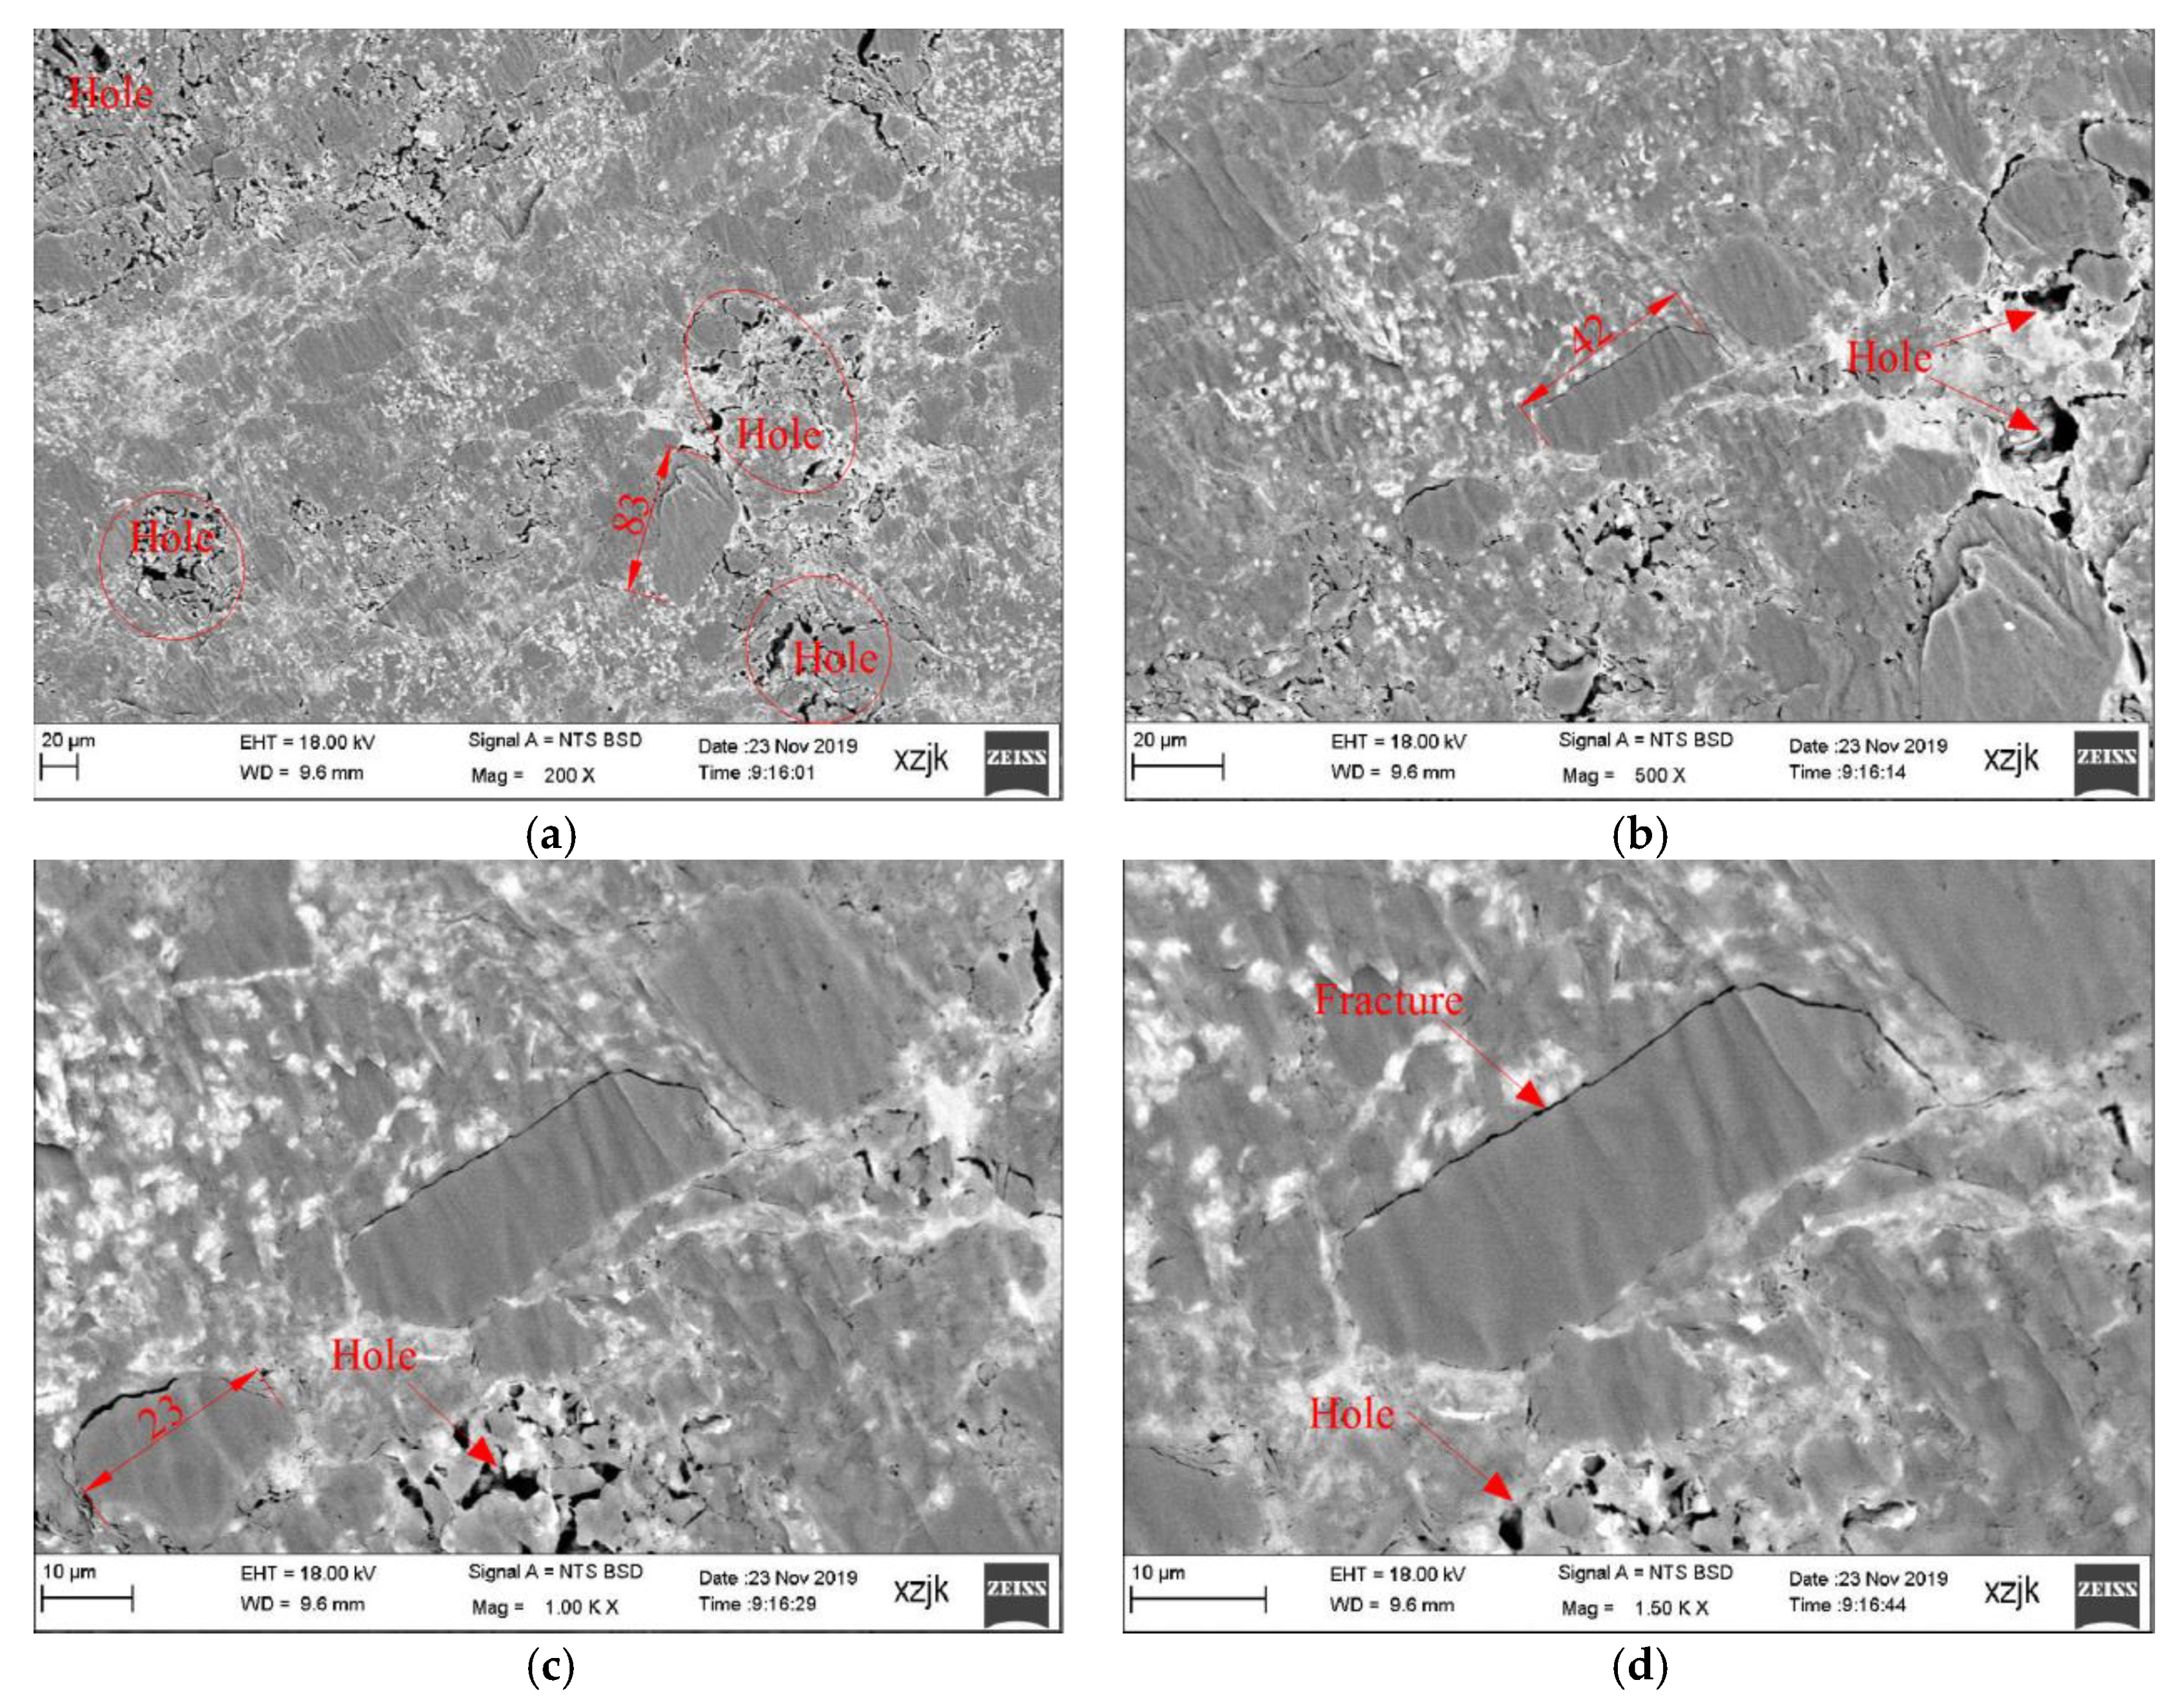
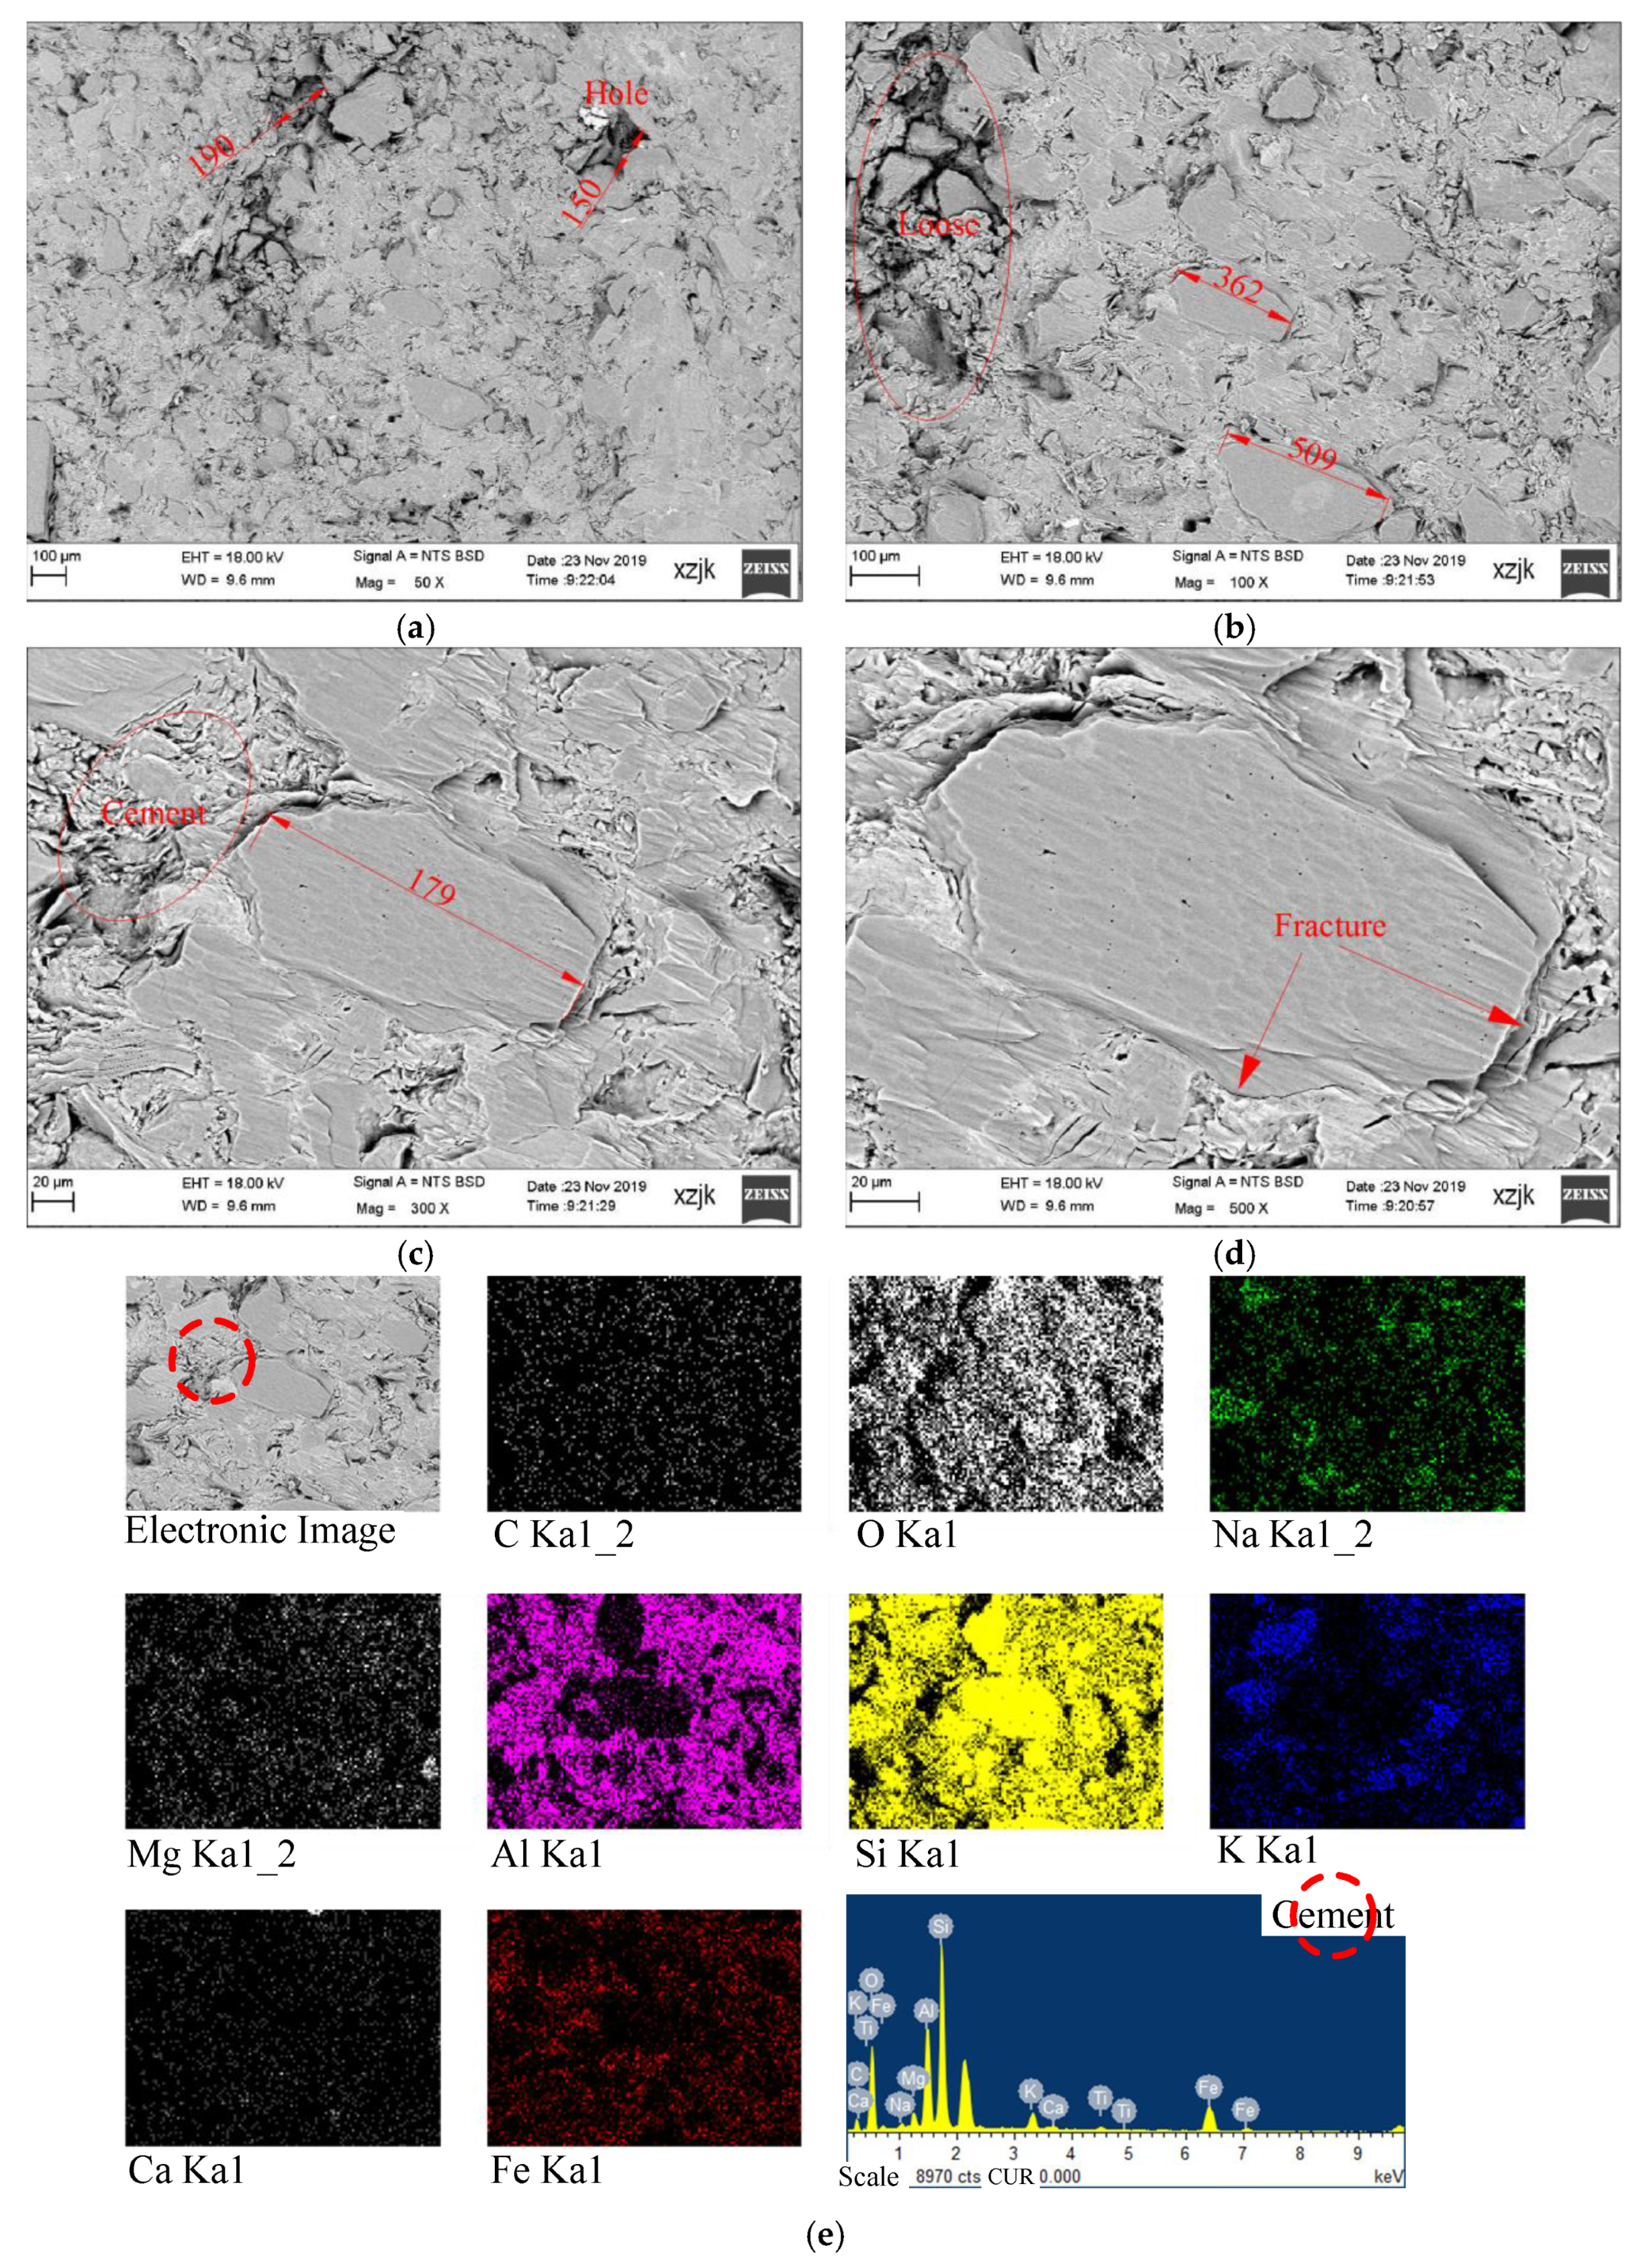
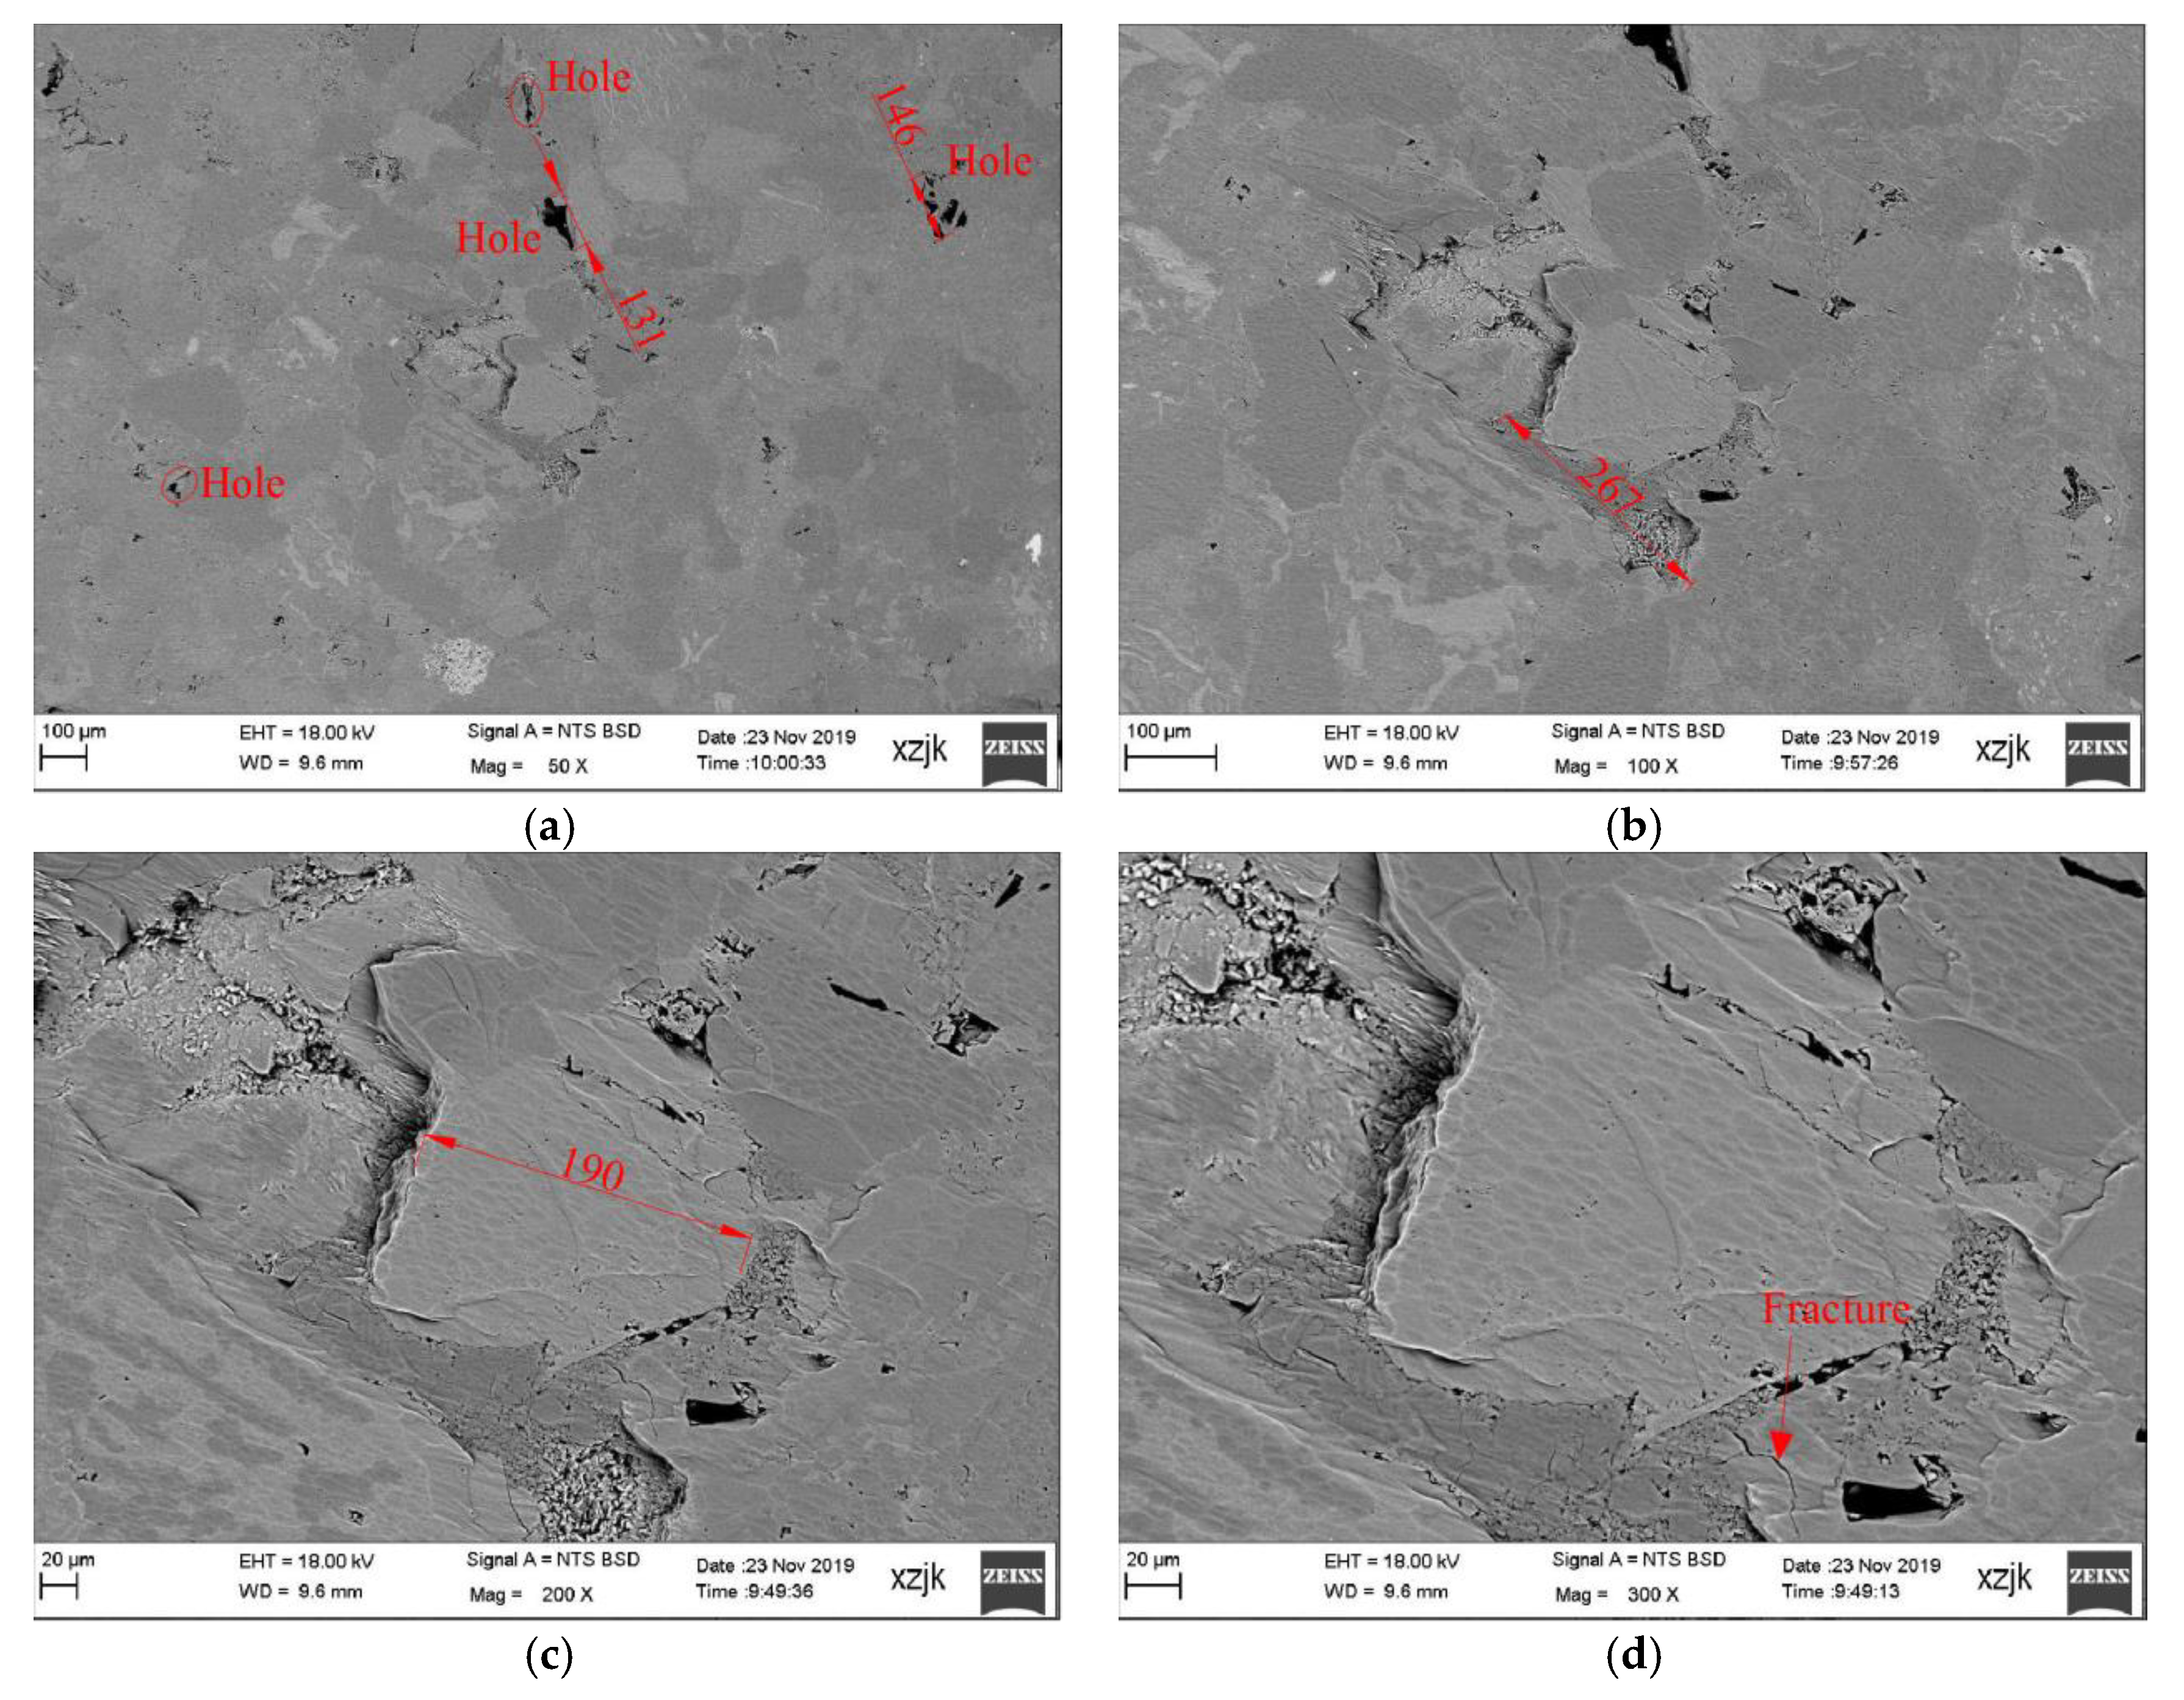
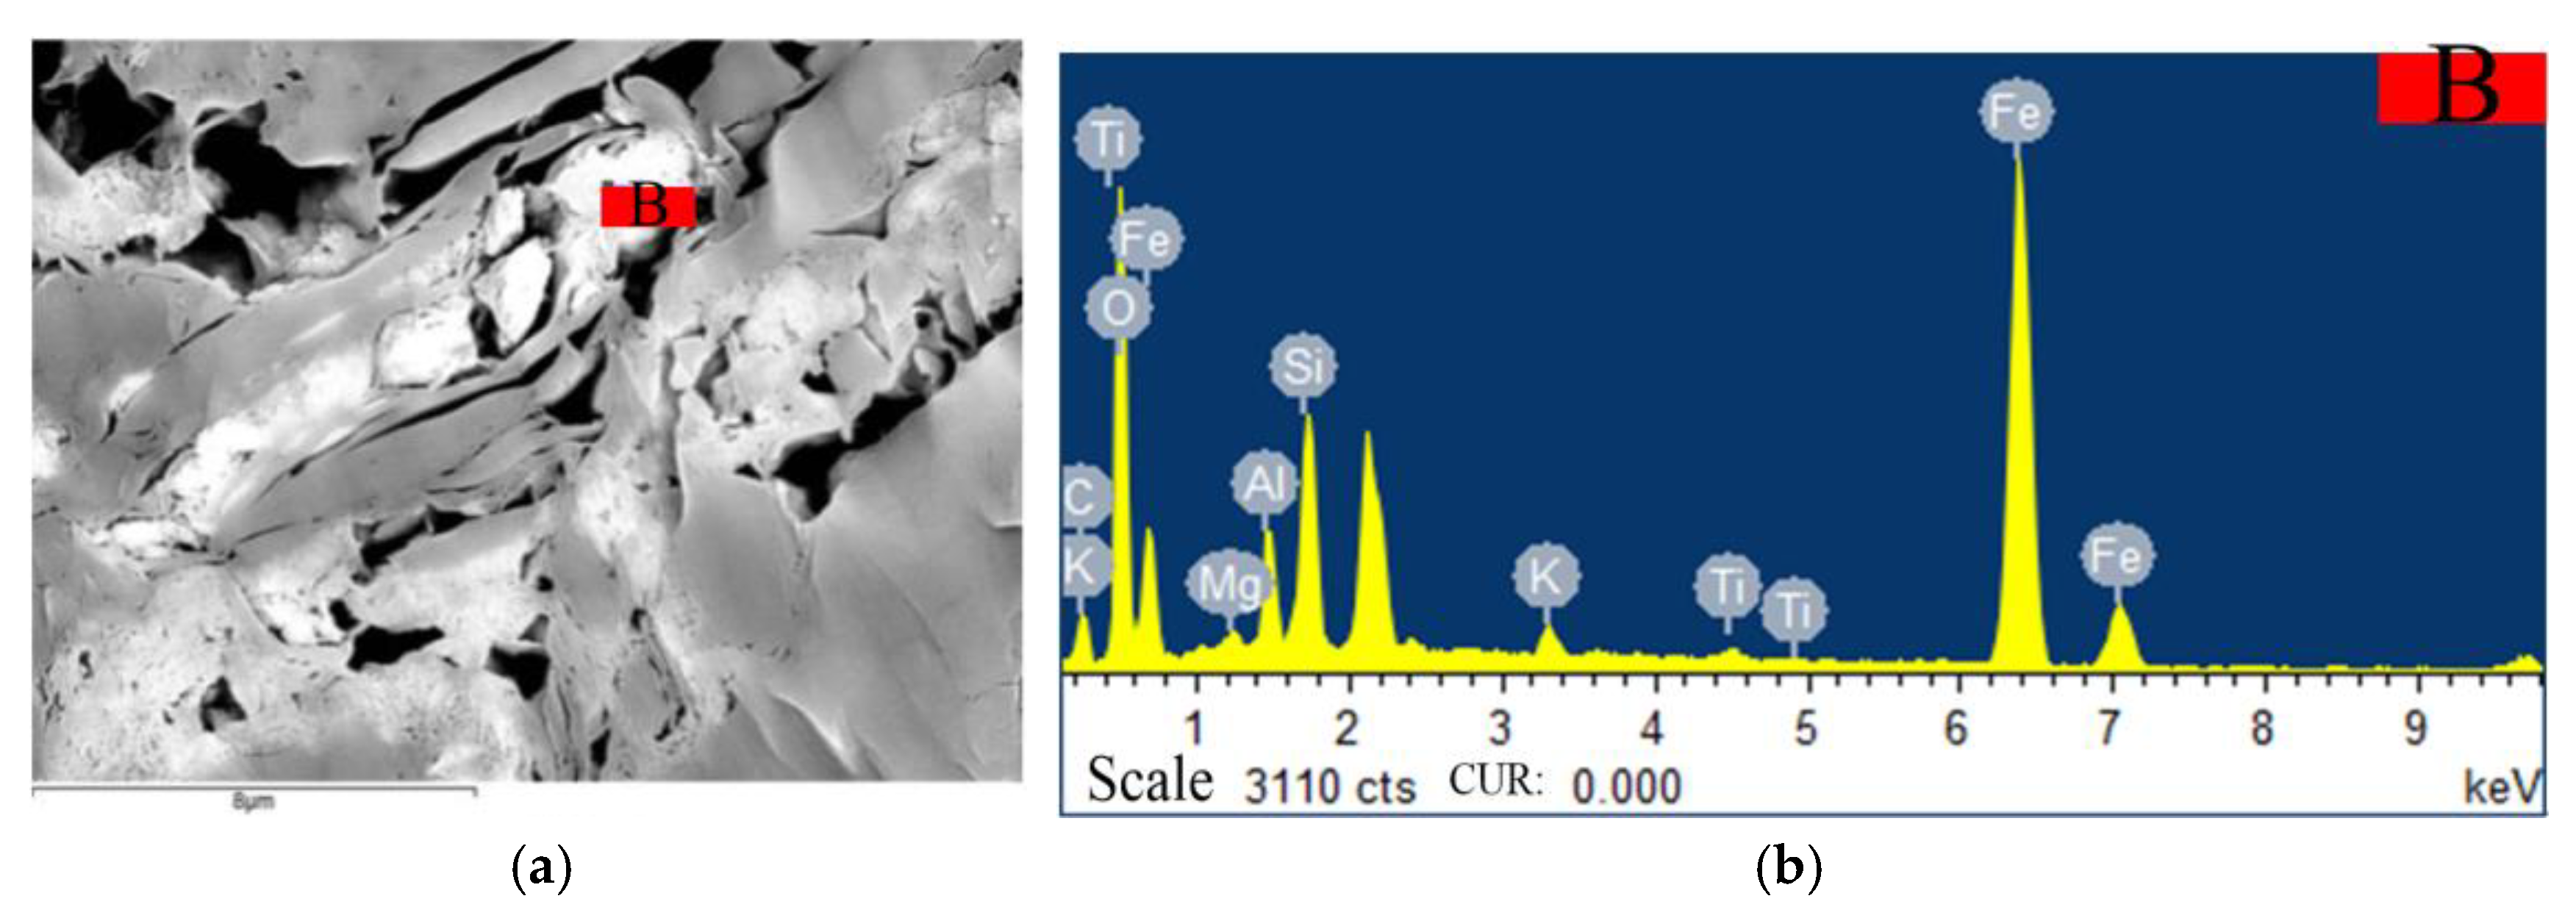
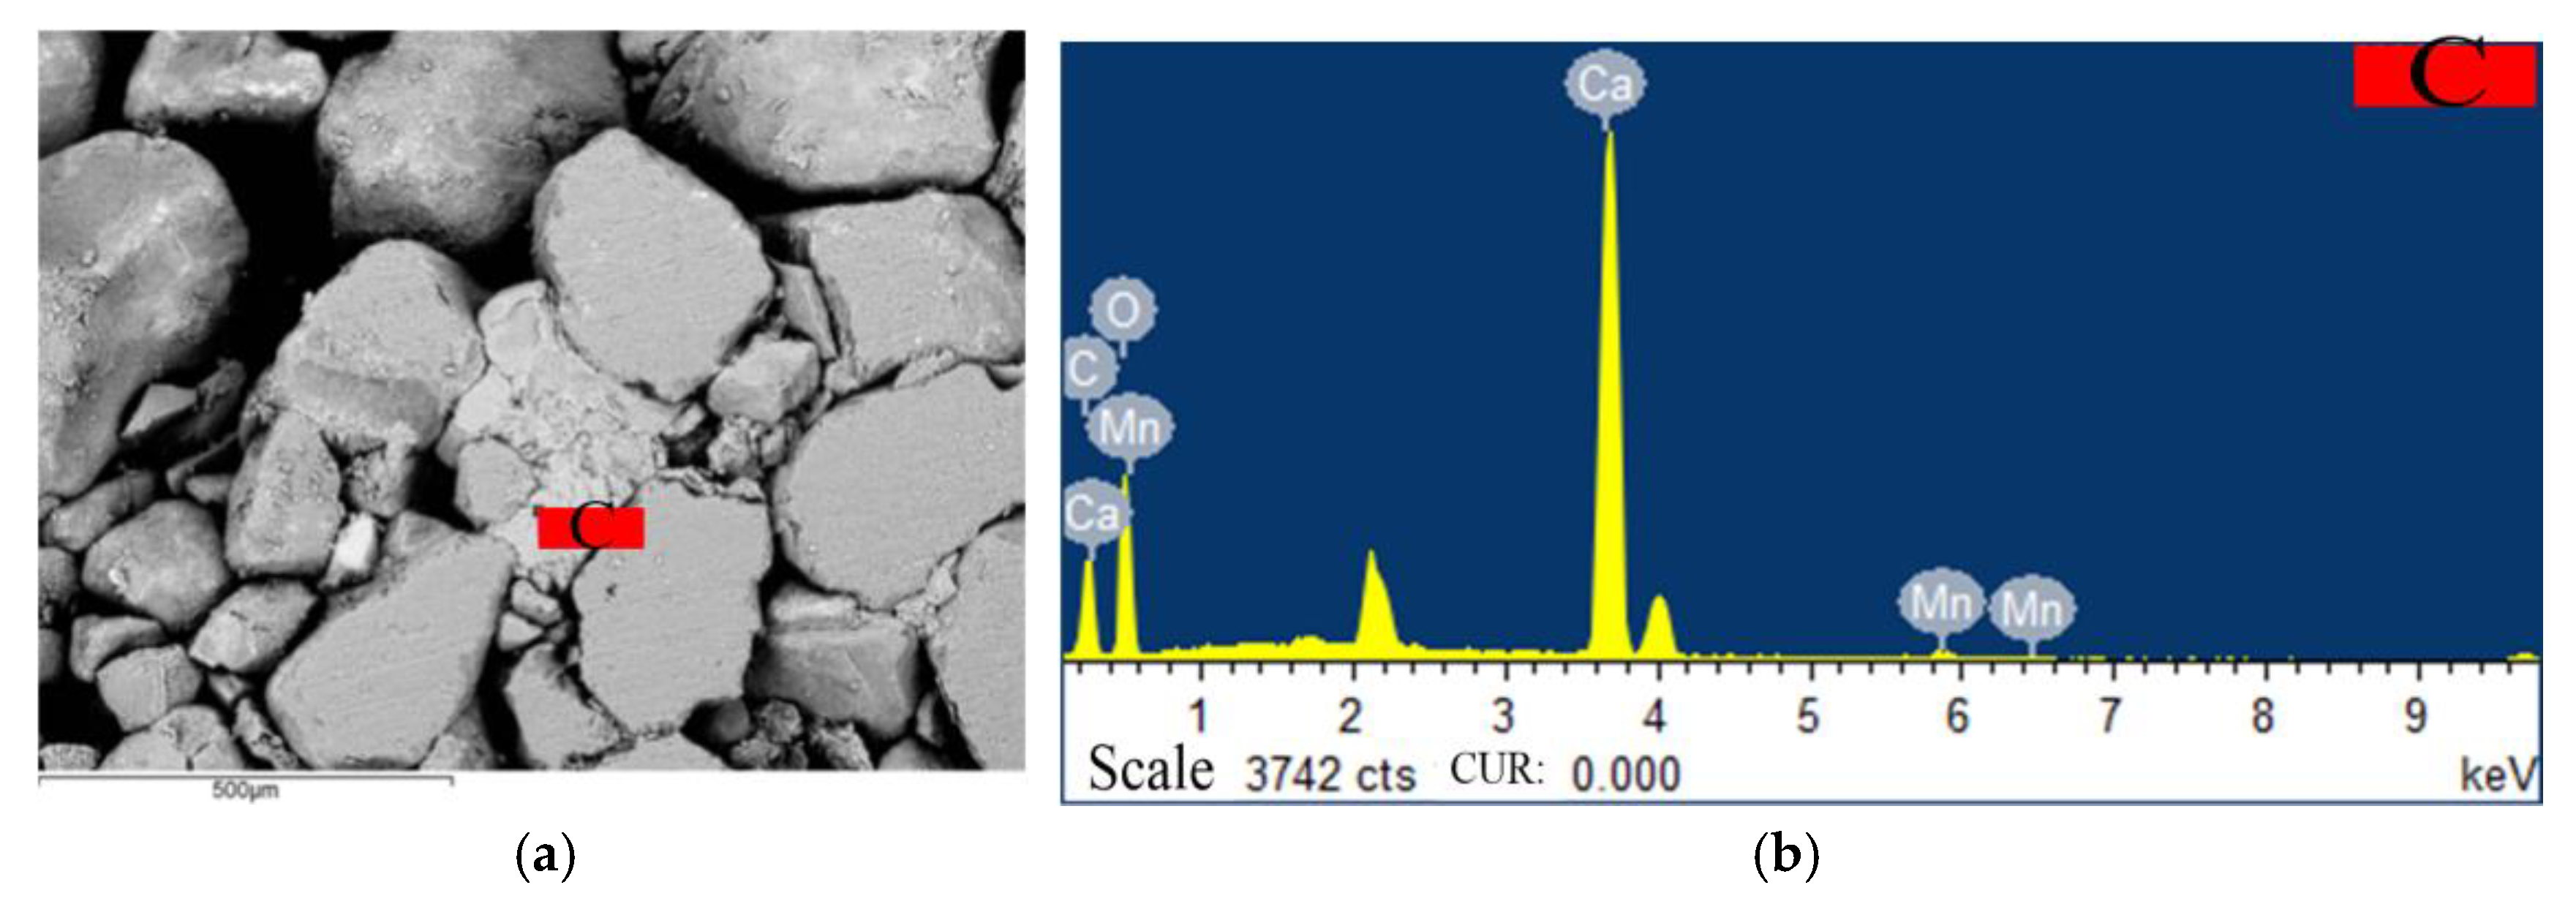
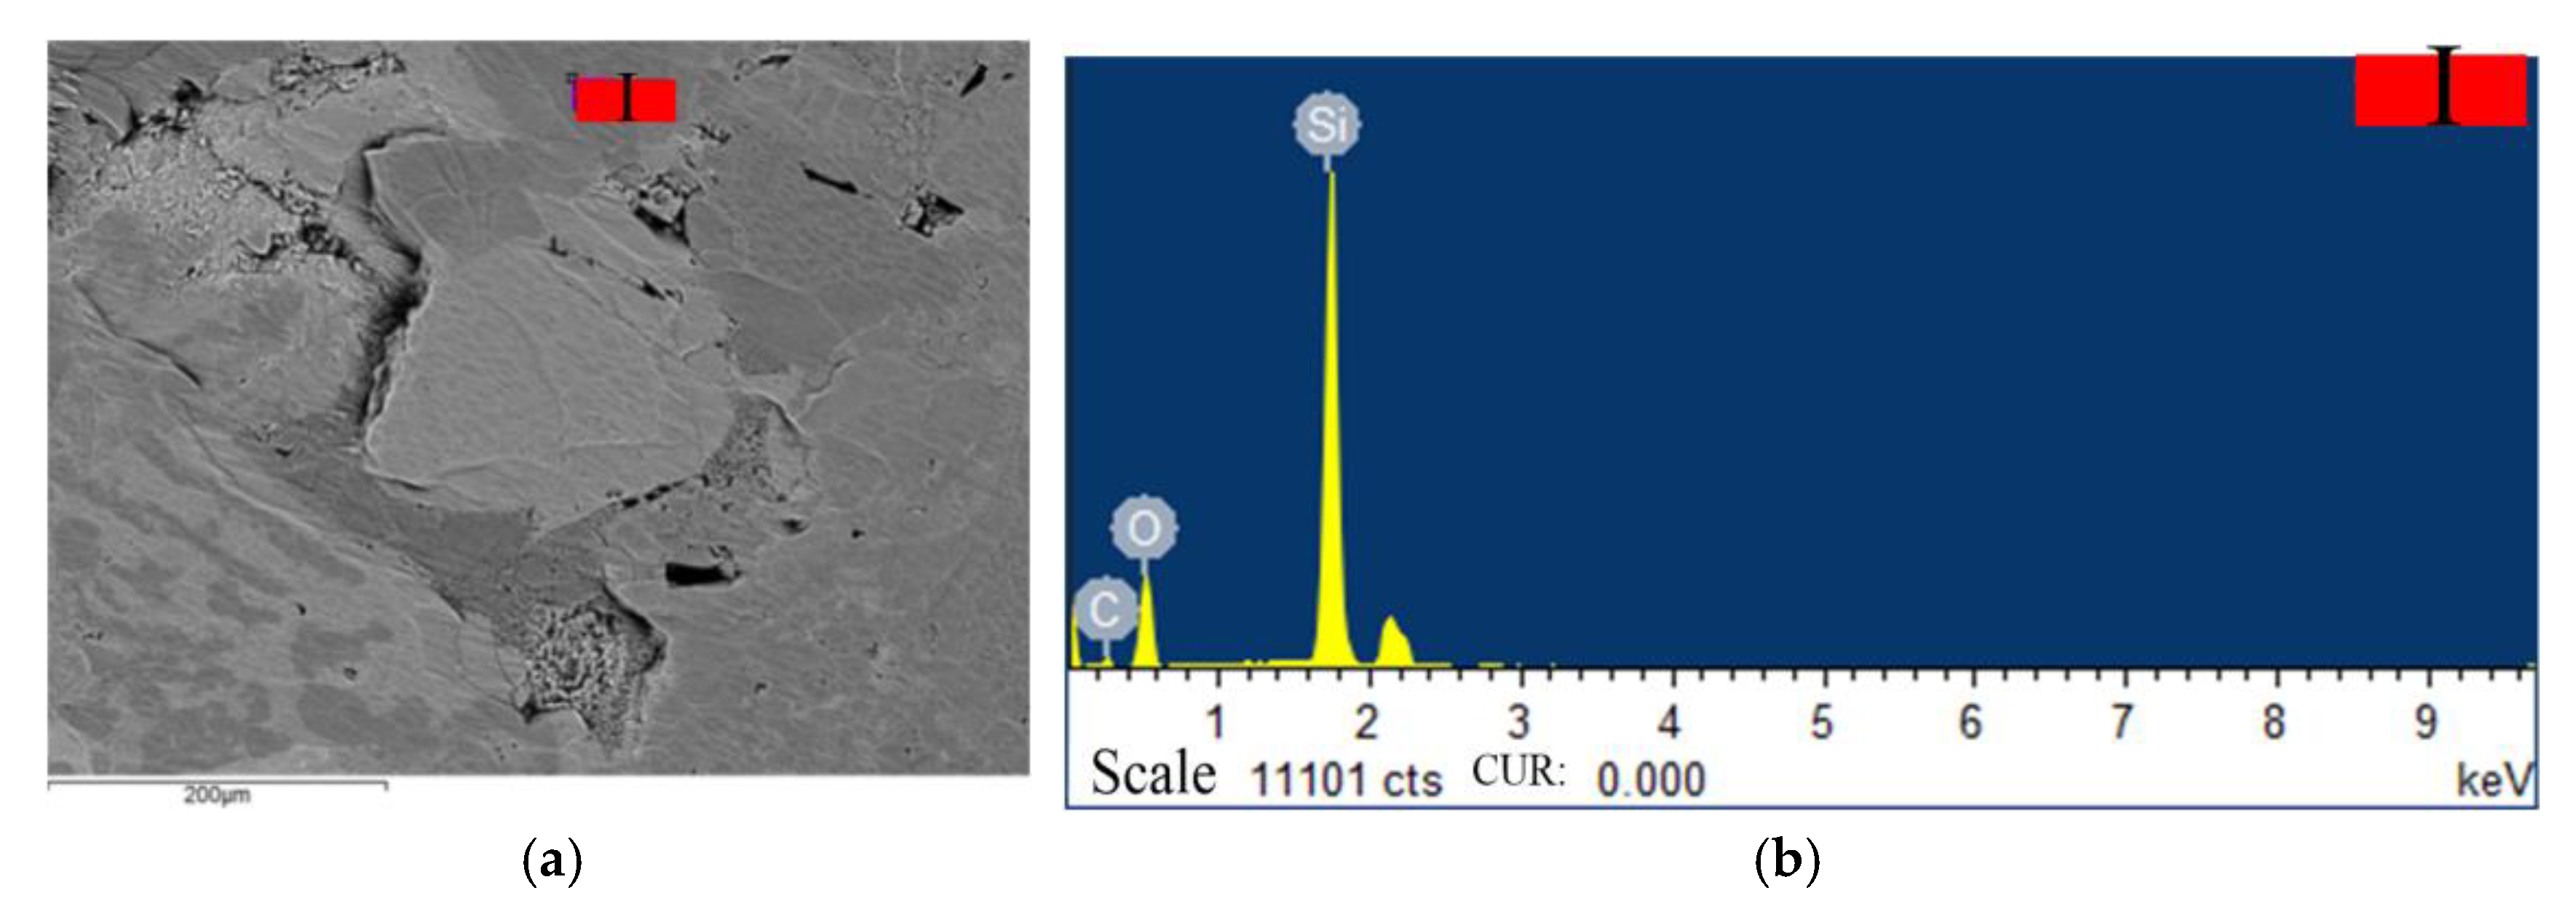
3.1. SEM Tests of Weakly Cemented Sandstone

To clearly elucidate the crack development in rock samples, they were polished using an Argon-ion Polisher-697. To obtain clear SEM images, samples were carbon coated. Figure 3 shows the equipment used (SIGMA, Carl Zeiss AG, Oberkochen, Germany).
However, in the argon-ion polishing experiment, the Zhidan group sandstone sample was always uneven and even broken locally. This phenomenon is closely related to its particle size, void, compactness and cement. Therefore, SEM proceeded with untreated sandstone samples (Figure 3d). Figure 4 and Figure 5 are schematic diagrams of the geometrical and microscopic characteristics of Zhidan group sandstone, respectively, and Figure 6, Figure 7 and Figure 8 show the geometrical and microscopic characteristics of Anding formation sandstone, Zhiluo formation sandstone, and Yan’an formation sandstone, respectively.
As shown in Figure 4, the grain size of Zhidan group sandstone was generally large, and could be divided into coarse (500–1000 μm) and medium sandstone (250–500 μm), according to the different levels of grain size. The pores were relatively large, some of which had a width of 603 μm. Moreover, the rocks were relatively loose, and some pores were filled with fine sandstone. Further, no fractures developed. Note that the test sample of Zhidan group sandstone was not polished, and its conductivity was not good. Under the irradiation of the electron beam, a discharge was produced, and white bright spots and patches appeared on the image.
As shown in Figure 5, slight, gently inclined and lateral stratification developed in the Zhidan group sandstone, while vertical stratification did not develop. Therefore, it was susceptible to transverse shear failure along the stratification, forming a flaky structure.
As can be seen in Figure 6, the Anding formation sandstone had a small grain size, comprising mostly siltstone (5–50 μm), according to the grain size, mixed with a little fine sand (50–250 μm). Moreover, obvious fractures and voids developed.
As shown in Figure 7, the Zhiluo group sandstone had a moderate grain size, comprising mostly fine sandstone, with some medium sandstone. The rock was relatively dense, with no large fracture, stratification, or joint development; holes only developed rarely. As shown in Figure 7e, the cementation contained relatively high amounts of Si and Al, as well as a quantifiable amount of Mg and a small amount of Fe, K, and Ca. This mineral may be plagioclase.
As can be seen in Figure 8, the rock particles were closely bound to the cements in the Yan’an formation sandstone. The irregular material may have been a mineral matrix or cementation agent, mostly comprising fine sandstone, according to the grain size classification. No large fractures, stratification, and joints developed, and holes developed rarely.

3.2. Cementation Types and Mineral Analysis of Weakly Cemented Sandstone

Before mineral composition analysis, the larger block rock sample was crushed, ground into powder by a crusher, and filtered using a 300-mesh filter screen to obtain more than 10 g of powdered rock, which was the amount used for the two mineral analysis experiments. The experimental equipment and process are shown in Figure 9.
Then, the mineral composition was determined using a mineral composition analyzer (AXiOX MAX, PANalytical B.V., Almelo, Netherlands), the identification results of which are shown in Table 2.
As can be seen in Table 2, the clay mineral content of the Zhidan group and Yan’an group sandstones was less than that of the Anding group and Zhiluo group sandstones. The Zhidan group sandstone was dominated by quartz, accounting for 54.1%. The Yan’an formation sandstone was dominated by dolomite, accounting for 42.9%. Subsequently, the mineral compositions of the energy spectrum of each rock sample mineral and cementation were analyzed, and a quantitative analysis of rock sample mineral compositions was performed.
As can be seen in Figure 10, the mineral contained large amounts of Si and Al, with a certain amount of K. Based on the mineral composition percentage of the Anding Formation sandstone in Table 2 and the element proportion contained in each mineral, it could be determined that this mineral was potash feldspar.
As shown in Figure 11, there were large amounts of Fe and Si, with smaller amounts of K, in the cementation component. According to the mineral composition percentage in Table 2 and the fuchsia appearance of the Anding Formation sandstone, it could be confirmed that this mineral was hematite.
In Figure 12 and Figure 13, large amounts of Ca can be identified, with a certain amount of Mn or Fe in the cementation. However, the cement in Figure 12 does not contain Mg, while the cementation in Figure 13 does. By comparing the mineral composition percentage of the Zhidan sandstone group in Table 2 and the element proportion contained in each mineral, it can be determined that the cementation in Figure 12 is calcite and the cementation in Figure 13 is dolomite.
As shown in Figure 14, the rock particles contained large amounts of Si and a small amount of Al. Using the mineral composition percentage of the Zhidan group sandstone in Table 2 and the element proportion contained in each mineral, the mineral could be identified as quartz.
As shown in Figure 15, there was a high Si content in the rock particles. This mineral could be recognized as quartz according to the mineral composition percentage of the Zhiluo group sandstone in Table 2 and the element proportion contained in each mineral.
As shown in Figure 16, the rock particles contained relatively large amounts of Si and Al, as well as a quantifiable amount of Mg and small amounts of Fe, K, and Ca. According to the mineral composition percentage of the Zhiluo group sandstone in Table 2 and the element proportion contained in each mineral, this mineral could be determined to be plagioclase.
Figure 17 shows that the rock particles contained large amounts of Si and Al and a certain amount of K. According to the mineral composition percentage of the Yan’an formation sandstone in Table 2 and the element proportion contained in each mineral, it could be determined that this mineral was potash feldspar.
As shown in Figure 18, the rock particles had high Si contents. According to the mineral composition percentage of Yan’an Formation sandstone in Table 2 and the element proportion contained in each mineral, it was determined to be quartz.

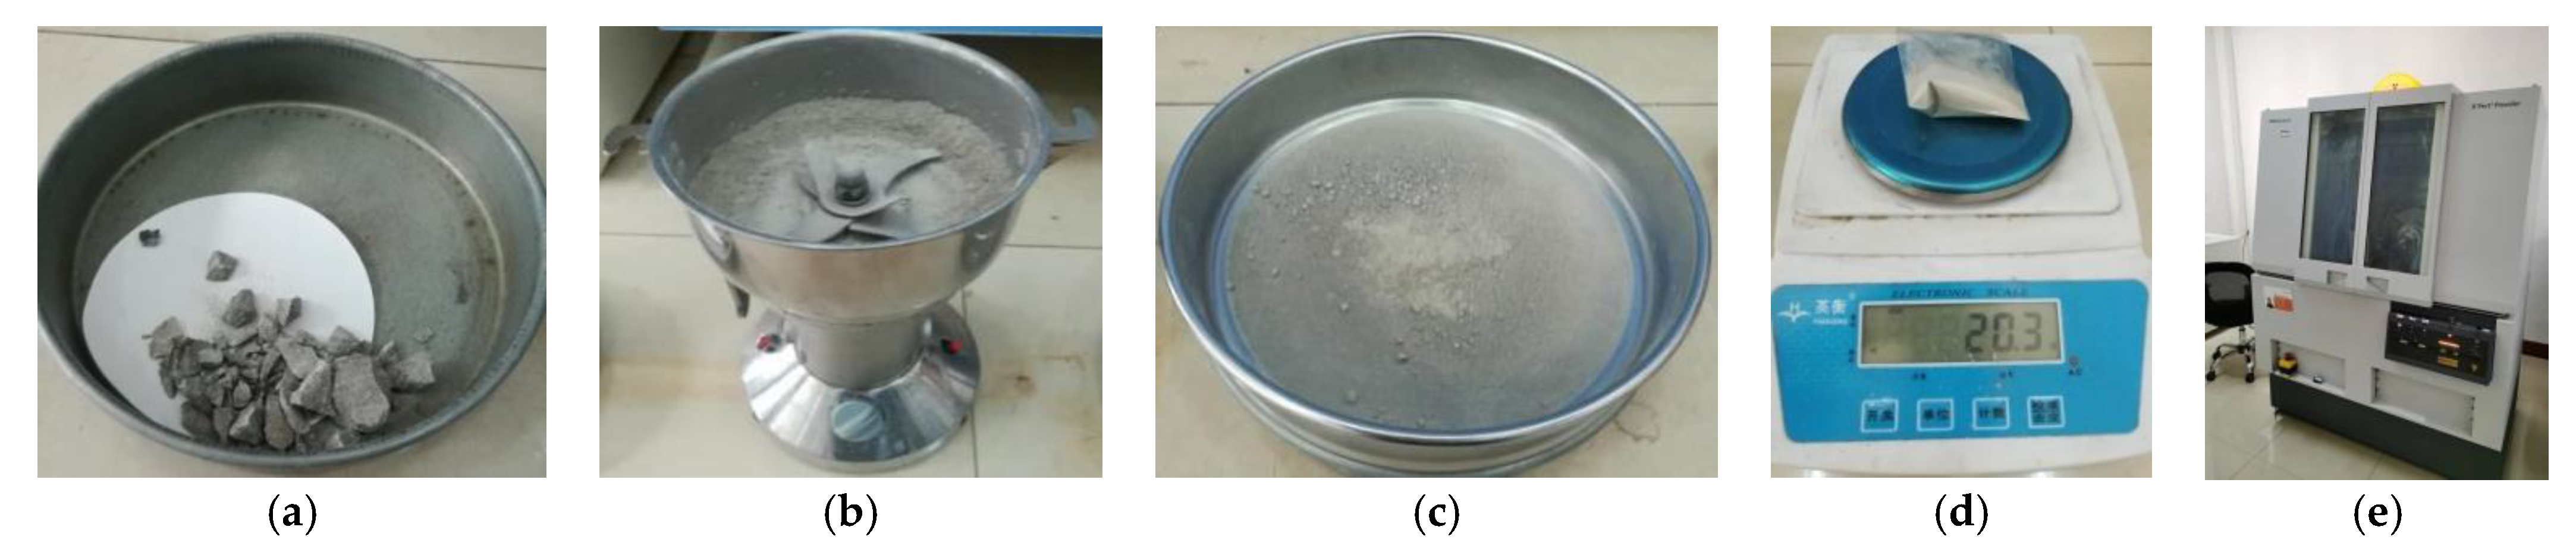
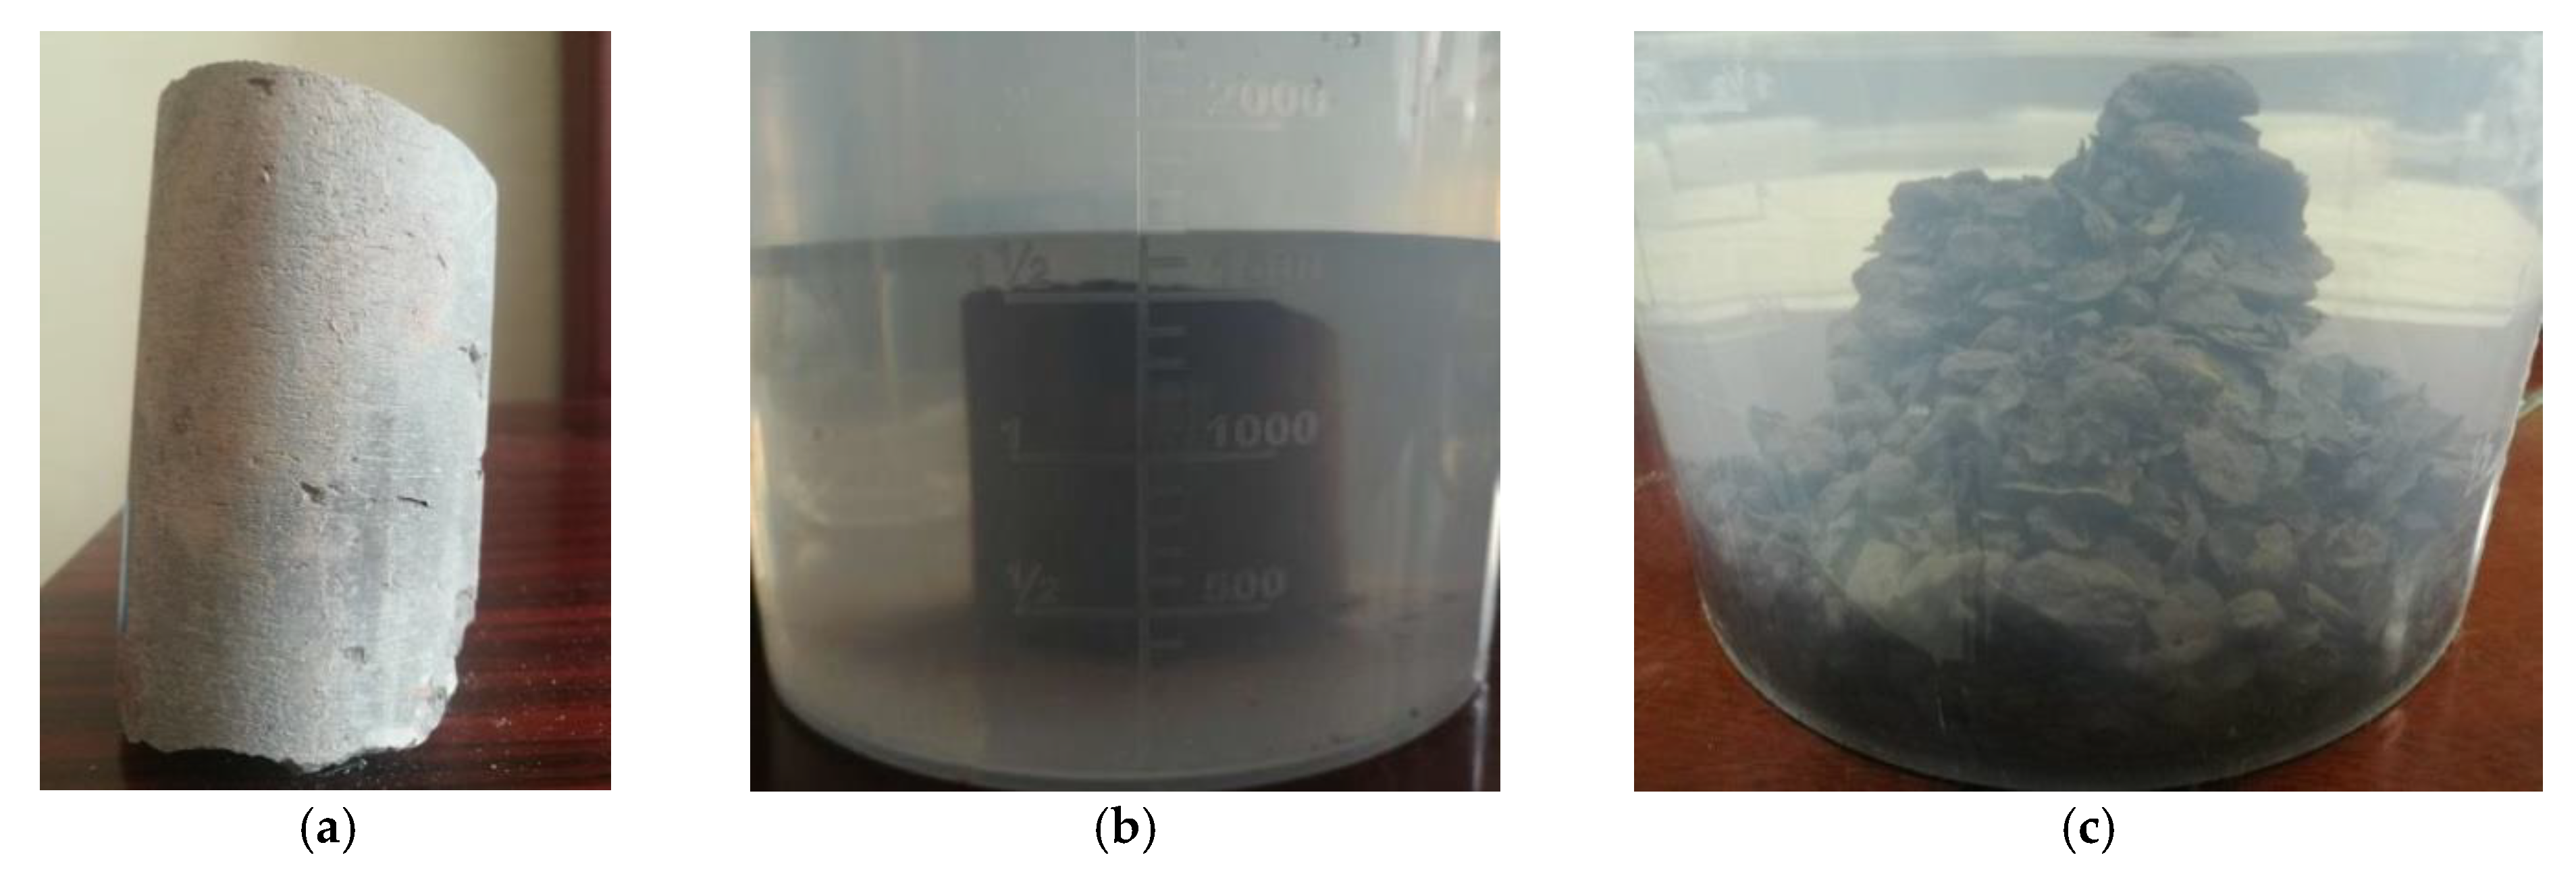
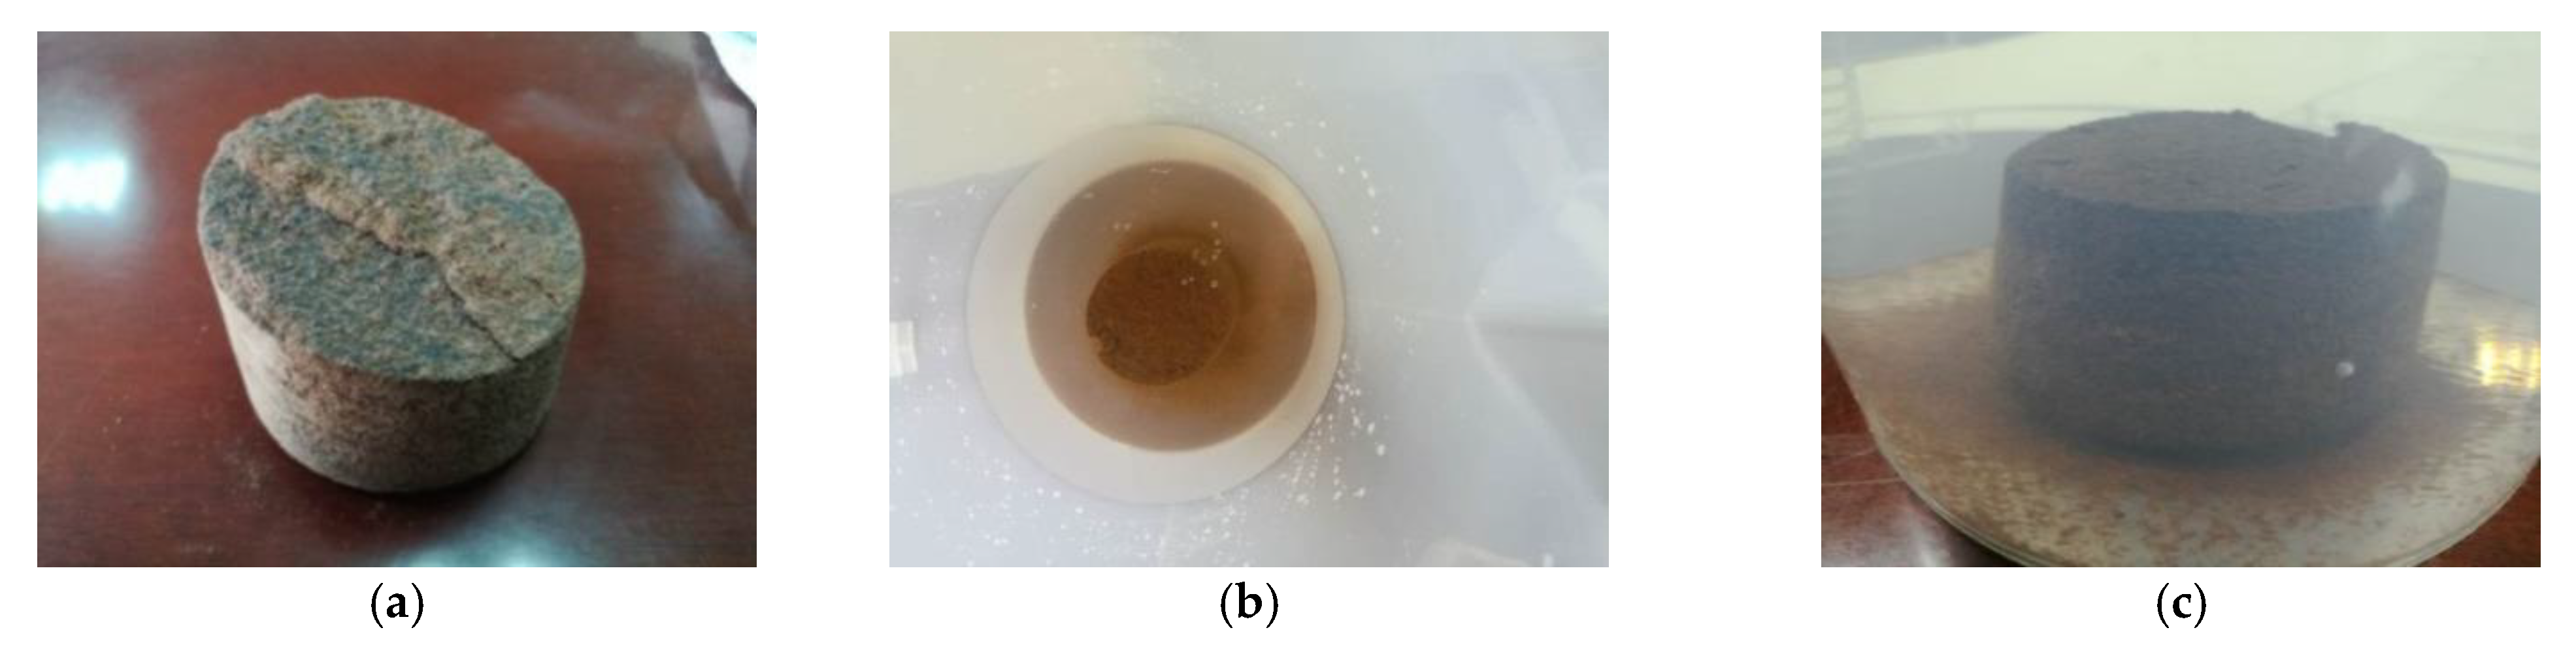
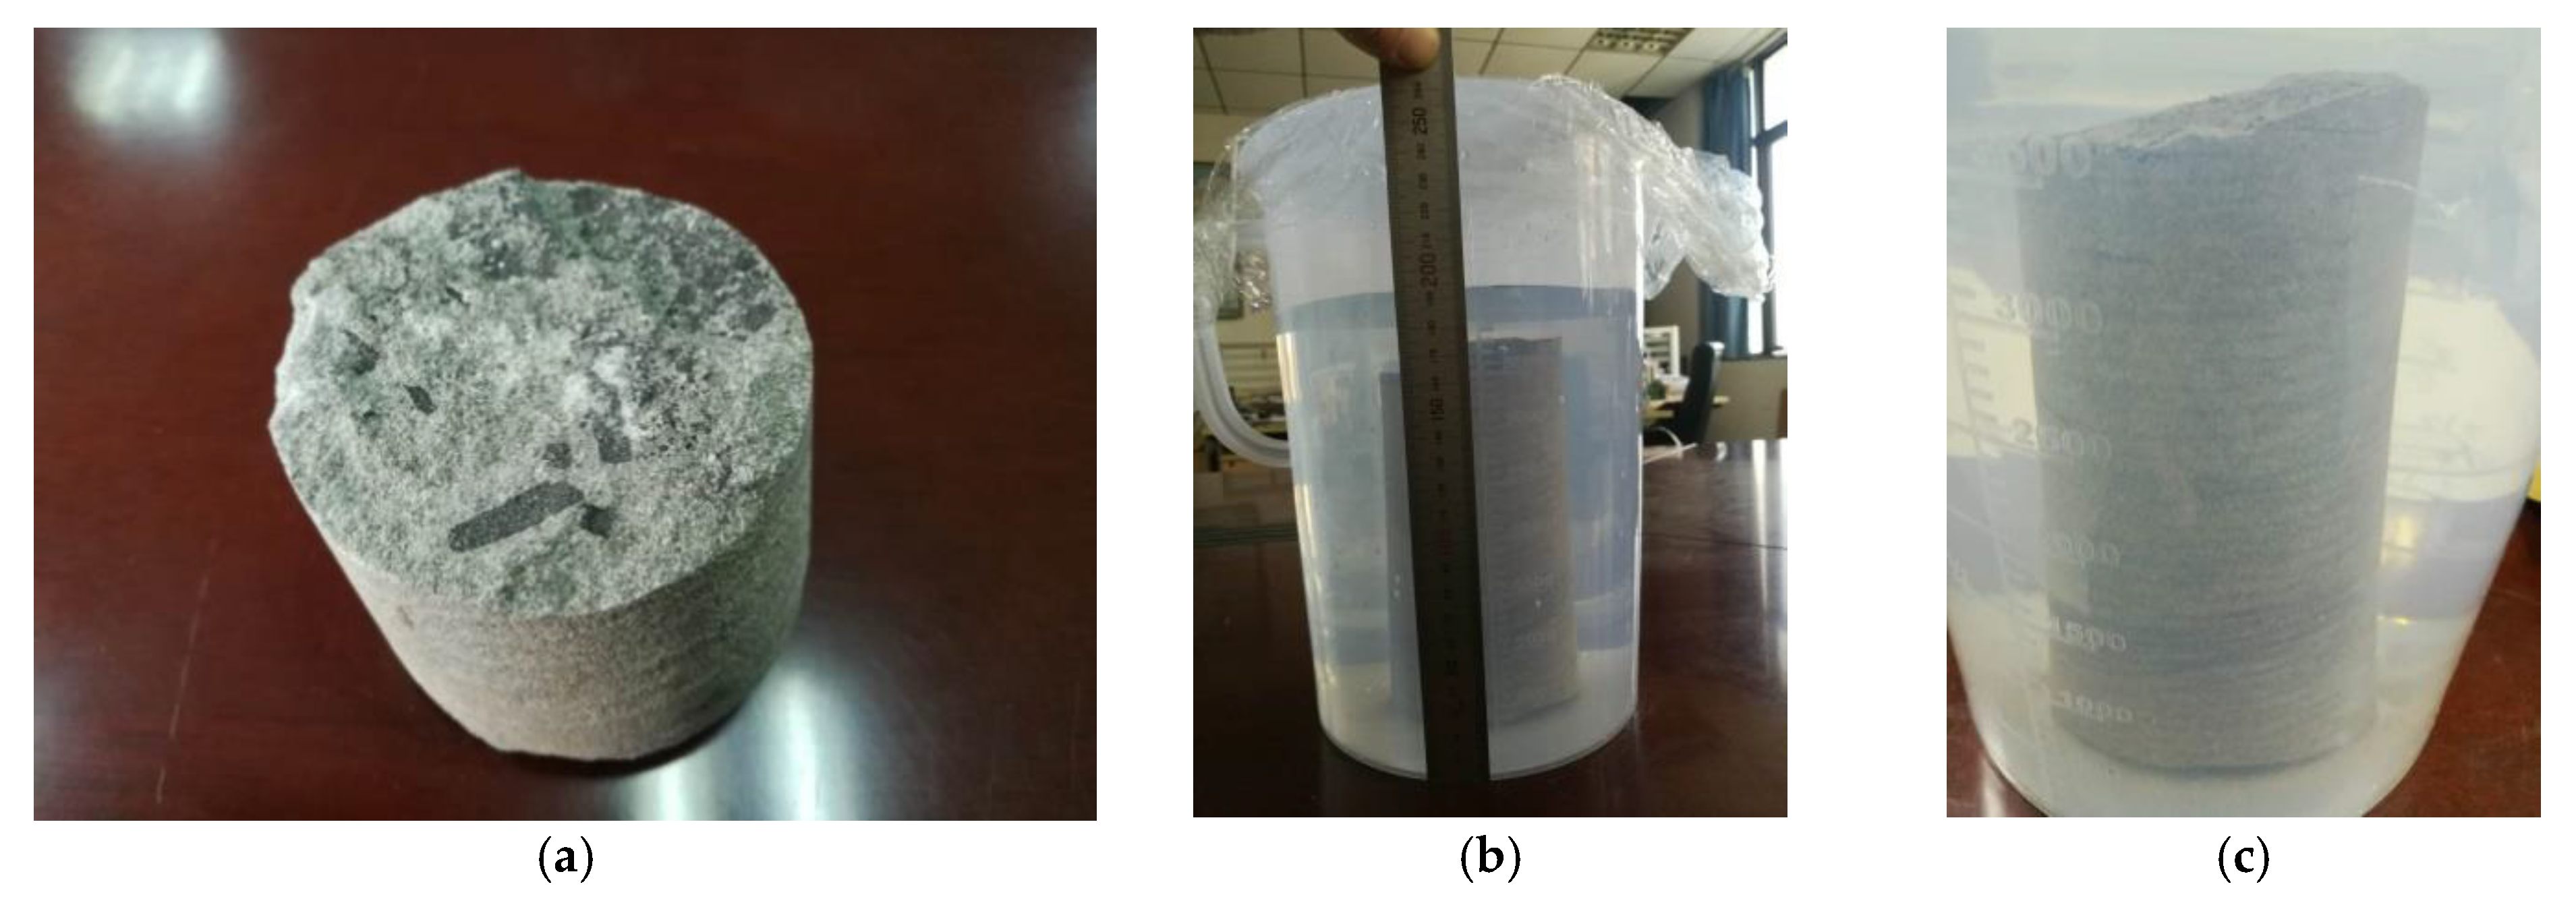
3.3. Hydrolytic Properties of Weakly Cemented Sandstone

Some of the Zhidan group sandstone, Anding group sandstone, Zhiluo group sandstone, and Yan’an group sandstone were placed in a 5000 mL container. The container was filled with water until the experimental samples were submerged, and sealed with plastic wrap. In the hydrolysis experiment, there was no artificial shaking of the container, which means that the whole experiment process occurred in a stable state. Figure 19, Figure 20, Figure 21 and Figure 22 show comparative diagrams of the corresponding rock samples before and after hydrolysis.
Figure 19 is a hydrolysis experiment comparison diagram of the Anding Formation sandstone. When the hydrolysis experiment of the Anding Formation sandstone was being conducted, the water near the rock sample gradually became turbid, and fine particles separated from the overall structure of the rock sample and continuously fell to the bottom of the container (Figure 19b). After several hours, the overall structure of the rock sample broke down and formed flake- or block-like structures (Figure 19c). This was because the clay mineral content of the Anding Formation sandstone was up to 41.3%, and the pores and fractures developed internally. Some of the clays may have expanded (water in interlayer positions), which provided the pressure for tensile failure of the individual components. Then, the rock sample expanded and failed along the internal pores and fractures, leading to the disintegration of the rock sample.
Figure 20 is a hydrolysis experiment comparison diagram of the Zhidan group sandstone. When the hydrolysis experiment was carried out, it was found that the high porosity of the immediately became saturated with the fluid (Note that the Zhidan group sandstones have been on site for some time and are not in their natural state), and some phenomena—such as bubbles and creaking noises—were transiently observed (Figure 20b). After one month of the hydrolysis experiment, although a layer of tiny particles was deposited at the bottom of the vessel, the overall structure of the Zhidan group sandstone was relatively complete (Figure 20c). This was because there were large gaps between particles in the rock mass; therefore, water absorption occurred. In addition, the Zhidan group sandstone contained few clay minerals, accounting for only 8.5% of the total sample amount. The cements were mostly potash feldspar and plagioclase, which are poorly soluble in water. Thus, the Zhidan group sandstone will not collapse.
Figure 21 is a hydrolysis experiment comparison diagram of the Zhiluo group sandstone. No abnormal phenomena occurred during the hydrolysis experiment of the Zhiluo group sandstone (Figure 21b). Several days later, large fractures developed in the rock sample; however, disintegration did not occur, and the rock sample almost maintained its original geometry (Figure 21c). This was because the Zhiluo group sandstone contains clay minerals, which are mostly insoluble. After encountering water, the Zhiluo group sandstone was only destroyed along the tiny fractures and cavities in the rock mass. Thus, the original geometry of the rock sample was maintained.
Figure 22 is a hydrolysis experiment comparison diagram of the Yan’an formation sandstone. No abnormality was detected during the hydrolysis experiments on this sandstone (Figure 22c). This was because the clay mineral content in Yan’an Formation sandstone is low, and it is poorly soluble in water. In addition, holes and fractures almost did not develop, and the rock samples maintained a good overall structure.
By analyzing the physical and mechanical properties of weakly cemented sandstones, it was found that most sandstones in the Zhidan group were medium sandstone or coarse sandstone, with a relatively large particle size, large internal voids, calcareous cementation, non-disintegration in the presence of water, and relatively weak lithology. Most Anding Formation sandstones were sandy mudstones of small particle size with internal fissures and holes. Additionally, they easily disintegrated and had a weak lithology. Moreover, the cementation was clay minerals or hematite. The Zhiluo group sandstone was mostly sandy mudstone, with a moderate particle size, relatively dense rocks, clay mineral cementation, non-disintegration in the presence of water, and weak medium-hard lithology. The Yan’an Formation sandstones were mostly fine sandstones or siltstones, with dense rocks, ferruginous cementation, non-disintegrating in the presence of water, and a medium–hard lithology.

4. Strata Failure Rule of Deep Mining with the Super-Thick and Weakly Cemented Overburden through Numerical Simulation

According to the geological and mining conditions of Yingpanhao Coal Mine, a two-dimensional discrete element model of the study area was constructed. According to the physical and mechanical properties and micro-geometric characteristics of weakly cemented sandstone, the mechanical parameters of rock joints and stratification were adjusted until the simulation results were consistent with the measured data. The model size and parameters are detailed in Table 3 and Table 4. In this paper, we studied the temporal and spatial evolution laws of the overburden movement when workfaces 2201, 2202, 2203, and 2204 were mined.
As can be seen from Figure 23, when the width of working face was 300 m, the height of the water-conducting fracture zone developed to 116 m above the coal seam, which was consistent with the measured results (the height of the water-conducting fracture zone develops to 115 m above the coal seam). At this time, the surface subsidence of 407 mm was larger than the actual measured value (326 mm). This was because the model built by UDEC was two-dimensional, the advance direction could be regarded as infinite mining, and the phenomenon of the inter-embedding among blocks occurred, so that the simulation results were larger than the measured results under the same mining width. This shows that the numerical model established in this paper is reasonable.

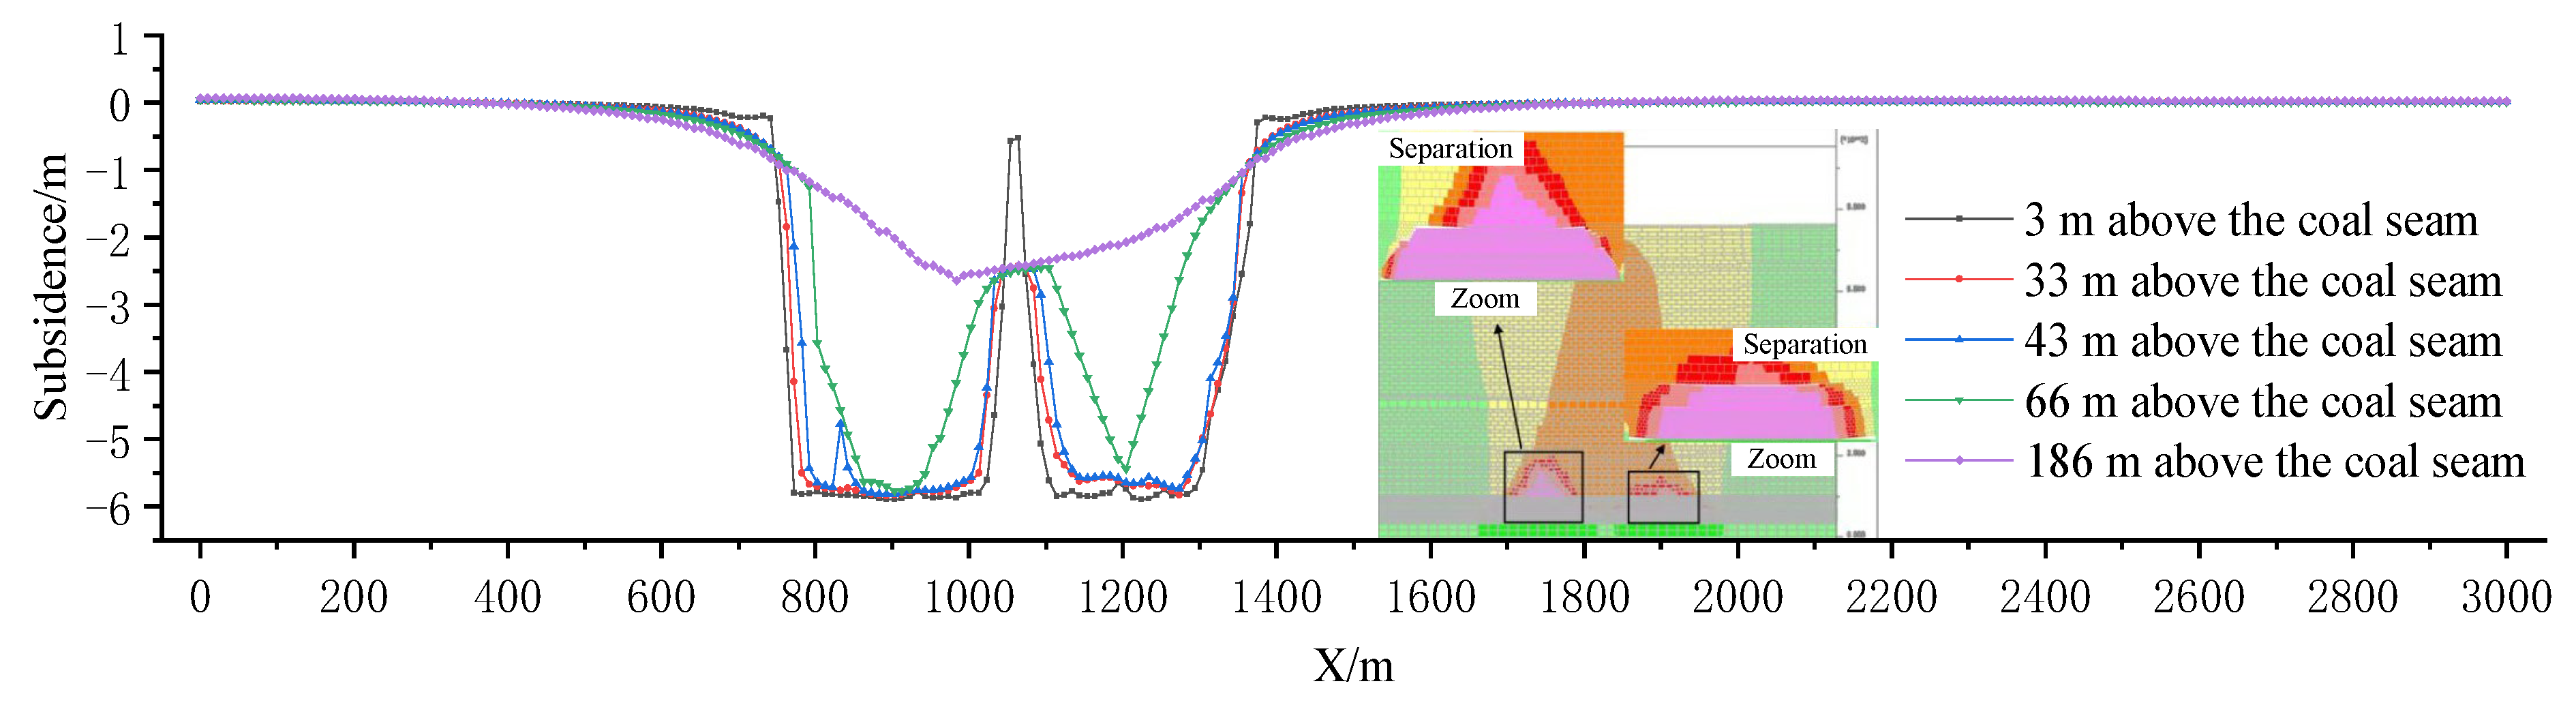
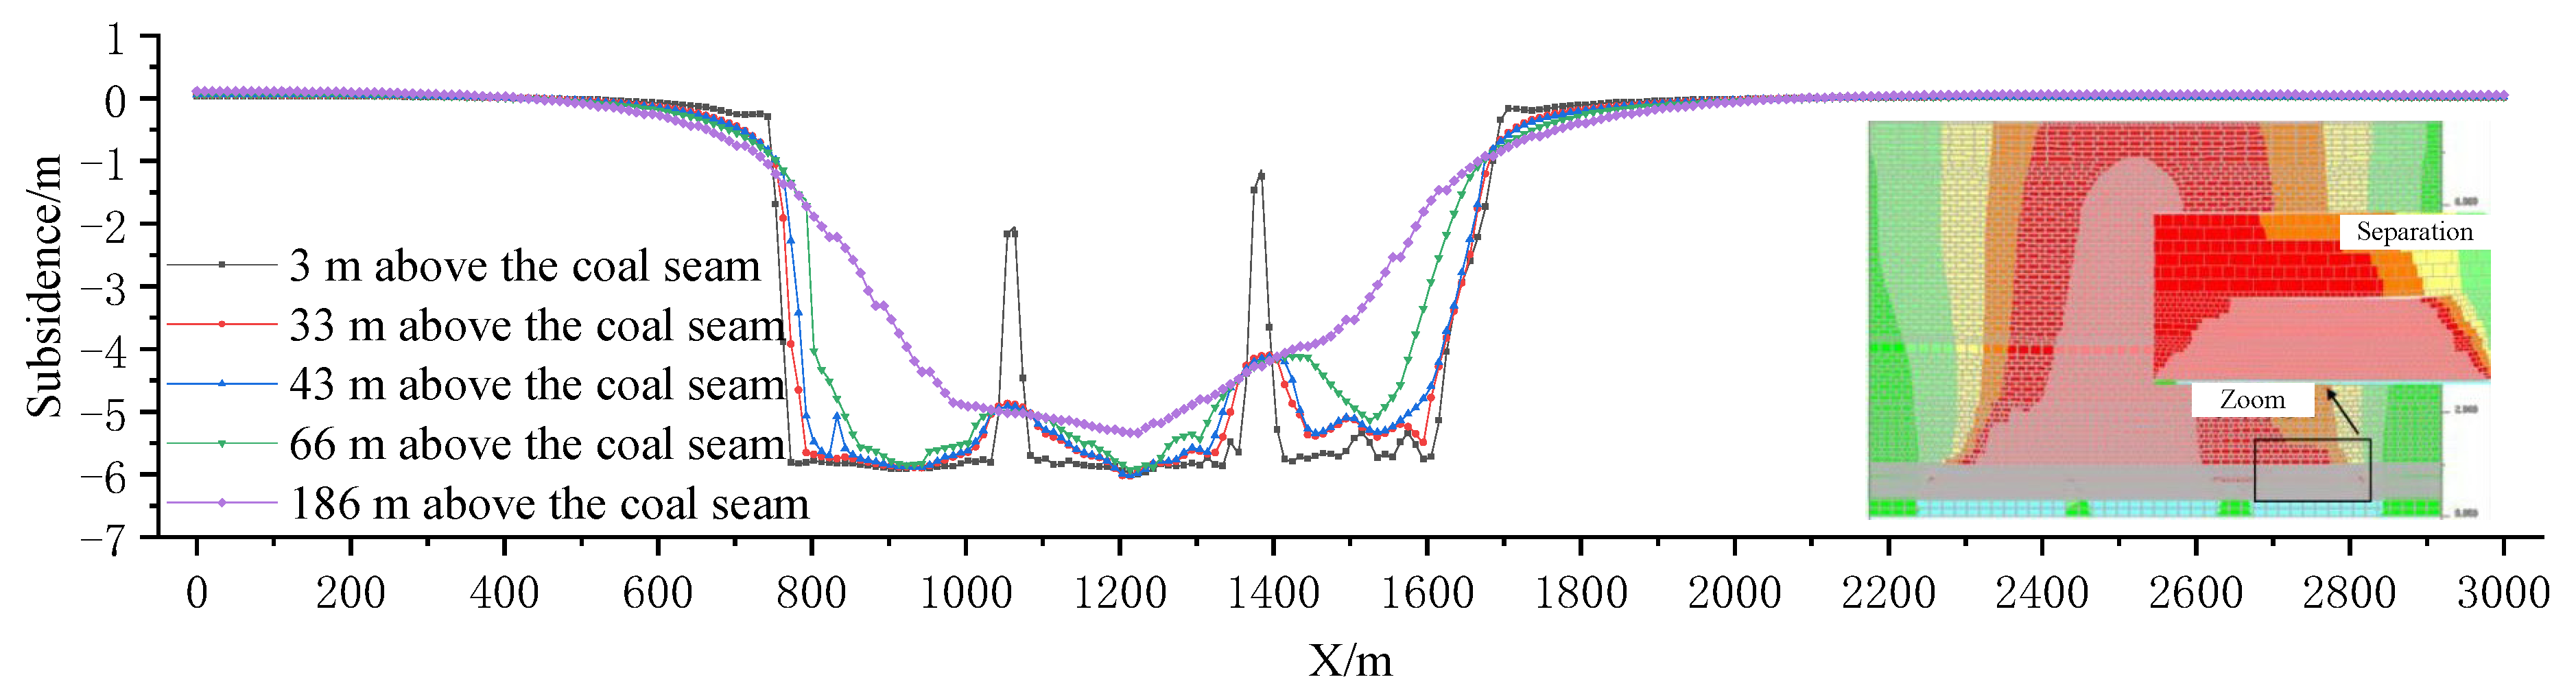
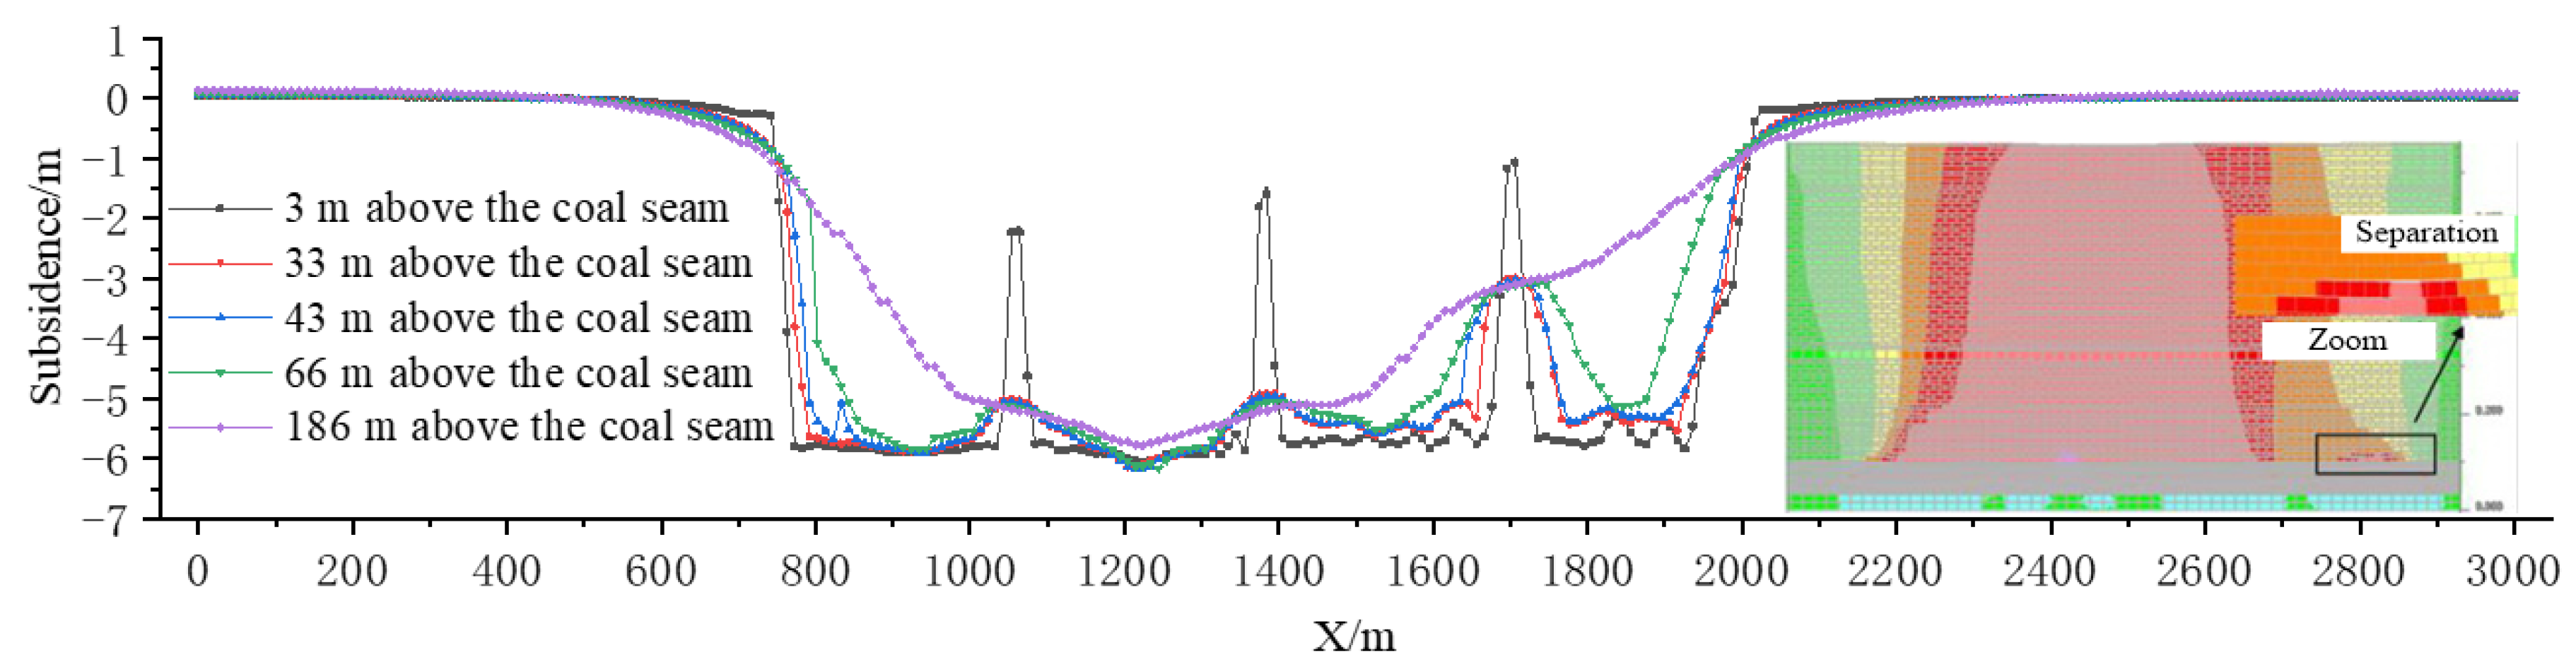
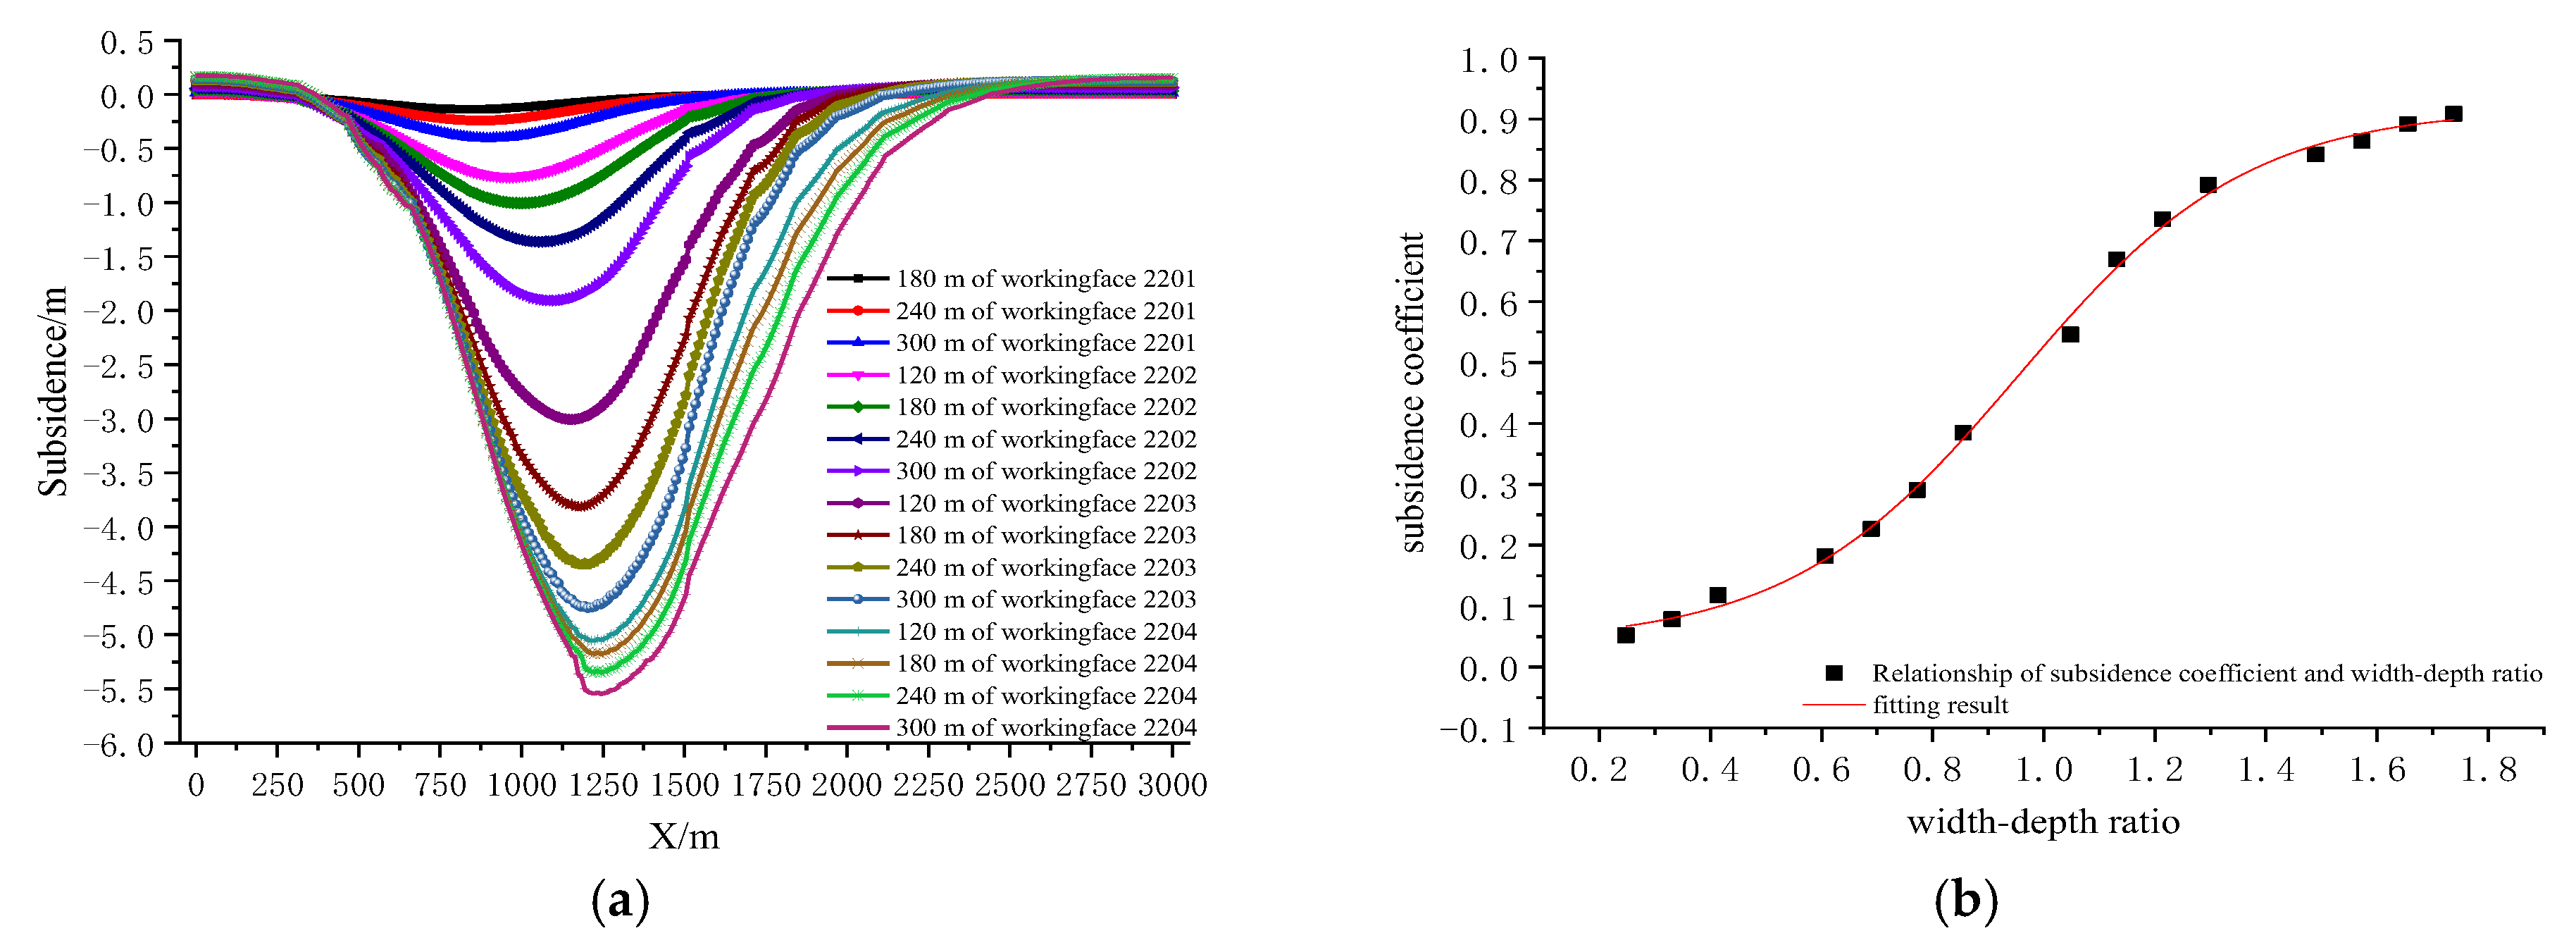
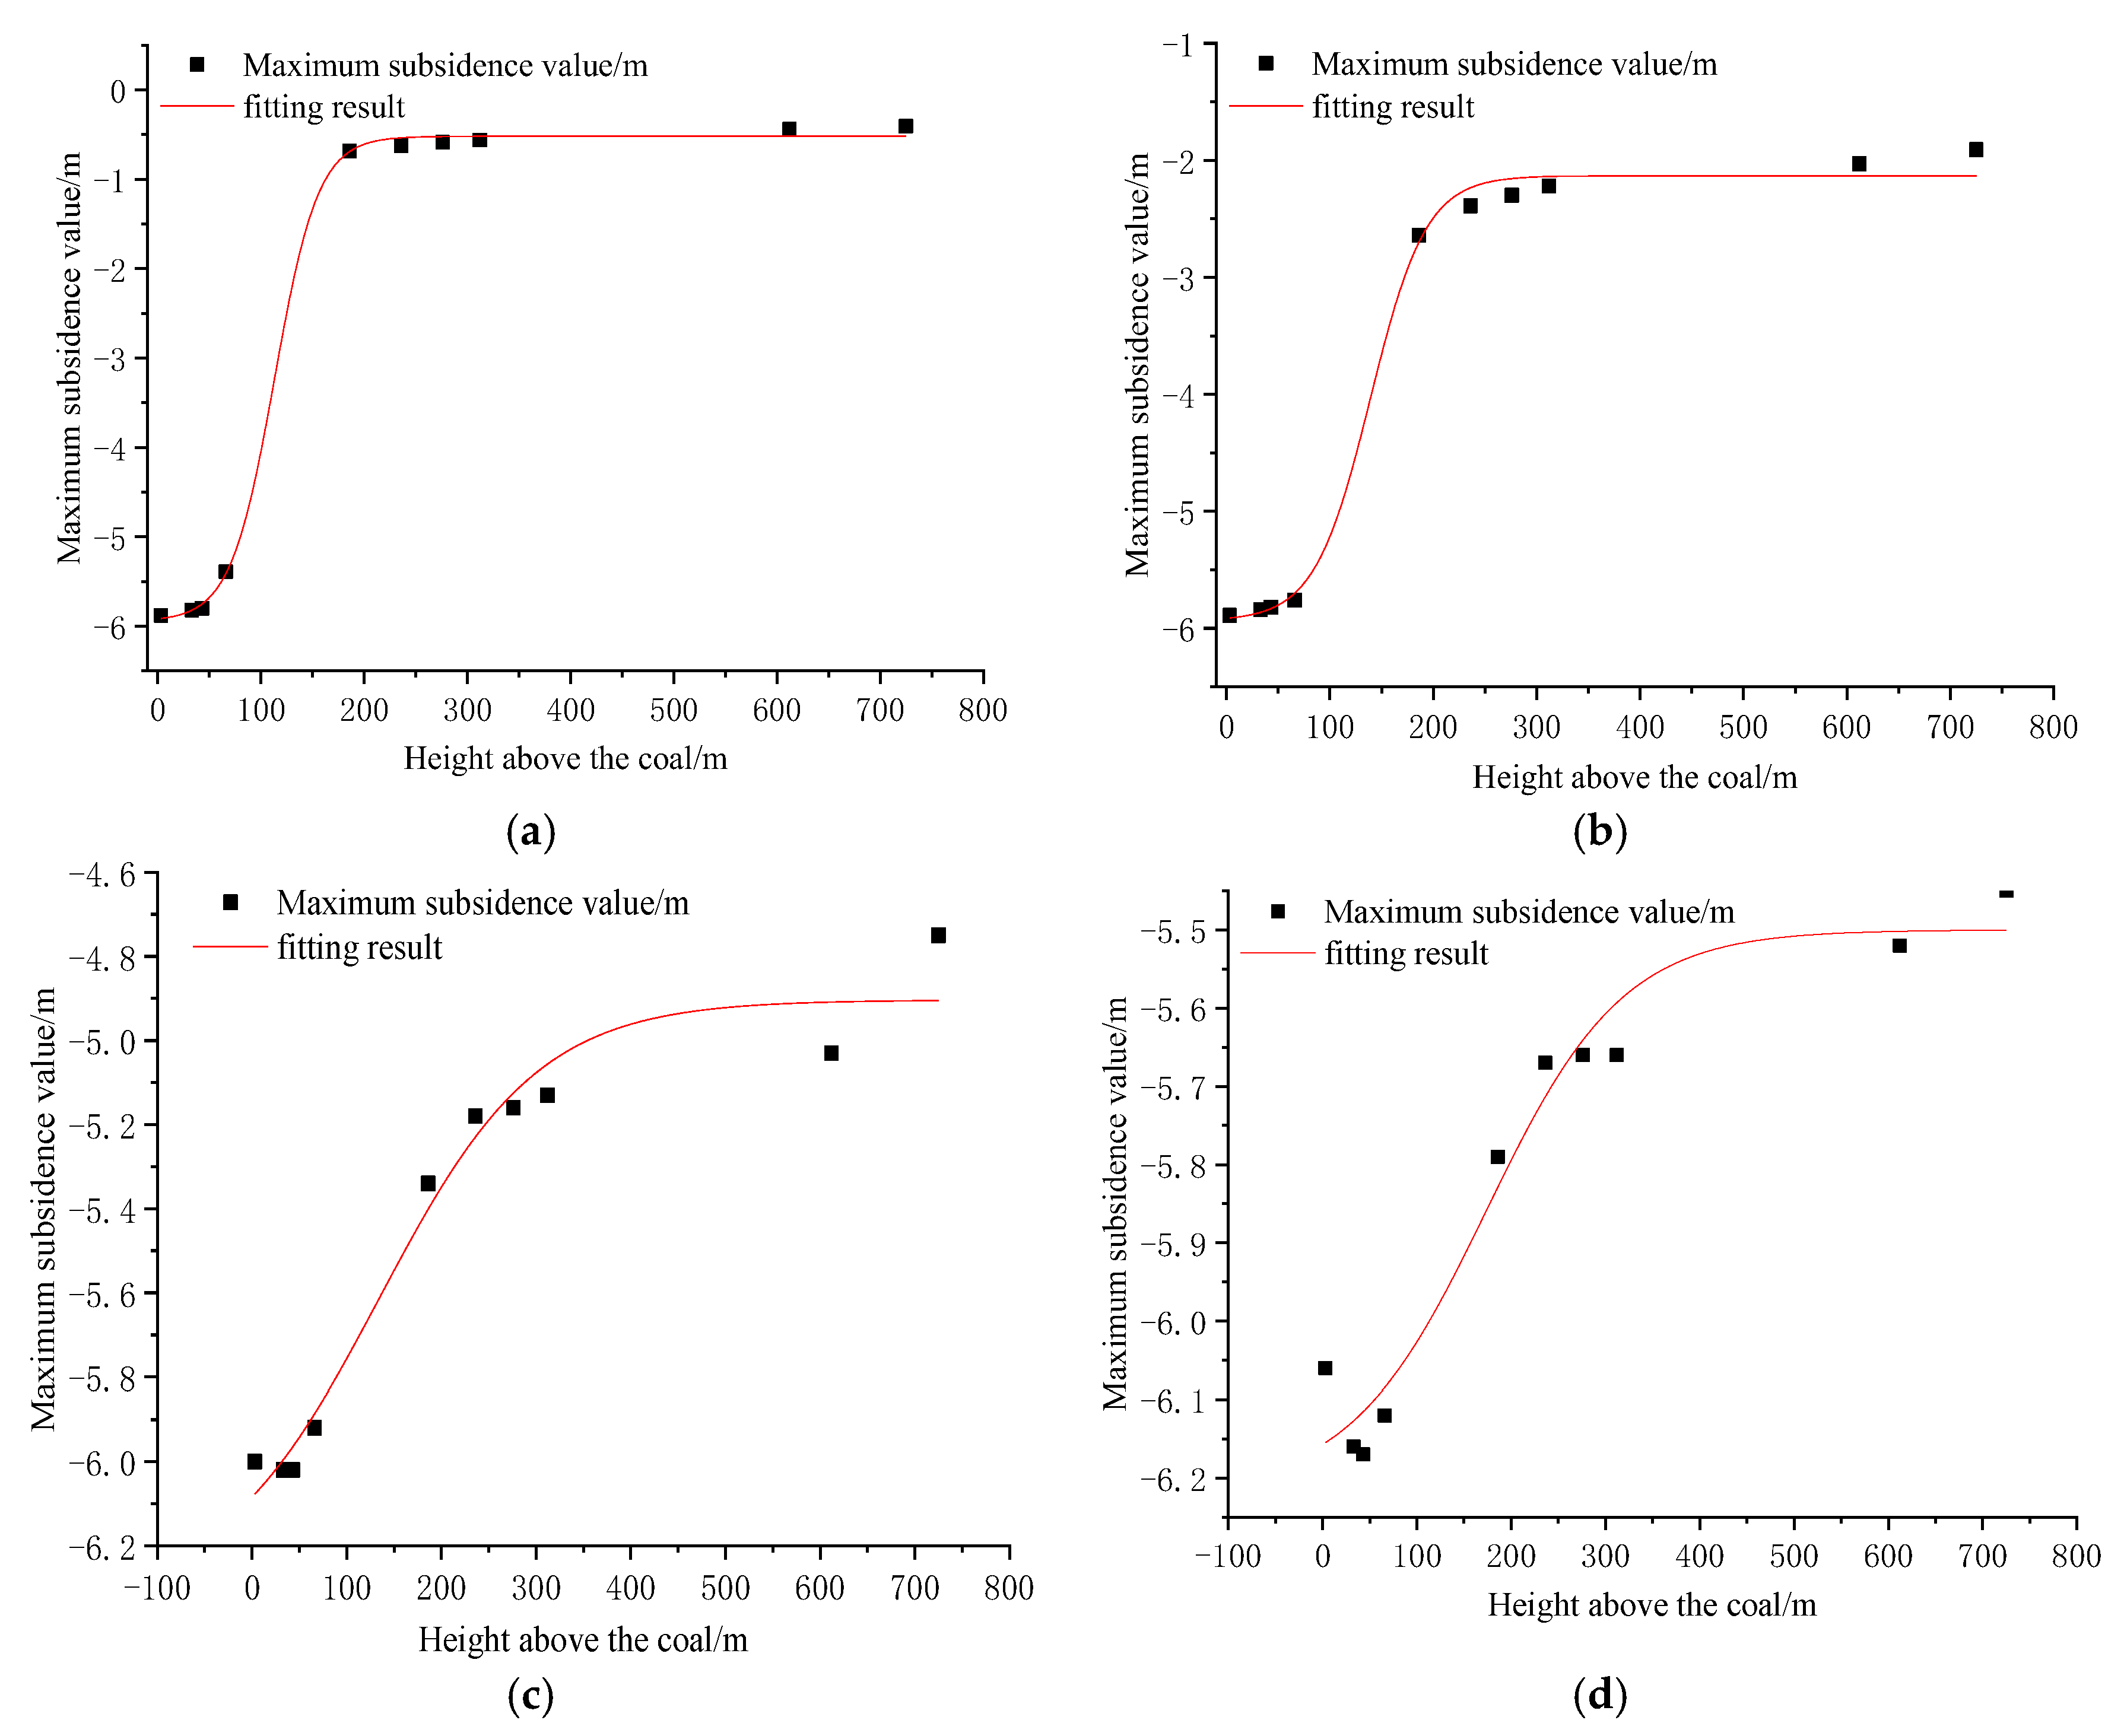
4.1. Displacement Evolution of Overburden Strata

In this section, the authors only discuss the displacement nephogram and the movement curves of the overlying strata at different buried depths when workfaces 2201, 2202, 2203, and 2204 were 300 m in length, as shown in Figure 24, Figure 25, Figure 26 and Figure 27.
It can be seen from these figures that after the coal seam had been mined, the subsidence was more significant from the immediate roof to 66 m above the coal seam. The separation layers of workforce 2201, 2202, 2203, and 2204 developed to 96 m, 66 m, 66 m, and 86 m above the coal seam, respectively.
With the expansion of the mining range, the compression of coal pillar 1, coal pillar 2 and coal pillar 3 exhibited a decreasing trend, which was consistent with the simulation results of similar materials. In Figure 28, Pillar 1 fractured and pressed into the floor strata, whereas Pillar 2 and 3 fractured the floor strata.
With increases in the mining range, the compression of coal pillar 1, coal pillar 2, and coal pillar 3 exhibited a decreasing trend, which was consistent with the simulation results for similar materials. Influenced by the coal pillar, the subsidence curve of the overburden rock was wavy, which was weakened when it passed through the thick Zhiluo group sandstone and, thus, gradually became a single gentle subsidence basin.
To demonstrate the relationship between the surface subsidence and mining degree more intuitively, the surface subsidence values of different width–depth ratios were found and the corresponding surface subsidence coefficients were calculated, as shown in Table 5. In addition, the corresponding surface subsidence curves and the relationship curves between the width–depth ratio and surface subsidence coefficient were drawn, as shown in Figure 29.
As shown in Figure 29a, after mining workfaces 2201, 2202, 2203, and 2204, the corresponding maximum surface subsidence values were 407 mm, 1910 mm, 4750 mm, and 5450 mm, respectively, exhibiting obvious jumps. When the length of workface 2203 was 120 m, the surface subsidence was the most significant, and the maximum surface subsidence value increased by 1090 mm. The numerical simulation results were consistent with the simulation results of similar materials, further verifying the reliability of the results found in this paper.
From Figure 29b, it can be seen that with increases in the width–depth ratio, the surface subsidence coefficient increased as a Boltzmann function, and the correlation coefficient R2 = 0.998. The mathematical expression is as follows:
q = 0.918 + 0.039 0.918 1 + e D 1 / H 0 0.954 0.206
In addition, the subsidence values of the overlying strata at different depths and the distance of the subsidence boundary to the goaf boundary with increases in the mining space were counted, and the corresponding relationship curves were drawn and fitted, as shown in Table 6 and Table 7 and Figure 30 and Figure 31:
It can be seen from Figure 30 that, when workfaces 2201, 2202, 2203, and 2204 were mined, the maximum subsidence value of the overlying strata at different buried depths and the height above the coal seam exhibited a Boltzmann function relationship, and the corresponding correlation coefficient R2 = 0.999, 0.994, 0.956, and 0.944. With mining range expansion, the correlation coefficient of the Boltzmann function tended to decrease.
As shown in Figure 31, when workfaces 2201, 2202, 2203, and 2204 were mined, the distance of the subsidence influence boundary to the goaf boundary at different buried depths and the height above the coal seam (∆H) had a Boltzmann function, with a correlation coefficient R2 = 0.992, 0.967, 0.872, and 0.918. The relevant mathematical expression is as follows:
H = 749.13 770.77 1 + e S W 490.67 35.49 H = 744.13 759.4 1 + e S W 448.81 16.68
H = 17086.79 98.69 S W + 0.14 S W 2 H = 14060.02 82.83 S W + 0.12 S W 2
By analyzing Figure 30 and Figure 31, it can be seen that when the goaf width was small, there was a Boltzmann function relationship between the Wmax at different buried depths and the height above the coal seam; the same was true for the SW at different buried depths and the height above the coal seam. With the continuous expansion of the goaf, the functional relationship between the Wmax at different buried depths and the height above the coal seam was constant, while the functional relationship between the SW at different buried depths gradually changed from a Boltzmann function to a parabolic function. Furthermore, due to the continuously expanding scope of the goaf, the tangent of the main influence angle increased gradually, and its variation range was between 1.21 and 1.71, which was within the common value range.

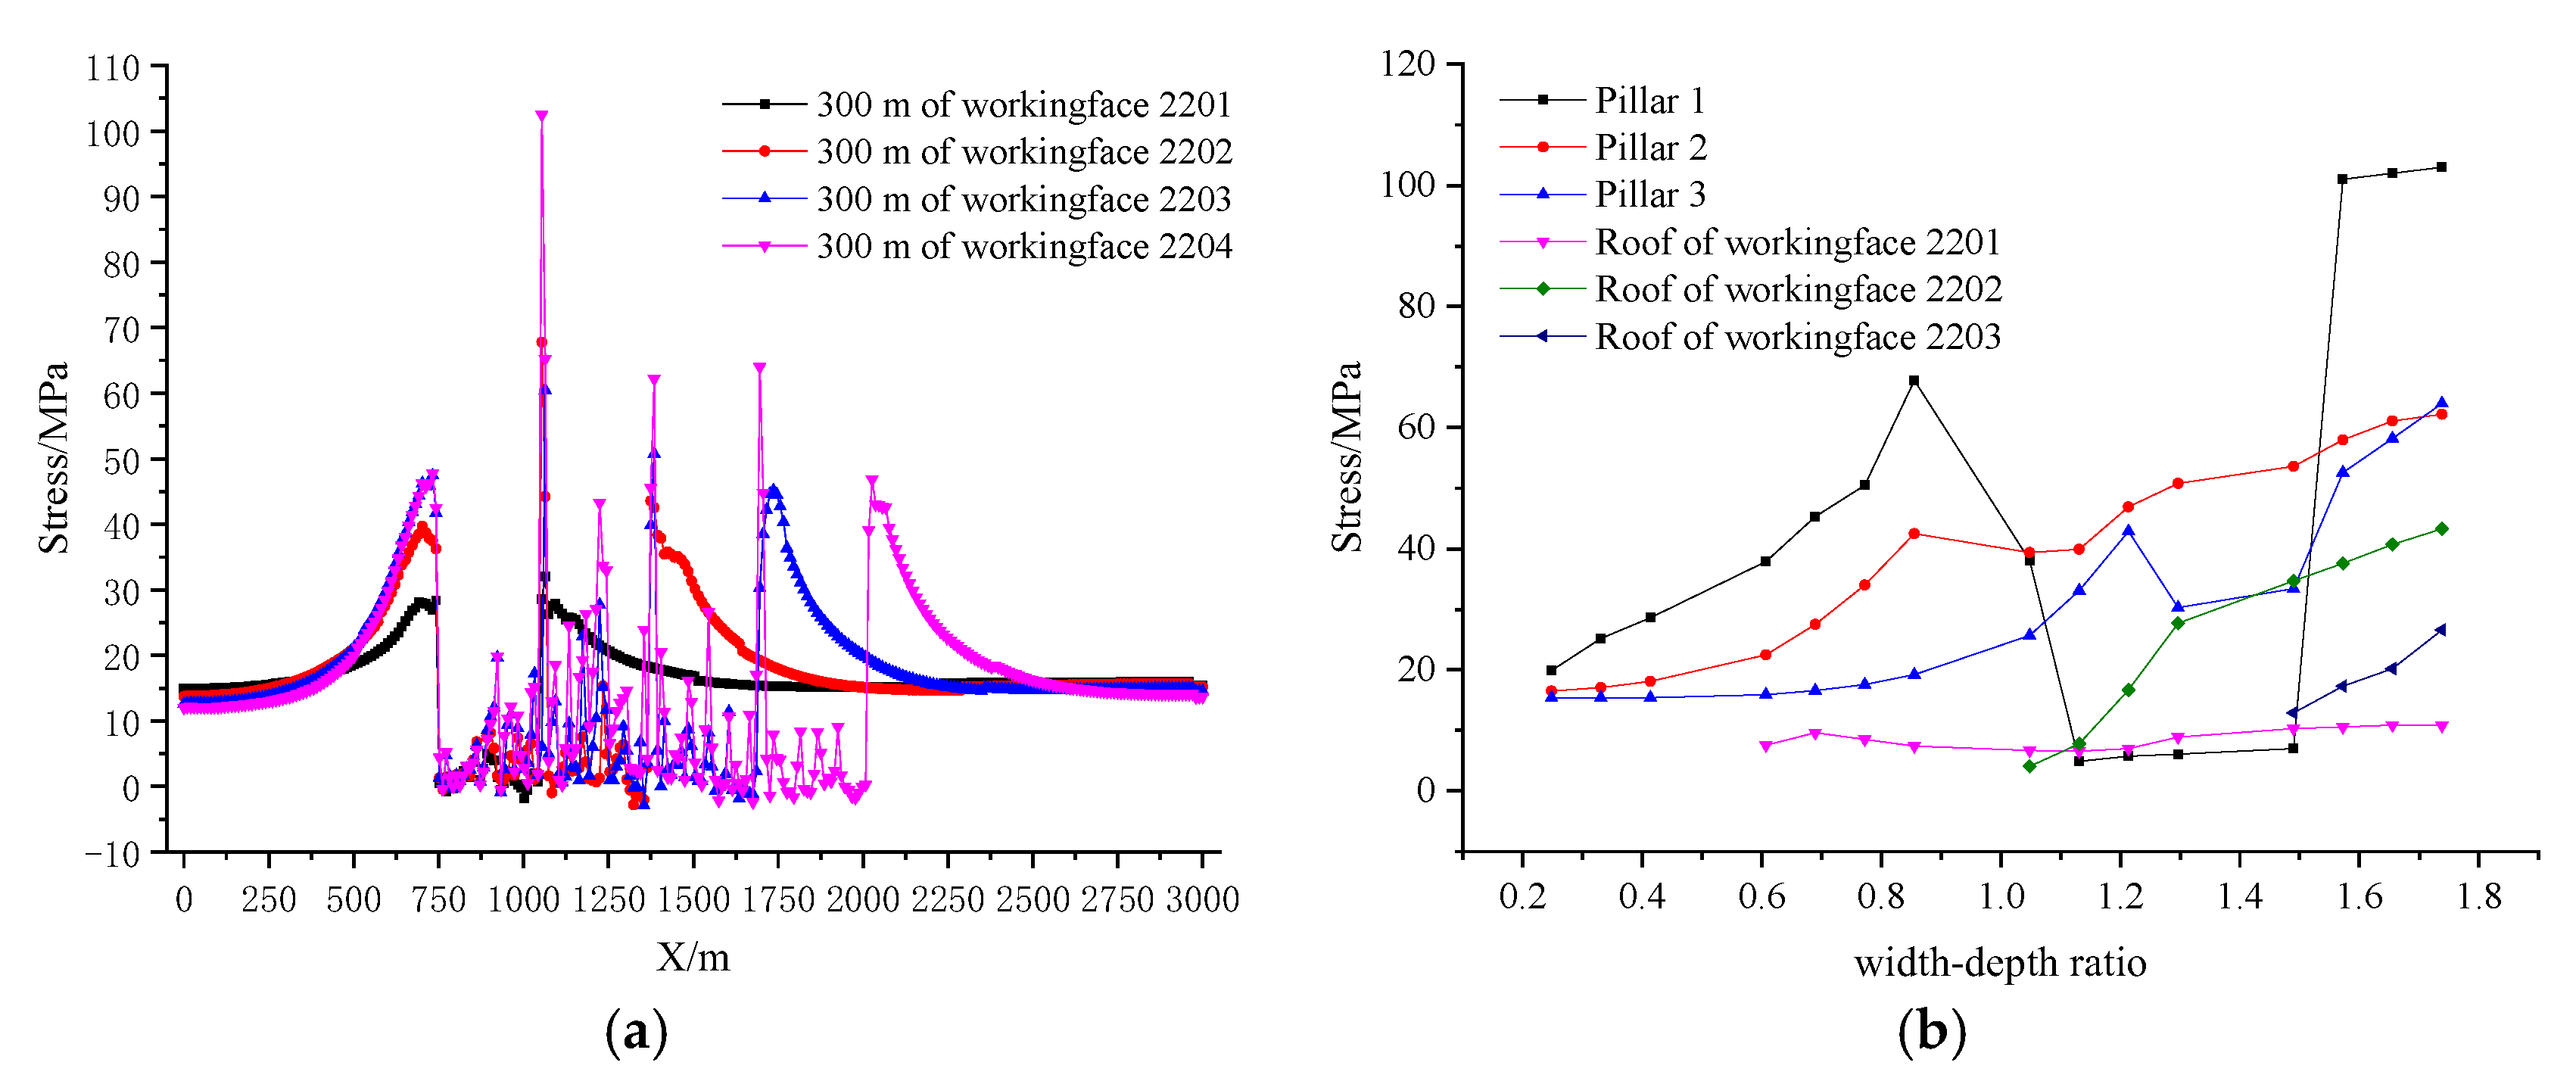
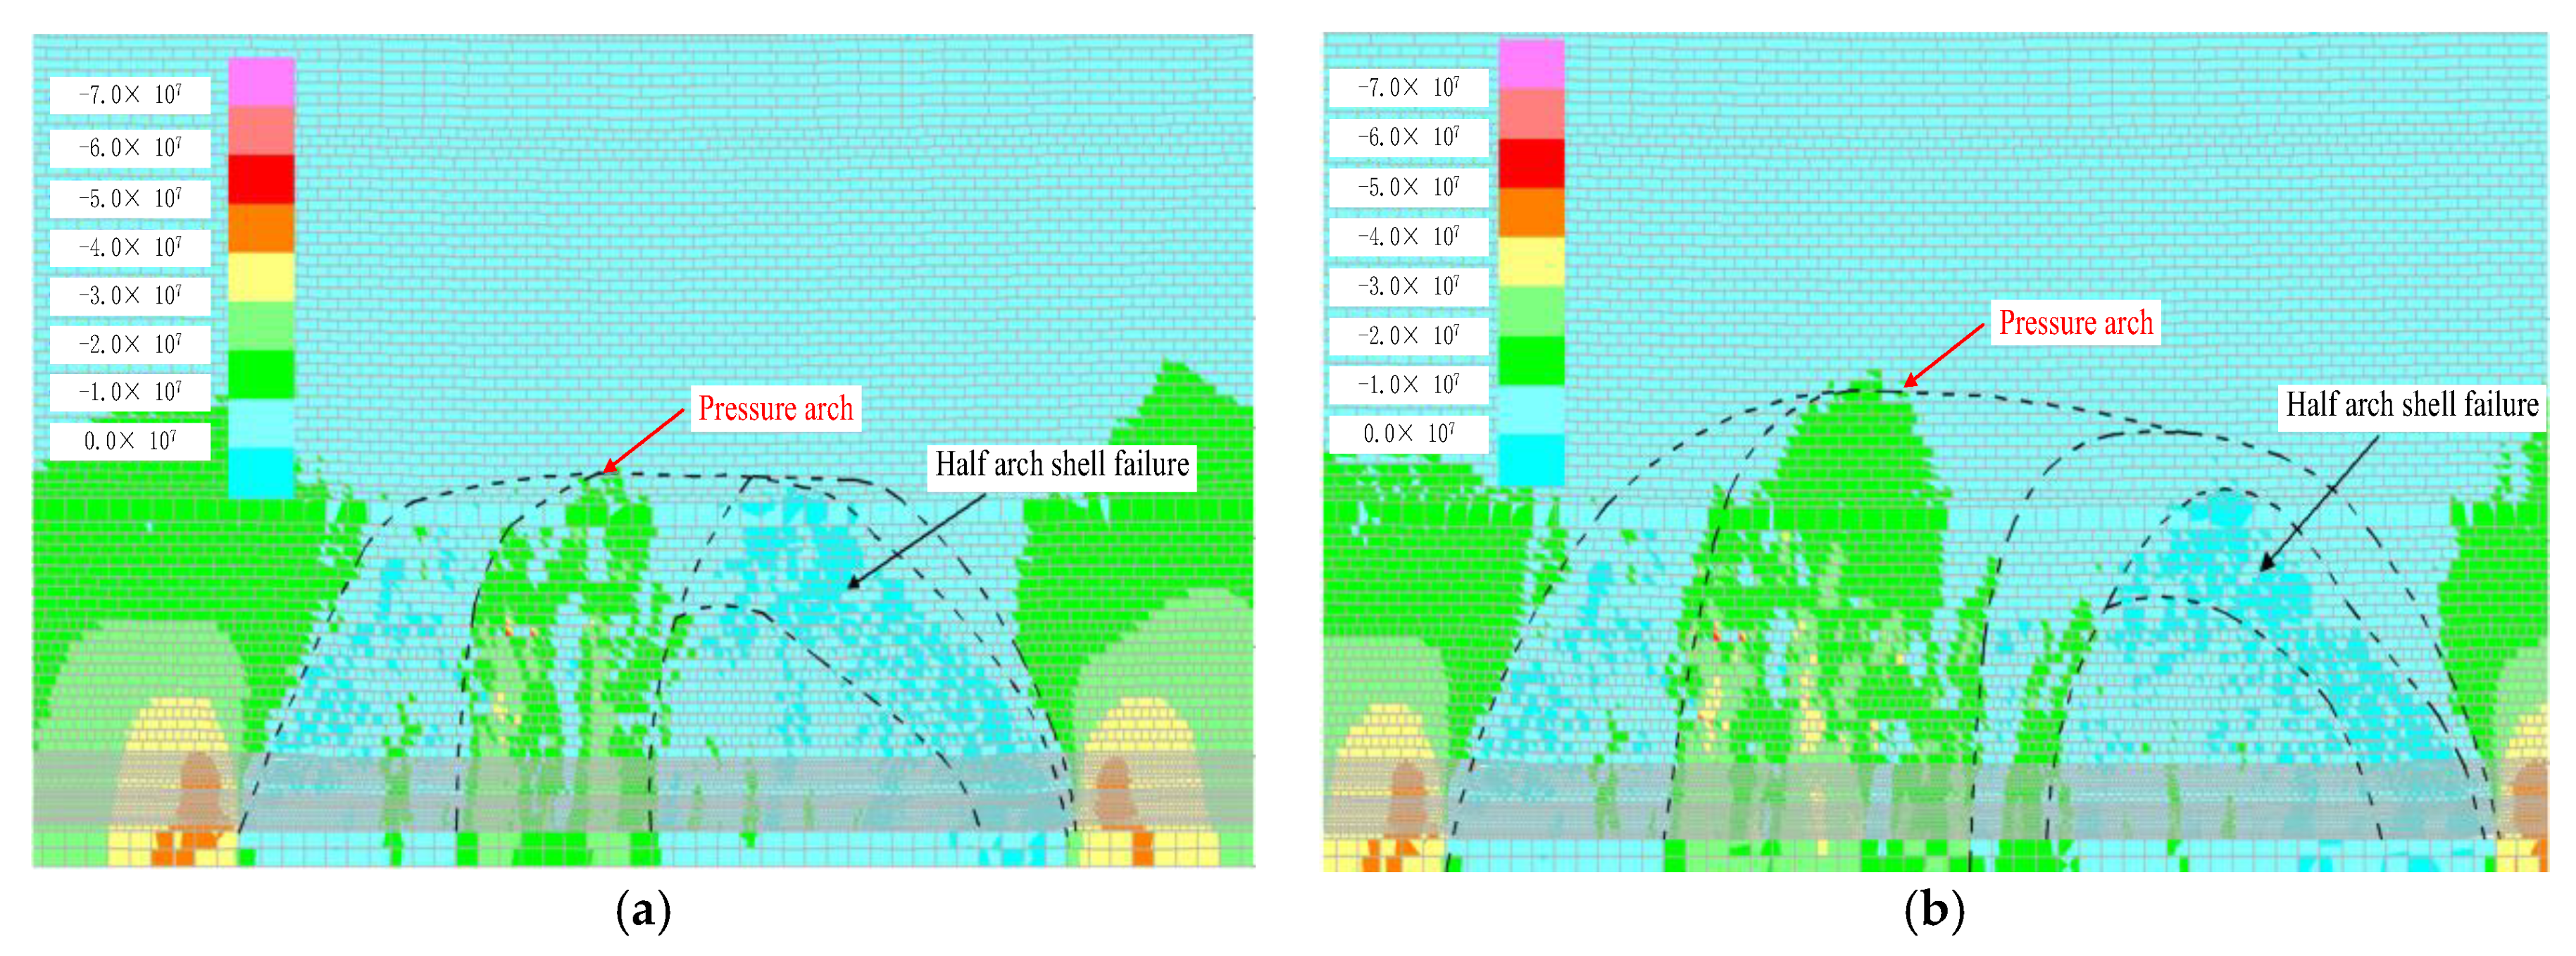
4.2. Evolution Law of the Stress Fields of the Overlying Strata

This study extracted the stress evolution data of overlying strata. Figure 32 shows a schematic of the evolution law of the surrounding rock stress field, and Table 8 reflects the corresponding vertical stress value statistics. The specific analysis was as follows:
(1) When the lengths of workface 2201 were 180 m, 240 m, and 300 m, the vertical stress of the coal wall at coal pillar 1 gradually increased, reaching 28.6 MPa.
(2) When mining workface 2202, the vertical stress of coal pillar 1 continued to increase, and the stress value reached 67.8 MPa. The stress of the coal wall at pillar 2 on both sides of the goaf increased, and the vertical stress value increased to 42.5 MPa.
(3) When mining workface 2203, the vertical stress of coal pillar 1 gradually decreased to 6.1 MPa, and the phenomenon of strata behavior appeared at the immediate roof of workface 2202; the vertical stress increased to 27.7 MPa. Moreover, the vertical stress of coal pillar 2 increased gradually, and the vertical stress values were 39.4 MPa, 39.9 MPa, 46.9 MPa, and 50.80 MPa, in sequence. In addition, the vertical stress values of the coal wall at pillar 3 first increased and then decreased, at 25.7 MPa, 33.1 MPa, 42.9 MPa, and 30.3 MPa, in sequence.
(4) When mining workface 2204, the vertical stress value of coal pillar 1 increased rapidly, from 7.01 MPa to 101 MPa, 102 MPa, and 103 MPa. Moreover, the vertical stress of coal pillar 2 and coal pillar 3 increased gradually, and the vertical stress at the immediate roof of the working face 2201 remained almost unchanged. In addition, slight strata behavior manifested at workfaces 2202 and 2203, and the vertical stress gradually increased.
By analyzing the stress evolution law of coal pillar 1, it can be seen that the dynamic range of the super-thick and weakly cemented overburden was wide during deep mining. For example, the stress concentration degree of the segment coal pillar at 600 m away from workface 2204 was further increased.
To further study the failure law of the super-thick and weakly cementation overburden in deep mining, we analyzed the evolution law of the pressure arch in the overburden during the mining process:
It can be seen from Figure 33a–c that when the width of workface 2201 was 180 m, a beam fracture occurred in thin sandstone (immediate roof), and a double-pressure arch developed above the goaf, forming a stable arch shell structure to support the overburden load. When the width of workface 2201 was 240 m, three pressure arches developed above the goaf, and arch-shell failure occurred in thick sandstone. When the width of workface 2201 was 300 m, the three-pressure arch above the goaf continued to develop upwards, and the arch-shell failure range of thick sandstone was further expanded.
It can be seen from Figure 33d–g that when the width of workface 2202 was 120 m, beam fracture occurred in thin sandstone (immediate roof), and a double-pressure arch developed above the goaf, forming a stable arch shell structure to support the rock load above the immediate roof. At this time, four pressure arches developed above workface 2201, and double arch-shell failure occurred in the thick sandstone. When the width of workface 2202 was 180 m, there were two large pressure arches above the goaf of workfaces 2201 and 2202, producing a stable arch shell structure to support the overburden load. Moreover, beam failure continued to occur in the thin sandstone (immediate roof) above workface 2202, forming a masonry beam structure. When the width of workface 2202 reached 240 m, two large pressure arches above the goaf of workfaces 2201 and 2202 developed slightly upwards to support the overlying strata load sequentially, and arch-shell failure occurred in thick sandstone above workface 2202. When the width of workface 2202 reached 300 m, the range of the two large pressure arches above the goaf of workfaces 2201 and 2202 expanded slightly to support the overlying strata load, and the arch-shell failure range of the thick sandstone above workface 2202 is slightly increased.
It can be seen from Figure 33h,i that, when the width of workface 2203 reached 120 m, the scope of the double large pressure arch above the goaf of workfaces 2201, 2202, and 2203 slightly expanded, and the arch–shell failure height continued to develop upwards. When the width of workface 2203 reached 300 m, the Zhidan group sandstone became severely damaged, losing its bearing capacity, and the stable arch–shell structure disappeared. Multiple pressure arches and semi-pressure arches developed at the bottom of the Zhidan group sandstone, with arch feet concentrating in coal pillar 1, coal pillar 2, and the caving zone of workface 2202. Moreover, small stress arches developed in the fracture zone. Beam failure occurred in the thin sandstone above workface 2203, and arch-shell type failure occurred in the thick sandstone.
It can be seen from Figure 33j–l that, when the width of workface 2204 reached 120 m and 180 m, the development pattern of pressure arches in the overburden was similar to that described in Figure 33i. The thin sandstone above workface 2204 experienced beam–type damage, forming a beam structure, and a double-pressure arch developed above the goaf of workface 2204, forming a stable arch–shell structure to support the above-rock load. When the width of workface 2204 reached 300 m, the small pressure arches disappeared in the caving fracture zone of workfaces 2201 and 2202, the half arch–shell failure structure developed in the caving fracture zone of workface 2203, three pressure arches developed in the rock layer above workface 2204, and arch–shell failure occurred in thick sandstone.
To deeply analyze the failure law of the super-thick and weakly cemented overburden in deep mining, the study simulated and analyzed the influence of the mining degree of the advancing direction and incline direction on the evolution law of the overburden pressure arch, without considering the influence of the section coal pillars on the overburden failure law.
It can be seen from Figure 34 that, with the continuous advancement of the working face, the pressure arch in the overlying strata developed forward. When the main key layer structure was broken, a stress concentration area formed in the broken place and the caving fracture zone below it, and the small pressure arches developed forwards with the advancement of the working face. At this time, the thick sandstone structure inside the small pressure arch was damaged through semi–arch shell type failure.
By analyzing the evolution law of the overburden pressure arch in Figure 32 and Figure 33, it can be seen that the failure law of the super-thick and weakly cemented overburden in deep mining presented a combined ‘beam–arch shell’ type failure, which transitioned into ‘beam–semi-arch shell’ type failure with the continuous expansion of the mining space.

5. Discussions

In order to verify the reliability of the numerical simulation results, we also carried out similar material model tests by simplifying the strata. In the test plan, the geometric similarity ratio and the similarity ratio of the unit weight of this physical experiment were 1:400 and 1:1.6, respectively. Before similar material model tests, test pieces had to be produced to carry out the compression test. Figure 35 illustrates the test equipment and experiment process. From the results of the compression test, the final ratio of the aggregate and the binder for similar material model was ensured, as shown in Table 9.
The test results of similar material model were highly consistent with the numerical simulation results. In Figure 36, “beam–arch shell” failure occurred on the overburden in the similar material model, and the overburden failure boundary was arched in the UDEC model. This phenomenon can be explained by masonry beam and pressure arch theory.
In this paper, the span of the pressure arch above the goaf gradually increased when the width of the working face 2202 increased from 60 m to 180 m, and the height of the pressure arch gradually developed upwards. The stress in the pressure arch reached the sandstone ultimate compression strength, “arch shell” failure occur when the width of the working face 2202 was 240 m. When the width of the working face 2202 was 300 m, the height of the fractured arch no longer retained to develop upward, the fractured arch continued to go forward, and the overburden was then destroyed in the form of a half arch. From the view of the mechanics, the failure mode in the semi-arch mechanical model was similar to that of the full arch pressure mechanics model. The bending moment, shearing force and axial force of the arbitrary section D of the half arch were the same as that of an arch. The “semi–arched shell” structure in Figure 36e was pressure shear damage, because the arch waist position bore the vertical downward load of the overburden and upward sloping forces of the lower strata and reached the shear ultimate strength of ultra-thick and weak cementation overburden.

6. Conclusions

In this paper, the Yingpanhao Coal Mine was taken as the research object. Rock samples of the Zhidan group sandstone and Zhiluo group sandstone were obtained through drilling and coring. The physical properties and microstructural characteristics of weakly cemented rocks were further studied using an electronic microscope and other equipment. Based on the experimental results, a two-dimensional discrete element model of the study area was reasonably constructed to analyze the movement law and failure characteristics of the super-thick and weakly cemented overburden in deep mining, and the following conclusions were obtained:
(1) The uniaxial compressive strength of the Cretaceous Zhidan group sandstone was found to be between 10 and 20 MPa, and the uniaxial compressive strength of the Jurassic sandstone was between 20 and 40 MPa. The mechanical parameters of different lithologic sandstones in the Cretaceous Zhidan group sandstone were generally smaller than those of the corresponding Jurassic Zhiluo group sandstones. The mechanical parameters of different lithologic sandstones in the Cretaceous Zhidan group decreased with increases in particle uniformity. The compressive strength and elastic modulus of different lithologic sandstones in the Jurassic Zhiluo group decreased with increases in particle uniformity, while their cohesion increases.
(2) The Zhidan group sandstone was characterized by a large grain size, large internal voids, and calcareous cementation. Moreover, it did not disintegrate in water. Further, the Anding group sandstone was characterized by a small grain size, along with clay mineral and hematite cementation. Moreover, internal fractures and pores developed, and the Anding group sandstone disintegrated easily. The Zhiluo group sandstone was relatively compact, cemented by clay minerals, and did not easily disintegrate in water. The Yan’an group sandstone was compact, cemented with iron, and did not disintegrate in water.
(3) In deep multi-workface mining with super-thick and weakly cemented overburdens, the dynamic behavior range of the overburden was wide, and the influence range extended to 600 m beyond the goaf boundary. The compressive deformation of coal pillars at different positions differed significantly. The compressive deformation of the coal pillar between the first mining face and the adjacent workface was the largest, and that of other coal pillars decreased sequentially. The surface subsidence developed significantly, and the surface subsidence coefficient exhibited a Boltzmann functional relationship with the width–depth ratio.
(4) With the continuous expansion of the goaf, the tangent of the main influence angle increased gradually; its change ranged is between 1.21 and 1.71, falling within the common value range. In addition, the correlation degree of the Boltzmann functional relationship between the Wmax of different buried depths and the height above the coal gradually weakened, and the functional relationship between the SW values at different buried depths and the heights above the coal gradually changed from a Boltzmann function to a parabolic function.
(5) The failure mode of the super-thick and weakly cemented overburden was ‘beam–arch shell’ failure, and the failure boundary was an arch fracture. The failure mode of thin weakly cemented sandstone was ‘beam’ failure, which finally formed the masonry beam structure. The failure mode of thick weakly cemented sandstone was ‘arch-shell’ failure, and with the continuous expansion of the mining scope, it gradually changed from complete ‘arch-shell’ failure to ‘half-arch-shell’ failure.

Author Contributions

Writing—review and editing, G.Z. and G.G.; formal analysis, W.W.; writing—original draft, J.W. and H.L.; investigation, Q.D. All authors have read and agreed to the published version of the manuscript.

Funding

This research was funded by the National Natural Science Foundation Item (Grant No.: 51974292 and 52204097).

Data Availability Statement

The data supporting reported results can be found by contacting the corresponding author ([email protected]).

Acknowledgments

The authors gratefully acknowledge the staff who works in the lab. They help us transport experimental materials and set up experimental equipment. We also thank the Zhou Chenghu’s team, Shandong Jianzhu University for their guidance in revising the paper. At last, we are grateful to the editors and reviewers who have made a great contribution to the improvement of the article quality.

Conflicts of Interest

The authors declare no conflict of interest.

References

  1. Li, Y.; Xu, W.; Wu, P.; Meng, S. Dissolution versus cementation and its role in determining tight sandstone quality: A case study from the Upper Paleozoic in northeastern Ordos Basin, China. J. Nat. Gas Sci. Eng. 2020, 78, 103324. [Google Scholar] [CrossRef]
  2. Zhao, P.; Fan, X.; Zhang, Q.; Zhang, M.; Yao, B. Effects of hydration on physical properties and rock microstructure of shale oil reservoir in the Triassic Chang 7 Member of Southern Ordos Basin. Energy Sources Part A Recovery Util. Environ. Eff. 2020, 1–19. [Google Scholar] [CrossRef]
  3. Jin, K.; Cheng, Y.; Wang, L.; Dong, J.; Guo, P.; An, F.; Jiang, L. The effect of sedimentary redbeds on coalbed methane occurrence in the Xutuan and Zhaoji Coal Mines, Huaibei Coalfield, China. Int. J. Coal Geol. 2015, 137, 111–123. [Google Scholar] [CrossRef]
  4. Park, N.; Holder, J.; Olson, J. Discrete Element Modeling of Fracture Toughness Tests in Weakly Cemented Sandstone. In Proceedings of the Gulf Rocks 2004, the 6th North America Rock Mechanics Symposium (NARMS), Houston, TX, USA, 5–10 June 2004. [Google Scholar]
  5. Li, H.; Wang, K.; Liu, C. Study on mechanical and acoustic emission characteristics of weakly cementation sandstone in Shendong coal field. J. Min. Saf. Eng. 2018, 35, 843–851. [Google Scholar]
  6. Zhang, Y.; Xu, W.-Y.; Gu, J.-J.; Wang, W. Triaxial creep tests of weak sandstone from fracture zone of high dam foundation. J. Cent. South Univ. 2013, 20, 2528–2536. [Google Scholar] [CrossRef]
  7. Zheng, W.; Guo, Y.; Zhi, G. Stability Analysis and Control Measures of Large-Span Open-Off Cut with Argillaceous Cemented Sandstone Layered Roof. Math. Probl. Eng. 2021, 2021, 8744081. (In Chinese) [Google Scholar] [CrossRef]
  8. Sun, L. Structural Evolution and Rock Pressure Activity Regularity of Weakly Cemented Strata of the Large Mining Height Work Face in Western China. Chin. J. Rock Mech. Eng. 2017, 36, 1820. (In Chinese) [Google Scholar]
  9. Lin, Y. Study on the Surface and Strata Movement Regular of Mining under the Hugely Thick Sand—Illustrated by the Case of Yingpanhao Mine. Master’s Thesis, China University of Mining and Technology, Beijing, China, 2018. (In Chinese). [Google Scholar]
  10. Gao, S. Study on the Development Law and Hydrogeological Effection of the Water Flowing Fractured Zone in the Western Jurassic Strata. Master’s Thesis, China University of Mining and Technology, Beijing, China, 2018. (In Chinese). [Google Scholar]
  11. Zhang, W.; Sun, Y.; Zhang, D.; Zhang, L.; Tang, J.; Fan, G.; Liang, S. Three-dimensional Physical Simulation Test for Activity Laws of Mining-induced Overburden by Radon Detection in Yili Mining area of Xinjiang. J. Min. Saf. Eng. 2019, 36, 1102–1108. (In Chinese) [Google Scholar]
  12. Zhang, G.; Lv, Y.; Guo, G.; Yu, C. Monitoring deep mining similarity material model of super-thick and weak cementation overburden by digital photography. IOP Conf. Ser. Mater. Sci. Eng. 2020, 782, 022028. [Google Scholar] [CrossRef]
  13. Zhang, G.; Guo, G.; Lv, Y.; Gong, Y. Study on the Strata Movement Rule of the Ultrathick and Weak Cementation Overburden in Deep Mining by Similar Material Simulation: A Case Study in China. Math. Probl. Eng. 2020, 2020, 7356740. [Google Scholar] [CrossRef]
  14. Lu, Y.; Wang, C.; Wang, W.; Sun, C.; Zhang, B. Height Prediction of Water Flowing Fractured Zone and Thickness Effect of Long Wall Caving in Thick Loose Seam with Weak Cementation. In Proceedings of the 9th China-Russia Symposium “Coal in the 21st Century: Mining, Intelligent Equipment and Environment Protection” (COAL 2018), Qingdao, China, 18–21 October 2018; Atlantis Press: Paris, France, 2018; pp. 1–8. (In Chinese). [Google Scholar]
  15. Li, Y.; Zhang, S.; Yang, Y.; Chen, H.; Li, Z.; Ma, Q. Study on the water bursting law and spatial distribution of fractures of mining overlying strata in weakly cemented strata in West China. Geomech. Eng. 2022, 28, 613–624. [Google Scholar]
  16. Du, Q.; Guo, G.; Li, H.; Gong, Y. Spatio-Temporal Evolution Law of Surface Subsidence Basin with Insufficient Exploitation of Deep Coal Resources in Aeolian Sand Area of Western China. Remote Sens. 2022, 14, 2536. [Google Scholar] [CrossRef]
  17. Gong, Y.; Guo, G.; Wang, L.; Zhang, G.; Zhang, G.; Fang, Z. Numerical Study on the Surface Movement Regularity of Deep Mining Underlying the Super-Thick and Weak Cementation Overburden: A Case Study in Western China. Sustainability 2022, 14, 1855. [Google Scholar] [CrossRef]
  18. Gong, Y.; Guo, G.; Zhang, G.; Guo, K.; Du, Q.; Wang, L. A Vertical Joint Spacing Calculation Method for UDEC Modeling of Large-Scale Strata and Its Influence on Mining-Induced Surface Subsidence. Sustainability 2021, 13, 13313. [Google Scholar] [CrossRef]
  19. Zhang, G.; Guo, G.; Shen, S.; Guo, Q.; Zhang, S.; Wu, J. Numerical Simulation Study of the Strata Movement Rule of Deep Mining with the Super-Thick and Weak Cementation Overburden: A Case Study in China. Math. Probl. Eng. 2021, 2021, 6806703. [Google Scholar] [CrossRef]
  20. Zhang, G.; Guo, G.; Gong, Y.; Xiao, A.; Zhao, T.; Li, H. Failure Mechanism of Giant-Thick Strata Characterized by Weak Cementation Based on Superimposed Similar Material Simulation. KSCE J. Civ. Eng. 2022, 26, 3355–3369. [Google Scholar] [CrossRef]
Figure 1. Weak cementation sandstone. (a) Zhiluo formation. (b)Zhidan group. (c)Yan’an formation. (d) Shear test.
Minerals 12 01276 g001
Figure 2. Comparative analysis diagram of the strata mechanical parameters. (a) Comparative analysis of the compressive strength. (b) Contrast analysis of the elastic modulus. (c) Cohesion comparative analysis.
Minerals 12 01276 g002aMinerals 12 01276 g002b
Figure 3. Experimental equipment. (a) Scanning electron microscope. (b) Argon ion polisher. (c) Carbon coater. (d) experimental sample.
Minerals 12 01276 g003
Figure 4. Microscopic geometric characteristics of Zhidan group sandstone at different magnification. (a) Particle and pore dimensions. (b) Fracture and pore size. (c) Analysis of attachment composition.
Minerals 12 01276 g004
Figure 5. Oblique transverse bedding of Zhidan group sandstone with different magnification grades.
Minerals 12 01276 g005
Figure 6. Microscopic geometric characteristics of An’ding group sandstone with different magnification grades. (a) Local microstructure features. (b) Particles and pores size-1. (c) Particles and pores size-2. (d) Fracture features. There are three kinds of pores in rock: pores, holes and cracks. Pores and holes are spaces that develop in three dimensions and vary in size. A hole diameter is greater than 2 mm while that of a pore is less than 2 mm. A crack is a gap which develops in two dimensions, and the difference between a crack and a hole is morphological. The ratio of the major and minor axes in a crack is larger than 10, while that of a hole is less than 10.
Minerals 12 01276 g006
Figure 7. Microscopic geometric characteristics of Zhiluo group sandstone with different magnification grades. (a) Pore size and its development characteristics. (b) Local looseness and its development characteristics. (c) Development form of the cements. (d) Fractures and their development locations. (e) Rock mineral element content.
Minerals 12 01276 g007
Figure 8. Microscopic geometric characteristics of Yan’an group sandstone with different magnification grades. (a) Pore size and its development characteristics. (b) Cementation size and its development characteristics. (c) Rock particles and their development characteristics. (d) Fractures and their development locations.
Minerals 12 01276 g008
Figure 9. Preliminary preparation experiment for the mineral analysis of rock samples. (a) Discrete rock. (b) Crusher. (c) Filter screen. (d) Electronic scale. (e) X-ray diffraction (AXiOX MAX).
Minerals 12 01276 g009
Figure 10. Energy spectrum analysis of rock particles in An’ding group sandstone. (a) Rock particles. (b) Energy spectrum.
Minerals 12 01276 g010
Figure 11. Energy spectrum analysis of cement in An’ding group sandstone. (a) Cementation. (b) Energy spectrum.
Minerals 12 01276 g011
Figure 12. Energy spectrum analysis of compact cement in Zhidan group sandstone. (a) Cementation. (b) Energy spectrum.
Minerals 12 01276 g012
Figure 13. Energy spectrum analysis of loose cement in Zhidan group sandstone. (a) Cementation. (b) Energy spectrum.
Minerals 12 01276 g013
Figure 14. Energy spectrum analysis of rock particles in Zhidan group sandstone. (a) Rock particles. (b) Energy spectrum.
Minerals 12 01276 g014
Figure 15. Energy spectrum analysis of rock particles in Zhiluo group sandstone. (a) Rock particles. (b) Energy spectrum.
Minerals 12 01276 g015
Figure 16. Energy spectrum analysis of cement in Zhiluo group sandstone. (a) Cementation. (b) Energy spectrum.
Minerals 12 01276 g016
Figure 17. Energy spectrum analysis of light rock particles in Yan’an group sandstone. (a) Rock particles. (b) Energy spectrum.
Minerals 12 01276 g017
Figure 18. Energy spectrum analysis of dark rock particles in Yan’an group sandstone. (a) Rock particles. (b) Energy spectrum.
Minerals 12 01276 g018
Figure 19. Hydrolysis experiments of An’ding group sandstone. (a) Before the hydrolysis. (b) Hydrolysis in progress. (c) After the hydrolysis.
Minerals 12 01276 g019
Figure 20. Hydrolysis experiments of Zhidan group sandstone. (a) Before hydrolysis. (b) During hydrolysis. (c) After hydrolysis.
Minerals 12 01276 g020
Figure 21. Hydrolysis experiments on Zhiluo group sandstone. (a) Before hydrolysis. (b) During hydrolysis. (c) After hydrolysis.
Minerals 12 01276 g021
Figure 22. Hydrolysis experiments of Yan’an group sandstone. (a) Before the hydrolysis. (b) Hydrolysis in progress. (c) After the hydrolysis.
Minerals 12 01276 g022
Figure 23. Failure characteristics of the overburden in mining single working face.
Minerals 12 01276 g023
Figure 24. Evolution rule of the overburden displacement field when the working face 2201 was mined.
Minerals 12 01276 g024
Figure 25. Evolution rule of the overburden displacement field when the working face 2202 was mined.
Minerals 12 01276 g025
Figure 26. Evolution rule of the overburden displacement field when the working face 2203 was mined.
Minerals 12 01276 g026
Figure 27. Evolution rule of the overburden displacement field when the working face 2204 was mined.
Minerals 12 01276 g027
Figure 28. Stress concentration phenomenon in coal pillar. (a) Pillar 1 fractured and pressed into the floor. (b) Pillar 2 fractured the floor. (c) Pillar 3 fractured the floor.
Minerals 12 01276 g028
Figure 29. Surface movement and deformation rule. (a) Surface subsidence curve. (b) Relation between width-depth ratio and q.
Minerals 12 01276 g029
Figure 30. Evolution rule of maximum surface subsidence in different mining degree. (a) 300 m of working face 2201 in width. (b) 300 m of working face 2202 in width. (c) 300 m of working face 2203 in width. (d) 300 m of working face 2204 in width.
Minerals 12 01276 g030
Figure 31. Evolution rule of surface subsidence boundary in different mining degree. (a) 300 m of working face 2201 in width. (b) 300 m of working face 2202 in width. (c) 300 m of working face 2203 in width. (d) 300 m of working face 2204 in width.
Minerals 12 01276 g031
Figure 32. Evolution rule of rock surrounding stress field. (a) Evolution law of immediate roof stress field. (b) Evolution law of coal pillar vertical stress.
Minerals 12 01276 g032
Figure 33. Evolution rule of pressure arch in the overburden when multi working faces were mined. (a) 180 m of working face 2201 in width. (b) 240 m of working face 2201 in width. (c) 300 m of working face 2201 in width. (d) 120 m of working face 2202 in width. (e) 180 m of working face 2202 in width. (f) 240 m of working face 2202 in width. (g) 300 m of working face 2202 in width. (h) 120 m of working face 2203 in width. (i) 300 m of working face 2203 in width. (j) 120 m of working face 2204 in width. (k) 180 m of working face 2204 in width. (l) 300 m of working face 2204 in width.
Minerals 12 01276 g033aMinerals 12 01276 g033b
Figure 34. Evolution rule of pressure arch in the overburden when the working faces was advancing. (a) 960 m along the advancing direction. (b) 1200 m along the advancing direction.
Minerals 12 01276 g034
Figure 35. Block production and compression test [13,20].
Minerals 12 01276 g035
Figure 36. Failure mode of super-thick weak cementation overburdens. (ae) show the failure mode of super-thick weak cementation overburdens when the working face 2202 was 60 m, 120 m, 180 m, 240 m and 300 m in width, respectively. (g) The overburden failure characteristics caused by mining working face 2201–2202. (f) and (h) are the pressure arch and half pressure arch model [13,20].
Minerals 12 01276 g036
Table 1. Physical mechanical parameters of Zhidan group sandstone.
HoleLithologyR/MpaE/Mpa ϑ C/Mpa φ ρ (g/cm3)
Hole 1coarse sandstone14.201835.750.342.1926 2.36
medium sandstone10.101338.440.302.0226 2.23
fine sandstone12.301748.470.282.4327 2.26
silt sandstone12.201573.430.302.5727 2.22
Hole 2coarse sandstone11.963173.110.312.2125 2.18
medium sandstone15.001950.140.312.1626 2.09
fine sandstone11.671639.940.301.3125 2.18
silt sandstone10.42777.770.321.4528 1.93
Hole 3coarse sandstone16.362692.510.293.6622 2.23
medium sandstone15.112159.670.302.3125 2.26
fine sandstone14.331523.210.311.7623 2.22
Average coarse sandstone14.172567.120.312.6925 2.26
medium sandstone13.401816.080.302.1626 2.19
fine sandstone12.771637.200.301.8325 2.22
silt sandstone11.311175.600.312.0128 2.08
Table 2. Quantitative analysis table of total rock X-ray diffraction.
RockMineral Content (%)
QuartzPotash FeldsparPlagioclaseCalciteDolomiteHematiteTCCM
Anding formation sandstone26.37.221.1004.341.3
Zhidan group sandstone54.111.518.45.12.408.5
Zhiluo formation sandstone35.013.818.400032.8
Yan’an formation sandstone17.36.617.1042.9016.3
Note: TCCM is total amount of clay minerals.
Table 3. Partial parameters of the numerical simulation model [20].
ParametersCoalZhiluo
Formation
Sandstone
Anding-Zhiluo Formation
Sandstone
Anding
Formation
Sandstone
Zhidan
Group
Sandstone
Loose
γ/(KN/m3)1.21 × 1012.42 × 1012.38 × 1012.27 × 1012.12 × 1011.98 × 101
K/(Pa)1.35 × 1098.28 × 1098.72 × 1098.50 × 1095.34 × 1097.92 × 108
G/(Pa)5.87 × 1086.17 × 1096.36 × 1096.23 × 1094.04 × 1094.12 × 108
Friction/(°)62.70 × 1012.80 × 1012.60 × 1012.70 × 1012.00 × 101
Cohesion/(Pa)8.89 × 1066.99 × 1067.39 × 1065.23 × 1062.28 × 1066.50 × 105
Tension/(Pa)1.35 × 1063.26 × 1063.39 × 1063.03 × 1061.42 × 1065.55 × 105
Jkn/(Pa)1.05 × 10114.98 × 1095.42 × 1095.20 × 1092.04 × 1096.62 × 108
Jks/(Pa)5.57 × 10114.87 × 1093.74 × 1094.93 × 1097.40 × 1082.82 × 108
Jcohesion/(Pa)8.59 × 1066.99 × 1067.39 × 1065.23 × 1062.28 × 1066.50 × 105
Jfriction/(°)62.70 × 1012.80 × 1012.60 × 1012.70 × 1012.00 × 101
Jtension/(Pa)1.05 × 1063.96 × 1063.39 × 1063.03 × 1061.42 × 1065.55 × 105
Table 4. Partial parameters of the numerical simulation model.
Boundary conditionsSet gravity 0–9.81
Bound x-velocity = 0 range x −0.1,0.1
Bound x-velocity = 0 range x 2999.9,3000.1
Bound y-velocity = 0 range y −0.1,0.1
SizeBlock 0,0 0,763 3000,763 3000,0
OthersRound = 0.1, Edge = 24
Table 5. Statistical table of surface movement parameters.
Mining ProcessMining Width/mMining Depth/mWidth-Depth RatioSubsidence/mmq
Working face 2201-180 m1807250.251390.05
Working face 2201-240 m2407250.332420.08
Working face 2201-300 m3007250.414070.12
Working face 2202-120 m4407250.617610.18
Working face 2202-180 m5007250.6910100.23
Working face 2202-240 m5607250.7713700.29
Working face 2202-300 m6207250.8619100.38
Working face 2203-120 m7607251.0530000.55
Working face 2203-180 m8207251.1338200.67
Working face 2203-240 m8807251.2143500.74
Working face 2203-300 m9407251.3047500.79
Working face 2204-120 m10807251.4950500.84
Working face 2204-180 m11407251.5751800.86
Working face 2204-240 m12007251.6653500.89
Working face 2204-300 m12607251.7454500.91
Table 6. Maximum subsidence values of the overburden in different depths (Wmax).
Height above the Coal/mSubsidence Value of the Overlying Strata at Different Buried Depths/mm
Working Face 2201-300 mWorking Face 2202-300 mWorking Face 2203-300 mWorking Face 2204-300 m
35880589060006060
335820584060206160
435800582060206170
665390576059206120
186682264053405790
236625239051805670
276587230051605660
312562222051305660
612440203050305520
725407191047505450
Table 7. Distance between the subsidence boundary and the goaf boundary of the overburden in different depths (Sw).
Height above the Coal/mDistance of the Subsidence Influence Boundary to Goaf Boundary/m
Working Face 2201-300 mWorking Face 2202-300 mWorking Face 2203-300 mWorking Face 2204-300 m
3340370340340
33400410370370
43410410380370
66430420380380
186450430390380
236470430380380
276470440380380
312480450390390
612550470410410
725600520420420
Table 8. Stress of coal pillar and immediate roof/MPa.
Mining OrderWidth
Depth Ratio
Immediate Roof of
Working Face 2201
Pillar 1Immediate Roof of
Working Face 2202
Pillar 2Immediate Roof of
Working Face 2203
Pillar 3
Working face 2201-180 m0.25no19.90 no16.50 no15.40
Working face 2201-240 m0.33no25.20 no17.10 no15.40
Working face 2201-300 m0.41no28.60 no18.10 no15.40
Working face 2202-120 m0.617.56 37.90 no22.50 no15.90
Working face 2202-180 m0.699.63 45.30 no27.50 no16.60
Working face 2202-240 m0.778.52 50.50 no34.00 no17.60
Working face 2202-300 m0.867.41 67.80 no42.50 no19.20
Working face 2203-120 m1.056.71 38.10 4.08 39.40 no25.70
Working face 2203-180 m1.136.57 4.90 7.81 39.90 no33.10
Working face 2203-240 m1.216.99 5.74 16.70 46.90 no42.90
Working face 2203-300 m1.308.91 6.10 27.70 50.80 no30.30
Working face 2204-120 m1.4910.30 7.01 34.70 53.60 12.90 33.40
Working face 2204-180 m1.5710.60 101.00 37.60 58.00 17.30 52.60
Working face 2204-240 m1.6610.90 102.00 40.70 61.10 20.20 58.20
Working face 2204-300 m1.7410.80 103.00 43.30 62.20 26.60 64.00
Table 9. Proportion of the similar simulated material [13].
StrataProportion
(Sand:Micas:Cement)
Cement
(Gypsum:CaCO3)
Saw DustWater
Coarse sandstone80:17:33:7010%
Sandy mudstone 480:18:25:5010%
Anding formation sandstone 473:23:43:7010%
Anding-zhiluo formation sandstone80:18:25:5010%
Zhiluo formation sandstone80:18:25:5010%
Sandy mudstone 373:23:43:7010%
Medium sandstone 180:18:27:3010%
Sandy mudstone 280:17:35:5010%
Coal80:17:33:7010%
Sandy mudstone 173:23:45:5010%
Publisher’s Note: MDPI stays neutral with regard to jurisdictional claims in published maps and institutional affiliations.

