Article

The Volcanic-Rich Layer of the “Camporotondo (Marche, Italy)” Section: Petrography and Sedimentation of an Unknown Distal Messinian Eruption

1
Dipartimento di Ingegneria & Geologia, Università G. d’Annunzio, Via dei Vestini 30, 66100 Chieti, Italy
2
Osservatorio Vesuviano, Istituto Nazionale di Geofisica e Vulcanologia, 80124 Naples, Italy
3
Scuola di Scienze e Tecnologia, Università degli Studi di Camerino, 62032 Camerino, Italy
4
Istituto Nazionale di Geofisica e Vulcanologia, Via di Vigna Murata 605, 00143 Roma, Italy
*
Author to whom correspondence should be addressed.
Minerals 2022, 12(7), 893; https://doi.org/10.3390/min12070893
Submission received: 25 May 2022 / Revised: 2 July 2022 / Accepted: 14 July 2022 / Published: 16 July 2022
(This article belongs to the Section Mineral Geochemistry and Geochronology)

Abstract

:
A Messinian and lithified horizon enriched in volcanic particles with thicknesses of 170–180 cm crops in the Camporotondo (CR) section (Marche, Italy). This volcanic-rich layer (VRL) was investigated by field plus mesoscopic observations, X-ray powder diffraction (XRPD), scanning electron microscopy (SEM), bulk composition methods and electron-microprobe analysis (EMPA). The quantitative textural features of volcanic and sedimentary components were determined by 2D image analysis. The lowermost massive 70–80 cm portion is free of sedimentary structure or characterised only by plane-parallel ones, whereas the uppermost one is undulated and cross-laminated. The XRPD and SEM outcomes unveil that the VRL of CR is mainly composed of glassy shards (≥80 area%), a variable amount of sedimentary minerals (<20 area%) and a very low content of magmatic minerals (few area%). The bulk and micro-chemical attributes of volcanic and glassy materials are rhyolitic and almost identical to previous VRLs dated at 5.5 Ma (VRL-5.5). The signatures of immobile elements and the high amount of H2O present in the glass fraction suggest a provenance from a convergent geodynamic setting. The 2D image analysis on SEM observations show that the VRL-5.5 of CR is composed of very fine and sorted (averages of MZ of 5,72 and σi of 0,70), scarcely vesicular, glass shards, with similar long and short size dimensions, shape and roundness. The VRL-5.5 of CR is free of large minerals and fossils. The coupling of mesoscopic and microscopic determinations indicates that the lowermost interval was deposited such as a primary tephra, i.e., fallout pyroclasts sinking in seawater. Instead, the uppermost interval derives from local, low-energy and sin-depositional remobilisation of the same VRL-5.5. The textural attributes of the volcanic fractions, the sedimentological features and the thickness of the VRL at CR correspond to the westward deposit of a still unknown eruption likely occurred at 5.5 Ma.

1. Introduction

Pyroclastic fall and flow materials are deposited in an instantaneous geological time and are thus useful for chronostratigraphy; the airfall deposits from high magnitude eruptions are the most suitable geological markers since they cover regional to continental areas [1,2,3]. In distal areas, such tephra fallout deposits are generally loose, sorted and tiny (<2 mm) [4,5]. Conversely, pyroclastic flows tend to form un-sorted thick deposits (ignimbrites) up to distances ranging from few to tens of km from the vent [6,7,8,9,10]. Tephras, i.e., loose pyroclastic materials of any origin [9,11,12] and lithified tephras labelled here volcanic-rich layers (VRL), can be the unique witnesses of dismantled volcanoes, erased by tectonic or erosive processes [9,13,14,15,16,17,18,19]. Finally, there are cryptotephras, i.e., sedimentary levels hosting volcanic materials [9,20].
Pyroclastic horizons can be either primary and secondary, if remobilized or altered after a first depositional process [1,6,20,21,22,23,24]. Thereby, both fall and flow deposits after their original sedimentation can remain undisturbed (primary tephra), or be subject to gravity or flow remobilization or may be affected by chemical alteration processes by exogenous sedimentary mechanisms, i.e., secondary tephras [25,26,27,28,29,30,31,32,33,34,35]. Under subaerial conditions these deposits are easily eroded, whereas in submarine settings they are frequently buried and preserved [8,16,36,37,38].
Commonly, a tephra is primary if it preserves its original thickness and structure after deposition [39,40] and is also characterized by an internal stratigraphy and sharp contacts at the top and at the bottom with the encasing sediments; however, some primary deposits are massive, unstratified and isotropic. A primary tephra can be also incomplete if partially eroded. Secondary deposits may have greater thicknesses than their primary equivalents at the same distance from the vent [39]. All these characteristics are really and straightforward useful when a direct comparison of the deposit from proximal to distal areas is observable, otherwise it is not an easy task to understand if a tephra or volcanic rich layer is primary or not [20,27,37]. Furthermore, the remobilization process can leave traces such as: (i) changes in grain size distribution (GSD), (ii) change in grains shape, (iii) load-, flux and/or gravity-driven sedimentary structures, (iv) soft-sediment deformation and (v) presence of bioturbation and fossils [27,28,29,30,38,41,42,43]. Finally, the terms pyroclastic and epiclastic (or volcanoclastic) are commonly used to refer those materials deposited directly after magma fragmentation and after weathering, erosion and/or secondary deposition, respectively [10,42,44,45].
To shed new light on these volcanic and sedimentary processes, as well as on its petrological features, here we focus on a VRL located in the Marche region (Italy) (Figure 1). The Camporotondo outcrop hosts this VRL, within the same stratigraphic interval of other VRLs exposed in the eastern side (Adriatic part) of the Apennines, along the NNW-SSE direction [46,47,48,49,50,51,52,53,54,55,56,57]. All the other VRL-hosting sites are Messinian, specifically they represent the post-evaporitic interval pev1 unit [58,59] and are dated at ca. 5.5 Ma [48,49,52,54,57]. The other VRL-5.5 were recently interpreted to be a turbiditic deposit originated from a unique primary pyroclastic deposit [48,56], alternatively similar to a primary fallout in seawater [45]; both origins have been also proposed as a function of location [53,54].
The VRL-bearing section of CR (Figure 1, Table S1) has been here extensively characterised by field and mesoscopic rock observations, bulk chemical composition, X-ray powder diffraction (XRPD), transmission optical microscopy (TOM), scanning electron microscopy (SEM) and micro-chemical characterisation by electron probe micro-analysis (EPMA). The outcomes attained here provide new insights on the origin and deposition of the VRL of CR and in parallel proposes an analytical protocol to characterise lithified and ancient tephras worldwide.

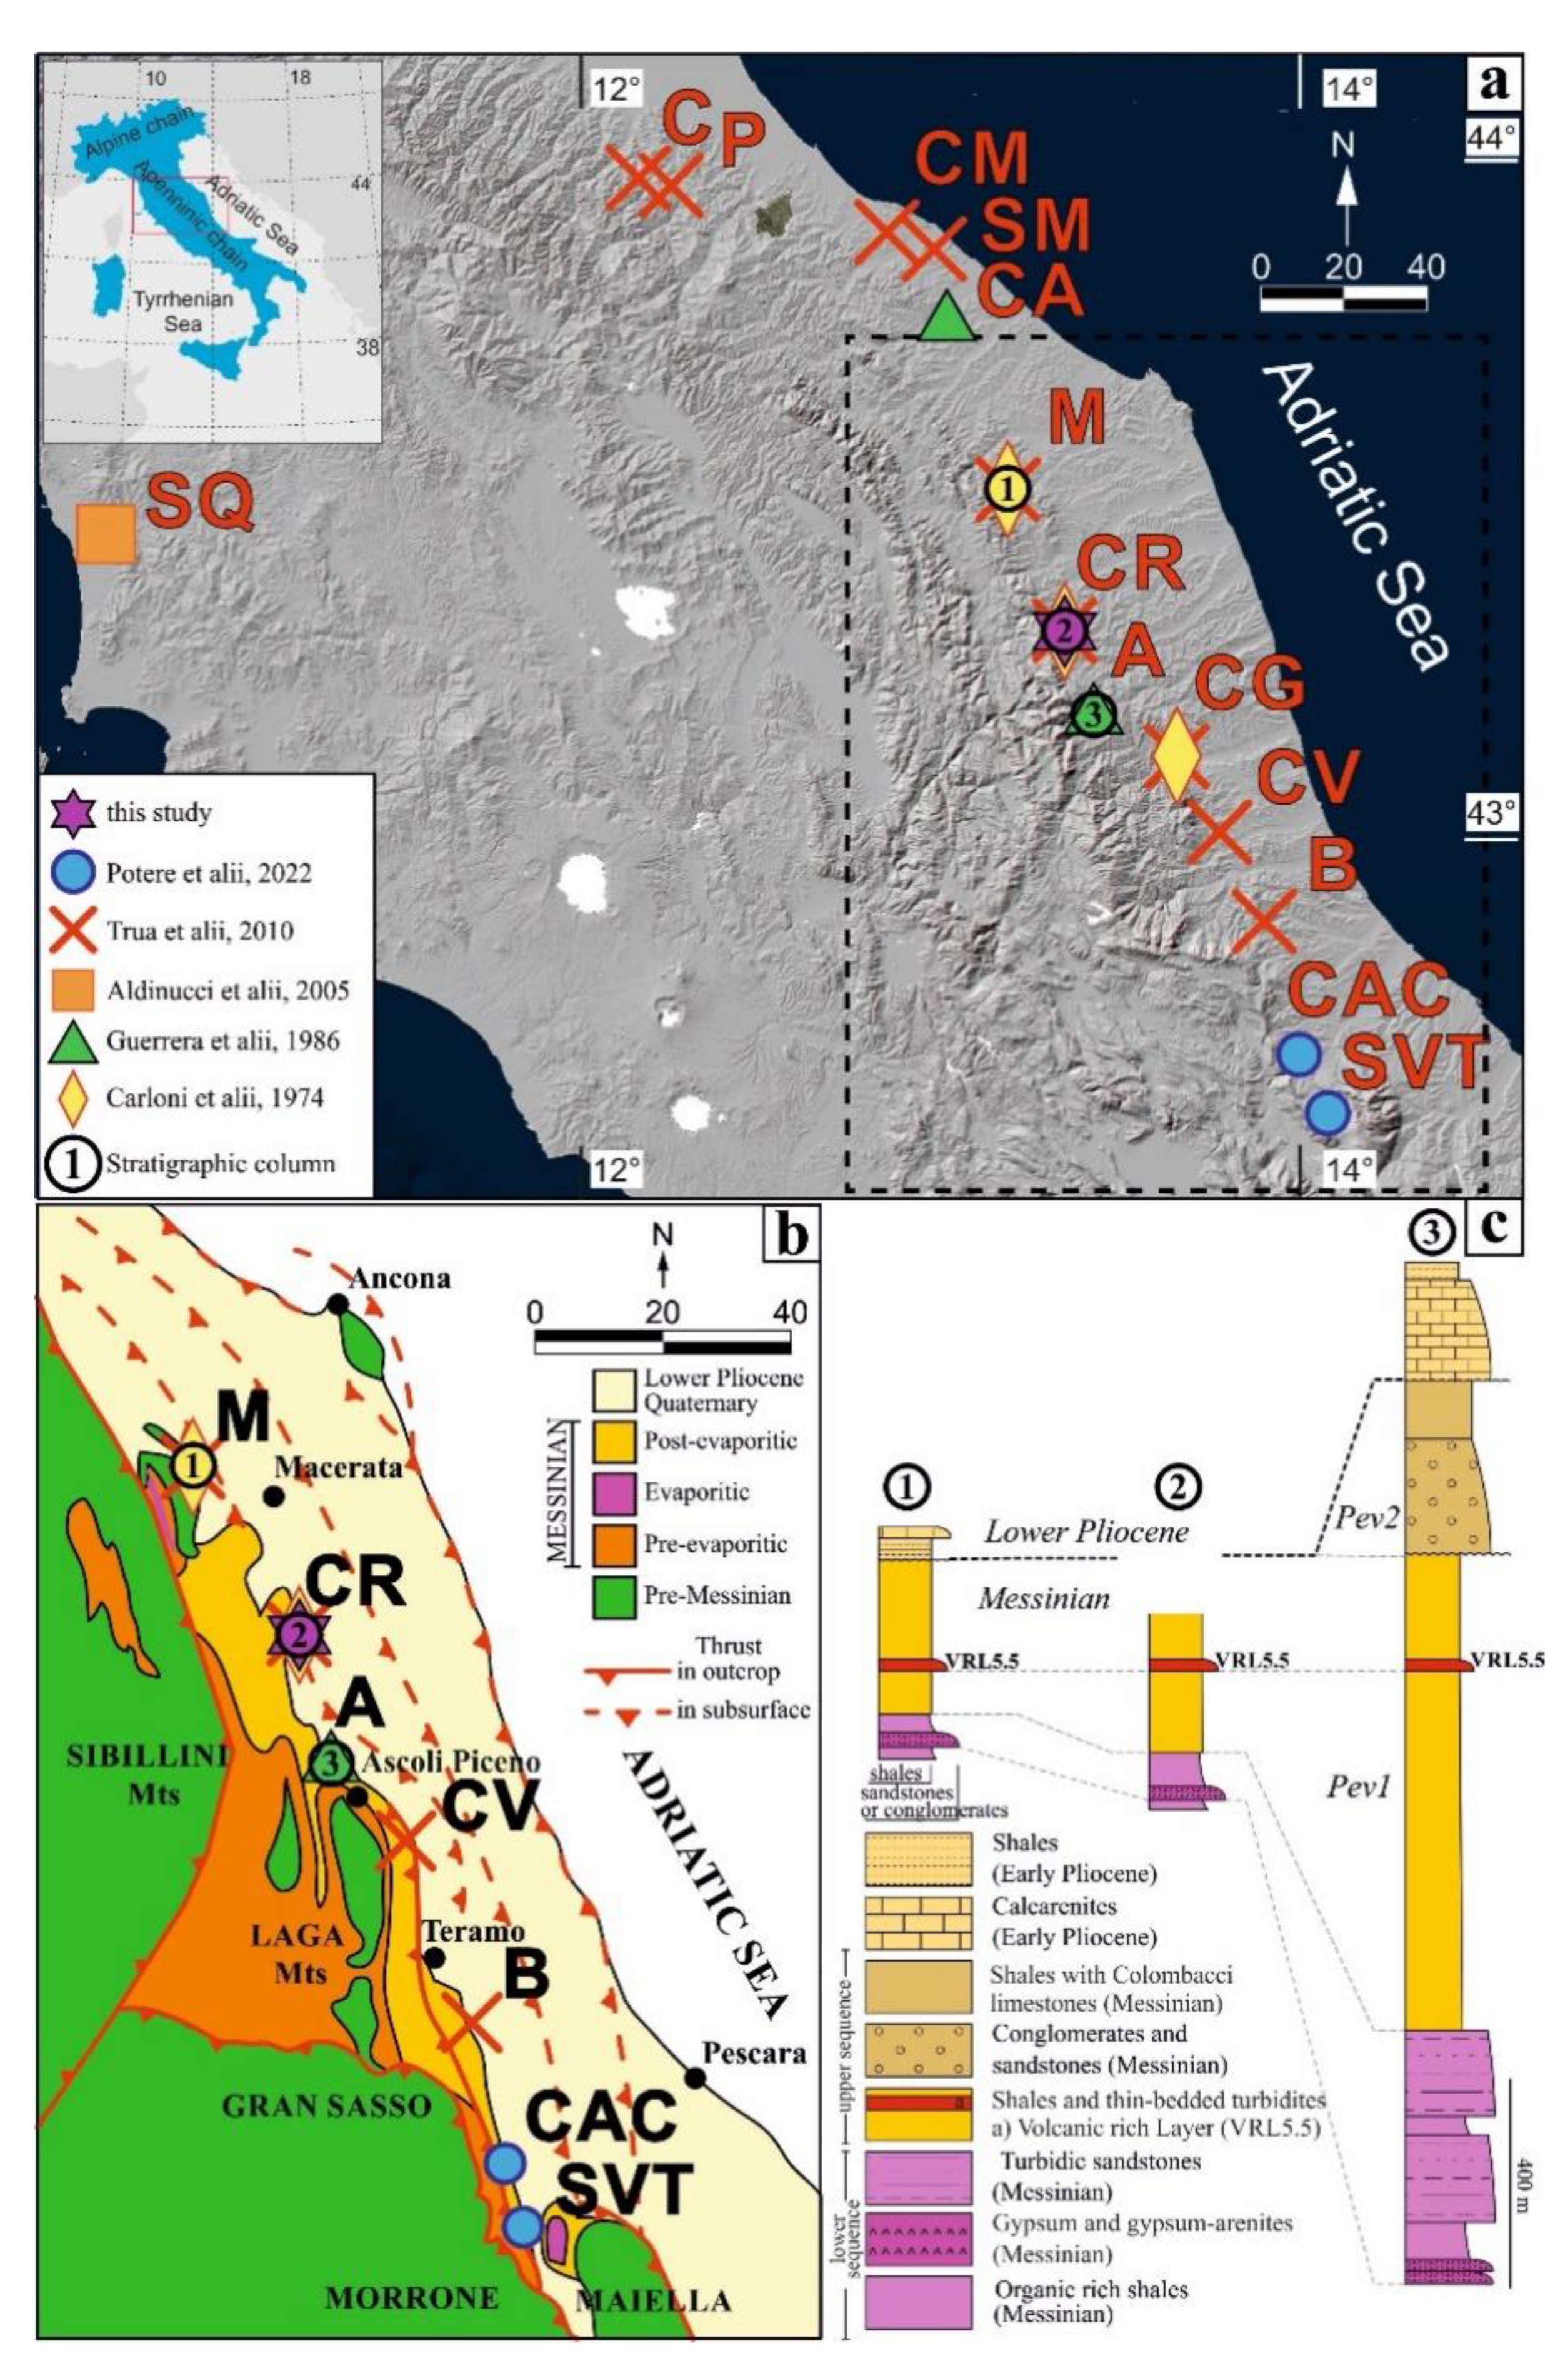
2. Geological Setting and Sampling

The study area is located in the eastern sector of the central Apennines fold-and-thrust belt (Figure 1a,b); this area developed ahead of the growing Apennines and was infilled by siliciclastic turbidites sourced from the north [31,60]. The analysed area is placed in the northern apex of the triangular-shaped foredeep basin (Figure 1), where the general thickness of the Messinian turbiditic succession is reduced with respect to the southern foredeep depocenter (about 400 m vs. up to 3000 m) (Figure 1b) [61,62,63,64]. The marine Messinian deposits are deep-water siliciclastic turbidites intercalated by gypsum and gypsum arenites [64]. Moving from the bottom, the Messinian section comprises: (i) few hundred meters of evaporitic deposits and organic-rich shales, (ii) a main interval of turbiditic sandstones and shales and (iii) a brackish shale with limestone levels and locally conglomerates and sandstones (Colombacci Fm. [65]). This post-evaporitic succession shows longitudinal (i.e., down-current) thickness variations ranging from ca. 300 m in the north (Maccarone and Camporotondo sections in Figure 1b,c) to ca. 1300 m in the south (Force section in Figure 1b,c). The differences in thickness and facies have been related to the paleo-physiography of this foredeep basin and its tectonics (Fiastrone-Fiastrella line [65,66]).
The VRL horizon is intercalated in the post-evaporitic turbiditic interval (peV1 [67,68]) and extensively crops-out in the western limb of an NNW-SSE striking syncline with beds gently dipping (10–20°) to ENE. The layer is sandwiched in a prevalently shaly sequence (100–200 m thick), intercalated in the intermediate portion of the turbiditic post-evaporitic succession (Camporotondo section in Figure 1c). The analysed outcrop coincides with a N-S trending cliff, about 200 m long and 80 m high, located close to the Camporotondo village. The exposed succession is made up prevalently of shales with sporadic very thin bedded sandstones and with the VRL sited in the upper part of the section. The layer, even if locally affected by tectonics, is well preserved and continuous (Figure 2 and Figure S1), with a thickness of about 170–180 cm. At the base of the VRL, the contact with the underlaying shales is sharp whereas at the top the boundary is more gradual and less pronounced, also due to the weathered exposure (Figure 2 and Figure S1). At the field scale, it is composed by at least five mesoscopically differentiable beds from which 15 macroscopic (i.e., about 10 cm × 10 cm × 5–10 cm) oriented samples have been extracted (Figure S1). Eight of these ones were subsequently half cut in laboratory along planes parallel to the N-S trending field outcrop (Figure 2) and finely polished also producing thin sections (Figure 3).

3. Analytical Methods

XRPD. The 15 CR samples were first analysed by X-ray powder diffraction, in order to recognize the presence of both, amorphous and crystalline phases [69,70]. After a first sample preparation in Chieti, analyses were conducted at the Istituto Nazionale di Geofisica e Vulcanologia in Naples (Osservatorio Vesuviano) after a first sample preparation in Chieti. About 100 g per sample was first comminuted with an electric grinder to produce a homogeneous coarse powder with grains of hundreds of µm. A homogeneous portion of about 20/30 mg per powder was milled by hand in an agate mortar for a few minutes under acetone, to obtain a homogeneous powder with particle sizes of few µm. Each fine powder was gently mounted in a cylindrical hole made of a low-background sample holder of oriented Si wafer, avoiding as much as possible preferential orientation of crystallites. The Si sample-holder highlights the presence of non-crystalline phases [71,72].
The XRPD patterns were collected with an X’PERT PRO PANalitycal diffractometer with a Bragg-Brentano parafocusing geometry, equipped with Cu anticathode (CuKα = 1.5406 Å) and a detector of the latest generation X ‘PIXEL. The stripping of the Kβ radiation was obtained by a pyrolytic graphite monochromator and a Ni filter. All XRPD spectra were recorded between 4° and 83° of 2θ, with a scan speed of 0.04°/s with a step of 0.01°. The obtained XRPD patterns were analysed with the software X’Pert Data collector®. The measured Bragg reflections were assigned to the crystalline standards that better reproduce the position and intensity of them.
Bulk chemical composition. Based on the XRPD results and BS-SEM evidence, three representatives and richest in the amorphous phase (the poorest in crystalline phases samples) were chosen to determine their bulk chemical composition. All analyses were performed in the Activation Laboratories LTD (Ontario, Canada), following the analytical protocols code 4B1 total Digestion ICP, code 4F-CaCO3 IR, code 4F-FeO titration, code 4F-H2O+− gravimetric and code 4LITHO packages (for a more detailed description of all these analysis package with a description of the instrumentation and protocols used visit the ACTLABS web-site: https://actlabs.com/geochemistry/lithogeochemistry-and-whole-rock-analysis/lithogeochemistry/ (accessed on 30 May 2022) and https://actlabs.com/geochemistry/lithogeochemistry-and-whole-rock-analysis/carbon-and-sulphur/ (accessed on 30 May 2022) [73,74]. The aim of these analyses was the quantification of the number of major oxides, principal volatile species (H2O, CO2 and S), the Fe2+/Fe3+ ratio and the LOI (amount of material loss on ignition).
SEM and EPMA. The selected eight samples of the CR section mounted in thin sections (Figure 3) were used to acquire a total of 120 digital micro-photographs, 15 per sample, using a JSM6500F from JEOL Field Emission Gun-SEM (installed at the Istituto Nazionale di Geofisica e Vulcanologia of Rome), equipped with an EDS detector. The operating parameters were electric voltage of 15 kV, a current of 1 nA, a working distance of 10 mm for each sample were acquired three series (up, centre and down along the Z-axis of the outcrop) of images at successive magnifications of the same area, from 100 to 1600× (Figure 3) in back scattered mode (BS-SEM). The same eight thin sections were used for microchemical determinations still in Rome, using a Jeol-JXA8200 EPMA, equipped with both EDS and five WDS. The operating parameters were electric voltage of 15 kV, a current of 10 nA, a working distance of 11 mm and a defocused electron beam with a diameter of 5 to 10 µm [2,32,75,76]. Per each section, a minimum of 10 points for glass shards plus 10 per mineral were acquired.
Image analysis. The Image-Pro Plus 6.0 software was used to perform image analysis on a total of 24 BS-SEM microphotographs (3 per sample) at different magnifications: 100× to determine the abundance of crystals, glass and carbonates, while the 200× was preferred to quantify textural attributes. Each BS-SEM image was processed as follow: (i) conversion into 8-bit format with 256 shades of grey, (ii) enhancing of image to better emphasize the contours of the phases and (iii) segmentation [2,32,69,75,77]. As shown in Figure S4, the glasses, carbonates and crystals were separated by segmentation as a function of their characteristic grey tones. When necessary, several phases were identified by manual separation. Finally, all the textural attributes of any single phase were measured automatically [78]. Per each phase, i.e., glass or mineral particle, its equal-area ellipsis was measured to determine major and minor axes, their aspect ratio, the angle of the major axis with respect to the horizontal and its area. Equal-area ellipses with major and minor axis < 10 and <5 µm, respectively, were excluded. In addition, also the roundness of glassy particles was quantified:
perimeter2/(4 × π × area)
A roundness of 1 corresponds to a perfect circular object, while an increment of it indicates objects with more irregular contours [33,79]. The size distribution was calculated from 2D textural data [69,73,74]. The grain-size was converted to phi-scale as,
Φ = −log2D
where D is the major axis in mm of the equal-area ellipse. Such measurements were used to construct grain-size parameters [69]:
Mz = (Φ16 + Φ50 + Φ84)/3
σi = [(Φ84Φ16)/4] + [(Φ95Φ5)/6.6]
SKi = {(Φ84 + Φ16 − 2Φ50)/[2(Φ84Φ16)]} + {(Φ95 + Φ5 − 2Φ50)/[2(Φ95Φ5)]}
KG = (Φ95Φ5)/[2.44(Φ75Φ25)]
in all the calculations the abundance of particles with a certain Φ is in area%; for instance, the Φ50 denotes the size of the major axis representing the 50 area% in the particle distribution [69,80].

4. Results

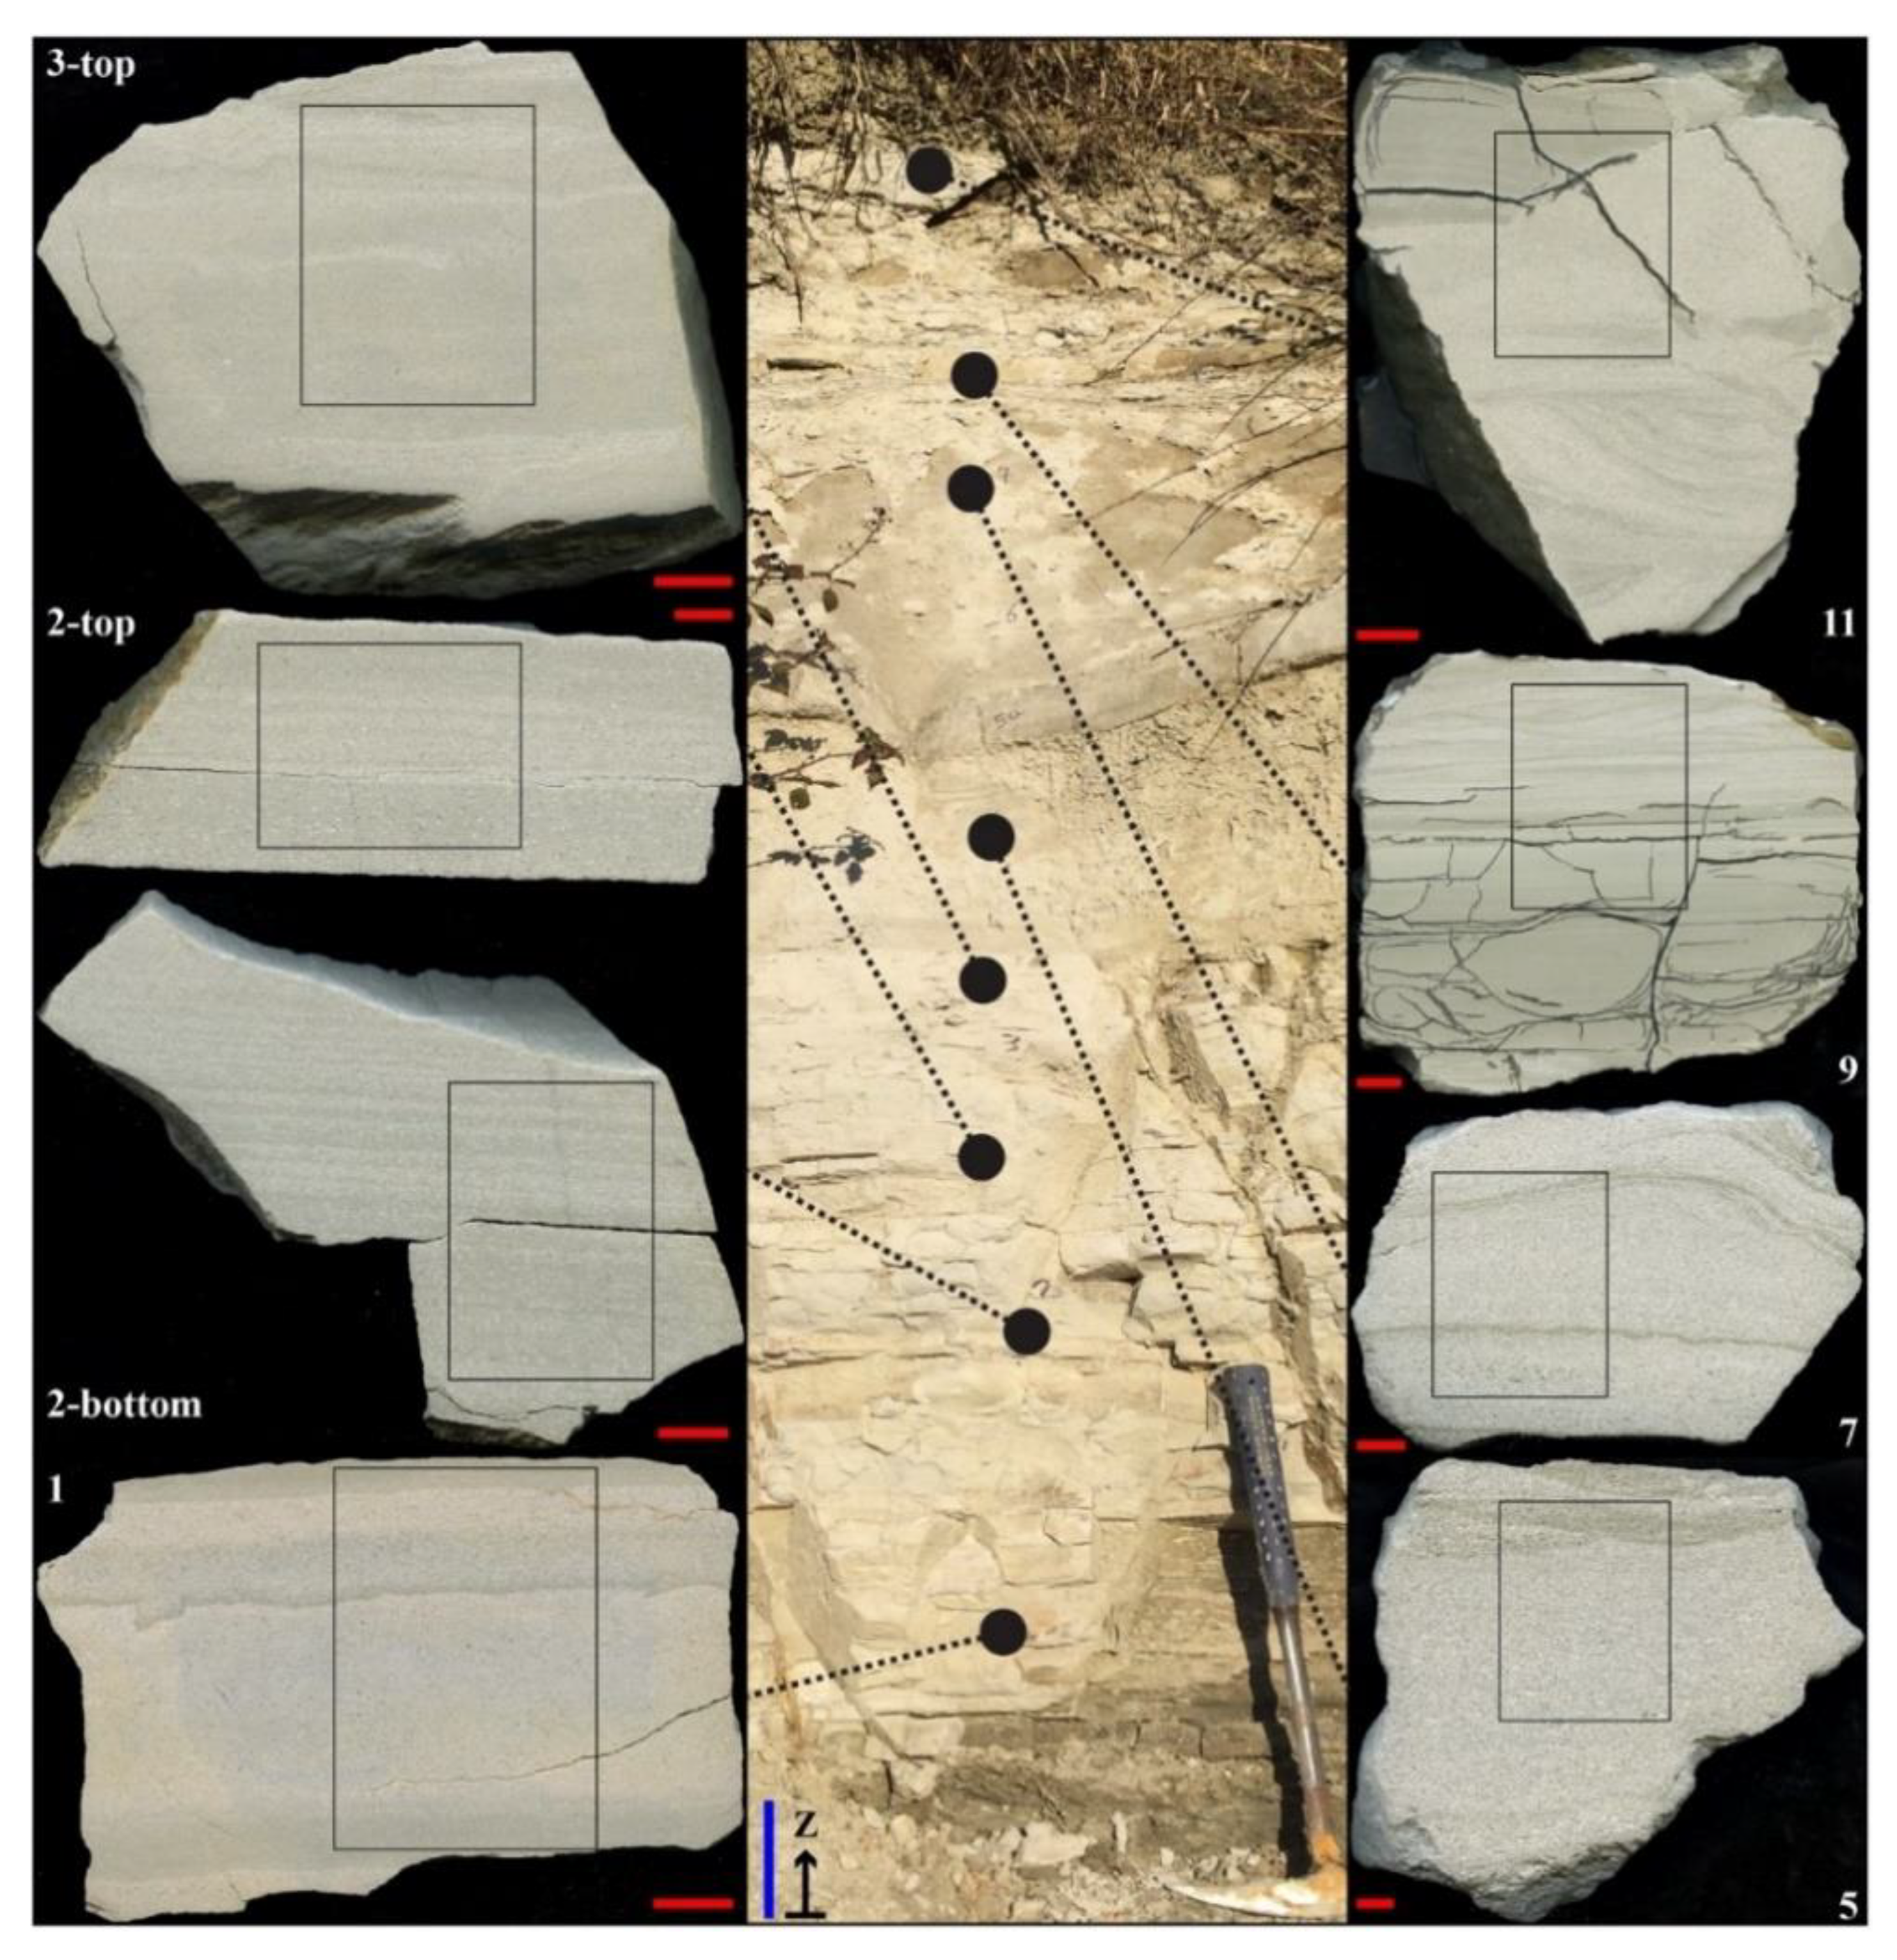
4.1. Field and Mesoscopic Stratigraphy

In the field, the outcrop of CR laterally extends for several tens of meters with only centimetric variation of its thickness, which remains invariably lesser than two meters (Figure S1). The mesoscopic and oriented specimens highlight the following types of sedimentary facies: (i) unlayered or massive (almost structure-free), (ii) plane-parallel layered, (iii) undulated-parallel or cross-laminated layered, (iv) complex, i.e., with the coexistence of the various types listed above (Figure 2. Complex type shows also intersections between the various layers, cross layering and load structures [34].
Moving from the bottom, the VRL-5.5 horizon lies on shales through a sharp contact (Figure S1). The combined investigations of field and meso scopic polished surfaces allow for the recognition of three intervals into the VRL of CR. The CR-1, CR-2-bottom and CR-2-top are homogeneous and massive, free of gradation and show local regular plane-parallel laminations (type i and ii), with colour bands, sub-horizontal stylolitic pressure-solution structures, rare load and flames-pillows structures (Figure 2). At the top of the following CR-3-top sample the first appearance of parallel wavy structures (type iii) has been observed (Figure 2). The entire basal succession, corresponding to the first pseudo-layer, shows a total thickness of about 80–90 cm from CR-1 to CR-3-top (Figure 2 and Figure S1). The following CR-5 sample largely shows a general massive unlayered aspect (type i) with a cross-lamination at the top, thus resulting in the complex type (type iii and iv); this constitutes the second sub-horizon of about 20 cm in thickness, and appears homogeneous and macroscopically coarser grained with respect to the underlying beds (Figure 2 and Figure S1). The CR5 differs in a wave-like appearance with respect the underlying planar CR-1 to CR-3-top interval. The transition between the CR-1, CR-3 and CR5 is also marked by presence of structures in the CR-3-top and by an increasing grains size (Figure 2 and Figure 3).
The successive third sub-horizon (including CR-7, CR-9 and CR-11 samples) has a whole thickness of about 80 cm, again displaying first a coarse plane parallel lamination (type ii in CR-7), then a thin lamination (type ii in CR-9) and finally a cross-lamination (type iv in CR-11) (Figure 2 and Figure S1). The uppermost interval in CR-11 contains several internal minor horizons of mostly plane-parallel laminations (type ii) alternated with thin curved and cross-bedding structures (type iii and iv), with also curved erosional trough bounding surfaces filled by sets (0.5–1 cm thick) of foreset laminae that commonly have a tangential relationship to the base of the set bounding surfaces (Figure 2). Cross-laminations are truncated at the top and are overlain by near plane parallel bed sets. In the upper part of this interval (CR-7, CR-9 and CR-11) soft sediment deformations are visible; moreover, upward squeezing of ash particles are also present (CR-9 and CR-11) (Figure 2). The VRL horizon ends up with a clayey soil through a sharp contact (Figure S1).

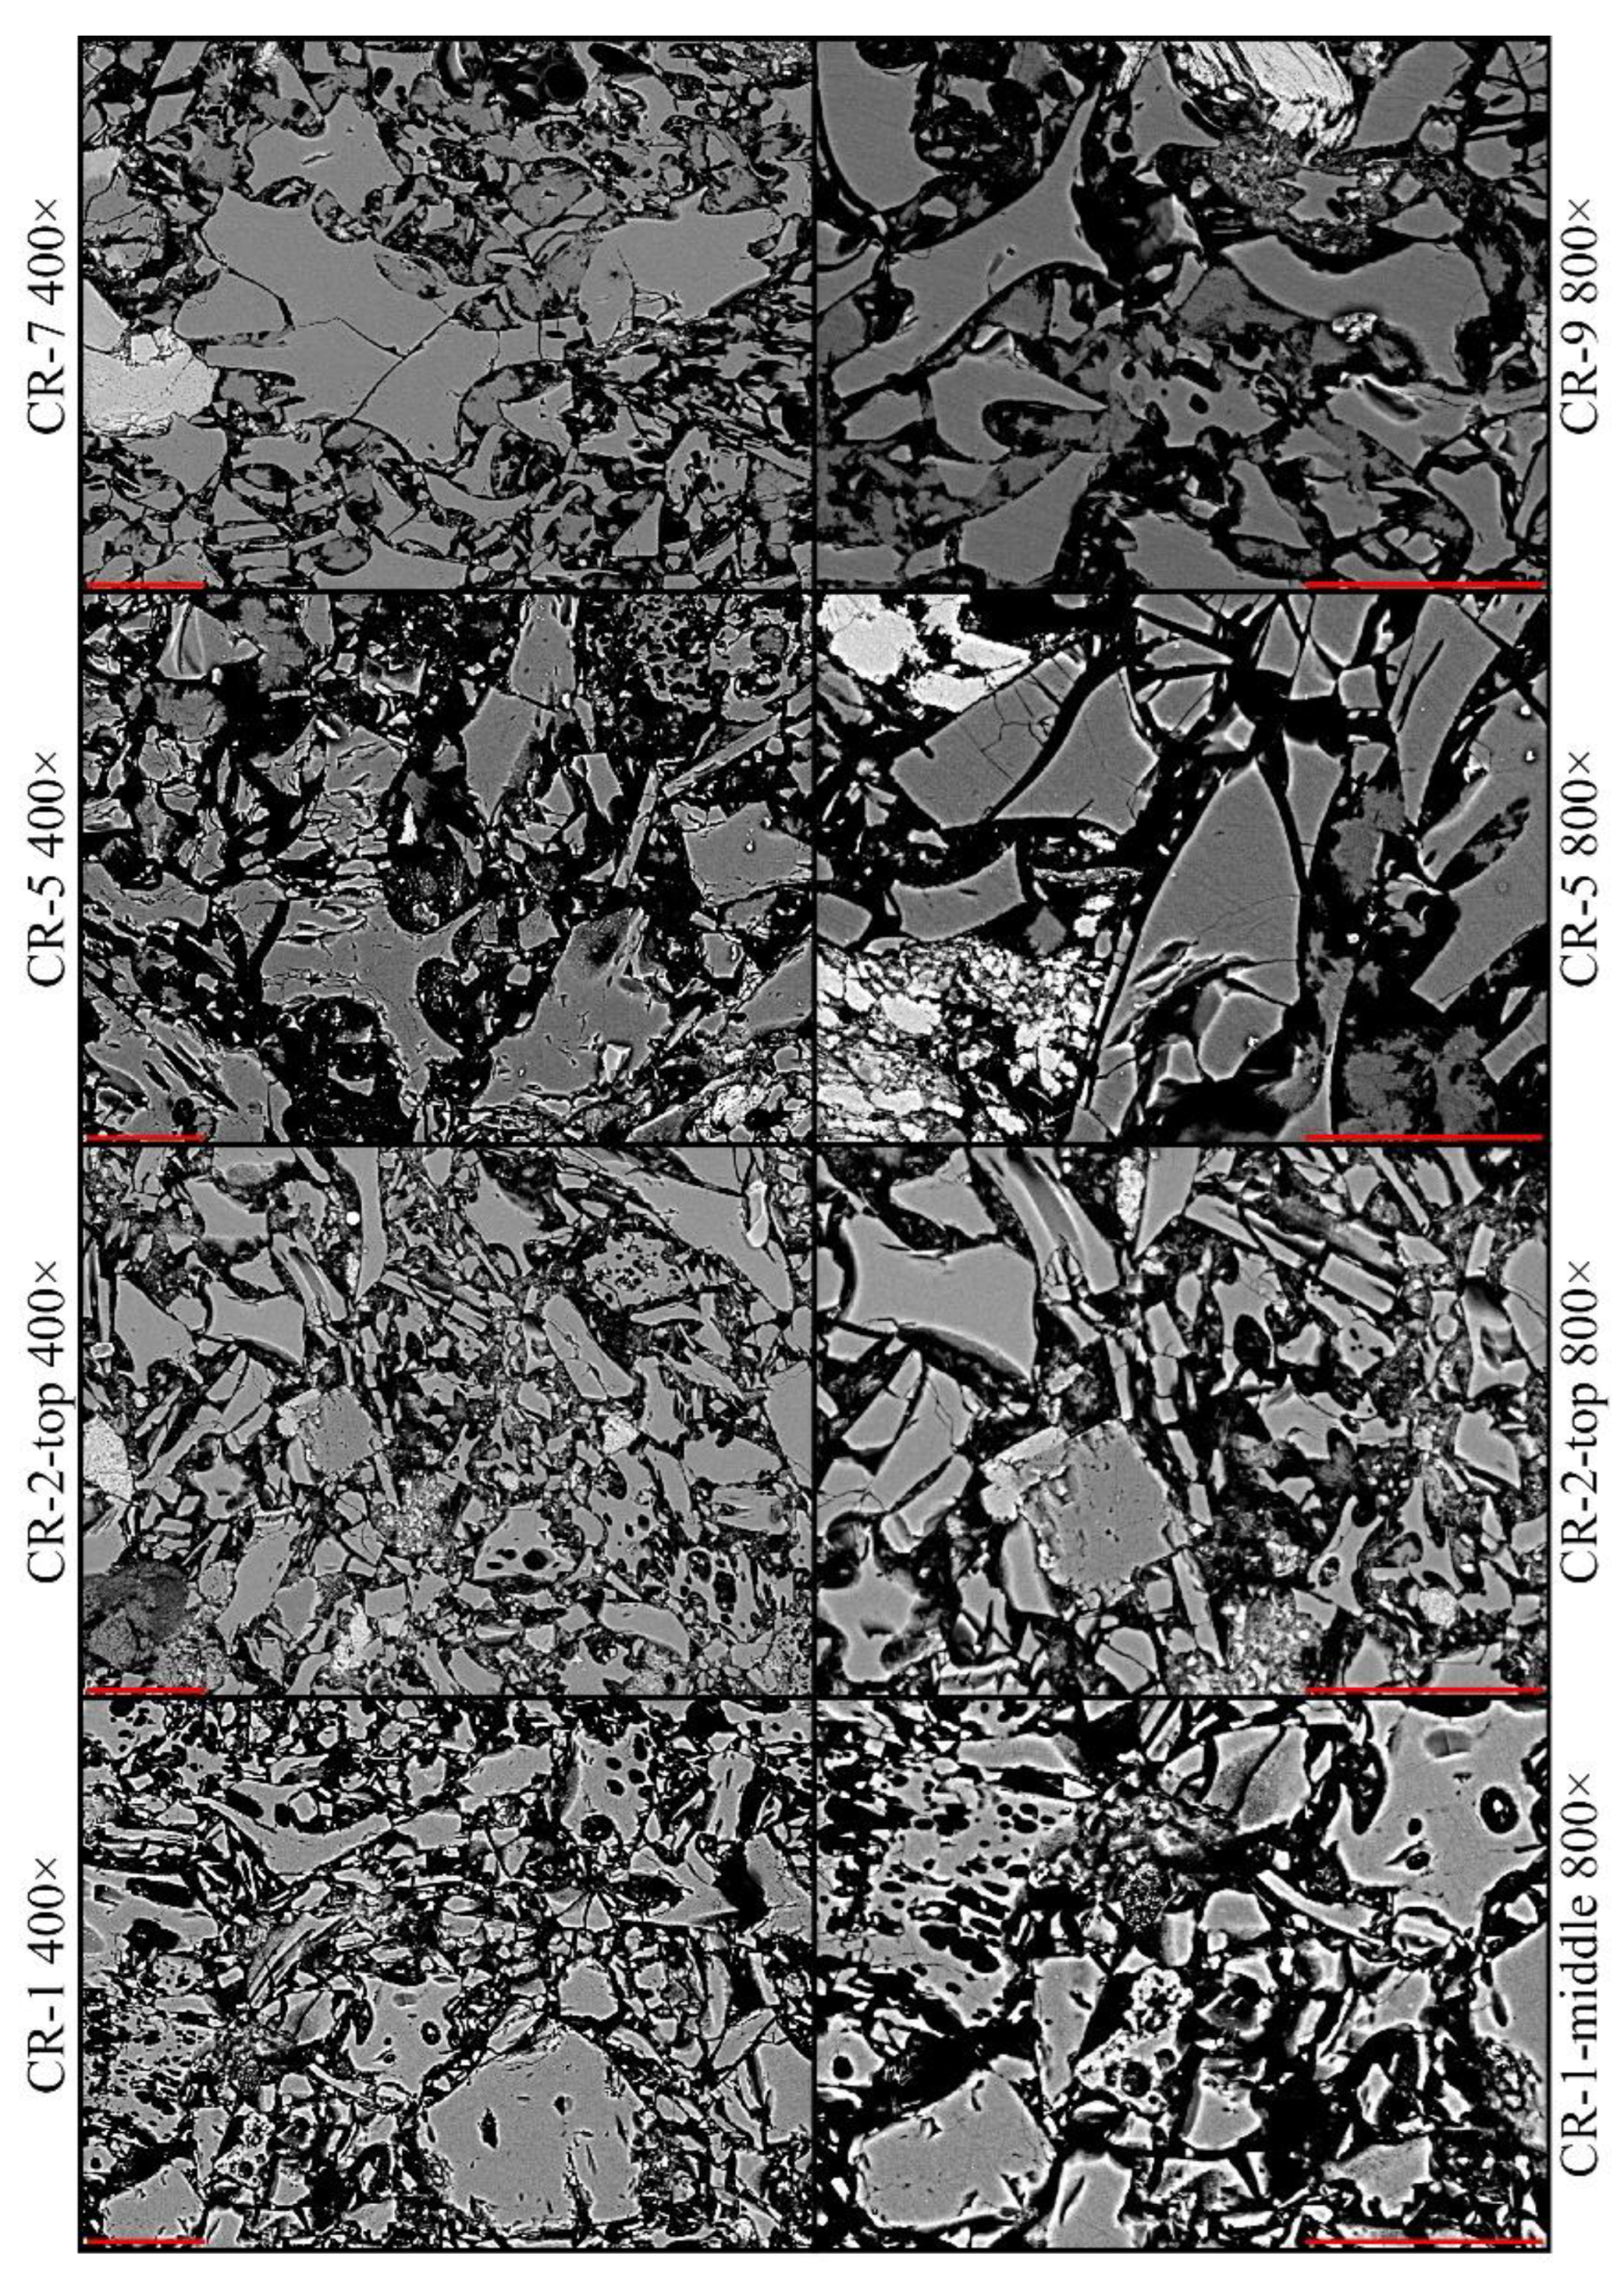
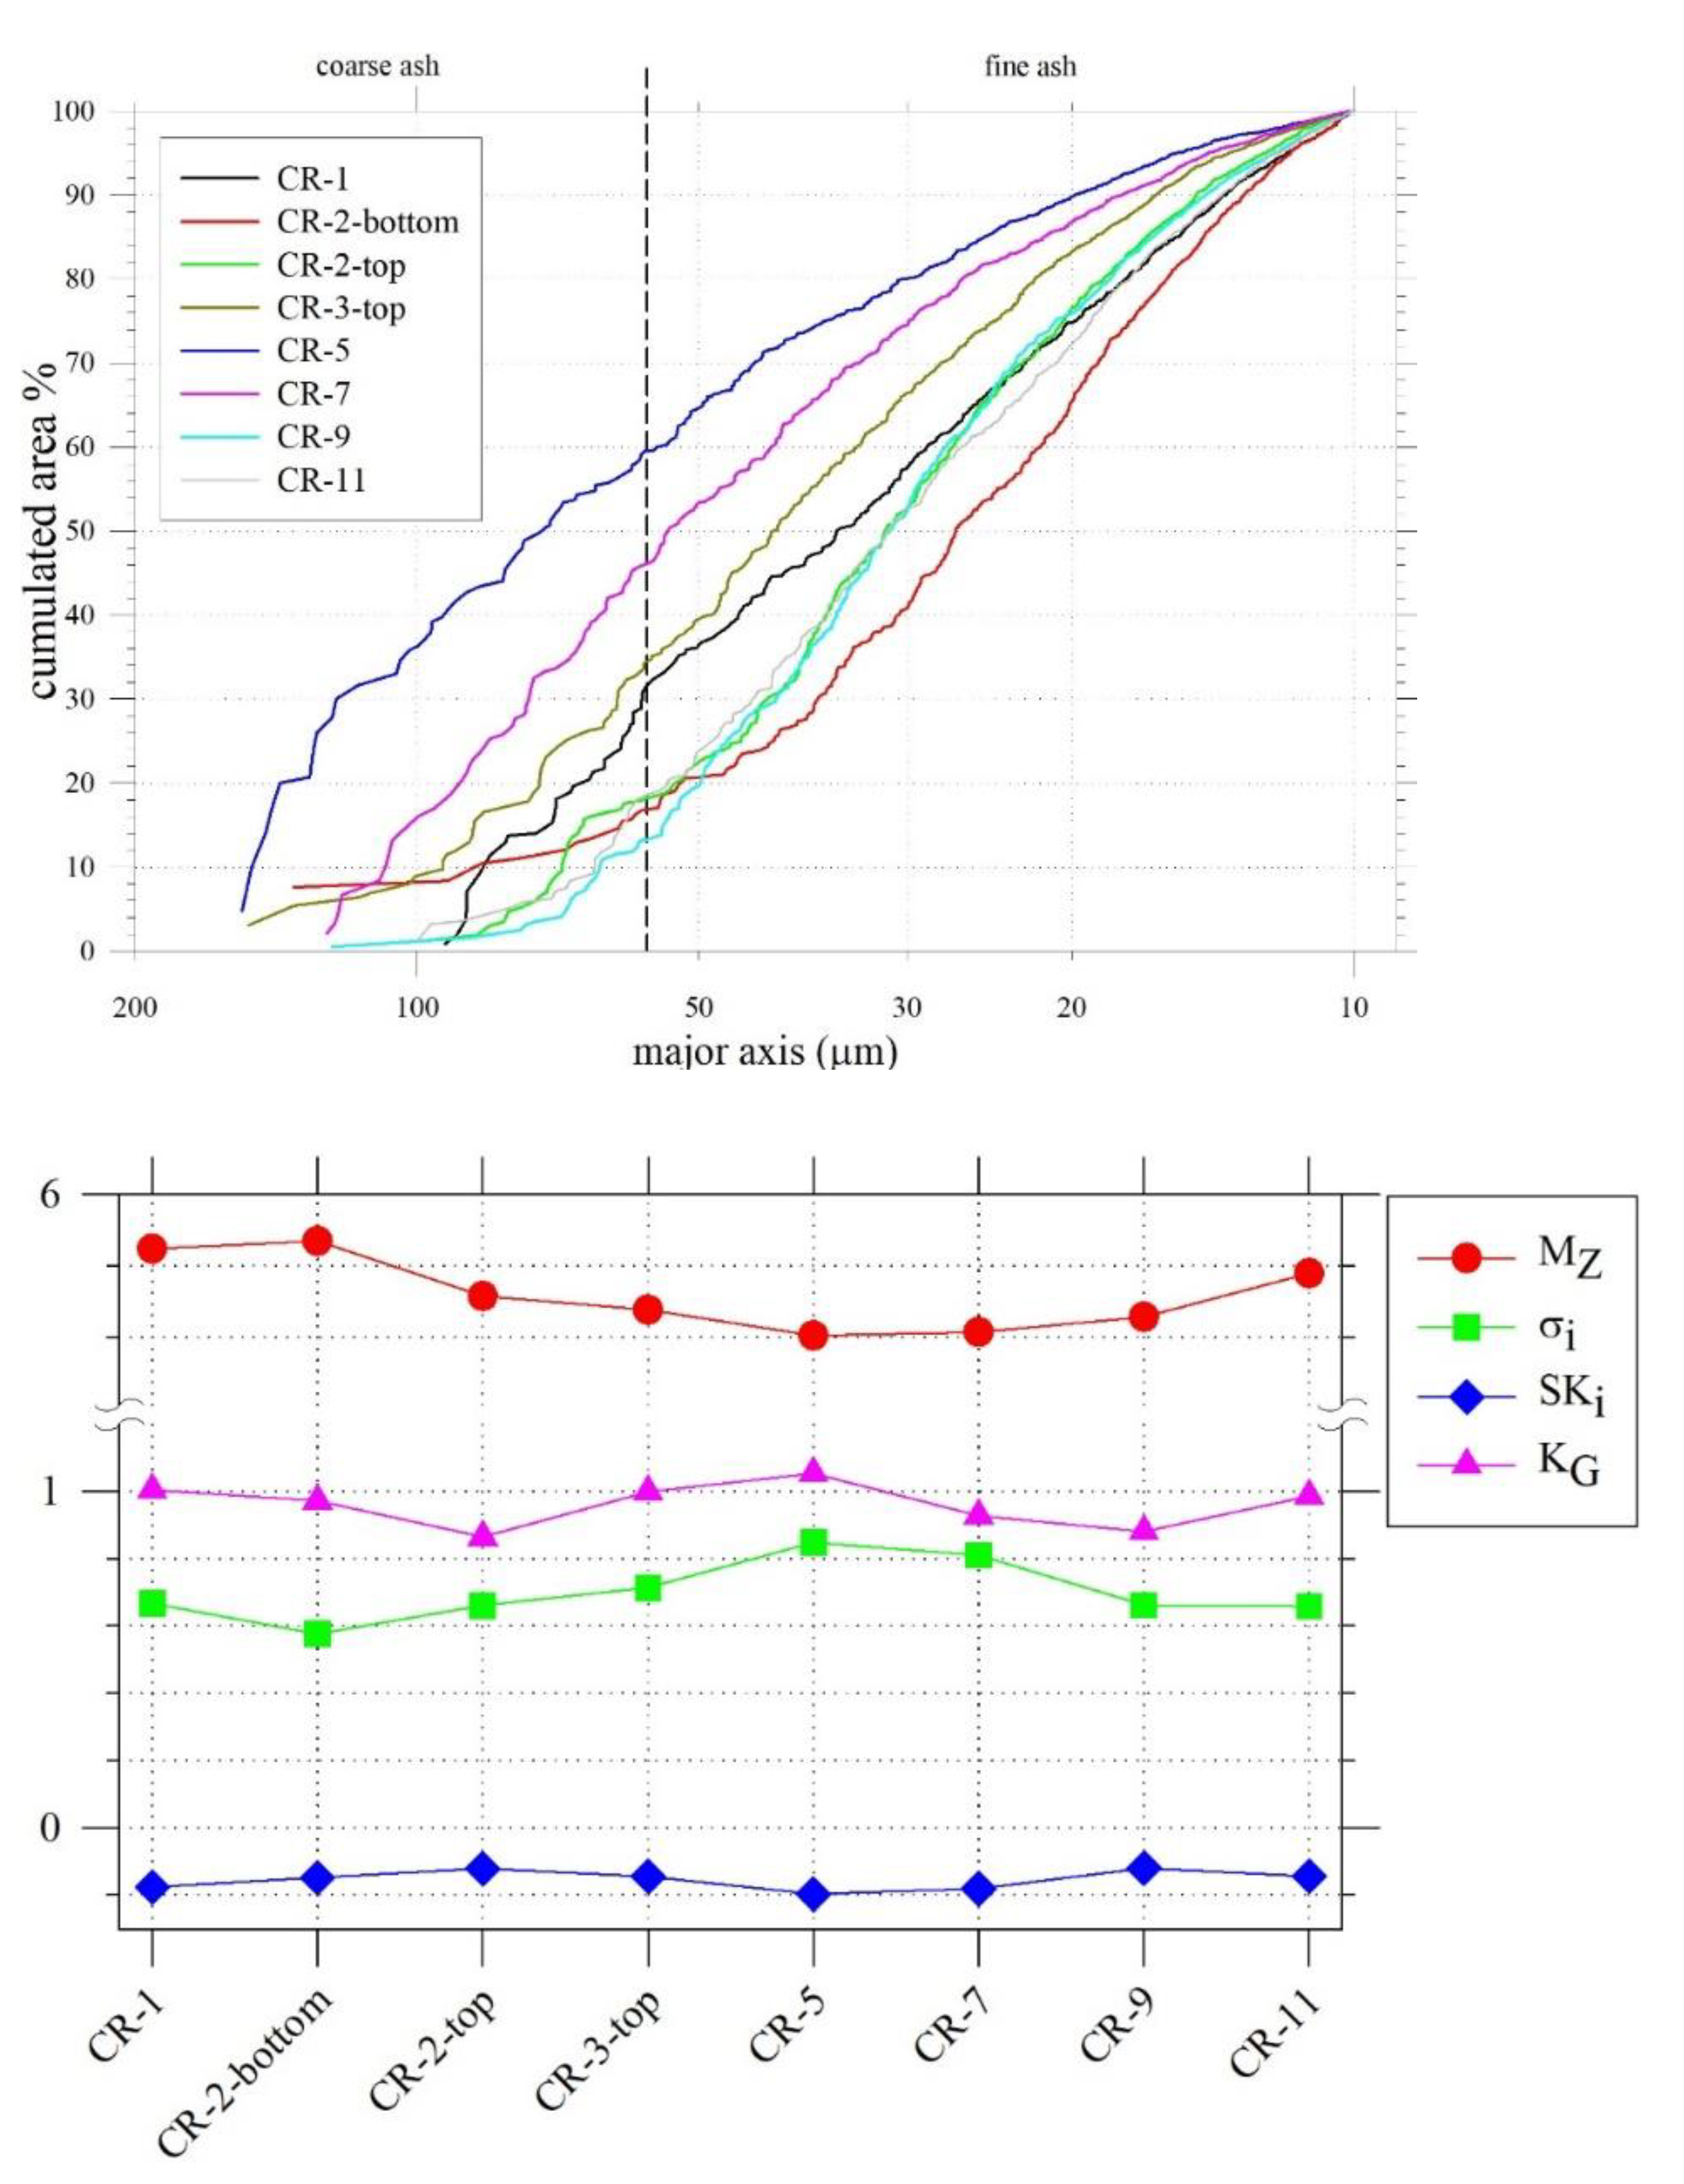
4.2. Microscopic Features
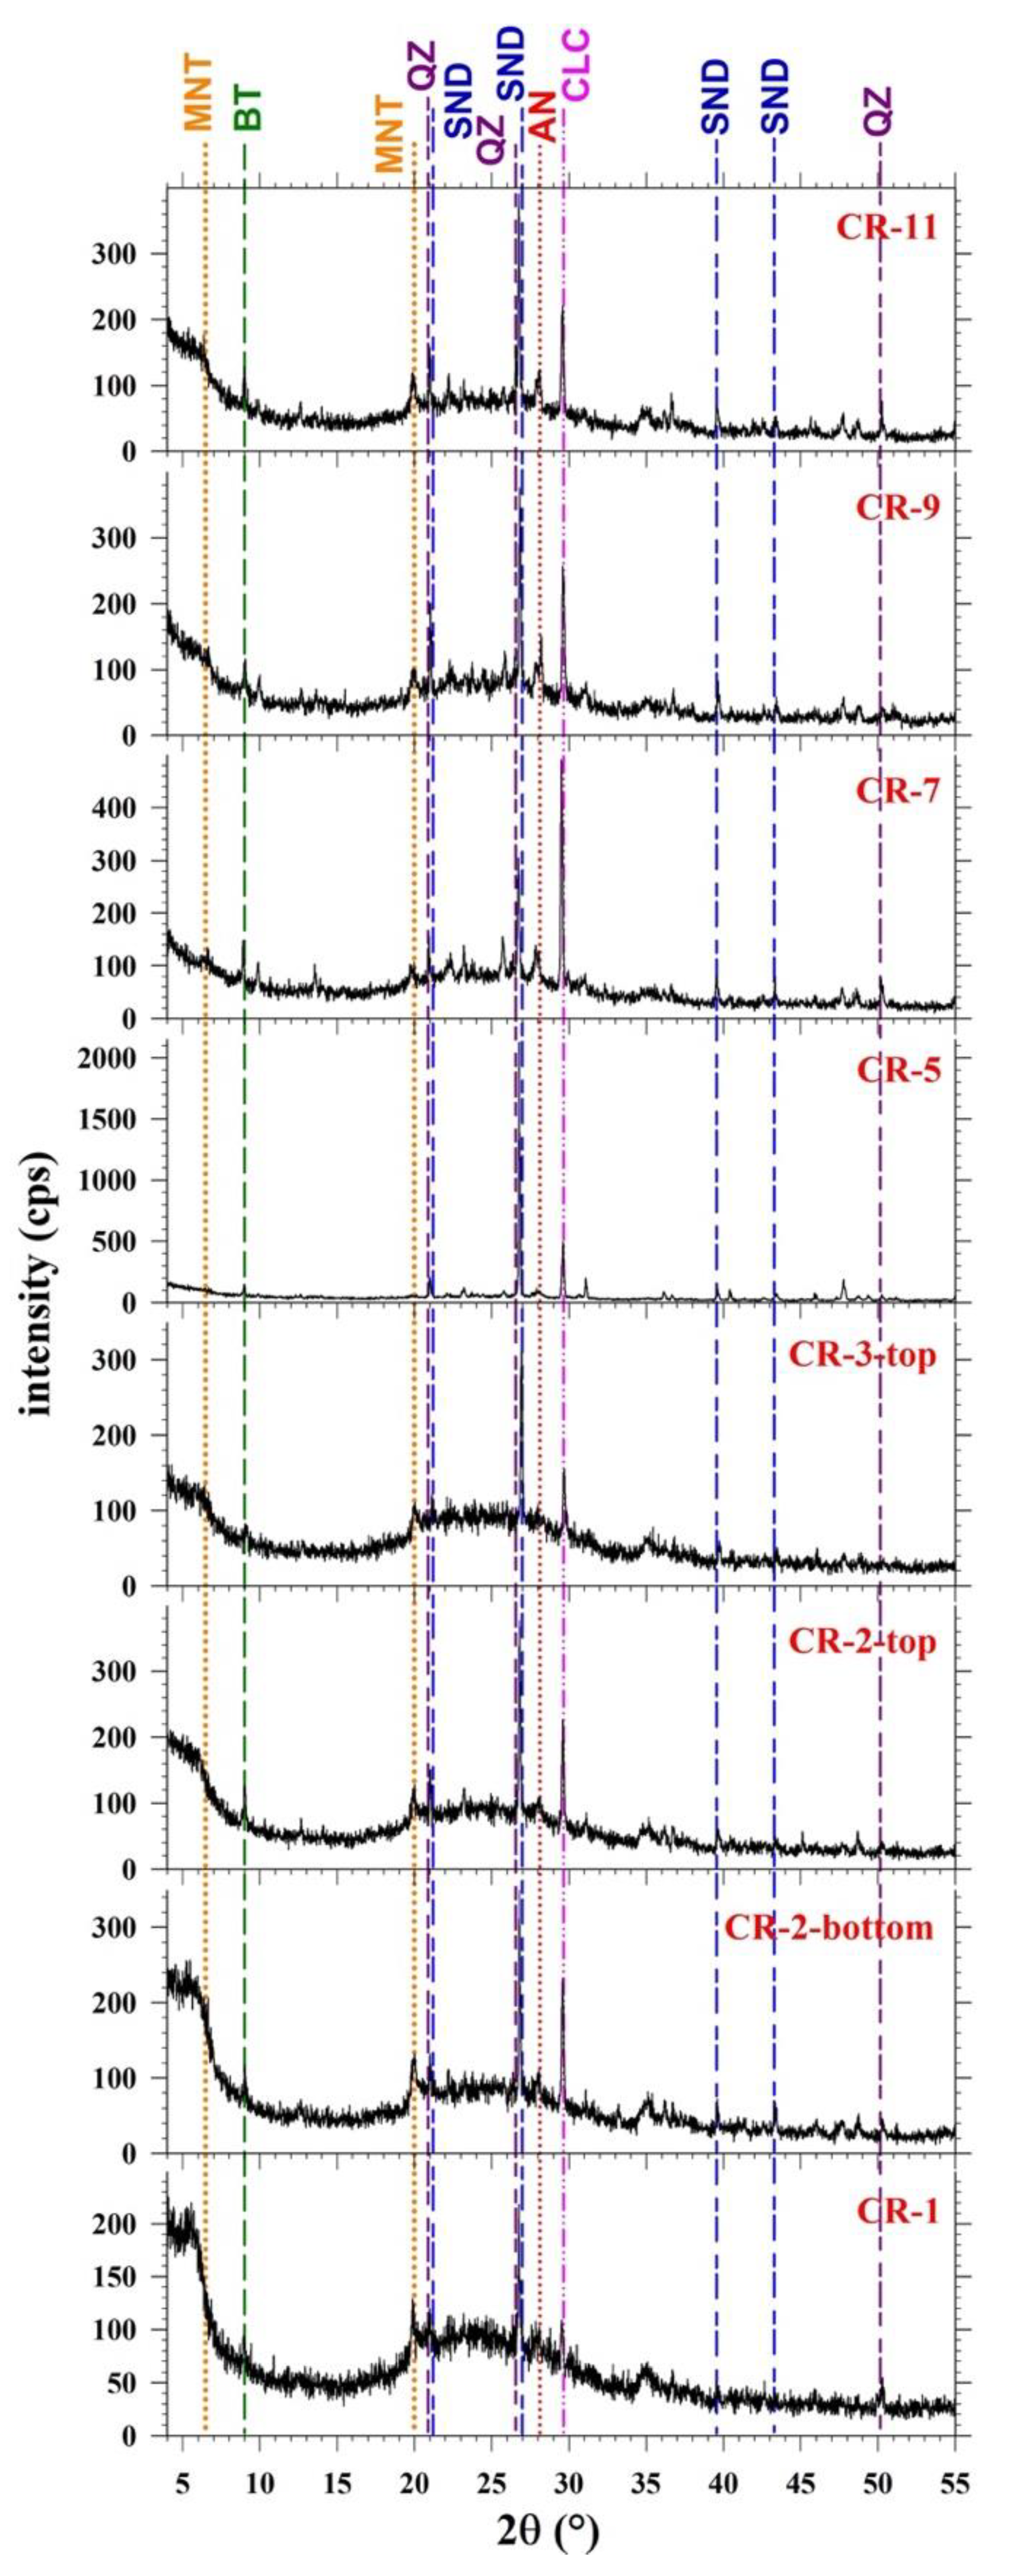
The previous mesoscopic attributes (Figure 2) are here corroborated and detailed by observation on digitalised images of thin sections (left column in Figure 3), as well by representative BS-SEM micro-photographs (middle and right columns in Figure 3). The type of sedimentary structures described above are corroborated by scanned thin section images (Figure 3). The eight samples mostly contain glassy ash-sized volcanic particles, plus subordinate carbonate cement filling voids and very few silicate minerals (Figure 3 and Figure 4). The shape of glass particles are discriminated following the classical morphological features, such as: (i) blocky with curvy-planar surfaces and low vescicularity, (ii) vesicular with irregular shapes and smooth fluid surfaces, (iii) fine and irregular shaped consisting of several globular masses stick together, (iv) spherical or drop-like with smoothly curved surfaces and commonly attached and/or agglutinated, and (v) platy with curved surfaces, part of a bubble wall [9,10,13,79,81,82].
The glass shards have dimension ranging around 100 µm, with a prevalence of blocky (type i) and vesicular (type ii) morphologies, plus some fragments with platy-like shape (v types); many glassy particles contours can be associated to bubble-walls (Figure 3 and Figure 4). The largest blocky shards result sometimes fractured or broken, while only some of these biggest fragments show inside them bubbles with micrometric dimensions, never exceeding few tens of µm (Figure 3 and Figure 4). Their aspect ratio moves mainly from 1:2 to 1:3, i.e., prismatic shape, whereas more anisotropic shapes are uncommon (Figure 3 and Figure 4). The shards appear insignificantly affected by alteration. The carbonate content is poorly variable (see below); calcite phases mainly occur in voids among glassy particles and subordinately in isolated particles. Fossils are completely lacking in all samples (Figure 3 and Figure 4).

4.3. XRPD

X-ray diffraction analyses were performed on eight representative selected CR specimens as a function of the stratigraphy (Figure 2 and Figure S1) and are shown in Figure 5. The principal feature of all samples, except for the CR-5, is the presence of a large bulge (between ~18 and 33° of 2θ) with a low but detectable intensity (about 100 cps), due to the amorphous silicate phase occurrence [57,83,84,85]. With the exception of CR-5 sample, two very faint peaks at low angles are observed. They indicate the presence of sheet-silicates, such as montmorillonite and biotite (Figure 5). In all of the CR patterns, at 3.34, 3.26, 3.2 Å reflections indicate the quartz, sanidine and anorthite, respectively; the typical most intense Bragg reflections of calcite (3.03Å) are also always detectable (Figure 5). The intensities of Bragg reflections are crudely and inversely correlated with the intensity of the large shoulder; since the data collection of XRPD and weight of used materials are the same, it can be stated that the amount of minerals decreases when the silicate glass fraction increases (Figure 5). Admitting the absence of any preferred orientation of crystallites, the intensity of calcite is weak (<300 cps) in the lower part of the section (CR-1, CR-2-bottom, CR-2-top, CR-3-top), the highest in CR-5 and then progressively decrease again moving upward (CR-7, CR-9, CR-11) (Figure 5). The CR-5 XRPD pattern is instead characterised by the near absence of the bulge related to the non-crystalline phase counterbalanced by the presence of the highest intense Bragg peak, corresponding to quartz and feldspars (Figure 5).

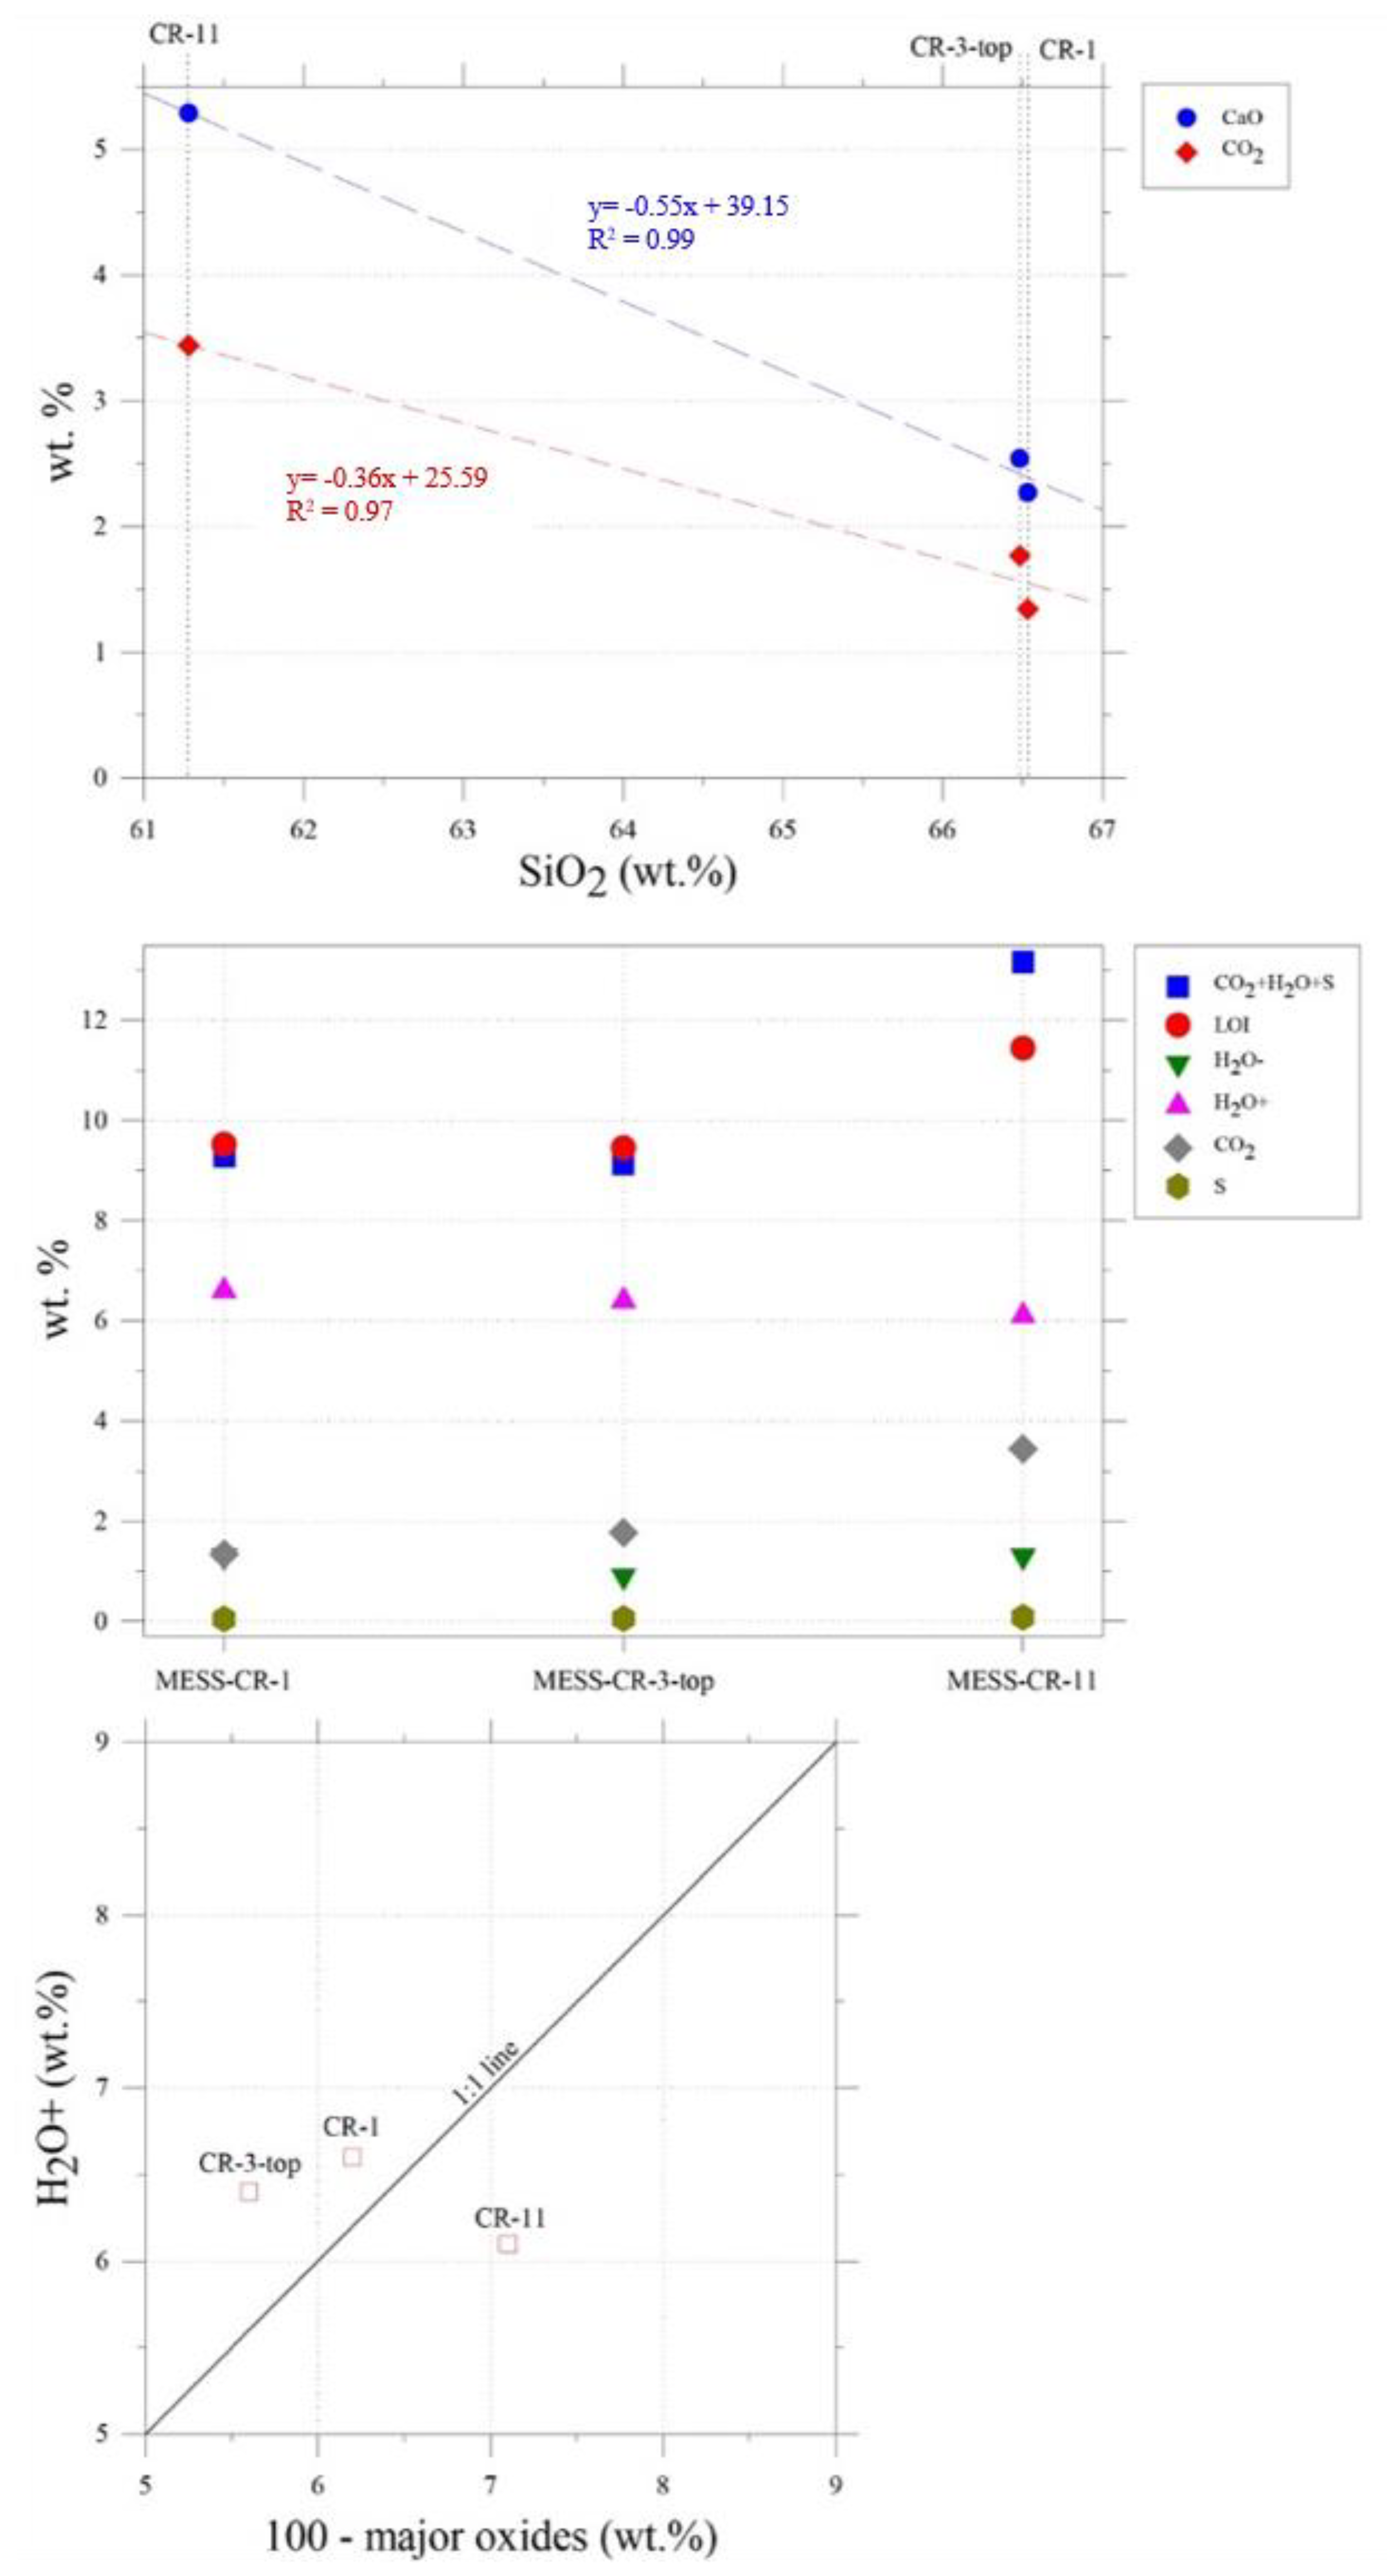
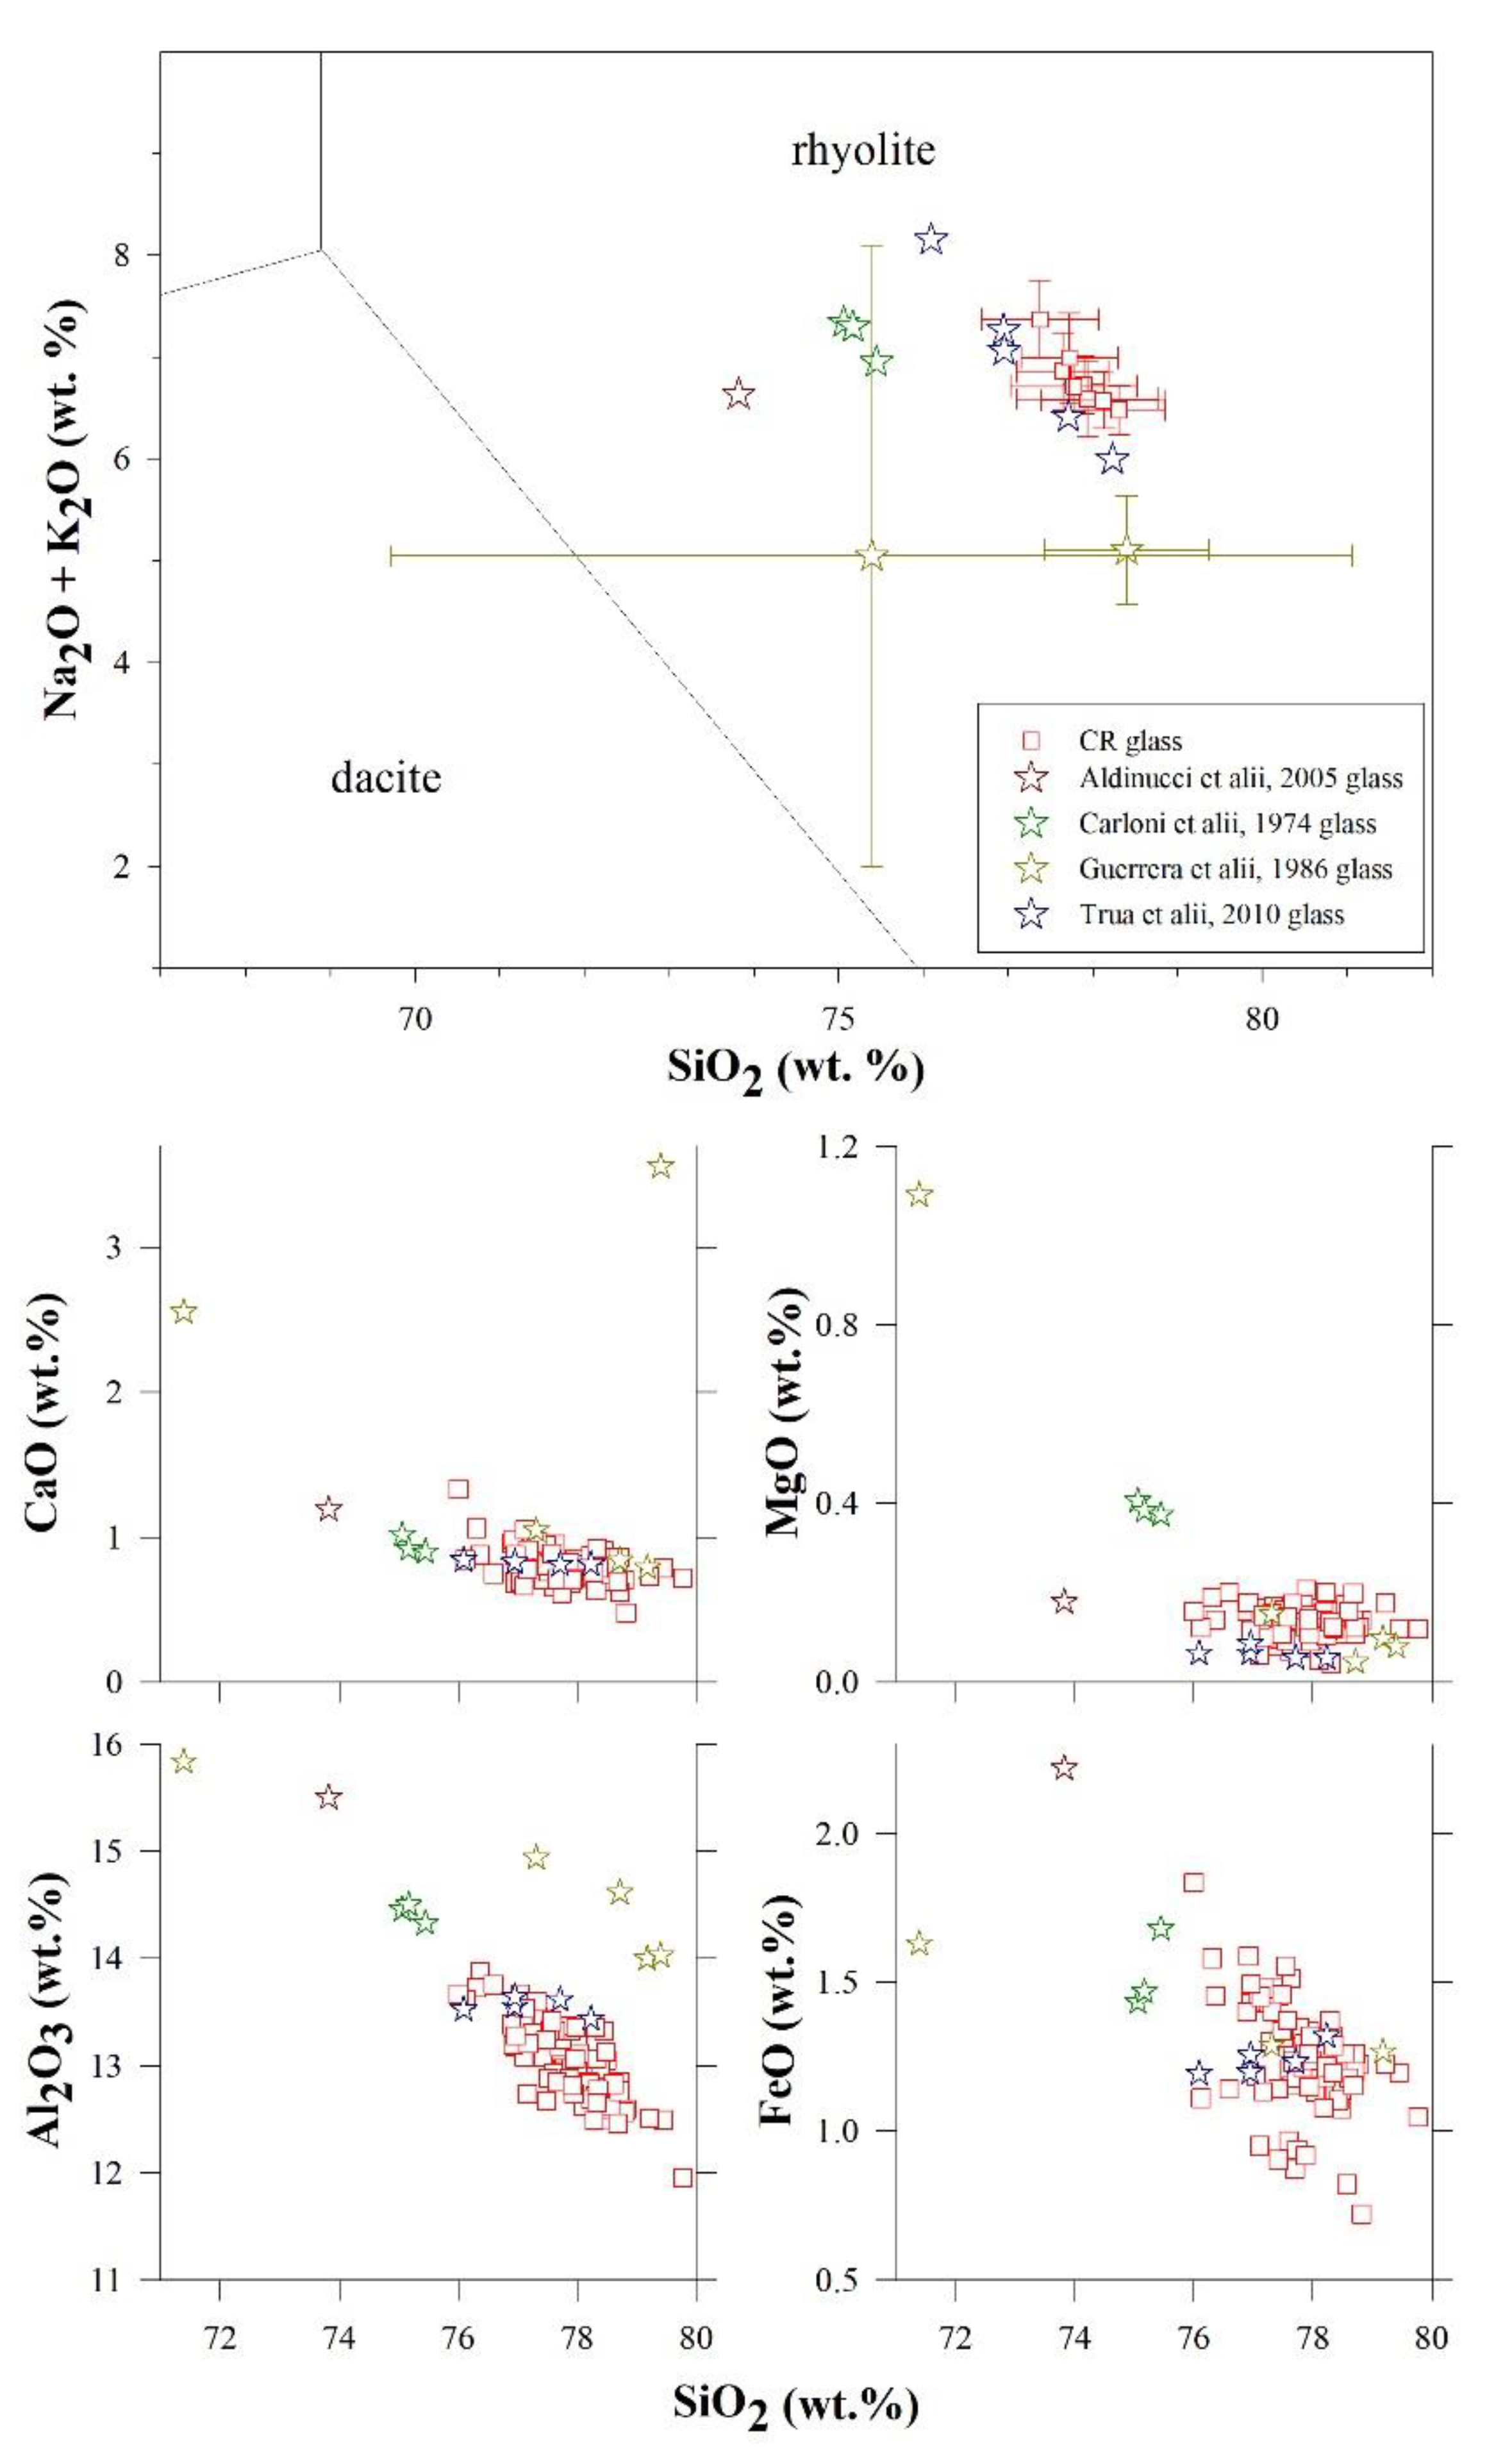
4.4. Whole and Micro-Chemical Compositions

The bulk composition of the 3 samples selected for analysis in the reason of the lower clay and calcite abundance, is reported in Tables S3 and S4. Only SiO2, CaO and CO2 and LOI (and tot) show significant absolute variations (particularly in CR11), whereas all the other oxides are very similar; the amount of SiO2 is inversely related to that of CaO and CO2 (Table S3, Figure 6). The total H2O content varies between 7.3 and 7.9 wt.%, with the largest relative variations due to H2O, whilst H2O+ shifts between 6.1 and 6.6 wt.% (Table S3, Figure 6). The FeO and Fe2O3 contents range between 1.3 to 1.5 and 0.9 to 1.4 wt.%, resulting in a slight variable Fe2+/Fe3+ ratio (Table S3). The contents of the LOI and of CO2 + H2O + S are well comparable between them per each sample (Table S3); the S is at the detection limit.
The micro-chemical compositions of glassy grains are reported and compared with previous determination on other VRL horizons or from the same locality (see below) in Tables S5 and S6. The values of the major oxides obtained from the microprobe analyses on glassy fragments well reflect those determined by bulk rock composition (Tables S3, S5, and S6), in line with the low amount of minerals in the analysed VRL (Figure 3 and Figure 4) and the XRPD outcomes (Figure 5). The most evident absolute and relative differences between the microprobe and bulk geochemical data are found for SiO2, MgO and CaO (Tables S3, S5 and S6). The higher SiO2 and lower contents of CaO and also MgO in the glassy particles by EPMA compared to bulk compositions is due to the absence of relative silica-poor mineral phases such as sheet-, chain- and framework-silicates and to the absence of carbonates and Mg-bearing silicates, respectively (Tables S3, S5 and S6). The differences of sum of oxides with respect to the ideal closure of 100 wt.% when compared with H2O+ determinations are in very well agreement. Thereby, the amount of water likely dissolved in these glasses is on the order of 6–7 wt.% (Figure 6).

5. Discussion

Petrology and provenance of the VRL-5.5. The glassy grains via EPMA have a rhyolitic composition [86], perfectly overlapping with those derived from previous studies on similar VRLs (Figure 7) [48,51,53,63]. The Harker diagrams further constrain the variations of the major oxides that invariably fall within narrow compositional ranges (Figure 7), except those by Guerrera et al., 1986 [53]. Since the stratigraphic positions of these VRL horizons are also similar (Figure 1), the volcanic-rich layer cropping at CR was also emplaced at 5.5. Ma (VRL-5.5).
The bulk immobile elements are particularly useful to evaluate old and tephra with some alteration and to constrain the magmatic signature of the VRL-5.5 [87,88], similar to as displayed in Figure 8. All the VRL-5.5 trace immobile elements determined here fall invariably in the field of volcanic arc and sin-collisional domains (Figure 8). The high amount of H2O wt.% (Figure 6) can result on both primary magmatic water and secondary hydration [89]. We were unable to measure H2O profiles using FTIR and especially isotopic signatures of water and consequently it can not be definitely quantified the fraction of magmatic vs. submarine water in these glasses. Such finding excludes a paleo-Ponza source as hypothesised by Trua et al., 2010 [47], being free of any calc-alkaline, and suggests the provenance from a convergent geodynamic setting [90]. Moreover, the provenance of the VRL-5.5 from W or SW with respect to CR should determine a significant thickness of such materials in some peri-Tyrrhenian sites, that are totally undocumented in central and southern domains east of Tyrrhenian sea, with the exception of 1–2 cm-thick VRL at the Serredi quarry, in Tuscany (Figure 1).
Volcanology and deposition of the VRL-5.5. Previous investigations on the other VRL 5.5 sites (Figure 1) reported only a qualitative low amount of volcanic minerals, whereas the amount of carbonate or in general sedimentary fractions was never analysed or quantified [47,51,53]. Here, the image analysis determinations allow us to quantify sedimentary vs. volcanic fractions, as well as their textural attributes [35,40,73,91,92]. The 2D image analysis obtained on thin sections allow for the constraint of qualitative determinations (Figure 3 and Figure 5) and to quantify the actual content of glassy particles, magmatic minerals and carbonates (Figure 9). The total content of magmatic minerals (quartz, feldspars, and biotite) is very low (Figure 9). They are invariably contained in glass matrix and never occurring similar to isolated crystals (Figure 3 and Figure 5). Such determinations are in line with the XRPD results (Figure 5), except for the sample CR-5 where the amount of quartz and feldspars are higher. Only in the CR-5, we interpreted such apparent discrepancy by considering both these silicate phases such as sedimentary rocks are unrelated to the VRL-5.5 magmatic source.
Such explanation well agrees with the area% of sedimentary carbonates measured again for the CR-5 specimen. Montmorillonite also is grown in sedimentary environment [93,94], at a sub-micrometric scale since it is unobservable in SEM images but only by XRPD. The carbonate and montmorillonite phases can be thus considered to precipitate from circulating seawater fluids after the deposition of the CR VRL-5.5 horizon and/or by the alteration of its glassy fraction [14,95,96]. They lithified or cemented the previously loose CR VRL-5.5 deposit [27,42].
We can then conclude that CR-5 is the layer richest in sedimentary materials and more depauperated in volcanic ones due to mechanical transport and/or the richest in carbonates due to the largest volcanic grains (see below) that induce a major number of voids (Figure 9 and Figure 10). In line with aforementioned field and mesoscopic observations (Figure 2 and Figure S1), the CR-5 sub-horizon divides the lowermost and almost massive sub-horizon (CR-1 to CR-3-top) from the uppermost one containing many pervasive sedimentary structures (CR-7, CR-9 and CR-11) (Figure 2, Figure 9 and Figure S1). In the eight thoroughly analysed specimens extraneous lithologies and fossils are completely lacking, as well as clear evidence of turbiditic sedimentary structures [7,97,98] common in the rest of the Messinian succession (Figure 2 and Figure S1). These attributes exclude a deposition of the entire VRL-5.5 of CR or of a part of it from a turbiditic current [1,20,24] and the suggestion of its origin from a single enormous gravity current [47,51,53]. At the same time, the presence of these three main sub-horizons and slight but detectable 2D grain-size variations can be attributed to different depositional processes (Figure 2 and Figure S1).
The various measurements derived from the image analysis, including the abundance in area%, of the various glass fragments were used to calculate the classic whole grain-size parameters [80], mirroring those obtainable from 3D determinations [69,73,74] (Table S7 and Figure 10). The pyroclastic clasts are all ash-sized, with the largest clasts always below 150 μm and with a prevalence of fine ash compared to coarse ones (Figure 11). The grain size distribution does not show any significant trend associated with the position along the stratigraphic column, except a slight but detectable inversion in the 2D grain-size trend for the CR-5 sample (Figure 2 and Figure S1). The tiny sizes of ash particles and the absence of loose minerals suggests a distal origin of the entire VRL-5.5 volcanic material [1,20,24].
The mean size MZ in the various samples are poorly variable being comprised between 5.60 and 5.87, with a mean value of 5.72 (Table S7 and Figure 10). In detail, the MZ decreases, thus the grain size of ash increases, moving upwards up to the CR-5, then the trends reinvert again; in other words, the CR-5 hosts the largest ash grains, whereas the tiniest ones increase moving downward and upward from it (Figure 10). The other σi and KG parameters have similar but opposite characteristics as a function of vertical stratigraphy, while the skewness SKi is instead constant; the relative less sorted sample is CR-5 (Figure 10). Further confirmations of such appraisal are furnished by the similarities in 2D long and short sizes, aspect ratio, roundness and orientation of particle lengths (Figure 11).
The long and short axes of equal-area ellipses of ashy grains overlap among all the samples analysed, testifying an extremely high textural similarity; the aspect ratio of particles is also very similar and mainly ranging between 2 and 5 (Figure 11). The length of particles is mainly randomly distributed around the theoretical value of 8.3% per class (perfect random distribution on the 12 classes used), sign of an absence or scarce presence of fabric except for sample CR-2-top (Figure 11). This can be related to the poor anisotropy of the particles (see above) and to weak, if present, depositional effects.
The roundness of volcanic particles provides valuable insights on the possible transport of cuspated or segmented grains [3,79,99,100,101]. The most part of particles has similar roundness distribution with value of 5, followed by 2 (more rounded). They are unrelated to vertical stratigraphy and are equally or even less rounded than pristine tephras reported for the Grímsvötn-2011 fallout [79] at tens of km from its source (Figure 11). As matter of fact, the shards preserve their original shape. Therefore, these features further confirm the absence of significant reworking as expected in deposition by turbidity currents (e.g., higher grain roundness) even if a local remobilization of the VRL-5.5 pyroclastic grains cannot be excluded.
To summarize, the 2D textures of volcanic particles have very similar distributions along the CR stratigraphy (Figure 11). Since only the lowermost massive sub-horizon of CR-5 is structure-less, we conclude that this first 80–90 cm of the CR deposit results from direct precipitation of fine ashy particles from a volcanic vent. They first dispersed in the atmosphere and then sink in seawater [1,9]. The uppermost sub-horizon is instead characterized by poor but visible structures (Figure 2 and Figure S1) and we thus speculate that it resulted from re-mobilisation and local transport by low-energy currents of the same unconsolidated and waterlogged VRL-5.5 from adjacent sites, such to preserve the original roundness of the brittle ashes (Figure 11). The CR-5 sample may represent the first deposited materials after this local reworking or a single thin redeposited sub-horizon. The CR-7 to CR-11 uppermost sub-horizon is the sluggish sedimented part of this local remobilised current(s) made of VRL-5.5 glassy shards.
This depositional reappraisal indicates that of the total 170–180 cm height of the outcrop in CR, lesser than 80–90 cm is the real primary deposit. Such interpretation also well explains the variability in thickness, admitting no erosive process, of the same surrounding VRL-5.5 at limited lateral distance from CR in the Marche area (Figure 1), i.e., 150 cm at Colle Gallo, 150–300 cm at Amandola, 120 cm at Maccarone and 80 cm at Calcinelli (96; 47; 22). Further investigations on the same VRL-5.5 must constrain the real primary thickness of them. The sampling and analytical protocols described here are useful to identify the petrological and sedimentary processes underwent in other lithified tephras, i.e., VRLs.

Supplementary Materials

The following supporting information can be downloaded at: https://www.mdpi.com/article/10.3390/min12070893/s1, Figure S1: An enlarged and detailed field view and specimens of the CR outcrop, with all the 15 specimens and 15 XRPD patterns.; Figure S2: Example of image analysis on two representative samples. From left to right and up to down: BS-SEM microphotographs, segmentation in false colours and textural measurements of single objects. The false colours red, cyan and yellow corresponds to glass, carbonates and crystals, respectively. The collected textural measures concern the angle between the major axis and the horizontal, area, aspect ratio (as major axis/minor axis), perimeter, length of the major and minor axes, roundness (right column). The blue bars correspond to 50 µm. Table S1: CR sample locations, labels and thickness; Table S2: Sites of VRL5.5 reported in previous studies; Table S3: Bulk compositions of selected samples rich in volcanic phases; Table S4: Trace elements from bulk analysis of selected CR samples and literature (where available); Table S5: Micro-chemical composition of glassy matrixes determined by EPMA (raw data); Table S6: Micro-chemical composition of glassy matrixes determined by EPMA (100 wt.% dry recalculation); Table S7: Micro-chemical composition of a Dumfriesshire augite from the Micro-Analysis Consultant, run as a standard, determined by EPMA; Table S8: Grain-size statistical parameters derived from image analysis.

Author Contributions

Conceptualization, D.P., G.I. and V.S.; methodology, D.P., G.I. and V.S.; formal analysis, D.P.; investigation, D.P., V.S., M.P., P.P.P., A.M., M.N. and P.S.; resources, M.P., A.M., M.N., P.S. and G.I.; data curation, D.P. and G.I.; writing—original draft preparation, D.P., V.S. and G.I.; writing—review and editing, D.P., V.S., M.P., P.P.P., A.M., M.N. and P.S.; visualization, D.P., V.S. and G.I.; supervision, D.P., V.S. and G.I.; project administration, G.I. All authors have read and agreed to the published version of the manuscript.

Funding

This study was funded by the “Fondi Ateneo of the University G. D’Annunzio” of Iezzi G. and Scisciani V. and PRIN (2017J277S9_003) project “Time Scales of Solidification in Magmas: Application to Volcanic Eruptions, Silicate Melts, Glasses, Glass-Ceramics” awarded to G. Iezzi.

Data Availability Statement

Not applicable.

Acknowledgments

Most of this study was conducted during the Ph.D. of D. Potere. We thank the two anonymous reviewers and the Academic Editor Nick Pearce for the useful, constructive comments.

Conflicts of Interest

The authors declare no conflict of interest.

References

  1. Alloway, B.; Lowe, D.; Larsen, G.; Shane, P.; Westgate, J.A. Tephrochronology. The Encyclopaedia of Quaternary Science, 2nd ed.; Elsevier: Amsterdam, The Netherlands, 2013; Volume 4, pp. 277–304. [Google Scholar]
  2. Giuliani, L.; Iezzi, G.; Mollo, S. Dynamics of volcanic systems: Physical and chemical models applied to equilibrium versus disequilibrium solidification of magmas. AGU Books 2020, 16, 373–418. [Google Scholar]
  3. Manga, M.; Patel, A.; Dufek, J. Rounding of pumice clasts during transport: Field measurements and laboratory studies. Bull. Volcanol. 2011, 73, 321–333. [Google Scholar] [CrossRef] [Green Version]
  4. Bonadonna, C.; Costa, A. Estimating the volume of tephra deposits: A new simple strategy. Geology 2012, 40, 415–418. [Google Scholar] [CrossRef]
  5. Houghton, B.; Carey, R.J. Chapter 34—Pyroclastic Fall Deposits. In The Encyclopedia of Volcanoes, 2nd ed.; Sigurdsson, H., Ed.; Academic Press: Cambridge, MA, USA, 2015; pp. 599–616. [Google Scholar] [CrossRef]
  6. Buchwaldt, R. Pyroclastic Flow. In Encyclopedia of Natural Hazards; Encyclopedia of Earth Sciences, Series; Bobrowsky, P.T., Ed.; Springer: Dordrecht, The Netherlands, 2013. [Google Scholar] [CrossRef]
  7. Cas, R. Mass-Flow Arenites from a Paleozoic Interarc Basin, New South Wales, Australia: Mode and Environment of Emplacement. J. Sediment. Res. 1979, 49, 29–44. [Google Scholar] [CrossRef]
  8. Cioni, R.; Pistolesi, M.; Rosi, M. Chapter 29—Plinian and Subplinian Eruptions. In The Encyclopedia of Volcanoes, 2nd ed.; Sigurdsson, H., Ed.; Academic Press: Cambridge, MA, USA, 2015; pp. 519–535. [Google Scholar] [CrossRef] [Green Version]
  9. Lowe, D.J.; Pearce, N.J.C.; Jorgensen, M.A.; Kuehn, S.C.; Tryon, C.A.; Hayward, C.L. Correlating tephras and cryptotephras using glass compositional analyses and numerical and statistical methods: Review and evaluation. Quat. Sci. Rev. 2017, 175, 1–44. [Google Scholar] [CrossRef]
  10. Wohletz, K.H.; Krinsley, D. Scanning Electron Microscopy of Basaltic Hydromagmatic Ash; Los Alamos National Laboratory Report LA-UR, 82–1433; University of California, Los Alamosa National Laboratory: Los alamos, NM, USA, 1982; 43p. [Google Scholar]
  11. Cole, J.W. Tephra. In Petrology. Encyclopedia of Earth Science; Springer: Boston, MA, USA, 1989. [Google Scholar] [CrossRef]
  12. Thorarinsson, S. The eruption of Mt. Hekla 1947–1948. Bull. Volcanol. 1950, 10, 157–168. [Google Scholar] [CrossRef]
  13. Cas, R.; Wright, J. Volcanic Succession Modern and Ancient; Springer: Dordrecht, The Netherlands, 1988. [Google Scholar] [CrossRef]
  14. Fisher, R.V.; Schmincke, H.U. Pyroclastic Rocks; Springer: Berlin/Heidelberg, Germany, 1984. [Google Scholar] [CrossRef]
  15. Iverson, N.A.; Kalteyer, D.; Dunbar, N.W.; Kurbatov, A.; Yates, M. Advancements and best practices for analysis and correlation of tephra and cryptotephra in ice. Quat. Geochronol. 2017, 40, 45–55. [Google Scholar] [CrossRef]
  16. Loughlin, S.C. Volcanoes and Volcanic Eruptions. In Encyclopedia of Natural Hazards; Bobrowsky, P.T., Ed.; Encyclopedia of Earth Sciences Series; Springer: Dordrecht, The Netherlands, 2013. [Google Scholar] [CrossRef]
  17. Monteath, A.J.; Hughes, P.D.M.; Wastegård, S. Evidence for distal transport of reworked Andean tephra: Extending the cryptotephra framework from the Austral volcanic zone. Quat. Geochronol. 2019, 51, 64–71. [Google Scholar] [CrossRef] [Green Version]
  18. Ponomareva, V.; Portnyagin, M.; Davies, S.M. Tephra without Borders: Far-Reaching Clues into Past Explosive Eruptions. Front. Earth Sci. 2015, 3, 83–99. [Google Scholar] [CrossRef] [Green Version]
  19. Schmincke, H.U. Volcanic Edifices and Volcanic Deposits. In Volcanism; Schmincke, H.U., Ed.; Springer: Berlin/Heidelberg, Germany, 2004; pp. 127–154. [Google Scholar] [CrossRef]
  20. Freundt, A.; Schindlbeck-Belo, J.C.; Kutterolf, S.; Hopkins, J.L. Tephra layers in the marine environment: A review of properties and emplacement processes. Geol. Soc. London, Spéc. Publ. 2021, 520. [Google Scholar] [CrossRef]
  21. Friedman, I.; Long, W. Volcanic glasses, their origins and alteration processes. J. Non-Cryst. Solids 1984, 67, 127–133. [Google Scholar] [CrossRef]
  22. Branney, M.J.; Kokelaar, P. Pyroclastic Density Currents and the Sedimentation of Ignimbrites. Geol. Soc. London Memoir 2002, 27, 152. [Google Scholar]
  23. Brown, R.J.; Andrews, G.D.M. Chapter 36—Deposits of Pyroclastic Density Currents. In The Encyclopedia of Volcanoes, 2nd ed.; Sigurdsson, H., Ed.; Academic Press: Cambridge, MA, USA, 2015; pp. 631–648. [Google Scholar] [CrossRef]
  24. Lowe, D.J. Tephrochronology and its application: A review. Quat. Geochronol. 2011, 6, 107–153. [Google Scholar] [CrossRef] [Green Version]
  25. Schneider, J.-L.; Le Ruyet, A.; Chanier, F.; Buret, C.; Ferrière, J.; Proust, J.-N.; Rosseel, J.-B. Primary or secondary distal volcaniclastic turbidites: How to make the distinction? An example from the Miocene of New Zealand (Mahia Peninsula, North Island). Sediment. Geol. 2001, 145, 1–22. [Google Scholar] [CrossRef]
  26. Talling, P.J.; Masson, D.G.; Sumner, E.J.; Malgesini, G. Subaqueous sediment density flows: Depositional processes and deposit types. Sedimentology 2012, 59, 1937–2003. [Google Scholar] [CrossRef]
  27. Kataoka, K.S.; Urabe, A.; Nagahashi, Y. Millennial-scale reworking of tephra in alluvial to shallow marine settings: Distinguishing pseudo-isochrons from genuine ones. Quat. Int. 2016, 397, 173–193. [Google Scholar] [CrossRef]
  28. Gudmundsdóttir, E.R.; Eiríksson, J.; Larsen, G. Identification and definition of primary and reworked tephra in Late Glacial and Holocene marine shelf sediments off North Iceland. J. Quat. Sci. 2011, 26, 589–602. [Google Scholar] [CrossRef]
  29. Manville, V.; Hodgson, K.A.; Houghton, B.F.; Keys, J.R.; White, J.D.L. Tephra, snow and water: Complex sedimentary responses at an active snow-capped stratovolcano, Ruapehu, New Zealand. Bull. Volcanol. 2000, 62, 278–293. [Google Scholar] [CrossRef]
  30. Rausch, J.; Grobéty, B.; Vonlanthen, P. Eifel maars: Quantitative shape characterization of juvenile ash particles (Eifel Volcanic Field, Germany). J. Volcanol. Geotherm. Res. 2015, 291, 86–100. [Google Scholar] [CrossRef] [Green Version]
  31. Stalder, N.F.; Fellin, M.G.; Caracciolo, L.; Guillong, M.; Winkler, W.; Milli, S.; Moscatelli, M.; Critelli, S. Dispersal pathways in the early Messinian Adriatic foreland and provenance of the Laga Formation (Central Apennines, Italy). Sediment. Geol. 2018, 375, 289–308. [Google Scholar] [CrossRef]
  32. Giuliani, L.; Iezzi, G.; Vetere, F.; Behrens, H.; Mollo, S.; Cauti, F.; Ventura, G.; Scarlato, P. Evolution of textures, crystal size distributions and growth rates of plagioclase, clinopyroxene and spinel crystallized at variable cooling rates from a mid-ocean ridge basaltic melt. Earth-Sci. Rev. 2020, 204, 103165. [Google Scholar] [CrossRef]
  33. Takashimizu, Y.; Iiyoshi, M. New parameter of roundness R: Circularity corrected by aspect ratio. Prog. Earth Planet Sci. 2016, 3, 2. [Google Scholar] [CrossRef] [Green Version]
  34. Sohn, C.; Sohn, Y.K. Distinguishing between primary and secondary volcaniclastic deposits. Sci. Rep. 2019, 9, 12425. [Google Scholar] [CrossRef] [PubMed] [Green Version]
  35. Satow, C.; Grant, K.M.; Wulf, S.; Schulz, H.; Mallon, A.; Matthews, I.; Lowe, J. Detection and Characterisation of Eemian Marine Tephra Layers within the Sapropel S5 Sediments of the Aegean and Levantine Seas. Quaternary 2020, 3, 6. [Google Scholar] [CrossRef] [Green Version]
  36. Pollard, A.M.; Blockley, S.P.E.; Ward, K.R. Chemical alteration of tephra in the depositional environment: Theoretical stability modelling. J. Quat. Sci. 2003, 18, 385–394. [Google Scholar] [CrossRef]
  37. Blong, R.; Enright, N.; Grasso, P. Preservation of thin tephra. J. Appl. Volcanol. 2017, 6, 10. [Google Scholar] [CrossRef] [Green Version]
  38. Gudmundsdóttir, E.R.; Eiríksson, J.; Larsen, G. Holocene marine tephrochronology on the Iceland shelf: An overview. Jökull 2012, 62, 53–72. [Google Scholar]
  39. Buckland, H.M.; Cashman, K.V.; Engwell, S.L.; Rust, A.C. Sources of uncertainty in the Mazama isopachs and the implications for interpreting distal tephra deposits from large magnitude eruptions. Bull. Volcanol. 2020, 82, 23. [Google Scholar] [CrossRef] [Green Version]
  40. Mahony, S.H.; Sparks, R.S.J.; Barnard, N.H. Quantifying uncertainties in marine volcanic ash layer records from ocean drilling cores. Mar. Geol. 2014, 357, 218–224. [Google Scholar] [CrossRef]
  41. Boygle, J. Variability of tephra in lake and catchment sediments, Svínavatn, Iceland. Glob. Planet. Chang. 1999, 21, 129–149. [Google Scholar] [CrossRef]
  42. D’Atri, A.; Pierre, F.D.; Lanza, R.; Ruffini, R. Distinguishing primary and resedimented vitric volcaniclastic layers in the Burdigalian carbonate shelf deposits in Monferrato (NW Italy). Sediment. Geol. 1999, 129, 143–163. [Google Scholar] [CrossRef]
  43. Griggs, A.J.; Davies, S.M.; Abbott, P.M.; Coleman, M.; Palmer, A.P.; Rasmussen, T.L.; Johnston, R. Visualizing tephra deposits and sedimentary processes in the marine environment: The potential of X-ray microtomography. Geochem. Geophys. Geosyst. 2015, 16, 4329–4343. [Google Scholar] [CrossRef] [PubMed] [Green Version]
  44. Carey, S.N.; Schneider, J.L. Chapter 7—Volcaniclastic Processes and Deposits in the Deep-Sea. Dev. Sedimentol. 2011, 63, 457–515. [Google Scholar] [CrossRef]
  45. Fisher, R.V. Rocks composed of volcanic fragments and their classification. Earth-Sci. Rev. 1966, 1, 287–298. [Google Scholar] [CrossRef]
  46. Cremonini, G.; Farabegoli, E. Note ill.ve alla Carta Geologica dell’Appennino Emiliano-Romagnolo; Università di Bologna: Bologna, Italy, 1982. [Google Scholar]
  47. Trua, T.; Manzi, V.; Roveri, M.; Artoni, A. The Messinian volcaniclastic layers of the Northern Apennines: Evidence for the initial phases of the Southern Tyrrhenian spreading? Ital. J. Geosci. 2010, 129, 269–279. [Google Scholar] [CrossRef]
  48. Aldinucci, M.; Bigazzi, G.; Dall’Antonia, B.; Da Prato, S.; Donia, F.; D’Orazio, M.; Foresi, L.M.; Mazzei, R.; Riforgiato, F.; Sandrelli, F.; et al. The upper Messinian post-evaporitic succession of Serredi Quarry (southern Tuscany, Italy): New stratigraphic data and geochronology of an ash layer. GeoActa 2005, 4, 67–82. [Google Scholar]
  49. Bassetti, M.; Lucchi, F.; Roveri, M. Physical stratigraphy of the Messinian post-evaporitic deposits in Central-southern Marche area (Appennines, Central Italy). Mem. Della Soc. Geol. Ital. 1994, 48, 275–288. [Google Scholar]
  50. Cantalamessa, G.; Centamore, E.; Chiocchini, U.; Micarelli, A.; Potetti, M. Il Miocene delle Marche. In La Geologia delle Marche. Studi Geologici Camerti; Centamore, E., Deiana, G., Eds.; Congresso Società Geologica Italiana: Roma, Italy, 1986; Volume Sp. 73°. [Google Scholar]
  51. Carloni, C.; Cati, F.; Borsetti, A.M.; Francavilla, F.; Mezzetti, R.; Savelli, C. Il limite Miocene-Pliocene nelle Marche centro-meridionali. Boll. Soc. Geol. Ital. 1974, 93, 823–836. [Google Scholar]
  52. Centamore, E.; Cantalamessa, G.; Micarelli, A.; Potetti, M.; Berti, D.; Bigi, S.; Morelli, C.; Ridolfi, M. Stratigrafia ed analisi di facies dei depositi del Miocene e del Pliocene inferiore dell’avanfossa Marchigiano-Abruzzese e delle zone limitrofe. Studi Geol. Camerti Spec. 1991, 1, 125–131. [Google Scholar]
  53. Guerrera, F.; Tonelli, G.; Veneri, F. Caratteri lito-sedimentologici e mineralogico-petrografici di vulcanoclastiti mioceniche presenti nella successione umbro-machigiana. Boll. Soc. Geol. Ital. 1986, 105, 307–325. [Google Scholar]
  54. Odin, G.S.; Ricci Lucchi, F.; Tateo, F.; Cosca, M.; Hunziker, J.C. Integrated stratigraphy of the Maccarone Section, Late Messinian (Marche Region, Italy). Developments in Palaeontology and Stratigraphy; Elsevier: Amsterdam, The Netherlands, 1995; pp. 531–545. [Google Scholar] [CrossRef]
  55. Savelli, D.; Wezel, F.C. Schema geologico del Messiniano del pesarese. Boll. Della Soc. Geol. Ital. 1979, 97, 165–188. [Google Scholar]
  56. Selli, R. Il Bacino del Metauro—Descrizione Geologica, Risorse Minerarie, Idrogeologia. Ed. Cassa di Risparmio di Fano, Fano. 1954. Available online: http://www.fondazionecarifano.it/libroselli/miocene2.html (accessed on 30 November 2020).
  57. Velev, S.; Stanimirova, T.; Dochev, D.; Bonev, K. X-ray diffraction analysis of tephra layers from Perunika Glacier, Livingston Island, Antarctica. Rev. Bulg. Geol. Soc. 2018, 79, 65–66. [Google Scholar]
  58. Roveri, M.; Manzi, V.; Bassetti, M.; Merini, M.; Ricci, F. Stratigraphy of the Messinian post-evaporitic stage in eastern-Romagna (northern Apennines, Italy). G. Geol. 1998, 60, 119–142. [Google Scholar]
  59. Roveri, M.; Lugli, S.; Manzi, V.; Schreiber, B. The Messinian salinity crisis: A sequence-stratigraphic approach. GeoActa Spec. Publ. 2008, 1, 117–138. [Google Scholar]
  60. Ricci Lucchi, F. The Oligocene to Recent Foreland Basins of the Northern Apennines; Foreland basins: Blackwell, Oxford, 1986; Volume 8, pp. 105–139. [Google Scholar]
  61. Bigi, S.; Casero, P.; Corrado, S.; Milli, S.; Moscatelli, M.; Stanzione, O. Geometric framework and thermal history of the Laga basin: Constraints for integrated basin analysis. Geophys. Res. Abstr. 2006, 8, 08484. [Google Scholar]
  62. Bigi, S.; Milli, S.; Corrado, S.; Casero, P.; Aldega, L.; Botti, F.; Moscatelli, M.; Stanzione, O.; Falcini, F.; Marini, M.; et al. Stratigraphy, structural setting and burial history of the Messinian Laga basin in the context of Apennine foreland basin system. J. Mediterr. Earth Sci. 2009, 1, 61–84. [Google Scholar] [CrossRef]
  63. Milli, S.; Moscatelli, M.; Stanzione, O.; Falcini, F. Sedimentology and physical stratigraphy of the Messinian turbidite deposits of the Laga Basin (central Apennines, Italy). Boll. Della Soc. Geol. Ital. 2007, 126, 255–281. [Google Scholar]
  64. Scisciani, V.; Montefalcone, R. Coexistence of thin- and thick-skinned tectonics: An example from the Central Apennines, Italy. Geol. Soc. Am. Spec. Pap. 2006, 114, 33–53. [Google Scholar]
  65. Cantalamessa, G.; Centamore, E.; Chiocchini, U.; Micarelli, A.; Potetti, M. Tectonic-sedimentary evolution of the northwestern part of the Laga Basin (upper Miocene-lower Pliocene, central-southern Marche). Mem. Della Soc. Geol. Ital. 1982, 24, 221–232. [Google Scholar]
  66. Bigi, S.; Calamita, F.; Cello, G.; Centamore, E.; Deiana, G.; Paltrinieri, W.; Pierantoni, P.P.; Ridolfi, M. Tectonics and sedimentation within a messinian foredeep in the central apennines, Italy. J. Pet. Geol. 1999, 22, 5–18. [Google Scholar] [CrossRef]
  67. Artoni, A. Messinian events within the tectono-stratigraphic evolution of the Southern Laga Basin (Central Apennines, Italy). Boll. Soc. Geol. Ital. 2004, 122, 447–465. [Google Scholar]
  68. Roveri, M.; Manzi, V. The Messinian salinity crisis: Looking for a new paradigm? Palaeogeogr. Palaeoclim. Palaeoecol. 2006, 238, 386–398. [Google Scholar] [CrossRef]
  69. Merico, A.; Iezzi, G.; Pace, B.; Ferranti, L.; Cremona, M.; Scafa, M.; Cavallo, A.; Colella, A.; Nazzari, M.; Scarlato, P. Grain size and grain size distribution of a lithified fault core in carbonates rocks using multi-scale image analysis: The example of the San Benedetto-Gioia dei Marsi fault (Central Italy). J. Struct. Geol. 2020, 134, 104017. [Google Scholar] [CrossRef]
  70. Prause, S.; Weisenberger, T.B.; Cappelletti, P.; Grimaldi, C.; Rispoli, C.; Jónasson, K.; Jackson, M.D.; Gudmundsson, M.T. Alteration progress within the Surtsey hydrothermal system, SW Iceland—A time-lapse petrographic study of cores drilled in 1979 and 2017. J. Volcanol. Geotherm. Res. 2020, 392, 106754. [Google Scholar] [CrossRef]
  71. Iezzi, G.; Mollo, S.; Ventura, G. Solidification behavior of natural silicate melts and volcanological implications. In Volcanoes: Formation, Eruptions and Modeling; Lewis, N., Moretti, A., Eds.; Nova Publishers: New York, NY, USA, 2009; pp. 127–151. [Google Scholar]
  72. Iezzi, G.; Della Ventura, G.; Tribaudino, M.; Nemeth, P.; Margiolaki, I.; Cavallo, A.; Gaillard, F.; Behrens, H. Phase transition induced by solid solution: The BCa-BMg substitution in richteritic amphiboles. Am. Miner. 2010, 95, 369–381. [Google Scholar] [CrossRef]
  73. Iezzi, G.; Caso, C.; Ventura, G.; Vallefuoco, M.; Cavallo, A.; Behrens, H.; Mollo, S.; Paltrinieri, D.; Signanini, P.; Vetere, F. First documented deep submarine explosive eruptions at the Marsili Seamount (Tyrrhenian Sea, Italy): A case of historical volcanism in the Mediterranean Sea. Gondwana Res. 2014, 25, 764–774. [Google Scholar] [CrossRef]
  74. Iezzi, G.; Lanzafame, G.; Mancini, L.; Behrens, H.; Tamburrino, S.; Vallefuoco, M.; Passaro, S.; Signanini, P.; Ventura, G. Deep sea explosive eruptions may be not so different from subaerial eruptions. Sci. Rep. 2020, 10, 6709. [Google Scholar] [CrossRef] [Green Version]
  75. Lanzafame, G.; Iezzi, G.; Mancini, L.; Lezzi, F.; Mollo, S.; Ferlito, C. Solidification and Turbulence (Non-laminar) during Magma Ascent: Insights from 2D and 3D Analyses of Bubbles and Minerals in an Etnean Dyke. J. Pet. 2017, 58, 1511–1533. [Google Scholar] [CrossRef]
  76. Vetere, F.; Iezzi, G.; Behrens, H.; Holtz, F.; Ventura, G.; Misiti, V.; Cavallo, A.; Mollo, S.; Dietrich, M. Glass forming ability and crystallisation behaviour of sub-alkaline silicate melts. Earth-Sci. Rev. 2015, 150, 25–44. [Google Scholar] [CrossRef]
  77. White, J.D.L.; Houghton, B.F. Primary volcaniclastic rocks. Geology 2006, 34, 677–680. [Google Scholar] [CrossRef]
  78. Lanzafame, G.; Mollo, S.; Iezzi, G.; Ferlito, C.; Ventura, G. Unraveling the solidification path of a pahoehoe “cicirara” lava from Mount Etna volcano. Bull. Volcanol. 2013, 75, 703. [Google Scholar] [CrossRef]
  79. Liu, E.J.; Cashman, K.V.; Rust, A.C. Optimising shape analysis to quantify volcanic ash morphology. GeoResJ 2015, 8, 14–30. [Google Scholar] [CrossRef] [Green Version]
  80. Baiyegunhi, C.; Liu, K.; Gwavava, O. Grain size statistics and depositional pattern of the Ecca Group sandstones, Karoo Supergroup in the Eastern Cape Province, South Africa. Open Geosci. 2017, 9, 554–576. [Google Scholar] [CrossRef]
  81. Shoji, D.; Noguchi, R.; Otsuki, S.; Hino, H. Classification of volcanic ash particles using a convolutional neural network and probability. Sci. Rep. 2018, 8, 8111. [Google Scholar] [CrossRef]
  82. Wohletz, K.H. Mechanisms of hydrovolcanic pyroclast formation: Grain-size, scanning electron microscopy, and experimental studies. J. Volcanol. Geotherm. Res. 1983, 17, 31–63. [Google Scholar] [CrossRef]
  83. Andrews, J.T.; Kristjansdottir, G.B.; Eberl, D.D.; Jennings, A.E. A quantitative x-ray diffraction inventory of volcaniclastic inputs into the marine sediment archives off Iceland: A contribution to the Volcanoes in the Arctic System programme. Polar Res. 2013, 32. [Google Scholar] [CrossRef] [Green Version]
  84. Cersoy, S.; Martinetto, P.; Bordet, P.; Hodeau, J.L.; Van Elslande, E.; Walter, P. Identifying and quantifying amorphous and crystalline content in complex powdered samples: Application to archaeological carbon blacks. J. Appl. Crystallogr. 2016, 49, 585–593. [Google Scholar] [CrossRef]
  85. Cullity, B.D.; Stock, S.R. Elements of X-Ray Diffraction, 3rd ed.; Pearson Education Limited, Edinburgh Gate, Harlow: Essex, UK, 2014. [Google Scholar]
  86. Le Maitre, R.W.; Streckeisen, A.; Zanettin, B.; Le Bas, M.J.; Bonin, B.; Bateman, P.; Bellieni, G.; Dudek, A.; Efremova, S.; Keller, J.; et al. Igneous Rocks: A Classification and Glossary of Terms, Recommendations of the International Union of Geological Sciences, Subcommission of the Systematics of Igneous Rock; Cambridge University Press: Cambridge, UK, 2002; ISBN 0-521-66215-X. [Google Scholar]
  87. Clemens, J.D.; Stevens, G.; Mayne, M.J. Do arc silicic magmas form by fluid-fluxed melting of older arc crust or fractionation of basaltic magmas? Contrib. Miner. Pet. 2021, 176, 44. [Google Scholar] [CrossRef]
  88. Pearce, J.A.; Harris, N.B.W.; Tindle, A.G. Trace Element Discrimination Diagrams for the Tectonic Interpretation of Granitic Rocks. J. Pet. 1984, 25, 956–983. [Google Scholar] [CrossRef] [Green Version]
  89. Seligman, A.N.; Bindeman, I.N.; Watkins, J.M.; Ross, A.M. Water in volcanic glass: From volcanic degassing to secondary hydration. Geochim. Cosmochim. Acta 2016, 191, 216–238. [Google Scholar] [CrossRef] [Green Version]
  90. Corradino, C.; Pious, A.; Amato, E.; Torrisi, F.; Bucolo, M.; Fortuna, L.; Del Negro, C. Assessing the elements at risk in volcanic areas by combining deep convolutional neural network and multispectral satellite images. In Proceedings of the EGU General Assembly 2022, Vienna, Austria, 23–27 May 2022. EGU22-4568. [Google Scholar] [CrossRef]
  91. Derkachev, A.N.; Ponomareva, V.V.; Portnyagin, M.V.; Gorbarenko, S.A.; Nikolaeva, N.A.; Malakhov, M.I.; Zelenin, E.A.; Nürnberg, D.; Liu, Y. Widespread tephra layers in the Bering Sea sediments: Distal clues to large explosive eruptions from the Aleutian volcanic arc. Bull. Volcanol. 2018, 80, 80. [Google Scholar] [CrossRef]
  92. Longman, J.; Palmer, M.R.; Gernon, T.M.; Manners, H.R. The role of tephra in enhancing organic carbon preservation in marine sediments. Earth-Science Rev. 2019, 192, 480–490. [Google Scholar] [CrossRef]
  93. Cuadros, J.; Caballero, E.; Huertas, F.; Vencelá, C.; Huertas, F.; Linares, J. Experimental alteration of volcanic tuff: Smectite formation and effect on 18O isotope composition. Clays Clay Miner. 1999, 47, 769–776. [Google Scholar] [CrossRef]
  94. Fisk, M.; McLoughlin, N. Atlas of alteration textures in volcanic glass from the ocean basins. Geosphere 2013, 9, 317–341. [Google Scholar] [CrossRef] [Green Version]
  95. Deer, W.A.; Howie, R.A.; Zussman, J. An Introduction to the Rock-Forming Minerals, 3rd ed.; Longman Scientific & Technical: Harlow, UK; New York, NY, USA, 1992. [Google Scholar]
  96. Pauly, B.D.; Schiffman, P.; Zierenberg, R.; Clague, D.A.; Schiffman, P. Environmental and chemical controls on palagonitization. Geochem. Geophys. Geosyst. 2011, 12. [Google Scholar] [CrossRef]
  97. Bouma, A.H. Sedimentology of Some Flysch Deposits; Elsevier: Amsterdam, The Netherlands, 1962. [Google Scholar]
  98. Mutti, E.; Normark, W.R. An Integrated Approach to the Study of Turbidite Systems. In Seismic Facies and Sedimentary Processes of Submarine Fans and Turbidite Systems. Frontiers in Sedimentary Geology; Weimer, P., Link, M.H., Eds.; Springer: New York, NY, USA, 1991. [Google Scholar] [CrossRef]
  99. Buckland, H.M.; Saxby, J.; Roche, M.; Meredith, P.; Rust, A.C.; Cashman, K.V.; Engwell, S.L. Measuring the size of non-spherical particles and the implications for grain size analysis in volcanology. J. Volcanol. Geotherm. Res. 2021, 415, 107257. [Google Scholar] [CrossRef]
  100. Hentschel, M.L.; Page, N.W. Selection of Descriptors for Particle Shape Characterization. Part. Part. Syst. Charact. 2003, 20, 25–38. [Google Scholar] [CrossRef]
  101. Mikli, V.; Kaerdi, H.; Kulu, P.; Besterci, M. Characterization of powder particle mor- phology. Proc. Eston Acad Sci. Eng. 2001, 1, 22–34. [Google Scholar]
Figure 1. (a) Location of the samples of the VRL-5.5 deposits from previous studies (Table S2) and the Camporotondo section (CR) investigated in this study (Table S1). (b) Schematic structural model of Abruzzo-Marche area (dashed rectangle in a) with the principal sedimentary units and tectonic elements. (c) Representative stratigraphic columns of the Messinian post-evaporitic deposit in the Marche area. From North to South: (1) Maccarone (Potenza-Esino sector), (2) Camporotondo (Fiastrella-Potenza sector) and (3) Force (Aso-Fiastrella sector). The acronyms are: A Amandola; B Bisenti; C Campea; CA Calcinelli; CAC Castiglione a’ Casauria; CG Colle Gallo; CM Casteldimezzo; CR Camporotondo; CV Civitella del Tronto; M Maccarone; P Piavola; SQ Serredi quarry; SM Santamarina; SVT San Vittorino.
Minerals 12 00893 g001
Figure 2. Stratigraphy of the CR section (Camporotondo di Fiastrone, see Figure 1 for location) with the position of the collected oriented samples (centre) used to prepare the mesoscopic and microscopic polished and coaxial to the field samples (left and right); black rectangles indicate the positions of the oriented thin sections (displayed in Figure 3). The red and blue bars correspond to 1 and 10 cm, respectively. White numbers are samples labels, as reported in Table S1.
Minerals 12 00893 g002
Figure 3. (left column) Camporotondo (CR) polished thin sections (black rectangles in Figure 2) with representative BS-SEM microphotographs (200× in middle and 400× in right columns), showing the salient textural features. Red and black bars are 1 cm and 50 µm, respectively. Blue arrow (cb) and red arrow (gl) indicates carbonates and glassy components. The glass shards show blocky shapes with some curvilinear edges corresponding to bubble walls and rare pumice-like shapes.
Minerals 12 00893 g003
Figure 4. Textural features of glassy ash grains (dark grey), carbonates (light grey phases in CR-2-top, CR-5, CR-7 samples) and rare crystals (light grey to white in CR-9) imaged by BS-SEM at different magnification. Red bars are for 50 μm.
Minerals 12 00893 g004
Figure 5. Stacked XRPD patterns as a function of stratigraphy of the CR section. The coloured vertical lines correspond to crystalline standards from the ICSD database. These XRPD spectra are characterised by a large and relatively low-intense bulge around 18° and 32° of 2θ, indicative of a non-crystalline phase. Recognised crystalline phase are anorthite (AN), biotite (BT), calcite (CLC), montmorillonite (MNT), quartz (QZ) and sanidine (SND).
Minerals 12 00893 g005
Figure 6. (top) Relationships between bulk SiO2 vs. CaO and CO2 (Table S3), plus their linear regressions. (middle) Variations of bulk contents of S, CO2, H2O, H2O+ and LOI (Table S3). (bottom) Differences respect to 100 wt.% of oxide total amount determined by EPMA (Table S5) compared with bulk determinations of H2O+ (Table S3).
Minerals 12 00893 g006
Figure 7. TAS classifications (up) and SiO2 vs. other major oxides (down) of the VRL5.5 glasses measured with EPMA (from the recalculated on a dry basis data in Table S6). All the data from this (empty squares) and previous studies (empty stars) are clustered in limited compositional domains, except few samples.
Minerals 12 00893 g007
Figure 8. Immobile trace elements proxies for tectonic interpretation of high-silica-content rocks (modified from 74) (from data in Table S4). All axes are logarithmic.
Minerals 12 00893 g008
Figure 9. Abundance of glasses, carbonates and crystal phases, calculated by image analysis on 3 representative BS-SEM microphotographs per thin section at a magnification of 100×.
Minerals 12 00893 g009
Figure 10. (top) 2D grain sizes versus cumulative area%, where the major axis corresponds to the major axes (µm) of equal-area ellipses quantified by image analysis on BS-SEM microphotographs (Figure S4) at a magnification of 200×. (bottom) 2D grain-size parameters (see Table S7).
Minerals 12 00893 g010
Figure 11. (a) major vs. minor axes (log scale) of all equal-area ellipses of glass shards; (b) major axis frequency distribution divided in 9 classes every 10 µm; (c) aspect ratio frequency distribution divided in 9 classes; (d) 2D angular frequency distribution of major axis considering 12 classes, every 15°; (e) roundness frequency distribution divided in 7 classes, every 5 plus one of 2; (f) roundness frequency comparison from the Grímsvötn-2011 fallout, sample G6 (60 kms from the vent) in 59. All parameters are quantified by image analysis on BS-SEM images at 200×.
Minerals 12 00893 g011
Publisher’s Note: MDPI stays neutral with regard to jurisdictional claims in published maps and institutional affiliations.

