
The Effect of Mn Substitution on Natural Sphalerites by Means of Raman Spectroscopy: A Case Study of the Săcărâmb Au–Ag–Te Ore Deposit, Apuseni Mountains, Romania


Abstract
:1. Introduction
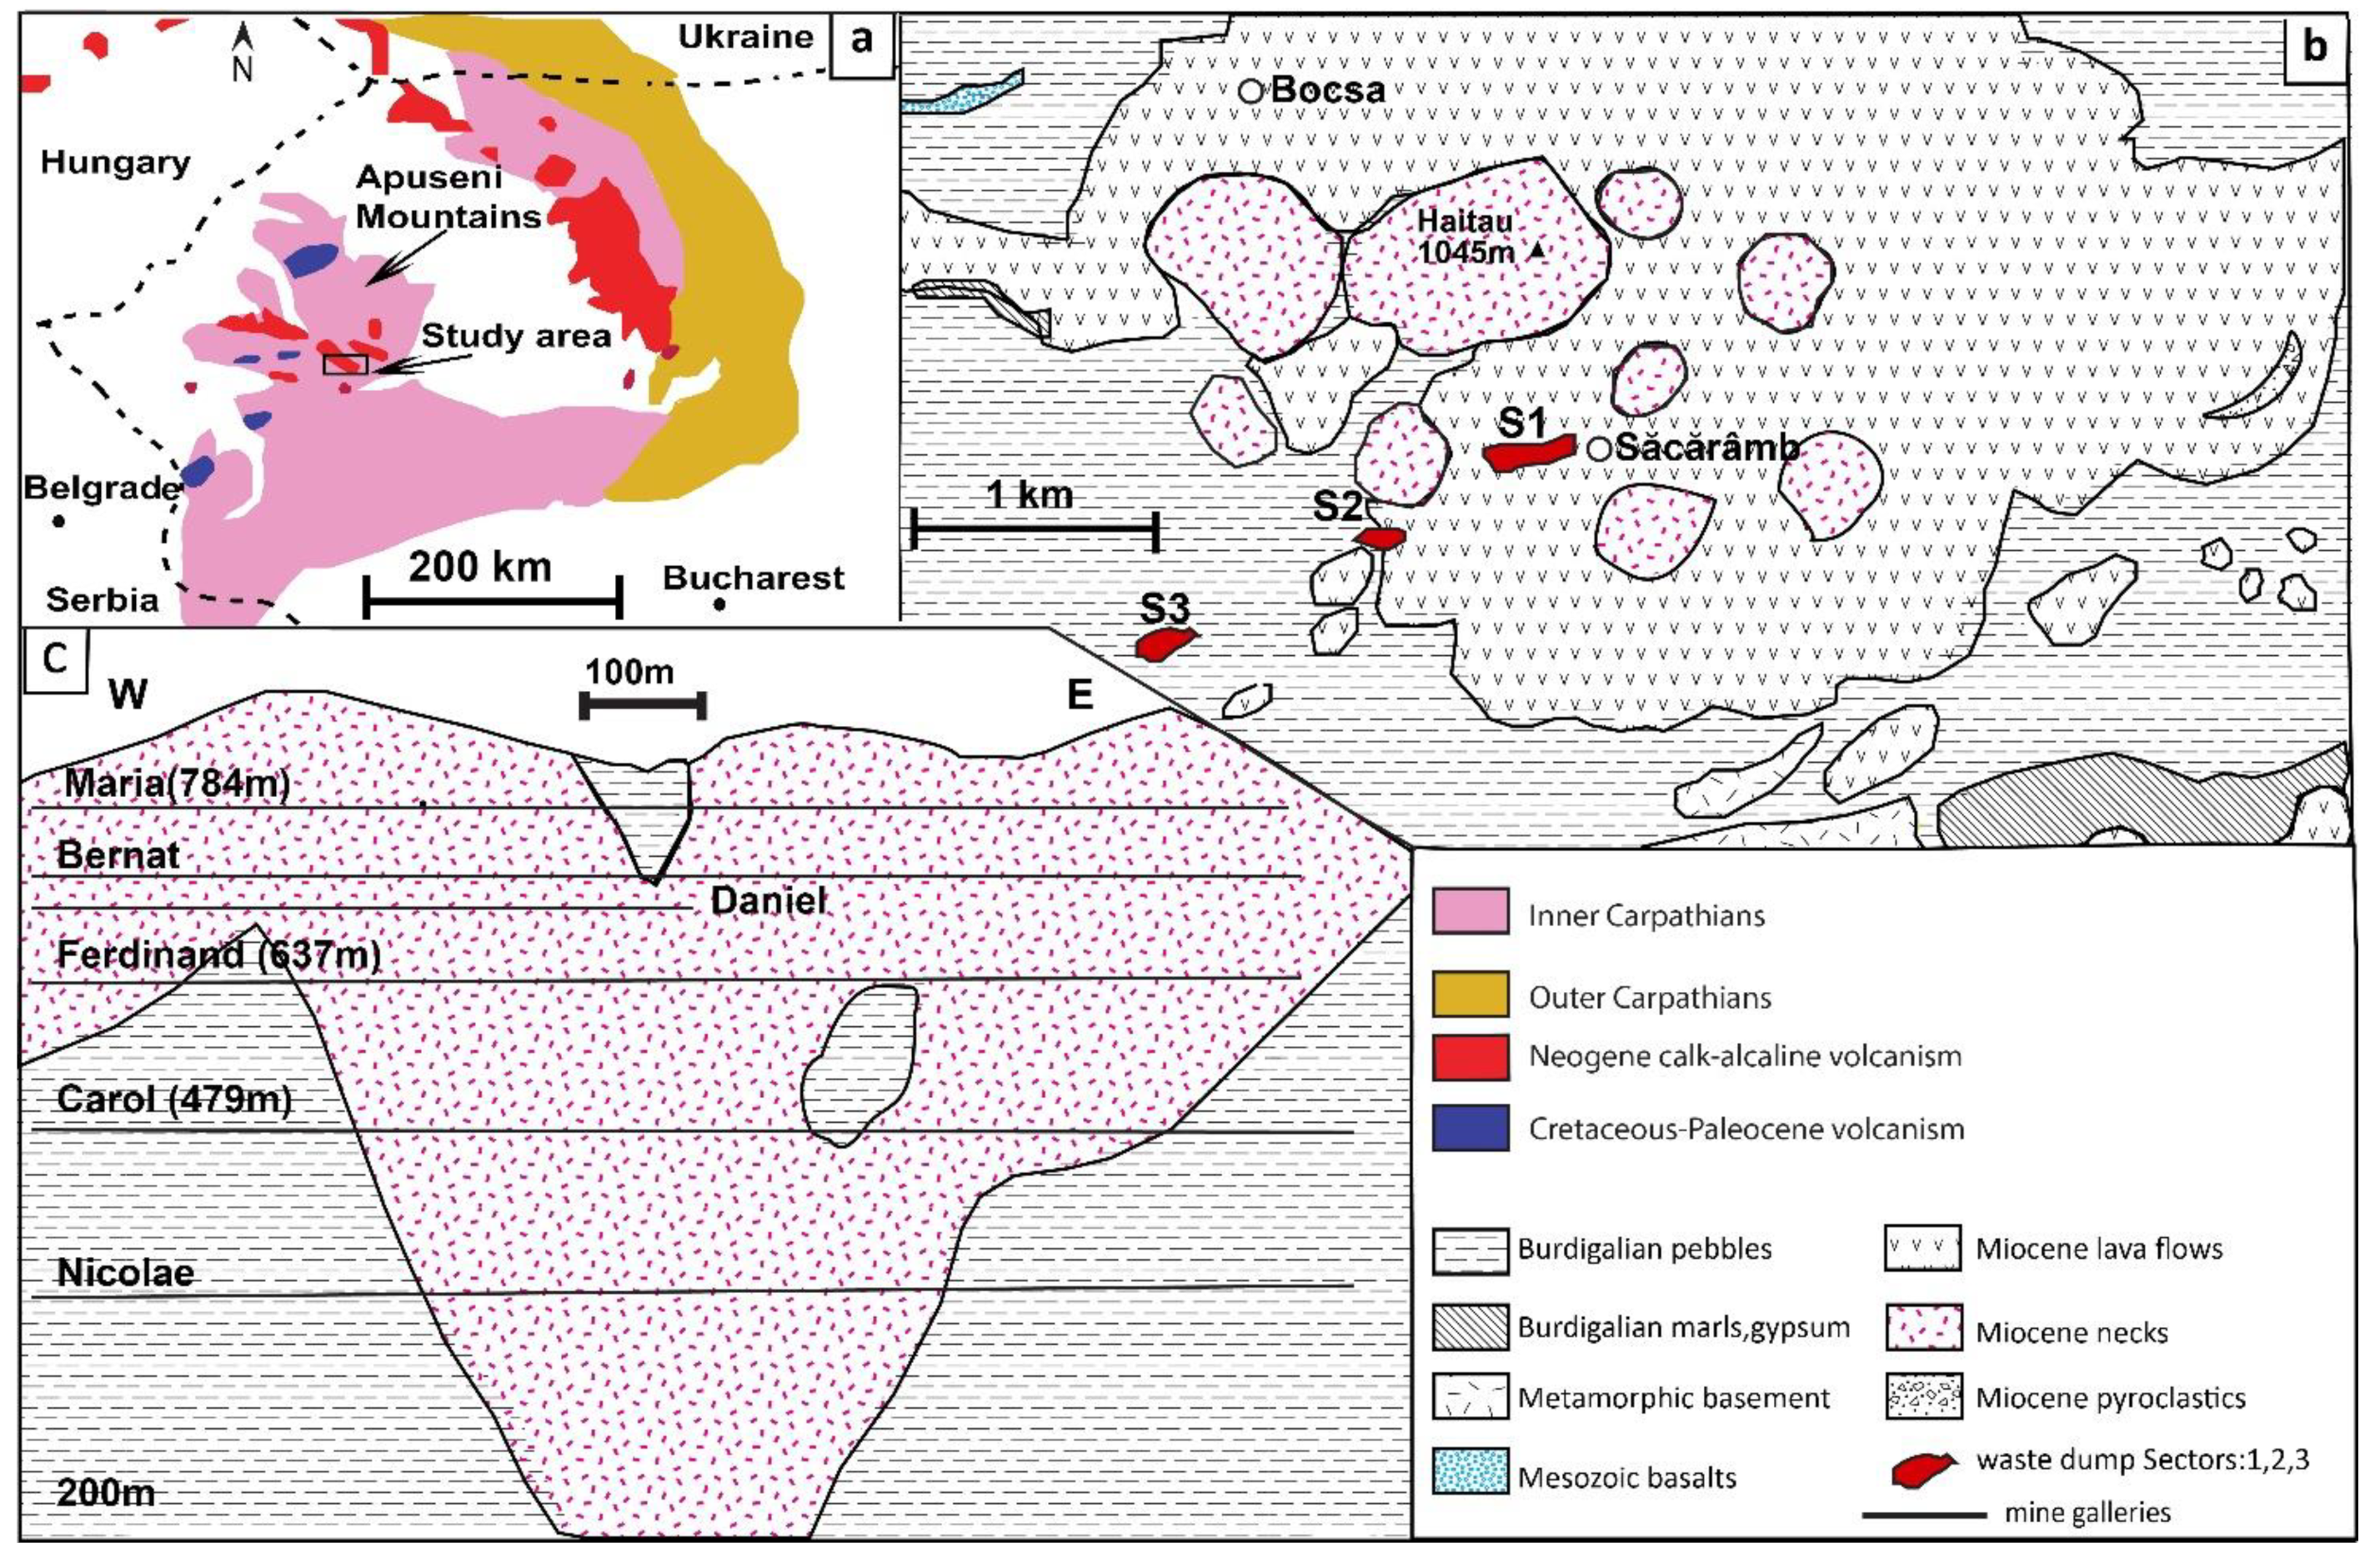
2. Geological Setting
3. Materials and Methods
4. Results
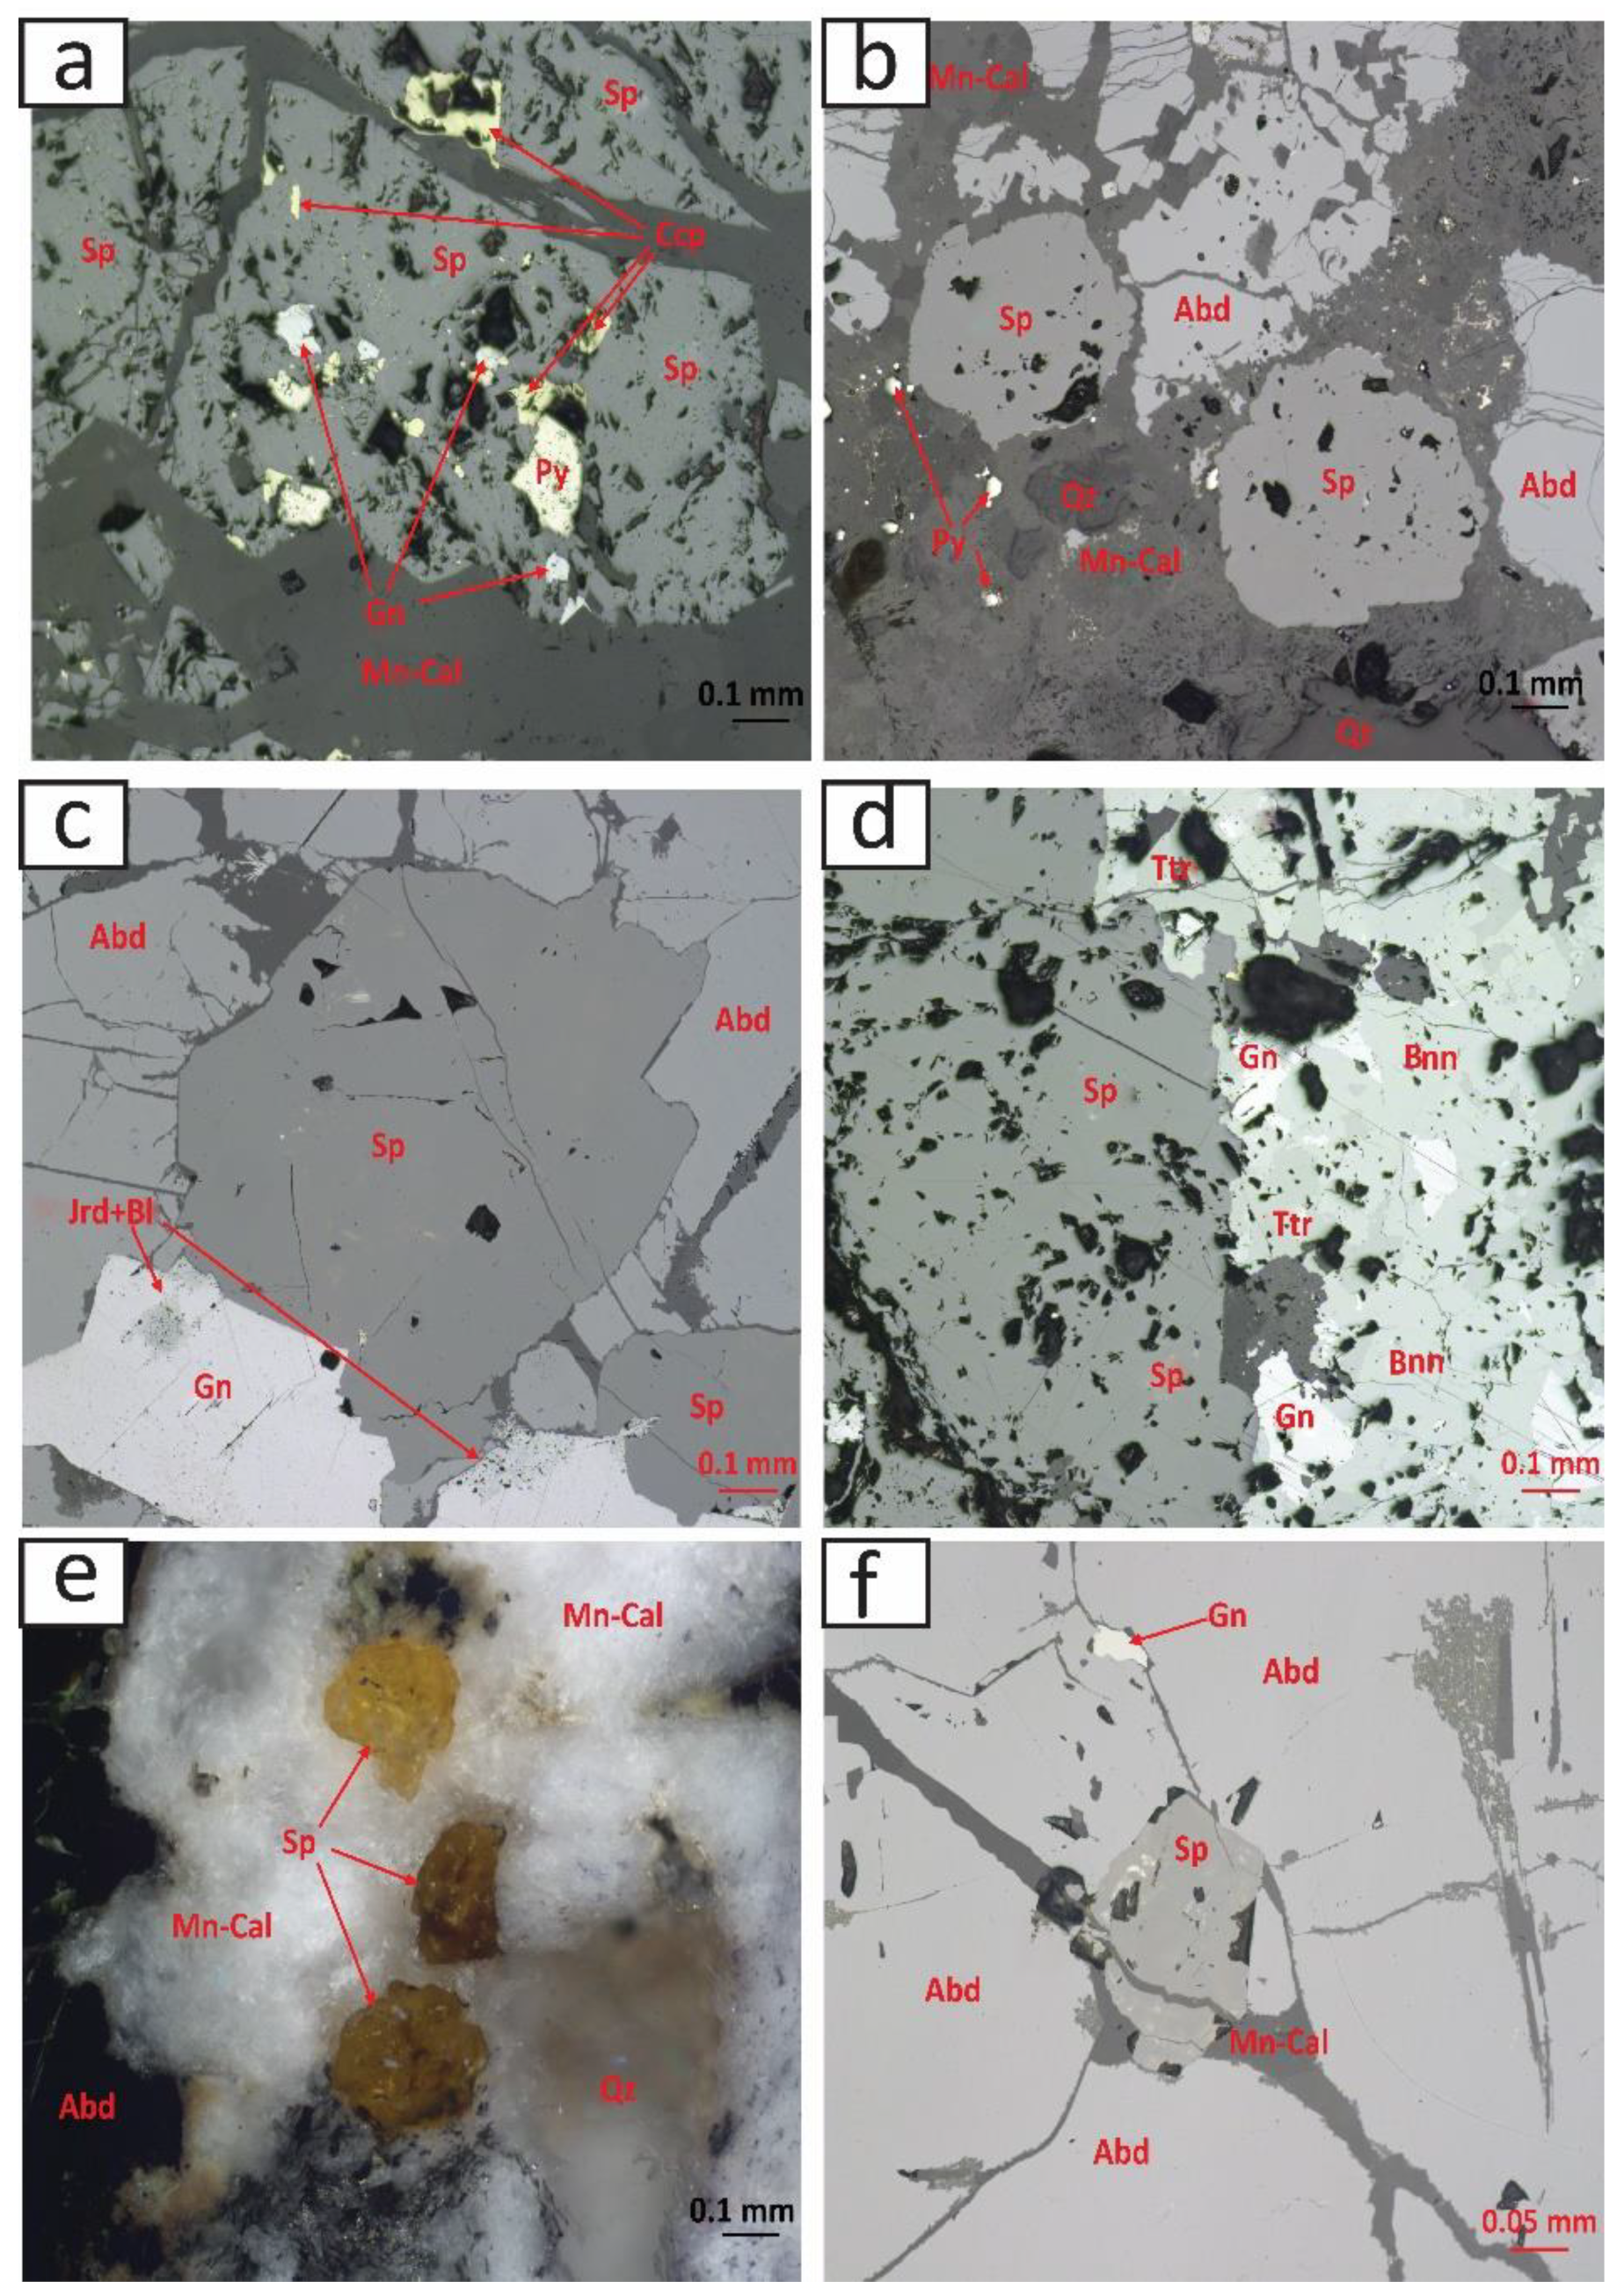
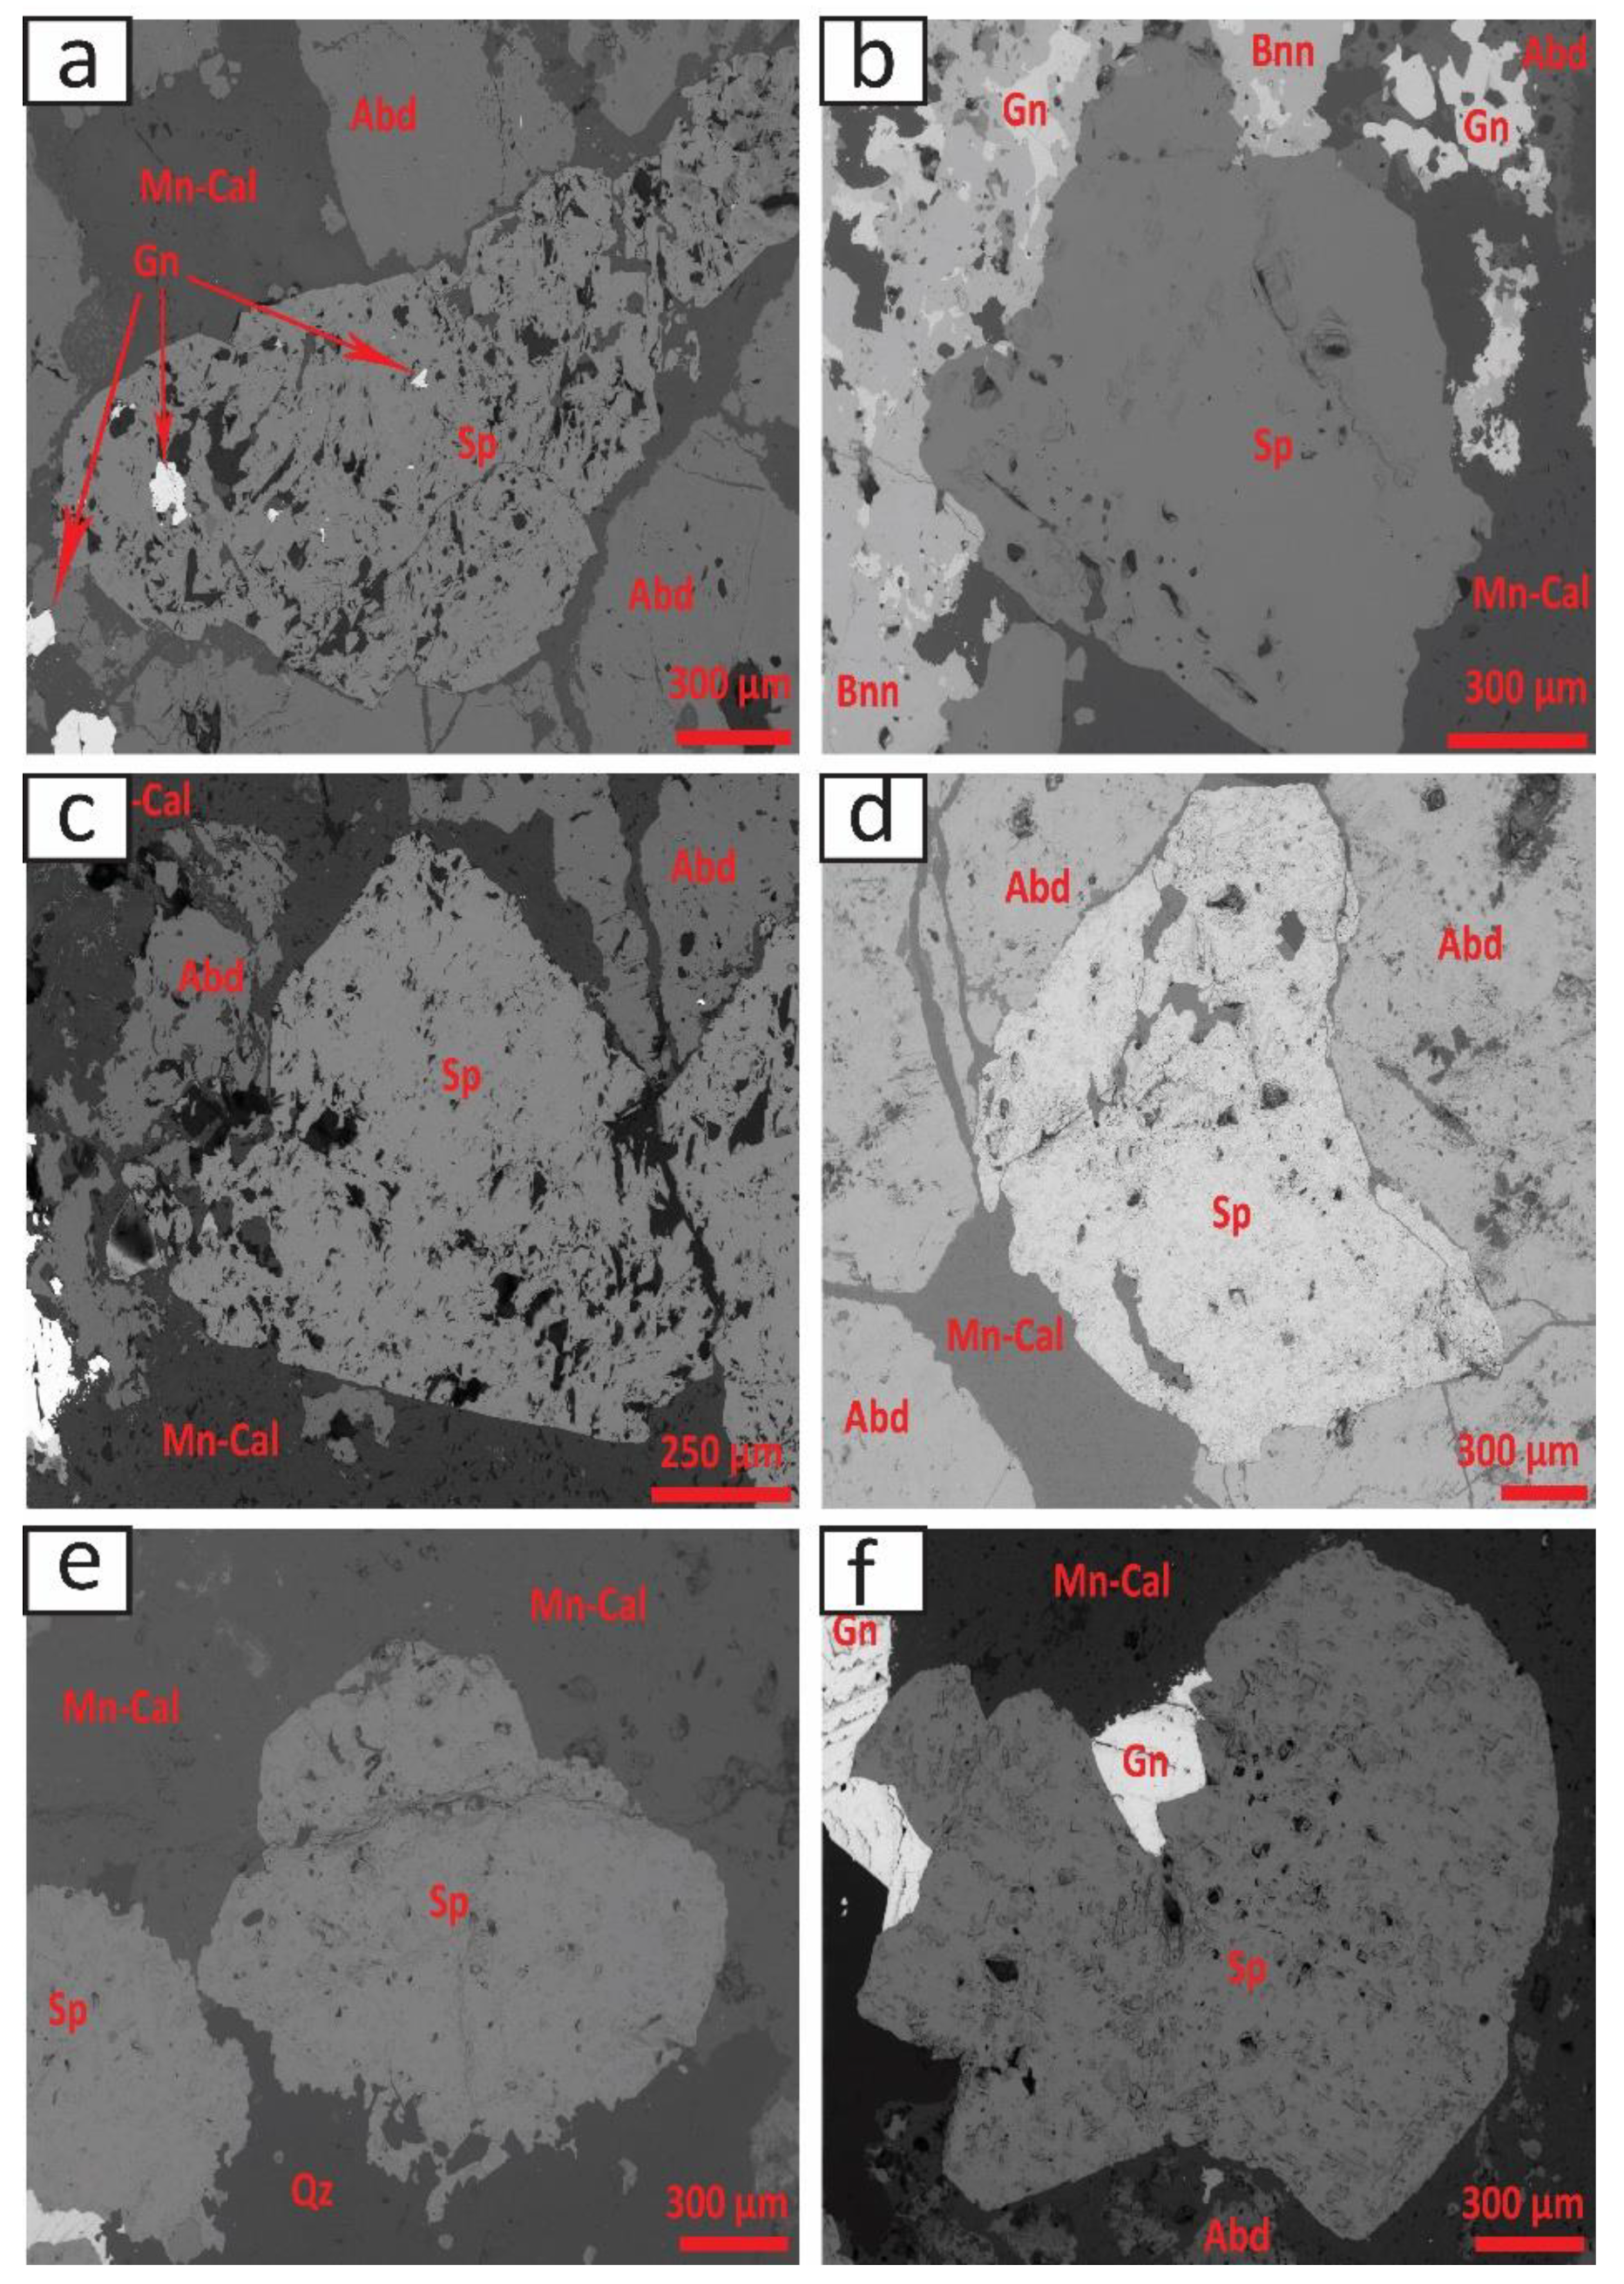
4.1. Mineral Paragenesis and Chemistry of Sphalerite
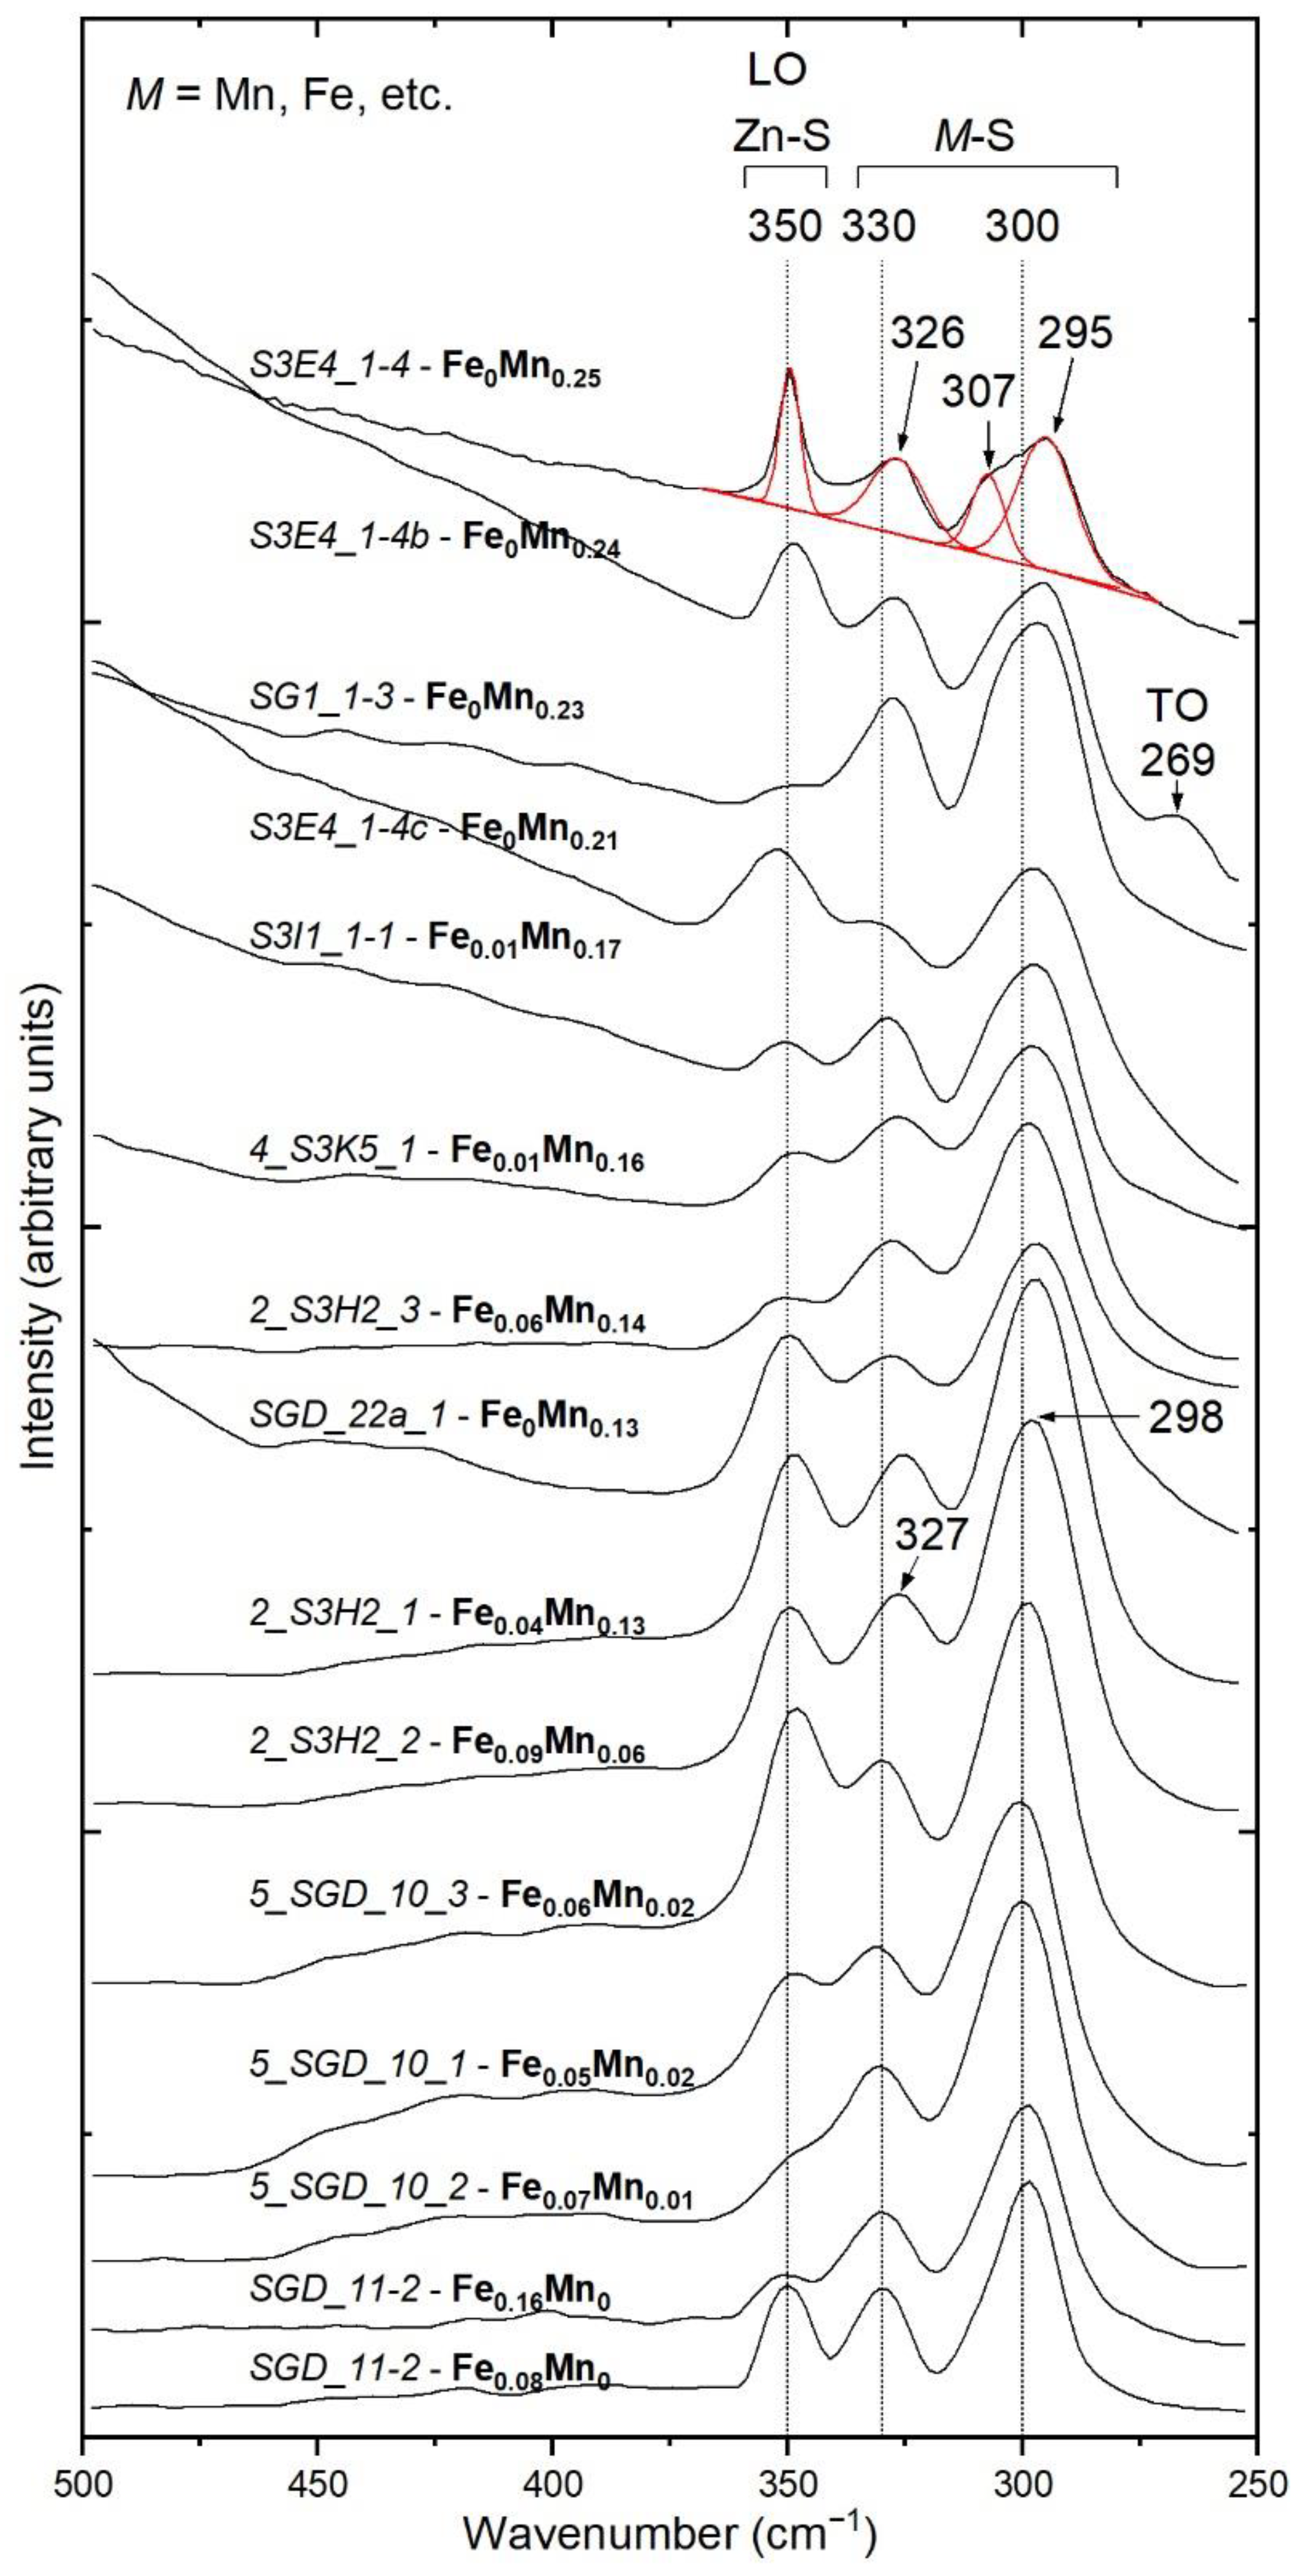
4.2. Raman Spectroscopy and Band Assignments
5. Discussion
5.1. Vibrational Characteristics of Mn-Substituted Sphalerite
5.2. Implications for Metallogenesis of the Săcărâmb Ore Deposit
- Stage I is a high-temperature stage between 400 and 500 °C, dominated by common sulfides disseminated in the altered andesitic neck.
- Stage II is characterized by temperatures between 350 and 400 °C; it is a more complex stage with the presence of sulfosalts and the development of vein systems,
- Stage III is a Mn-rich stage; it is considered the main ore formation stage with temperatures between 200 and 300 °C, and alabandite as the main sulfide mineral, forming veins of up to 10 cm in diameter. In this stage, sphalerite crystals with the highest Mn content were identified.
- Stage IV is a telluride- and sulfosalt-rich stage with lower temperatures between 150 and 230 °C, as presented by Dincă [20]. Sphalerite in this stage has a high Mn concentration as in stage III; however, Fe and Cd are present in the composition.
- Stage V, the oxide and As-Sb stage, is the final mineralization stage in which glauch-type ore is present with Mn oxides, realgar, orpiment, stibnite, and native Au. The formation temperature is between 100 and 150 °C.
6. Conclusions
- Natural sphalerites of (M = Mn, Fe), where x is in the range of 0.07 ≤ x ≤ 0.25, were analyzed by means of SEM-EDS and Raman spectroscopy. The sphalerite samples contain an extensive amount of Mn (between 0 and 14.10 wt.%), which is the largest concentration of Mn in sphalerites from Romanian territory.
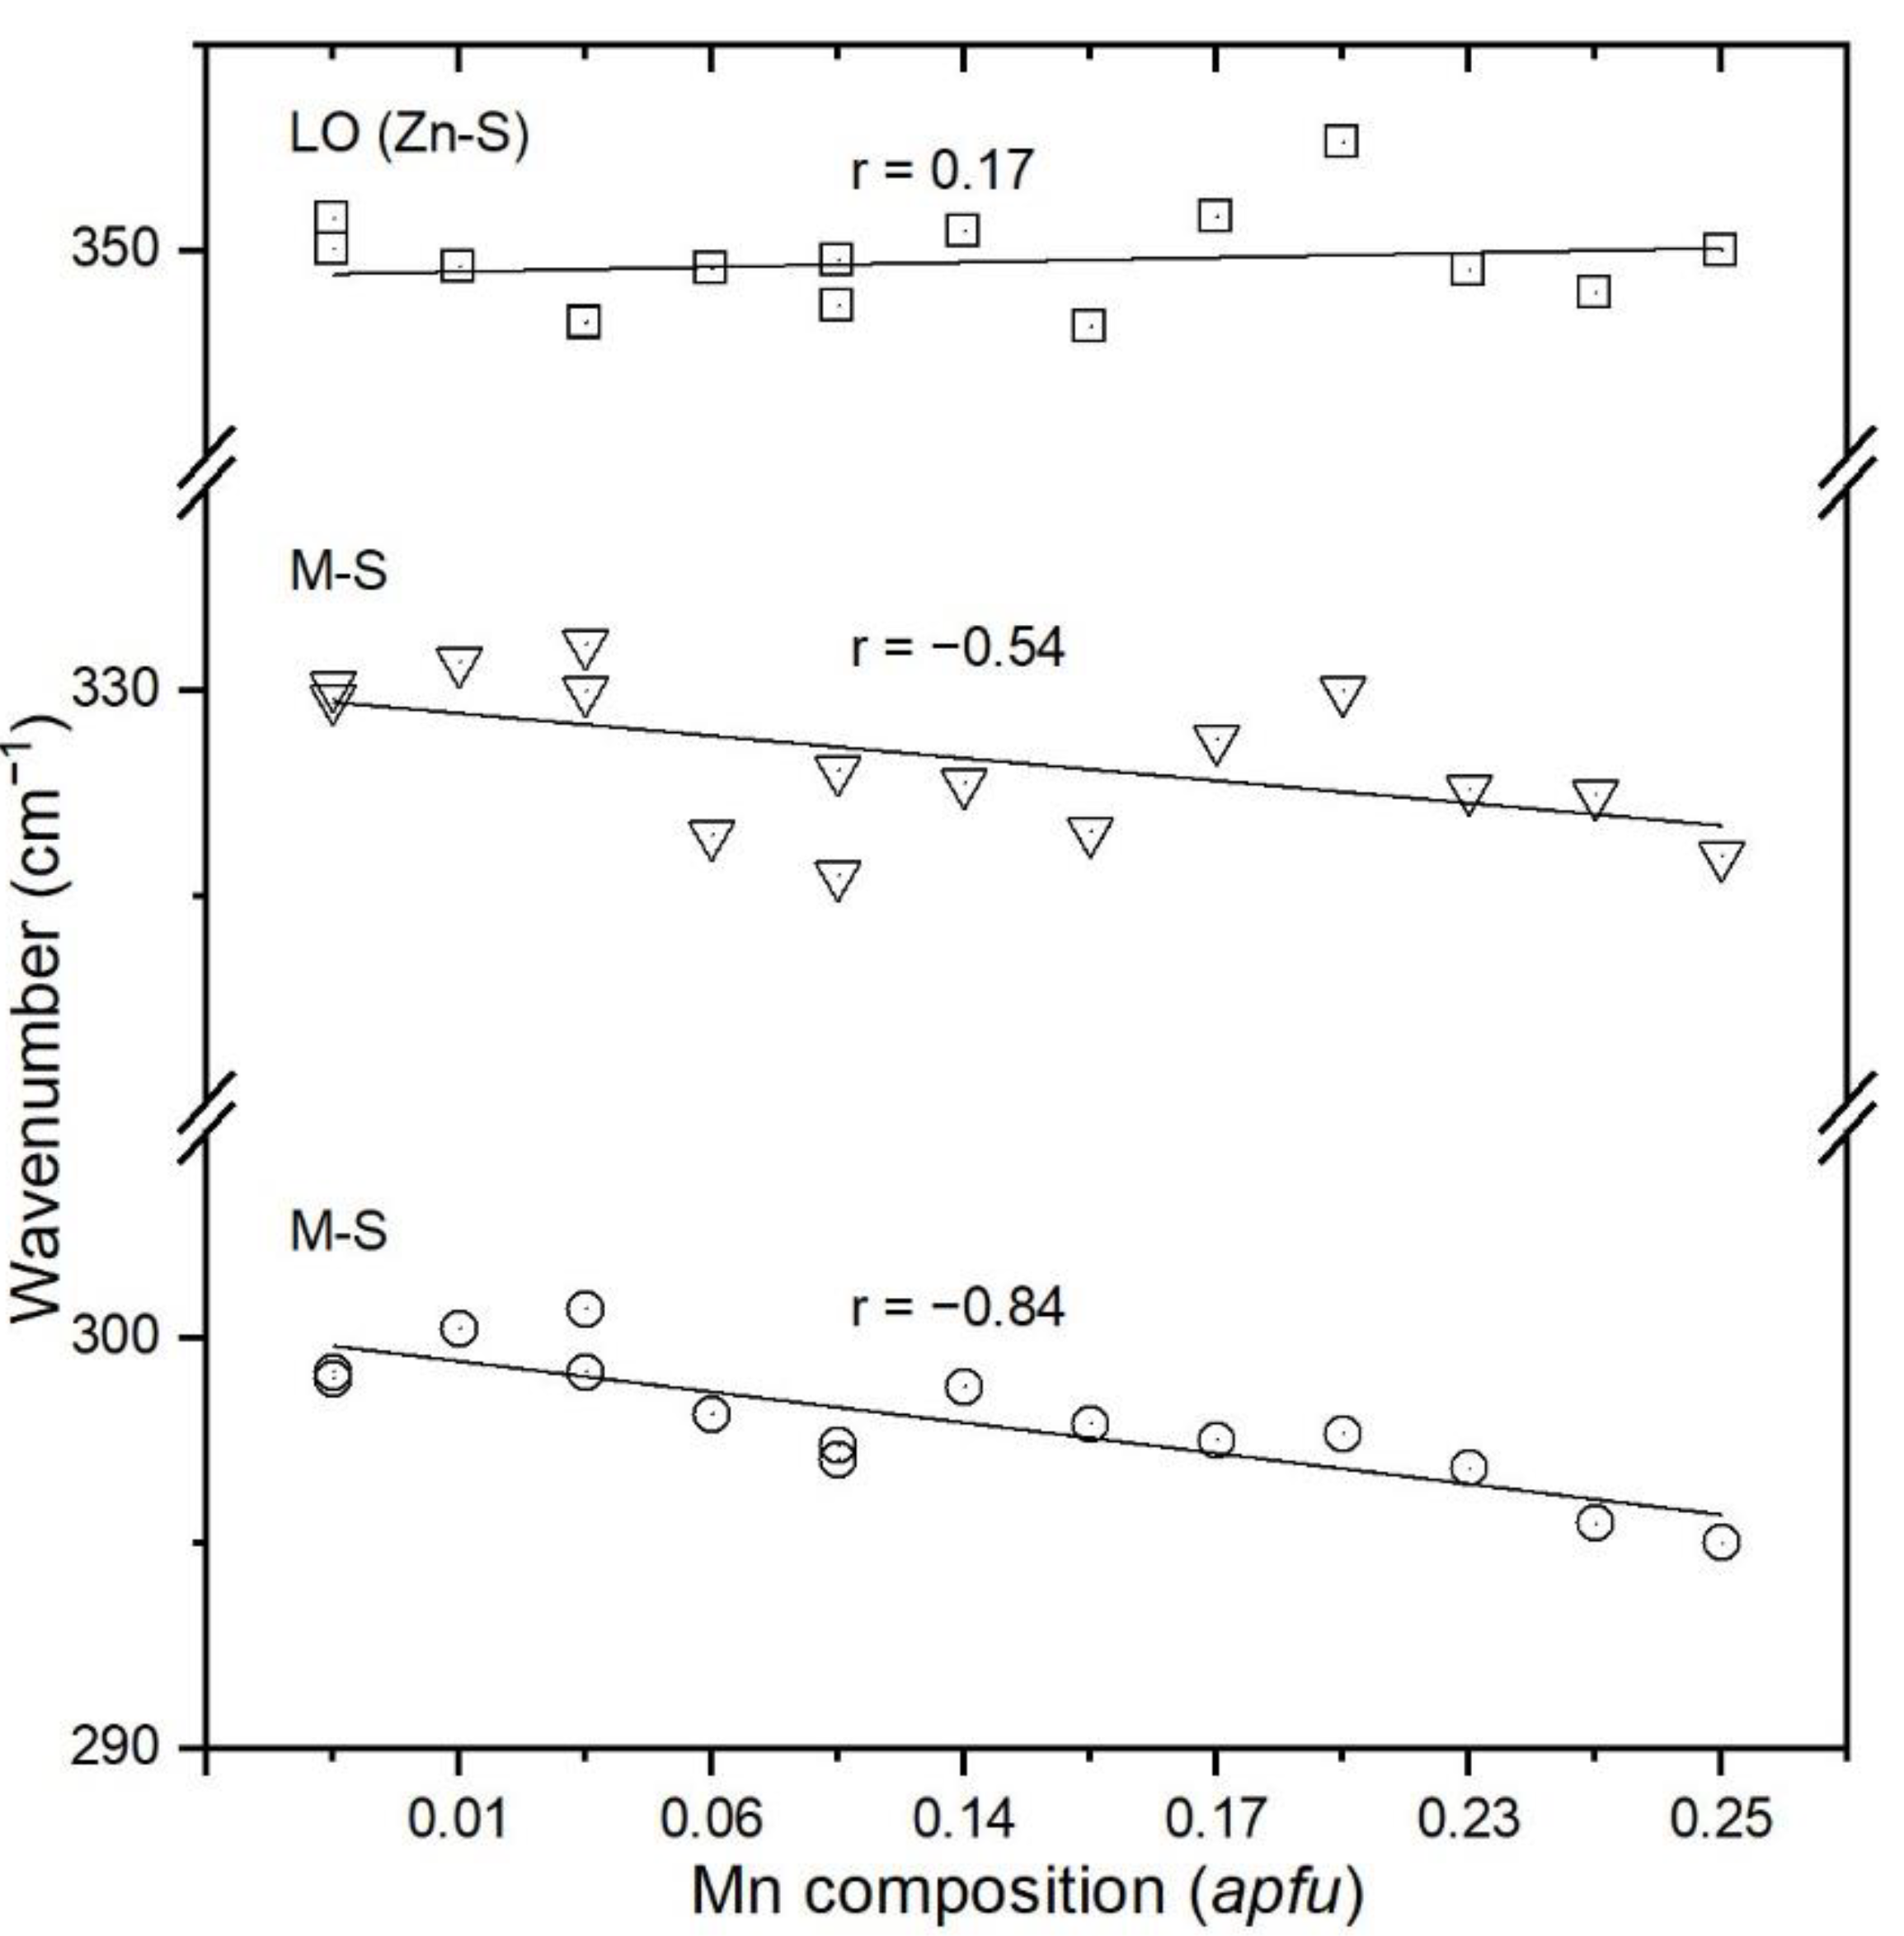
- New Raman spectra of natural Mn-rich sphalerites are presented for the first time. The results obtained in the present study provide Mn estimation by determining the positions of the 330 and 300 cm−1 Raman bands. Accordingly, two linear equations were obtained. In this regard, the present study has revealed the usefulness of Raman spectroscopy for (semi)quantitative measurements of Mn concentration in natural sphalerites.
- This systematic peak-position shift towards lower wavenumbers with increasing Mn content is mainly linked to the smaller ionic radius of Mn2+ and polyhedral distortions in tetrahedral sites (MnS4) where the symmetry reduces from Td to D2d.
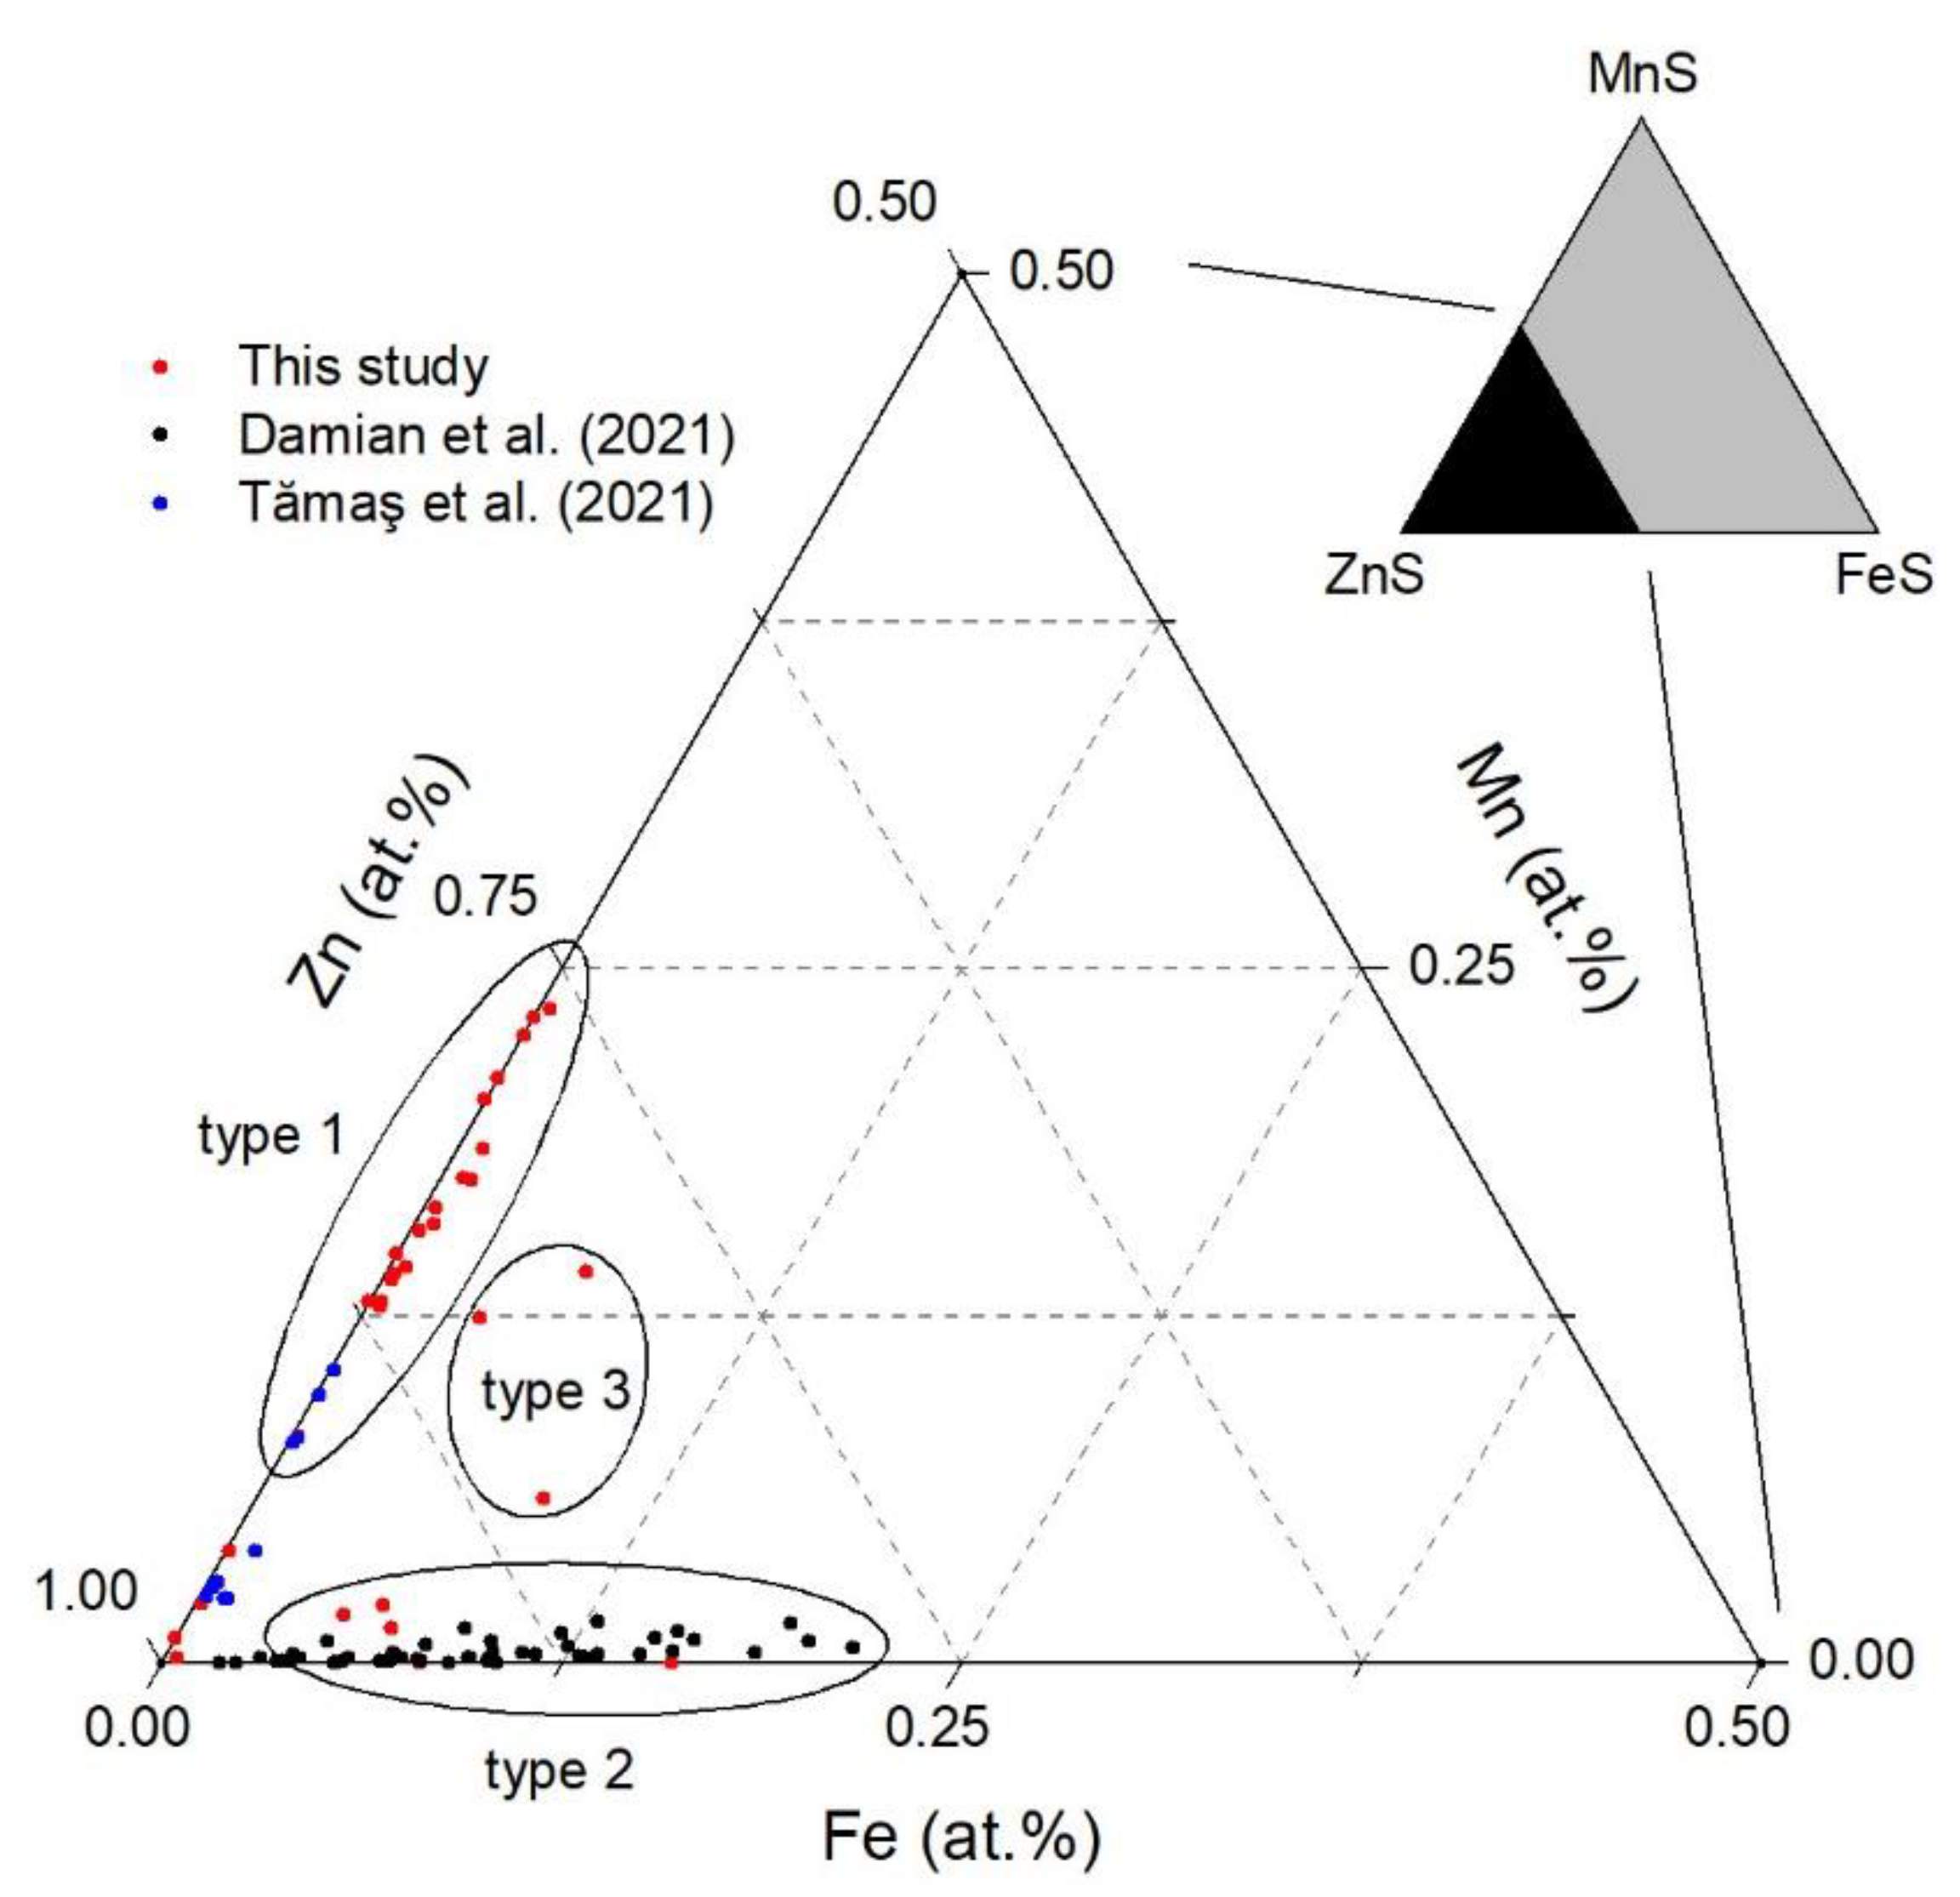
- In this study, three genetic types of sphalerites were identified: from ferroan to manganoferroan , as well as mangan-rich compositions.
- Mn-sphalerites are strongly connected to the presence of alabandite in mineralized assemblages.
- The formation of several types of sphalerites in the Săcărâmb Au–Ag–Te ore deposit was caused by the succession of different types of hydrothermal fluids and the interaction between the fluids and the host material (host rocks and earlier mineralized stages).
Author Contributions
Funding
Data Availability Statement
Acknowledgments
Conflicts of Interest
References
- Cook, N.J.; Ciobanu, C.L.; Pring, A.; Skinner, W.; Shimizu, M.; Danyushevsky, L.; Saini-Eidukat, B.; Melcher, F. Trace and minor elements in sphalerite: A LA-ICPMS study. Geochim. Cosmochim. Acta 2009, 73, 4761–4791. [Google Scholar] [CrossRef]
- Pring, A.; Wade, B.; McFadden, A.; Lenehan, C.E.; Cook, N.J. Coupled Substitutions of Minor and Trace Elements in Co-Existing Sphalerite and Wurtzite. Minerals 2020, 10, 147. [Google Scholar] [CrossRef] [Green Version]
- Scott, S.D. Experimental Calibration of the Sphalerite Geobarometer. Econ. Geol. 1973, 68, 466–474. [Google Scholar] [CrossRef]
- D’Amico, P.; Calzolari, A.; Ruini, A.; Catellani, A. New energy with ZnS: Novel applications for a standard transparent compound. Sci. Rep. 2017, 7, 16805. [Google Scholar] [CrossRef]
- Voigt, D.; Sarpong, L.; Bredol, M. Tuning the Optical Band Gap of Semiconductor Nanocomposites-A Case Study with ZnS/Carbon. Materials 2020, 13, 4162. [Google Scholar] [CrossRef] [PubMed]
- Zigone, M.; Vandevyver, M.; Talwar, D.N. Raman scattering and local force variations due to transition-element impurities in zinc-sulfide crystals: Effect of pressure application. Phys. Rev. B 1981, 24, 5763. [Google Scholar] [CrossRef]
- Hope, G.A.; Woods, R.; Munce, C.G. Raman microprobe mineral identification. Miner. Eng. 2001, 14, 1565–1577. [Google Scholar] [CrossRef]
- Kharbish, S. A Raman spectroscopic investigation of Fe-rich sphalerite: Effect of fe-substitution. Phys. Chem. Miner. 2007, 34, 551–558. [Google Scholar] [CrossRef]
- Buzatu, A.; Buzgar, N.; Damian, G.; Vasilache, V.; Apopei, A.I. The determination of the Fe content in natural sphalerites by means of Raman spectroscopy. Vib. Spectrosc. 2013, 68, 220–224. [Google Scholar] [CrossRef]
- Jiménez-Sandoval, S.; López-Rivera, A.; Irwin, J.C. Influence of reduced mass differences on the Raman spectra of ternary mixed compounds:Zn1−xFexSandZn1−xMnxS. Phys. Rev. B 2003, 68, 054303. [Google Scholar] [CrossRef]
- Babedi, L.; von der Heyden, B.P.; Neethling, P.H.; Tadie, M. The effect of Cd-substitution on the Raman vibrational characteristics of sphalerite. Vib. Spectrosc. 2019, 105, 102968. [Google Scholar] [CrossRef]
- Roşu, E.; Pécskay, Z.; Ştefan, A.; Popescu, G.; Panaiotu, C.; Panaiotu, C.E. The evolution of the Neogene volcanism in the Apuseni Mountains (Rumania): Constraints from new K-Ar data. Geol. Carpathica 1997, 48, 353–359. [Google Scholar]
- Roşu, E.; Seghedi, I.; Downes, H.; Alderton, D.H.; Szakács, A.; Pécskay, Z.; Panaiotu, C.; Panaiotu, C.E.; Nedelcu, L. Extension-related Miocene calc-alkaline magmatism in the Apuseni Mountains, Romania: Origin of magmas. Swiss Bull. Mineral. Petrol. 2004, 84, 153–172. [Google Scholar]
- Popescu, G.C.; Neacşu, A.; Cioacă, M.E.; Buia, G. Tellurium, Selenium and Cadmium Resources in the Waste Dumps of Săcărâmb Area (Apuseni Mountains), Romania. A Preliminary Estimation. Earth Environ. Sci. 2013, 8, 199–206. [Google Scholar]
- Ianovici, V.; Borcoş, M.; Bleahu, M.; Patrulius, D.; Lupu, M.; Dimitrescu, R.; Savu, H. Geology of the Apuseni Mountains; Editura Academiei Române: București, Romania, 1976. [Google Scholar]
- Ciobanu, C.; Cook, N.; Damian, G.; Damian, F.; Buia, G. Telluride and sulphosalt associations at Sacarimb. In Proceedings of the Au-Ag-Telluride Deposits of the Golden Quadrilateral, Apuseni Mts., Romania; Guidebook Intern. Field Workshop of IGCP Proj; Schweizerbart Science Publishers: Stuttgart, Germany, 2004; pp. 145–186. [Google Scholar]
- Alderton, D.H.; Fallick, A.E. The nature and genesis of gold-silver-tellurium mineralization in the Metaliferi Mountains of western Romania. Econ. Geol. 2000, 95, 495–516. [Google Scholar] [CrossRef]
- Udubasa, G. Excursion Guide. Mineral Occurrences in the Metaliferi Mountains, Romania. Rom. J. Miner. 1992, 75, 35p. [Google Scholar]
- Dincă, G.; Popescu, G.; Ciobotea-Barbu, O.C. New data on the relationship between alabandite and Te-minerals from Săcărâmb Au-Ag-Te ore deposit. In Proceedings of the Ore Deposits of Asia: China and Beyond, SEG, Beijing, China, 17–20 September 2017. [Google Scholar]
- Dincă, G. Mineralogia Zăcământului de Au-Ag-Te Săcărâmb, cu Privire Specială Asupra Sulfosărurilor. Ph.D. Thesis, University of Bucharest, Bucharest, Romania, 2019. [Google Scholar]
- Dincă, G.; Popescu, G.C.; Bîrgăoanu, D.; Ciobotea-Barbu, O.C. Pb-Sb/As sulfosalts from Săcărâmb Au-Ag-Te ore deposit (Romania). In Proceedings of the Life with Ore Deposits on Earth—15th SGA, Glasgow, UK, 27–30 August 2019; pp. 1800–1803. [Google Scholar]
- Dincă, G.; Popescu, G.C.; Ciobotea-Barbu, O.C.; Bărgăoanu, D. Silver sulfotellurides and other te-sulfosalts in alabandite-bearing veins from Săcărmb Au-Ag-Te ore deposit, Metaliferi Mountains, Romania. Rom. J. Miner. Depos. 2018, 91, 19–24. [Google Scholar]
- Dincă, G.; Popescu, G.C. New sulfosalt associations from Săcărâmb Au-Ag-Te ore deposit. Preliminary Data. Rom. J. Miner. Depos. 2016, 89, 65–70. [Google Scholar]
- Dincă, G.; Popescu, G.C. Manganoquadratite and Cd-manganoquadratite from Săcărâmb Au-Ag-Te ore deposit, Metaliferi Mountains, Romania. Carpathian J. Earth Environ. Sci. 2019, 14, 131–136. [Google Scholar] [CrossRef]
- Ghitulescu, T.; Socolescu, M. Etude Géologique et Minière des Monts Métallifères: (Quadrilatère, Aurifère et Régions Environnantes); Imprimeria Națională: București, Romania, 1941. [Google Scholar]
- Giuşcǎ, D. Note preliminaire sur la genèse du gisement aurifère de Sǎcǎrîmb. Bul. Lab. Min. Gen. Univ. Buc. 1935, 1, 72–82. [Google Scholar]
- Giuşcǎ, D. La genese du gisement aurifer de Săcărâmb. C. R. Acad. Sci. Roum. 1936, 1, 243–246. [Google Scholar]
- Warr, L.N. IMA–CNMNC approved mineral symbols. Mineral. Mag. 2021, 85, 291–320. [Google Scholar] [CrossRef]
- Barton, P.B.; Bethke, P.M. Chalcopyrite disease in sphalerite; pathology and epidemiology. Am. Mineral. 1987, 72, 451–467. [Google Scholar]
- Osadchii, E.G.; Gorbaty, Y.E. Raman spectra and unit cell parameters of sphalerite solid solutions (FexZn1−xS). Geochim. Cosmochim. Acta 2010, 74, 568–573. [Google Scholar] [CrossRef]
- Kyono, A.; Gramsch, S.A.; Yamanaka, T.; Ikuta, D.; Ahart, M.; Mysen, B.O.; Mao, H.-K.; Hemley, R.J. The influence of the Jahn–Teller effect at Fe2+ on the structure of chromite at high pressure. Phys. Chem. Miner. 2011, 39, 131–141. [Google Scholar] [CrossRef] [Green Version]
- Walsch, D.; Donnay, G.; Donnay, J.D.H. Jahn-Teller effects in ferro-magnesian minerals: Pyroxenes and olivines. Bull. Sociétié Fr. Mineral. Cristallogr. 1974, 97, 170–183. [Google Scholar] [CrossRef]
- Kullerud, G. The FeS-ZnS System, a Geological Thermometer; John, Griegs Boktrykkeri: Bergen, Norway, 1953. [Google Scholar]
- Skinner, B.J. Unit-cell edges of natural and synthetic sphalerites. Am. Mineral. J. Earth Planet. Mater. 1961, 46, 1399–1411. [Google Scholar]
- Vallin, J.T.; Slack, G.A.; Roberts, S.; Hughes, A.E. Infrared Absorption in Some II-VI Compounds Doped with Cr. Phys. Rev. B 1970, 2, 4313–4333. [Google Scholar] [CrossRef]
- Nien, Y.-T.; Chen, I.-G. Raman scattering and electroluminescence of ZnS: Cu,Cl phosphor powder. Appl. Phys. Lett. 2006, 89, 261906. [Google Scholar] [CrossRef] [Green Version]
- Sombuthawee, C.; Bonsall, S.B.; Hummel, F.A. Phase equilibria in the systems ZnS-MnS, ZnS-CuInS2, and MnS-CuInS2. J. Solid State Chem. 1978, 25, 391–399. [Google Scholar] [CrossRef]
- Kaneko, S.; Aoki, H.; Nonaka, I.; Imoto, F.; Matsumoto, K. Solid Solution and Phase Transformation in the System ZnS-MnS under Hydrothermal Conditions. J. Electrochem. Soc. 1983, 130, 2487. [Google Scholar] [CrossRef]
- Tămaș, C.G.; Andrii, M.P.; Kovács, R.; Drăgușanu, S.; Cauuet, B. Sphalerite Composition in Low- and Intermediate-Sulfidation Epithermal Ore Bodies from the Roșia Montană Au-Ag Ore Deposit, Apuseni Mountains, Romania. Minerals 2021, 11, 634. [Google Scholar] [CrossRef]
- Damian, G.; Buzatu, A.; Apopei, A.I.; Damian, F.; Maftei, A.E. Hydrothermal Sphalerites from Ore Deposits of Baia Mare Area. Minerals 2021, 11, 1323. [Google Scholar] [CrossRef]
- Olivo, G.R.; Gibbs, K. Paragenesis and mineral chemistry of alabandite (MnS) from the Ag-rich Santo Toribio epithermal deposit, Northern Peru. Mineral. Mag. 2018, 67, 95–102. [Google Scholar] [CrossRef]
- Hurai, V.; Huraiová, M. Origin of ferroan alabandite and manganoan sphalerite from the Tisovec skarn, Slovakia. Neues Jahrb. Mineral. Abh. 2011, 188, 119–134. [Google Scholar] [CrossRef]
- Di Benedetto, F. Compositional zoning in sphalerite crystals. Am. Mineral. 2005, 90, 1384–1392. [Google Scholar] [CrossRef]
- Bernardini, G.P.; Borgheresi, M.; Cipriani, C.; Di Benedetto, F.; Romanelli, M. Mn distribution in sphalerite: An EPR study. Phys. Chem. Miner. 2004, 31, 80–84. [Google Scholar] [CrossRef]
- Kelley, K.D. Textural, Compositional, and Sulfur Isotope Variations of Sulfide Minerals in the Red Dog Zn-Pb-Ag Deposits, Brooks Range, Alaska: Implications for Ore Formation. Econ. Geol. 2004, 99, 1509–1532. [Google Scholar] [CrossRef]
- Zhuang, L.; Song, Y.; Liu, Y.; Fard, M.; Hou, Z. Major and trace elements and sulfur isotopes in two stages of sphalerite from the world-class Angouran Zn–Pb deposit, Iran: Implications for mineralization conditions and type. Ore Geol. Rev. 2019, 109, 184–200. [Google Scholar] [CrossRef]
- Gottesmann, W.; Gottesmann, B.S. Sphalerite composition and ore genesis at the Tumurtijn-ovoo Fe-Mn-Zn skarn deposit, Mongolia. Neues Jahrb. Mineral. Abh. 2009, 185, 249–280. [Google Scholar] [CrossRef]
- Wang, L.; Qin, K.-Z.; Song, G.-X.; Li, G.-M. A review of intermediate sulfidation epithermal deposits and subclassification. Ore Geol. Rev. 2019, 107, 434–456. [Google Scholar] [CrossRef]
- Sillitoe, R.H.; Hedenquist, J.W. Linkages between Volcanotectonic Settings, Ore-Fluid Compositions, and Epithermal Precious Metal Deposits; Society of Economic Geologists: Littleton, CO, USA, 2005. [Google Scholar]


| Sector/Sample Type | Samples | Mn | Fe | Cd | Cu | Zn | S | SUM | Calculated Formula | (Mn,Fe)-S (cm−1) | LO Zn-S (cm−1) | ||
|---|---|---|---|---|---|---|---|---|---|---|---|---|---|
| Core sample | SGD_11_2 | n.d. | 4.72 | n.d. | n.d. | 63.11 | 32.18 | 100 | 0 | 299 | 330 | 350 | |
| Core sample | SGD_11_1 | n.d. | 9.48 | n.d. | n.d. | 58.48 | 32.05 | 100 | 0 | 299 | 330 | 351 | |
| Core sample | 5_SGD_10_2 | 0.75 | 4 | 0.03 | n.d. | 65.42 | 29.8 | 100 | 0.01 | 300 | 331 | 350 | |
| Core sample | 5_SGD_10_1 | 0.98 | 2.79 | 0.14 | n.d. | 63.13 | 32.97 | 100 | 0.02 | 300 | 331 | 348 | |
| Core sample | 5_SGD_10_3 | 1.22 | 3.50 | 0.72 | n.d. | 63.85 | 30.71 | 100 | 0.02 | 299 | 330 | 348 | |
| Sector 3 | 2_S3H2_2 | 3.49 | 5.4 | n.d. | n.d. | 59.81 | 31.3 | 100 | 0.06 | 298 | 327 | 350 | |
| Sector 3 | 2_S3H2_1 | 7.22 | 2.23 | n.d. | n.d. | 58.1 | 32.44 | 100 | 0.13 | 297 | 326 | 349 | |
| Sector 2 | 8_SGD_22a_1 | 7.55 | 0.24 | 0.4 | n.d. | 59.81 | 32 | 100 | 0.13 | 297 | 328 | 350 | |
| Sector 3 | 2_S3H2_3 | 7.92 | 3.57 | n.d. | n.d. | 53.37 | 35.14 | 100 | 0.14 | 298 | 328 | 350 | |
| Sector 3 | 4_S3K5_1 | 9.55 | 0.56 | 0.13 | n.d. | 53.28 | 36.48 | 100 | 0.16 | 298 | 327 | 348 | |
| Sector 3 | S3I1_1_1 | 10.22 | 0.46 | n.d. | n.d. | 52.96 | 36.36 | 100 | 0.17 | 298 | 329 | 351 | |
| Sector 3 | S3E4_1_4c | 12.29 | n.d. | 0.16 | n.d. | 54.92 | 32.63 | 100 | 0.21 | 298 | 330 | 352 | |
| Sector 2 | SG1_1_3 | 13.11 | 0.05 | 0.28 | 0.16 | 53.50 | 32.90 | 100 | 0.23 | 297 | 328 | 350 | |
| Sector 3 | S3E4_1_4b | 13.74 | n.d. | 0.49 | n.d. | 53.96 | 31.81 | 100 | 0.24 | 295, 307 sh | 328 | 349 | |
| Sector 3 | S3E4_1_4 | 14.10 | 0.24 | 0.03 | n.d. | 54.23 | 31.40 | 100 | 0.25 | 295, 307 sh | 326 | 350 | |
Publisher’s Note: MDPI stays neutral with regard to jurisdictional claims in published maps and institutional affiliations. |
© 2022 by the authors. Licensee MDPI, Basel, Switzerland. This article is an open access article distributed under the terms and conditions of the Creative Commons Attribution (CC BY) license (https://creativecommons.org/licenses/by/4.0/).
Share and Cite
Dincă, G.; Apopei, A.I.; Szabo, R.; Maftei, A.E. The Effect of Mn Substitution on Natural Sphalerites by Means of Raman Spectroscopy: A Case Study of the Săcărâmb Au–Ag–Te Ore Deposit, Apuseni Mountains, Romania. Minerals 2022, 12, 885. https://doi.org/10.3390/min12070885
Dincă G, Apopei AI, Szabo R, Maftei AE. The Effect of Mn Substitution on Natural Sphalerites by Means of Raman Spectroscopy: A Case Study of the Săcărâmb Au–Ag–Te Ore Deposit, Apuseni Mountains, Romania. Minerals. 2022; 12(7):885. https://doi.org/10.3390/min12070885
Chicago/Turabian StyleDincă, George, Andrei Ionuț Apopei, Robert Szabo, and Andreea Elena Maftei. 2022. "The Effect of Mn Substitution on Natural Sphalerites by Means of Raman Spectroscopy: A Case Study of the Săcărâmb Au–Ag–Te Ore Deposit, Apuseni Mountains, Romania" Minerals 12, no. 7: 885. https://doi.org/10.3390/min12070885
APA StyleDincă, G., Apopei, A. I., Szabo, R., & Maftei, A. E. (2022). The Effect of Mn Substitution on Natural Sphalerites by Means of Raman Spectroscopy: A Case Study of the Săcărâmb Au–Ag–Te Ore Deposit, Apuseni Mountains, Romania. Minerals, 12(7), 885. https://doi.org/10.3390/min12070885