Article

Alterations of Carbonate Mineral Matrix and Kerogen Micro-Structure in Domanik Organic-Rich Shale during Anhydrous Pyrolysis

Center for Petroleum Science and Engineering, Skolkovo Institute of Science and Technology, Bolshoy Boulevard 30, 121205 Moscow, Russia
*
Authors to whom correspondence should be addressed.
Minerals 2022, 12(7), 870; https://doi.org/10.3390/min12070870
Submission received: 31 May 2022 / Revised: 30 June 2022 / Accepted: 5 July 2022 / Published: 9 July 2022

Abstract

:
The study of organic-rich carbonate-containing shales after heating is an important task for the effective application of in-situ thermal kerogen conversion technologies implemented for these types of rocks. This research was conducted to study changes in the rocks of the Domanik Formation after high-temperature treatment, taking into account the nature of structural changes at the micro level and chemical transformations in minerals. The sample of organic-rich carbonate-containing shales of the Domanik Formation was treated in stages in a pyrolizer in an inert atmosphere in the temperature range of 350–800 °C for 30 min at each temperature. By means of X-ray powder diffractometry (XRPD), HAWK pyrolysis, light and scanning electron microscopy (SEM), energy-dispersive X-ray spectroscopy (EDX), and computed micro-tomography, the characteristics of the rock before and after each heating stage were studied. The results showed significant alteration of the mineral matrix in the temperature range 600–800 °C, including the decomposition of minerals with the formation of new components, and structural alterations such as fracturing micropore formation. The organic matter (OM) was compacted at T = 350–400 °C and fractured. The evolution of void space includes fracture formation at the edges between rock components, both in organic matter and in minerals, as well as nanopore formation inside the carbonate mineral matrix. The results obtained show what processes at the microlevel can occur in carbonate-containing organic-rich shales under high-temperature treatment, and how these processes affect changes in the microstructure and pore space in the sample. These results are essential for modeling and the effective application of thermal EOR in organic-rich shales.

1. Introduction

Currently, the reserves of traditional hydrocarbons are declining in the world and in Russia in particular [1], while the demand remains high; according to IEA [2,3] and OPEC [4] forecasts, demand will continue to grow. Thus, unconventional hydrocarbon reserves of shale formations are attracting more and more attention from geoscientists [5,6]. The production of oil from shales is highly promising in Russia, given that the Russian Federation is one of the leading countries in terms of unconventional shale oil reserves [7].
Among shale rocks of various types [8], carbonate-containing shales are of particular interest. Carbonate-containing shales are formed in an anoxic depositional early diagenetic environment, which can result in the deposition of organic-rich, fine-grained carbonate sediments. Organic-rich carbonate rocks are widely distributed and are excellent potential source rocks [9]. The Domanik Formation belongs to this type of rock, which is characterized by both a high total organic carbon (TOC) content, reaching up to 30%, and a very low porosity [10]. Difficulties in extracting oil from such reservoirs are associated both with extraction of hydrocarbons from kerogen and with extremely low porosity and permeability of reservoir.
One of the distinctive features of shale rocks is the high content of kerogen [11]. Since kerogen is a solid-phase hydrocarbon that is almost completely insoluble in most organic solvents, thermal methods may be used to transform kerogen into hydrocarbons. In situ EOR based on thermal impact began to be developed back in the 1940s [12] and currently includes many different techniques [13,14] such as in situ combustion [15], in situ pyrolysis [15,16], and a variety of their modifications.
Effective application of temperature-enhanced oil recovery (EOR) requires a deep understanding of the influence of high temperatures on reservoir properties during treatment. There are a number of studies devoted to the alteration of organic matter (OM) and shale fabric after high-temperature treatment of oil shales. Kobchenko et al. [17] using synchrotron microtomography and 4D imaging demonstrated that, when heated to 350 °C, fractures began to form in the Green River oil shale sample, whereas, according to thermogravimetry and gas chromatography, the cracking of kerogen began at the same temperature. Saif T. et al. [18] conducted vacuum pyrolysis of organic-rich shales at temperatures up to 500 °C using synchrotron X-ray tomography with a built furnace, and they also found that pore development is directly related to the initial spatial distribution of organic matter. Bai et al. [19] using multiple approaches demonstrated that temperature affects the chemical composition and pore evolution of the organic-rich shales. Geng et al. [20] showed that, with the coupled effect of elevated temperature and pressure on the oil shale, the formation of pores and fractures occurs in the sample. Kim et al. [21] conducted pyrolysis of Green River Formation rock samples under geologically realistic triaxial stress; via micro-CT and scanning electron microscopy (SEM), the fracture development and matrix porosity were determined. Mukhametdinova et al. [22] heated a sample of oil shale from the Bazhenov Formation in a combustion tube simulating high-pressure air injection EOR technology. Further laboratory studies showed an increase in porosity and permeability, the appearance of fractures in the samples, and the conversion of kerogen into synthetic oil.
The influence of thermal treatment on the Domanik Formation was studied by Gafurova et al. [23,24], Kovaleva et al. [25], and Nasyrova et al. [26]. The authors found that a change in the pore space and an increase in porosity occurs when the samples are heated, as a result of the transformation of organic matter and fracturing of the rock. However, the authors did not consider the fundamental processes underlying the changes in the porous medium of the Domanik samples, such as the decomposition of carbonates.
The decomposition of carbonates under high temperatures is a fairly well-studied process, to which a huge number of studies were devoted, including decomposition temperatures and study of structural changes occurring in calcite and dolomite [27]. However, carbonate decomposition has not sufficiently been sanctified in shales. Jukkola et al. found that the decomposition of calcite in a shale sample occurs at lower temperatures than usually occurs in pure carbonate [28].
This article is devoted to the study of changes in the porous medium of the Domanik Formation after high-temperature treatment by anhydrous pyrolysis considering carbonate mineral matrix decomposition and OM microstructural transformations. For this purpose, Domanik samples were heated at different temperatures. The mineral composition, carbonate matrix, and organic matter of these samples were investigated before and after pyrolysis, using X-ray diffraction (XRD), energy-dispersive X-ray analysis (EDX), SEM, Rock-Eval, and microtomography methods.

2. Materials and Methods

2.1. Materials

The Domanik Formation (DF) deposits extend in a wide strip along the Ural Fold System in the European part of the Russian Federation (Figure 1); relative to tectonics, the DF is located within the Eastern European (Russian) Platform. The Domanik Formation, as a stratigraphic subdivision, corresponds to the Middle Fransian of the Upper Devonian, and it occupies most of the area of the eastern parts of the Timan-Pechora and the Volga-Ural oil and gas basins (Figure 1) [29,30]. The formation depth is approximately 2000 m. The Middle Fransian Domanik Formation is mainly represented by carbonate marine sediments, both deep-water and shallow-water types [30]. The terms “Domanik type rocks” and “Domanik facies” refer to deposits sedimented in a deep marine anoxic environment during periods of active sea basin transgression [31]; lithologically, such rocks are represented by bituminous and siliceous clay carbonate shales with a significant content of organic matter. Domanik facies are found within the Eastern European and Timan-Pechora basins not only in the Middle Fransian, but also covering the Fransian, the Famennian of the Upper Devonian, and the Tournaisian stage of the Mississippian. The DF shales mainly consist of the following four components: carbonate (chemogenic and organogenic); sapropel planktogenic OM; autigenic and biogenic silica; and a small amount of clay particles [32]. According to the amount of organic matter, researchers divide the Domanik type rocks into two main types, domanicites and domanicoids [33]. The domanicites are characterized by a high content of TOC—5.0%–22% (25%); in the domanicoids, the TOC content is lower—0.5%–5%, and organic matter is characterized by the humus-sapropel (I–II) type of kerogen [33,34,35,36,37]. According to pyrolytic studies, the DF refers to mature oil-producing rocks [38]. The DF shales are characterized by extremely low permeability and porosity (0.66 to 1.87), fractures and cavities in carbonate mineral matrix, inter- and intraparticle pores predominantly in the carbonate mineral matrix, and pores in the organo-mineral part of the rock [10,39,40]. The Domanik Formation is often considered as an analogue of the Eagle Ford Formation [32,41].
The studied rock sample came from a well located in the Verhne-Kamsk Depression in the Volga-Ural oil and gas basin (Figure 1a).
The sample is represented by an organic-rich mudstone consisting of an organo-mineral matrix with inclusions of carbonate shell debris (Figure 2). The debris is poorly sorted and poorly rounded. The size of large shell fragments is 50–300 µm in length and 10–20 µm in thickness; small fragments are 20 µm or lower in length. Most of the rock is composed of a dark-brown to black organo-mineral matrix with a prevailing content of organic matter. The matrix mineral part consists of small fragments of calcite, feldspar grains, illite plates, and siliceous matter, distributed in a kerogen (Figure 2). Moreover, products of secondary processes which include pyritization and dolomitization can be found. The thermal maturation according to Rock-Eval pyrolysis data (Tmax = 429 °C, HI = 566) is considered immature (incipient oil generation zone [42,43]). The mineral composition according to X-ray powder diffractometry of the sample is shown in Table 1.
There was a parallel laminated, and sometimes, lenticular, microstructure highlighted by the shell debris orientation; the structure was bioclastic detrital. According to the optical microscopy and SEM, porosity was almost absent. Only single micropores could be found in the OM and minerals.

2.2. Methods

2.2.1. Experiment Design

A Domanik carbonate-containing organic-rich shale rock sample was prepared in the form of a 3 × 5 mm cylinder and powders (60 mesh size). Powders were heated separately at temperatures of 400/600/800 °C, while the cylinder was isothermally treated sequentially at 350–400–450–600–800 °C in a pyrolyzer chamber (in the sample crucible of the HAWK Resource Workstation (Wildcat Technologies, Humble, TX, USA)) in inert He atmosphere for 30 min at each temperature. The initial heating rate was 35–40 °C/min. The temperature of the sample was determined by the instrument’s integrated thermocouple. The temperature range of 350–600 °C is devoted primarily to analyzing organic matter alteration. A temperature of 350 °C was chosen to initiate free and weakly adsorbed hydrocarbons release; in the temperature range of 400–600 °C, kerogen decomposition and HC release from kerogen should occur [44]. The temperature range of 600–800 °C was selected for mineral composition and mineral matrix alteration analysis. To characterize composition alterations, samples were studied with XRPD and EDX analysis; to analyze microstructure alterations of organic matter and mineral matrix, SEM was used; Rock-Eval methodology was applied for OM maturity extent estimation. Micro-CT allowed to estimate bulk porosity alteration in the whole rock volume. Methods were applied before heating and after the selected heating steps. A schematic of the experiment is presented in Figure 3.
A brief description of the applied methods is given below.

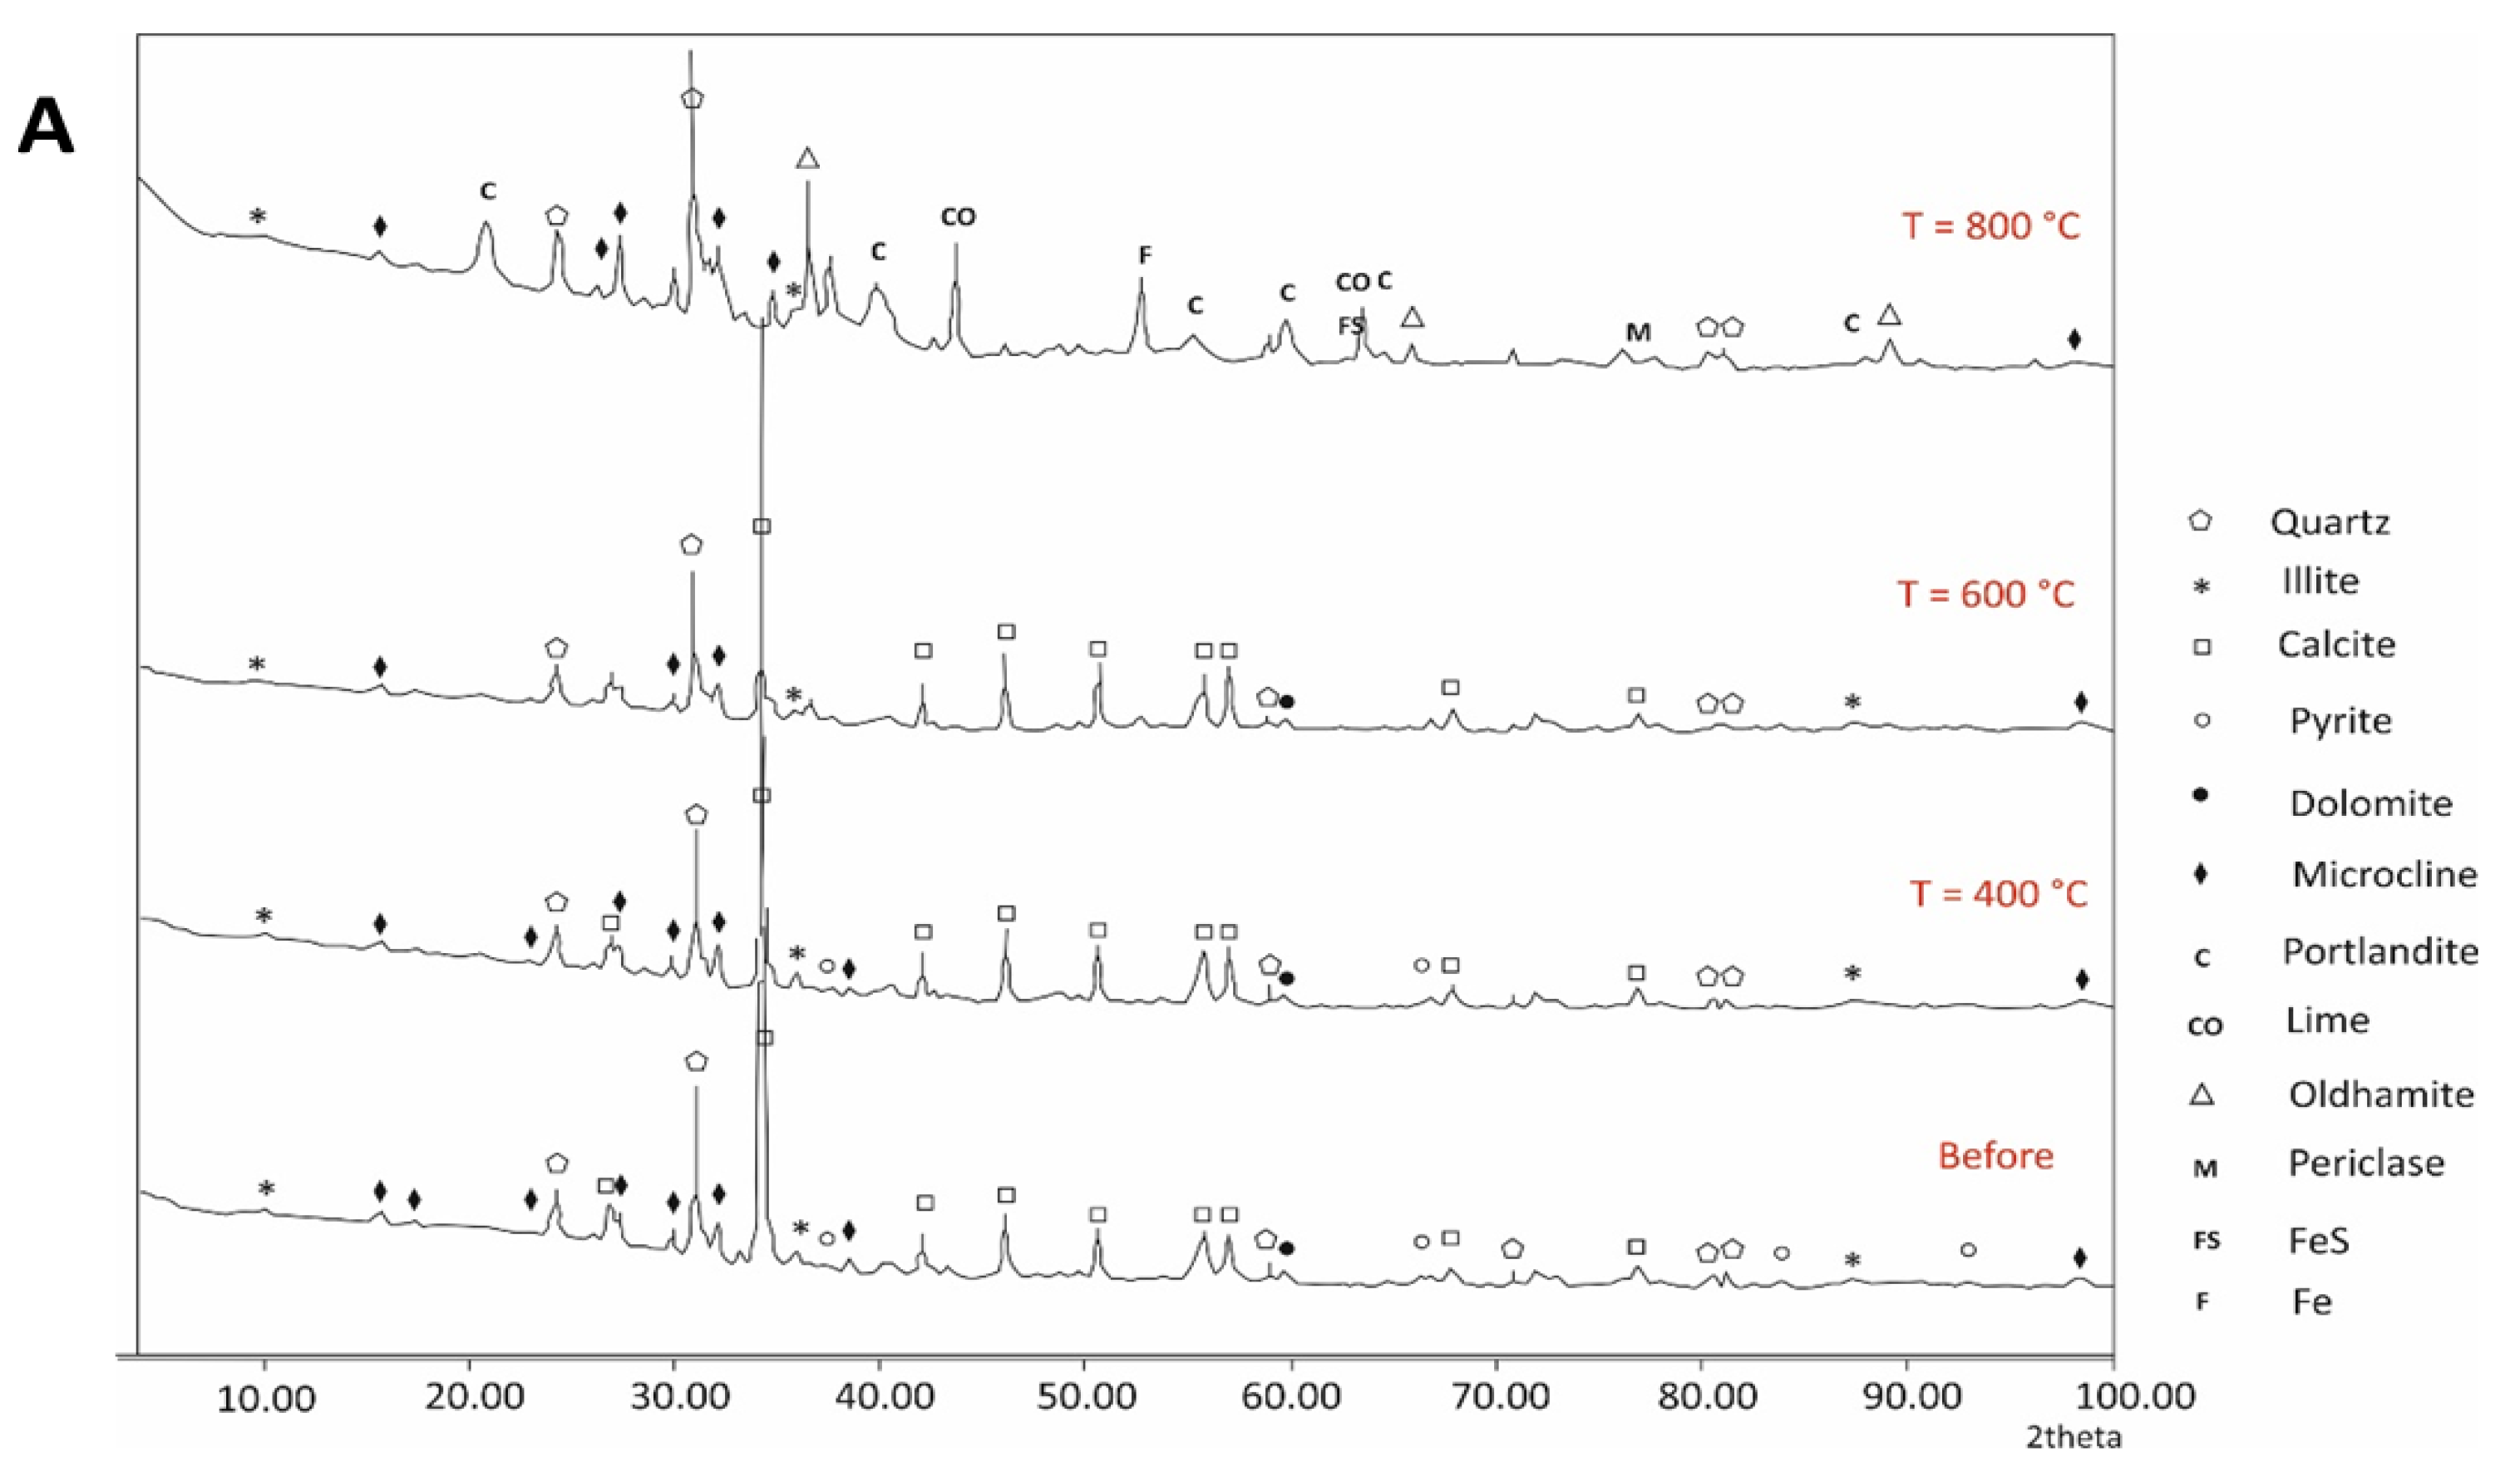
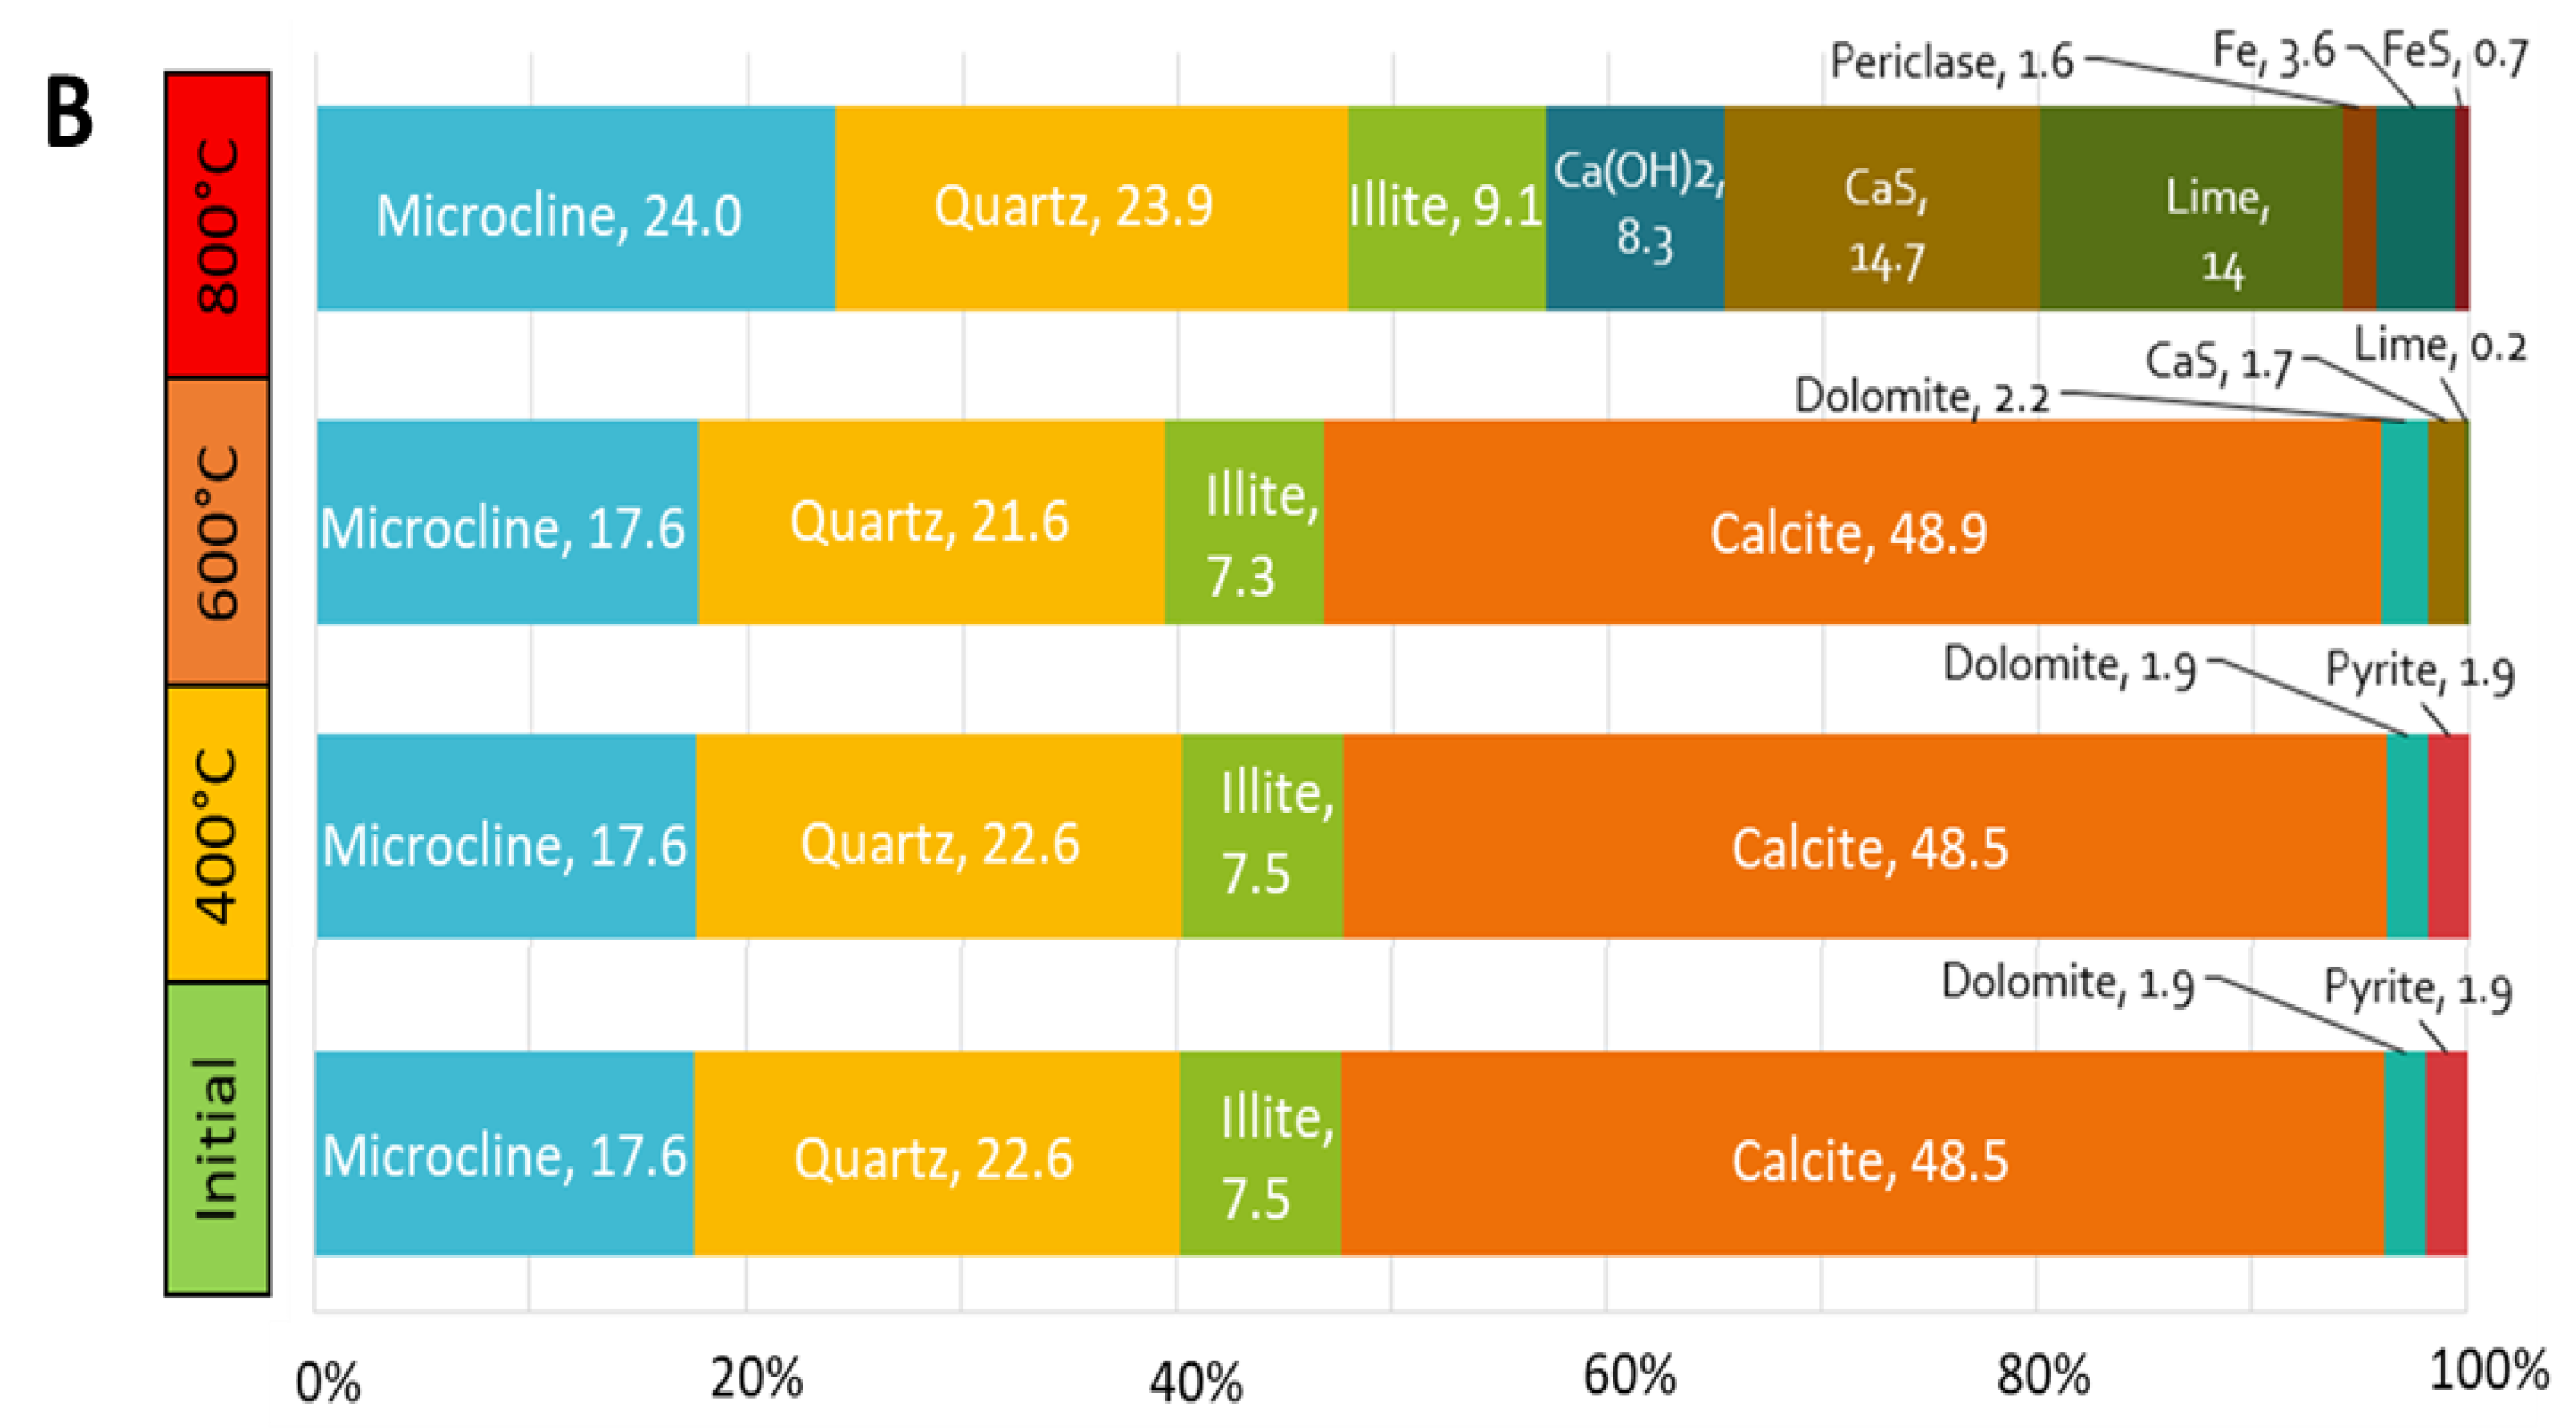
2.2.2. X-ray Diffractometry

The X-ray diffraction powder analysis technique was used to study the mineral crystalline phase composition of the sample. The Huber G670 diffractometer applied for this method has transmission geometry (linear PSD detector, Co tube (Ka1 = 1.78892 Å, 1200 W) and automatic monochromatic system). The sample was preliminarily powdered using a vibratory mill Retsch MM400 at a frequency of 25 Hz for 8 min. The prepared powders were analyzed before heating and after the selected heating stages; approximately 50 mg of powder from the sample was needed.

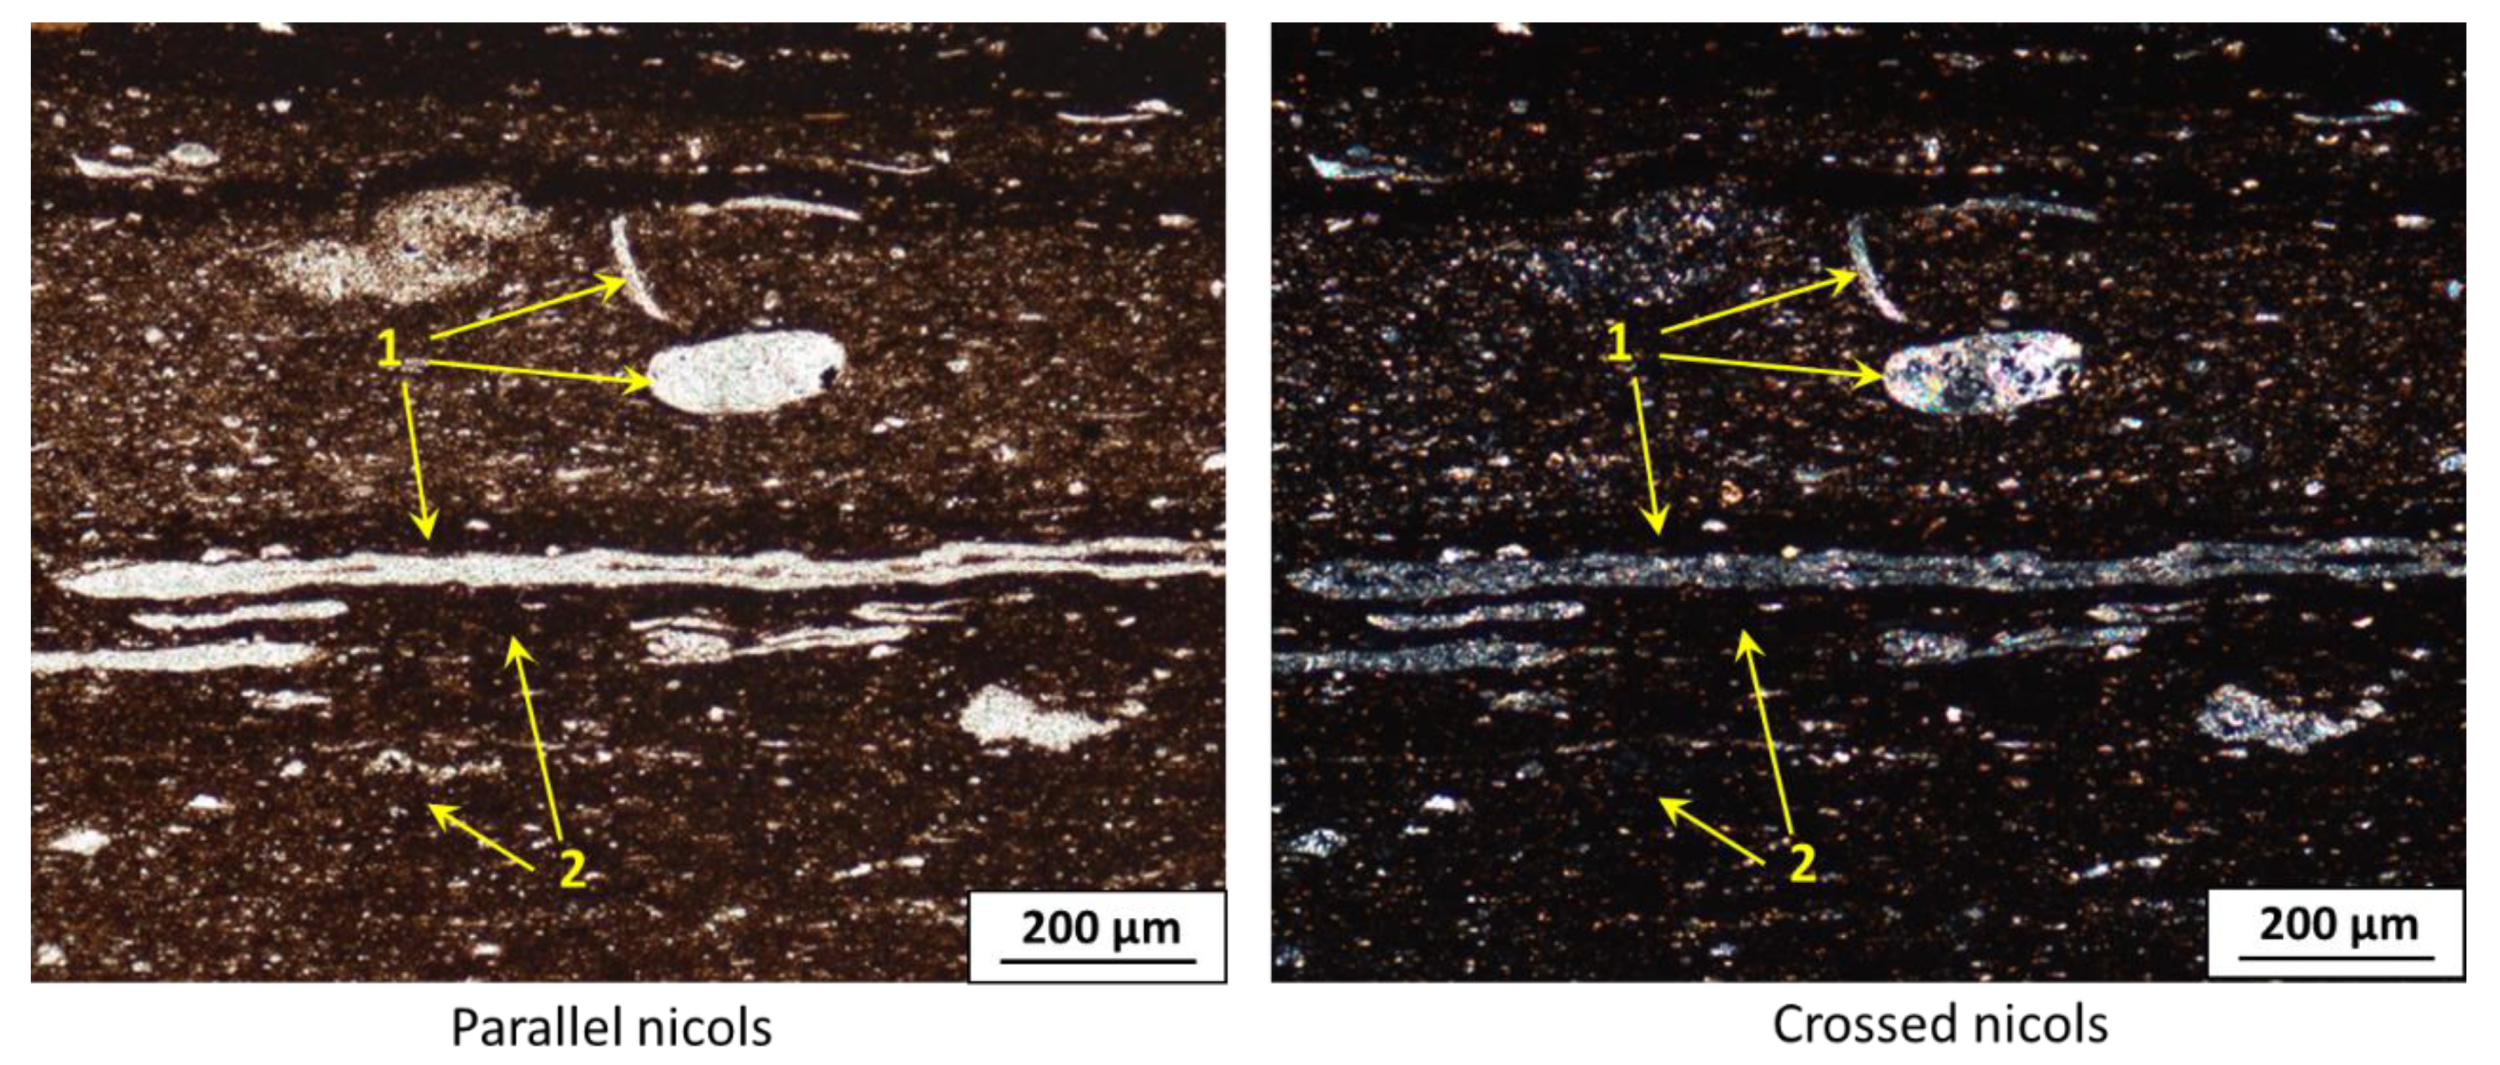
2.2.3. Thin Section Analysis

For petrological characterization, optical polarizing microscopy on thin sections was performed using an AxioScope 5 microscope (Carl Zeiss, Jena, Germany). For precise shale fabric investigation, a thin section was made with a thickness of 10–20 µm.

2.2.4. Broad Ion Beam Scanning Electron Microscopy

For the study of mineral matrix and organic matter microfabric, broad ion beam scanning electron microscopy (BIB-SEM) was used. A small core plug of the sample (3–5 mm diameter) was prepared. The flat surface of the cylinder sample was first mechanically polished using 18 and 10 µm diamond grinding papers, and 1, 3, and 6 µm suspensions were subjected to ionic polishing by BIB. According to [45], ion milling does not affect the microstructure of the organic matter. In order to avoid charging the sample in the microscope, the studied surface of the sample was coated with a thin (10 nm) gold layer. Quattro S (Thermo Fisher Scientific, Waltham, MA, USA) SEM with an electron beam current range from 1 pA to 200 nA with an accelerating voltage of 10 to 30 kV was used. The void space was evaluated on large mosaic images (approximately 1000 × 1000 μm) with pore segmentation using ImageJ software (1.53q, Rasband, National Institutes of Health, Bethesda, MD, USA) [46]).

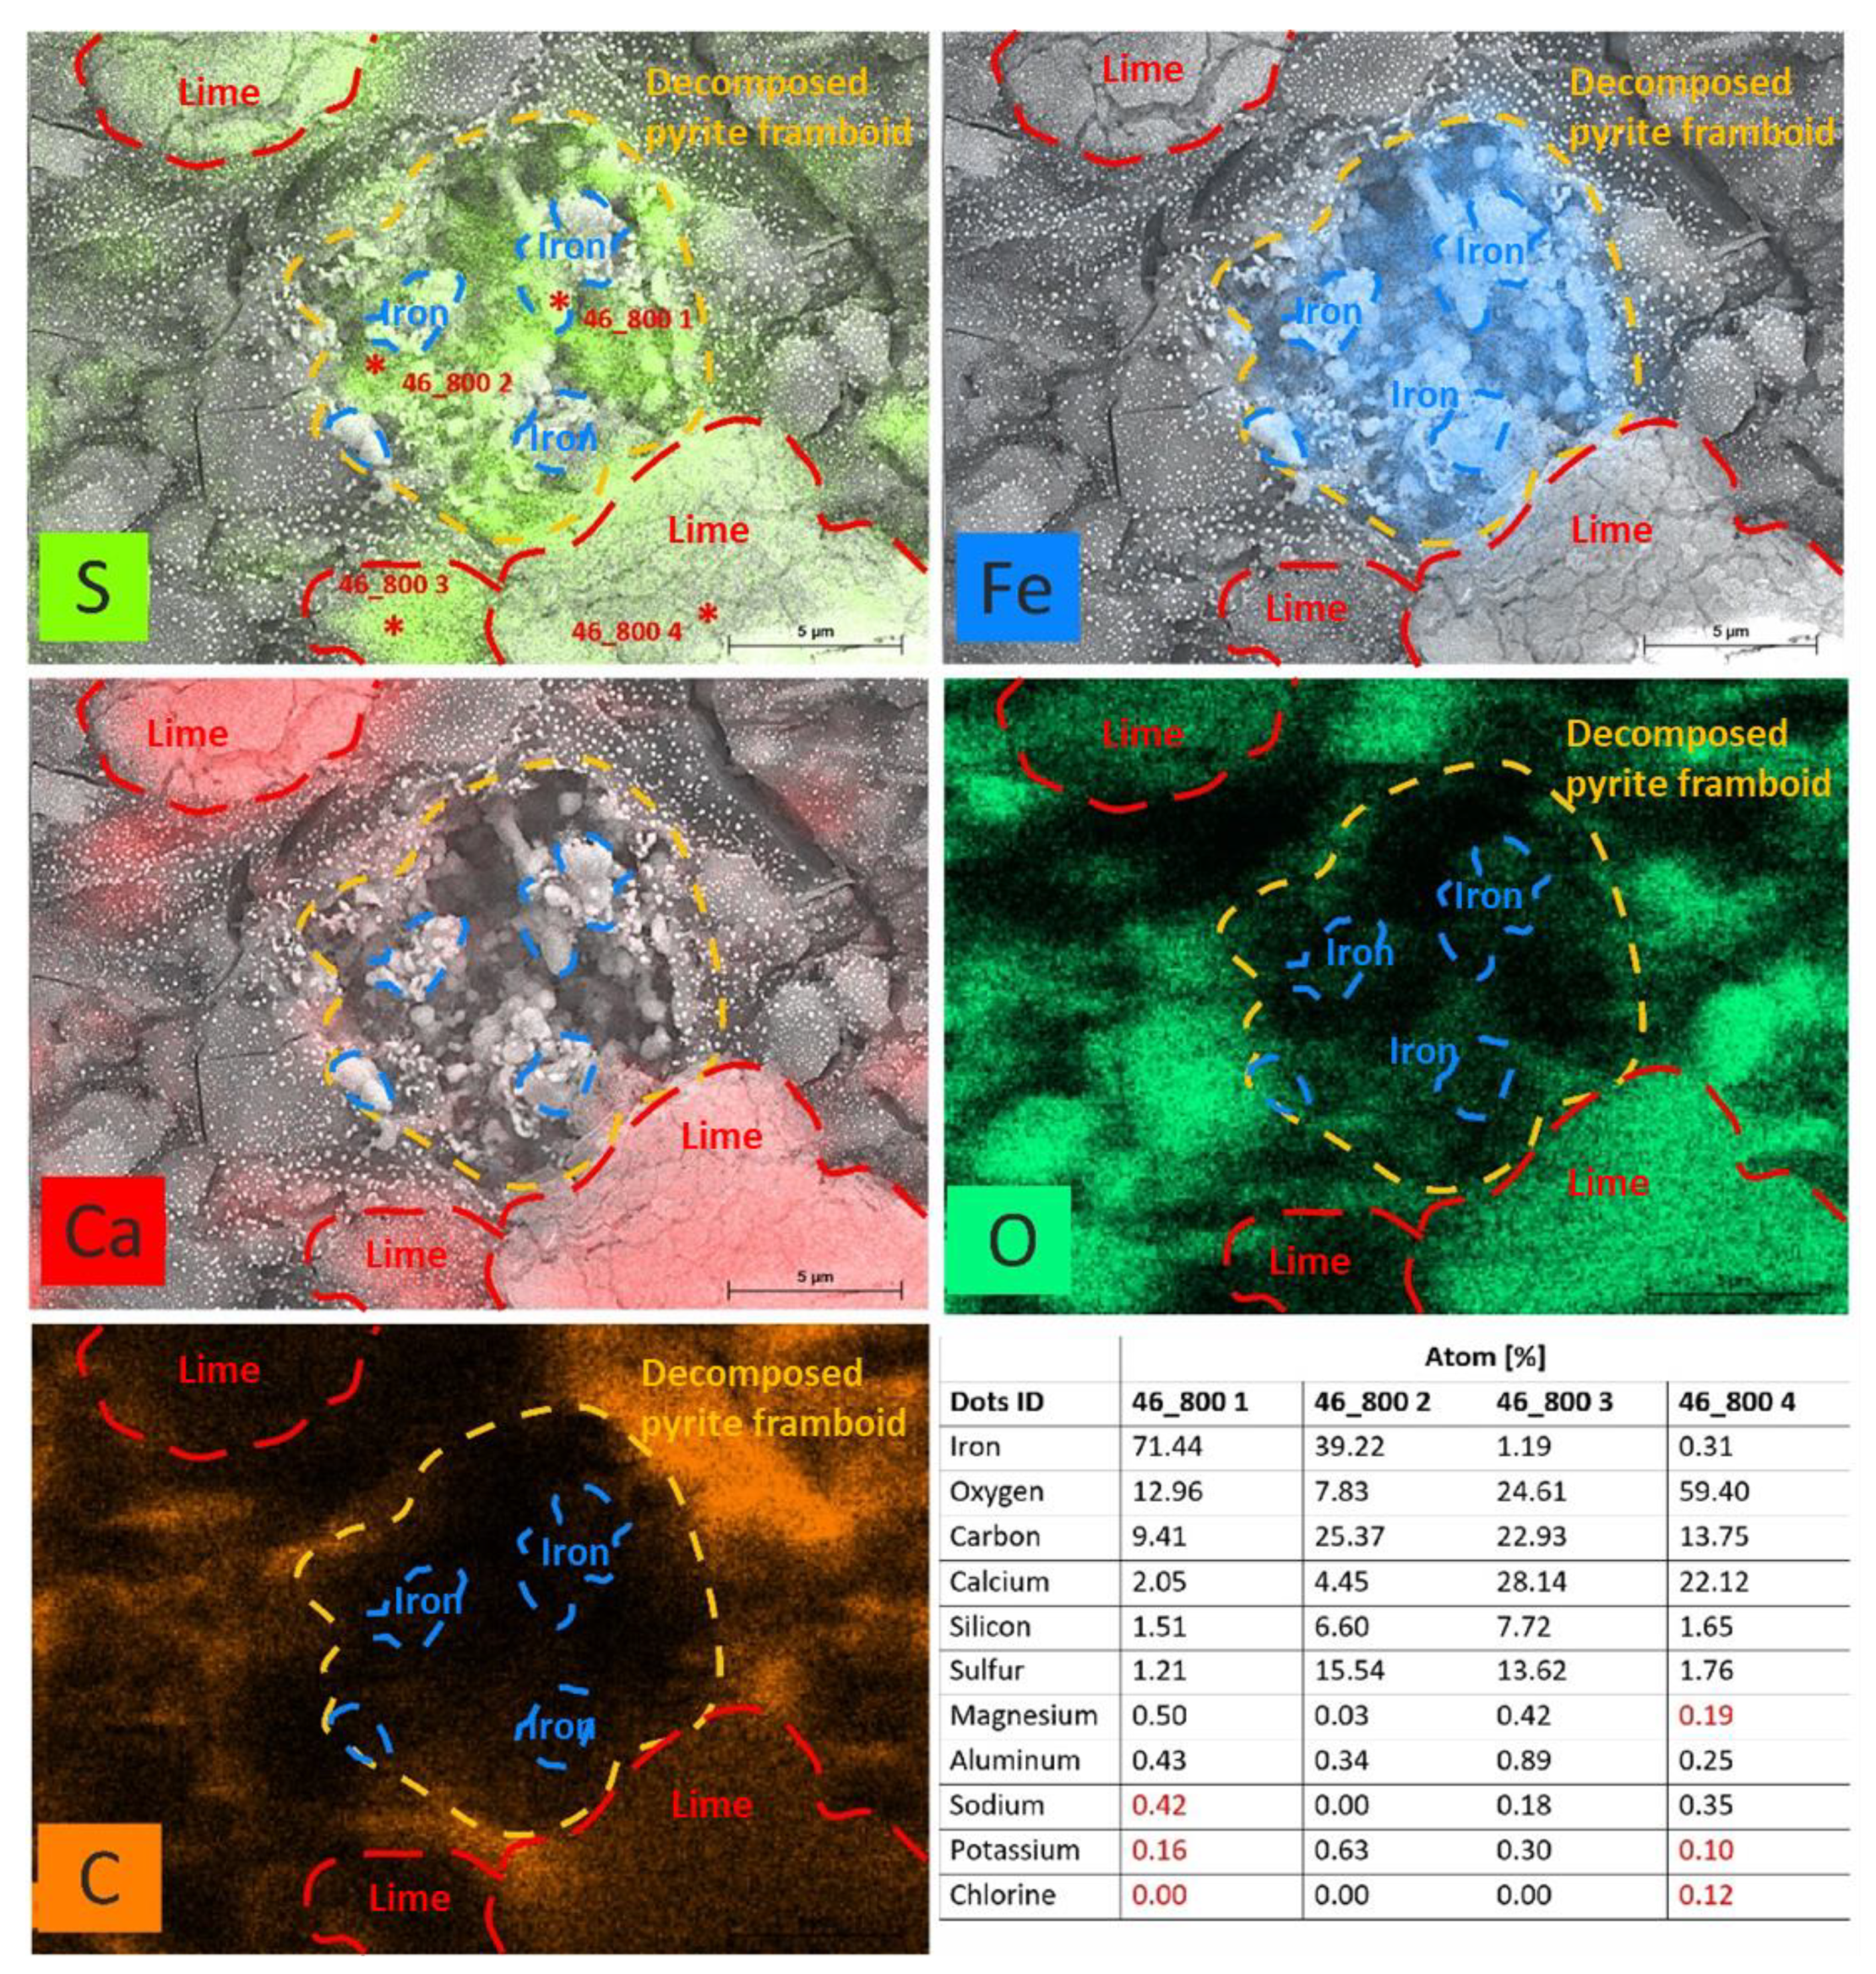
2.2.5. Energy-Dispersive X-ray Spectroscopy

To study the elemental composition of various phase components of the sample before and after heating, energy-dispersive X-ray spectroscopy (EDX) (Quantax, Bruker, Billerica, MA, USA) embedded in SEM was used.

2.2.6. Programmed Pyrolysis

In order to characterize the Domanik organic-rich rock sample generation potential, pyrolysis was conducted in the HAWK Resource Workstation (Wildcat Technologies, Humble, TX, USA) using the Rock-Eval bulk rock procedure. The main pyrolysis parameters were obtained as follows: S0 and S1 (free hydrocarbons contained in the sample), S2 (generated hydrocarbons), S3 (CO2 yield during thermal breakdown of kerogen); temperature Tmax (°C); total organic carbon (TOC, wt.%), generative organic carbon (GOC, wt.%), and nongenerative organic carbon (NGOC, wt.%).

2.2.7. Computed Micro Tomography

For investigation of the pore space alteration in the whole volume of the rock sample, the method of X-ray computed microtomography was used. The sample was prepared in the form of a 3 × 3 mm cylinder. The GE phoenix v|tome| × L240/180 system includes a combination of high-power 240 kV microfocus and 180 kV high-resolution nanofocus X-ray tubes. The 3 × 3 mm rock sample was analyzed with the nanofocus tube with an accelerating voltage of 100 kV and a current of 260 µA (second mode). The geometrical resolution was 1.2 μm/voxel for all scans. A set of 2400 2D radiographic projections were reconstructed using GE datos|x reconstruction 2.6.1-RTM software, and further 3D models were processed with Per-Geos 1.5 software (ver. 1.5, Thermo Fisher Scientific, Waltham, MA, USA).

3. Results

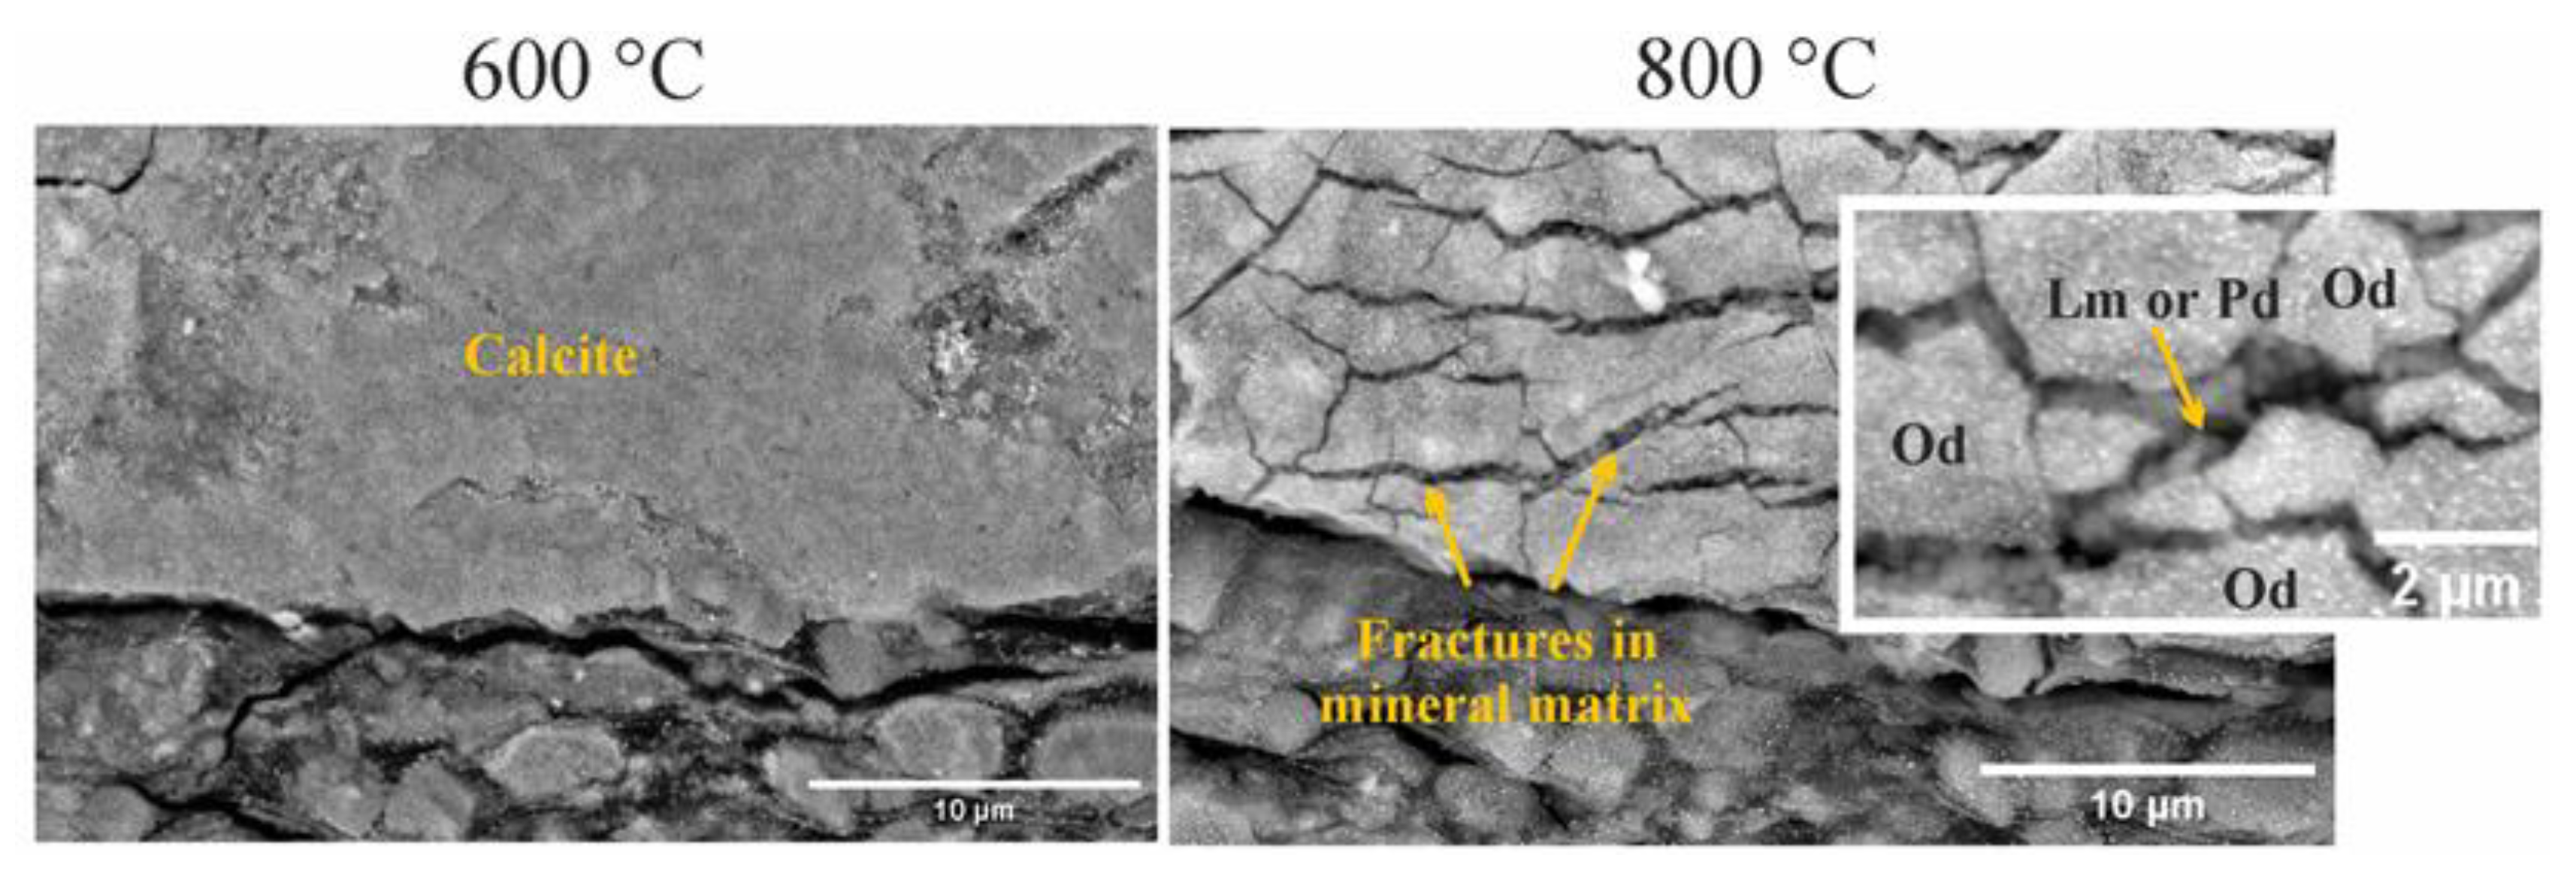
3.1. Mineral Matrix Alteration

According to XRPD data, the first mineral composition changes were observed at T = 600 °C (Figure 4). Pyrite decomposed partially with the formation of iron sulfide FeS, while carbonates also started to decompose at T 600 °C with the formation of lime CaO and oldhamite CaS (Figure 5). The most intense change in composition occurred at the temperature of 800 °C, where pyrite and carbonates decomposed completely with the formation of minerals such as FeS and Fe, lime CaO, periclase MgO, and portlandite Ca(OH)2. Figure 4B shows the evolution of mineral composition during the experiment.
XRPD data were detailed by EDX analysis. Figure 5 shows the SEM secondary electron image combined with EDX elemental maps for sample Ch-46t. In the central part of the SEM image, there is a decomposed former pyrite framboid, and transformed carbonates are situated generally in the upper left part and in the lower part of the images, as confirmed by both morphology and elemental distribution. The elemental distribution shows evidence of the presence of pure iron and oldhamite mineral (CaS). As shown in Figure 5, sulfur was distributed in two areas: in the area of former pyrite where it matched with iron, and in the areas of Ca distribution (former calcite grains). Sulfur was not situated everywhere inside the area of former pyrite; in white dense grains, only Fe was detected. This fact indicates that these dense grains may be pure iron; elemental fractions in EDX measurements confirmed that the atomic fraction of iron in the dot 46_800 1 was 71.44 at.%, while the fraction of sulfur was only 1.21 at.%. In the dot 46_800 2, the fraction of S was 15.54 at.%, while the fraction of iron was 39.22 at.%. In this dot, the iron amount also exceeded the fraction of sulfur, but not by much, perhaps caused by the presence of pure iron and iron compounds with sulfur or pure iron and pure sulfur. The matching of Ca and S elements may evidence that these elements formed a single compound. However, in dots 46_800 3 and 46_800 4, the atomic fractions of Ca exceeded the atomic fractions of sulfur (Ca = 28.14 at.% and S = 13.62 at.% vs. Ca = 22.12 at.% and S = 1.76 at.%, respectively), while, according to the formula, CaS fractions of these elements should be approximately equal. Furthermore, oxygen and carbon were contained in this area, which can be explained by the assumption that the calcium and sulfur compounds were formed only on the surface of mineral grains, whereas the penetration depth of the current was deeper than the layer of calcium with sulfur thickness. Thus, in the obtained spectra, the elemental compositions of calcium oxide, hydroxide, and calcium carbonate may be reflected.
Structural alterations in the carbonate mineral matrix were determined by BIB-SEM. Fine-grained aggregates appeared in areas of carbonate crystals with a grain size of 0.23–0.30 µm. Aggregates were highly porous with a pore size about 0.1–0.25 µm. Carbonate mineral crystals were fractured intensively at the T = 800 °C according to SEM (Figure 6).

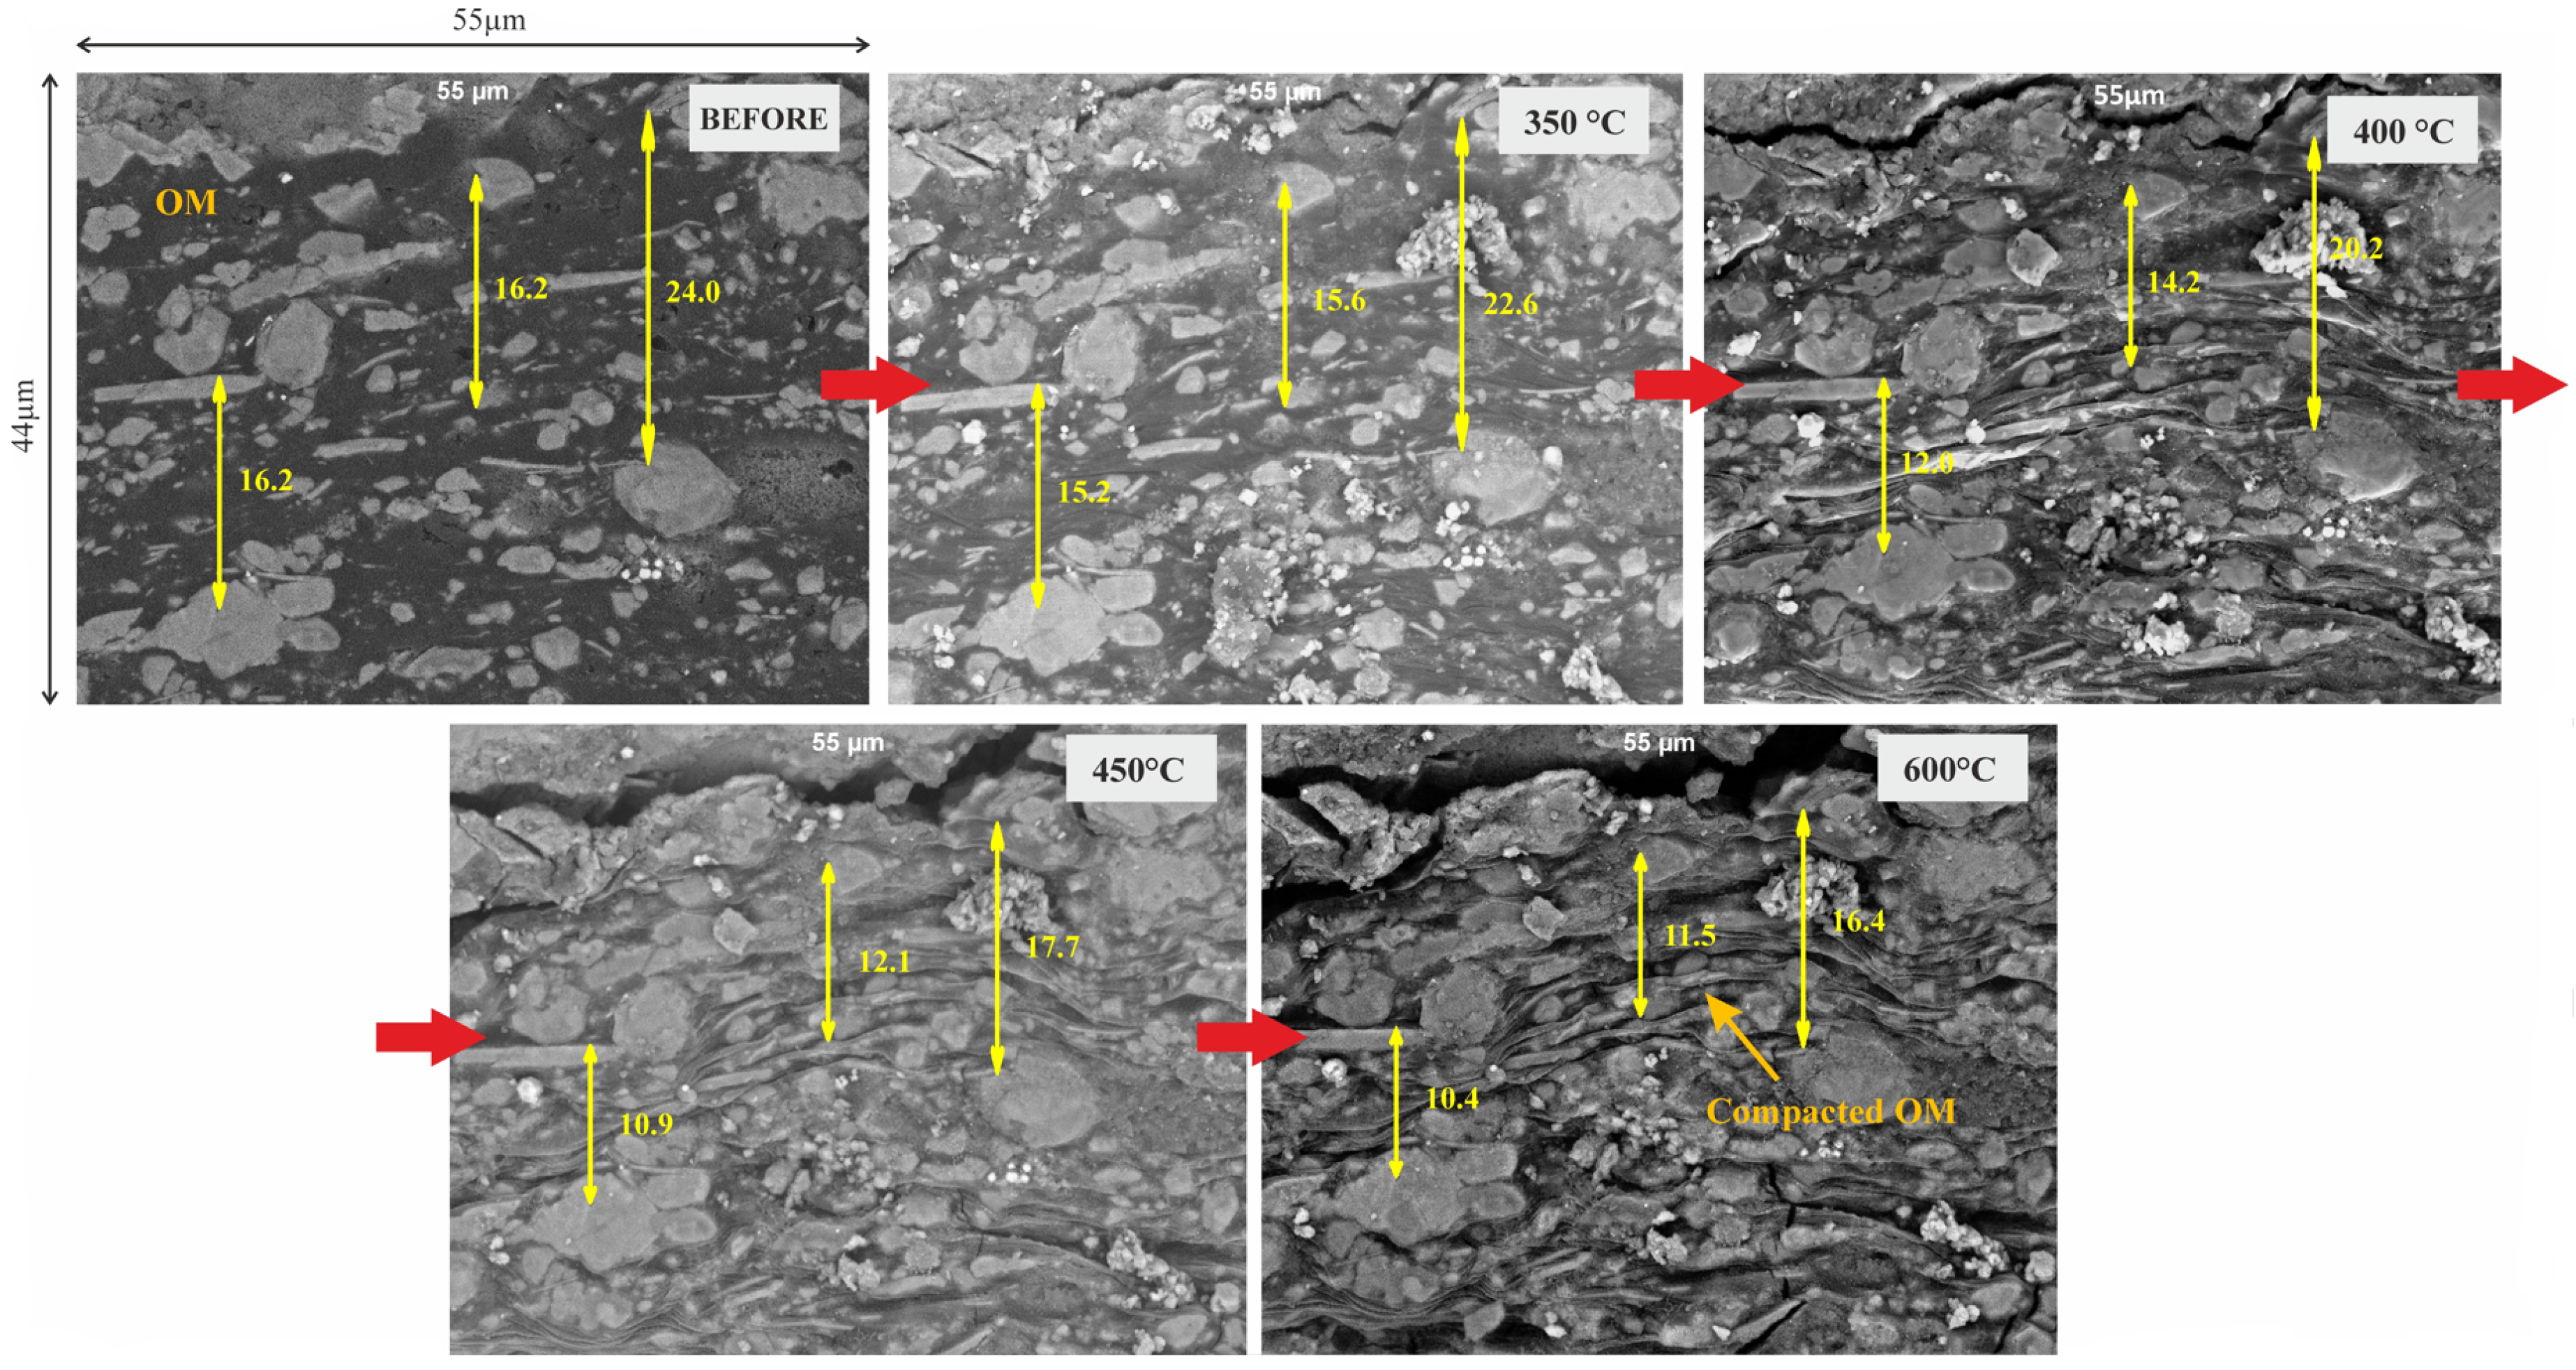
3.2. Organic Matter Alterations

We monitored both morphological changes in organic matter and changes in pyrolytic parameters during heating. Major morphological changes were observed in a temperature range of 350–600 °C, which included squeezing and compaction of kerogen, as well as fracture formation. Squeezing and compaction of organic matter were determined from SEM images, which clearly showed the convergence of mineral grains as the heating temperature increased (Figure 7). The shrinkage occurred parallel to the bedding and in areas rich in organic matter, where mineral grains seemed to “float” in kerogen. The average extent of compaction calculated for 10 different distances between grains was about 32%.
In addition to compaction, fractures formed in OM at the temperature of 450 °C (Figure 8). The fracture length varied from 1 to 5 µm. The aperture increased with temperature from less than 0.3 µm to 0.5–1.12 µm.
The HAWK pyrolysis procedure showed that the extent of thermal maturation changed to more mature, and the hydrocarbon generation potential decreased with an increase in pyrolysis temperature. As expected, the amounts of free (S0) and adsorbed (S1) hydrocarbons (HC) decreased almost to zero after heating at 400 °C. The amount of generated HC (S2) decreased by almost 60% at 400 °C in comparison with the amount before heating, whereas, at 600 °C and 800 °C, it decreased by more than 99% and became close to zero. No significant changes were observed in the S3 parameter. The total organic carbon (TOC) parameter showed a gradual decrease with temperature where generative organic carbon (GOC) decreased threefold at 400 °C, becoming almost zero at 600 °C and 800 °C, while nongenerative organic carbon (NGOC) stayed approximately the same (Figure 9).

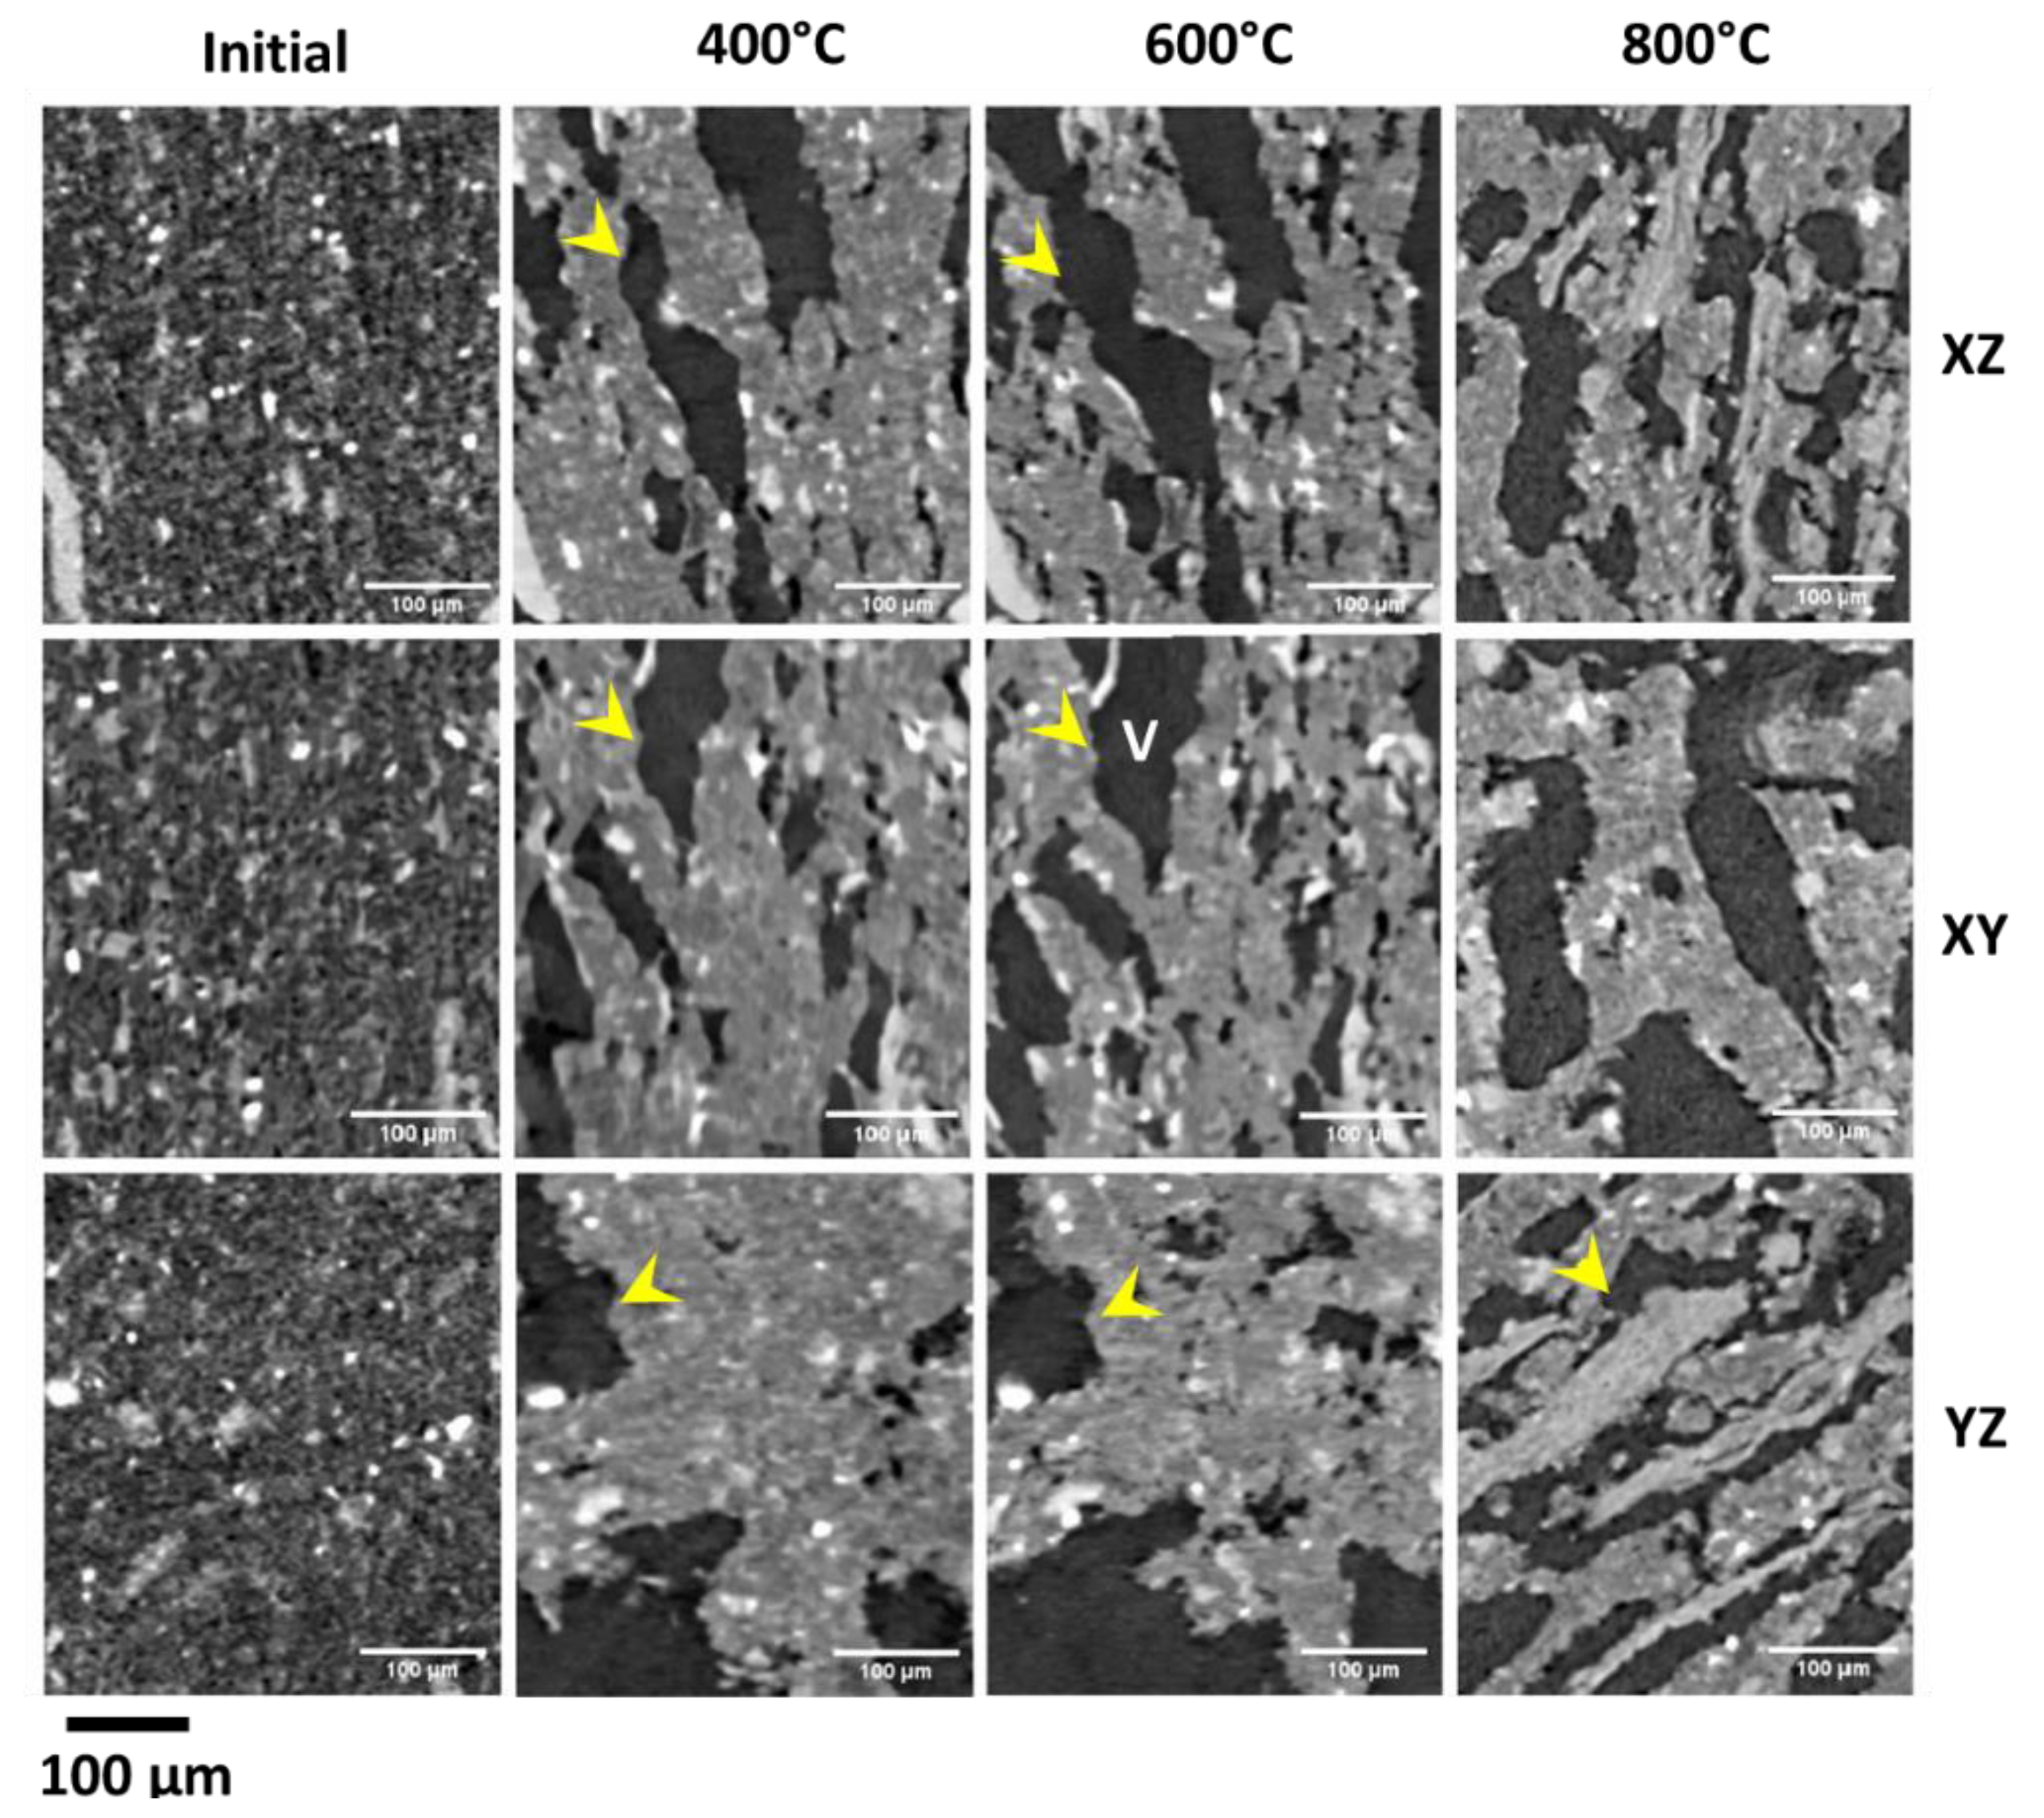
3.3. Porous Media Alterations

Micro-computed tomography enabled the assessment of porous media evolution inside the rock sample, and not only at the surface in contrast to SEM; however, the relatively rough resolution compared to SEM did not allow to identify pores less than 3 µm or to attribute such pores to the mineral matrix or organic matter. Results of tomography showed the appearance of fractures and vugs at 400 °C, whereas, at 600–800 °C, the complication of the fracture network was determined (Figure 10).
SEM enabled studying structural alterations, including void space changes at a micro level, as well as determining the attribution of voids to rock components (organic matter or minerals). However, the void space evolution could only be studied on the sample’s polished surface.
The net impact of heat treatment on porous media was evaluated by the quantification of porosity using BIB-SEM large-area images and micro-CT scans; results are shown in Figure 11. Figure 11 shows the dramatic difference in porosity obtained from the micro-CT and BIB-SEM. The difference was caused by micro-CT taking into account all the resolved micro- and macrofractures during void space segmentation and calculation, whereas the SEM images accounted only for the pores formed in the carbonate mineral matrix and kerogen.
The following types of newly formed pores were determined at different heating steps, according to SEM and micro-CT:
  • Main fractures, which tended to form at the interfaces between minerals and OM, the formation of such fractures was determined by both SEM (Figure 7) and micro-CT (Figure 9);
  • Fractures inside mineral grains (Figure 6, 800 °C);
  • Fractures inside OM (Figure 6);
  • Voids in kerogen and between grains, which are related to kerogen squeezing (Figure 7).
  • Pores in mineral matrix in areas of decomposed minerals (Figure 8).

4. Discussion

4.1. The Nature of Structural Alterations during Thermal Carbonate Mineral Matrix Decomposition

According to the literature, calcite decomposes to solid calcium oxide CaO and gaseous carbon dioxide via the following reaction [47]:
CaCO3(s) → CaO(s) + CO2.
Dolomite decomposition is more complex. It decomposes according to the following reaction [48]:
CaMg(CO3)2 → CaCO3 + MgO + CO2 → CaO + MgO + CO2.
The temperature, the rate of carbonate thermal decomposition, and the morphology of decomposition products vary depending on many factors such as the initial particle size, molecular structure, perfection of the crystal lattice, composition of the surrounding atmosphere, and the influence of additives [47,49]. According to many studies, calcite starts to decompose in inert atmosphere at temperatures of 565–806.6 °C [28,47,50]. XRPD data obtained from sample Ch-46t showed that the decomposition of the carbonates occurred at the temperature of 800 °C in our experiment, which means that the decomposition of Domanik Formation carbonates occurs in the range of 600–800 °C.
In the sample studied, not only did Ca and Mg oxides form as a result of carbonate (calcite, dolomite) decomposition, but new minerals—oldhamite CaS, portlandite Ca(OH)2, and wollastonite CaSiO3—were also formed. This was a result of the interaction of carbonate minerals with other shale components during the decomposition process.
Oldhamite CaS is a rare mineral which is found in meteorites in nature [51], and is also formed in burning coal dumps [52].
The CaS formation from calcite and its decomposition products were investigated in a number of studies.
Oh and Wheelock [53] heated CaO pellets in a mixture of gases containing SO2 gas, and they determined that the formation of oldhamite occurred when the system reducing potential PCO/PCO2 was increased. They described this process by the following reaction:
CaO + SO2 + 3CO → CaS + 3CO2.
Kim Hoong et al. [54] theoretically assessed the possibility of CaS formation from CaCO3, Ca(OH)2, and CaO during reactions with S2, SO2, or H2S at high temperatures. They concluded that, in the presence of disulfur (S2) or sulfur dioxide SO2 gases, at high temperatures, calcite and its decomposition products could form CaS and CaSO4 with carbon dioxide or water in some cases; in the presence of H2S gas, the formation of CaS with water and, in the case of calcite, with CO2 was possible.
As shown above, the formation of CaS compound at high temperatures is possible during the interaction of CaCO3, CaO, or Ca(OH)2 with sulfur-bearing gases. These gases may be generated in organic-rich rocks during pyrolysis. H2S release from coal during pyrolysis in an N2 inert atmosphere was detected by Chen et al. [55], while Yani et al. [56] also detected the release of H2S and SO2 gases from pyrolized lignite samples. Mozaffari et al. [57] showed the release of sulfur compounds in Estonian kukersite shale oil obtained using pyrolysis at temperatures lower than 520 °C; in particular, they demonstrated that the presence of steam during pyrolysis led to an increase in H2S release.
The source of sulfur-containing gases can be both inorganic and organic compounds. The pyrite mineral represents an inorganic compound contained in the studied samples that can generate sulfur-containing gases by itself or by interacting with other components during pyrolysis.
The process of pyrite decomposition in an inert atmosphere occurs stepwise according to the following [58]: FeS2 (pyrite) → FeSx (pyrrhotite) → FeS (troilite) → Fe (iron). During this process, gaseous sulfur (Sn) is released, with the dominance of S2 gas [52]. This gas may react with calcium-bearing components to form CaS mineral.
A sulfur-containing organic matter can be a source of H2S gas. Calkins [59] detected that disulfides, mercaptans, and aliphatic sulfides generated hydrogen sulfide at temperatures of 700–850 °C during coal pyrolysis.
Sulfur-bearing gases may also be produced by the interaction between pyrite decomposition products and organic matter. The authors of [60] proposed that hydrogen sulfide may be generated at the interface between the organic coal matrix and FeS during heating. Calkins [59] suggested that sulfur gas released from decomposing pyrite can react with the hydrogen in components of organic matter such as alkyl or hydroaromatic compounds forming hydrogen sulfide gas. Yani et al. [56] suggested that SO2 gas may be generated in pyrite-bearing lignite samples via the reaction of pyrrhotite with oxygen present in lignite.
On the basis of the above, we suggest the following possible variants of oldhamite CaS formation in the Ch-46t sample at 800 °C considering that no CaSO4 was detected in the XRPD results:
  • From CaO via interaction with SO2 and CO according to Equation (3), where SO2 can be generated via the reaction between pyrrhotite and oxygen contained in organic matter;
  • From calcite, calcium oxide, or hydroxide in contact with H2S gas via the following reactions suggested by Kim Hoong et al. [54]:
    CaCO3 + H2S → CaS + H2O + CO2,
    or
    CaO + H2S → CaS + H2O,
    or
    Ca(OH)2 + H2S → CaS + 2 H2O,
    where H2S can be generated from organic matter or from the interaction of organic matter and products of pyrite decomposition.
Another compound generated from the carbonate mineral matrix is portlandite Ca(OH)2. Portlandite is a hydroxide-containing mineral which can be found in metamorphic rocks in nature as an alteration product of calcium silicates or as a product of precipitation from springs in ultrabasic rock; it can also be found in fumaroles, burned coal, or spontaneously combusted bitumen-rich sedimentary rocks [61].
Portlandite can be formed via the reaction between CaO and water [62].
CaO + H2O → Ca(OH)2.
Hydration of CaO can occur in the presence of water in both either a liquid or a gaseous state [63]. At high temperatures during pyrolysis, water is assumed to be in the form of vapor in the studied sample. The source of water can be different: chemically joined water released from clay minerals due to heating, water released from organic matter, or pore water.
The structural alterations of the carbonate matrix at 800 °C were caused by the formation of new components.
The formation of oxides from carbonates may provide a significant complication of mineral matrix with new pore formation. According to Rodrigues-Navarro et al. [27], CaO forms as a pseudomorph in calcite crystals, and it is characterized by a fine-grained porous structure. They heated calcite crystals in a temperature range of 600–1150 °C and determined by FE-SEM that, at temperatures of 700–750 °C, highly porous CaO nanocrystal aggregates formed at the edges of calcite pockets. Porosity in this new structure increased to 34% with a pore size of about 15 nm. These rod-shaped CaO nanocrystals were characterized by a thickness of 20 nm, up to a few micrometers long. The edges of the pockets were straight and parallel to the edges of the calcite rhombohedron.
Portlandite formation from CaO may cause a porosity reduction in highly porous CaO aggregates. In a solid–vapor system, portlandite replaces the original sites of CaO; as the specific volume of portlandite is greater than that of CaO, the newly formed products push apart the original sites, thereby providing expansion [63]. The observed fine-grained structures may be oxides or hydroxides of calcium.
Oldhamite formed as a crust at the calcite crystal surfaces. This did not lead to significant structural changes; however, it prevented the transformation of calcite into calcium oxide due to its specific morphology.
Sulfur-bearing gases contained in a formation or formed during thermal EOR (pyrite decomposition and kerogen thermal cracking) are unfavorable components during hydrocarbon production. They can both damage well equipment and harm the surrounding environment. Sulfur trapping in carbonate decomposition products (in the form of CaS and, probably, MgS) is a positive phenomenon capable of reducing the harm caused by sulfur. Although CaS can dissolve in water, it naturally prevents CaCO3 transformation to CaO and Ca(OH)2 at surfaces of decomposed carbonates, thus preventing additional porosity. However, CaS formed as a crust on carbonate crystals prone to fracking, possibly due to grain expansion during portlandite formation. Ultimately, the fractures formed increased the pore space connectivity.

4.2. Kerogen Microstructural Transformation

Kerogen is an organic material that is insoluble in organic solvents and capable of generating hydrocarbons [64]. The kerogen structure is represented as a macromolecule composed of condensed carbocyclic nuclei connected by heteroatomic bonds or aliphatic chains. Kerogen is amorphous, and its carbon skeleton is porous [65]. The latter, which consists of large chains of aromatic and aliphatic carbons, is highly elastic, a characteristic that impacts the geomechanics of a shared matrix. The chemical structure and porosity of kerogen may be defined by the following: the extent of maturation, the kerogen’s origin (which affects its mechanical properties), and its thermal behavior, including squeezing and fracturing.
The ability of solid kerogen to undergo shrinkage was detected by Budinova et al. [66] and Saad Alafnan [67]. Budinova et al. found that solid kerogen could flow during heating even at low temperatures. Kerogen samples were heated in an open system in a pyrolizer with an intercepted diamond anvil cell, and the squeezing and flow of studding matter were detected at temperatures lower than 160 °C [66]. Saad Alafnan studied the mechanical properties of kerogen, and identified that, as the temperature increased, kerogen underwent prolonged plastic deformation before failure. Vasiliev et al. [68] showed that the kerogen of the Bazhenov Formation became porous with increasing thermal maturation, as a result of microstructural alterations of kerogen in organic-rich shale. In our study, we observed a different effect; instead of pore formation, progressive compaction occurred. This compaction was closely related to the organic porosity, as revealed by the abovementioned researchers. When the mineral matrix serves as a rock skeleton and organic matter (kerogen) fills the voids between the grains, thermal maturation leads to the formation of organic pores. However, when organic matter represents a significant volume of rock (mineral matrix and kerogen are equal), such as in this study, organic matter shrinks during thermal maturation. We suggest that this was a result of the formation of hydrocarbons with the resulting mass loss of the rock.
The elastoplastic properties of kerogen, which may influence its ability to be squeezed, are defined by its microstructure. Saad Alafnan, investigating the link between the petrophysics of kerogen on a molecular level and its mechanical properties, identified that kerogen with the lowest porosity showed the highest degree of elasticity; contrarily, kerogen with the highest porosity showed a higher tendency toward plastic deformation.
The extent of maturation may also influence the mechanical properties of kerogen. Bousige [65] found that immature kerogens tend to exhibit ductile behavior, whereas mature kerogens are characterized by brittle behavior.
Kerogen shrinkage during pyrolysis, which is characteristic for areas in the rock with extremely high organic matter content, may negatively influence reservoir properties. The compaction of kerogen may cause the compaction of the whole volume of rock, contributing to the closure of pores and fractures. On the contrary, fracture formation results in additional porosity and may enhance reservoir properties.
The experimental design involved heat treatment in an open system at atmospheric pressure. However, real subsurface EOR occurs at lithostatic and reservoir pressure. There are only a few experiments under high pressure available in the literature, which indicated the formation of organic pores at temperatures generally lower than we observed. For example, at 333 °C, Ko et al. [69] demonstrated spongy pores after hydrous pyrolysis. We might expect the formation of organic porosity earlier in the presence of water and reservoir pressure. In turn, the lithostatic pressure potential might prevent formation of organic pores. The influence of reservoir pressure on carbonate mineral decomposition is poorly studied, and there are contradictory data in the literature. Some researchers found that high pressure induces polymorph transitions [70], while others stated that high pressure influences the decomposition temperature [71]. There are no available data on Domanik mineral matrix transformation under reservoir pressure conditions, and a detailed study is needed. The second aspect is the presence of water in the subsurface during real EOR application. There are several aspects to consider when using anhydrous pyrolysis. Firstly, despite no water being used in the experiment, water is still present in the Domanik Formation sample [72,73,74], and it can also be naturally generated during the thermal cracking of kerogen [75]. Secondly, a number of EOR shale-oriented techniques utilize gases, such as high-pressure air injection with further self-pyrolysis [76] and CO2 or N2 injection [77,78,79,80]. Thirdly, there are ex situ shale retorting techniques which use pyrolysis [81]. Anhydrous pyrolysis is a cheap and fast method for the artificial maturation of organic-rich shale. However, at the same time, it might be the source of potential biases, which are related to the presence of water and reservoir pressure. Using the results presented in the paper, advanced experiments, including water, reservoir, and lithostatic pressure, should be designed to evaluate the whole spectrum of in-situ alterations.

5. Conclusions

A Domanik Formation organic-rich shale sample was pyrolyzed in an inert atmosphere and ambient pressure at temperatures in the range of 350–800 °C. Alterations of the carbonate mineral matrix and organic matter, as well as the evolution of porous media, were investigated using a variety of methods. According to the experiments conducte and their interpreted results, the following conclusions could be drawn:
  • High-temperature treatment induced a significant alteration of the carbonate mineral matrix in Domanik Formation shale. The alteration included the decomposition of carbonates and the formation of new minerals, such as lime, periclase, portlandite, and oldhamite;
  • The decomposition of carbonates in a shale multicomponent medium is more complicated than in pure carbonates: CaS was formed in the presence of sulfur-containing components such as pyrite and OM, whereas Ca(OH)2 was formed in the presence of water;
  • The void space of Domanik Formation shale evolved through the temperature treatment. At the temperature of 350 °C, fractures started to appear at the edges between components, whereas, at 450 °C fractures appeared within the organic matter. Micropores in the carbonate mineral matrix formed after carbonate thermal decomposition at T = 800 °C. The bulk porosity increased from almost zero in the initial state to 6.7% at T = 800 °C;
  • The microstructure of organic matter was significantly altered during the treatment of Domanik Formation rocks. Microfractures formed in the OM at T = 400 °C, while shrinkage and compaction occurred in the temperature range of 350–600 °C by approximately 32%.

Author Contributions

Conceptualization, T.K., V.W. and M.S.; methodology, T.K., E.K., V.W., E.I. and A.M.; software, V.W., T.K. and A.B.; formal analysis, V.W. and A.M.; investigation, T.K., E.K., A.B., V.W., E.I. and A.M.; resources, M.S.; data curation, T.K.; writing—original draft preparation, V.W.; writing—review and editing, T.K.; visualization, V.W.; supervision, M.S.; project administration, M.S.; funding acquisition, M.S. All authors read and agreed to the published version of the manuscript.

Funding

This work was supported by the Ministry of Science and Higher Education of the Russian Federation under agreement No. 075-10-2022-011 within the framework of the development program for a world-class research center.

Data Availability Statement

The data presented in this study are available on request from the corresponding author. The data are not publicly available due to commercial report restrictions.

Acknowledgments

The authors would like to thank the Center for Petroleum Science and Engineering Laboratory members for technical support.

Conflicts of Interest

The authors declare no conflict of interest. The funders had no role in the design of the study; in the collection, analyses, or interpretation of data; in the writing of the manuscript, or in the decision to publish the results.

References

  1. Shmaefsky, B. The Past, Present, and Future of Earth’s Natural Resources (November 2018): The Future of Earth’s Natural Resources. Available online: https://ala-choice.libguides.com/c.php?g=879515&p=6319563 (accessed on 10 June 2022).
  2. International Energy Agency (IEA). Oil 2021, Analysis and Forecast to 2026. 2021. Available online: https://iea.blob.core.windows.net/assets/1fa45234-bac5-4d89-a532-768960f99d07/Oil_2021-PDF.pdf (accessed on 10 June 2022).
  3. Cozzi, L.; Gould, T.; Bouckart, S.; Crow, D.; Kim, T.Y.; Mcglade, C.; Olejarnik, P.; Wanner, B.; Wetzel, D. World Energy Outlook 2020; IEA: Paris, France, 2020; Volume 2050, pp. 1–461. [Google Scholar]
  4. The Organization of the Petroleum Exporting Countries (OPEC). OPEC World Oil Outlook (WOO). 2020. Available online: https://www.opec.org/opec_web/en/press_room/6147.htm (accessed on 10 June 2022).
  5. Tsvetkov, L.D.; Tsvetkova, N.L. Shale Oil of Russia. Sci. Tech. Collect. News Gas Sci. 2013, 16, 219–230. [Google Scholar]
  6. Stupakova, A.V.; Kalmykov, G.A.; Fadeeva, N.P.; Bogomolov, A.K.; Kiryukhina, T.A.; Korobova, N.I.; Maltsev, V.V.; Pronina, N.V.; Sautkin, R.S.; Suslova, A.A.; et al. On the Estimation of Shale-Oil Resources and Reserves. Moscow Univ. Geol. Bull. 2015, 70, 183–190. [Google Scholar] [CrossRef]
  7. U.S. Energy Information Administration (EIA). World Shale Resource Assessments. 2015. Available online: https://www.eia.gov/analysis/studies/worldshalegas/. (accessed on 10 June 2022).
  8. Rezaee, R. (Ed.) Fundamentals of Gas Shale Reservoirs; John Wiley and Sons: Hoboken, NJ, USA, 2015. [Google Scholar]
  9. Palacas, J.G. PD 1(3) Carbonate Rocks as Sources of Petroleum: Geological and Chemical Characteristics and Oil-Source Correlations. In Proceedings of the 11th World Petroleum Congress, London, UK, 28 August 1983. [Google Scholar]
  10. Karamov, T.; Mukhametdinova, A.; Bogdanovich, N.; Plotnikov, V.; Khakimova, Z. Pore Structure Investigation of Upper Devonian Organic-Rich Shales within the Verkhnekamsk Depression. In Proceedings of the International Multidisciplinary Scientific GeoConference: SGEM, Varna, Bulgaria, 30 June–6 July 2019; Volume 19, pp. 1045–1051. [Google Scholar]
  11. Zou, C. Unconventional Petroleum Geology; Elsevier: Amsterdam, The Netherlands, 2017; p. 500. [Google Scholar]
  12. Ryan, R.C.; Fowler, T.D.; Beer, G.L.; Nair, V. Shell’s In Situ Conversion Process−From Laboratory to Field Pilots. In Oil Shale: A Solution to the Liquid Fuel Dilemma; American Chemical Society: Washington, DC, USA, 2010; pp. 161–183. [Google Scholar] [CrossRef]
  13. Hazra, K.G.; Lee, K.J.; Economides, C.E.; Moridis, G. Comparison of Heating Methods for In-situ Oil Shale Extraction. In Proceedings of the IOR 2013-17th European Symposium on Improved Oil Recovery, St. Petersburg, Russia, 16–18 April 2013. [Google Scholar] [CrossRef] [Green Version]
  14. Kangac, Z.; Zhao, Y.; Yang, D. Review of Oil Shale In-situ Conversion Technology. Appl. Energy 2020, 269, 115121. [Google Scholar] [CrossRef]
  15. Kar, T.; Hascakir, B. In-situ kerogen extraction via combustion and pyrolysis. J. Pet. Sci. Eng. 2017, 154, 502–512. [Google Scholar] [CrossRef]
  16. Lee, K.; Moridis, G.J.; Ehlig-Economides, C.A. A Comprehensive Simulation Model of Kerogen Pyrolysis for the In-situ Upgrading of Oil Shales. SPE J. 2016, 21, 1612–1630. [Google Scholar] [CrossRef] [Green Version]
  17. Kobchenko, M.; Panahi, H.; Renard, F.; Dysthe, D.K.; Malthe-Sørenssen, A.; Mazzini, A.; Scheibert, J.; Jamtveit, B.; Meakin, P. 4D Imaging of Fracturing in Organic-Rich Shales During Heating. J. Geophys. Res. Solid Earth 2011, 116, B12201. [Google Scholar] [CrossRef]
  18. Saif, T.; Lin, Q.; Singh, K.; Bijeljic, B.; Blunt, M.J. Dynamic Imaging of Oil Shale Pyrolysis using Synchrotron X-ray Micro-tomography: Dynamic Imaging of Oil Shale Pyrolysis. Geophys. Res. Lett. 2016, 43, 6799–6807. [Google Scholar] [CrossRef] [Green Version]
  19. Bai, F.; Sun, Y.; Liu, Y.; Guo, M. Evaluation of the porous structure of Huadian oil shale during pyrolysis using multiple approaches. Fuel 2017, 187, 1–8. [Google Scholar] [CrossRef]
  20. Geng, Y.; Liang, W.; Liu, J.; Cao, M.; Kang, Z. Evolution of Pore and Fracture Structure of Oil Shale under High Temperature and High Pressure. Energy Fuels 2017, 31, 10404–10413. [Google Scholar] [CrossRef]
  21. Kim, T.W.; Ross, C.M.; Guan, K.; Burnham, A.K.; Kovscek, A.R. Permeability and Porosity Evolution of Organic Rich Shales as a Result of Heating. In Proceedings of the SPE Western Regional Meeting, San Jose, CA, USA, 23 April 2019. [Google Scholar]
  22. Mukhametdinova, A.; Mikhailova, P.; Kozlova, E.; Karamov, T.; Baluev, A.; Cheremisin, A. Effect of Thermal Exposure on Oil Shale Saturation and Reservoir Properties. Appl. Sci. 2020, 10, 9065. [Google Scholar] [CrossRef]
  23. Gafurova, D.R.; Korost, D.V.; Kozlova, E.V.; Kalmykov, A.G.; Kalmykov, G.A. Changes in The Void Space of Various Lithotypes of Kerogen-Saturated Rocks of The Domanic Formation at Different Heating Rates. Georesources 2017, 19, 255–263. [Google Scholar] [CrossRef]
  24. Gafurova, D.R.; Kalmykov, A.; Korost, D.; Kalmykov, G. Macropores Generation in the Domanic Formation Shales: Insights from Pyrolysis Experiments. Fuel 2021, 289, 119933. [Google Scholar] [CrossRef]
  25. Kovaleva, L.; Zinnatullin, R.; Musin, A.; Kireev, V.; Karamov, T.; Spasennykh, M. Investigation of Source Rock Heating and Structural Changes in the Electromagnetic Fields Using Experimental and Mathematical Modeling. Minerals 2021, 11, 991. [Google Scholar] [CrossRef]
  26. Nasyrova, Z.R.; Kayukova, G.P.; Shunina, E.N.; Islamova, G.G.; Batalin, G.A.; Morozova, E.V.; Vakhin, A.V.; Nurgaliev, D.K. Thermal Decomposition of Kerogen in High-Carbon Domanic Rock of the Romashkino Oilfield in Sub-and Supercritical Water. Energy Fuels 2022, 36, 3549–3562. [Google Scholar] [CrossRef]
  27. Rodriguez-Navarro, C.; Ruiz-Agudo, E.; Luque, A.; Rodriguez-Navarro, A.B.; Ortega-Huertas, M. Thermal Decomposition of Calcite:Mechanisms of Formation and Textural Evolution of CaO Nanocrystals. Am. Mineral. 2009, 94, 578–593. [Google Scholar] [CrossRef]
  28. Jukkola, E.E.; Denilauler, A.J.; Jensen, H.B.; Barnet, W.I.; Murphy, W.I.R. Thermal Decomposition Rates of Carbonates in Oil Shale. Ind. Eng. Chem. 1953, 45, 2711–2714. [Google Scholar] [CrossRef]
  29. Fortunatova, N.K.; Zayceva, E.L.; Bushueva, M.A.; Shvec-Teneta-Gutiy, A.G.; Baranova, A.V.; Kononova, L.I.; Rahimova, E.V.; Mikheeva, A.I.; Olenova, N.V.; Avdeeva, A.A. Unified Sub-Regional Stratigraphic Schematic of the Upper Devonian Sediments of the Volga-Ural Sub-Region; Explanatory Note; VNIGRI: Moscow, Russia, 2018; p. 63. (In Russian) [Google Scholar]
  30. Kiruhina, T.A.; Fadeeva, N.P.; Stupakova, A.V.; Poludetkina, E.N.; Sautkin, R.S. Domanic deposits of the Timan-Pechora and Volga-Ural Basins. Oil Gas Geol. 2013, 3, 76–87. [Google Scholar]
  31. Lianga, X.; Jina, Z.; Philippov, V.; Obryadchikov, O.; Zhong, D.; Liu, Q.; Uspensky, B.; Morozov, V. Sedimentary characteristics and evolution of Domanik facies from the Devonian–Carboniferous regression in the southern Volga-Ural Basin. Mar. Pet. Geol. 2020, 119, 104438. [Google Scholar] [CrossRef]
  32. Gabnasyrov, A.V.; Lyadova, N.A.; Putilov, I.S.; Solovyev, S.I. Domanik Shale Oil: Unlocking Potential. In Proceedings of the SPE Russian Petroleum Technology Conference and Exhibition, Moscow, Russia, 11 October 2016. [Google Scholar] [CrossRef]
  33. Fadeeva, N.P.; Kozlova, E.V.; Poludetkina, E.N.; Shardanova, T.A.; Pronina, N.V.; Stupakova, A.V.; Kalmykov, G.A.; Khomyak, A.N. The Hydrocarbon-Generation Potential of the Domanik Rocks in the Volga–Ural Petroliferous Basin. Mosc. Univ. Geol. Bull. 2016, 71, 41–49. [Google Scholar] [CrossRef]
  34. Bazhenova, T.K. Mixed rocks containing non-carbonate carbon. In Systematics and Classification of Sedimentary Rocks and Their Analogues; Nedra: St. Petersburg, Russia, 1998; pp. 265–269. [Google Scholar]
  35. Bushev, D.A.; Burdel’naya, N.S.; Valyaeva, O.V.; Derevesnikova, A.A. Geochemistry of Late Devonian Oils of the Timan-Pechora Basin. Russ. Geol. Geophys. 2017, 58, 332–342. [Google Scholar] [CrossRef]
  36. Prishchepa, O.M.; Averyanova, O.Y. The notion base and the paramount objects of unconventional raw hydrocarbons supply. Oil Gas J. (Online J.) 2013, 10, 1–11. Available online: http://oilgasjournal.ru/vol_10/prishchepa.html (accessed on 10 June 2022).
  37. Kiseleva, Y.A.; Zheglova, T.P.; Dakhnova, M.V.; Mozhegova, S.V.; Nazarova, E.S.; Nechitailo, G.S. The role of Domanik deposits in the formation of oil pools in the central areas of the Volga–Ural petroleum province (Buzuluk depression). Russ. Geol. Geophys. 2017, 58, 310–321. [Google Scholar] [CrossRef]
  38. Vashkevich, A.A.; Strizhnev, K.V.; Shashel, V.A.; Zakharova, O.A.; Kasyanenko, A.A.; Zagranovskaya, D.E.; Grebenkina, N.Y. Forecast of prospective areas for sediment type Domanic in the Volga-Ural oil and gas province (Russian). Neftyanoe Khozyaystvo-Oil Ind. 2018, 12, 14–17. [Google Scholar] [CrossRef]
  39. Kadurov, R.; Galiullin, B.; Statsenko, E.O. The porous space structure of Domanik shales in the East of Russian plate. In Proceedings of the 18th International Multidisciplinary Scientific GeoConference SGEM2018, Science and Technologies in Geology, Exploration and Mining, Albena, Bulgaria, 2–8 July 2018; Volume 18, pp. 907–914. [Google Scholar]
  40. Bogdanovich, N.; Kozlova, E.; Karamov, T. Lithological and Geochemical Heterogeneity of the Organo-Mineral Matrix in Carbonate-Rich Shales. Geosciences 2021, 11, 295. [Google Scholar] [CrossRef]
  41. Stoupakova, A.V.; Kalmykov, G.A.; Korobova, N.I.; Fadeeva, N.P.; Gatovskii, Y.A.; Suslova, A.A.; Sautkin, R.S.; Pronina, N.V.; Bolshakova, M.A.; Zavyalova, A.P.; et al. Oil-Domanic deposits of the Volga-Ural basin–types of section, formation conditions and prospects of oil and gas potential. Georesursy. Georesources 2017, 1, 112–124. [Google Scholar] [CrossRef]
  42. Sanei, H. Genesis of solid bitumen. Sci. Rep. 2020, 10, 15595. [Google Scholar] [CrossRef]
  43. Hart, B.S.; Steen, A.S. Programmed pyrolysis (Rock-Eval) data and shale paleoenvironmental analyses: A review. Interpretation 2015, 3, SH41–SH58. [Google Scholar] [CrossRef]
  44. Lopatin, N.V. Emets TP Piroliz V Neftegazovoy Geokhimii; Nauka: Moscow, Russia, 1987; p. 145. (In Russian) [Google Scholar]
  45. Mastalerz, M.; Schieber, J. Effect of ion milling on the perceived maturity of shale samples: Implications for organic petrography and SEM analysis. Int. J. Coal Geol. 2017, 183, 110–119. [Google Scholar] [CrossRef]
  46. Schneider, C.A.; Rasband, W.S.; Eliceiri, K.W. NIH Image to ImageJ: 25 years of image analysis. Nat. Methods 2012, 9, 671–675. [Google Scholar] [CrossRef]
  47. Shahraki, B.K.; Mehrabi, B.; Gholizadeh, K.; Mohammadinasab, M. Thermal behavior of calcite as an expansive agent. J. Min. Metall. Sect. B Metall. 2011, 47, 89–97. [Google Scholar] [CrossRef]
  48. Belousov, M.V.; Selivanov, E.N.; Gulyaeva, R.I.; Tyushnyakov, S.N.; Rakipov, D.F. Thermodynamics and Kinetics of the Thermal Dissociation of Dolomite. Russ. J. Non-Ferr. Met. 2016, 57, 180–186. [Google Scholar] [CrossRef]
  49. Cherkasov, A.V. Low-Energy Technology of Binder Compositions with Controlled Expansion Based on Magnesium-Containing Materials. Ph.D. Thesis, V.G. Technological University, Belgorod Oblast, Russia, 2006. [Google Scholar]
  50. Topor, N.D.; Ogorodova, L.P.; Melchakova, L.V. Thermal Analysis of Minerals and Inorganic Compounds; Nauka: Moscow, Russia, 1987. (In Russian) [Google Scholar]
  51. Haberle, C.W.; Garvie, L.A. Extraterrestrial formation of oldhamite and portlandite through thermal metamorphism of calcite in the Sutter’s Mill carbonaceous chondrite. Am. Mineral. J. Earth Planet. Mater. 2017, 102, 2415–2421. [Google Scholar] [CrossRef]
  52. Kruszewski, Ł. Oldhamite-periclase-portlandite-fluorite assemblage and coexisting minerals of burnt dump in Siemianowice Ślaskie-Dabrówka Wielka area (Upper Silesia, Poland)—Preliminary report. Mineral. Pol. 2006, 28, 118–120. [Google Scholar]
  53. Oh, J.S.; Wheelock, T.D. Reductive decomposition of calcium sulfate with carbon monoxide: Reaction mechanism. Ind. Eng. Chem. Res. 1990, 29, 544–550. [Google Scholar] [CrossRef] [Green Version]
  54. Ng, K.H.; Liew, S.C.; Zhang, S. Thermodynamic analysis of CaS production from various Ca-based precursors: A prequel to SO2 reduction mediated by CaS/CaSO4 redox agents. Process Saf. Environ. Prot. 2021, 147, 900–911. [Google Scholar] [CrossRef]
  55. Chen, H.K.; Li, B.Q.; Zhang, B.J. Transformation of sulfur during pyrolysis and hydropyrolysis of coal. Fuel 1998, 77, 487. [Google Scholar] [CrossRef]
  56. Yani, S.; Zhang, D. An experimental study into pyrite transformation during pyrolysis of Australian lignite samples. Fuel 2010, 89, 1700–1708. [Google Scholar] [CrossRef]
  57. Mozaffari, S.; Baird, Z.S.; Järvik, O. Sulfur in kukersite shale oil: Its distribution in shale oil fractions and the effect of gaseous environment. J. Therm. Anal. Calorim. 2022, 1, 1–10. [Google Scholar] [CrossRef]
  58. Hu, G.; Dam-Johansen, K.; Wedel, S.; Hansen, J.P. Decomposition and oxidation of pyrite. Prog. Energy Combust. Sci. 2006, 32, 295–314. [Google Scholar] [CrossRef]
  59. Calkins, W.H. Investigation of organic sulfur-containing structures in coal by flash pyrolysis experiments. Energy Fuels 1987, 1, 59–64. [Google Scholar] [CrossRef]
  60. Cleyle, P.J.; Caley, W.F.; Stewart, L.; Whiteway, S.G. Decomposition of pyrite and trapping of sulphur in a coal matrix during pyrolysis of coal. Fuel 1984, 63, 1579–1582. [Google Scholar] [CrossRef]
  61. Anthony, J.W.; Bideaux, R.A.; Bladh, K.W.; Nichols, M.C. (Eds.) Handbook of Mineralogy; Mineralogical Society of America: Chantilly, VA, USA; Available online: http://www.handbookofmineralogy.org/ (accessed on 10 June 2022).
  62. Justnes, H.; Escudero-Oñate, C.; Garmo, Ø.A.; Mengede, M. Transformation Kinetics of Burnt Lime in Freshwater and Sea Water. Materials 2020, 13, 4926. [Google Scholar] [CrossRef] [PubMed]
  63. Ramachandran, V.S.; Sereda, P.J.; Feldman, R.F. Mechanism of Hydration of Calcium Oxide. Nature 1964, 201, 288–289. [Google Scholar] [CrossRef]
  64. Vandenbroucke, M. Kerogen: From Types to Models of Chemical Structure. Oil Gas Sci. Technol. 2003, 58, 243–269. [Google Scholar] [CrossRef] [Green Version]
  65. Bousige, C.; Ghimbeu, C.M.; Vix-Guterl, C.; Pomerantz, A.E.; Suleimenova, A.; Vaughan, G.; Garbarino, G.; Feygenson, M.; Wildgruber, C.; Ulm, F.J.; et al. Realistic molecular model of kerogen’s nanostructure. Nat. Mater. 2016, 15, 576–582. [Google Scholar] [CrossRef] [PubMed]
  66. Budinava, T.; Huang, W.; Racheva, I.; Tsyntsarski, B.; Petrova, B.; Yardim, M.F. Investigation of Kerogen Transformation during Pyrolysis by Applying a Diamond Anvil Cell. Oil Shale 2014, 31, 121. [Google Scholar] [CrossRef] [Green Version]
  67. Alafnan, S. The Impact of Pore Structure on Kerogen Geomechanics. Geofluids 2021, 2021, 4093895. [Google Scholar] [CrossRef]
  68. Vasiliev, A.L.; Pichkur, E.B.; Mikhutkin, A.A.; Spasennikh, M.J.; Bogdanovich, N.N.; Balushkina, N.S.; Kalmikov, G.A. The study of pore space morphology in kerogen from Bazhenov formation. Oil Ind. J. 2015, 10, 28–31. [Google Scholar]
  69. Ko, L.T.; Loucks, R.G.; Zhang, T.; Ruppel, S.C.; Shao, D. Pore and pore network evolution of Upper Cretaceous Boquillas (Eagle Ford-equivalent) mudrocks: Results from gold tube pyrolysis experiments. AAPG Bull. 2016, 100, 1693–1722. [Google Scholar] [CrossRef]
  70. Liu, C.; Zheng, H.; Wang, D. Raman spectroscopic study of calcite III to aragonite transformation under high pressure and high temperature. High Press. Res. 2017, 37, 545–557. [Google Scholar] [CrossRef]
  71. Patil, K.; Jain, S.; Gandi, R.K.; Shankar, H.S. Calcium carbonate decomposition under external pressure pulsations. In Proceedings of the AIChE Annual Meeting, Conference Proceedings, Austin, TX, USA, 7–12 November 2004; pp. 3943–3962. [Google Scholar]
  72. Kazak, E.S.; Kazak, A.V. Experimental features of cation exchange capacity determination in organic-rich mudstones. J. Nat. Gas Sci. Eng. 2020, 83, 103456. [Google Scholar] [CrossRef]
  73. Kazak, E.S.; Kazak, A.V. A novel laboratory method for reliable water content determination of shale reservoir rocks. J. Pet. Sci. Eng. 2019, 183, 106301. [Google Scholar] [CrossRef]
  74. Kazak, E.S.; Kozlova, E.V.; Karamov, T.I.; Bogdanovich, N.N.; Chizhov, D.B. Connate water of the organocarbonate shale rocks of domanic deposits (Russian). Neftyanoe Khozyaystvo-Oil Ind. 2021, 2021, 84–89. [Google Scholar] [CrossRef]
  75. Cavelan, A.; Boussafir, M.; Le Milbeau, C.; Laggoun-Défarge, F. Impact of Oil-Prone Sedimentary Organic Matter Quality and Hydrocarbon Generation on Source Rock Porosity: Artificial Thermal Maturation Approach. ACS Omega 2020, 5, 14013–14029. [Google Scholar] [CrossRef] [PubMed]
  76. Sun, Y.H.; Bai, F.T.; Lü, X.S.; Li, Q.; Liu, Y.M.; Guo, M.Y.; Guo, W.; Liu, B.C. A Novel Energy-Efficient Pyrolysis Process: Self-pyrolysis of Oil Shale Triggered by Topochemical Heat in a Horizontal Fixed Bed. Sci. Rep. 2015, 5, 1–8. [Google Scholar] [CrossRef] [PubMed] [Green Version]
  77. Tovar, F.D.; Barrufet, M.A.; Schechter, D.S. Enhanced oil recovery in the wolfcamp shale by carbon dioxide or nitrogen injection: An experimental investigation. SPE J. 2021, 26, 515–537. [Google Scholar] [CrossRef]
  78. Sheng, J.J. Enhanced oil recovery in shale reservoirs by gas injection. J. Nat. Gas Sci. Eng. 2015, 22, 252–259. [Google Scholar] [CrossRef] [Green Version]
  79. Bauman, J.H.; Deo, M. Simulation of a conceptualized combined pyrolysis, in situ combustion, and CO2 storage strategy for fuel production from green river oil shale. Energy Fuels 2012, 26, 1731–1739. [Google Scholar] [CrossRef]
  80. Bougre, E.S.; Gamadi, T.D. Enhanced oil recovery application in low permeability formations by the injections of CO2, N2 and CO2/N2 mixture gases. J. Pet. Explor. Prod. 2021, 11, 1963–1971. [Google Scholar] [CrossRef]
  81. Yefimov, V.; Li, S. Extraction of oil shale: Surface and in situ retorting. In Coal, Oil Shale, Natural Bitumen, Heavy Oil Peat II; EOLSS Publication: Abu Dhabi, United Arab Emirates, 2009. [Google Scholar]
Figure 1. (a) The geographic location of the Domanik-type rocks; (b) the Domanik Formation in the regional stratigraphic chart.
Minerals 12 00870 g001
Figure 2. Microphotographs of Ch-46t sample, demonstrating organic matter and mineral heterogeneity; 1—mineral components (light color), 2—organic matter (dark brown).
Minerals 12 00870 g002
Figure 3. Schematic representation of the experiment.
Minerals 12 00870 g003
Figure 4. (A) Sample Ch-46t XRD patterns before the experiment and after heating at temperatures of 400 °C, 600 °C, and 800 °C. (B) Evolution of mineral composition during the experiment.
Minerals 12 00870 g004aMinerals 12 00870 g004b
Figure 5. EDX elemental maps and point analysis results for sample Ch-46t at T = 800 °C. Sulfur (S), iron (Fe), calcium (Ca), oxygen (O), and carbon (C) elemental distribution maps combined with SEM image. Yellow line—decomposed pyrite framboid; red line—decomposed calcite grains (lime); blue line—iron grains.
Minerals 12 00870 g005
Figure 6. BIB-SEM images of sample Ch-46t at T = 600 °C and 800 °C. Structural alterations in carbonate mineral matrix occurred at T = 800 °C. Od—oldhamite (CaS); Lm—lime (CaO); Pd—portlandite (Ca(OH)2).
Minerals 12 00870 g006
Figure 7. BIB-SEM images of sample Ch-46t before heating and at T = 350–600 °C illustrating the OM shrinkage.
Minerals 12 00870 g007
Figure 8. t at T = 400, 450, and 800 °C. The appearance of fractures in kerogen at T = 400 °C is shown; the fracture aperture increased with temperature. OM—organic matter; yellow arrows—fractures.
Minerals 12 00870 g008
Figure 9. (A) Free (S0), adsorbed (S1), and generated (S2) hydrocarbon amount, and CO2 (S3) change; (B) total organic carbon alteration after heating up to 800 °C. GOC—generative organic carbons, NGOC—nongenerative organic carbon.
Minerals 12 00870 g009
Figure 10. Micro-CT slices in XZ plane of Ch-46t sample before heating and after heating at 400 °C, 600 °C, and 800 °C (XZ, XY, and YZ planes). Slices for the initial state and at 400 °C and 600 °C were selected for the same areas. Arrows indicate fractures.
Minerals 12 00870 g010
Figure 11. Porosity change during treatment based on BIB-SEM scanning and micro-CT. The significant difference in porosity was caused by the accounting of all resolved fractures by micro-CT, whereas SEM only accounted for pores in the carbonate matrix and kerogen.
Minerals 12 00870 g011
Table 1. Mineral composition of sample Ch-46t according to X-ray powder diffractometry.
Calcite, %Quartz, %Microcline, %Illite, %Dolomite, %Pyrite, %
48.522.617.67.51.91.9
Publisher’s Note: MDPI stays neutral with regard to jurisdictional claims in published maps and institutional affiliations.

