Abstract
This paper presents the investigations of selected properties of concrete containing two fractions of fly ash microspheres (FAMs) with grain size up to 200 µm and up to 500 µm. Concrete mixtures with ordinary Portland cement and three substitution rates of cement by FAMs, 1.3%, 2.0%, and 2.6%, were investigated. For all concrete mixes, the constant water–binder ratio (w/b) equal to 0.50 was used. The research program included the determination of chemical composition, particle size distribution, and pozzolanic activity of FAMs. The analysis showed that the microspheres consist of three main elements: silicon, aluminum, and iron, whose oxides constitute about 89% of the material. The total content of air pores, measured in concrete at 28 days, ranges from 1.3 to 3.1% for the grain sizes below 200 µm and from 1.4% to 3.9% for the grain sizes up to 500 µm. The FAMs with a particle diameter < 200 µm have a relatively high level of activity pozzolanic at 28 days. The SEM analysis proved that the use of microspheres reduces gaps and increases the CSH phase. The compression test showed that the addition of fly ash microspheres with grain size below 200 µm increases long-term concrete strength.
1. Introduction
The coal-fired thermal power plants (TPPs) produce large amounts of combustion products all over the world. By-products after coal combustion are: fly ash, bottom ash, boiler slag, and flue gas desulfurization materials. For example, in the European Union (EU 15) approximately 40 million tons of Coal Combustion Products (CCPs) were produced in 2016. Fly ash, which is obtained through electrostatic or mechanical precipitation of dust, such as particles from the flue gas, represents the greatest proportion of the total CCP production. Within the EU, the utilization for fly ash in the construction industry is currently around 43% and for bottom ash around 46%, while the utilization rate for boiler slag is 100%. In the majority of cases, CCPs are used as a replacement for naturally occurring resources and therefore offer environmental benefits by avoiding the need to quarry these resources. CCPs also help to reduce energy demand as well as emissions to the atmosphere, for example CO2, which results from the manufacturing process of the products, are replaced [1].
Many researchers [2,3,4,5,6] suggest that the application of reactive pozzolanic materials, e.g., blast furnace slag, fly ash, and silica fume is beneficial in the construction process. During industrial combustion of coal (at temperatures of up to ca. 1400 °C), its mineral matter is liquefied and simultaneously subjected to complex physicochemical changes involving dihydroxylation of hydrated aluminosilicates and aluminum silicates, partial mullitization, carbonate decomposition, iron sulphate breakdown, and reduction. Rapid cooling of combustion products promotes the formation of amorphous (non-crystalline) particles, e.g., of a spherical shape such as microspheres [7]. They are often called network-structured cenospheres or plerospheres; from the Greek plërës (filled) + sphere. Liu et al. [8] specified that after a high-temperature (1200–1700 °C) thermochemical transformation of the organic matter and mineral constituents in coal during combustion, several morphological types of microspheres may form such as cenospheres, porous microspheres, and plerospheres.
The above by-products are a very complex materials showing similar physical and chemical properties to fly ashes obtained from coals combustion. Their properties depend on various parameters, including the type of material from which they are obtained, the temperature at which coal combustion is burnt and the type of microsphere collection system in coal-fired power plants. Drozhzhin et al. [9] reports that at the electric power stations, where furnace by-product is removed in the form of an aqueous pulp, microspheres whose density is less than 1 g/cm3, spontaneously float on the surface of settlement tanks, as “foam layers” of different thickness. According to Fenelonov et al. [10] and Drozhzhin et al. [11], the content of microspheres in fly ashes coming from the combustion of different types of coals ranges from 0.1 to 3.8 wt.%; in most cases is equal to 0.3 ÷ 1.5 wt.%. Due to the hollow structure, the fly ash microspheres (FAMs) present low density (ranging from 400 to 900 kg·m−3 [12]) and low thermal conductivity. FAMs, similarly to fly ash, are aluminosilicates with Si/Al ratio ranging from 1.5 to 3.5 [13]. When a high amount of mullite is present, microsphere displays notable thermal stability, low thermal expansion, high creep resistance, high resistance to crack propagation, and high thermal shock resistance [14,15]. The grains of microspheres have small open porosity and show a small surface area (<500 cm2/g). The authors reported [16,17,18,19,20] that the average grain size of microspheres usually ranges from 5 to 500 µm and the average thickness varies from 2 to 30 µm. As suggested Strzałkowska [21] and Danish [22], the size of the particles depends on their chemical composition. For example, an increase in the SiO2 content in the chemical composition leads to a decrease in the diameter of microspheres. In turn, an increase in the Fe2O3 and Al2O3/SiO2 ratio leads to an increase in their grain diameter.
There is a definite need to characterize microsphere properties in terms of application in building materials, e.g., in cement composites or concrete [23]. The potential use of hollow fly ash microspheres (FAMs) in building materials is one of the ways to utilize and reduce the degree of by-product accumulation in the natural environment.
The grain sizes of mineral additives such as fly ashes, silica fume, and metakaolin has a significant impact on the properties of cement mortars or concrete. Kwan and Li [24,25] and Wang et al. [26] reported that FAM can fill into the interstitial voids in cement grains to release the entrapped water, and thus improve the workability of the cement mortar and concrete. Other research [24,27] has found that the particle geometry had a significant impact on the rheological properties, because the spherical particles reduced the yield stress or plastic viscosity of the fresh cement paste.
Liu et al. [28] and Zhang et al. [29] showed that fly ash microspheres as active mineral admixture has great impacts on cement hydration, including the physical and chemical effects. Researchers concluded that replacing the cement of FAM consequently leads to an increase in the effective water–cement ratio. As suggested by Blissett and Rowson [30], FAMs can be also be an active material due to its amorphous nature. In a composite system, the FAM particles can serve as nucleation sites for hydration products, promoting the nucleation and crystallization of calcium silicate hydrates (C-S-H), gel, and Ca(OH)2. As indicated by Sharonova et al. [31] the initial FAM is chemically activated by the Ca(OH)2 produced by Portland clinkers during the hydration process. FAMs, as a superfine fraction of fly ash, has a stronger pozzolanic effect than the fly ash itself.
The variable nature of the fly ash properties can potentially adversely affect the properties of concrete, thus limiting the commercial viability of promoting fly ash utilization. The determination of porosity or pore size distribution of fly ash microspheres enables the prediction or correlation of various properties of FAMs such as elasticity, fracture toughness, compressive and tensile strength, etc. Additionally, the numerical calculations provide the possibility of solving engineering issues of cementitious materials in different aspects (e.g., the morphology, strength evolution, heat of hydration [32,33,34]).
The results of studies by many researchers suggest that microspheres can be used to produce various construction products such as cement composites, as lightweight aggregates in concrete [23,35,36]. Microspheres also can be used for building elements with improved thermal properties [37]. Microspheres of a hollow core-shell structure might be a kind of more attractive raw material for morphology-controlled zeolite synthesis [38].
Previous studies [17] have shown that the use of microspheres grains with specific dimensions has a significant impact on the porosity of concrete. The purpose of this study is to assess whether the particle size distribution of the fly ash microspheres (FAMs) may have a significant effect on the pozzolanic activity, the compressive strength, and the porosity structures in concrete.
2. Materials and Methods
The studies involved microspheres; a fraction of siliceous fly ash coming from national power station (Dolna Odra) located in Poland. The power plant uses hydraulic transport for the combustion products. After being mixed with water, pulp is formed and pumped through pipelines to the landfill. A heavy fraction of by-product settles down to the bottom of the settling tank and the floating fraction (microspheres) is distributed over the water surface. The FAM samples were collected from the surface of the settling tanks and then dried at a temperature of 20 ± 5 °C.
The following materials were used to prepare the concrete mixture: Portland cement CEM I 42.5R according to European Standard EN 197-1 [39], fine aggregate (natural river sand, grain size up to 2 mm), coarse aggregate fractions: 2–8 and 8–16 mm, and tap water. In the current work, seven concrete mixtures were made with a constant water–binder ratio (w/b = 0.5). The concrete mix was made with the participation of microspheres with the grain size of diameters up to 200 µm (fraction A) and up to 500 µm (fraction B). The selected A and B fractions were obtained using a set of standard sieves by the dry method. FAM was used to replace cement at levels of 0%; 1.3%; 2.0%, and 2.6% by mass in the concrete mixture. The compositions of concrete mixtures are presented in Table 1.

Table 1.
Composition of concrete mixtures, w/b = 0.50 1.
The selected physical-chemical properties of FAM samples were tested for the two fractions: grain sizes with a diameter of up to 200 µm and up to 500 µm, using the following methods:
- The morphology and chemical composition were determined through a scanning electron microscope (SEM, type JEOL JSM 7800 F, Akishima, Tokyo, Japan) equipped with Energy Dispersive X-ray spectrometer (EDAX) (Octane Elite, Mahwah, NJ, USA), which allows for the identification of the elemental composition of the tested material. During tests, the accelerating voltage of 15 kV was used;
- The loss on ignition (LOI) was analyzed in accordance with EN 196-2 [40]. The dried microsphere samples were placed in a furnace and heated for 2 h, at the temperature of 950 °C;
- The particle size distribution was determined with a laser particle analyzer (Helios/R, Sympatec GMbH, Clausthal-Zellerfeld, Germany) according to the ISO 13320 standard method [41]. A three-point specification including d10, d50, and d90 particle size values assure appropriate information for determination of the particle size span width of fly ash microspheres. The d50 is the diameter that splits the distribution with half above and half below this diameter. The d90 and d10 represent the coarsest and finest parts of the distribution, respectively. The analyzer applies to rapid and automatic particle size analysis of solids through the dry method. The range of operation of the analyzer varies from 0.1 to 3500 μm;
- The specific density was determined in accordance with ASTM C188 [42]. The tests were carried out using the 2.2-dimethylopropane with a density greater than 0.61 g/cm3 at 20 °C;
- The specific surface area (method by Blaine’a) was determined by measuring the air flow resistance through the test material under standard conditions, in accordance with EN 196-6 [43] and ASTM C204 [44].
In turn, mechanical tests of the prepared samples were performed by using the following methods:
- Pozzolanic activity of the FAM samples were tested according to the procedure described in European Standard, EN 450-1 [45]. Compression tests were performed on mortar samples (40 mm × 40 mm × 160 mm) from each mixture at 28 and 90 days, using a hydraulic press machine. The pozzolanic activity was defined as the percentage ratio of the compressive strength of the cement mortar, fabricated with 75% by weight of the cement (CEM I 42.5R) and 25% wt.% FAM to strength containing 100% reference cement;
- The Advantest 9 C3000 kN computer-controlled mechanical testing machine was used to perform compression tests on the concrete specimens after 28 and 90 days of hardening. The investigations were carried out according to the EN 12390-3 standard [46] with a constant rate of loading equals 0.6 MPa/s;
- The structure of air voids in concrete samples, after 28 days, was determined by the automatic image analysis system Rapid Air 457. The investigations were performed on concrete samples with the dimensions 100 mm × 100 mm × 25 mm, cut out from 100 mm cubic samples. After cutting, one side of the samples was carefully polished with polishing powders of different levels of finesses. The surfaces of the samples were painted with a black marker to cover the prepared surface. The samples were heated to 55 °C, and a zinc (II) oxide was applied to their surfaces so as to fill all voids with the white pigment paste. After cooling, any residual powder was removed from the specimen surfaces. The following parameters were determined: the total content of air, A (%); the micropores content with a diameter below 300 μm, A300 (%); specific surface are of air voids, α (mm−1); and void spacing factor, (mm) in hardened concrete by the linear traverse and modified point count microscopical by method described in ASTM C457 [47].
3. Results
3.1. The Chemical Composition and the Particle Size Distribution of the FA Microspheres
FAM morphology of particles with diameters up to 200 µm and up to 500 µm observed with a scanning electronic microscope (SEM) is shown in Figure 1. The results of the analysis of the chemical oxide composition with standard deviations, and the loss on ignition (LOI) for the analyzed microspheres with the grain size in the indicated diameter range (by % weight) are presented in Table 2. The chemical composition tests were carried out for three samples of grain fractions of the tested material.
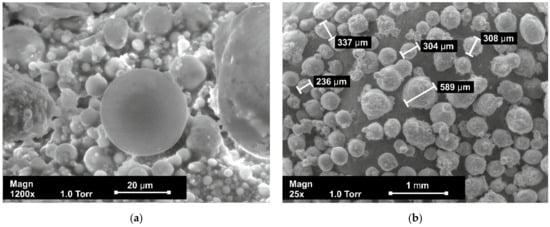
Figure 1.
SEM, microscopic images: (a) up to 200 µm; (b) up to 500 µm of grain sizes of the FAMs.
The visible shape of the microspheres, depending on the size of the particle fractions is diverse; from almost perfectly spherical to highly irregular (Figure 1). Micrograph’s data show that the particle size of microspheres below 200 μm consists mostly of spherical particles (Figure 1a). The microspheres of smaller sizes have a compact smooth wall surface and closed pores. The irregularly shaped particles can be seen in Figure 1b. It seems, that grain size in the range up to 500 μm appears to contain a large number of irregularly shaped particles. The large microspheres have irregular shapes and a deformed surface structure with open visible pores.
The morphological studies of the grains of microspheres with a diameter of up to 500 μm indicate a tendency to their agglomeration, which results of the formation of irregular and deformed particles shapes. Smaller particles are embedded in the surface of larger particles, which reduces their sphericity. The temperature of combustion coal and melting of chemical compounds likely has an impact on the formation of the grain structure of microspheres in the total mass of by-products.
During combustion, the mineral substances accompanying the coal were not subject to partial melting. Additionally, during the cooling of by-products, condensation of chemical compounds takes place on the surface of the microspheres grains, including the entrapment of gaseous products inside them. The resulting processes probably have an effect on the size of particles. The regular-shaped fine spherical particles provide the low friction, which helps to improve the flow ability and rheology of fresh concrete mixes [24,48].
The main components of examined fly ash microspheres are SiO2, Al2O3, and Fe2O3. These oxides are generally in amorphous form, which causes pozzolanic activity. Other components, such as K2O, Na2O, and TiO2 appear in small amounts. Comparing the results for both FAM fractions of the samples, significant differences in the content of individual components can be observed. As demonstrated in Table 2, the content of oxides in the fine FAM particles with a diameter of up to 200 µm, such as Al2O3, Fe2O3, CaO, MgO, Na2O, and TiO2, is higher compared with the content of these oxides in the grains of microspheres with a diameter of up to 500 µm. Thus, elements in oxide form are more strongly associated with a smaller fraction of microspheres. The opposite situation is observed for the Al2O3 and K2O, whose content increases in the sample for grains diameter up to 500 μm. The total sum of three oxides (SiO2, Al2O3 and Fe2O3) is equal to 86.2% for microspheres with a diameter < 200 µm, and 87.4% for FAM diameter < 500 µm. The higher content of potassium oxides is probably due to the lower melting point temperature and condensation on the smaller fractions of microspheres. The content of calcium oxide in the microspheres equals 4.9% for grain size up to 200 µm, and 3.4% for grain size of a diameter up to 500 µm. This oxide impacts on the pozzolanic activity of the tested material during the whole hydration process. The highest content of alkalis (Na2Oeq) in the material of grain size up to 500 µm (3.7%) in comparison to grain size up to 200 µm (3.5%), may suggest a change in the chemical composition and structure of the glassy phase. In turn, the SiO2/Al2O3 ratio shows the potential reactivity of fly ash microspheres; it is 1.8% and 1.6% for grain size below 200 µm and up to 500 µm, respectively. Loss on ignition is lower than 5 wt.% for both considered samples, so the microspheres can be classified as Category A and Class F according to Polish Standard PN-EN 450-1 [45] and ASTM C618 [49], (Table 2).
Table 2.
Chemical composition of the microsphere fractions with standard deviations determined via X-ray EDS.
Table 2.
Chemical composition of the microsphere fractions with standard deviations determined via X-ray EDS.
| Components, % | Particle Size Distribution of Fly Ash Microspheres | |
|---|---|---|
| <200 µm | <500 µm | |
| SiO2 | 51.9 ± 0.7 | 50.9 ± 1.2 |
| Al2O3 | 28.9 ± 0.3 | 32.3 ± 0.6 |
| Fe2O3 | 5.4 ± 0.5 | 4.2 ± 0.3 |
| CaO | 4.9 ± 1.1 | 3.4 ± 0.8 |
| MgO | 2.4 ± 0.2 | 2.4 ± 0.1 |
| Na2O | 1.1 ± 0.2 | 0.8 ± 0.3 |
| K2O | 3.7 ± 0.3 | 4.3 ± 0.1 |
| TiO2 | 1.7 ± 0.1 | 1.7 ± 0.1 |
| Na2Oeq * | 3.5 | 3.7 |
| SiO2+ Al2O3+ Fe2O3 | 86.2 | 87.4 |
| SiO2/Al2O3 | 1.8 | 1.6 |
| LOI | 1.00 | 1.19 |
| Standard mandatory requirements for fly ash chemical compositions | ||
| ASTM C618 [49] | Class F | SiO2+ Al2O3+ Fe2O3: 50% min.; LOI < 6% |
| IS 3812 [50] | Grade I | SiO2: 35% min., MgO: 5% max.; SO3: 3% max., Na2Oeq: 1.5% max., SiO2+ Al2O3+ Fe2O3: 70% min., LOI: 5% max. |
| EN 450-1 [45] | - | SiO2: 25% min., MgO: 4% max.; SiO2+ Al2O3+ Fe2O3: 70% min.; LOI: A ≤ 5%, B ≤ 7%, C ≤ 9% |
* Na2Oeq = Na2O + 0.658 K2O.
The cumulative distribution and distribution density of the analyzed fly ash microsphere (FAM) fractions are depicted in Figure 2. In Table 3, the following statistical parameters of tested materials are presented: diameters of characteristic grains: d10, d50, d90, dmean, and Span as described by Equation (1):
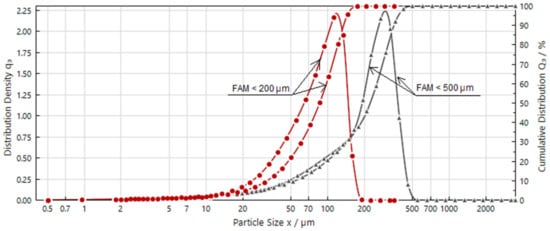
Figure 2.
Particle size distribution of the fly ash microspheres.
Table 3.
Statistical parameters (d10, d50, d90, and dmean), Span and Blaine specific surface area of FAMs.
The shape of the both curves for microspheres from the bituminous coal indicates a unimodal asymmetric (left-skewed) distribution. A bigger particle size of tested material can be associated with a greater proportion of unburnt coal, and the melting of chemical compounds on their surface (which cumulates mostly in bigger grain classes), which is indicated by higher loss on ignition for this sample (LOI for the grain size up to 200 µm, 1.0%; and for the grain size of diameter to 500 µm, about 1.2%, Table 2). Taking into account the obtained data, the smaller grain size of the microspheres affects the content of organic matter remaining on the surface of the tested fraction after burning of the bituminous coal. The (LOI) parameter represents, i.a., the content of unburned carbon in the microspheres, which of the content may adversely affect the properties of fresh concrete mixes and concrete; for example, on their workability or frost resistance.
Based on the results of granulometric analysis (Figure 2), the size of the particles distribution of microspheres changes in the range from 5 to 200 μm and from 5 to 500 µm. The percentage of microspheres grains for fractions below 10 µm, from 10 to 50 µm, from 50 to 102 µm, and from 102 to 200 µm is, 2.10%; 19.87%, 41.88%, and 36.15% respectively, of the total mass of the analyzed fraction of microspheres with diameters up to 200 µm. For grains with a diameter of up to 500 µm, their content in the whole volume is: 3.11% (below 18 µm), 17.39% (from 18 to 100 µm), 38.43% (from 100 to 250 µm) and 41.07% (from 250 to 500 µm). The presented data show that the particle size of fly ash microspheres (FAM) is 78.03% concentrated (in the range from 50 to 200 µm) and 79.5% (from 100 to 500 µm) of the total mass of the analyzed material.
The values of d10, d50, and d90 for the sample of grains size with diameters up to 200 µm were found as 40.63, 127.34, and 205.17 μm, respectively. On the other hand, for a sample with a grain diameter of up to 500 µm, the obtained values are as follows: 53.77, 222.61 and 352.35 µm. The average diameter of the microspheres (dmean) for the grain size up to 200 µm and up to 500 µm were 133.5 µm and 212.7 µm, respectively. A lower Span indicates homogeneous microspheres, which characterizes a high specific surface area. The obtained values are: 1.53 for grain size < 200 µm, and 1.34 for grain size up to 500 µm.
The specific density of FAMs varies from 0.51 g/cm3 for grain size up to 200 μm, to 0.56 g/cm³ for grain size up to 500 μm.
The specific surface of fly ash microspheres is 291.6 cm2/g (for particle size up to 500 μm) and 347.4 cm2/g (up to 200 μm). The size of the specific surface area of the tested material may be influenced by the dissolution rate of the grains in the mineral binder.
3.2. The Pozzolanic Activity and Compressive Strength
The pozzolanic activity of the microspheres for the grain sizes up to 200 and up to 500 µm in the cement mortars was determined in accordance with European Standard 450-1 [45]. The compression tests of the mortar samples with dimensions of 40 mm × 40 mm × 160 mm were carried out after 28 and 90 days of hardening. The pozzolanic activity indexes are presented in Table 4. Additionally, the minimum values of mentioned indexes according to EM, ASTM, and IS standards are reported.
Table 4.
The pozzolanic activity index for the cement mortars with FAM after 28 and 90 days.
The pozzolanic activity is generally determined by the presence of compounds, which mainly consists of reactive SiO2 and Al2O3, which can combine with portlandite, Ca(OH)2, a by-product of cement hydration to form further gel products, e.g., the CSH phase (hydrated calcium silicates). According to EN 450-1 [45] the acceptable level of pozzolanic activity is attained when the 28-day compressive strength of cement-ash mortar constitutes 75% of the value of the control sample, and after 90 days, 85%. In these studies, the requirements are met for all considered mortars. Based on the presented data, higher pozzolanic activity at 28 and 90 days was achieved for samples with microspheres with a grain size of up to 200 µm (Table 4). The particle sizes of the starting materials has an important role in determining the reactivity of FAMs, with smaller particles exhibiting higher reactivity due to higher specific surface area. Hanif et al. [51] also concluded that the degree of pozzolanic activity depends upon the particle size of fly ash. For example, fine size particles are more reactive compared with larger particles due to their inertness.
In order to evaluate the effect of microspheres’ addition on the strength development of concrete, destructive tests on concrete specimens were conducted. The 100 mm concrete cubes were stored at room temperature (20 ± 2 °C) with relative humidity equal to 95 ± 5%. The values of average compressive strength, tested at 28 and 90 days, are shown in Figure 3. The standard deviation of strength varies from 0.26 MPa to 1.56 MPa.
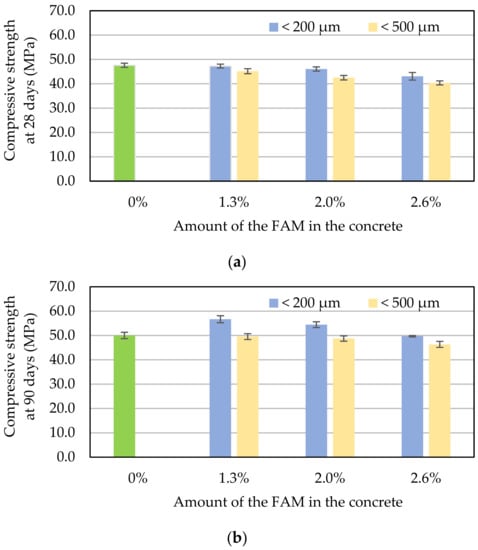
Figure 3.
Average compressive strength of concrete without and with different content of FAMs: (a) at 28 days, (b) and at 90 days.
As demonstrated in Figure 3, the compressive strength of concrete depends on microspheres fractions, their amount, and concrete age. After 28 days, for concrete containing 1.3%, 2.0%, and 2.6% of microspheres, the compressive strength decreased by 0.7%, 3.2%, and 9.5% (for grain size < 200 µm) and by 5.1%, 10.7%, and 15.2% (for grain size < 500 µm) in comparison with the control sample (Figure 3a). The obtained results indicate that the addition of fly ash microspheres affects the pozzolanic activity and decreases the strength of 28-day concrete.
After 90 days, for concrete containing 1.3%, 2.0%, and 2.6% of microspheres, the compressive strength increased by 11.8%, 8,1%, and 0.1% (for grain size < 200 µm) and decreased by 1.0%, 2.5%, and 7.3% (for grain size < 500 µm) in comparison with the control sample (Figure 3b). The compressive strength of samples modified by FAM of grain size below 200 µm increased because the FAM particles fit tightly into the pore structure. Taking into account the strength development of concrete, the recommended content of fly ash microspheres with grain size < 200 µm should be in range from 1.3% to 2%.
The grain size distribution and pozzolanic activity of cementitious materials, used in building structures, significantly affects the strength development of concrete [52]. The curing period when the grains of the microspheres are an inert material depends on the content of amorphous silica, and their specific surface area. Thus, all the beneficial effects resulting from the addition of microspheres in terms of mechanical strength become apparent at a later period of concrete hardening. Active silica, present in the grains of the microspheres, and in the presence of water, chemically reacts with hydrated calcium at normal temperatures, forming stabile compounds characterized by pozzolanic properties. It can be stated that the increase in the fine fractions of FAM (up to 200 µm) has a positive effect on the long-term strength development of concrete.
3.3. The Structure of Air Pores in Concrete Using the Automatic Image Analysis System
The air pores analysis in concrete was conducted by Rapid Air 457. The general views of the concrete surface to evaluate the characteristics of air pores with grain size up to 200 μm and up to 500 μm of the microspheres are presented in Figure 4. In turn, the images of air void distribution for concrete specimens without microspheres and two samples with 2.6% FAM of grains size up to 200 µm and up to 500 µm are shown in Figure 5.
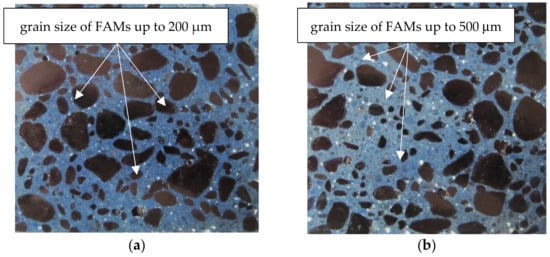
Figure 4.
View of the concrete surface to evaluate the characteristics of air voids distribution using Rapid Air 457: (a) FAMs up to 200 μm; (b) and FAMs up to 500 μm.
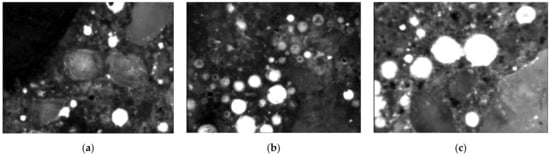
Figure 5.
Air voids distribution (marked in white) at the cross-section of concrete specimens at 28 days: (a) 0% FAM; (b) 2.6% FAM with grains size < 200 µm; (c) and 2.6% FAM with grains size < 500 µm.
The addition of microspheres causes the growth of the total content of the air (A) in concrete. According to the Powers model [52], the observed cross-sections of the concrete structure characterize spherical air voids. The main properties of the air structure in concrete at 28 days are listed in Table 5.
Table 5.
The quantitative characteristics of air voids in hardened concrete prepared from CEM I 42.5R and three substitution rates of microspheres.
The specific surface area (α) is usually defined as the total surface area of the air voids divided by their total volume. In turn, an air void spacing factor () is defined as the distance between the air voids [53]. Typically, the size of air bubbles and the spacing factor () should range from 50 to 200 μm and less than 200 μm, respectively, to withstand the adverse exposure conditions of a frost attack [54]. In turn, the ASTM C457 standard [47] reports that for concrete to be durable to freezing and thawing effects, the spacing factor and specific area should be in the range of 0.100 to 0.200 mm and 25 to 45 mm−1, respectively.
The total content of the air (A) in concrete without microspheres was equal to 0.75%. Based on Table 5, when the 1.3%, 2.0%, and 2.6% mass of cement was replaced by microspheres of grain size up to 200 µm, the relating values of about 1.3%, 1.5%, and 3.1% were obtained. In turn, for concrete with microspheres up to 500 µm, the air content after 28 days varied from 1.4% to 3.9%. Additionally, the increase in the content of micropores (A300) and the total air content (A) caused the spacing factor () to be reduced. For example, the spacing factor () in concrete with microspheres for the grains size up to 200 μm ranges from 0.214 mm (for 2.6% FAM) to 0.439 mm (for 1.3% FAM) in the total weight of cement. In turn, the proportion of microspheres with a diameter of up to 500 μm lowers the value of the spacing factor () by 11.6%, 36.5%, and 7.5%, respectively. The specific surface area of air voids (α) ranges from 21.6 mm−1 to 30.0 mm−1 (for grain size < 200 μm) and from 22.7 mm−1 to 32.4 mm−1 (for grain size < 500 μm) for the microspheres from 1.3% to 2.6% of the total weight of the cement in concrete. The highest content of the total air (A) in concrete, including the specific surface area of air voids (α) at the lowest spacing factor () was obtained in the presence of 2.6% microspheres for the grain size diameter up to 500 μm in the binder.
The A300/A ratio for concrete samples with FAMs up to 200 μm varies from 44.5 to 54.6%, which indicates that specimens contained a considerable amount of micropores (even up to several millimeters in diameter). In the case of concrete with FAMs below 500 µm, micropores range from 45.1 to 65.5% of the total air content. The addition of microspheres with grain size up to 500 μm allows for reduction in the size of macropores (>300 μm) in concrete. For concrete with 2.6% of microspheres with grain size diameter up to 500 μm, the total air and micropores (>300 µm) content provides the frost resistance for concrete. The obtained values provide an appropriate specific surface area and spacing factor acceptable by ASTM C457 [47]. The close pore distribution reduces the distance of airflow and limits the possibility of high hydraulic pressure in the case of the frost impact on concrete structures [17].
The distribution of pore sizes in the concrete without and with microspheres in amount from 1.3% to 2.6%, after 28 days, are listed in Table 6. The content of air voids in concrete increases with the increase amount of microsphere and range of pore size. For example, the content of microspheres in the range from 1.3% to 2.6% with grain sizes up to 200 μm causes the highest increase in the proportion of air pores in the range from 0 to 100 μm and above 500 μm. In turn, the presence of grains up to 500 μm, causes an increase in air pores in the concrete in the range from 200 to 300 μm and above 500 μm.
Table 6.
Pore size distribution of air voids in the concrete with fly ash microspheres (FAM).
The increase in the cumulative pore volume of the tested concrete indicates that the pores of the concrete with fly ash microspheres of grain size up to 200 μm and up to 500 μm tend to be the macropores. When the FAMs replacement rate is 1.3%, 2.0%, and 2.6% by weight of cement, the maximum pore content above 500 μm is 58.6%, 66.6%, and 54.9% (for grain sizes up to 200 μm), and 61.3%, 73.4%, and 71.7% (for grain sizes up to 500 μm) of total porosity of concrete.
With respect to the pore size distributions at 28 days, the higher percentage of finer pores noted for concrete specimens with microspheres indicate a higher refinement of their microstructure, probably due to the formation of solid phases as products of hydration, including pozzolanic reactions of fly ash microspheres. The less refined pore network observed for the concrete specimens is in keeping with total porosity results, showing the effect of this active mineral addition for the concrete structure.
3.4. Structure of the Concrete with Fly Ash Microspheres
The structure of concrete modified by fly ash microspheres was investigated using a scanning electron microscopy (SEM). Images of the chosen samples containing 2.6% fly ash microspheres, after 28 days of hardening, are shown in Figure 6.
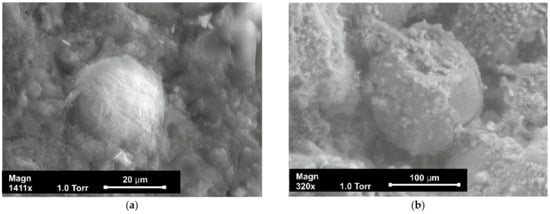
Figure 6.
SEM microscope images of samples contain 2.6% FAM with grain diameter: (a) <200 µm; (b) and <500 µm.
As shown in Figure 6, in the case of miscrospheres with grain size up to 500 μm (Figure 6b), the reaction products of the cement hydration cover the grain less than in the case of FAM with grain size up to 200 μm (Figure 6a). This suggests that some of the tested material reacts slower with alkaline substances in the cement due to the larger grain size. The pozzolanic reactivity of fly ash microspheres consumes CH to form insoluble hydration products. The CSH phase (hydrated silicates calcium) is more visible and covers most of the outer grain structure for microspheres up to 200 μm (Figure 6a). It is also observed that the reacted FAM particles are closely combined with the surrounding gel. In Figure 6b large pores in the concrete are visible and the structure is not compact. Their presence has an influence on the decrease in the compressive strength, which is confirmed by results presented in Figure 3.
To summarize, the activity of FAM for particle size diameter up to 200 μm is higher than for FAM for grains sized up to 500 μm. This is not only due to the much smaller particle size of FAM but also because of its higher calcium oxide (CaO) content compared with FAM of grain sized up to 500 μm (Table 2).
4. Conclusions
The conducted research program of the concrete enhanced with fly ash microspheres allows for the formulation of the following conclusions:
- The chemical composition and pozzolanic activity of the considered microsphere meet the requirements of EN 450-1 dedicated to fly ash from convection combustion. Thus, the FAM can be an unconventional mineral addition for concrete mixtures;
- The pozzolanic activity of fly ash microspheres mainly depend on grain size and chemical composition. The fine microspheres with grain size up to 200 μm characterizes a higher value of the pozzolanic activity index;
- Finer fraction of FAMs, i.e., up to 200 μm reveals better pozzolanic properties, which are related to larger Blaine surface area compared with grain sizes up to 500 μm;
- Due to the pozzolanic reactivity and the hollow nature of fly ash microspheres, the small particle size reacts with CH to produce a calcium silicate hydrate (CSH) gel that completely covers their surfaces. The smaller particle size of the fly ash microspheres can effectively fill the voids available within the cement matrix to increase the durability of the concrete;
- The addition of fly ash microspheres decreases the strength of 28-day concrete; however, in the case of long-term (90 days) strength, fly ash microspheres increase compressive strength. The recommended amount of FA with a grain size below 200 µm is in the range from 1.3% to 2%;
- The content of 2.6% FAMs ensures good parameters of concrete porosity. The use of fly ash microspheres is a good alternative to the traditional aeration solution for concrete mixes and an effective method of by-product utilization;
- Further studies with different dosages of fly ash microspheres (FAMs) should be undertaken in order to better understand the pore size distribution on the selected properties of concrete or cement composites.
The study proves that the use of microspheres grains with specific dimensions has a significant impact on the selected properties of concrete, and has an impact on the selected physical and chemical properties of the research material. The use of FAMs grains of the specific sizes in concrete technology may modify, for example, the mechanical strength of concrete, but this requires further research.
Author Contributions
Conceptualization, E.H. and A.K.-C.; Methodology, E.H.; Software, E.H.; Formal Analysis, E.H. and A.K.-C.; Investigation, E.H.; Data Analysis, E.H. and A.K.-C.; Writing—Original Draft Preparation, E.H.; Writing—Review and Editing, A.K.-C.; Project Administration, A.K.-C. All authors have read and agreed to the published version of the manuscript.
Funding
This research received no external funding.
Data Availability Statement
Data is contained within the article.
Conflicts of Interest
The authors declare no conflict of interest.
References
- European Coal Combustion Products Association. Available online: www.ecoba.com (accessed on 3 June 2022).
- AL-Jumaily, A.S.; Naji, N.; Kareem, Q. An overview on the Influence of Pozzolanic Materials on Properties of Concrete. Int. J. Enhan. Res. Sci. Tech. Eng. 2015, 4, 81–92. [Google Scholar]
- Haustein, E.; Kuryłowicz-Cudowska, A.; Łuczkiewicz, A.; Fudala-Książek, S.; Cieślik, B.M. Influence of Cement Replacement with Sewage Sludge Ash (SSA) on the Heat of Hydration of Cement Mortar. Materials 2022, 15, 1547. [Google Scholar] [CrossRef]
- Foti, D.; Lerna, M.; Sabba, M.F.; Vacca, V. Mechanical Characteristics and Water Absorption Properties of Blast-Furnace Slag Concretes with Fly Ashes or Microsilica Additions. Appl. Sci. 2019, 9, 1279. [Google Scholar] [CrossRef] [Green Version]
- Becerra-Duitama, J.A.; Rojas-Avellaneda, D. Pozzolans: A review. Eng. Appl. Sci. Res. 2022, 49, 495–504. [Google Scholar] [CrossRef]
- Sinsiri, T.; Teeramit, P.; Jaturapitakkulb, C.; Kiattikomolb, K. Effect of Finenesses of Fly Ash on Expansion of Mortars in Magnesium Sulfate. ScienceAsia 2006, 32, 063–069. [Google Scholar] [CrossRef]
- Bielowicz, B.; Botor, D.; Misiak, J.; Wagner, M. Critical Elements in Fly Ash from the Combustion of Bituminous Coal in Major Polish Power Plants. E3S Web Conf. 2018, 35, 02003. [Google Scholar] [CrossRef]
- Liu, H.; Sun, Q.; Wang, B.; Wang, P.; Zou, J. Morphology and Composition of Microspheres in Fly Ash from the Luohuang Power Plant, Chongqing, Southwestern China. Minerals 2016, 6, 30. [Google Scholar] [CrossRef] [Green Version]
- Drozhzhin, V.S.; Pikulin, I.S.; Kuvaev, M.D.; Redyushev, S.A.; Shprit, M.Y. Technical monitoring of microspheres from fly ashes of electric power stations in the Russian Federation. In Proceedings of the “World of Coal Ash” Conference, Lexington, KY, USA, 11–14 April 2005. [Google Scholar]
- Fenelonov, V.B.; Mel’gunov, M.S.; Parmon, V.N. The properties of cenospheres and the mechanism of their formation during high-temperature coal combustion at thermal power plans. KONA Powder Part. J. 2010, 28, 189–208. [Google Scholar] [CrossRef] [Green Version]
- Drozhzhin, V.S.; Shpirt, M.Y.; Danilin, L.D.; Kuvaev, M.D.; Pikulin, I.V.; Potemkin, G.A.; Redyushev, S.A. Formation processes and main properties of hollow aluminosilicate microspheres in fly ash from thermal power stations. Solid Fuel Chem. 2008, 42, 107–119. [Google Scholar] [CrossRef]
- Wu, Y.; Wang, J.Y.; Monteiro, P.J.; Zhang, M.H. Development of ultra-lightweight cement composites with low thermal conductivity and high specific strength for energy efficient buildings. Constr. Build. Mater. 2015, 87, 100–112. [Google Scholar] [CrossRef]
- Fomenko, E.V.; Anshits, N.N.; Pankova, M.V.; Solovyov, L.A.; Anshits, A.G. Fly Ash Cenospheres: Composition, Morphology, Structure, and Helium Permeability. In Proceedings of the World of Coal Ash (WOCA) Conference, Denver, CO, USA, 9–12 May 2011. [Google Scholar]
- Chávez-Valdez, A.; Arizmendi-Morquecho, A.; Vargas, G.; Almanza, J.M.; Alvarez-Quintana, J. Ultra-low thermal conductivity thermal barrier coatings from recycled fly-ash cenospheres. Acta Mater. 2011, 59, 2556–2562. [Google Scholar] [CrossRef]
- Wang, X.; Yuan, J.; Wei, P.; Zhu, M. Effects of fly ash microspheres on sulfate erosion resistance and chlorion penetration resistance in concrete. J. Therm. Anal. Calorim. 2020, 139, 3395–3403. Available online: https://link.springer.com/article/10.1007/s10973-019-08705-8 (accessed on 3 June 2022). [CrossRef]
- Michalíková, F.; Brezáni, I.; Sisol, M.; Kozáková, L. Morphological Properties of Microspheres from Combustion of Coal in Thermal Power Plants. J. Pol. Min. Eng. Soc. 2014, 15, 197–204. [Google Scholar]
- Haustein, E.; Kuryłowicz-Cudowska, A. The effect of fly ash microspheres on the pore structure of concrete. Minerals 2020, 10, 58. [Google Scholar] [CrossRef] [Green Version]
- Żyrkowski, M.; Neto, R.C.; Santos, L.F.; Witkowski, K. Characterization of fly-ash cenospheres from coal-fired power plant unit. Fuel 2016, 174, 49–53. [Google Scholar] [CrossRef]
- Ranjbar, N.; Kuenzel, C. Cenospheres: A review. Fuel 2017, 207, 1–12. [Google Scholar] [CrossRef]
- Fomenko, E.V.; Anshits, N.N.; Vasilieva, N.G.; Mikhaylova, O.A.; Rogovenko, E.S.; Zhizhaev, A.M.; Anshits, A.G. Characterization of fly ash cenospheres produced from the combustion of Ekibastuz coal. Eng. Fuels 2015, 29, 5390–5403. [Google Scholar] [CrossRef]
- Strzałkowska, E.; Adamczyk, Z. Influence of chemical composition of fly-ash cenospheres on their grains size. Int. J. Envir. Sci. Tech. 2019, 17, 809–818. [Google Scholar] [CrossRef] [Green Version]
- Danish, A.; Mosaberpanah, M.A.; Tuladhar, R.; Salim, M.U.; Yaqub, M.A.; Ahmad, N. Effect of cenospheres on the engineering properties of lightweight cementitious composites: A comprehensive review. J. Build. Eng. 2022, 49, 104016. [Google Scholar] [CrossRef]
- Haustein, E. The selected physico-chemical properties of microspheres and possibility of their use in cement composites. Compos. Theory Pract. 2016, 16, 25–29. [Google Scholar]
- Kwan, A.K.H.; Li, Y. Effects of fly ash microspheres on rheology, adhesiveness and strength of mortar. Constr. Build. Mater. 2013, 42, 137–145. [Google Scholar] [CrossRef]
- Li, Y.; Kwan, A.K.H. Ternary blending of cement with fly ash microspheres and condensed silica fume to improve the performance of mortar. Cem. Concr. Compos. 2014, 49, 26–35. [Google Scholar] [CrossRef]
- Wang, Q.; Wang, D.; Chen, H. The role of fly ash microsphere in the microstructure and macroscopic properties of high-strength concrete. Cem. Concr. Compos. 2017, 83, 125–137. [Google Scholar] [CrossRef]
- Yang, T.; Zhua, H.J.; Zhang, Z.H.; Gao, X.; Zhang, C.S.; Wu, Q.S. Effect of fly ash microsphere on the rheology and microstructure of alkali-activated fly ash/slag pastes. Cem. Concr. Res. 2018, 109, 198–207. [Google Scholar] [CrossRef]
- Liu, S.; Zhang, T.; Guo, Y.; Wei, J.; Yu, Q. Effects of SCMs particles on the compressive strength of micro-structurally designed cement paste: Inherent characteristic effect, particle size refinement effect, and hydration effect. Powder Technol. 2018, 330, 1–11. [Google Scholar] [CrossRef]
- Zhang, T.; Yu, Q.; Wei, J.; Zhang, P.; Chen, P. A gap-graded particle size distribution for blended cements: Analytical approach and experimental validation. Powder Technol. 2011, 214, 259–268. [Google Scholar] [CrossRef]
- Blissett, R.S.; Rowson, N.A. A review of the multi-component utilisation of coal fly ash. Fuel 2012, 97, 1–23. [Google Scholar] [CrossRef]
- Sharonova, O.M.; Kirilets, V.M.; Yumashev, V.V.; Solovyov, L.A.; Anshits, A.G. Phase composition of high strength binding material based on fine microspherical high calcium fly ash. Constr. Build. Mater. 2019, 216, 525–530. [Google Scholar] [CrossRef]
- Mariak, A.; Chróścielewski, J.; Wilde, K. Numerical simulation of hardening of concrete plate, Shell Structures: Theory and Applications. In Proceedings of the 11th International Conference on Shell Structures: Theory and Applications, SSTA, Gdansk, Poland, 1–13 October 2017; pp. 557–560. [Google Scholar] [CrossRef]
- Kuryłowicz-Cudowska, A.; Wilde, K.; Chróścielewski, J. Prediction of cast-in-place concrete strength of the extradosed bridge deck based on temperature monitoring and numerical simulations. Constr. Build. Mater. 2020, 254, 119224. [Google Scholar] [CrossRef]
- Kuryłowicz-Cudowska, A.; Haustein, E. Isothermal calorimetry and compressive strength tests of mortar specimens for determination of apparent activation energy. J. Mater. Civ. Eng. 2021, 33, 1–14. [Google Scholar] [CrossRef]
- Hanif, A.; Lu, Z.; Li, Z. Utilization of ash cenosphere as lighweight filler in cement-based composites—A review. Constr. Build. Mater. 2017, 144, 373–384. [Google Scholar] [CrossRef]
- Zanjad, N.; Pawar, S.; Nayak, C. Use of fly ash cenosphere in the construction Industry: A review. Mater. Today Proc. 2022, 62, 2185–2190. [Google Scholar] [CrossRef]
- Ciemnicka, J.; Prałat, K.; Koper, A.; Makomaski, G.; Majewski, Ł.; Wójcicka, K.; Buczkowska, K.E. Changes in the strength properties and phase transition of gypsum modified with microspheres, aerogel and HEMC polymer. Materials 2021, 14, 3846. [Google Scholar] [CrossRef] [PubMed]
- Wang, D.J.; Tang, Y.; Dong, A.G.; Zhang, Y.H.; Wang, Y.J. Hollow cancrinite zeolite spheres in situ transformed from fly ash cenosphere. Chin. Chem. Lett. 2003, 14, 1299–1302. [Google Scholar]
- EN 197-1; Cement. Part 1: Composition, Specifications and Conformity Criteria for Common Cements. European Standards, European Committee for Standardization: Brussels, Belgium, 2012.
- EN 196-2; Methods of Testing Cement. Part 2: Chemical Analysis of Cement. European Standards, European Committee for Standardization: Brussels, Belgium, 2013.
- ISO 13320:2009; Particle Size Analysis-Laser Diffraction Methods. Part I: General Principles. International Organization for Standardization (ISO): Geneva, Switzerland, 2009.
- ASTM C188-17; Standard Test Method for Density of Hydraulic Cement. ASTM International: West Conshohocken, PA, USA, 2017.
- EN 196-6; Methods of Testing Cement. Part 6. Determination of Fineness. European Standards, European Committee for Standardization: Brussels, Belgium, 2019.
- ASTM C204-11; Standard Test Methods for Fineness of Hydraulic Cement by Air-Permeability Apparatus. ASTM International: West Conshohocken, PA, USA, 2014.
- EN 450-1; Fly Ash for Concrete. Part 1: Definition, Specifications and Conformity Criteria. European Standards, European Committee for Standardization: Brussels, Belgium, 2012.
- EN 12390-3Testing Hardened Concrete. Part 3: Compressive Strength of Test Specimens, European Standards, European Committee for Standardization: Brussels, Belgium, 2019.
- ASTM C457/C457M-16; Standard Test Method for Microscopical Determination of Parameters of the Air-Void System in Hardened Concrete. ASTM International: West Conshohocken, PA, USA, 2016. Available online: www.astm.org (accessed on 3 June 2022).
- Kumar, S.; Mohapatra, S.K.; Gandhi, B.K. Effect of addition of fly ash and drag reducing on the rheological properties of bottom ash. Inter. J. Mech. Mat. Eng. 2013, 8, 1–8. [Google Scholar]
- ASTM C618; Standard Specification for Coal Fly Ash and Raw or Calcined Natural Pozzolan for Use in Concrete. ASTM International: West Conshohocken, PA, USA, 2019.
- IS 3812-Part 1 2013; Pulverized Fuel Ash—Specification for Use as Pozzolana in Cement Mortar and Concrete. Bureau of Indian Standards: New Delhi, India, 2013.
- Hanif, A.; Lu, Z.; Diao, S.; Zeng, X.; Li, Z. Properties investigation of fiber reinforced cement-based composites incorporating cenosphere fillers. Constr. Build. Mater. 2017, 140, 139–149. [Google Scholar] [CrossRef]
- Kumara, R.; Bhattacharjee, B. Porosity, pore size distribution and in situ strength of concrete. Cem. Concr. Res. 2003, 33, 155–164. [Google Scholar] [CrossRef]
- Powers, T.C.; Willis, T.F. Air requirement of frost-resistant concrete. Proc. Highw. Res. Board 1950, 29, 184–211. [Google Scholar]
- Mehta, P.K.; Monteiro, P.J.M. Concrete: Microstructure Properties and Materials, 2nd ed.; The McGraw-Hill Companies, Inc.: New York, NY, USA, 1993; p. 548. [Google Scholar]
Publisher’s Note: MDPI stays neutral with regard to jurisdictional claims in published maps and institutional affiliations. |
© 2022 by the authors. Licensee MDPI, Basel, Switzerland. This article is an open access article distributed under the terms and conditions of the Creative Commons Attribution (CC BY) license (https://creativecommons.org/licenses/by/4.0/).