
Trace Element Concentrations and Mineralogy of Quartz Vein Deposits from Southeastern Hubei Province, China


Abstract
:1. Introduction
2. Materials and Methods
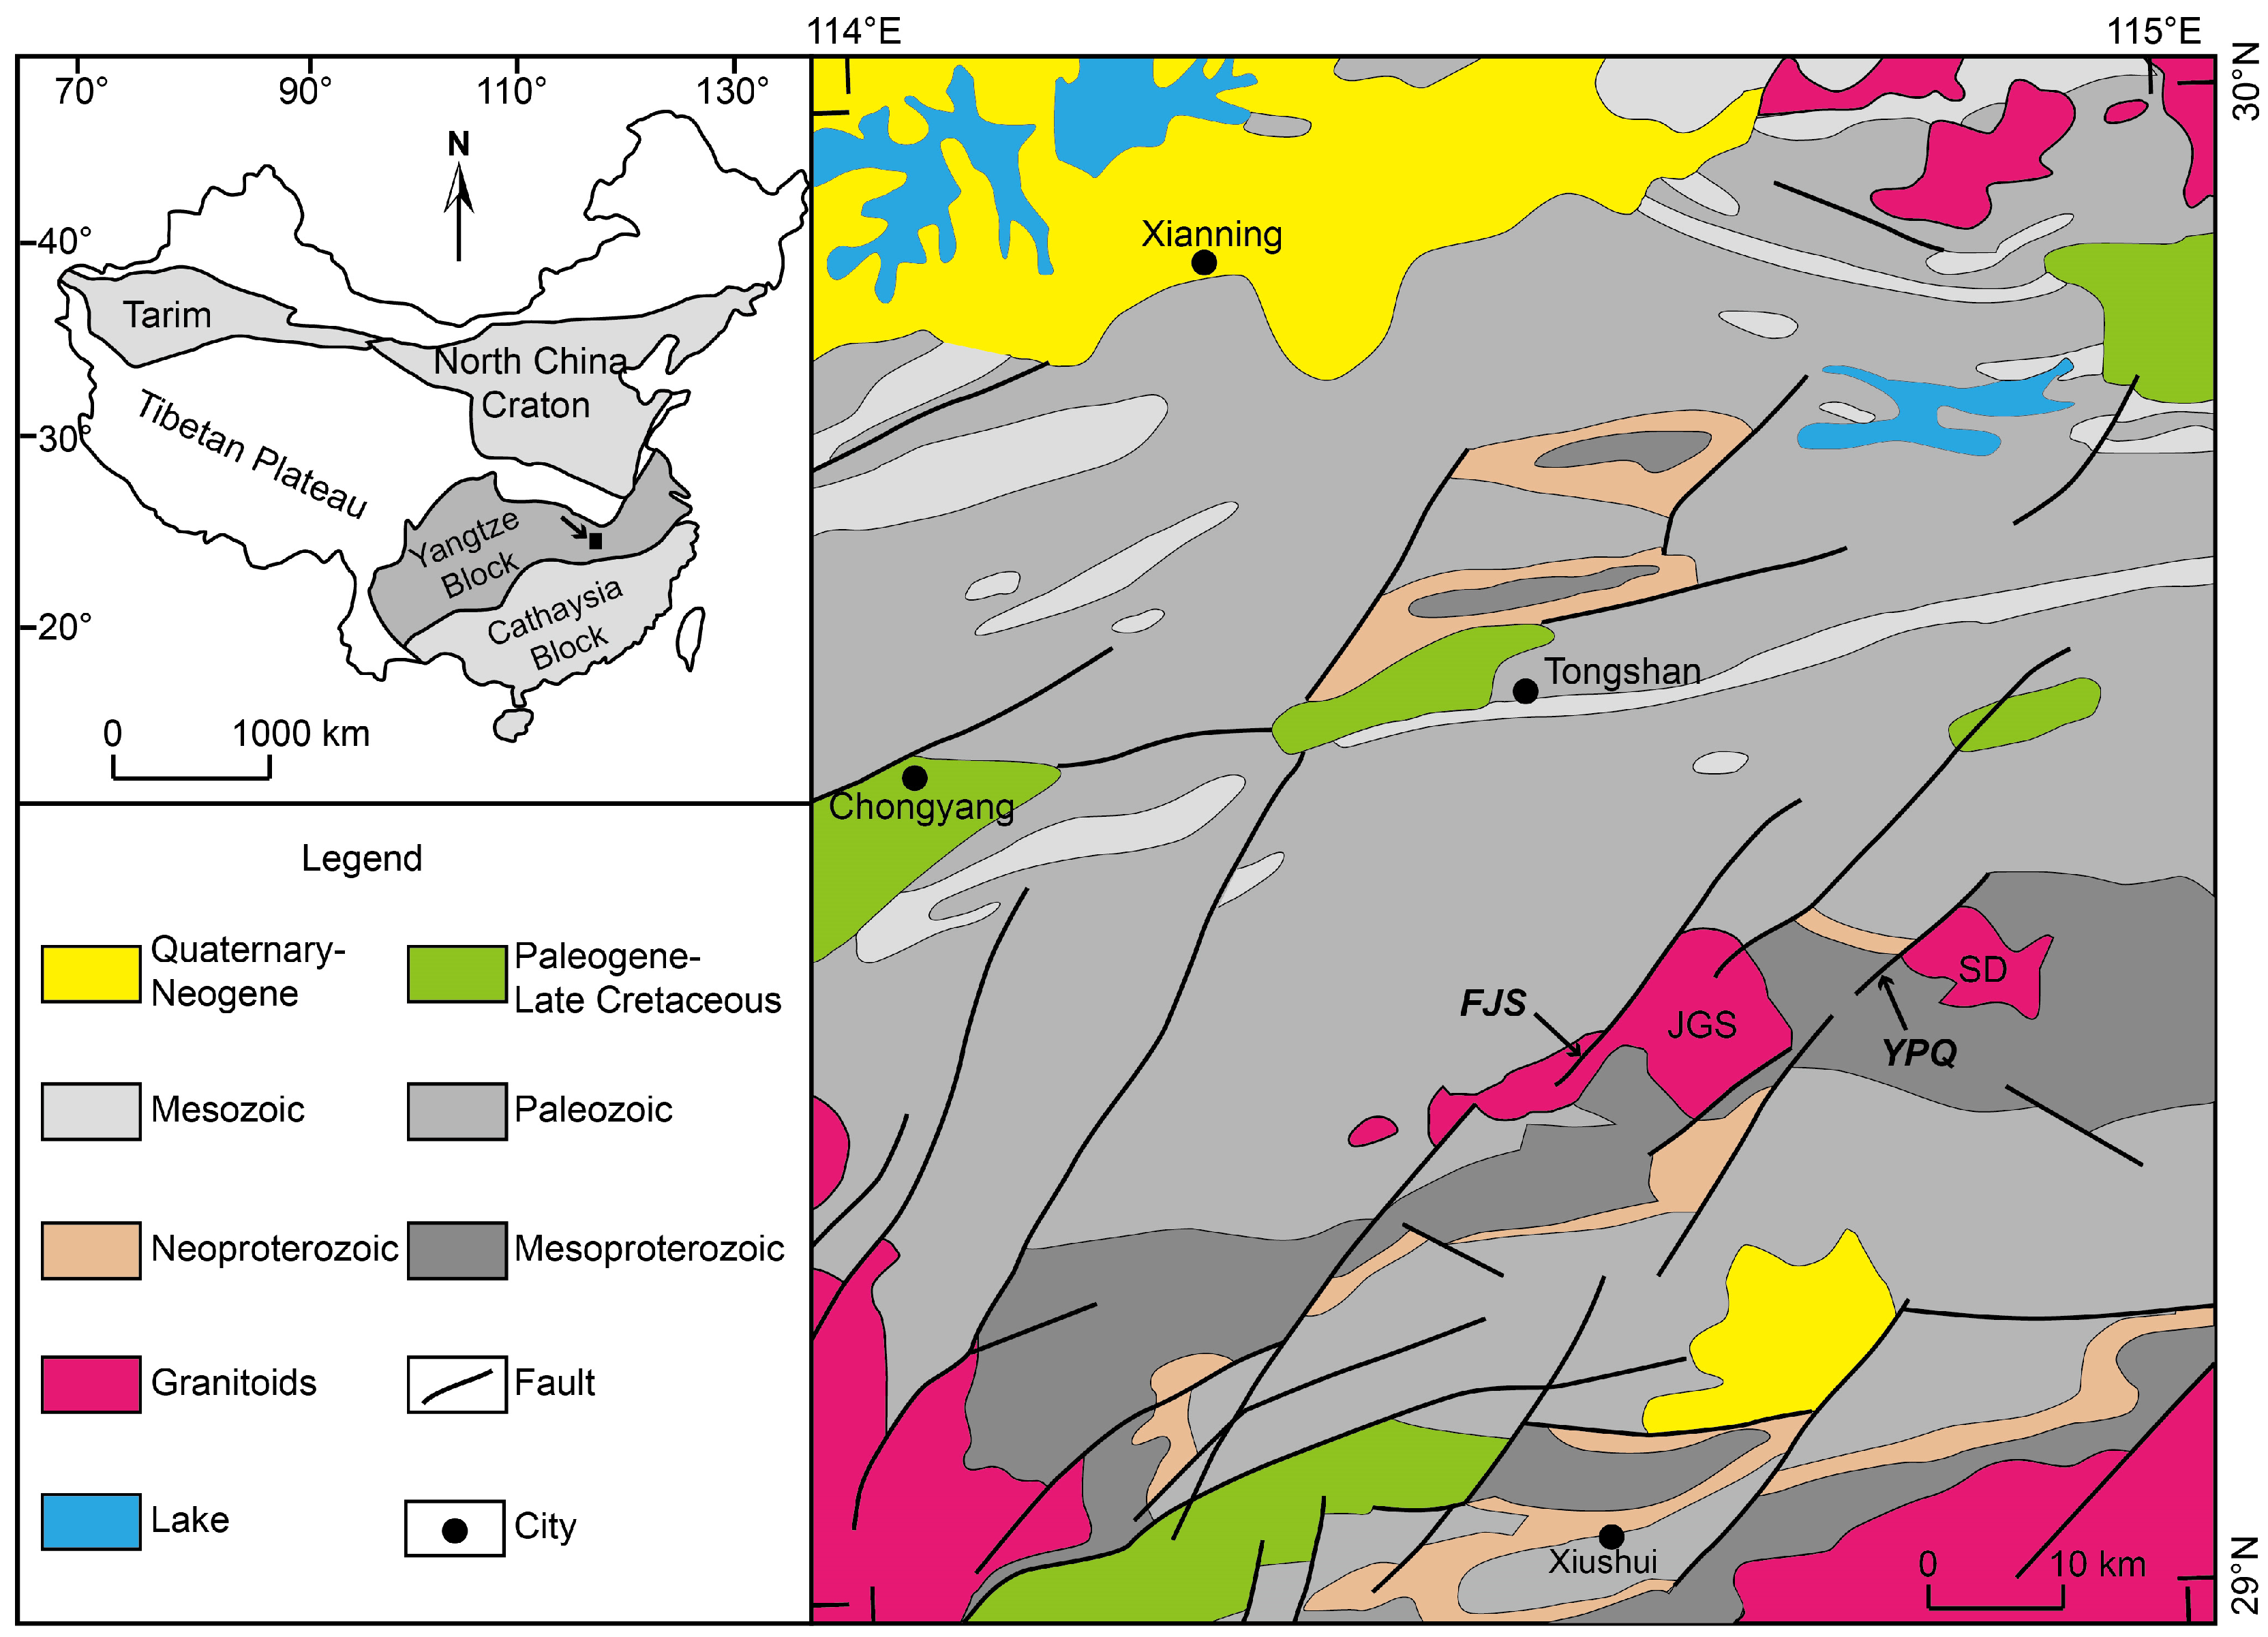
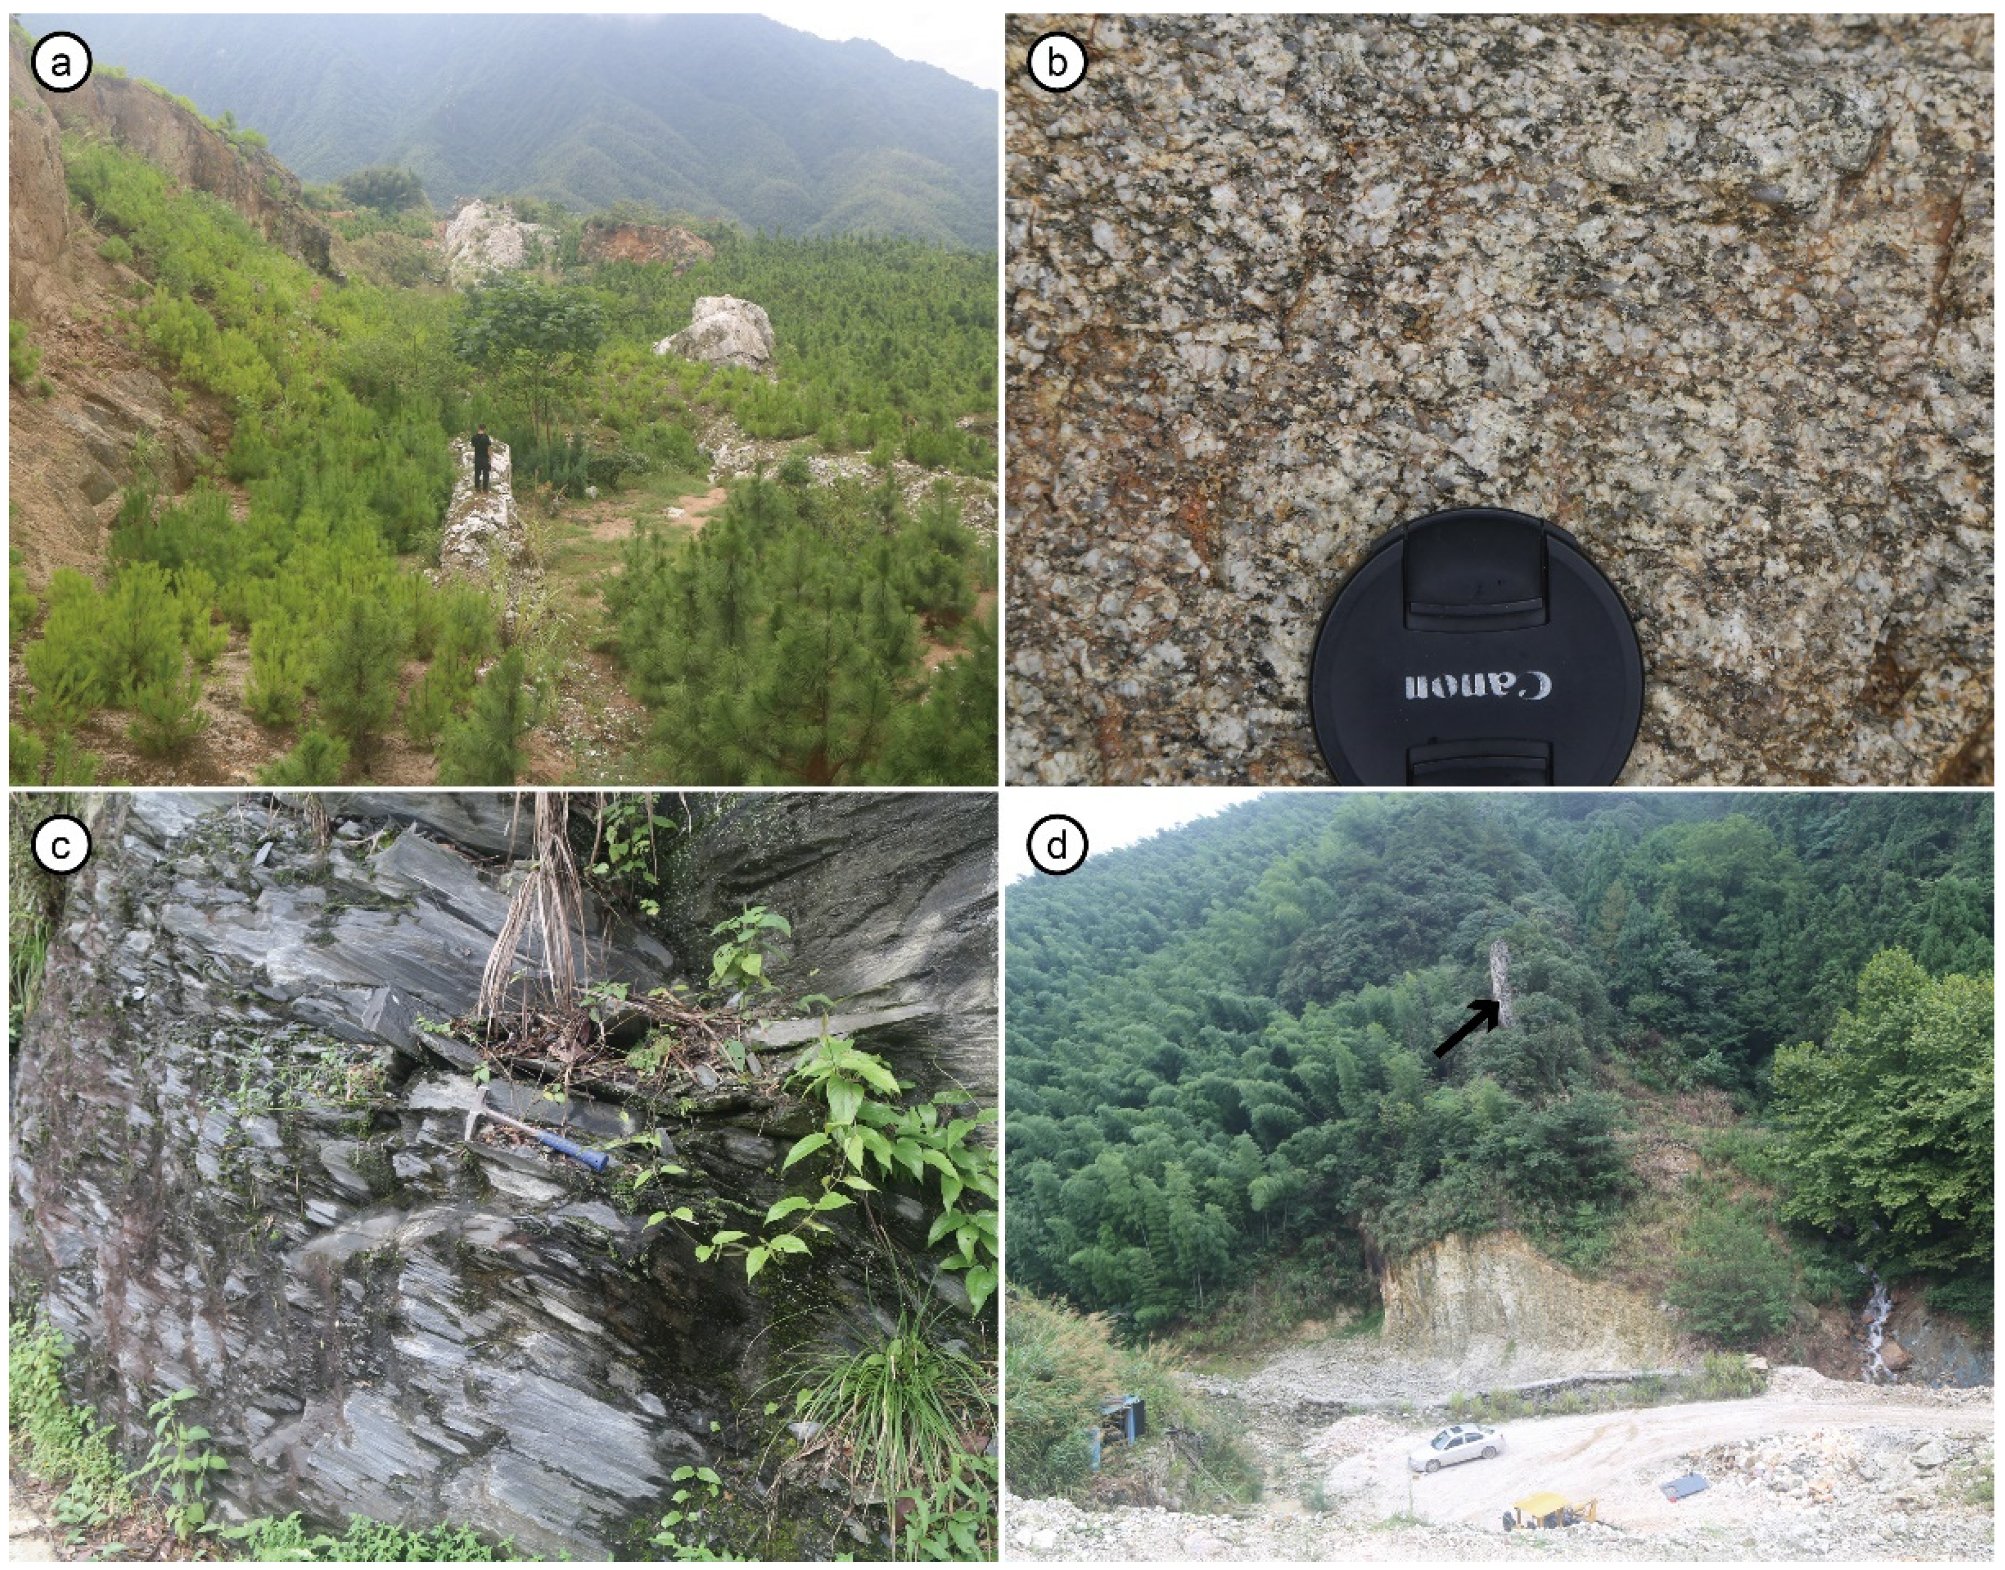
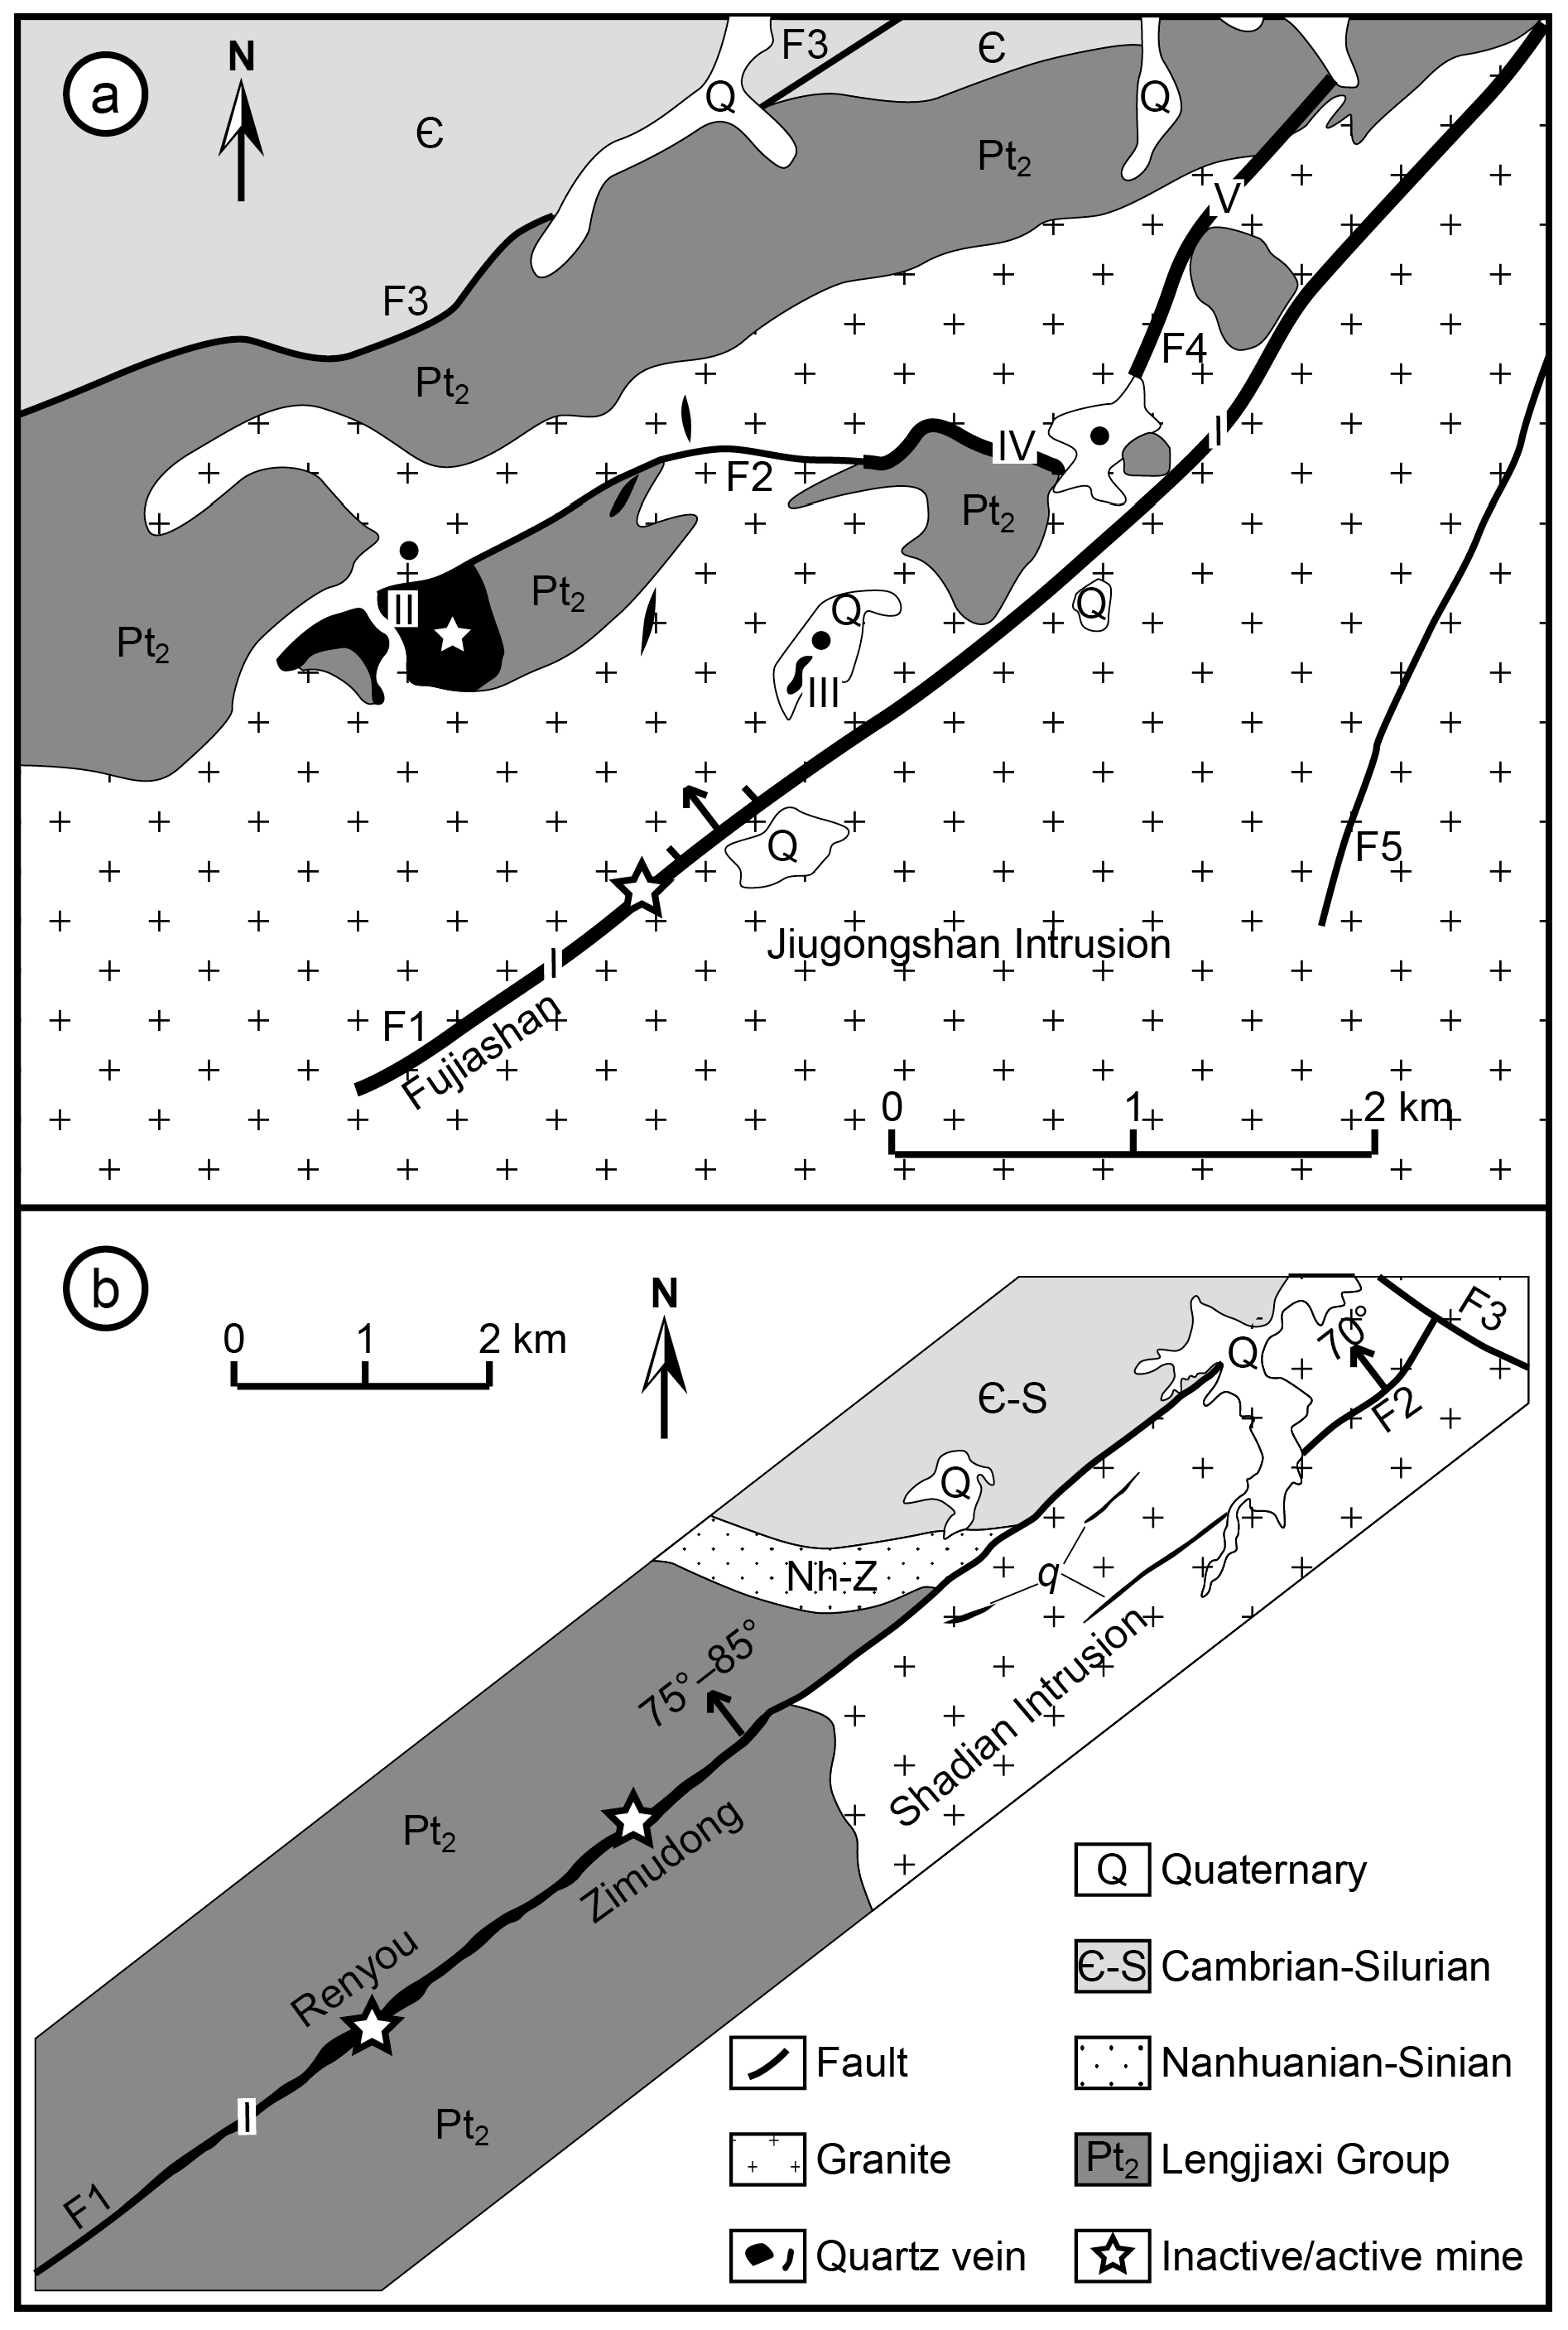
2.1. Geology of Quartz Deposits
2.1.1. Fujiashan Quartz Deposits
2.1.2. Yipanqiu Quartz Deposits
2.1.3. Sampling
2.2. Analytical Methods
2.2.1. Optical Microscopy
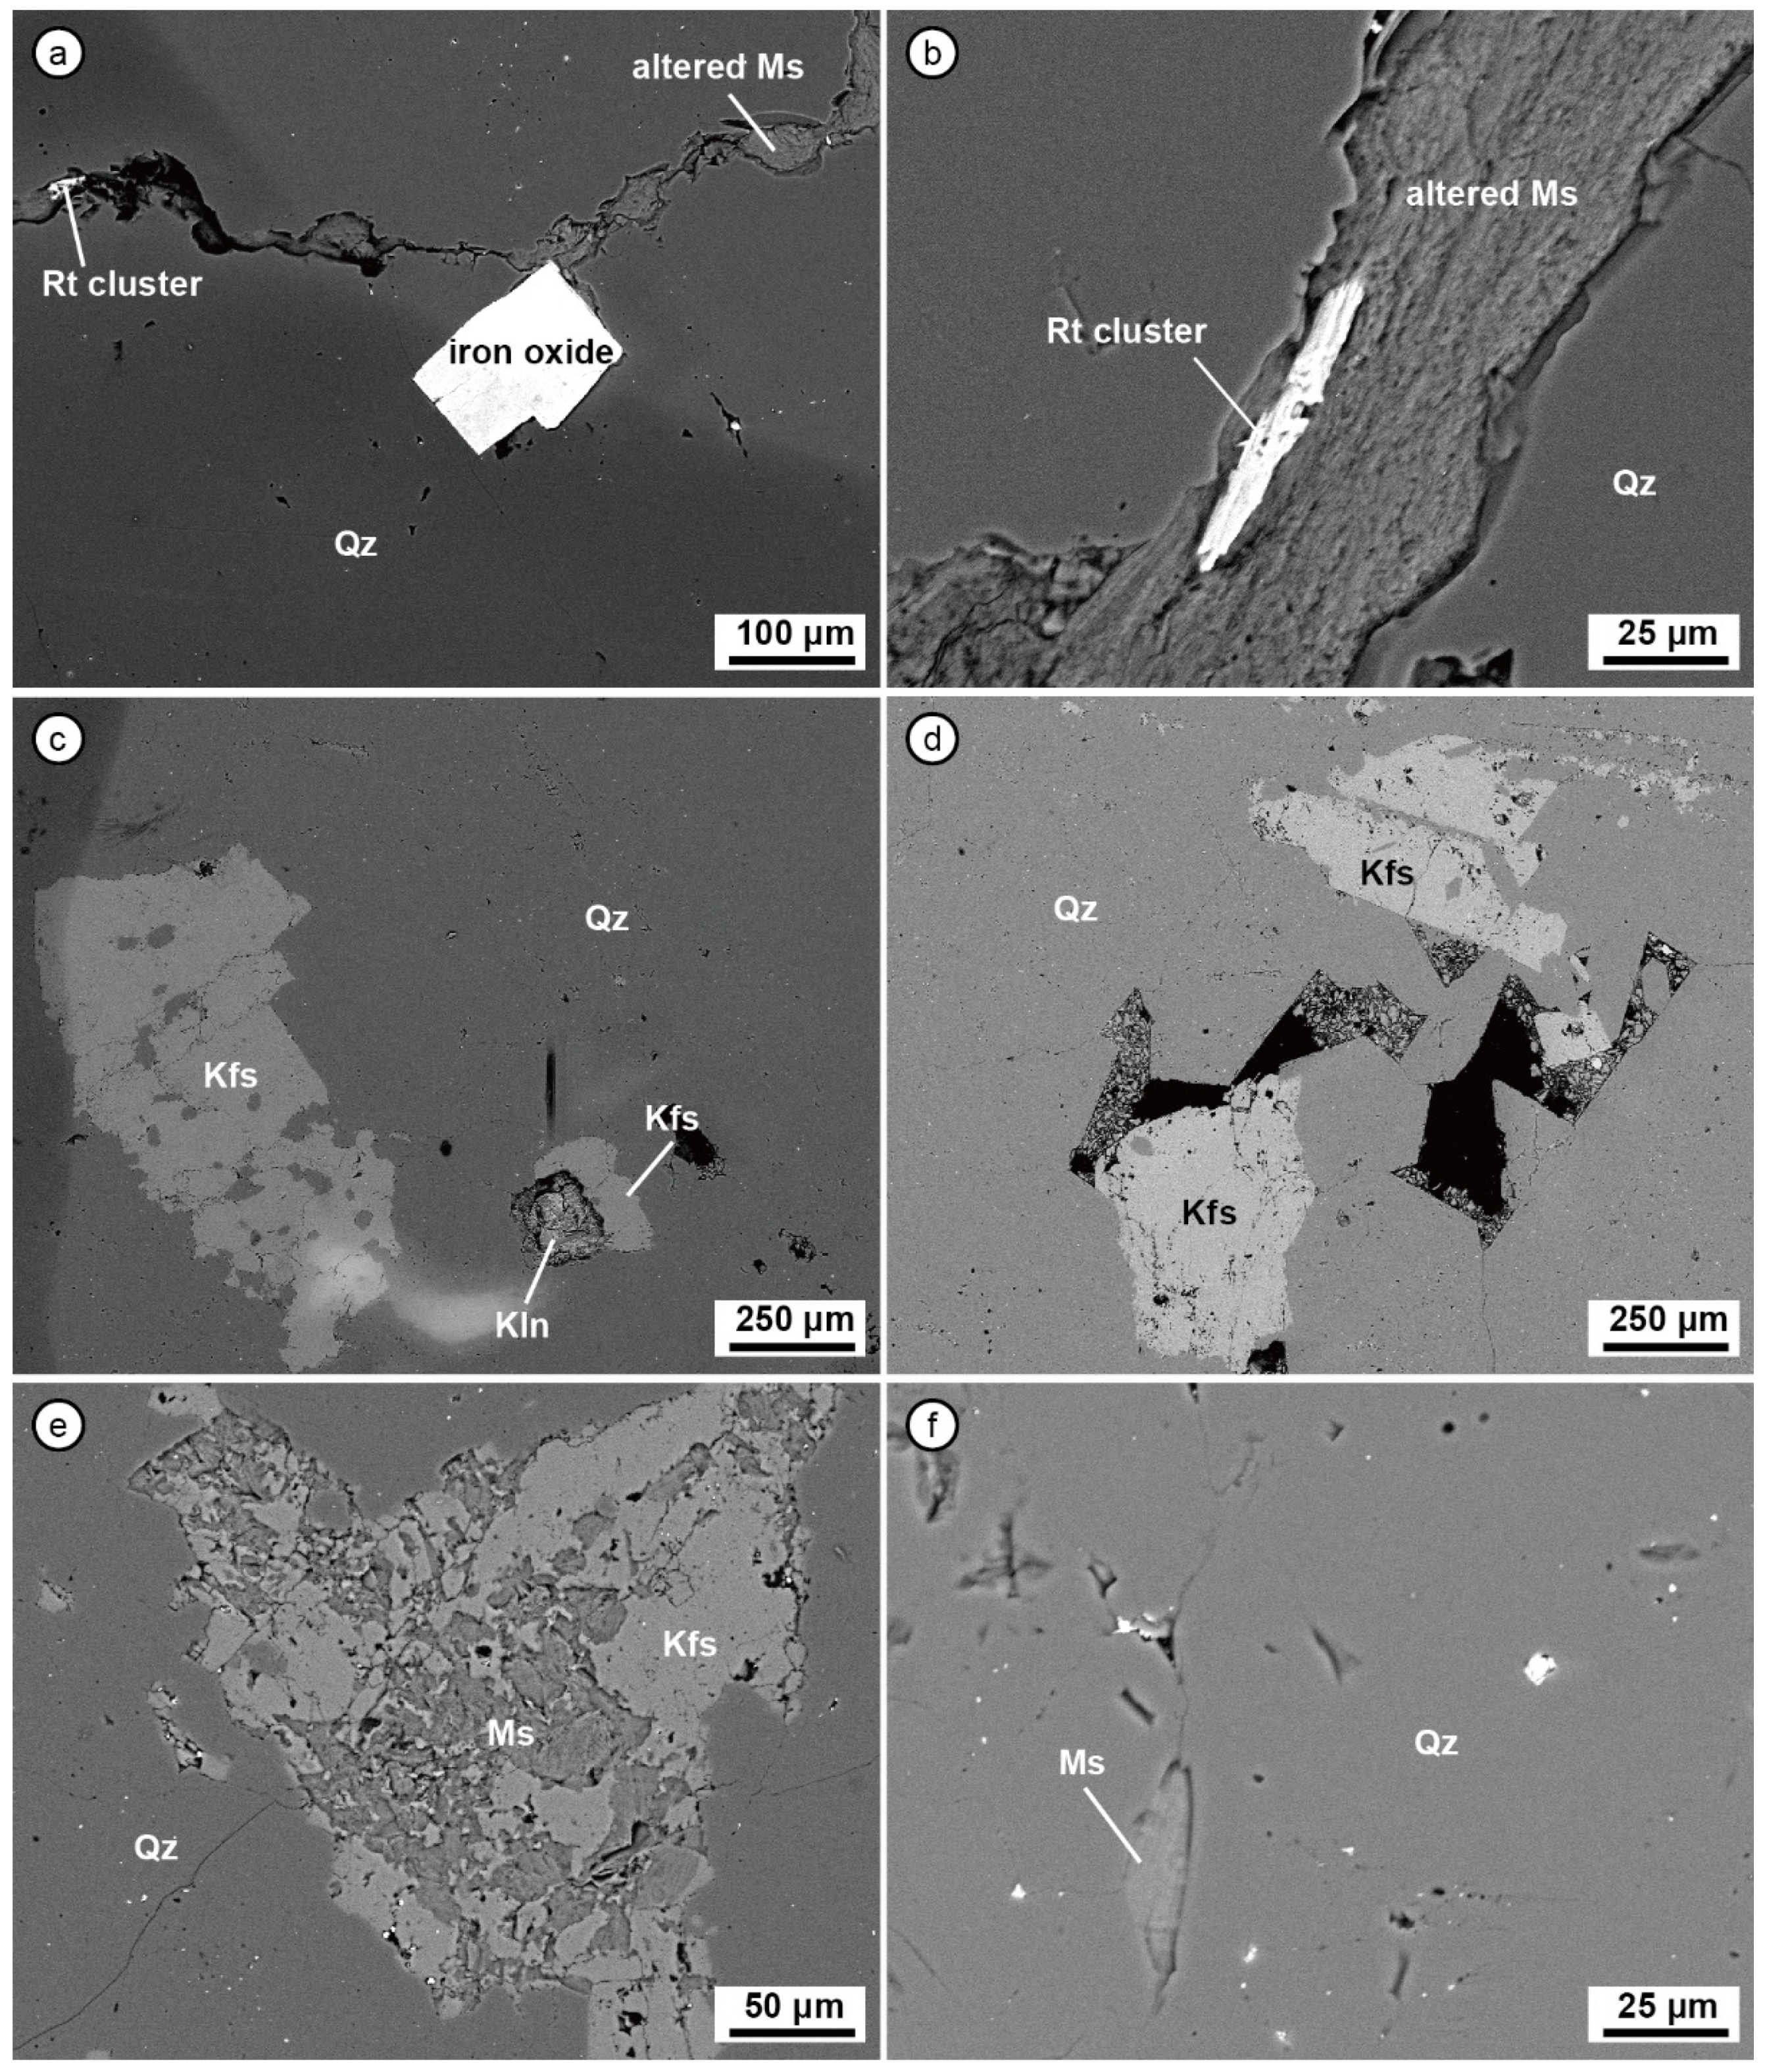
2.2.2. Scanning Electron Microscope
2.2.3. Raw Quartz Processing
2.2.4. Bulk Solution Chemical Analysis by ICP-OES
3. Results
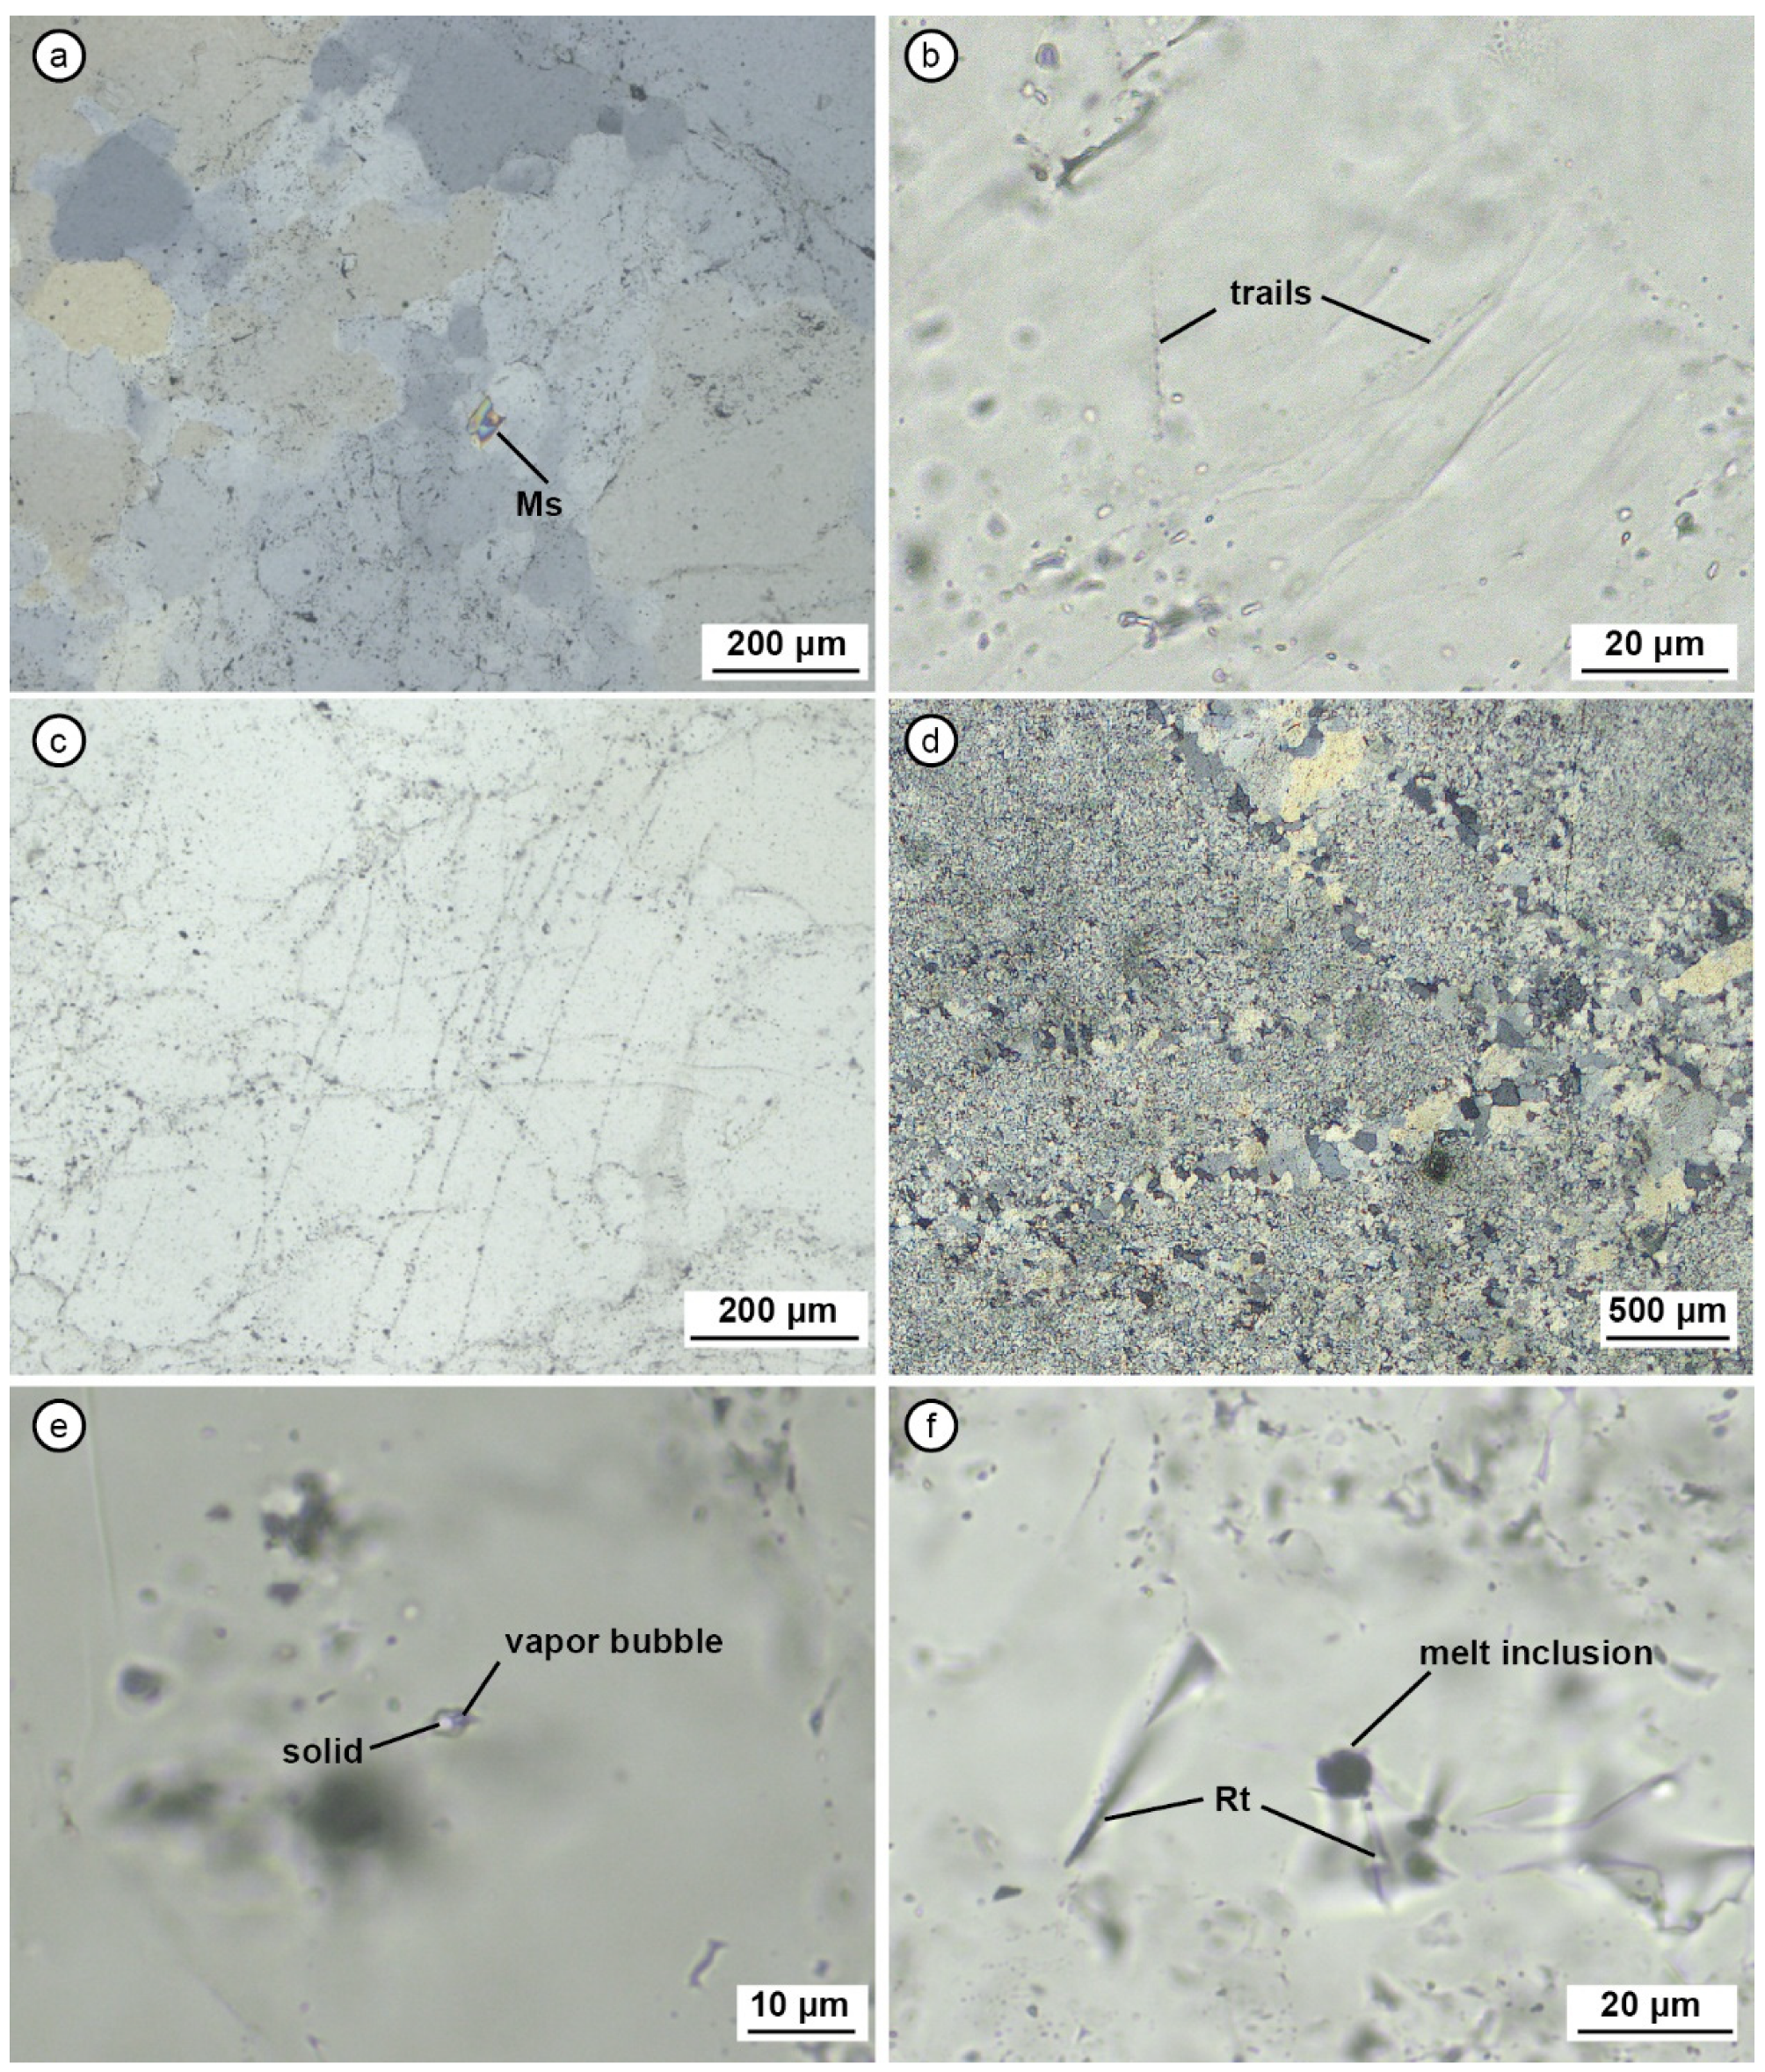
3.1. Petrography
3.1.1. Fujiashan Quartz Veins
3.1.2. Yipanqiu Quartz Veins
3.2. Chemical Composition
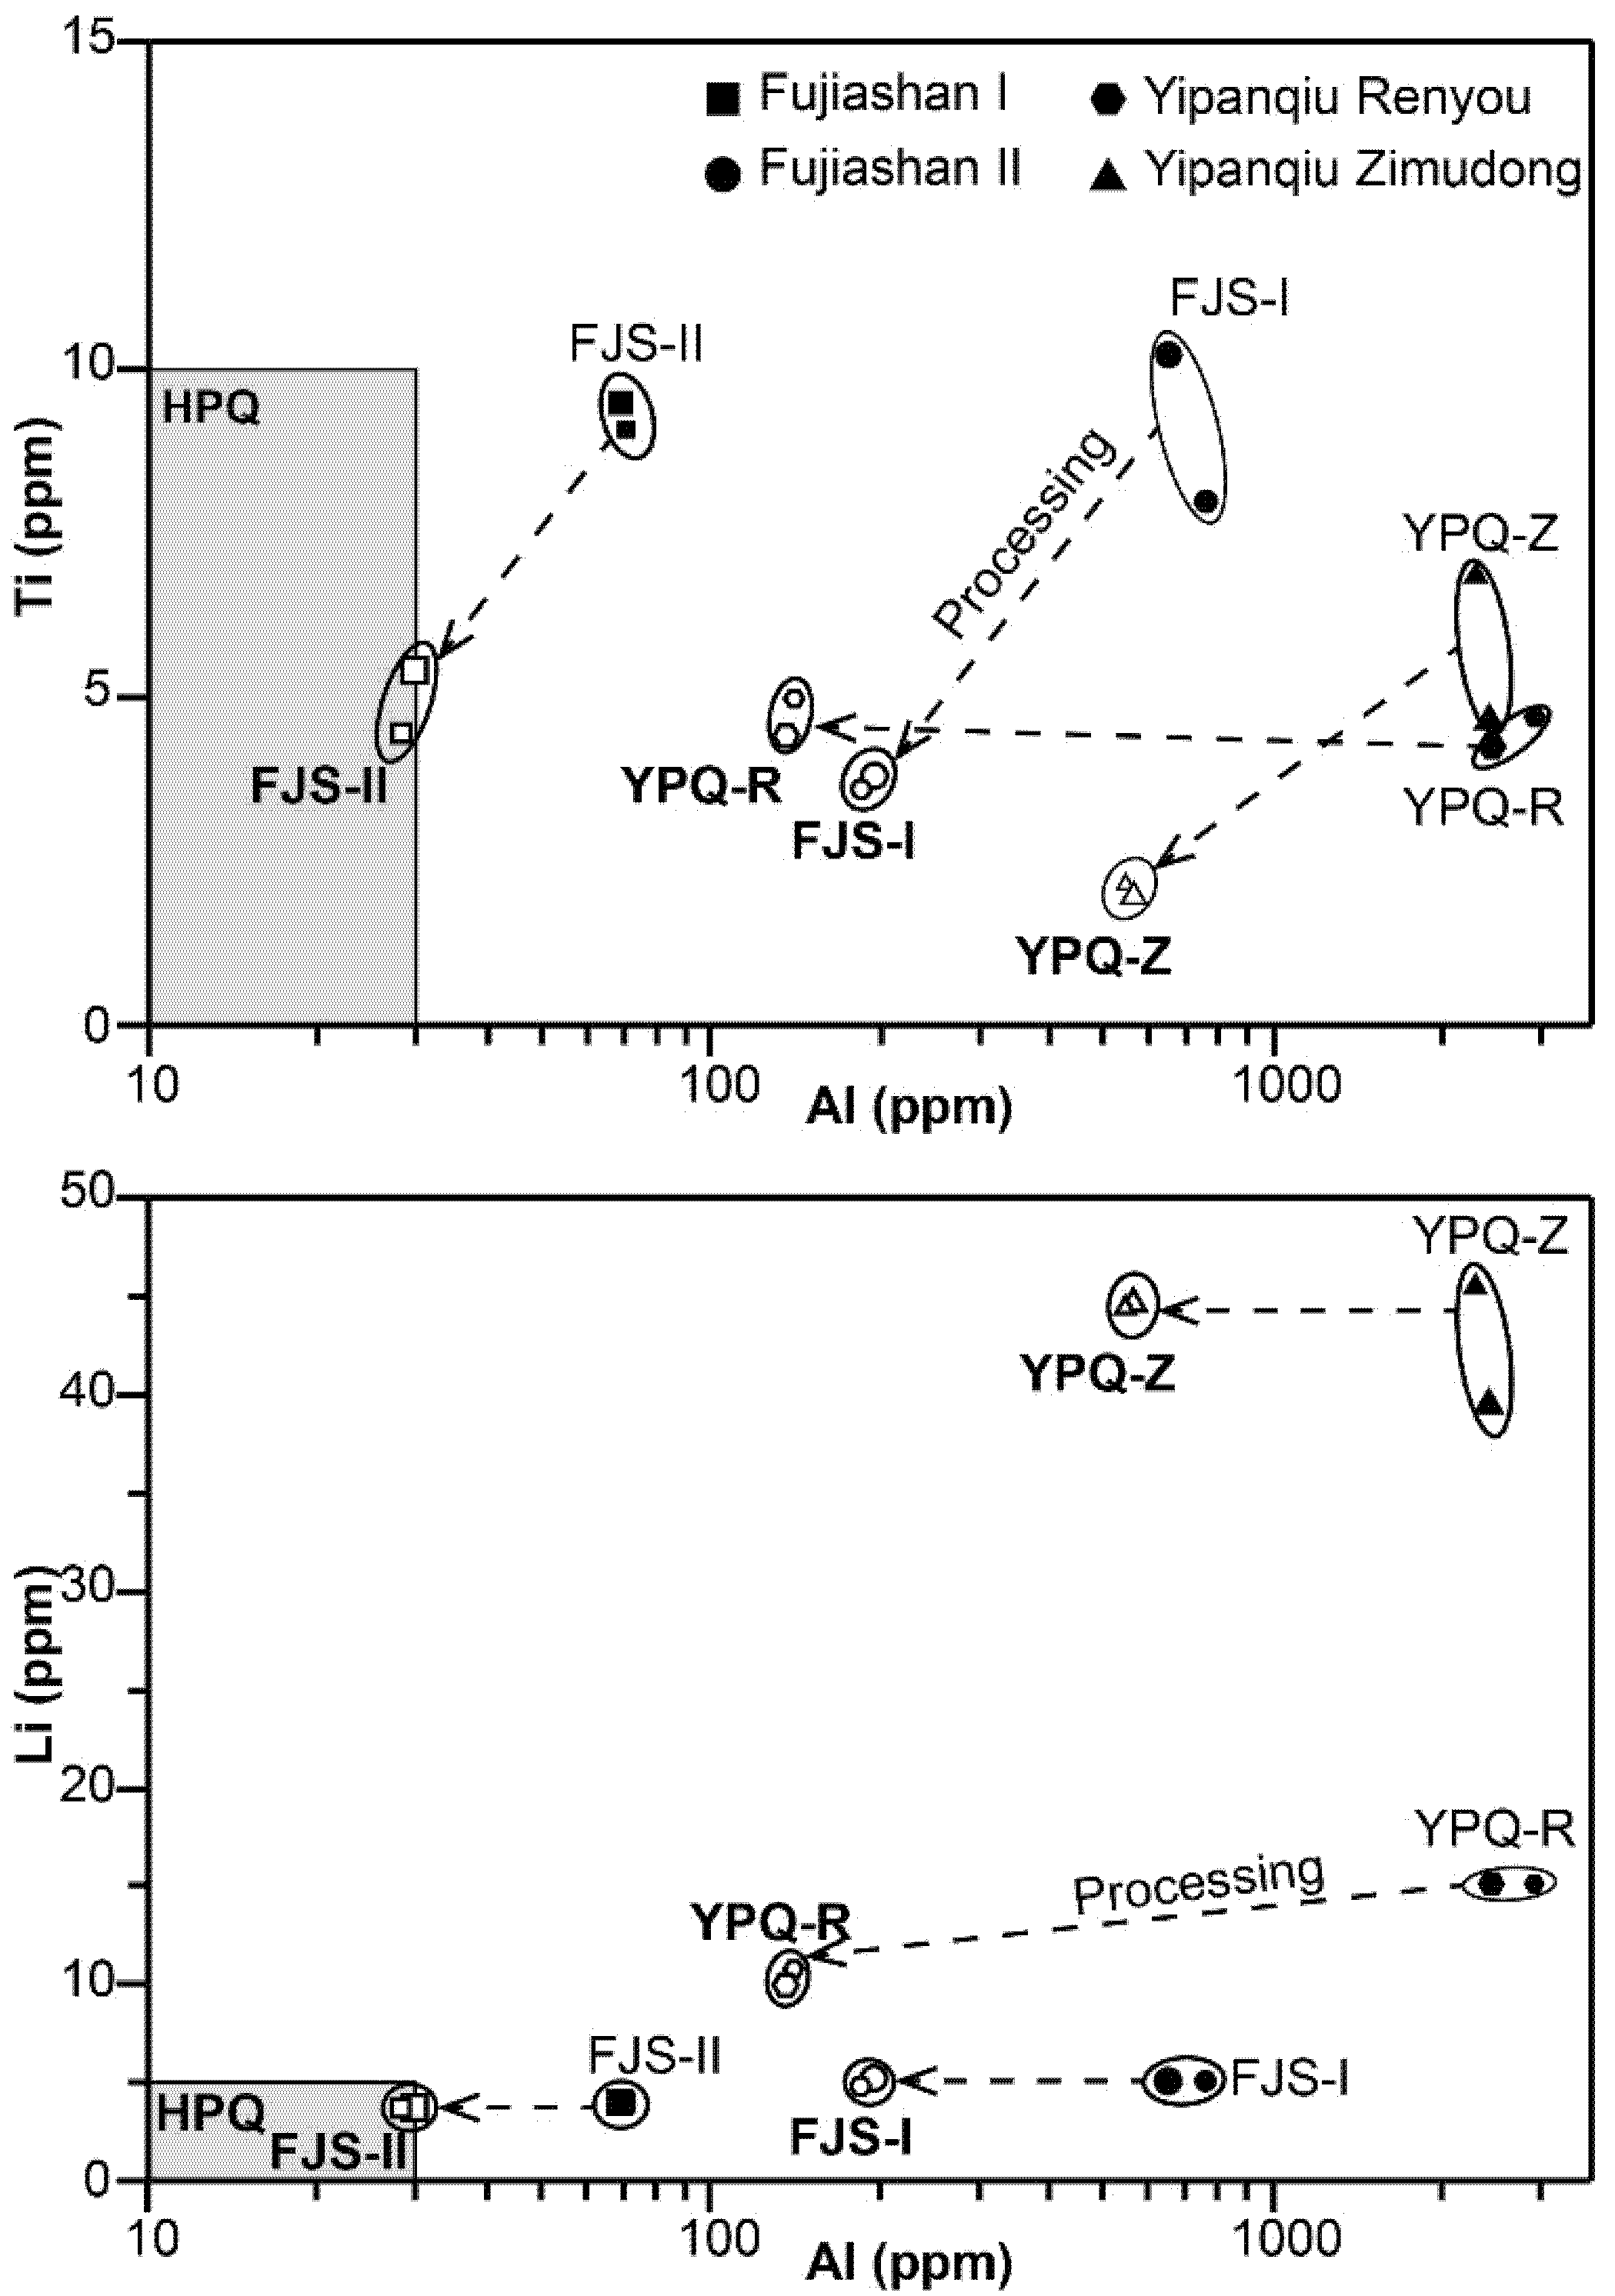
3.2.1. Raw Quartz
3.2.2. Processed Quartz
4. Discussion
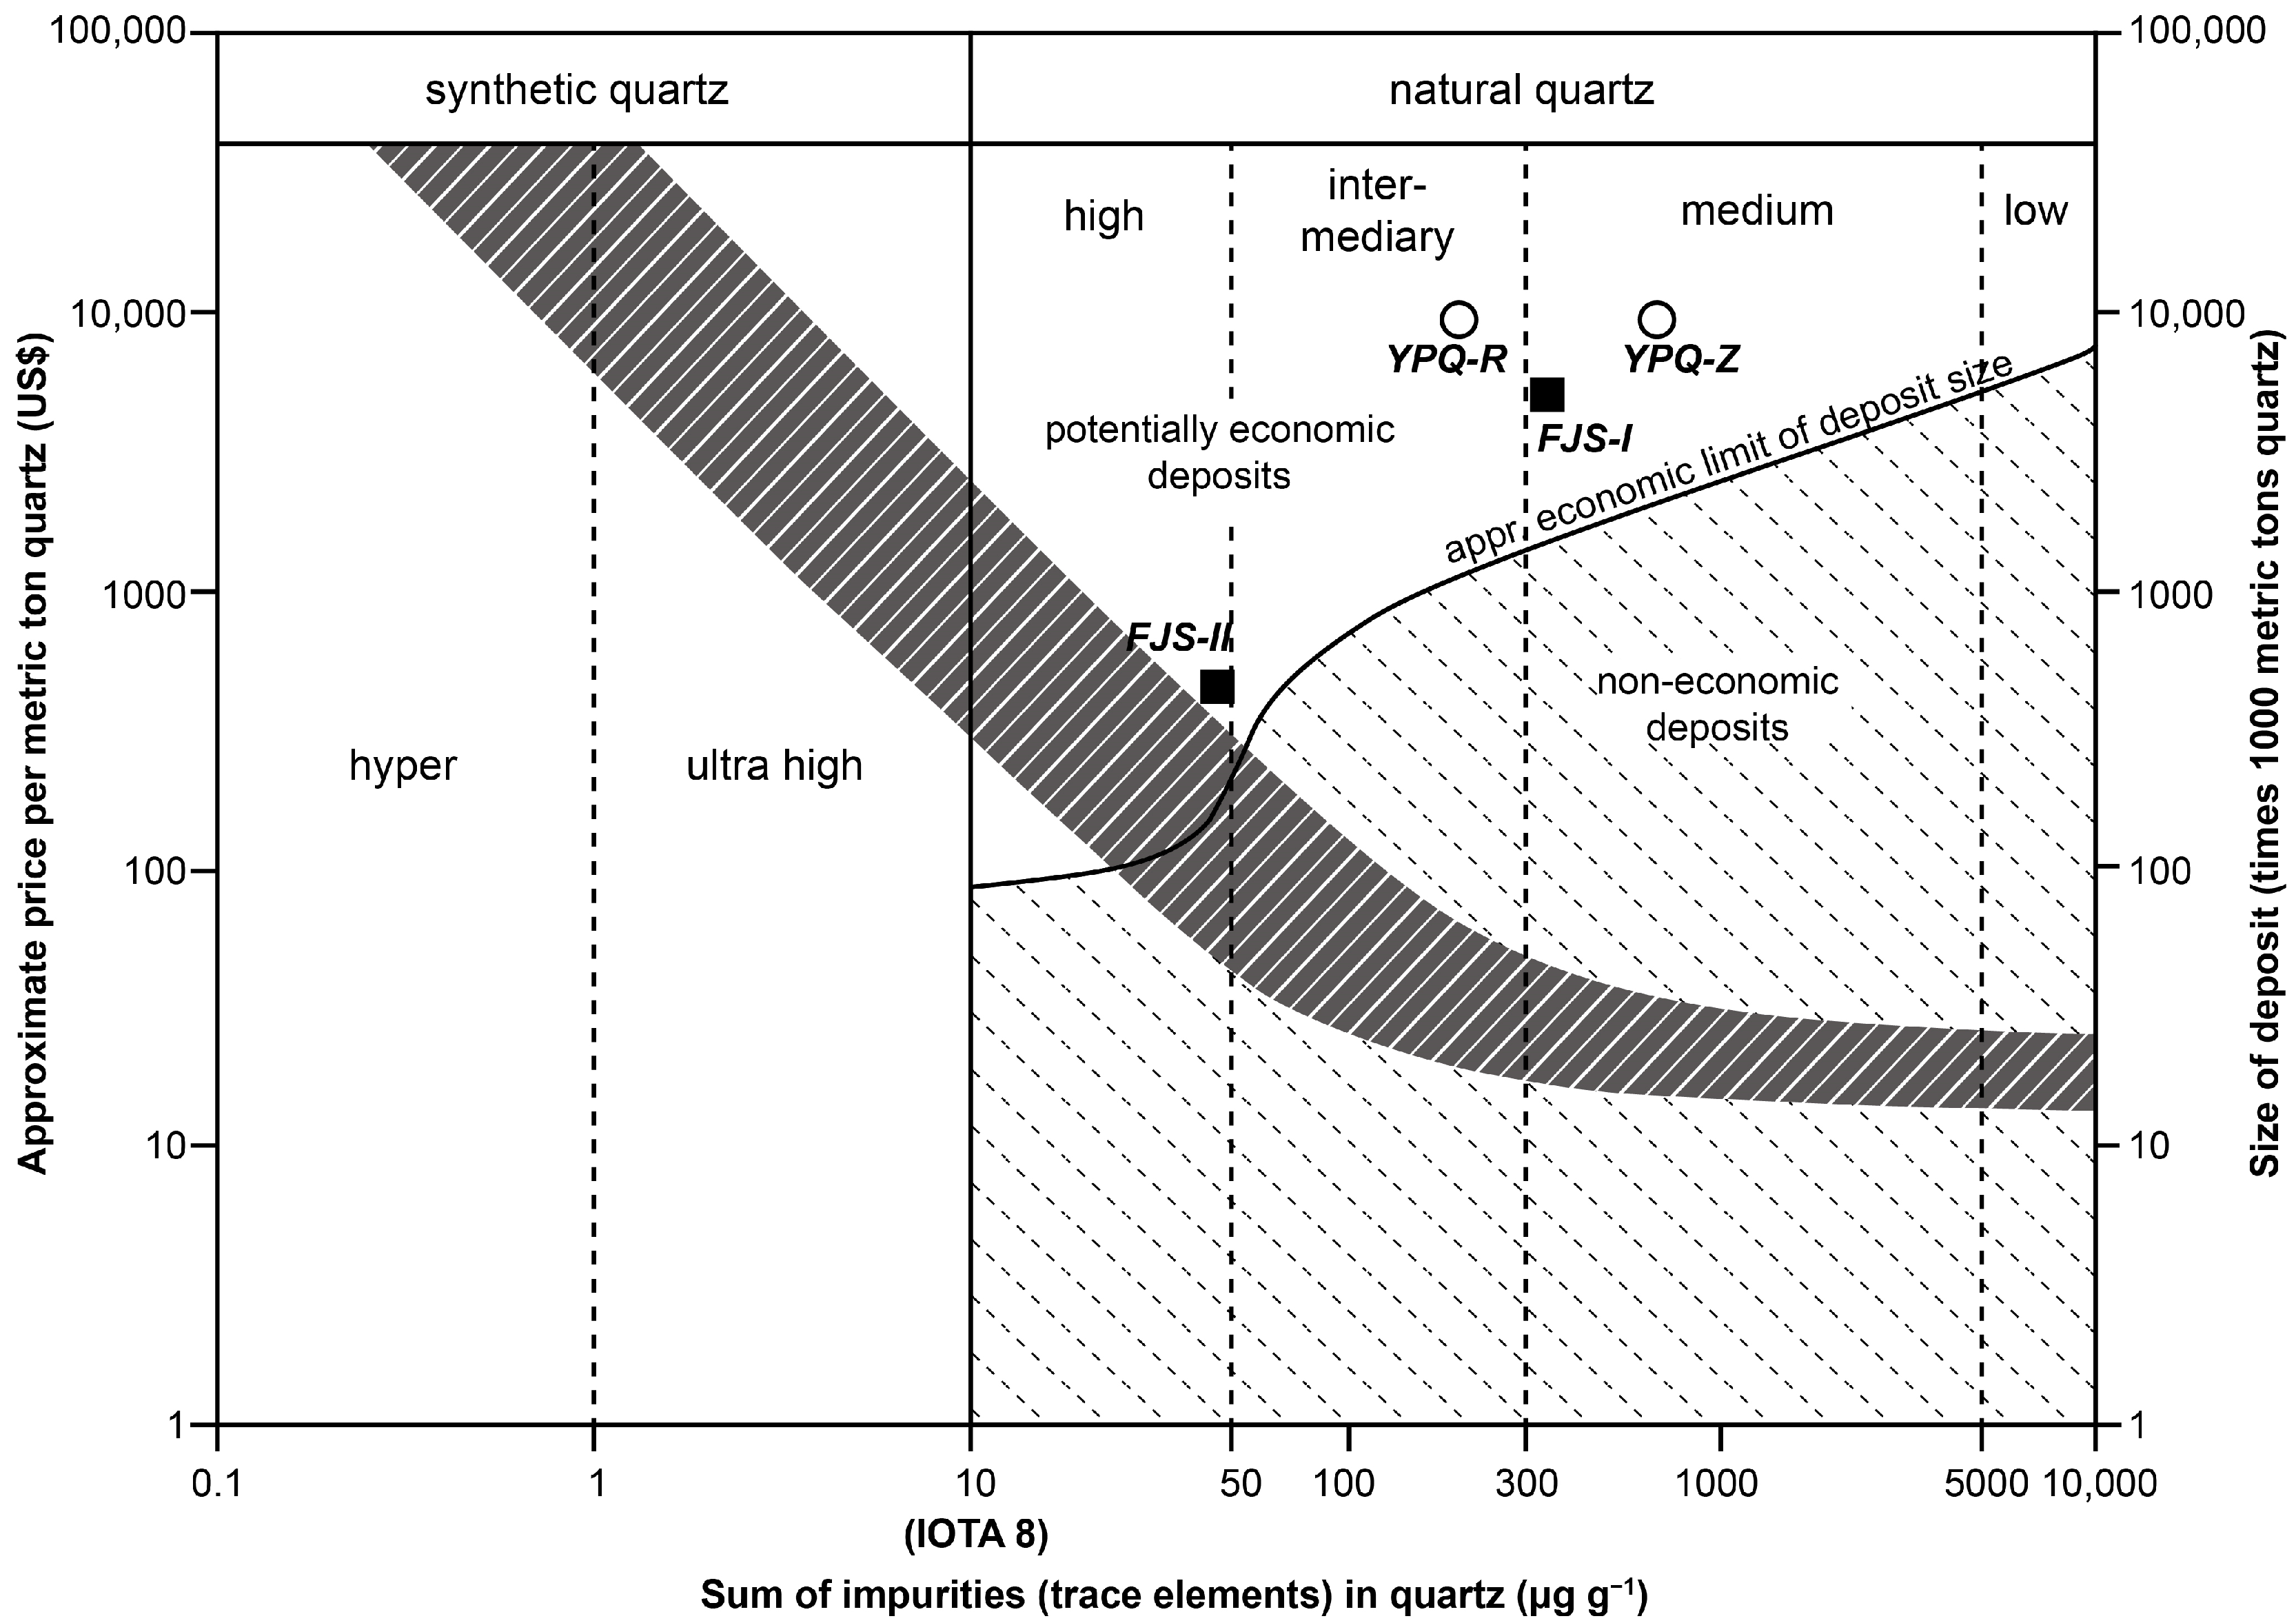
4.1. Economic Assessment with HPQ Aspect
4.2. Genetic Implications for the Fujiashan and Yipanqiu Quartz Deposits
5. Conclusions
Author Contributions
Funding
Data Availability Statement
Acknowledgments
Conflicts of Interest
References
- Götze, J. Classification, Mineralogy and Industrial Potential of SiO2 Minerals and Rocks. In Quartz: Deposits, Mineralogy and Analytics, 1st ed.; Götze, J., Möckel, R., Eds.; Springer: Berlin/Heidelberg, Germany, 2012; pp. 1–27. [Google Scholar]
- Götze, J.; Pan, Y.; Müller, A. Mineralogy and mineral chemistry of quartz: A review. Mineral. Mag. 2021, 85, 639–664. [Google Scholar] [CrossRef]
- Schlanz, J.W. High Pure and Ultra-High Pure Quartz. In Industrial Minerals & Rocks, 7th ed.; Kogel, J.E., Trivedi, N.C., Barker, J.M., Krukowski, S.T., Eds.; Society for Mining, Metallurgy, and Exploration, Inc.: Littleton, CO, USA, 2009; pp. 833–837. [Google Scholar]
- Haus, R.; Prinz, S.; Priess, C. Assessment of High Purity Quartz Resources. In Quartz: Deposits, Mineralogy and Analytics, 1st ed.; Götze, J., Möckel, R., Eds.; Springer: Berlin/Heidelberg, Germany, 2012; pp. 29–51. [Google Scholar]
- Haus, R. High demands on high purity—Processing high purity quartz and diatomite. Ind. Mineral. 2005, 10, 62–67. [Google Scholar]
- Müller, A.; Wanvik, J.E.; Ihlen, P.M. Petrological and Chemical Characterisation of High-Purity Quartz Deposits with Examples from Norway. In Quartz: Deposits, Mineralogy and Analytics, 1st ed.; Götze, J., Möckel, R., Eds.; Springer: Berlin/Heidelberg, Germany, 2012; pp. 71–118. [Google Scholar]
- Glover, A. The Spruce Pine Mining District—A brief review of the history, geology, and modern uses of the minerals mined in the Spruce Pine Mining District, Mitchell, Avery and Yancey Counties, North Carolina. In Proceedings of the 42nd Forum on the Geology of Industrial Minerals: Information Circular 34, Asheville, NC, USA, 7–13 May 2006; pp. 269–271. [Google Scholar]
- Swanson, S.E.; Veal, W.B. Mineralogy and petrogenesis of pegmatites in the Spruce Pine District, North Carolina, USA. J. Geosci. 2010, 55, 27–42. [Google Scholar] [CrossRef] [Green Version]
- Weil, J.A. A review of electron spin spectroscopy and its application to the study of paramagnetic defects in crystalline quartz. Phys. Chem. Miner. 1984, 10, 149–165. [Google Scholar] [CrossRef]
- Weil, J.A. A. A review of the EPR spectroscopy of the point defects in α-quartz: The decade 1982–1992. In Physics and Chemistry of SiO2 and the Si-SiO2 Interface 2; Helms, C.R., Deal, B.E., Eds.; Plenum Press: New York, NY, USA, 1993; pp. 131–144. [Google Scholar]
- Müller, A.; Ihlen, P.M.; Wanvik, J.E.; Flem, B. High-purity quartz mineralisation in kyanite quartzites, Norway. Miner. Depos. 2007, 42, 523–535. [Google Scholar] [CrossRef]
- Götze, J. Chemistry, textures and physical properties of quartz—Geological interpretation and technical application. Mineral. Mag. 2009, 73, 645–671. [Google Scholar] [CrossRef]
- Stalder, R. OH point defects in quartz—A review. Eur. J. Mineral. 2021, 33, 145–163. [Google Scholar] [CrossRef]
- Götze, J. Mineralogy and geochemistry of German high-purity quartz sands. In Mineral Deposits: Research and Exploration; Papunen, H., Ed.; Balkema: Rotterdam, The Netherlands, 1997; pp. 721–724. [Google Scholar]
- Harben, P.W. The Industrial Mineral Handy Book—A Guide to Markets, Specifications and Prices, 4th ed.; Industrial Mineral Information: London, UK, 2002; 412p. [Google Scholar]
- Blankenburg, H.J.; Götze, J.; Schulz, H. Quarzrohstoffe; Deutscher Verlag für Grundstoffindustrie: Leipzig-Stuttgart, Germany, 1994; 296p. [Google Scholar]
- Vatalis, K.I.; Charalambides, G.; Benetis, N.P. Market of high purity quartz innovative applications. Proc. Econ. Financ. 2015, 24, 734–742. [Google Scholar] [CrossRef] [Green Version]
- Müller, A.; Ihlen, P.M.; Snook, B.; Larsen, R.B.; Flem, B.; Bingen, B.; Williamson, B.J. The Chemistry of Quartz in Granitic Pegmatites of Southern Norway: Petrogenetic and Economic Implications. Econ. Geol. 2015, 110, 1737–1757. [Google Scholar] [CrossRef]
- Götze, J.; Pan, Y.; Müller, A.; Kotova, E.L.; Cerin, D. Trace Element Compositions and Defect Structures of High-Purity Quartz from the Southern Ural Region, Russia. Minerals 2017, 7, 189. [Google Scholar] [CrossRef]
- Müller, A.; Wiedenbeck, M.; Van den Kerkhof, A.M.; Kronz, A.; Simon, K. Trace elements in quartz—A combined electron microprobe, secondary ion mass spectrometry, laser-ablation ICP-MS, and cathodoluminescence study. Eur. J. Mineral. 2003, 15, 747–763. [Google Scholar] [CrossRef]
- Götze, J.; Plötze, M.; Graupner, T.; Hallbauer, D.; Bray, C.J. Trace element incorporation into quartz: A combined study by ICP-MS, electron spin resonance, cathodoluminescence, capillary ion analysis and gas chromatography. Geochim. Cosmochim. Acta 2004, 68, 3741–3759. [Google Scholar] [CrossRef]
- Müller, A.; Wiedenbeck, M.; Flem, B.; Schiellerup, H. Refinement of Phosphorus Determination in Quartz by LA-ICP-MS through Defining New Reference Material Values. Geostand. Geoanal. Res. 2008, 32, 361–376. [Google Scholar] [CrossRef]
- Rusk, B.; Koenig, A.; Lowers, H. Visualizing trace element distribution in quartz using cathodoluminescence, electron microprobe, and laser ablation-inductively coupled plasma-mass spectrometry. Am. Mineral. 2011, 96, 703–708. [Google Scholar] [CrossRef]
- Flem, B.; Müller, A. In Situ Analysis of Trace Elements in Quartz Using Laser Ablation Inductively Coupled Plasma Mass Spectrometry. In Quartz: Deposits, Mineralogy and Analytics, 1st ed.; Götze, J., Möckel, R., Eds.; Springer: Berlin/Heidelberg, Germany, 2012; pp. 219–236. [Google Scholar]
- Kronz, A.; Van den Kerkhof, A.M.; Müller, A. Analysis of Low Element Concentrations in Quartz by Electron Microprobe. In Quartz: Deposits, Mineralogy and Analytics, 1st ed.; Götze, J., Möckel, R., Eds.; Springer: Berlin/Heidelberg, Germany, 2012; pp. 191–217. [Google Scholar]
- Müller, A.; Keyser, W.; Simmons, W.B.; Webber, K.; Wise, M.; Beurlen, H.; Garate-Olave, I.; Roda-Robles, E.; Galliski, M.Á. Quartz chemistry of granitic pegmatites: Implications for classification, genesis and exploration. Chem. Geol. 2021, 584, 120507. [Google Scholar] [CrossRef]
- Götze, J.; Plötze, M.; Fuchs, H.; Habermann, D. Defect Structure and Luminescence Behaviour of Agate—Results of Electron Paramagnetic Resonance (EPR) and Cathodoluminescence (CL) Studies. Mineral. Mag. 1999, 63, 149–163. [Google Scholar] [CrossRef]
- Van den Kerkhof, A.M.; Hein, U.F. Fluid inclusion petrography. Lithos 2001, 55, 22–47. [Google Scholar] [CrossRef]
- Götze, J.; Pan, Y.; Marion Stevens-Kalceff, U.K.; Müller, A. Origin and significance of the yellow cathodoluminescence (CL) of quartz. Am. Mineral. 2015, 100, 1469–1482. [Google Scholar] [CrossRef]
- Monecke, T.; Kempe, U.; Götze, J. Genetic significance of the trace element content in metamorphic and hydrothermal quartz: A reconnaissance study. Earth Planet. Sci. Lett. 2002, 202, 709–724. [Google Scholar] [CrossRef]
- Larsen, R.B.; Henderson, I.; Ihlen, P.M.; Jacamon, F. Distribution and petrogenetic behaviour of trace elements in granitic pegmatite quartz from South Norway. Contrib. Mineral. Petr. 2004, 147, 615–628. [Google Scholar] [CrossRef]
- Kempe, U.; Götze, J.; Dombon, E.; Monecke, T.; Poutivtsev, M. Quartz Regeneration and its Use as a Repository of Genetic Information. In Quartz: Deposits, Mineralogy and Analytics, 1st ed.; Götze, J., Möckel, R., Eds.; Springer: Berlin/Heidelberg, Germany, 2012; pp. 331–355. [Google Scholar]
- Lin, M.; Pei, Z.; Lei, S. Mineralogy and Processing of Hydrothermal Vein Quartz from Hengche, Hubei Province (China). Minerals 2017, 7, 161. [Google Scholar] [CrossRef] [Green Version]
- Zhao, G.; Cawood, P.A. Tectonothemal evolution of the Mayuan assemblage in the Cathaysia block: Implications for Neoproterozoic collision-related assembly of the South China Craton. Am. J. Sci. 1999, 299, 309–339. [Google Scholar] [CrossRef] [Green Version]
- Li, X.-H.; Li, W.-X.; Li, Z.-X.; Lo, C.-H.; Wang, J.; Ye, M.-F.; Yang, Y.-H. Amalgamation between the Yangtze and Cathaysia Blocks in South China: Constraints from SHRIMP U–Pb zircon ages, geochemistry and Nd–Hf isotopes of the Shuangxiwu volcanic rocks. Precambrian Res. 2009, 174, 117–128. [Google Scholar] [CrossRef]
- Bureau of Geology and Mineral Resources of Hubei Province. Geological Memoirs (Series 1 Number 20) Regional Geology of Hubei Province (Include Attached Maps); Geology Press: Beijing, China, 1987; 721p, (In Chinese with English abstract). [Google Scholar]
- Zhou, X.; Xu, X.; Huang, S. Geological characteristics of silica deposits in Fujiashan area, Tongshan County, Hubei Province, China, and prospecting Indicators. West. Resour. 2011, 4, 60–62. (In Chinese) [Google Scholar]
- Wang, X.; Yi, C.; Tu, B.; Zang, J.; Guo, S.; Lu, C. Geological Characteristics and Metallogenic Regularity of Vein Quartz Deposit in Hubei Province. China Nonmet. Miner. Ind. 2020, 5, 46–50, (In Chinese with English abstract). [Google Scholar]
- Wang, Y.; Ma, C.; Wang, L.; Liu, Y. Zircon U-Pb Geochronology, Geochemistry and Sr-Nd-Hf Isotopes of the Neoproterozoic Granites on the Southeastern Margin of the Yangtze Block: Constraint on Crustal Growth. Earth Sci. 2018, 43, 635–654, (In Chinese with English abstract). [Google Scholar]
- Wang, X.-L.; Zhou, J.-C.; Griffin, W.L.; Wang, R.-C.; Qiu, J.-S.; O’Reilly, S.Y.; Xu, X.; Liu, X.-M.; Zhang, G.-L. Detrital zircon geochronology of Precambrian basement sequences in the Jiangnan orogen: Dating the assembly of the Yangtze and Cathaysia Blocks. Precambrian Res. 2007, 159, 117–131. [Google Scholar] [CrossRef]
- Wang, L.-X.; Ma, C.-Q.; Zhang, C.; Zhang, J.-Y.; Marks, M.A.W. Genesis of leucogranite by prolonged fractional crystallization: A case study of the Mufushan complex, South China. Lithos 2014, 206–207, 147–163. [Google Scholar] [CrossRef]
- Wang, Y.; Ma, C.; Wang, L.; Liu, Y. Petrogenesis and Tectonic Implications of the Cretaceous Granites from Xiaojiugong-Shadian, Northwest Jiangxi Province. Earth Sci. 2020, 45, 1115–1135, (In Chinese with English abstract). [Google Scholar]
- Wang, W.; Cong, J.; Deng, J.; Weng, X.; Lin, Y.; Huang, Y.; Peng, T. Developing Effective Separation of Feldspar and Quartz While Recycling Tailwater by HF Pretreatment. Minerals 2018, 8, 149. [Google Scholar] [CrossRef] [Green Version]
- Müller, A.; Koch-Müller, M. Hydrogen speciation and trace element contents of igneous, hydrothermal and metamorphic quartz from Norway. Mineral. Mag. 2009, 73, 569–583. [Google Scholar] [CrossRef]
- Günther, D.; Audétat, A.; Frischknecht, R.; Heinrich, C.A. Quantitative analysis of major, minor and trace elements in fluid inclusions using laser ablation–inductively coupled plasma mass spectrometry. J. Anal. Atom. Spectrom. 1998, 13, 263–270. [Google Scholar] [CrossRef]
- Ladenburger, S.; Walter, B.F.; Marks, M.A.W.; Markl, G. Combining Ion Chromatography and Total Reflection X-ray Fluorescence for Detection of Major, Minor and Trace Elements in Quartz-Hosted Fluid Inclusions. J. Anal. Chem. 2020, 75, 1477–1485. [Google Scholar] [CrossRef]
- Van den Kerkhof, A.M.; Kronz, A.; Simon, K.; Scherer, T. Fluid-controlled quartz recovery in granulite as revealed by cathodoluminescence and trace element analysis (Bamble sector, Norway). Contrib. Mineral. Petrol. 2004, 146, 637–652. [Google Scholar]
- Passchier, C.W.; Trouw, R.S.J. Microtectonics; Springer: Heidelberg, Germany, 2006; 366p. [Google Scholar]


| Sample Number | Quartz Powder | Grain Size (Mesh) | Al | B | Ca | Fe | K | Li | Na | P | Ti | Total |
|---|---|---|---|---|---|---|---|---|---|---|---|---|
| Fujiashan-I vein | ||||||||||||
| FJS-I | raw | 40~80 | 650.60 | 1.96 | 144.79 | 23.31 | 636.93 | 5.06 | 39.46 | <0.8 | 10.21 | 1512.33 |
| processed | 40~80 | 196.67 | <0.10 | 8.57 | 2.92 | 153.02 | 5.17 | 4.55 | <0.3 | 3.78 | 374.66 | |
| raw | 80~120 | 764.97 | 1.85 | 39.73 | 67.67 | 814.84 | 4.99 | 47.44 | <0.8 | 7.98 | 1749.47 | |
| processed | 80~120 | 185.42 | <0.10 | 7.27 | 2.91 | 144.58 | 4.85 | 5.15 | <0.3 | 3.57 | 353.74 | |
| Fujiashan-II vein | ||||||||||||
| FJS-II | raw | 40~80 | 69.13 | 1.83 | 17.99 | 13.78 | 6.92 | 3.99 | 28.12 | <0.8 | 9.46 | 151.22 |
| processed | 40~80 | 29.82 | 0.88 | 2.68 | 1.22 | <2.10 | 3.70 | 6.86 | <0.8 | 5.40 | 50.54 | |
| raw | 80~120 | 70.60 | 1.95 | 30.37 | 58.89 | 7.91 | 3.95 | 27.42 | <0.8 | 9.07 | 210.16 | |
| processed | 80~120 | 28.18 | 0.37 | 4.66 | 0.68 | <2.10 | 3.72 | 6.60 | <0.8 | 4.45 | 48.66 | |
| Yipanqiu quartz at Renyou | ||||||||||||
| YPQ-R | raw | 40~80 | 2448.93 | 0.96 | 32.93 | 14.68 | 2884.48 | 15.00 | 51.95 | 1.65 | 4.25 | 5454.83 |
| processed | 40~80 | 137.39 | <0.10 | 8.33 | 5.73 | 35.63 | 9.92 | 2.05 | <0.30 | 4.41 | 203.47 | |
| raw | 80~120 | 2910.47 | 1.04 | 42.20 | 13.65 | 3564.08 | 15.00 | 56.94 | <0.80 | 4.67 | 6608.04 | |
| processed | 80~120 | 141.95 | <0.10 | 7.55 | 4.27 | 30.91 | 10.79 | 1.64 | <0.30 | 4.97 | 202.09 | |
| Yipanqiu quartz at Zimudong | ||||||||||||
| YPQ-Z | raw | 40~80 | 2425.13 | 0.77 | 24.15 | 28.05 | 1547.74 | 39.54 | 38.15 | 1.79 | 4.62 | 4109.95 |
| processed | 40~80 | 568.46 | <0.10 | 8.40 | 1.32 | 66.26 | 44.65 | 15.11 | <0.80 | 2.01 | 706.20 | |
| raw | 80~120 | 2296.15 | 1.00 | 34.36 | 41.86 | 1916.98 | 45.48 | 46.42 | 1.33 | 6.84 | 4390.42 | |
| processed | 80~120 | 550.23 | <0.10 | 7.69 | 1.68 | 62.98 | 44.45 | 14.78 | <0.80 | 2.17 | 683.97 | |
Publisher’s Note: MDPI stays neutral with regard to jurisdictional claims in published maps and institutional affiliations. |
© 2022 by the authors. Licensee MDPI, Basel, Switzerland. This article is an open access article distributed under the terms and conditions of the Creative Commons Attribution (CC BY) license (https://creativecommons.org/licenses/by/4.0/).
Share and Cite
Wang, J.; Xie, Z.; Wang, C.; Hu, Y. Trace Element Concentrations and Mineralogy of Quartz Vein Deposits from Southeastern Hubei Province, China. Minerals 2022, 12, 814. https://doi.org/10.3390/min12070814
Wang J, Xie Z, Wang C, Hu Y. Trace Element Concentrations and Mineralogy of Quartz Vein Deposits from Southeastern Hubei Province, China. Minerals. 2022; 12(7):814. https://doi.org/10.3390/min12070814
Chicago/Turabian StyleWang, Jiuyi, Zefeng Xie, Chunlian Wang, and Yufei Hu. 2022. "Trace Element Concentrations and Mineralogy of Quartz Vein Deposits from Southeastern Hubei Province, China" Minerals 12, no. 7: 814. https://doi.org/10.3390/min12070814
APA StyleWang, J., Xie, Z., Wang, C., & Hu, Y. (2022). Trace Element Concentrations and Mineralogy of Quartz Vein Deposits from Southeastern Hubei Province, China. Minerals, 12(7), 814. https://doi.org/10.3390/min12070814