
Stability Evaluation and Structural Parameters Optimization of Stope Based on Area Bearing Theory

Abstract
:1. Introduction
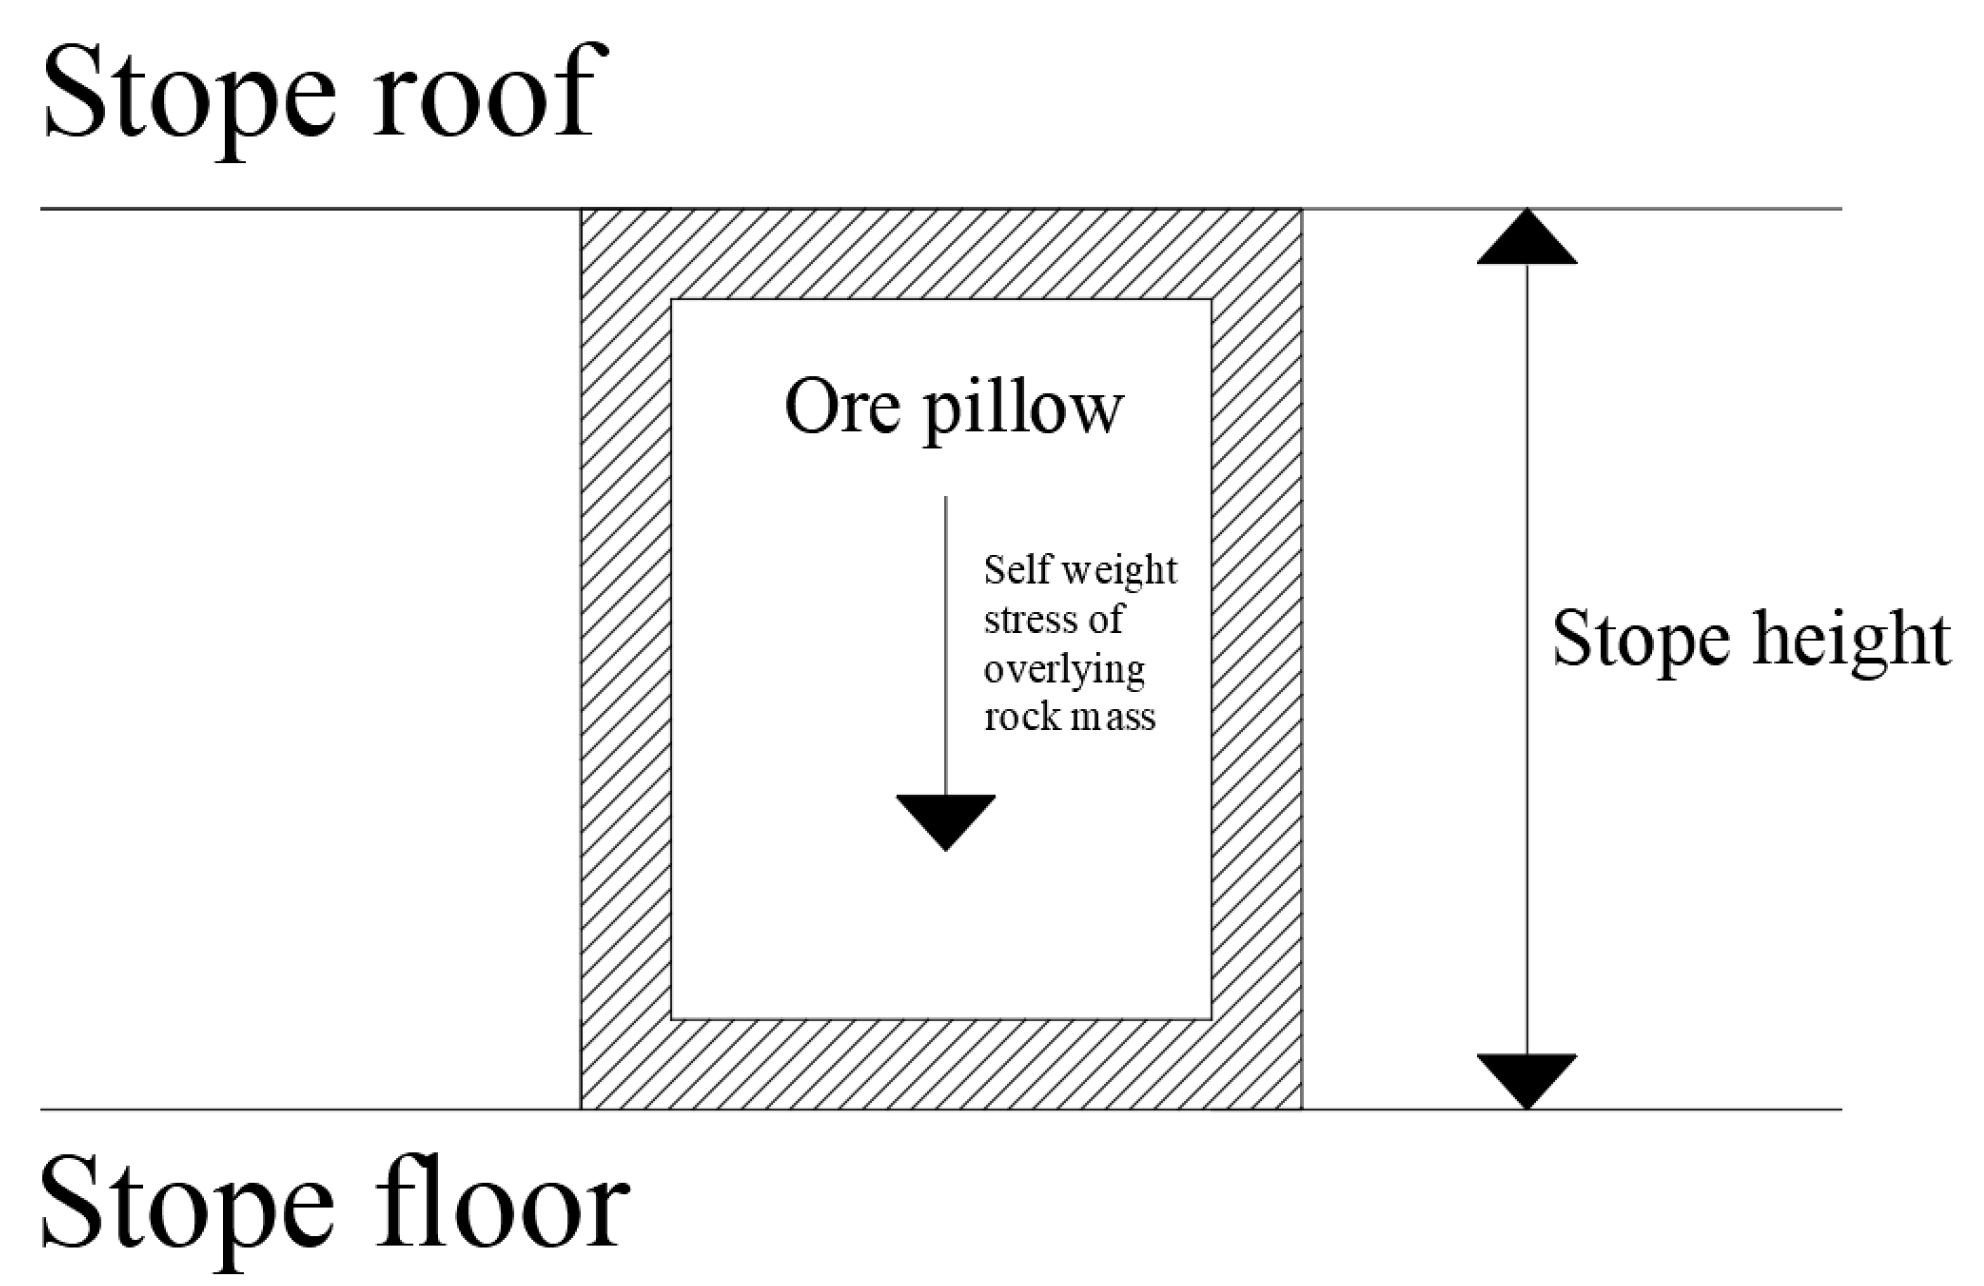
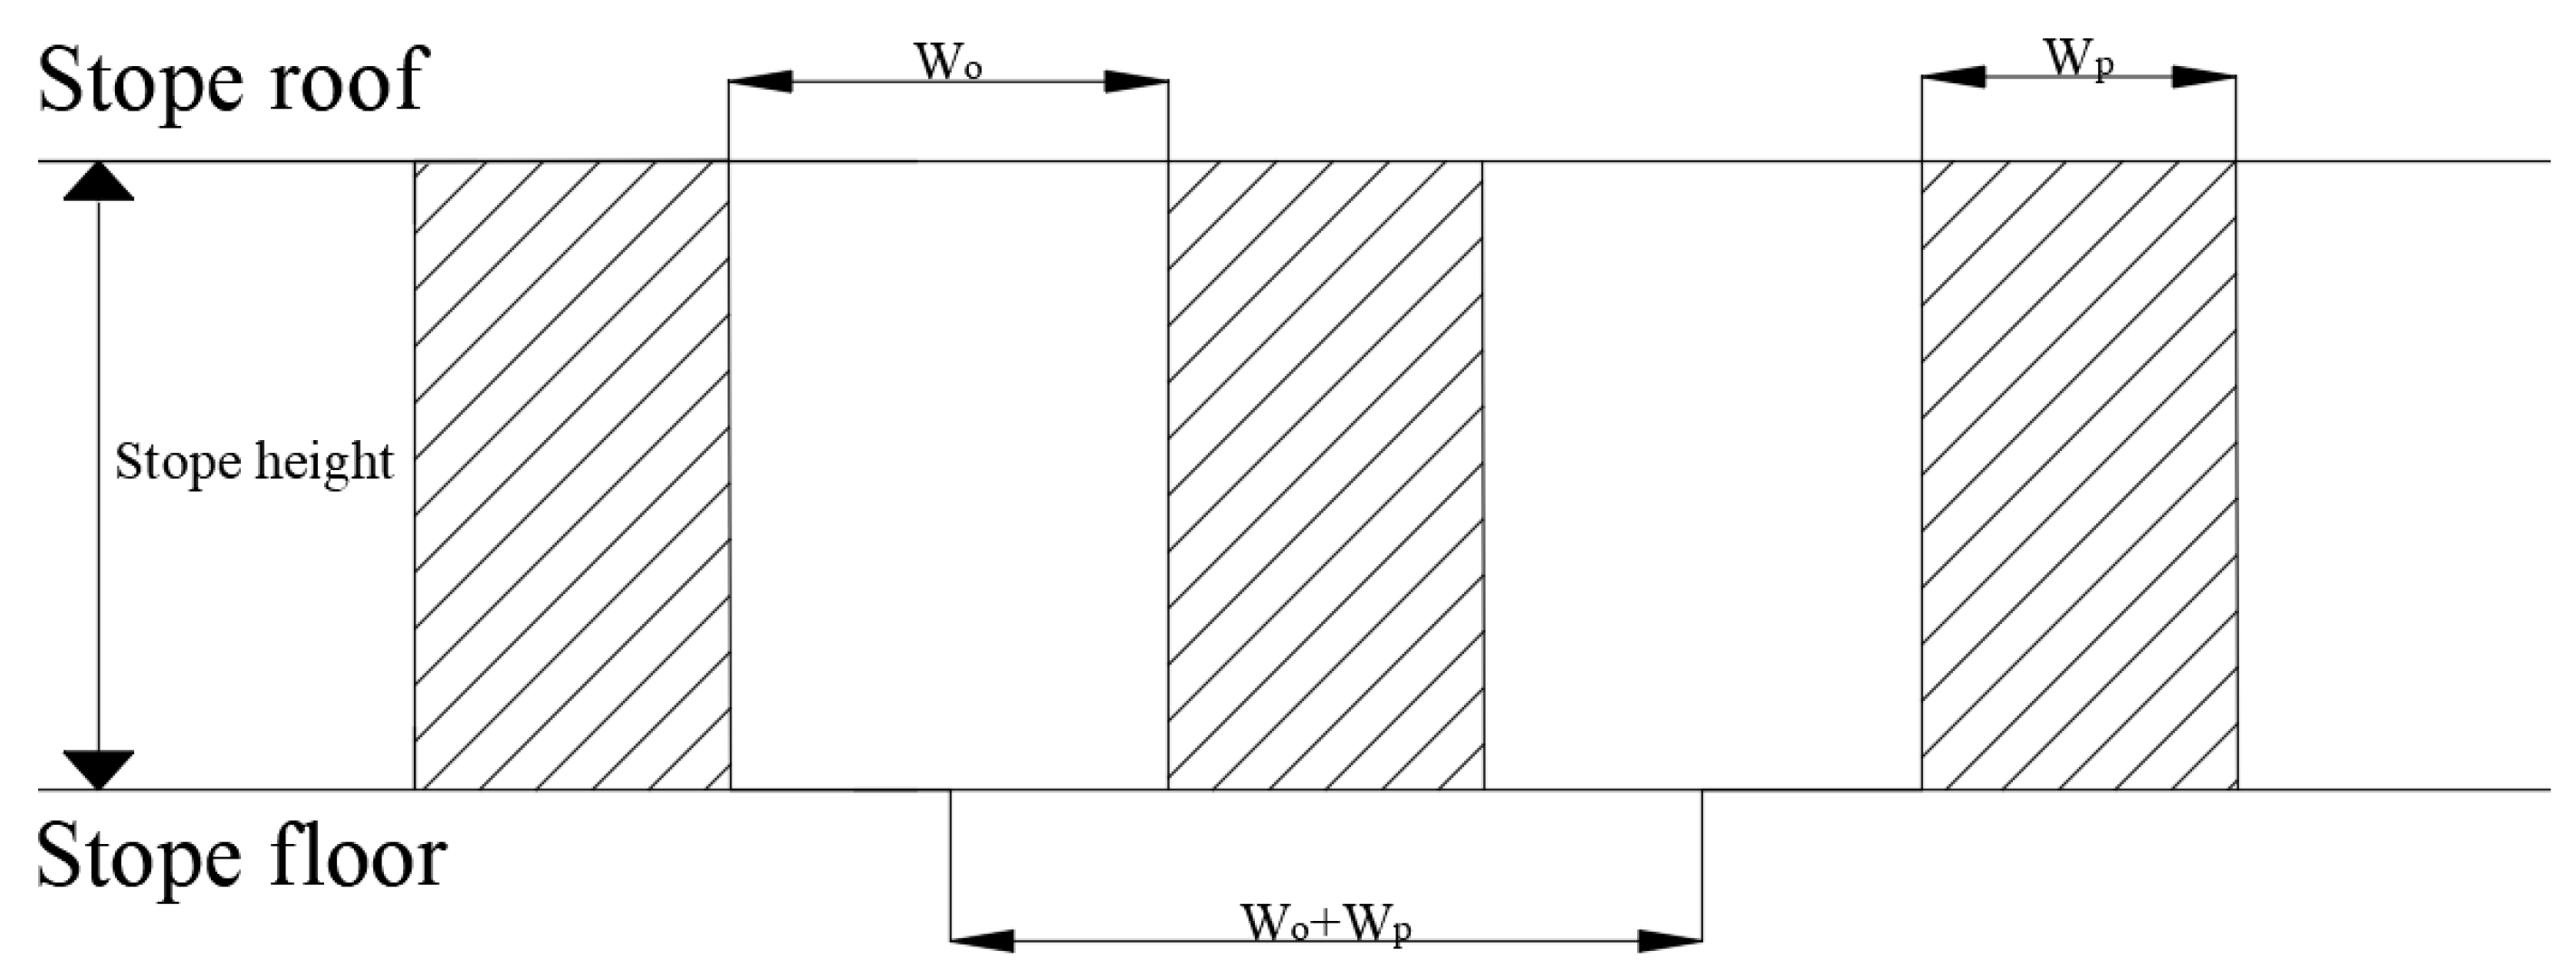
2. Area Bearing Theory
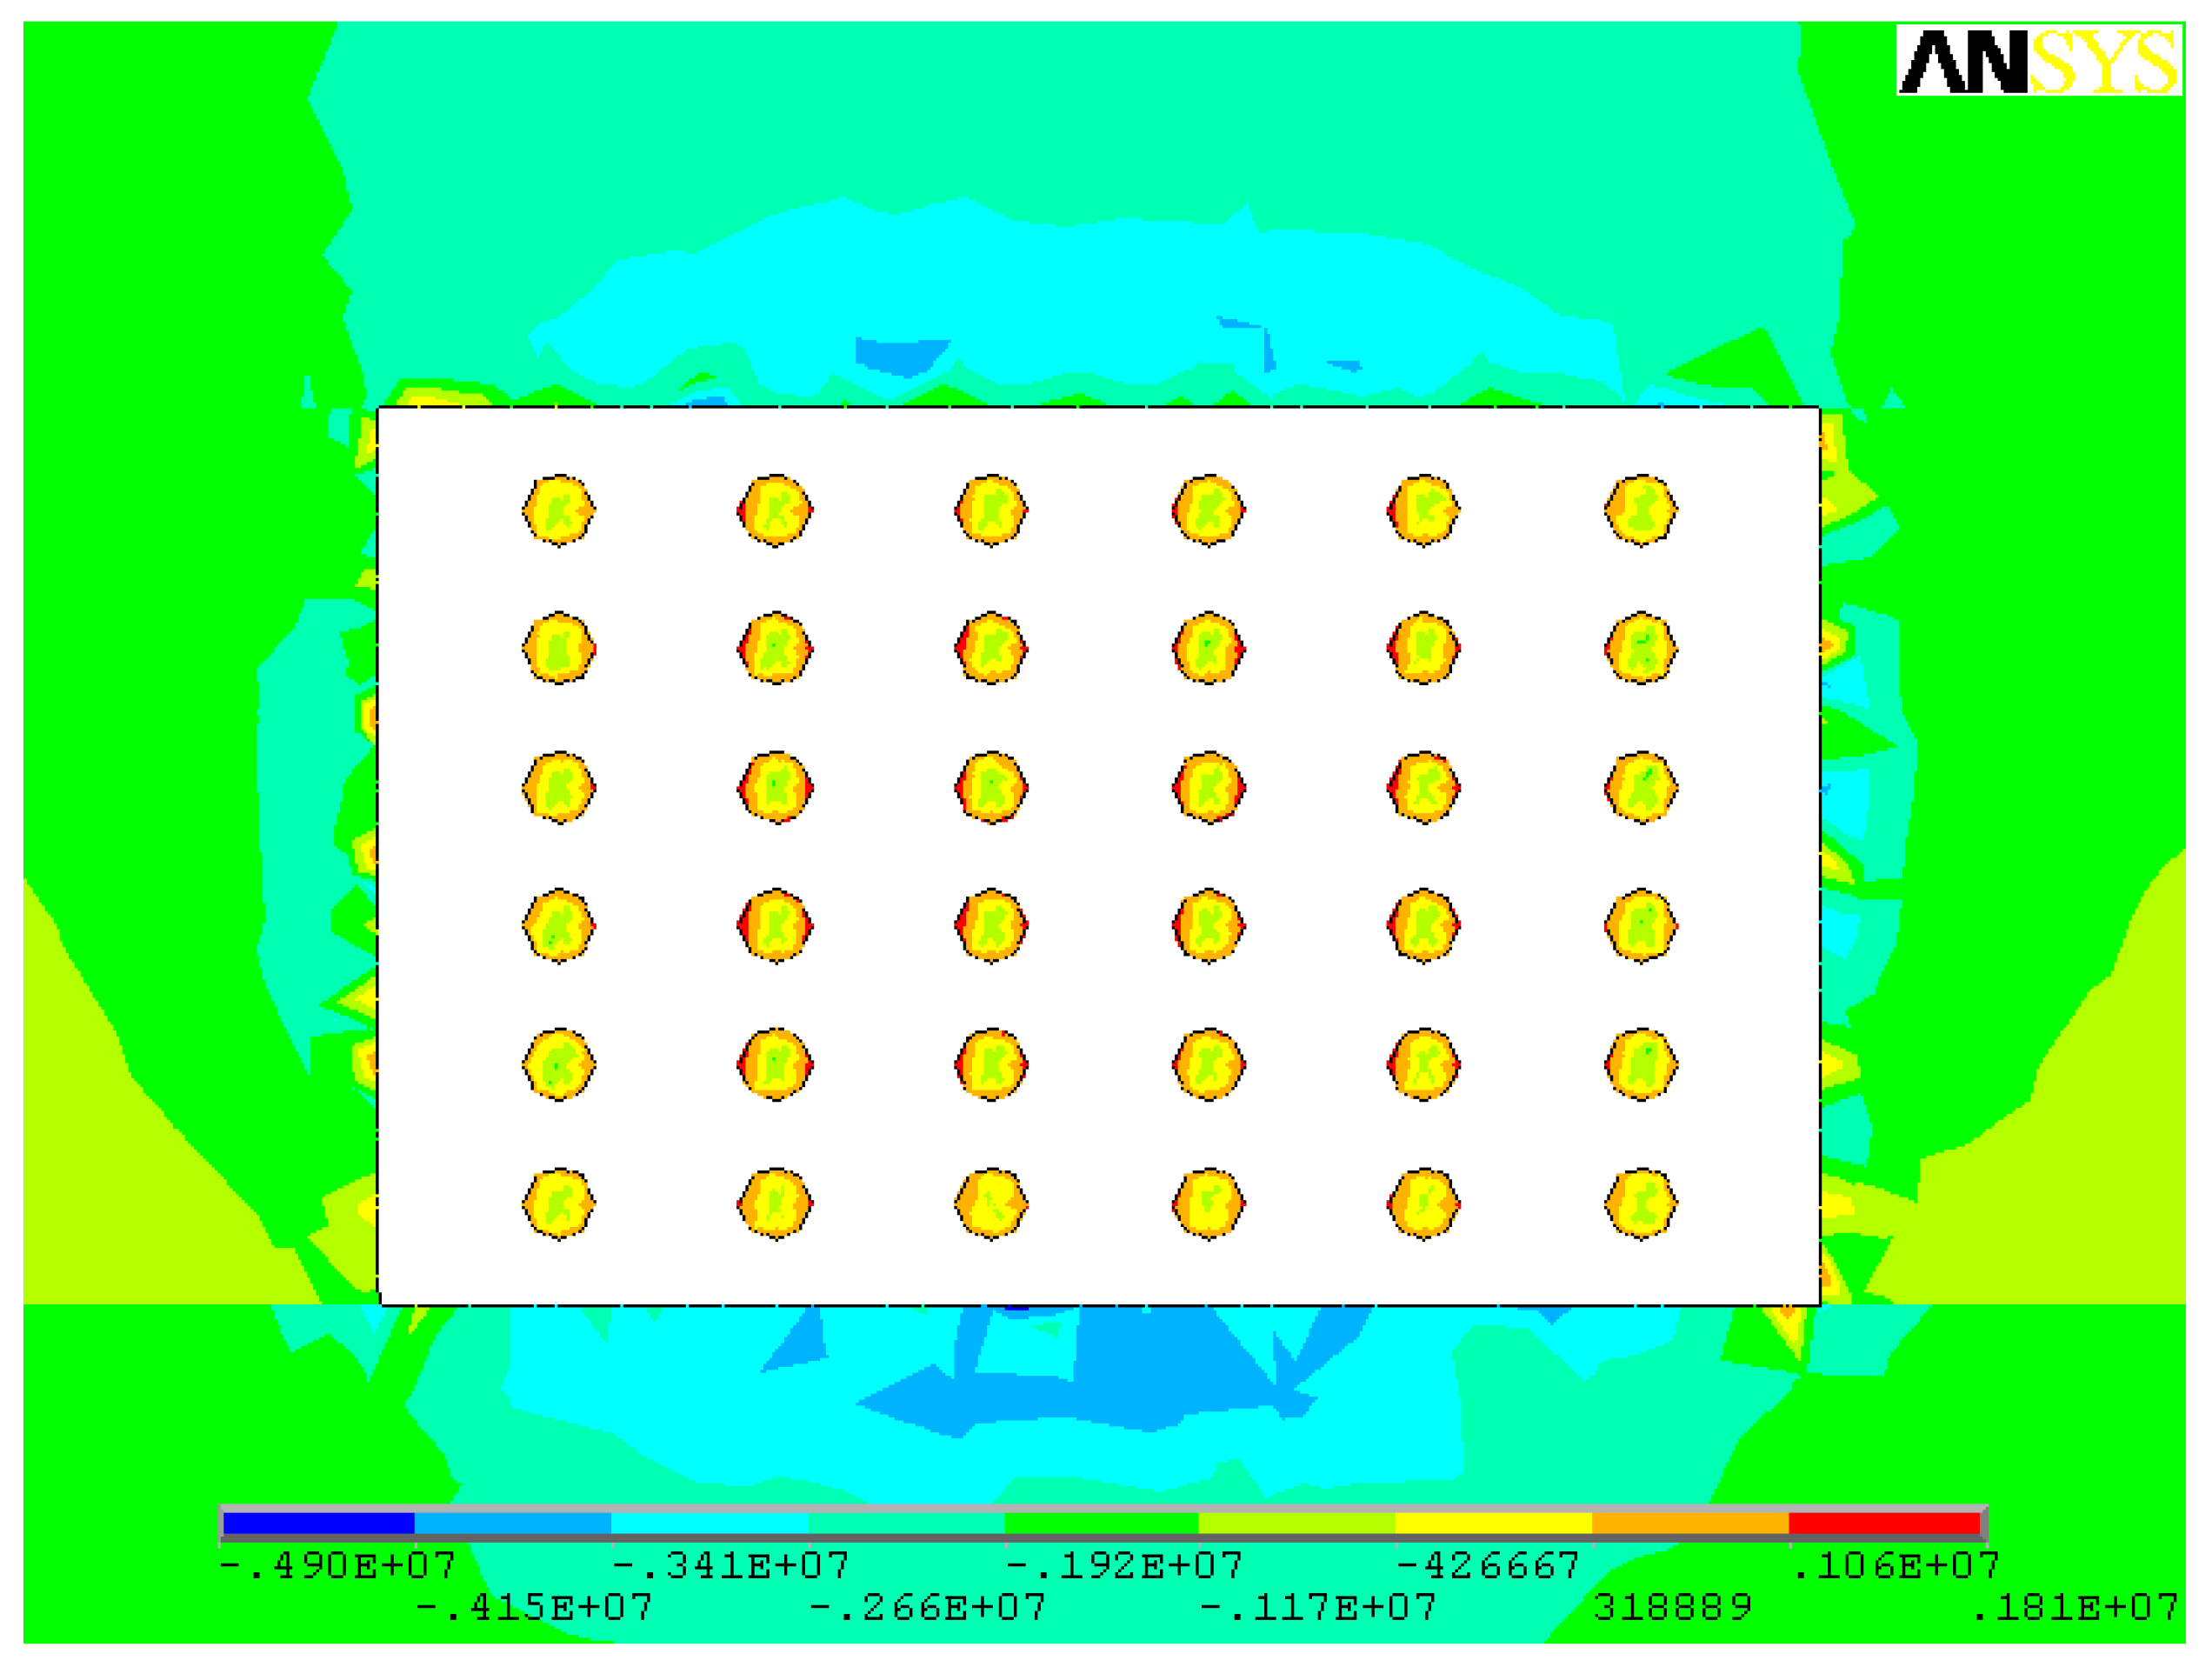
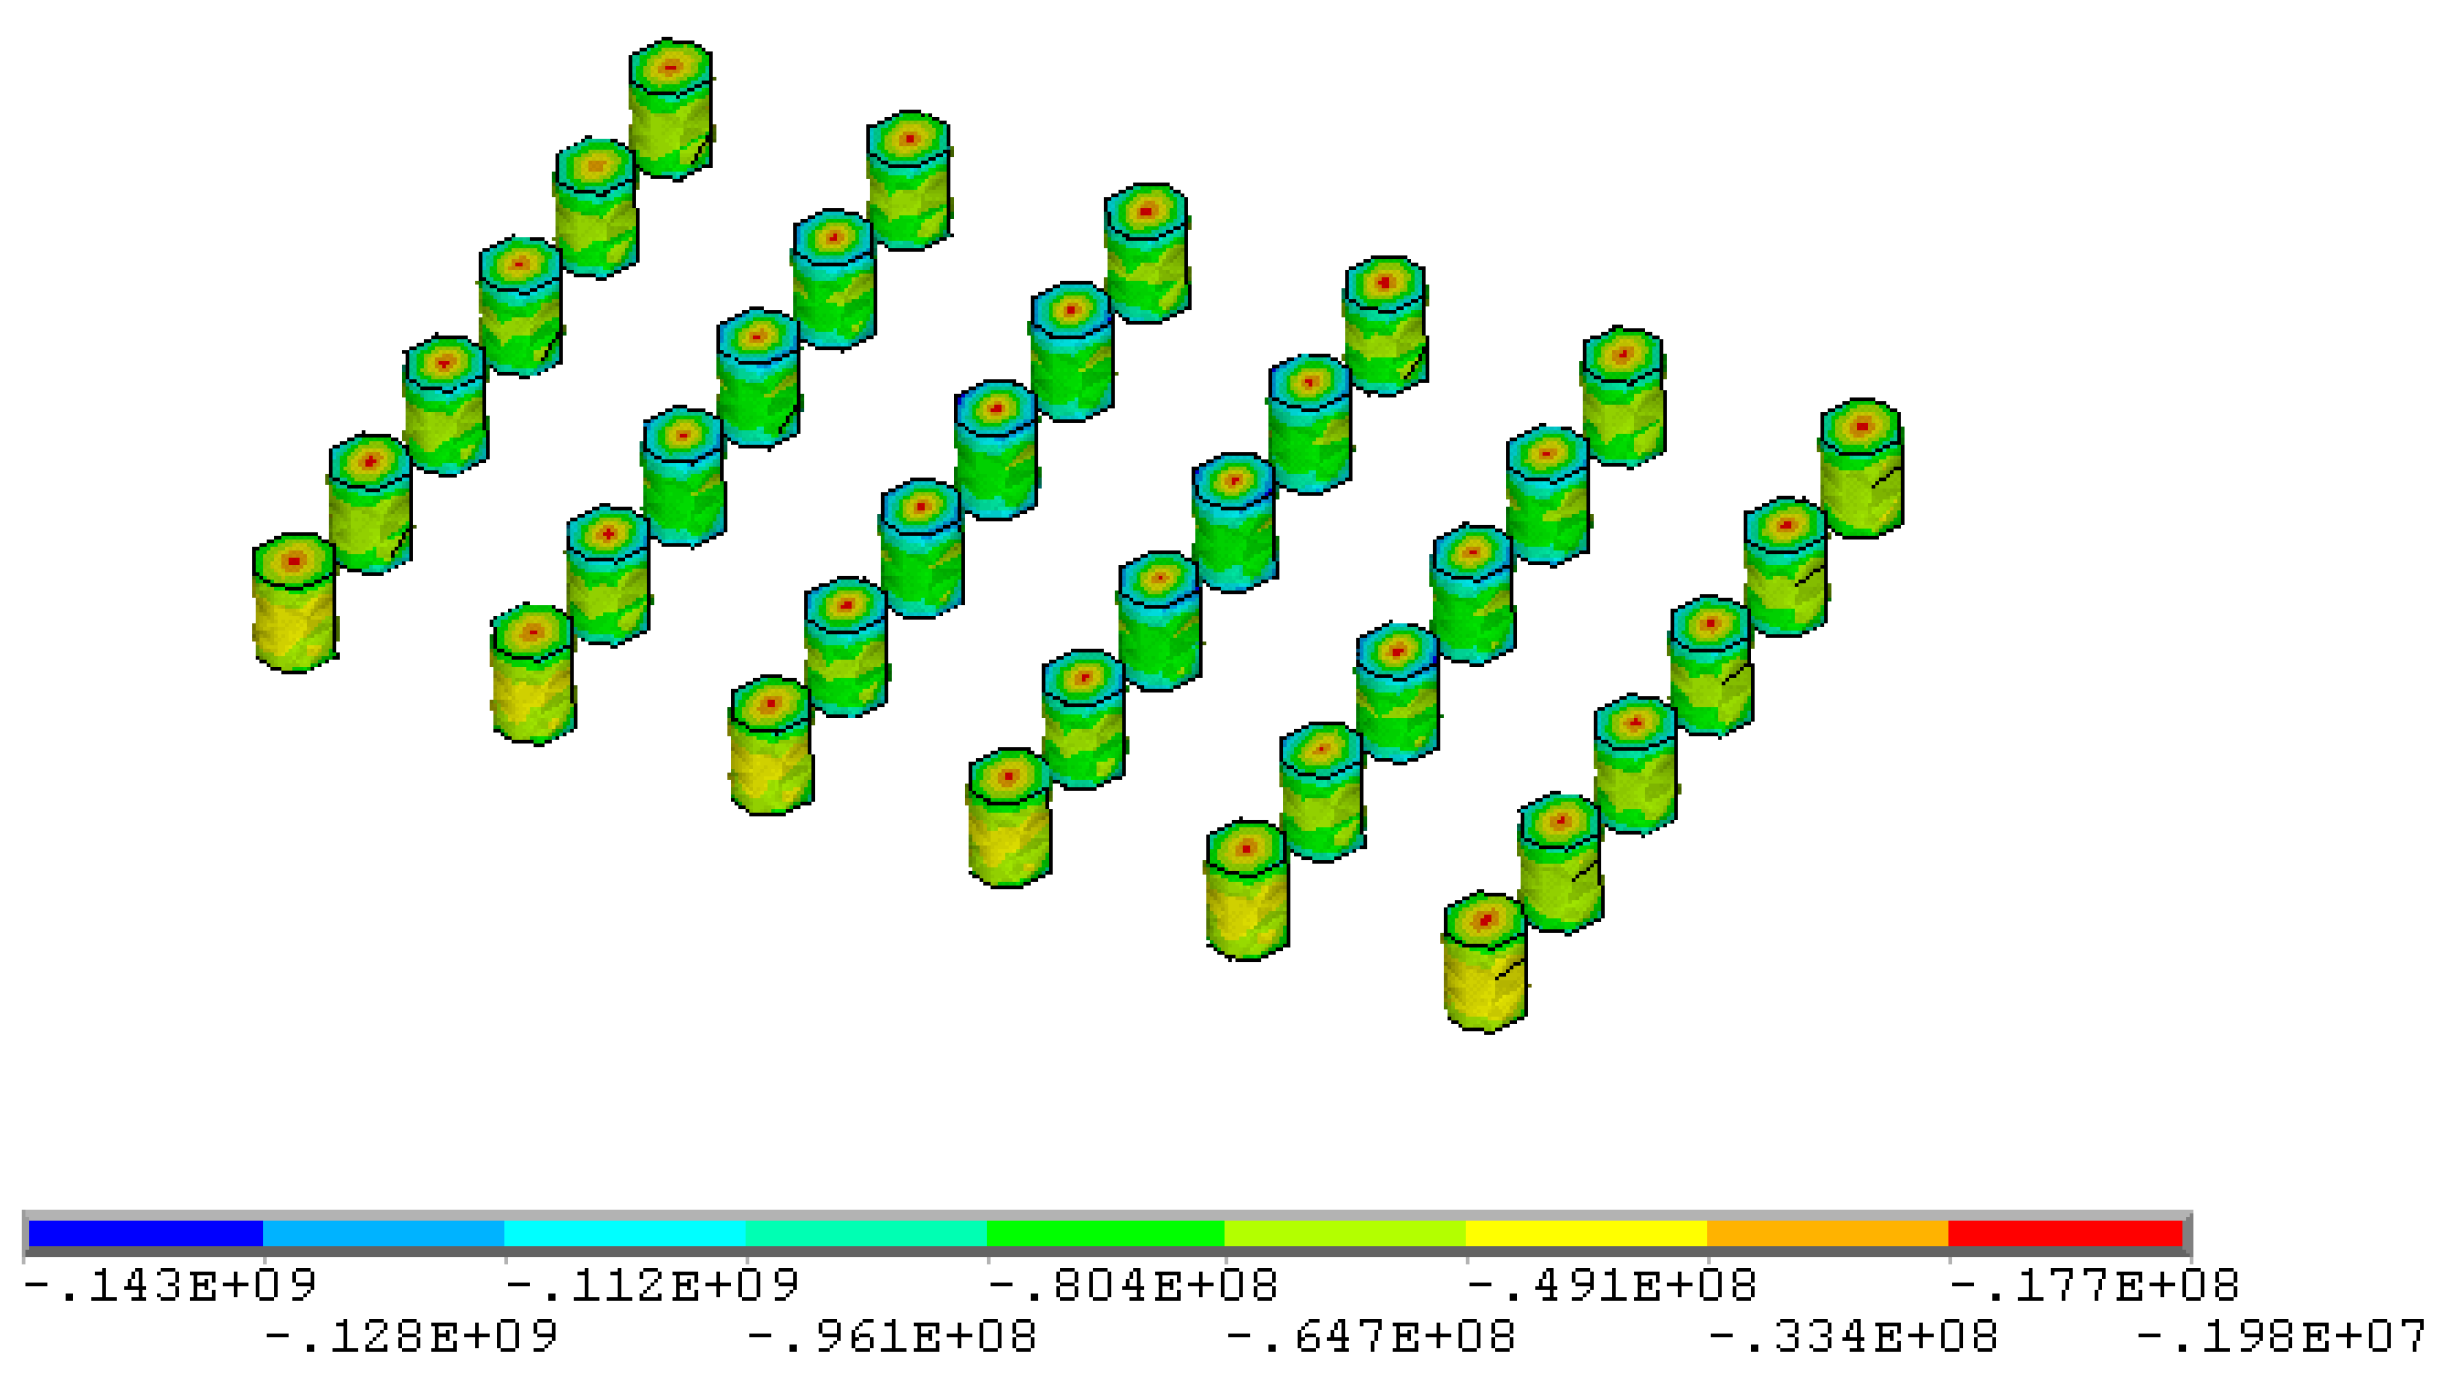
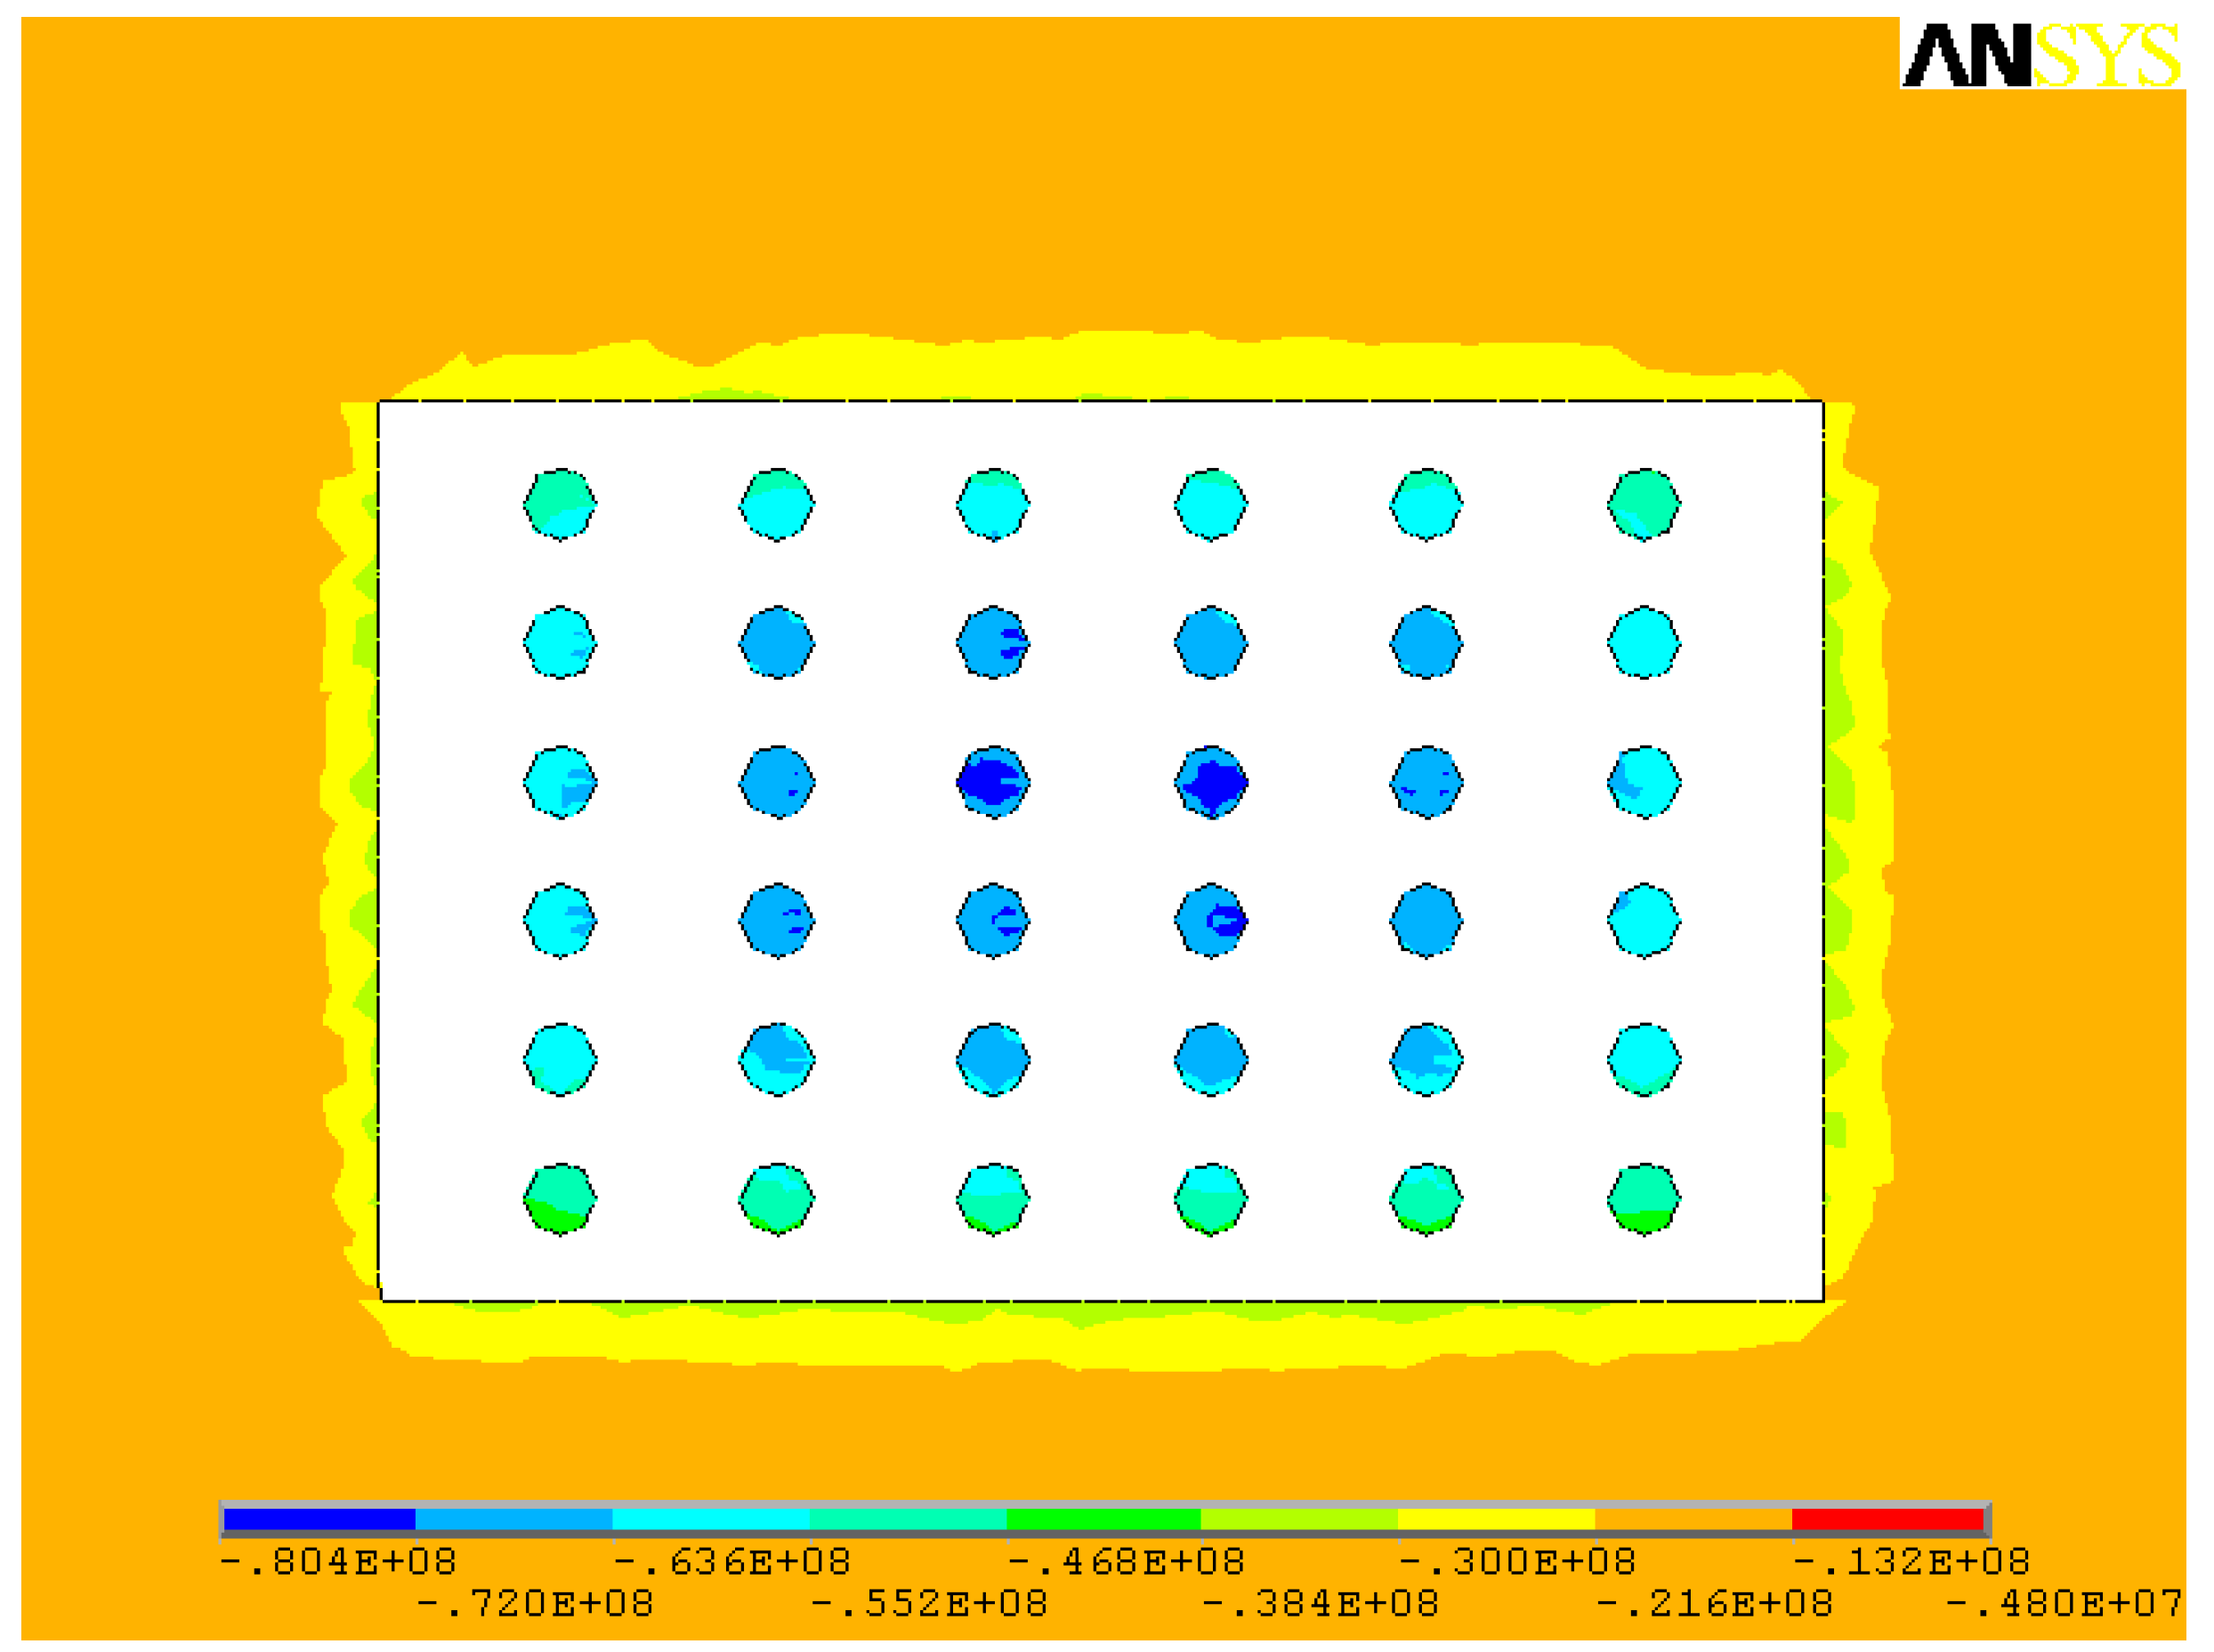
3. Stope Stability Evaluation
3.1. Simulation Conditions and Process
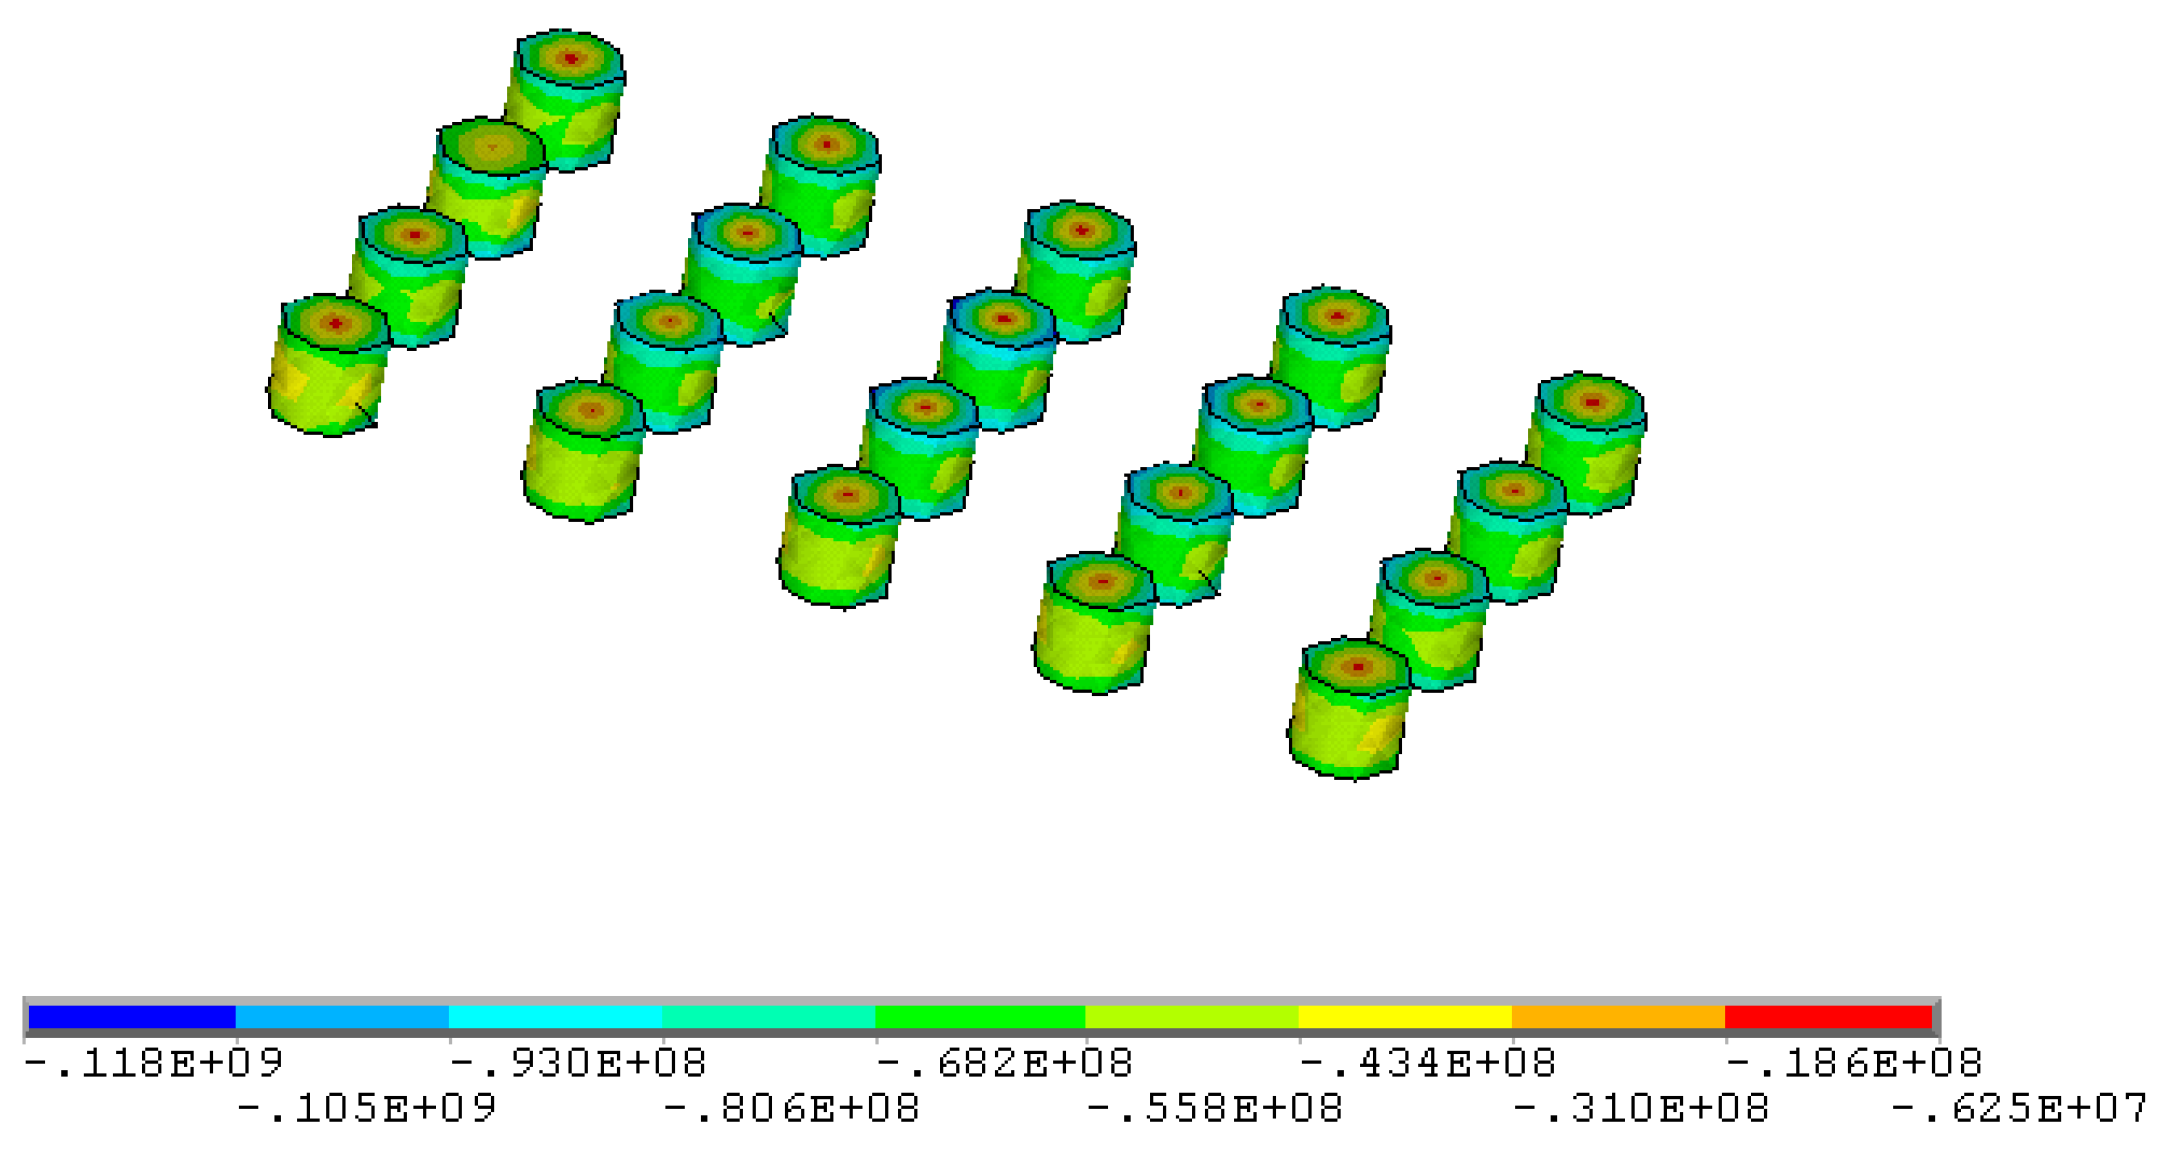
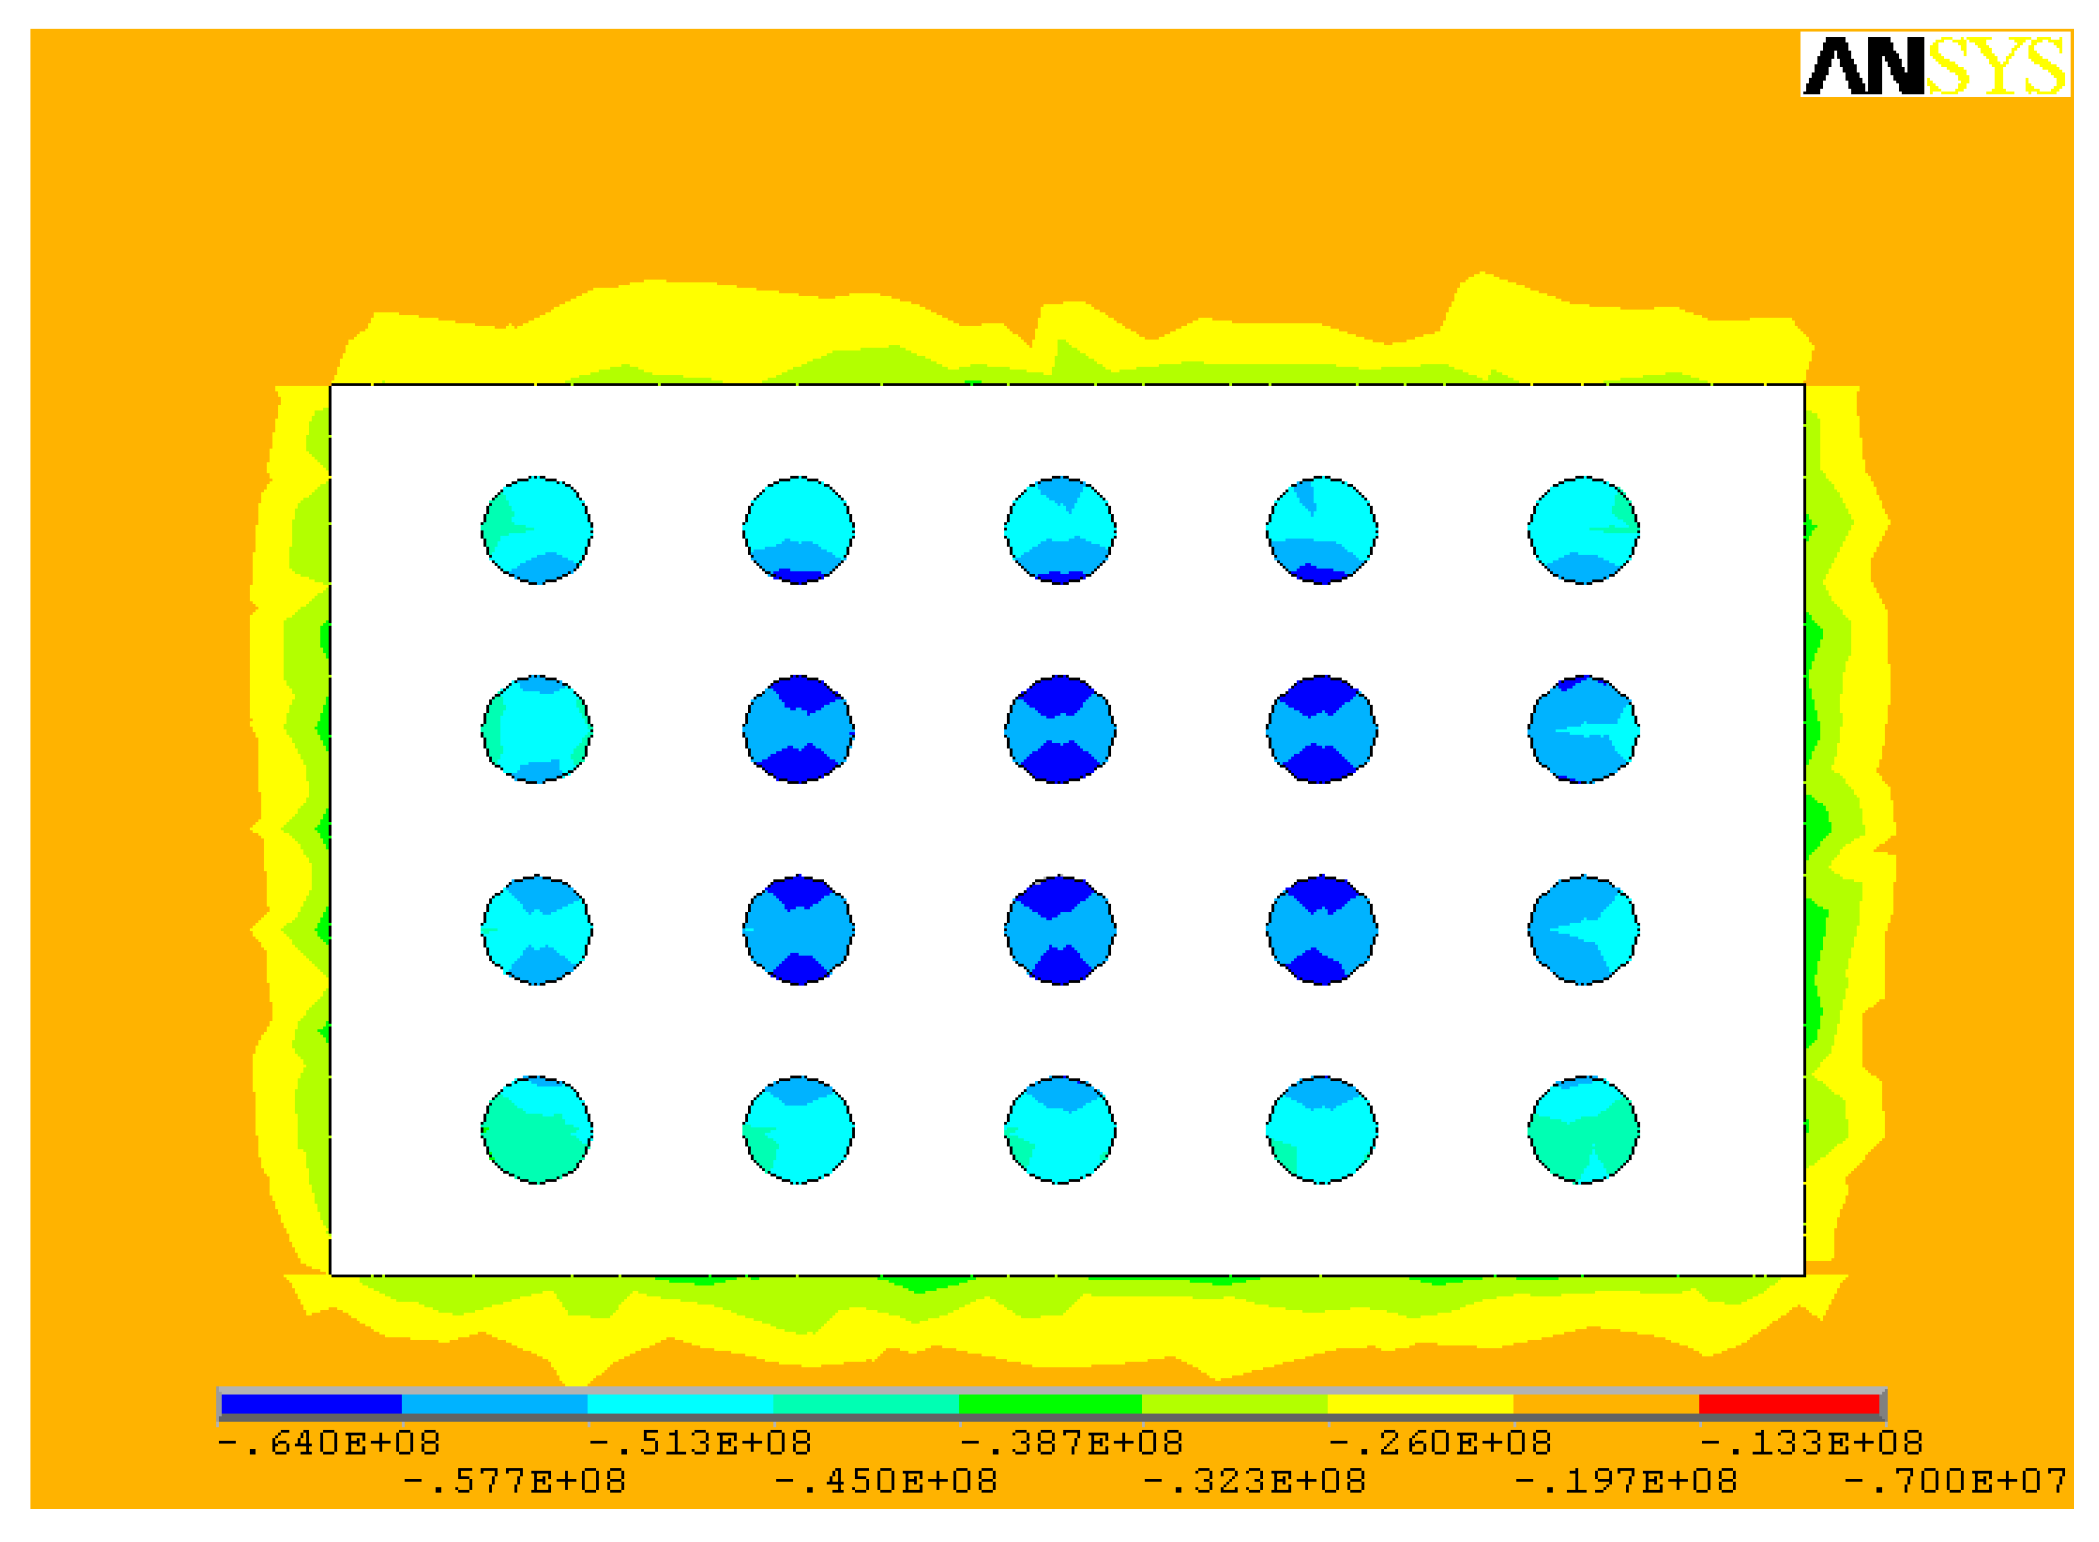
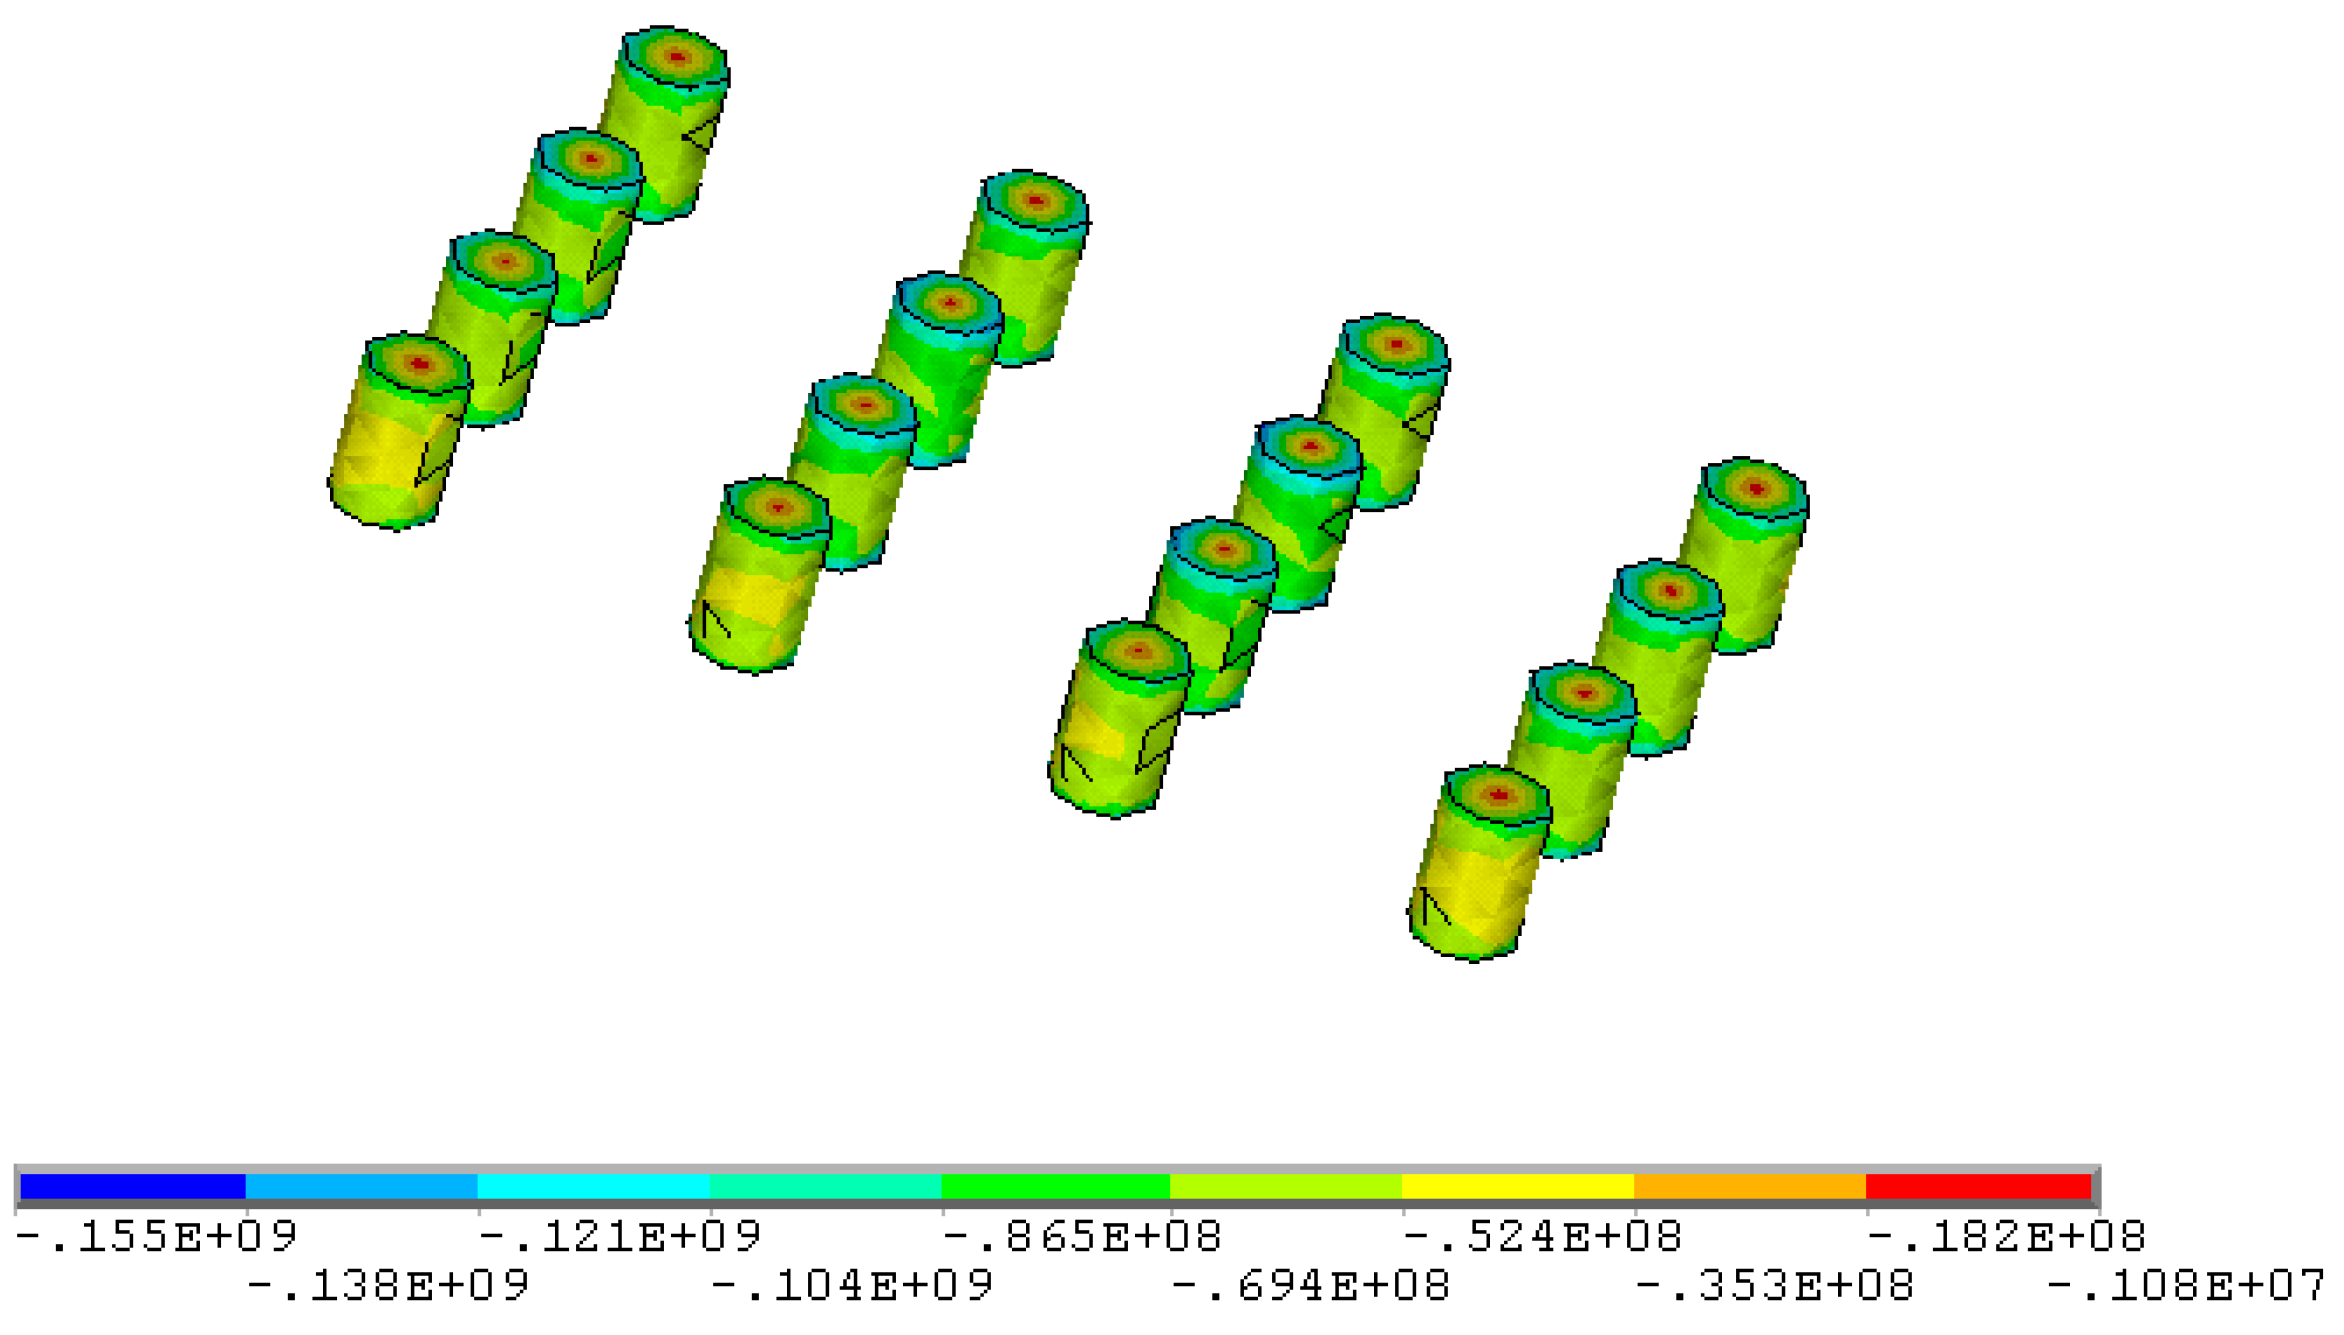
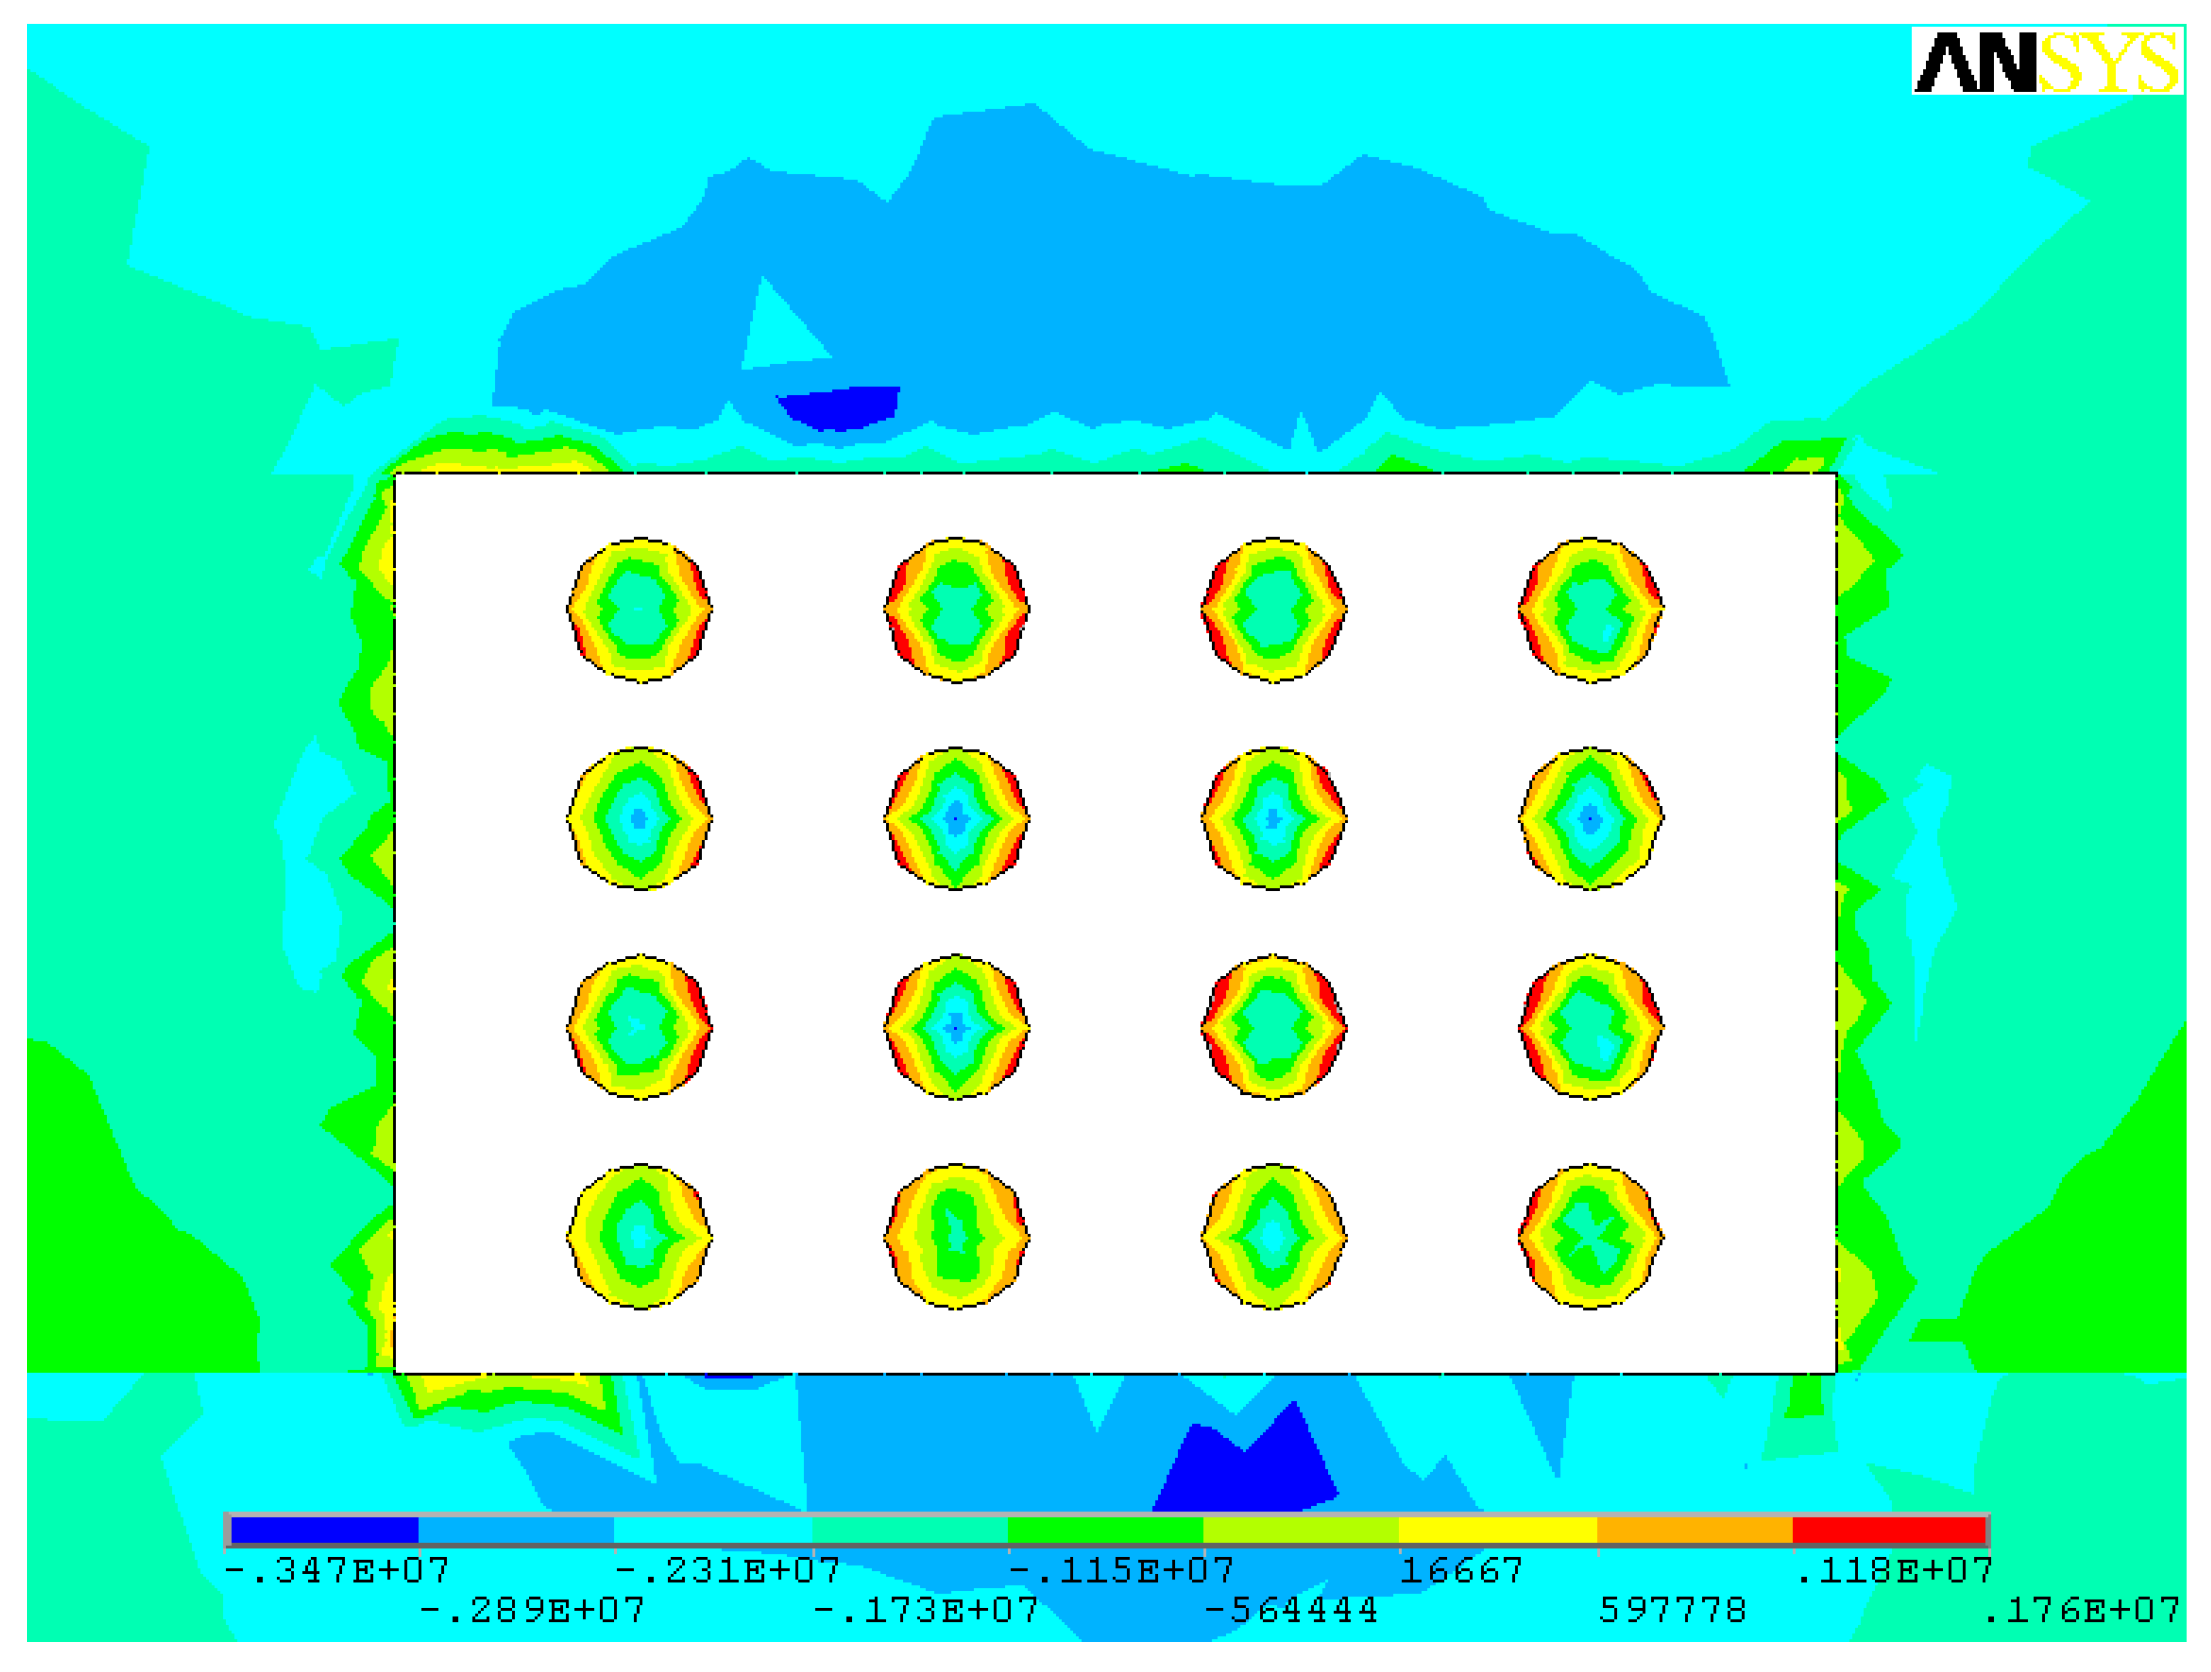
3.2. Simulation Results
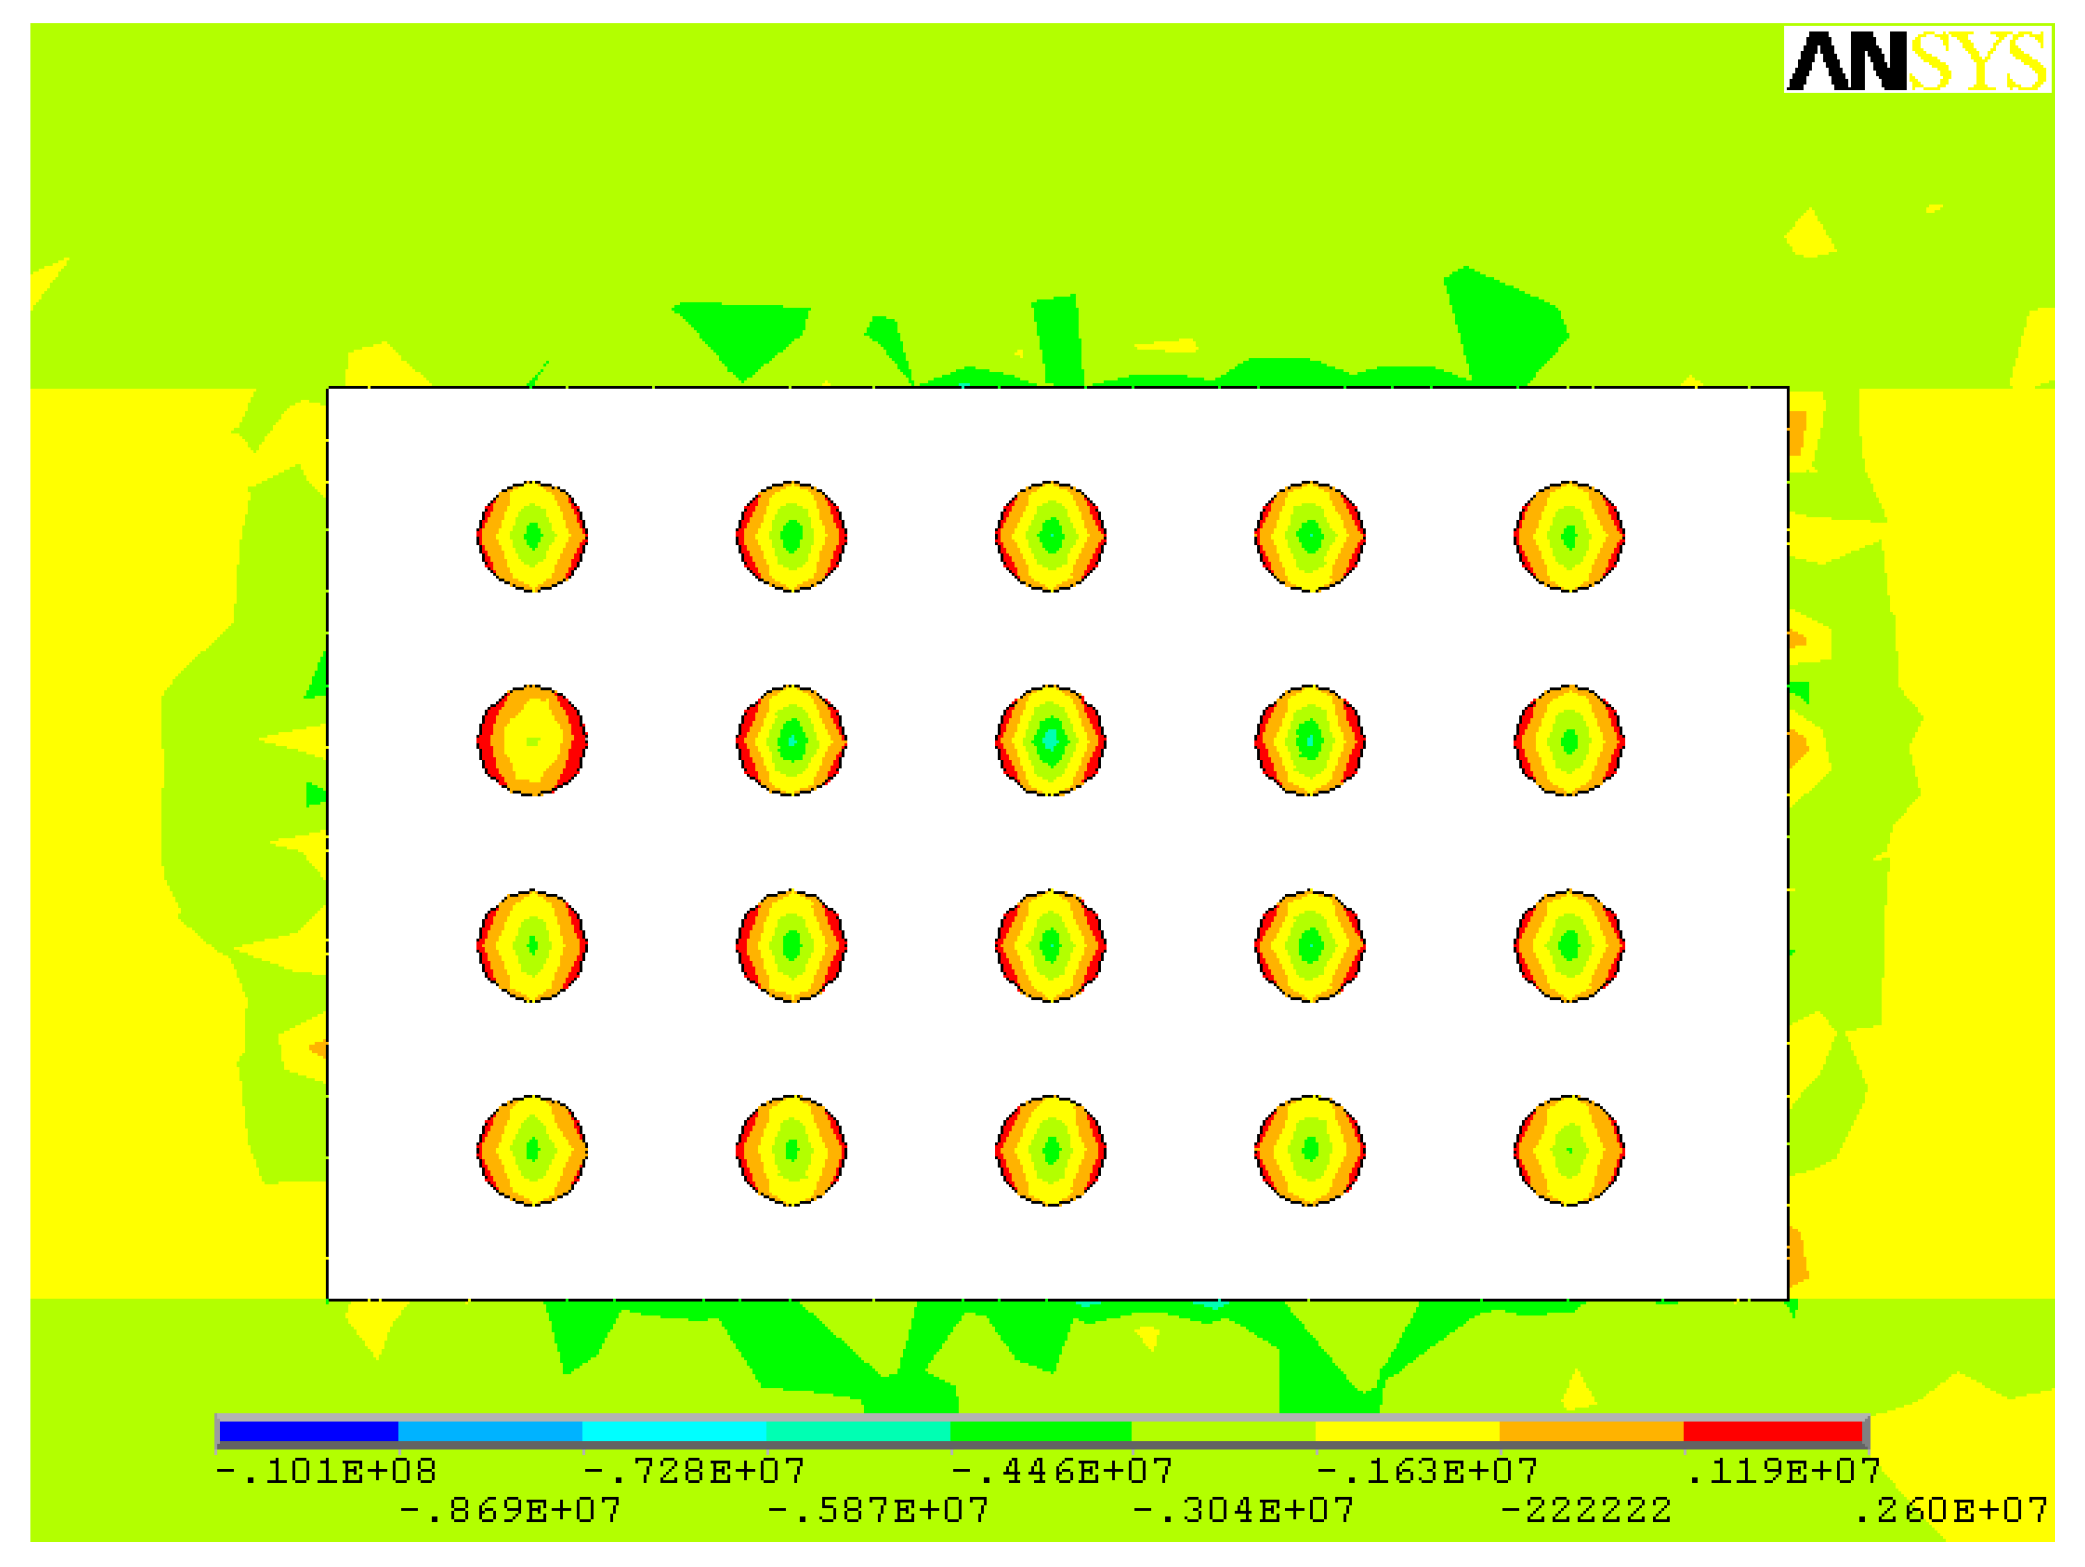
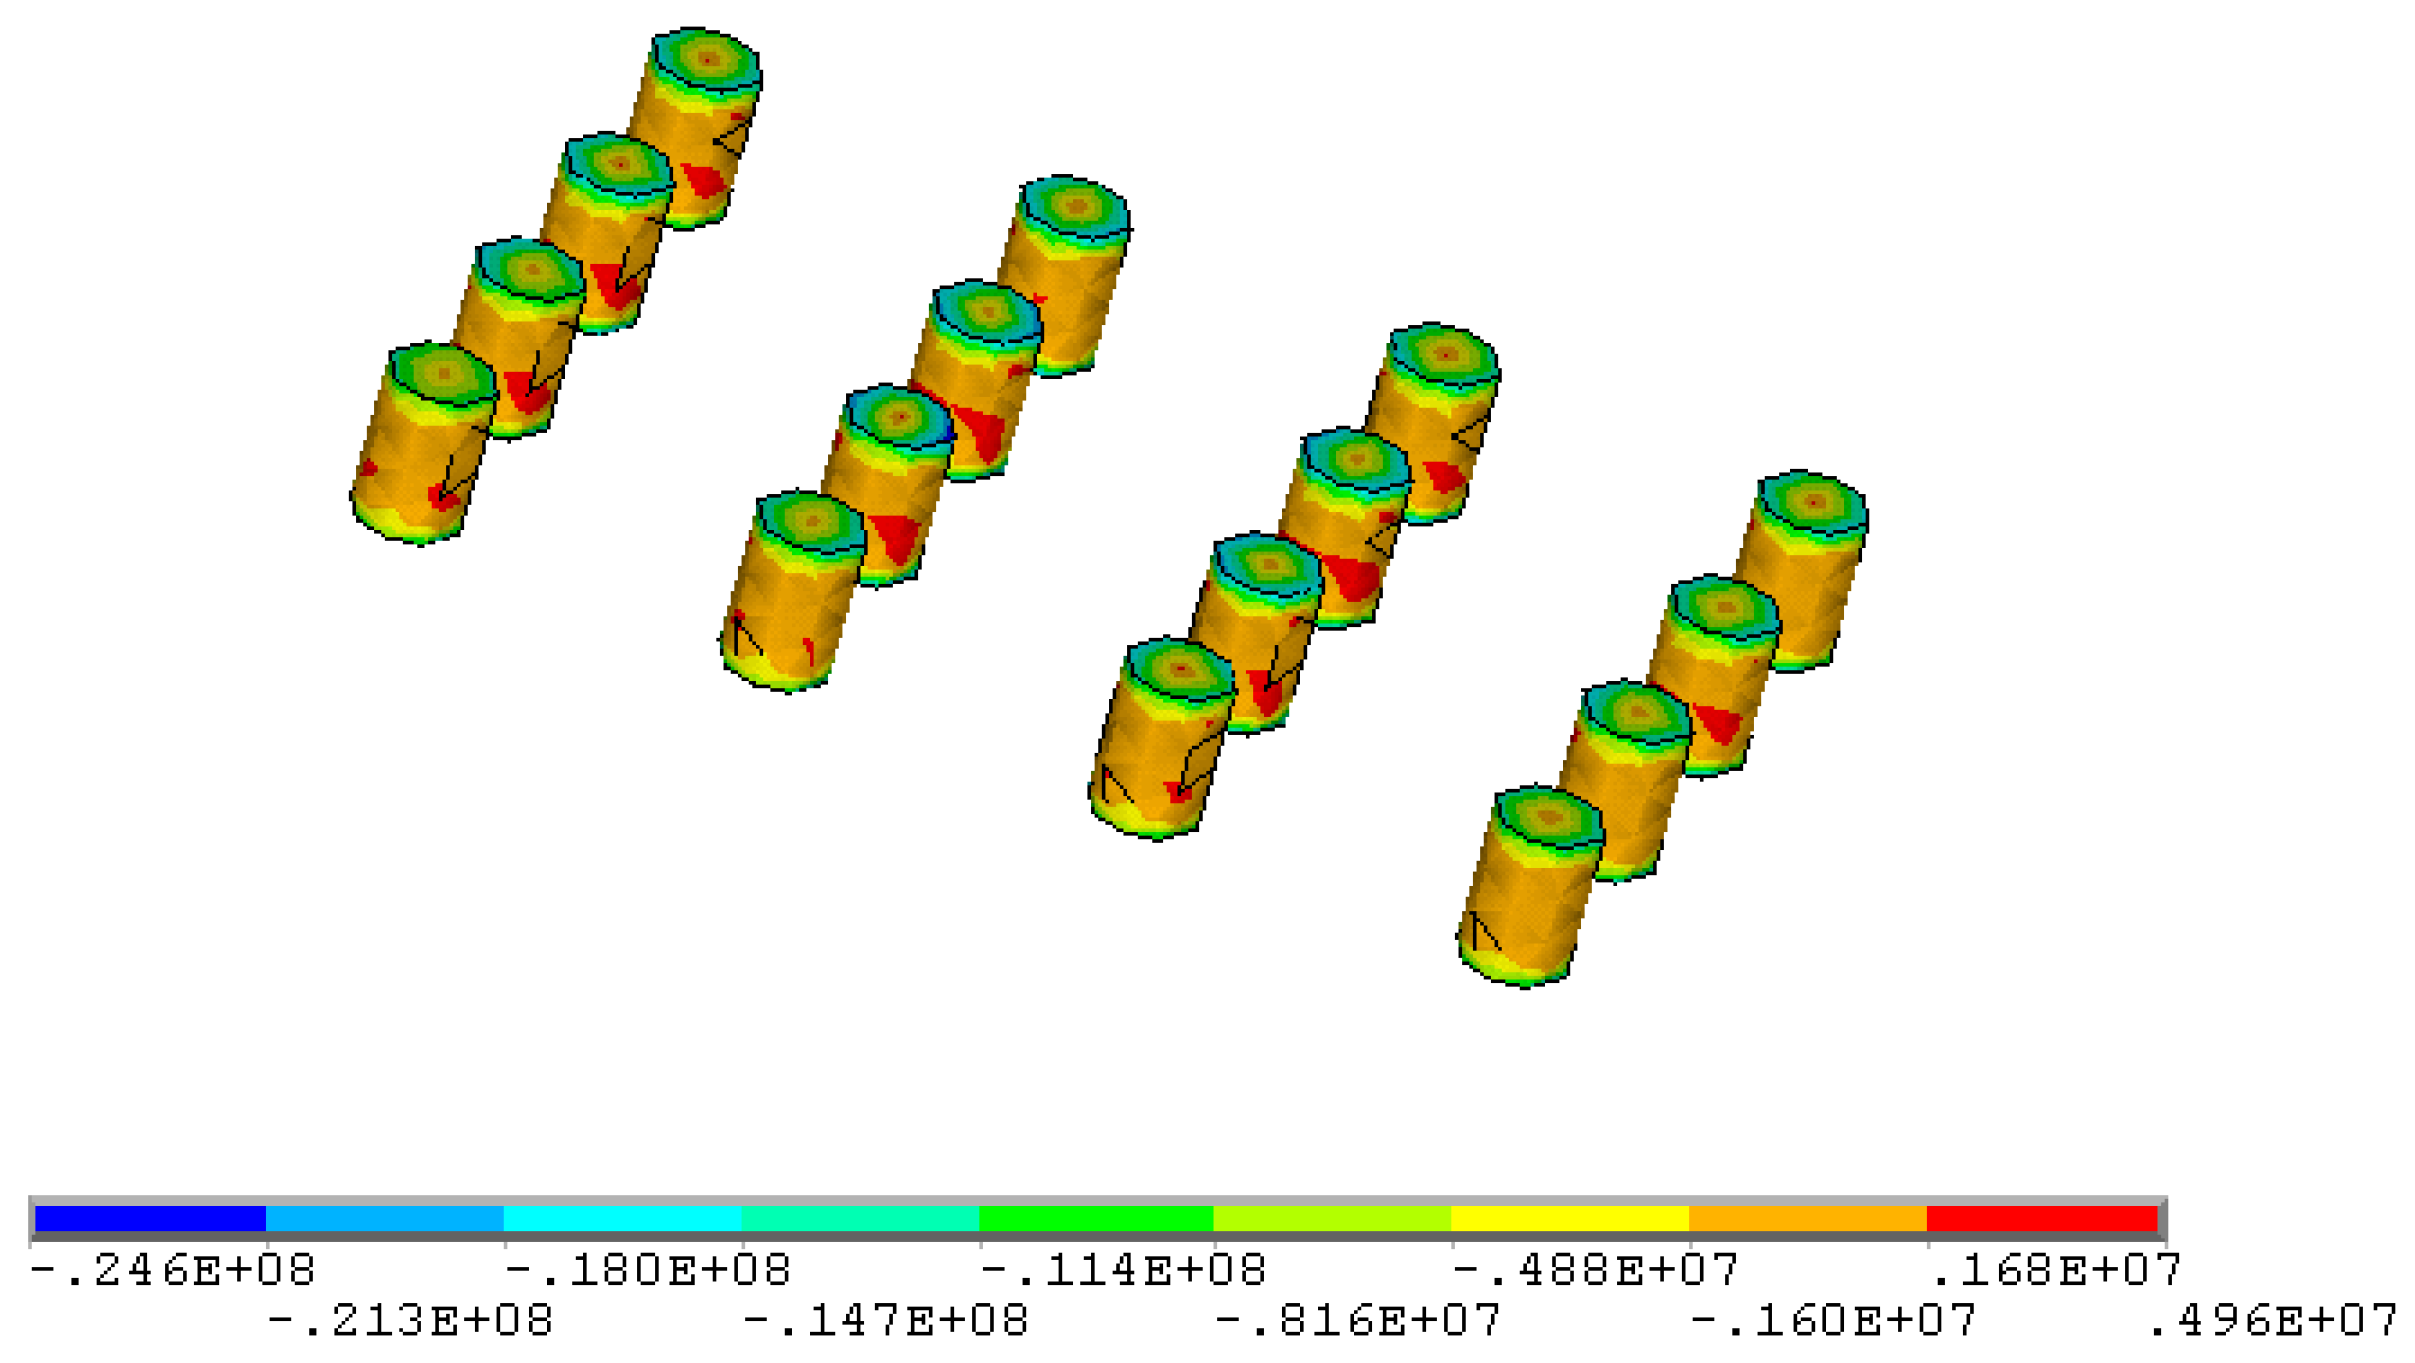
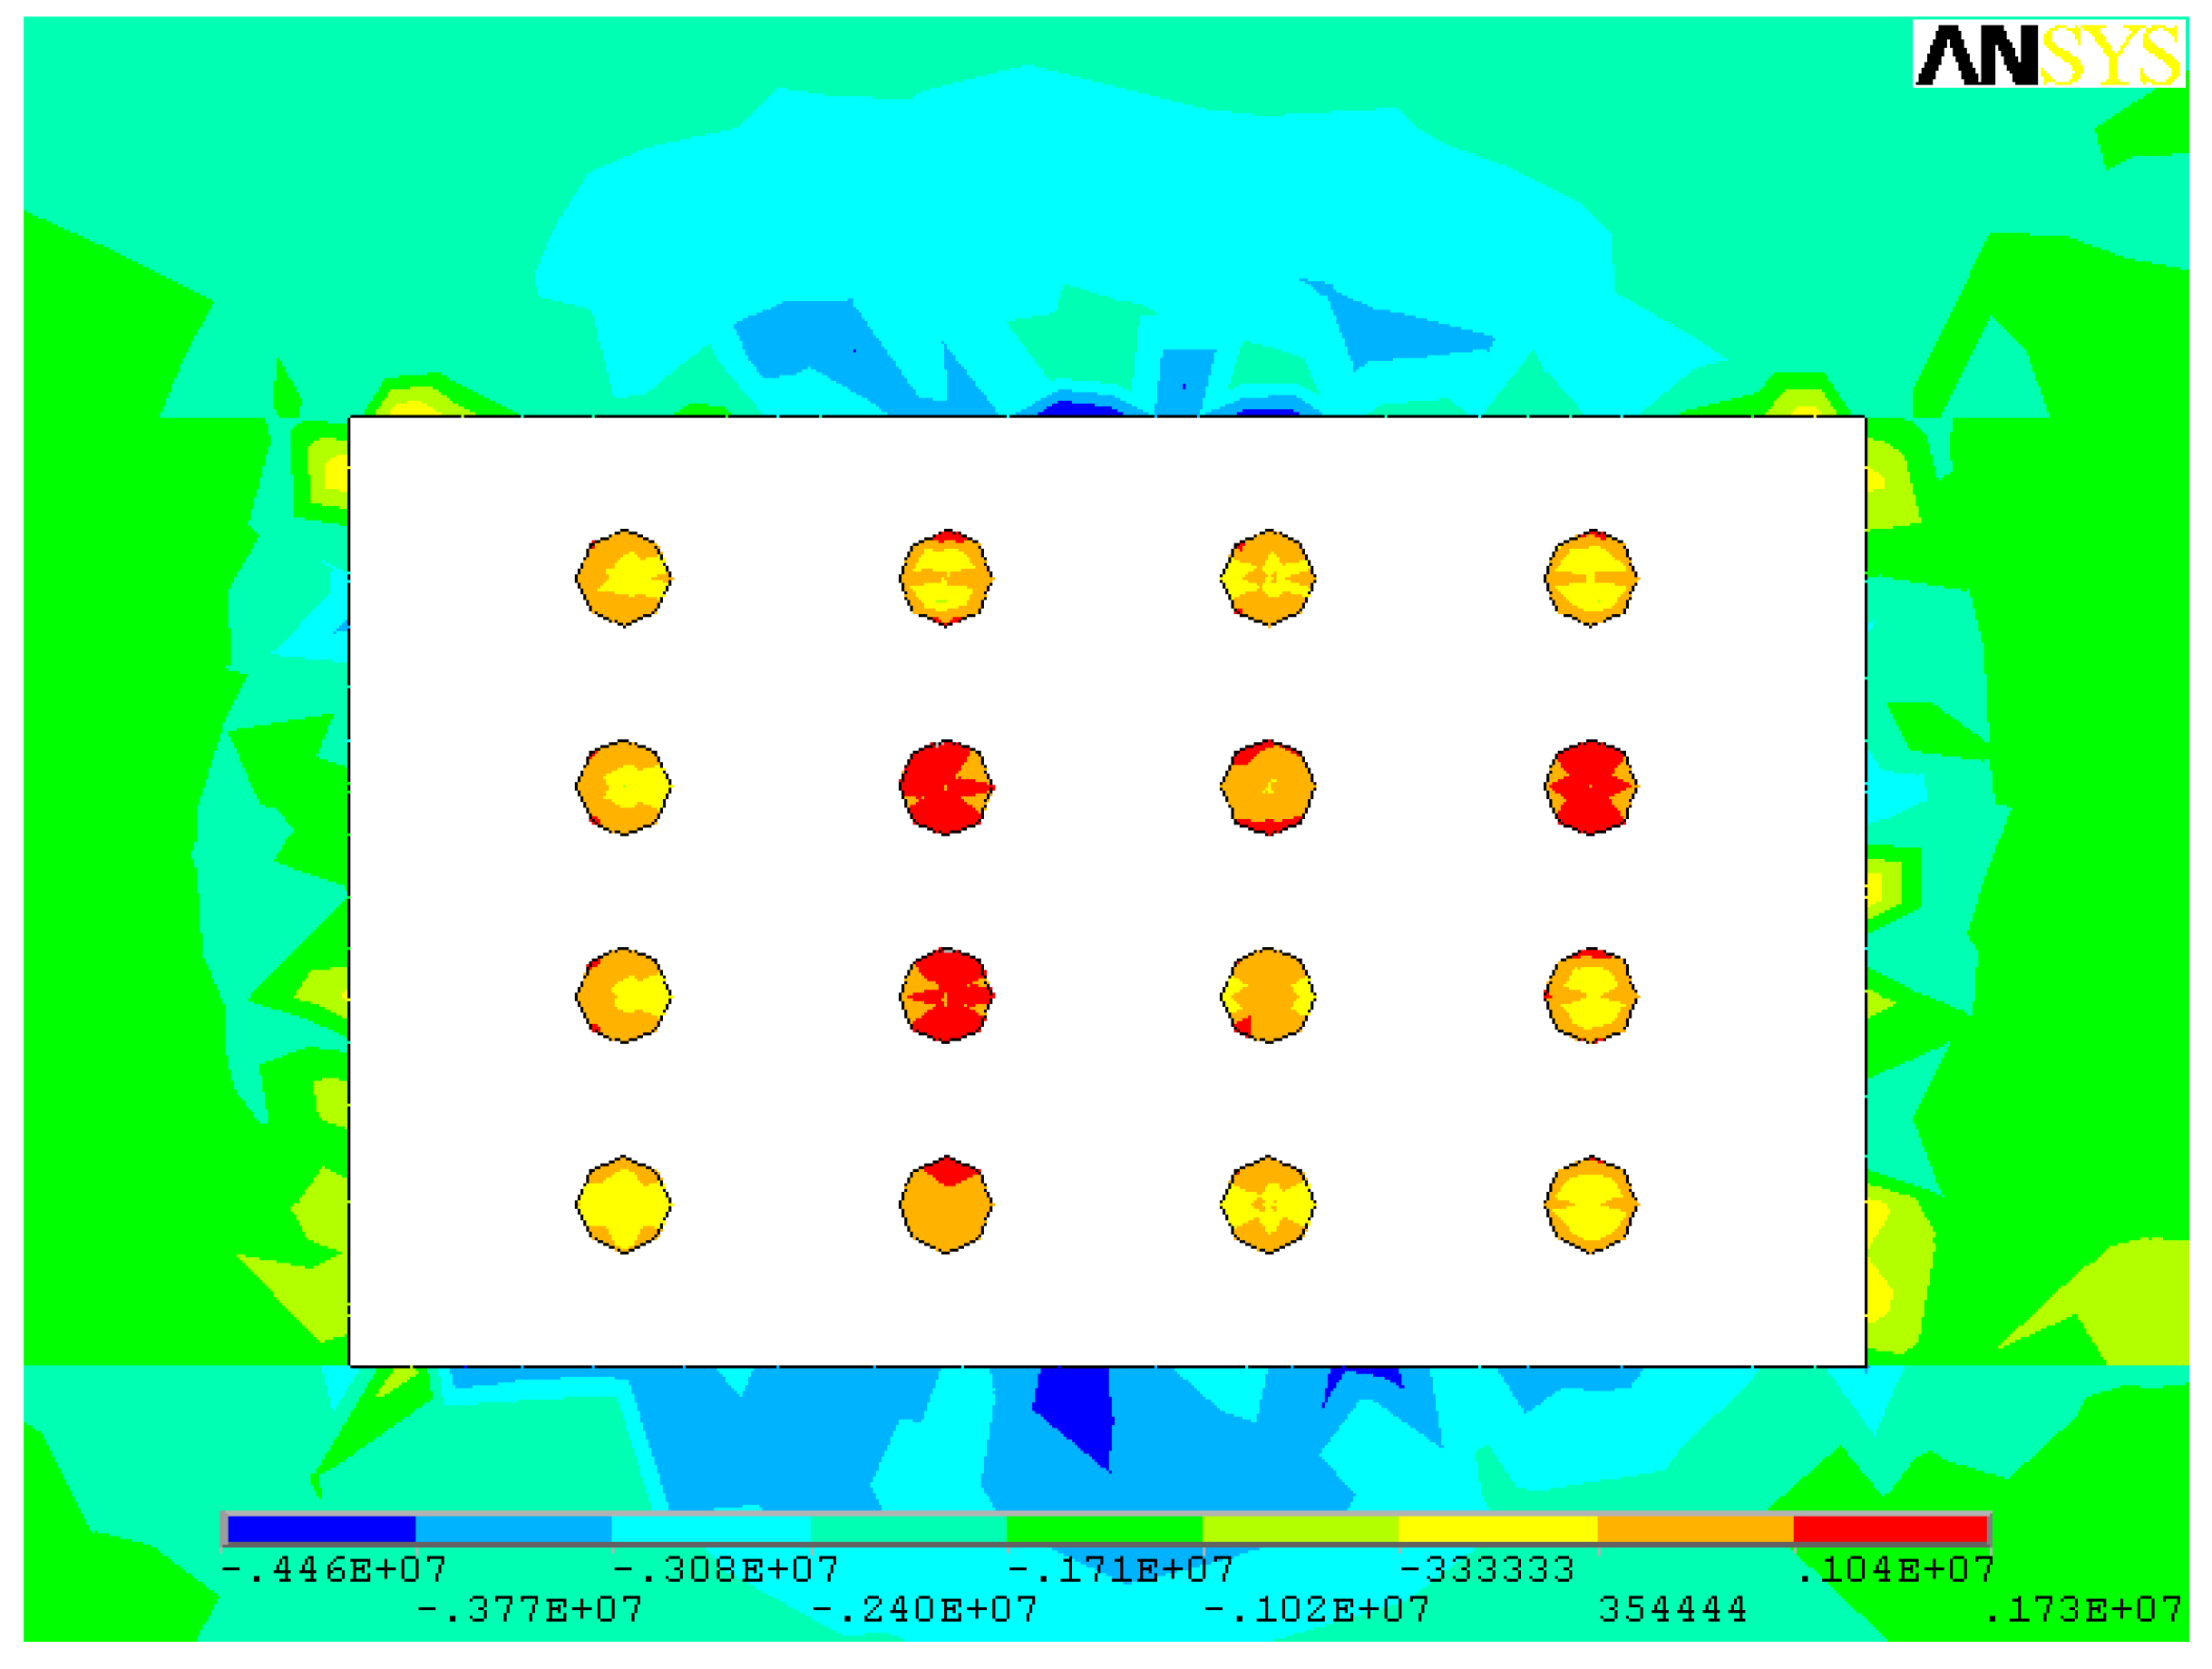
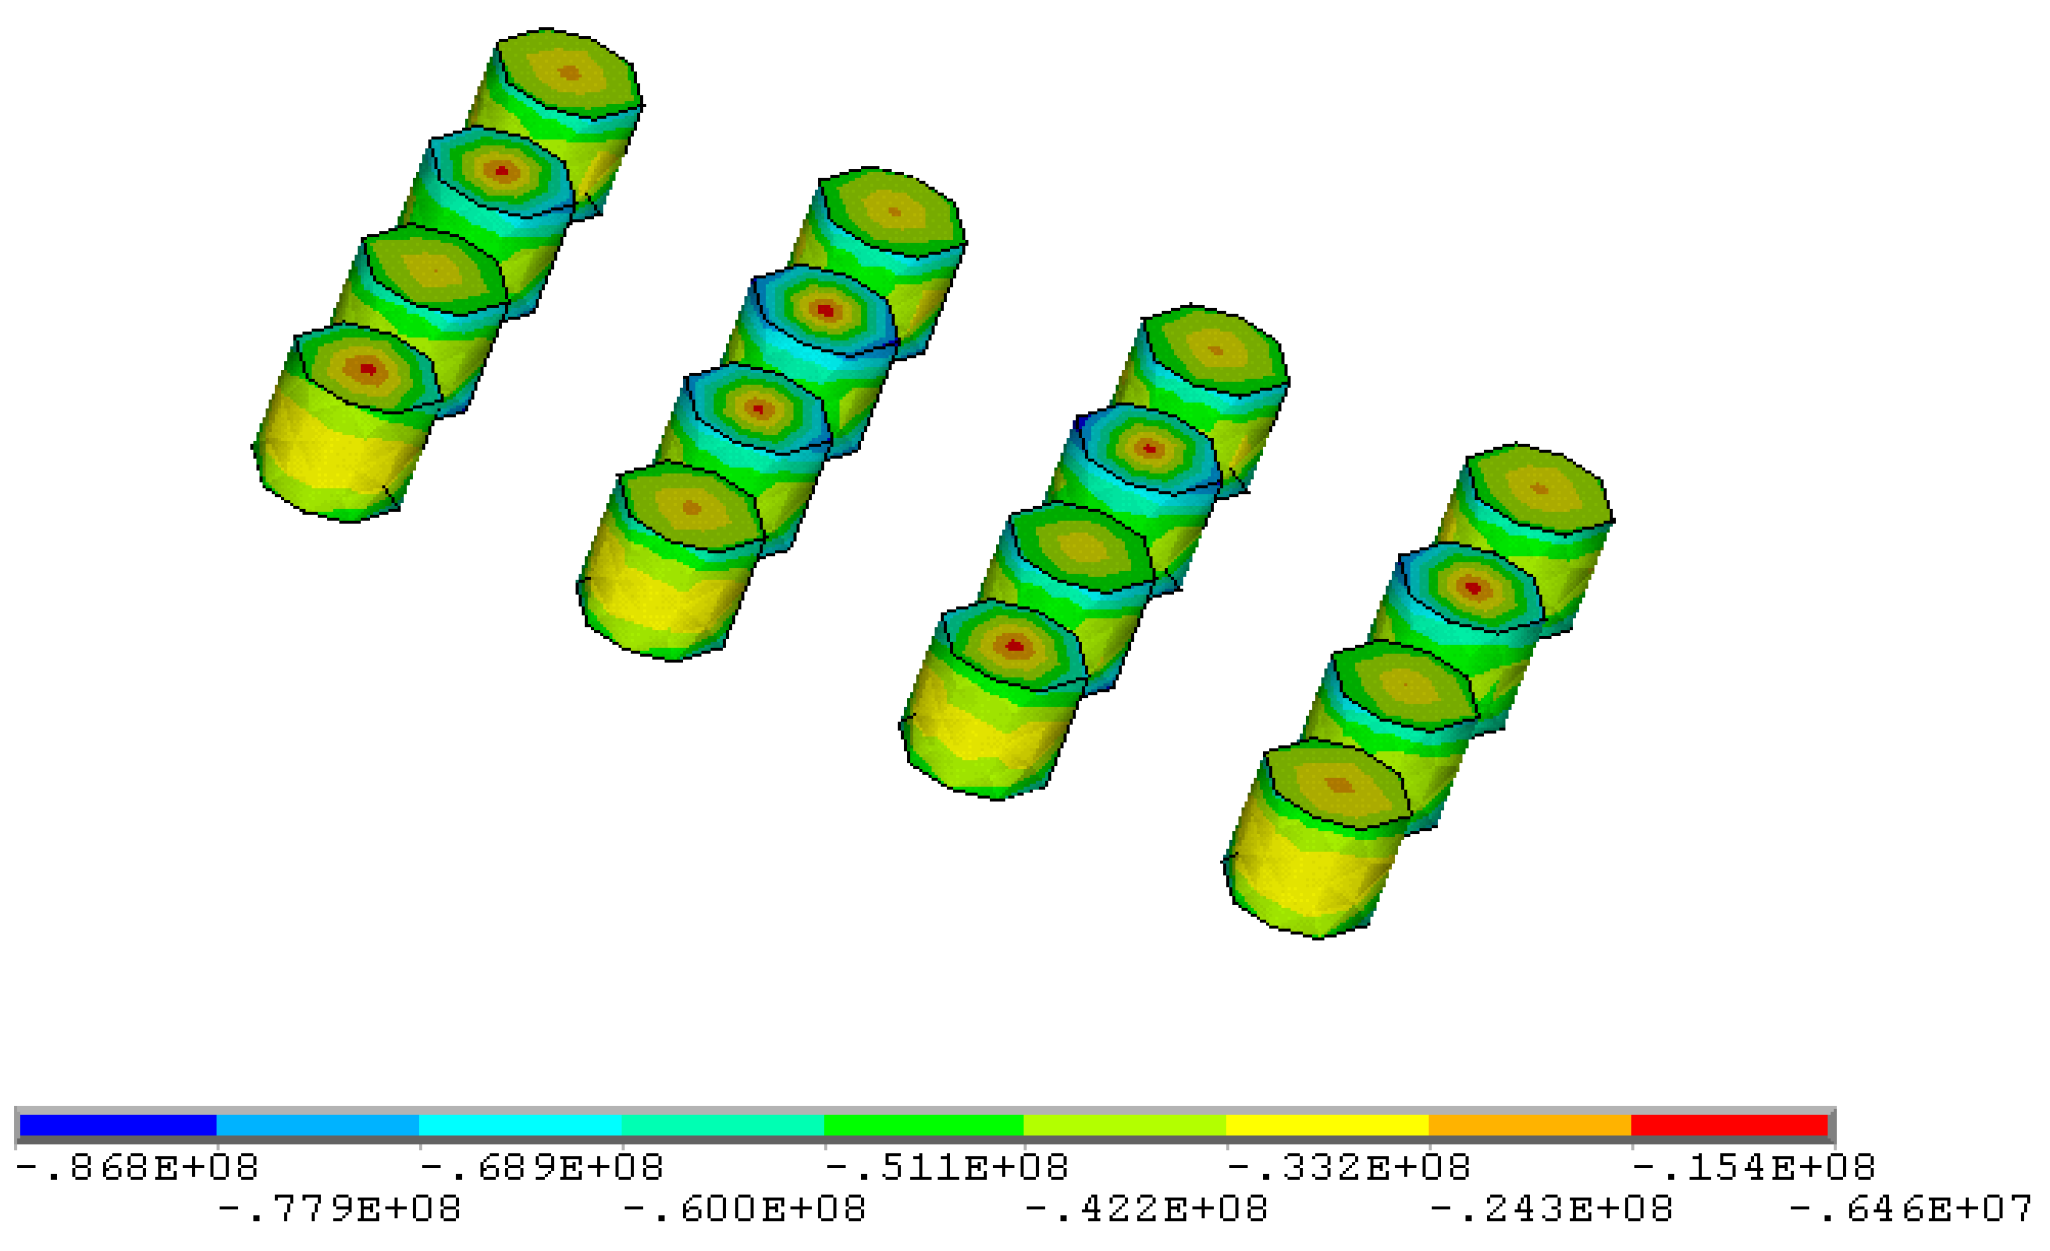
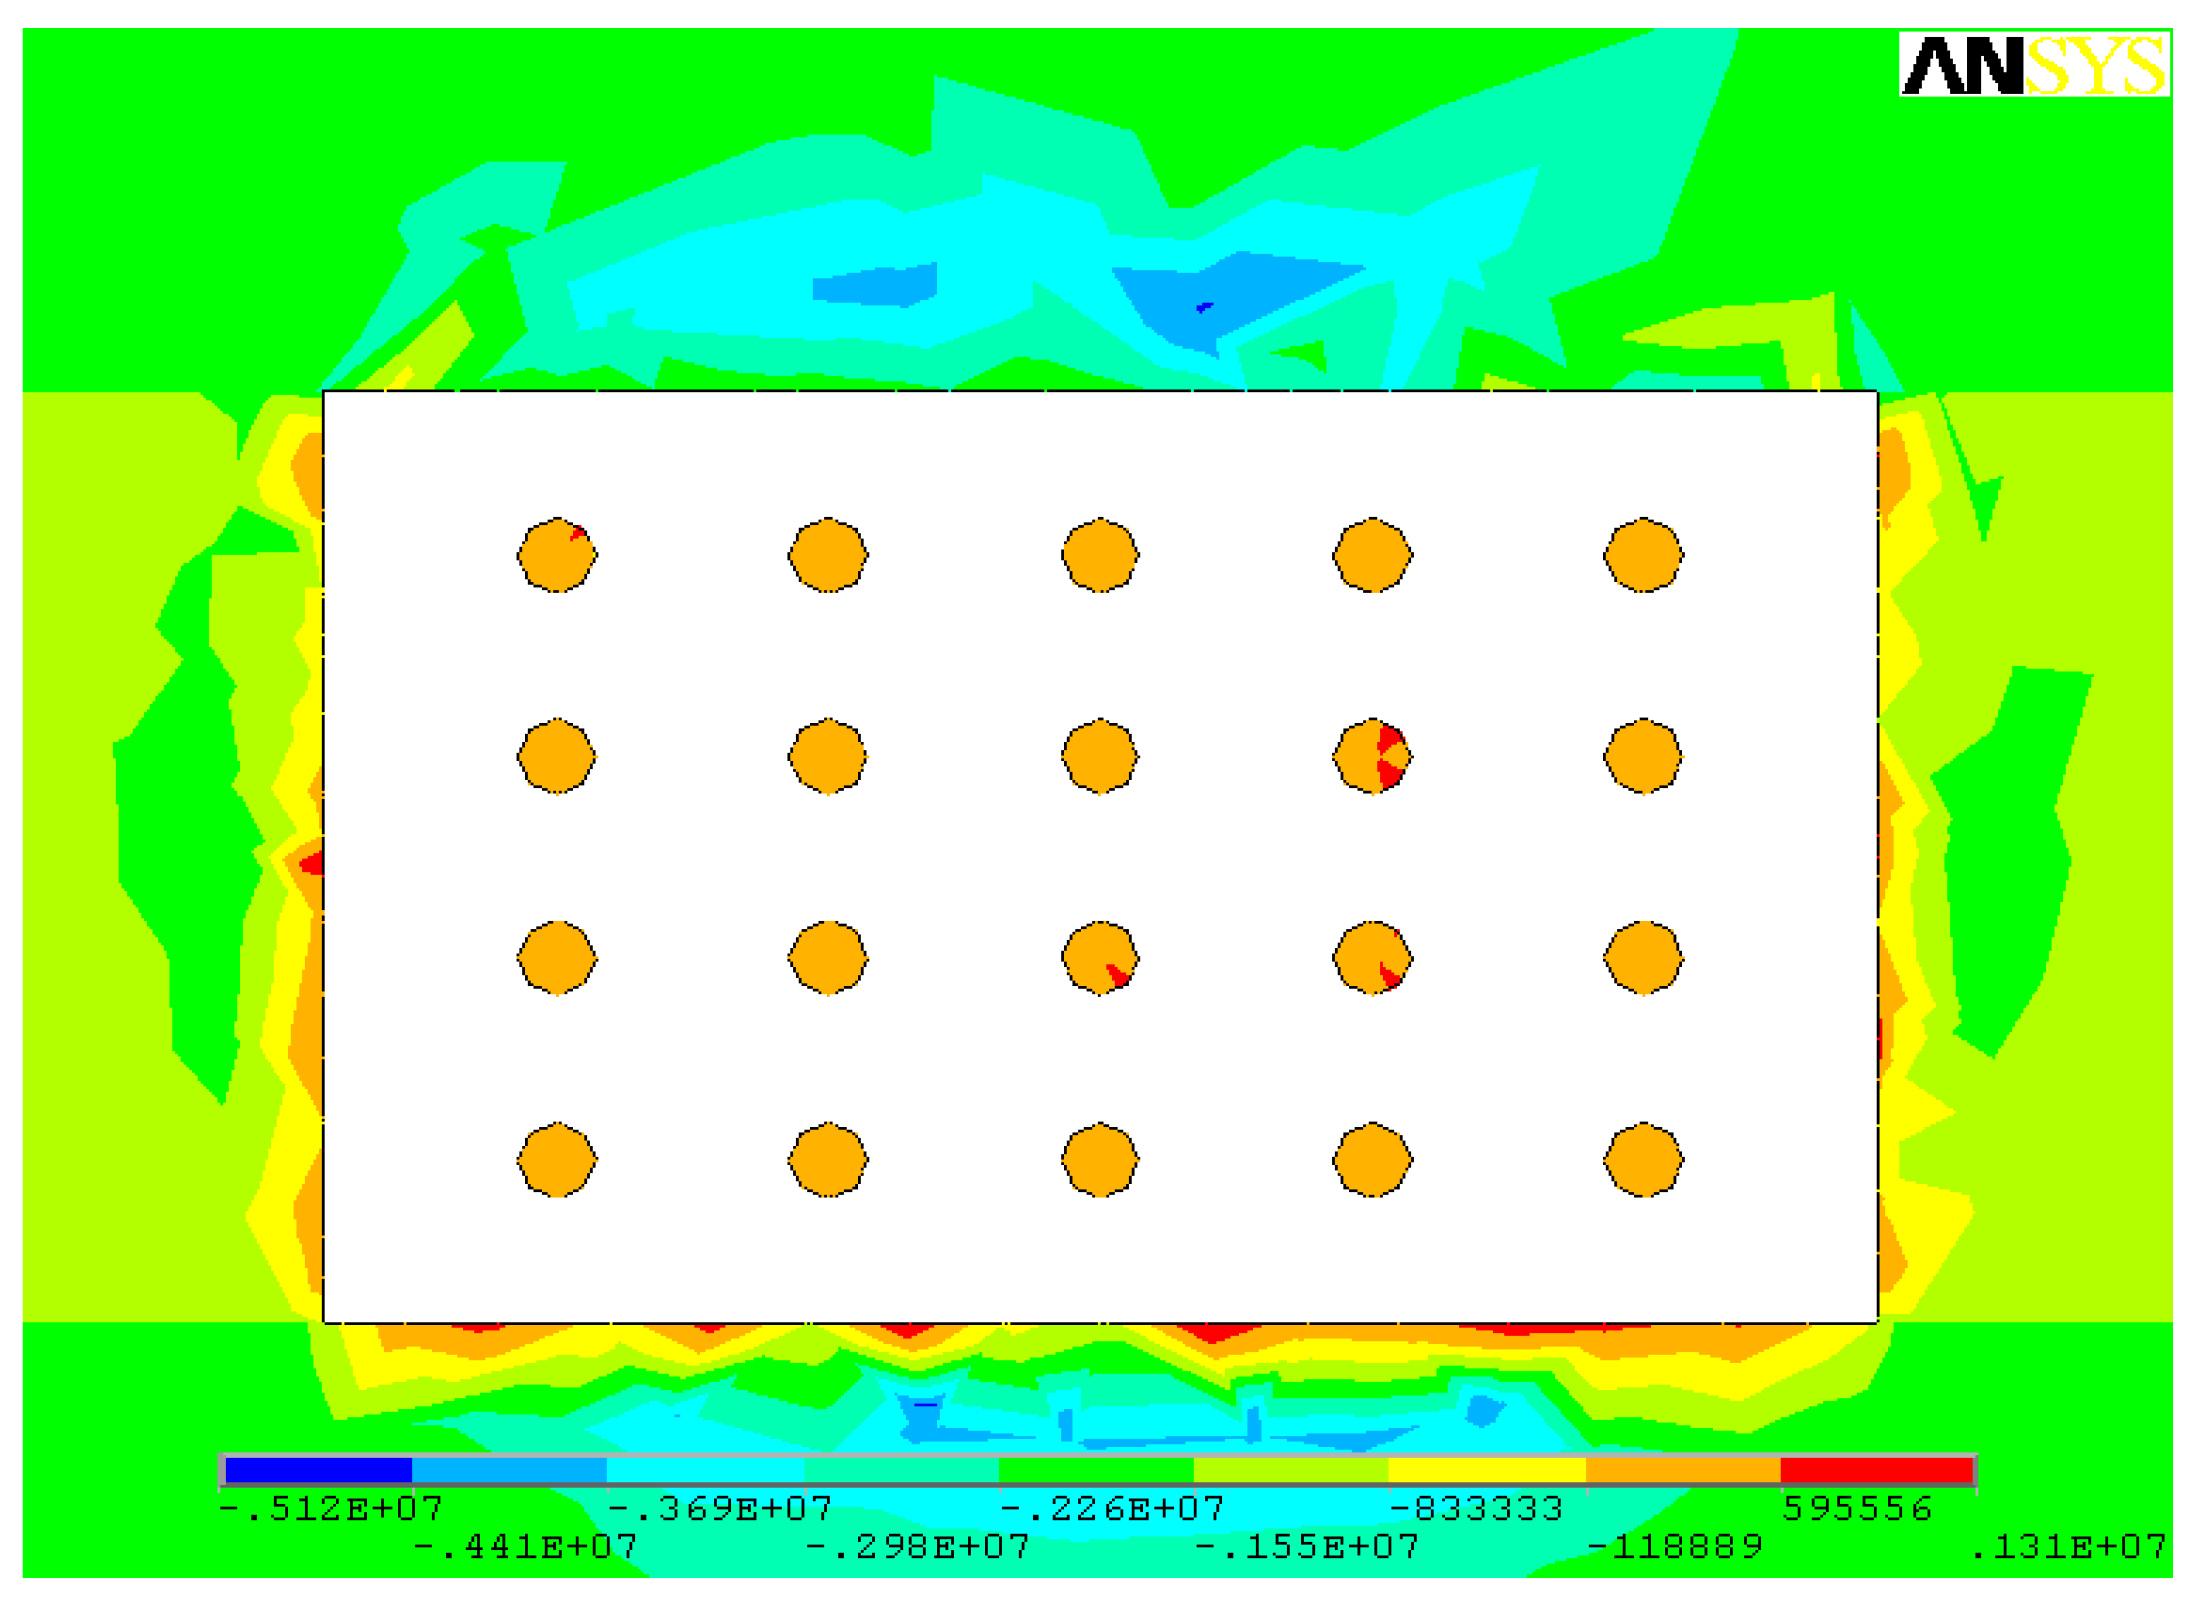
4. Optimization of Stope Structural Parameters
4.1. Stope Height 2.5 m
4.2. Stope Height 3.5 m
4.3. Stope Height 4.5 m
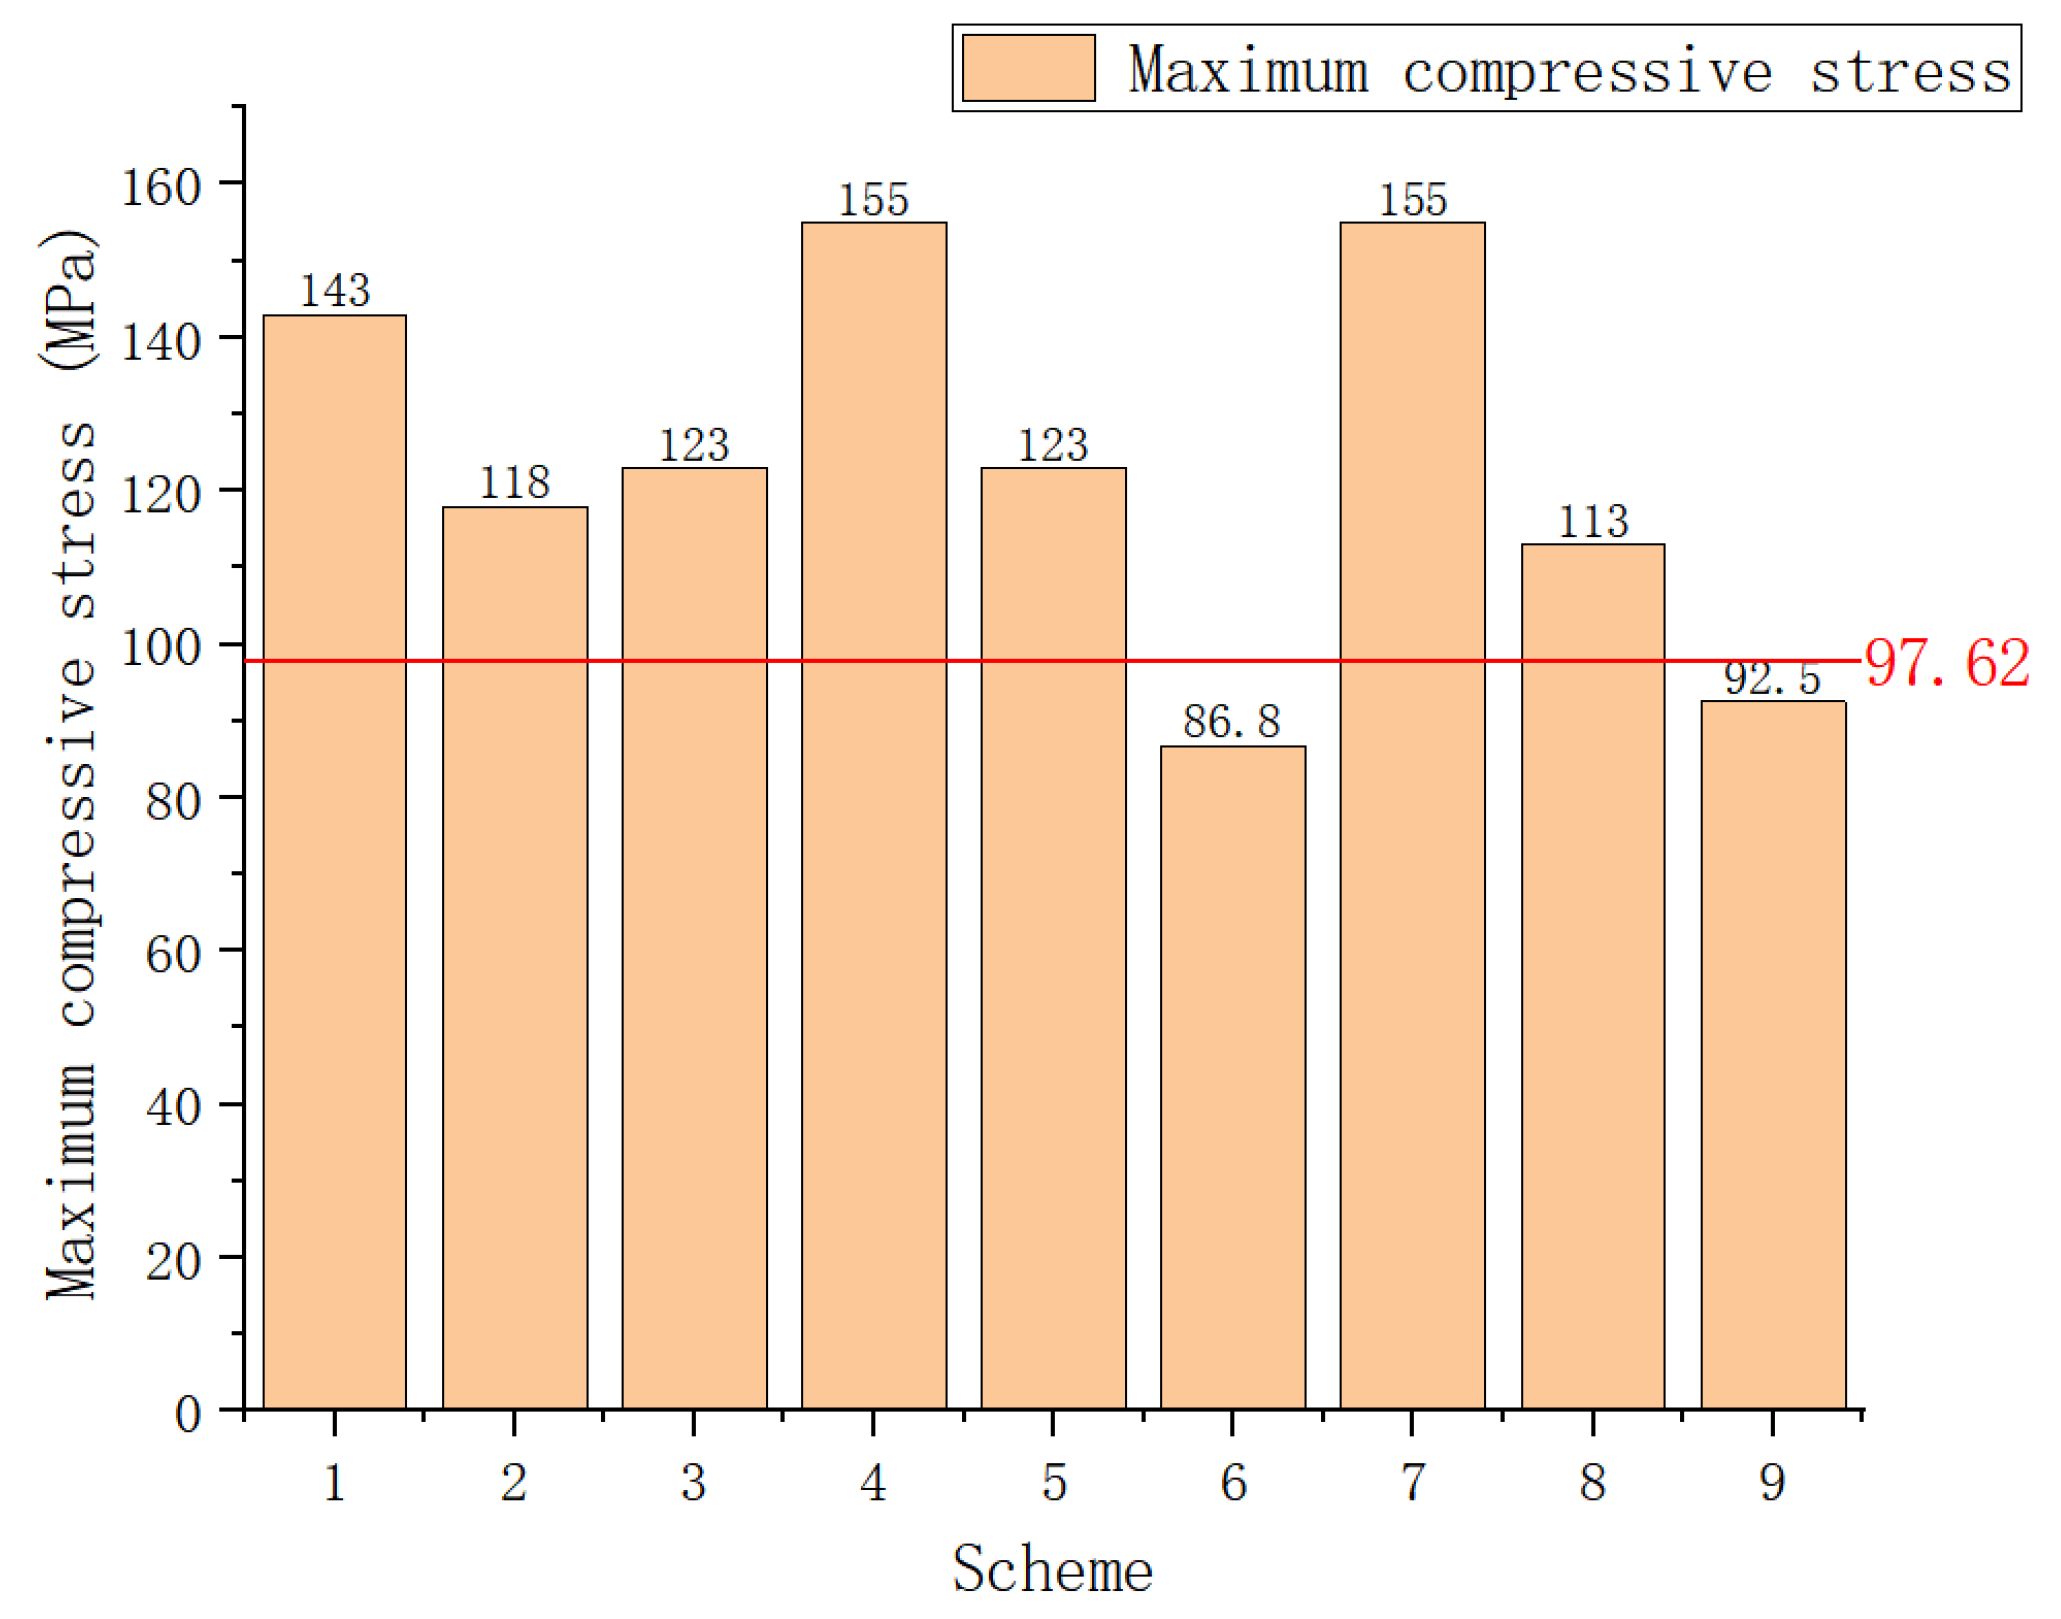
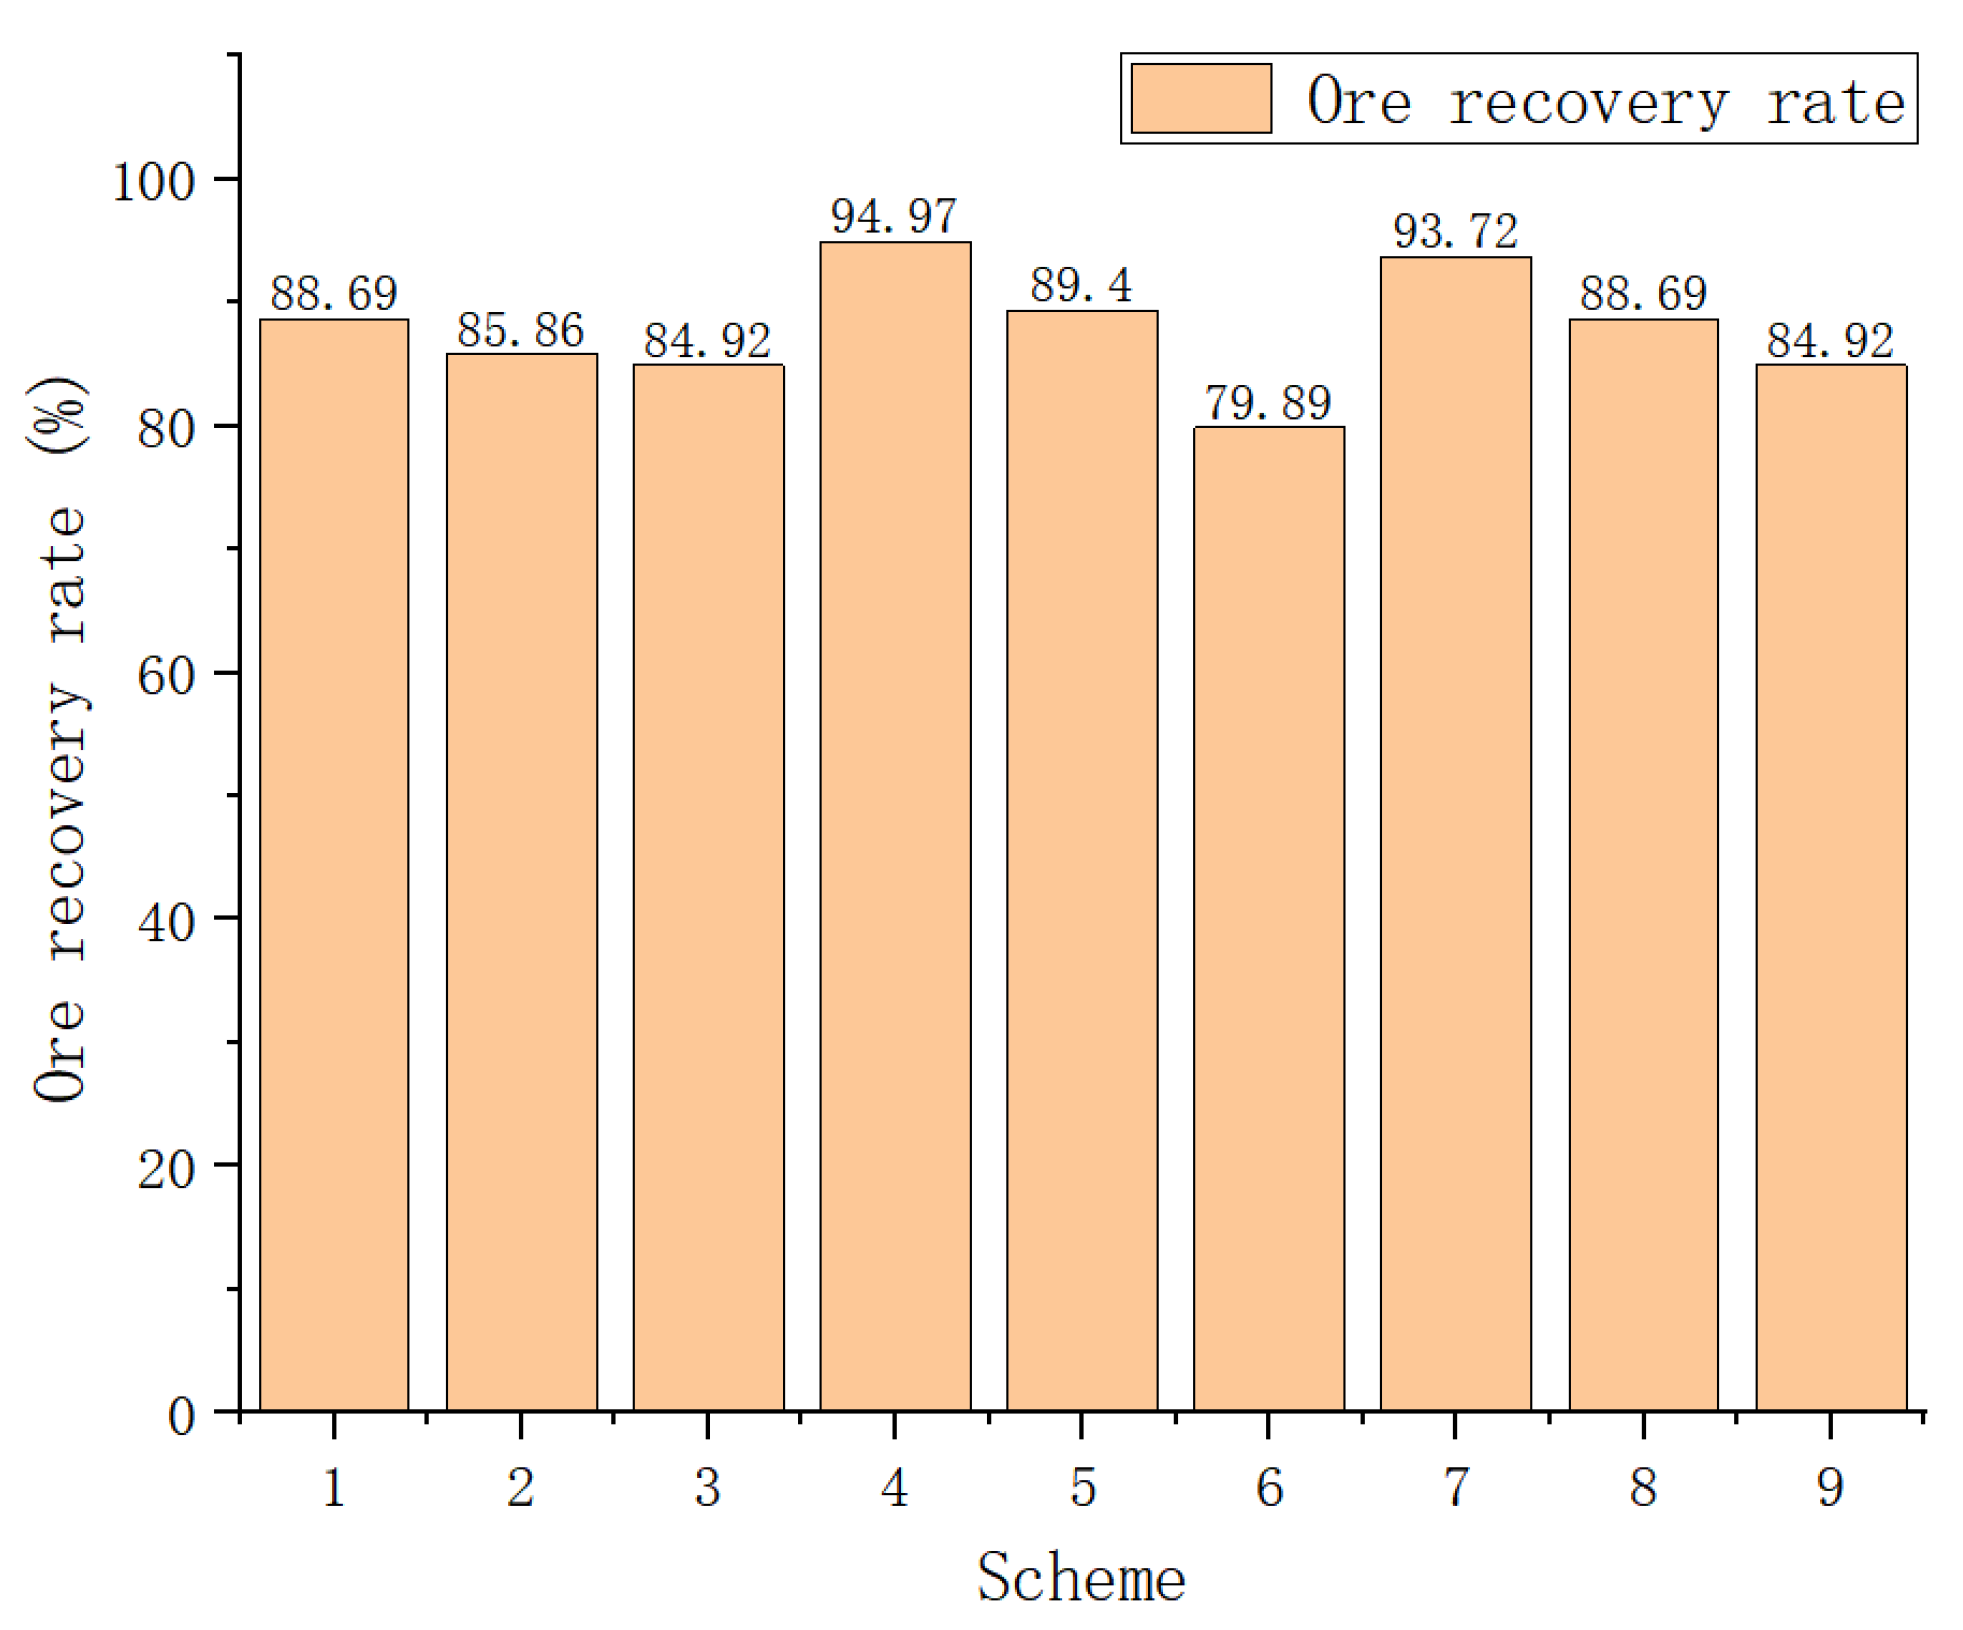
4.4. Optimization Results
5. Conclusions
- 1.
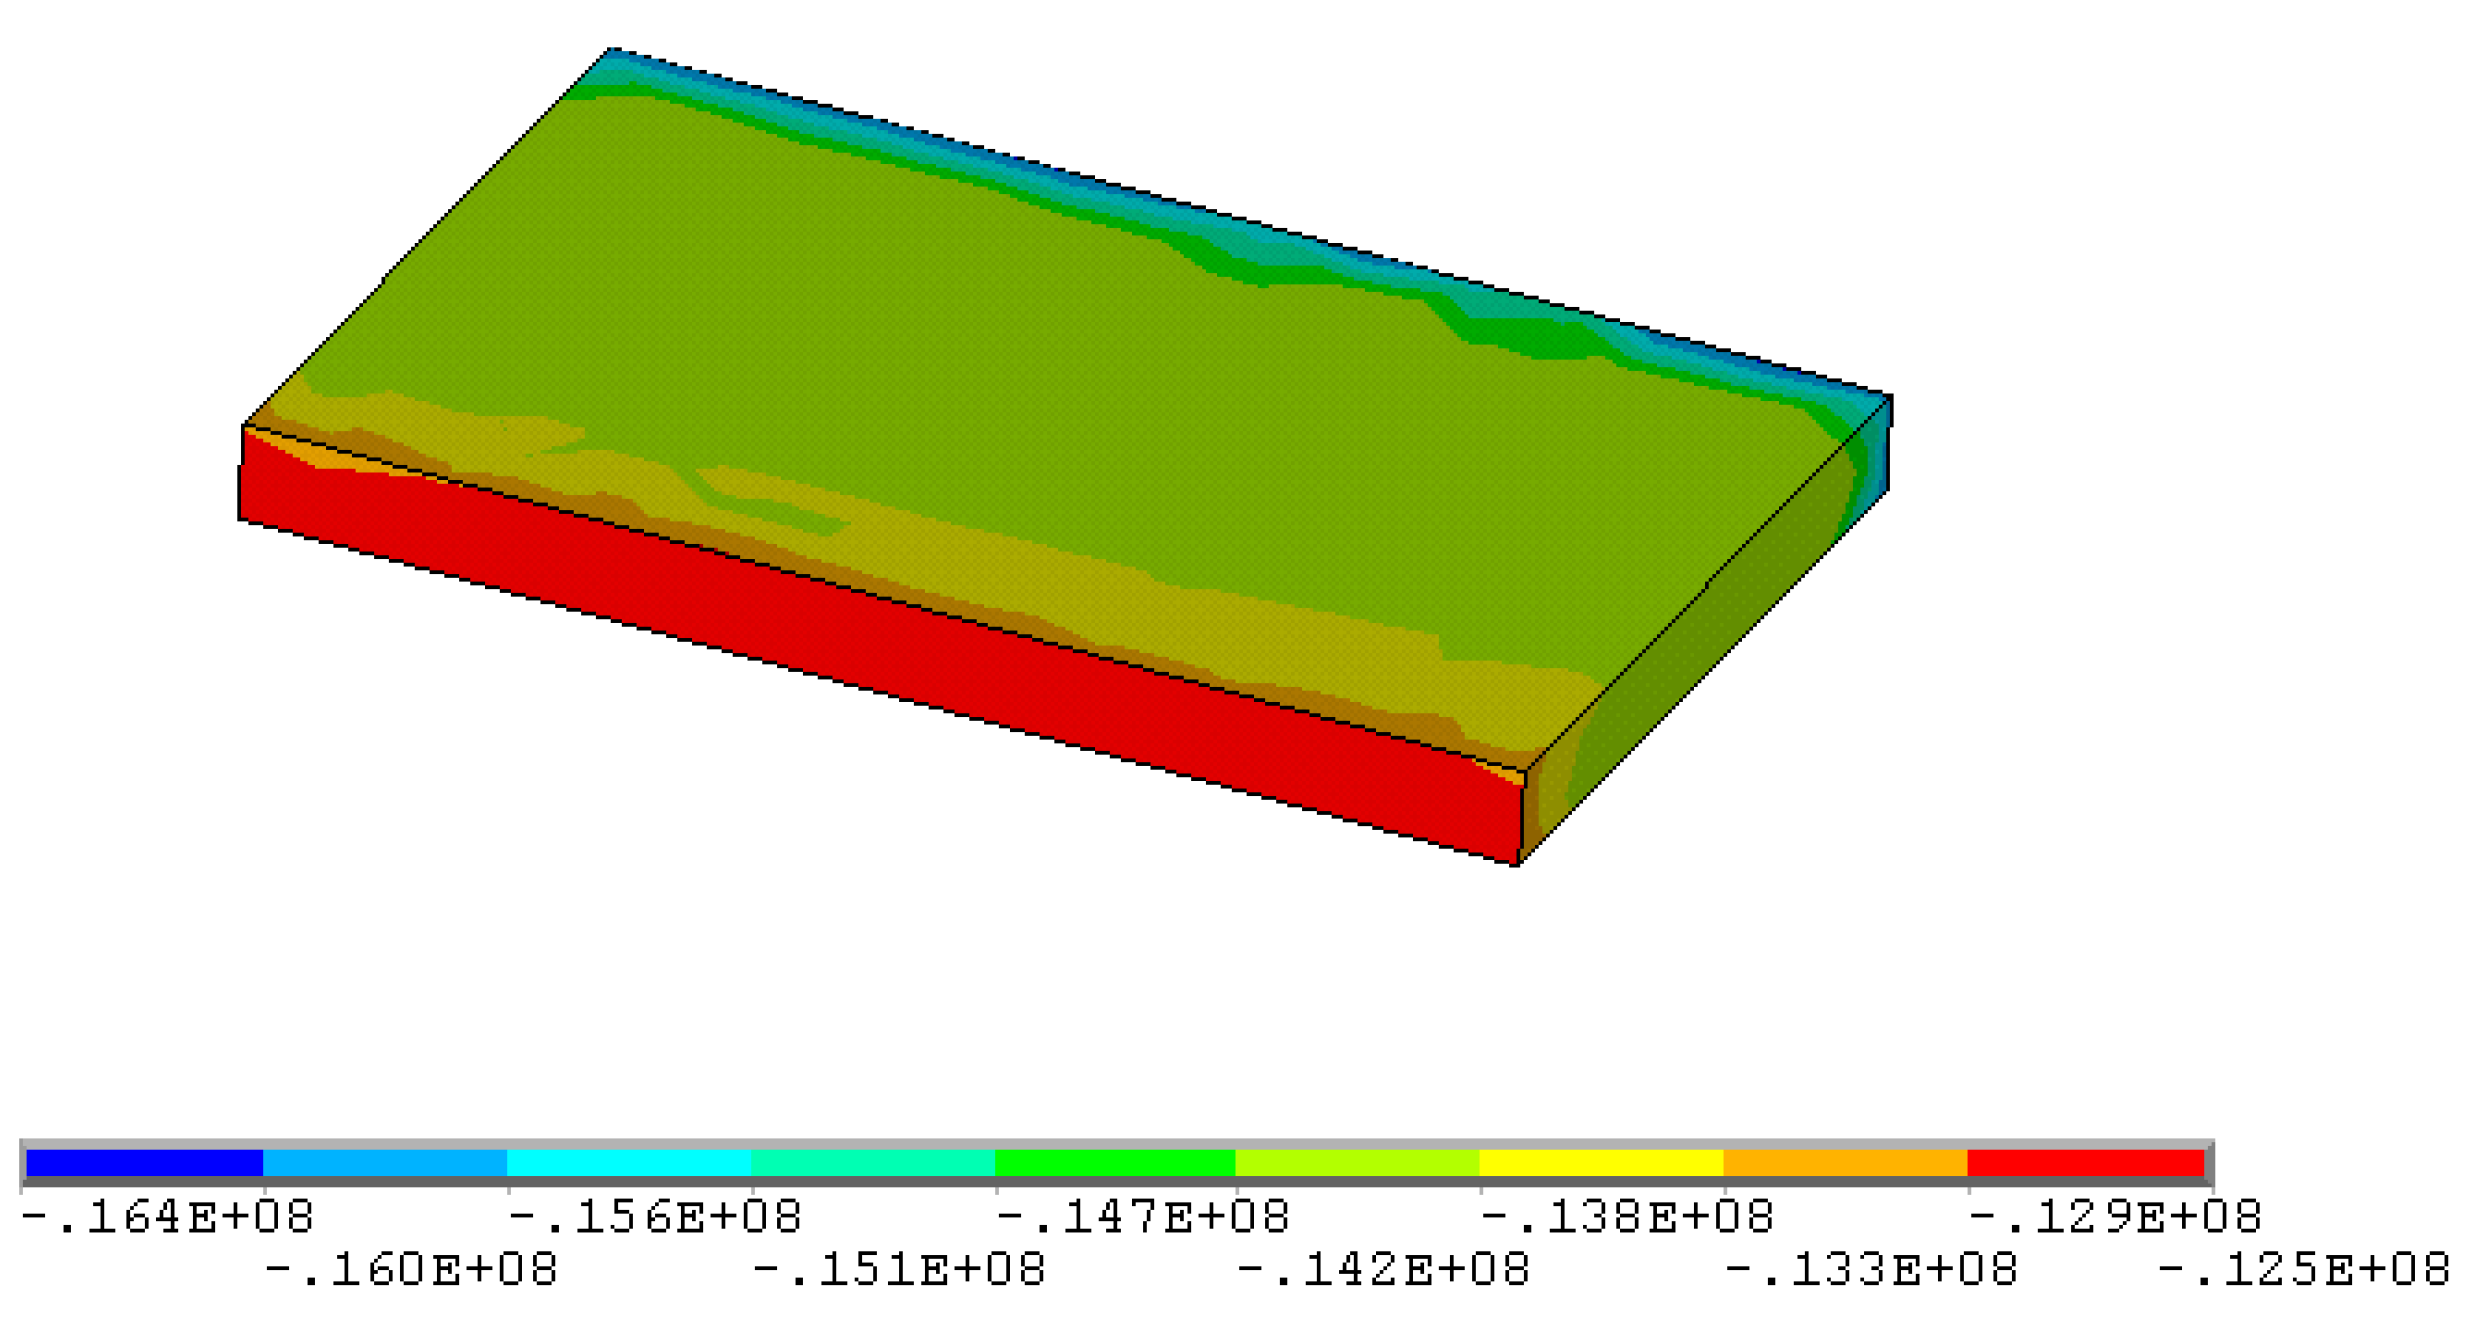
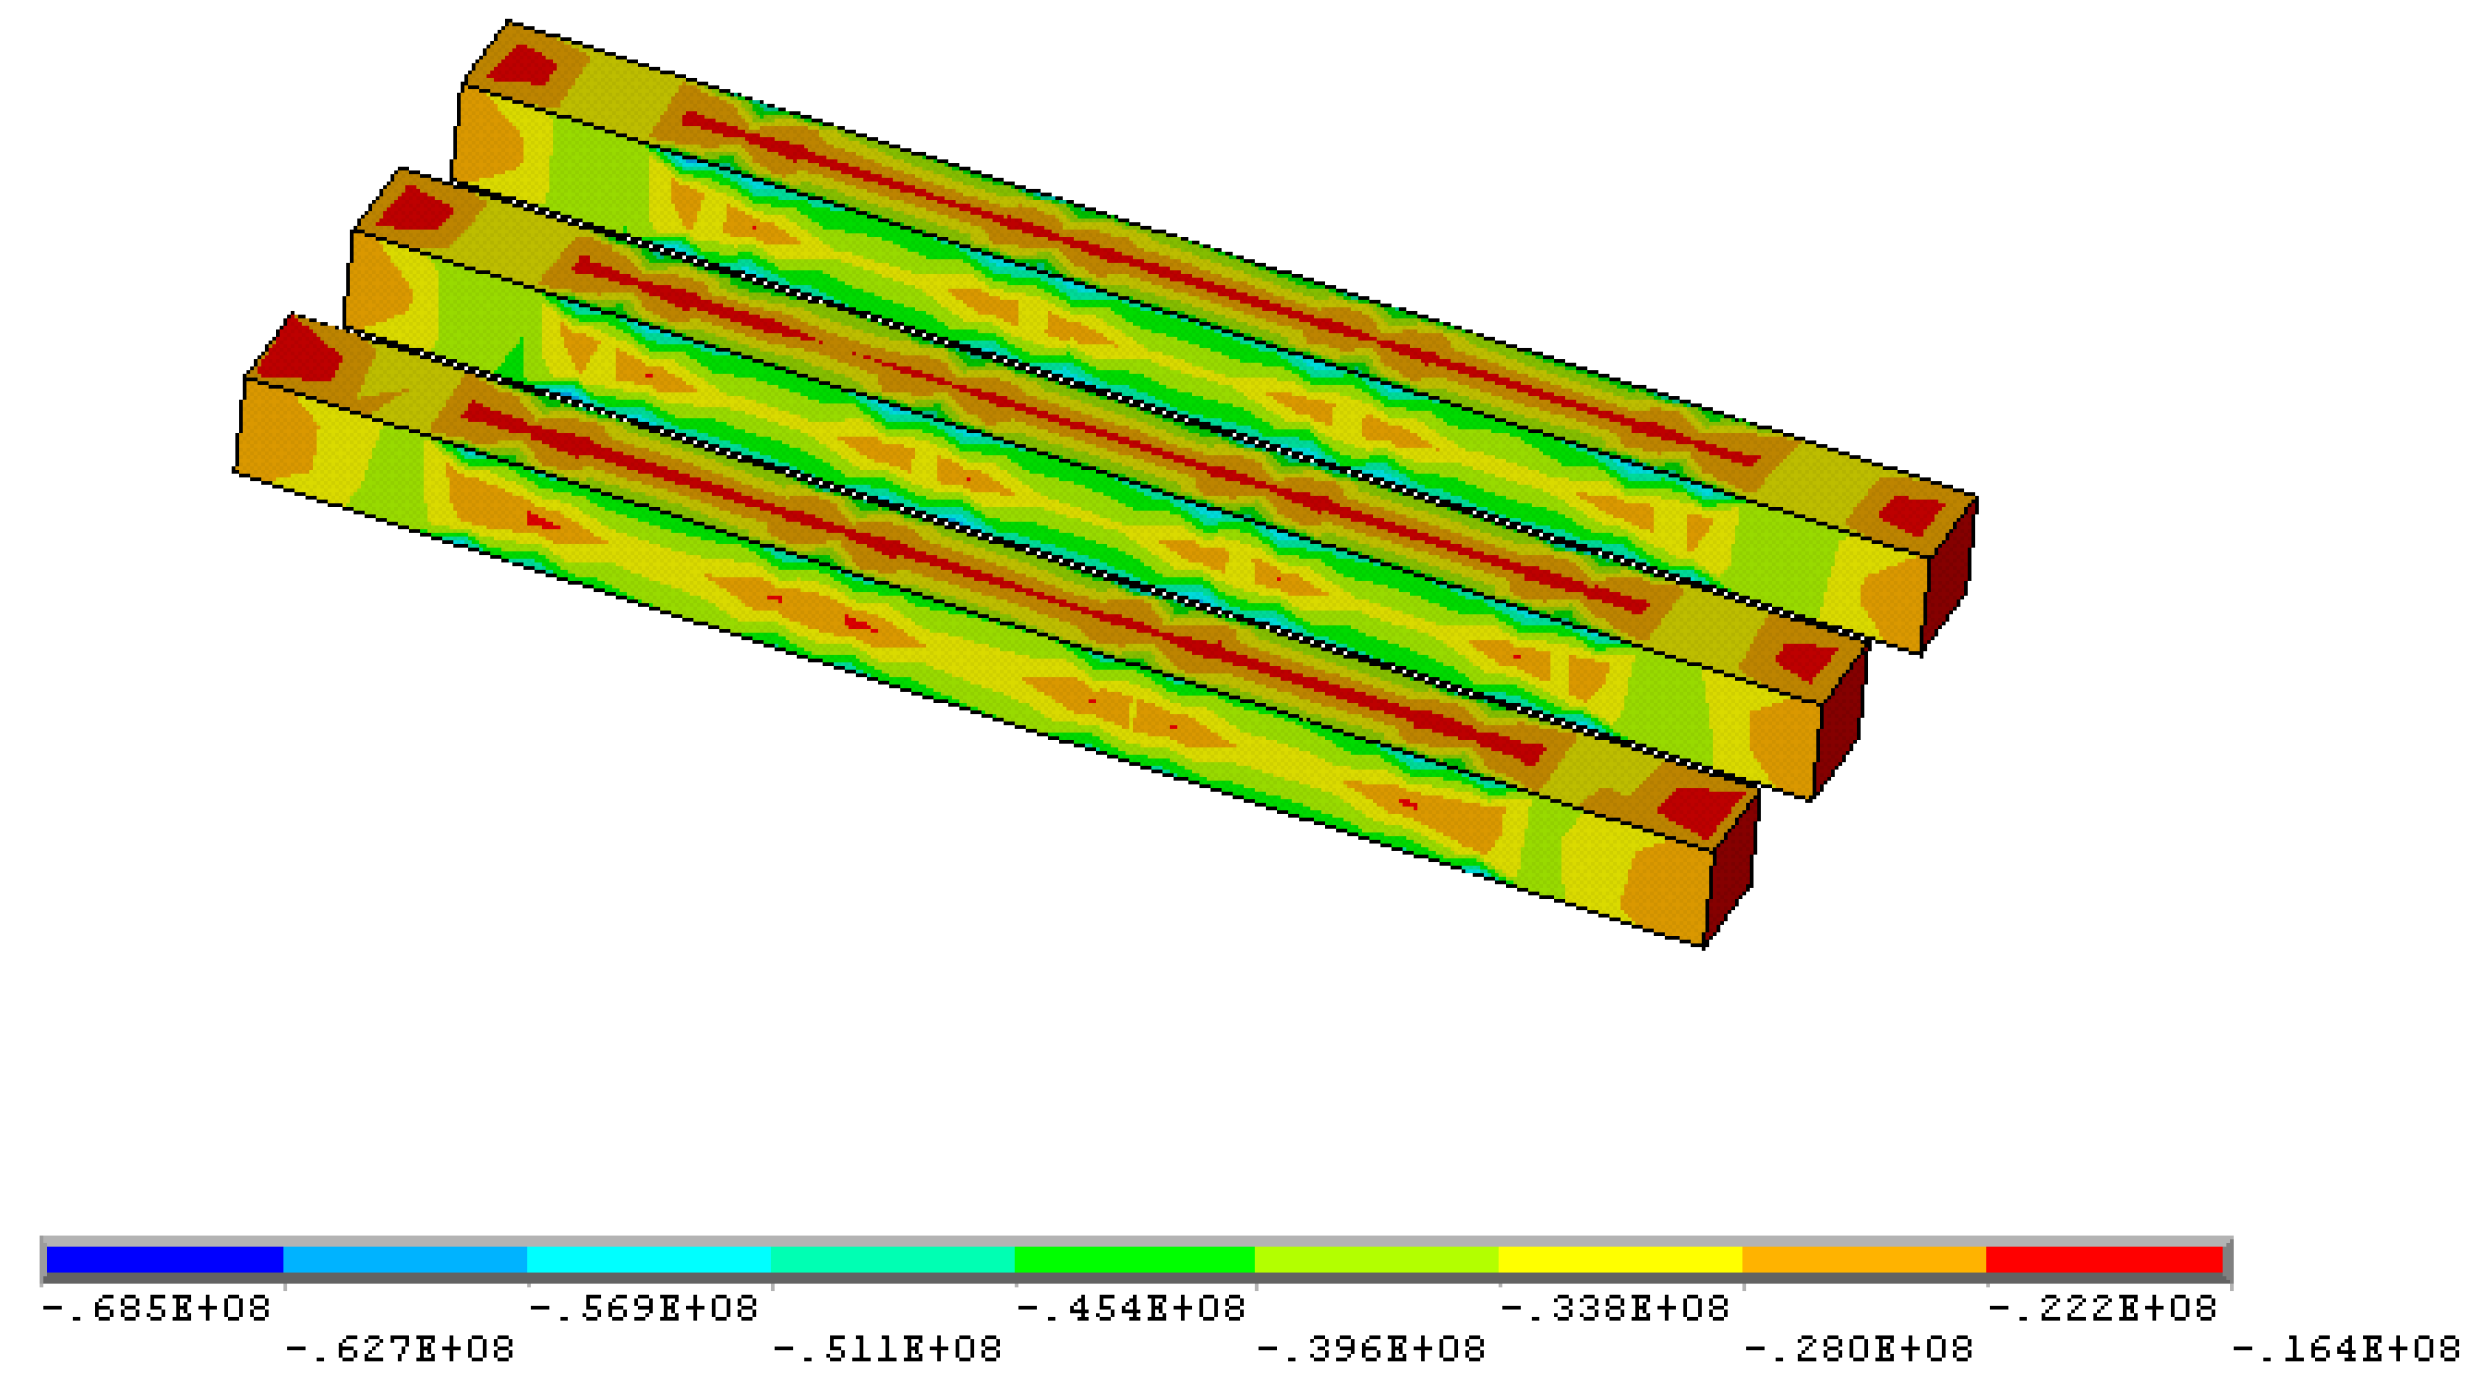
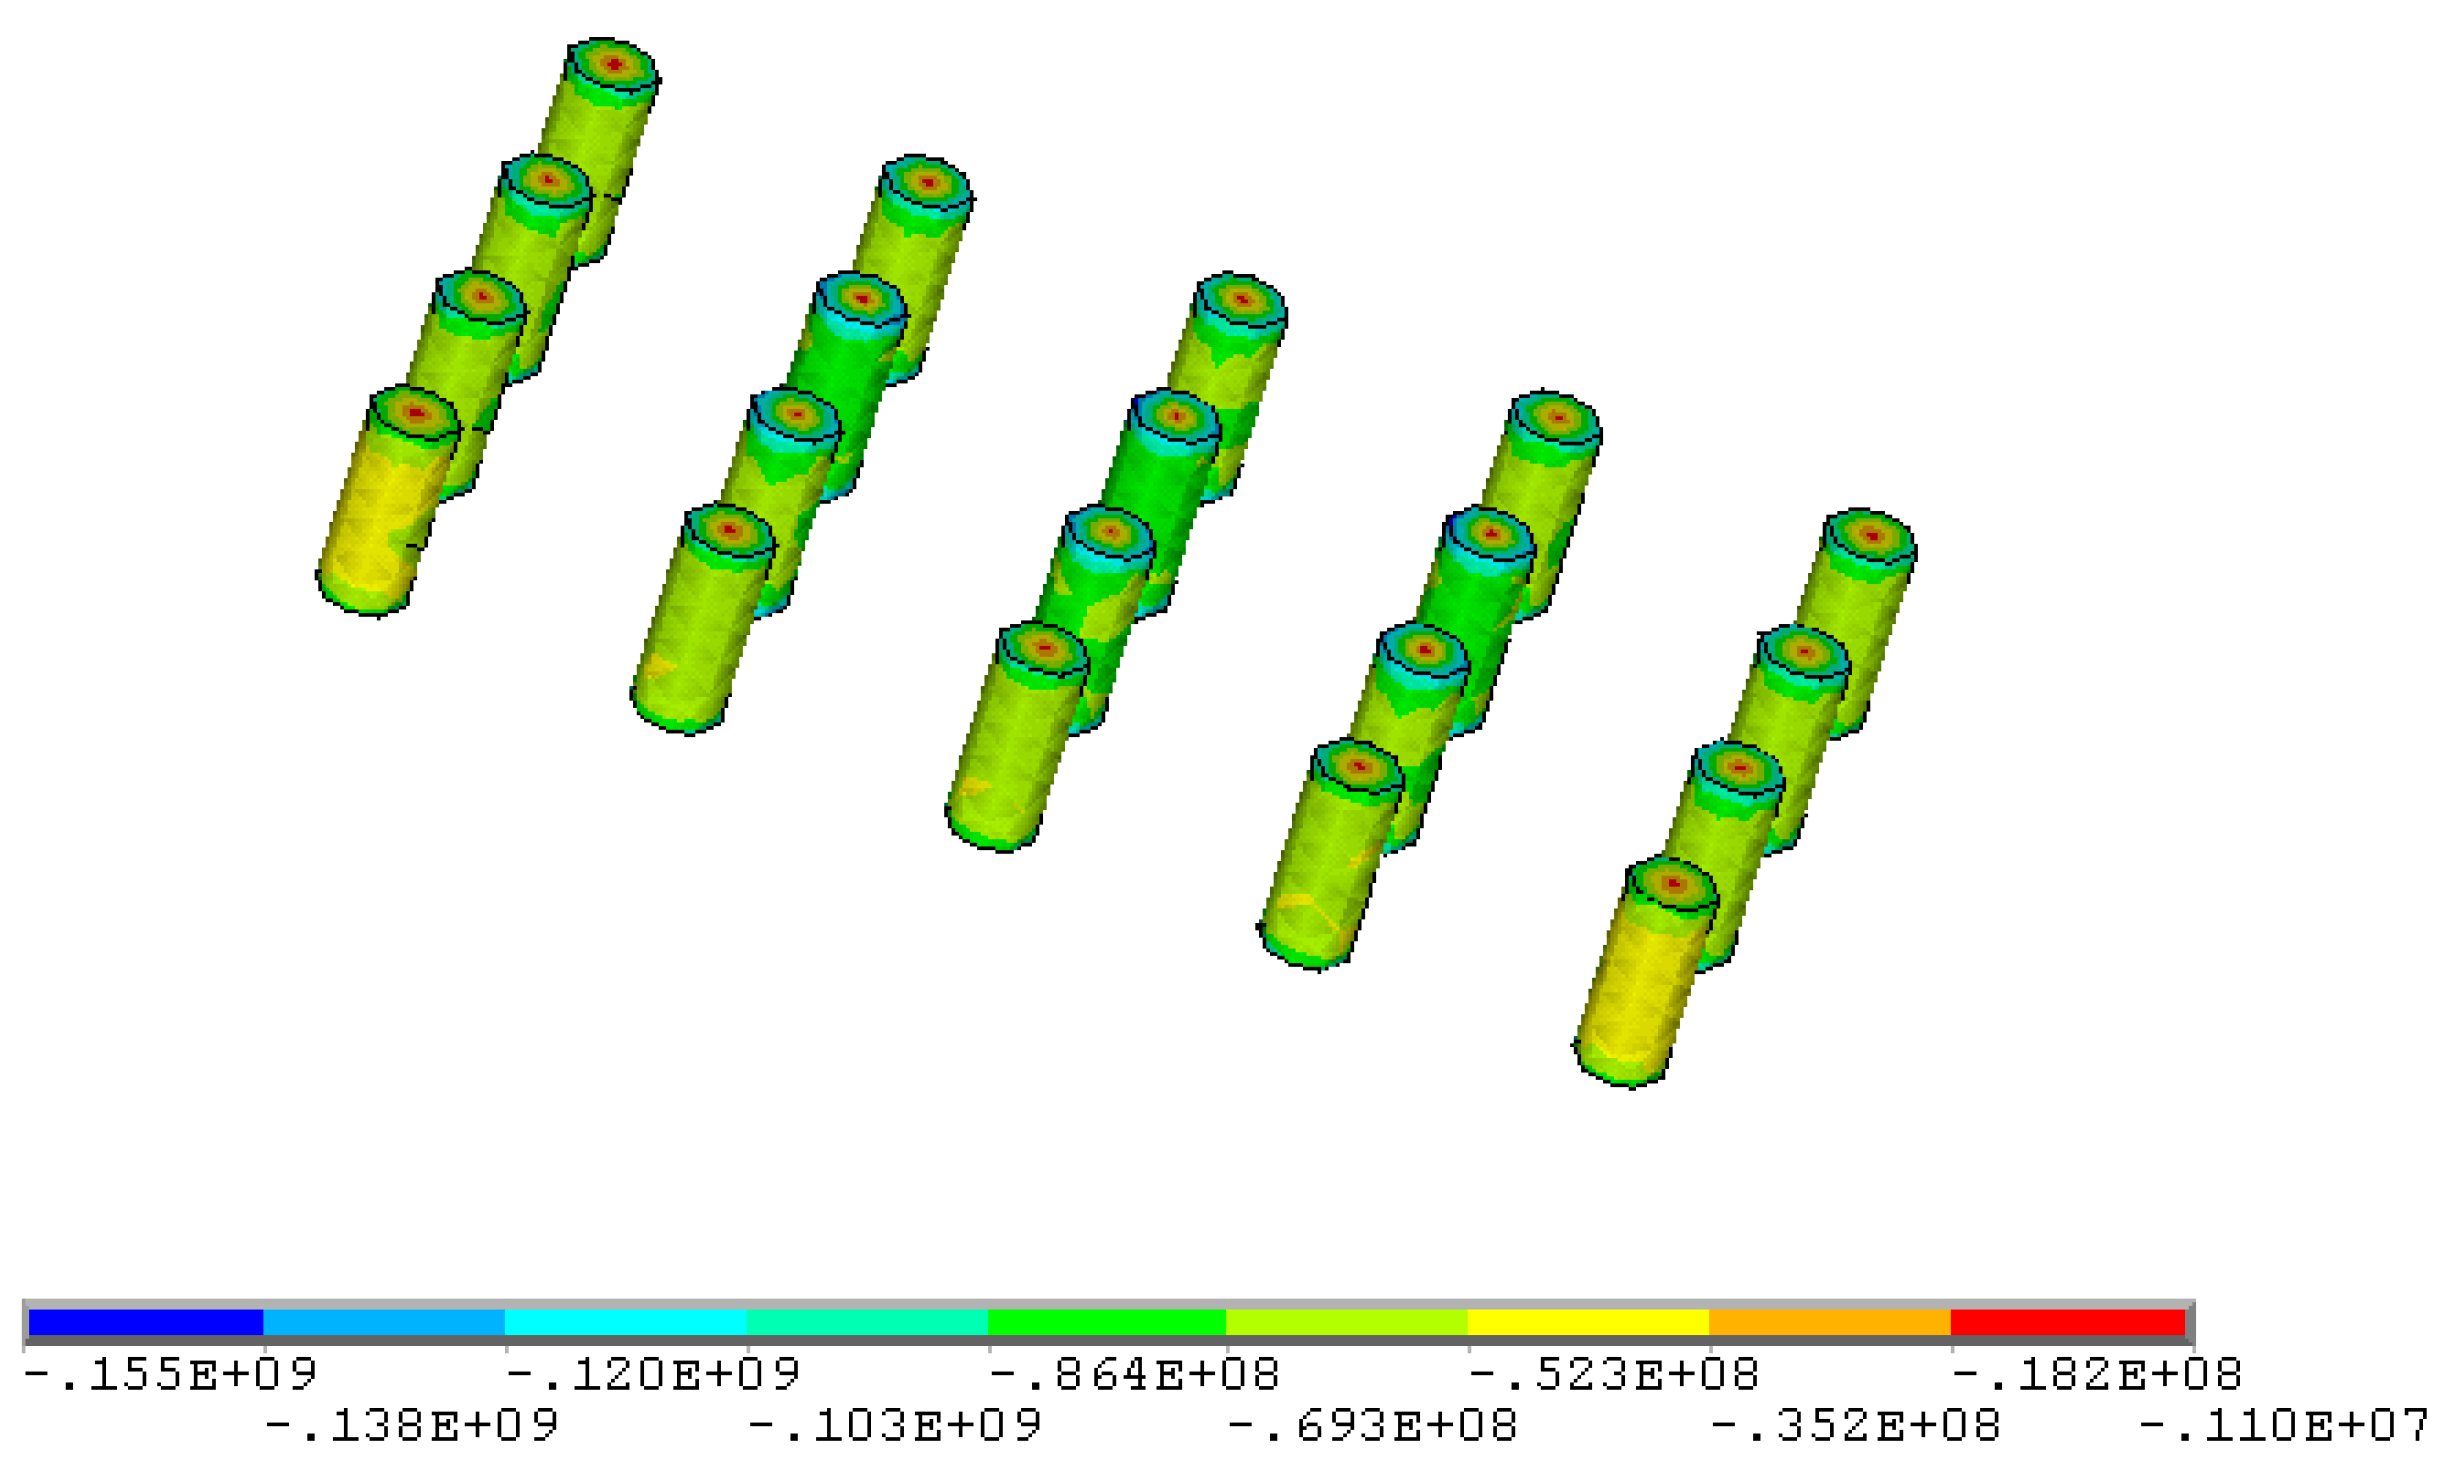
- Based on the area bearing theory, when the axial compressive stress is higher than the uniaxial compressive strength of the ore rock, the stope room will collapse. When the existing stope structural parameters are adopted, the maximum compressive stress in the ore pillar (142.0 MPa) is much higher than the uniaxial compressive strength of the ore (97.62 MPa). The existing stope structural parameters failed to maintain stability requirements and tended to be exposed to the risk of stope collapse.
- 2.
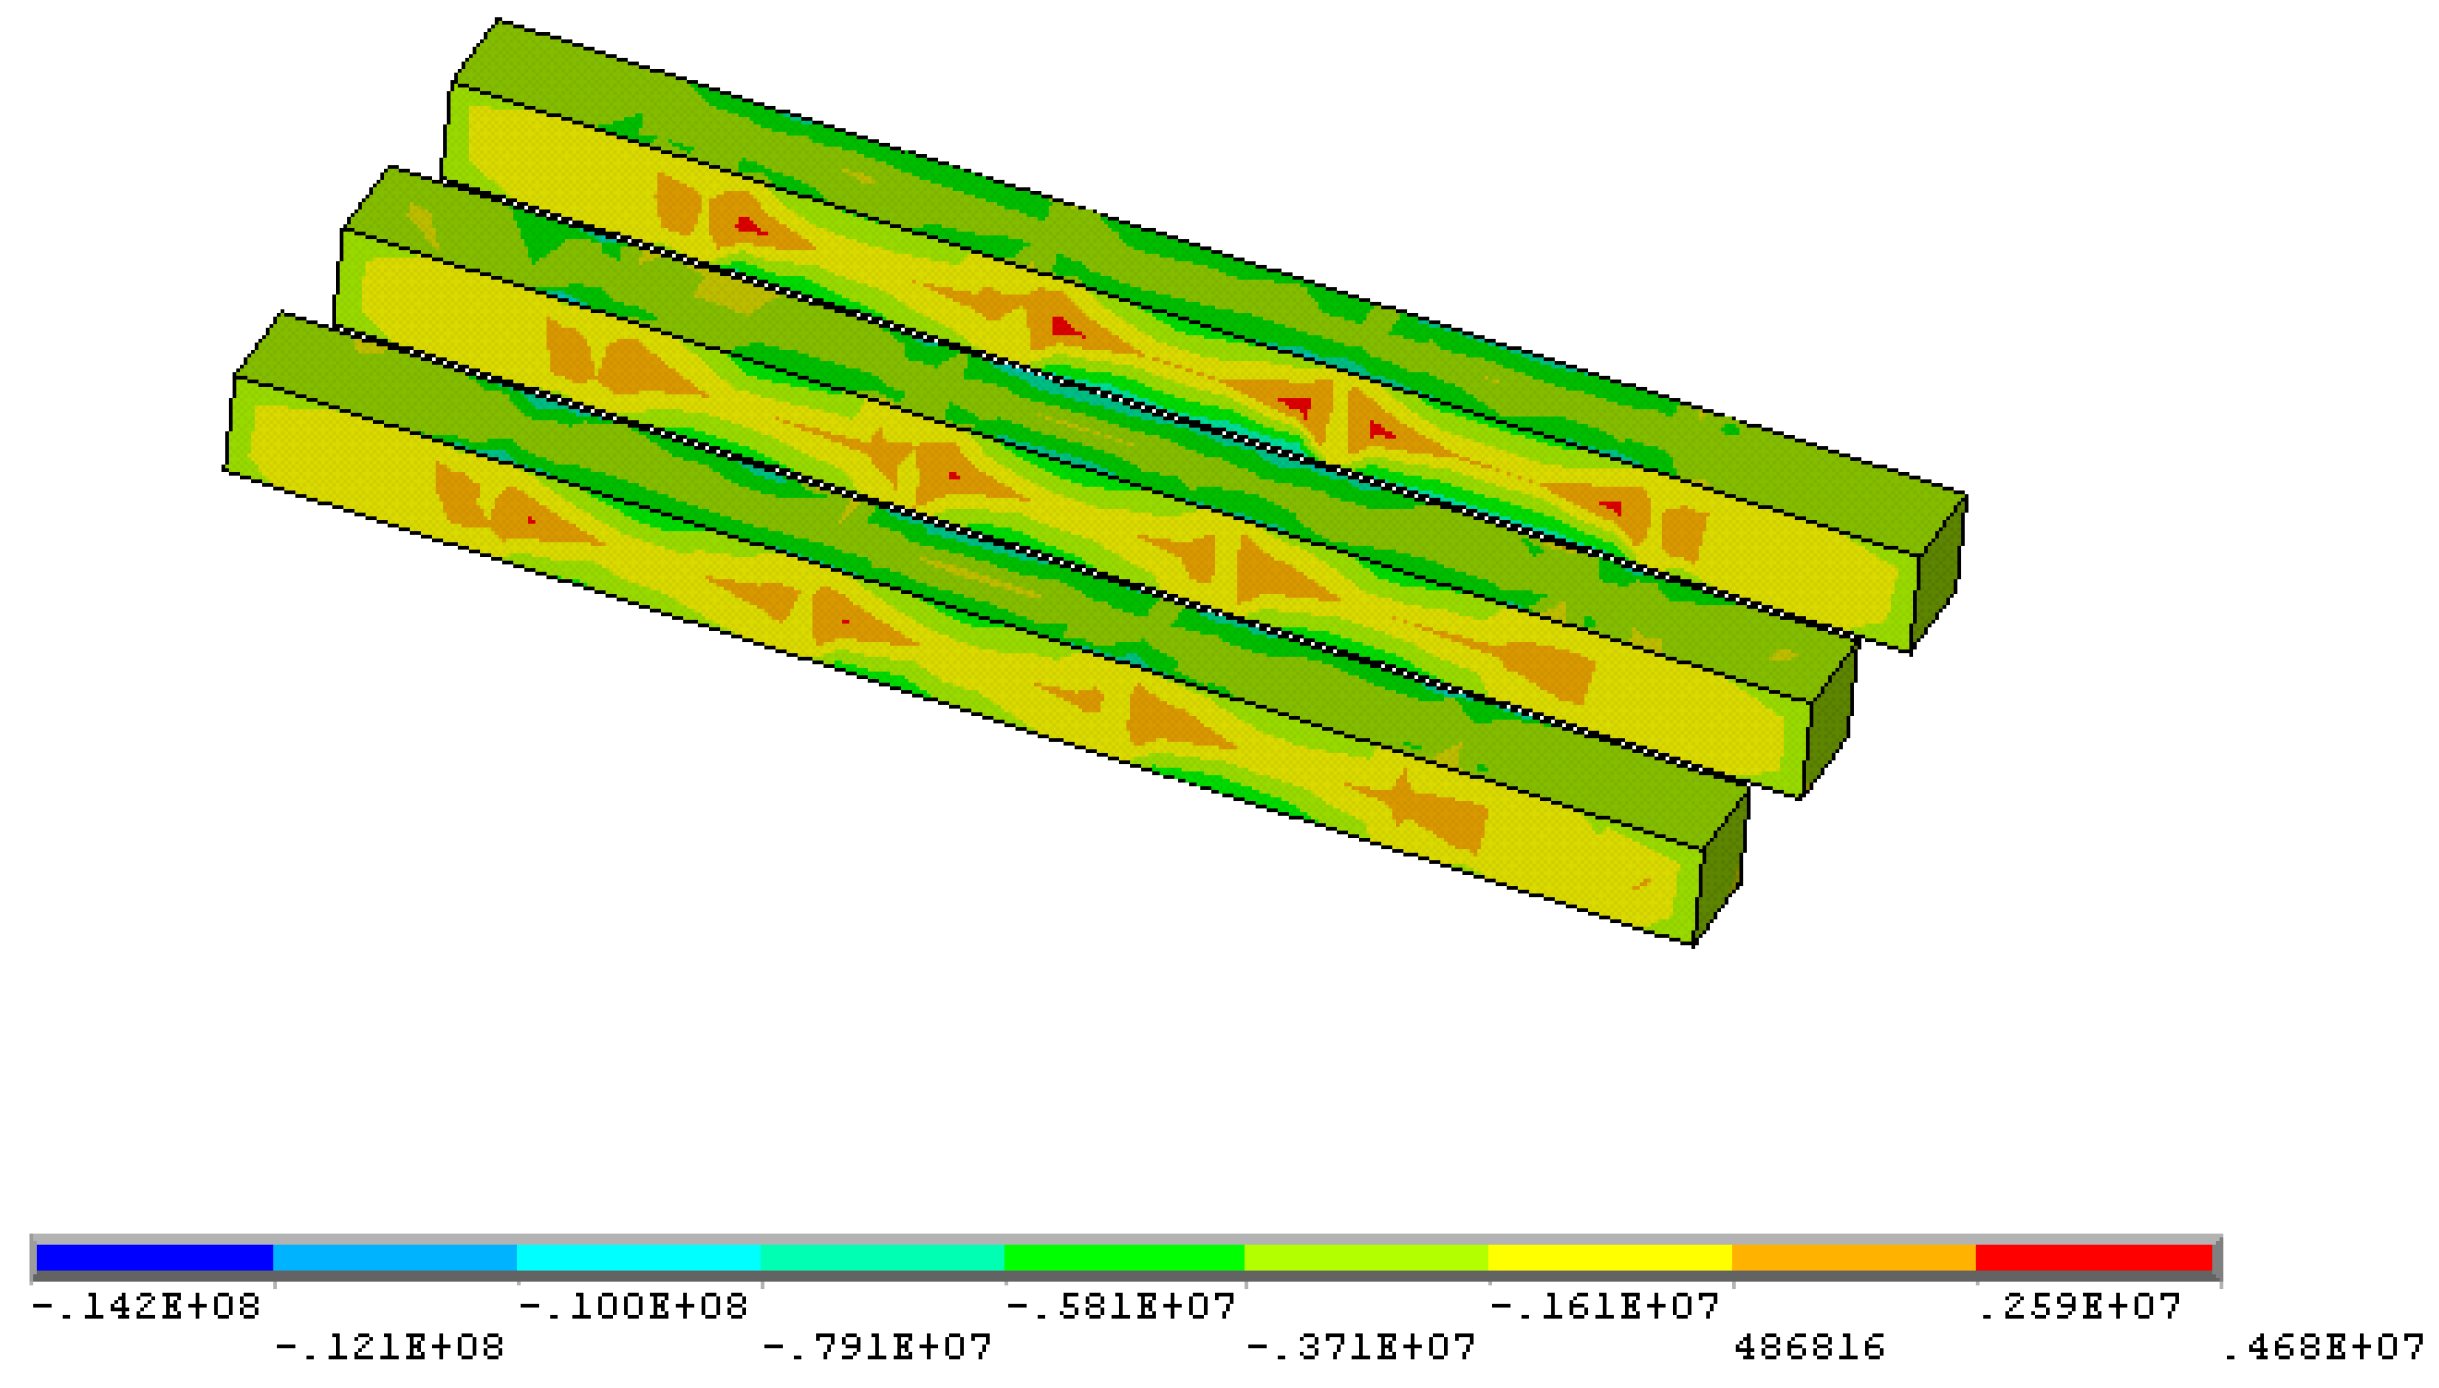
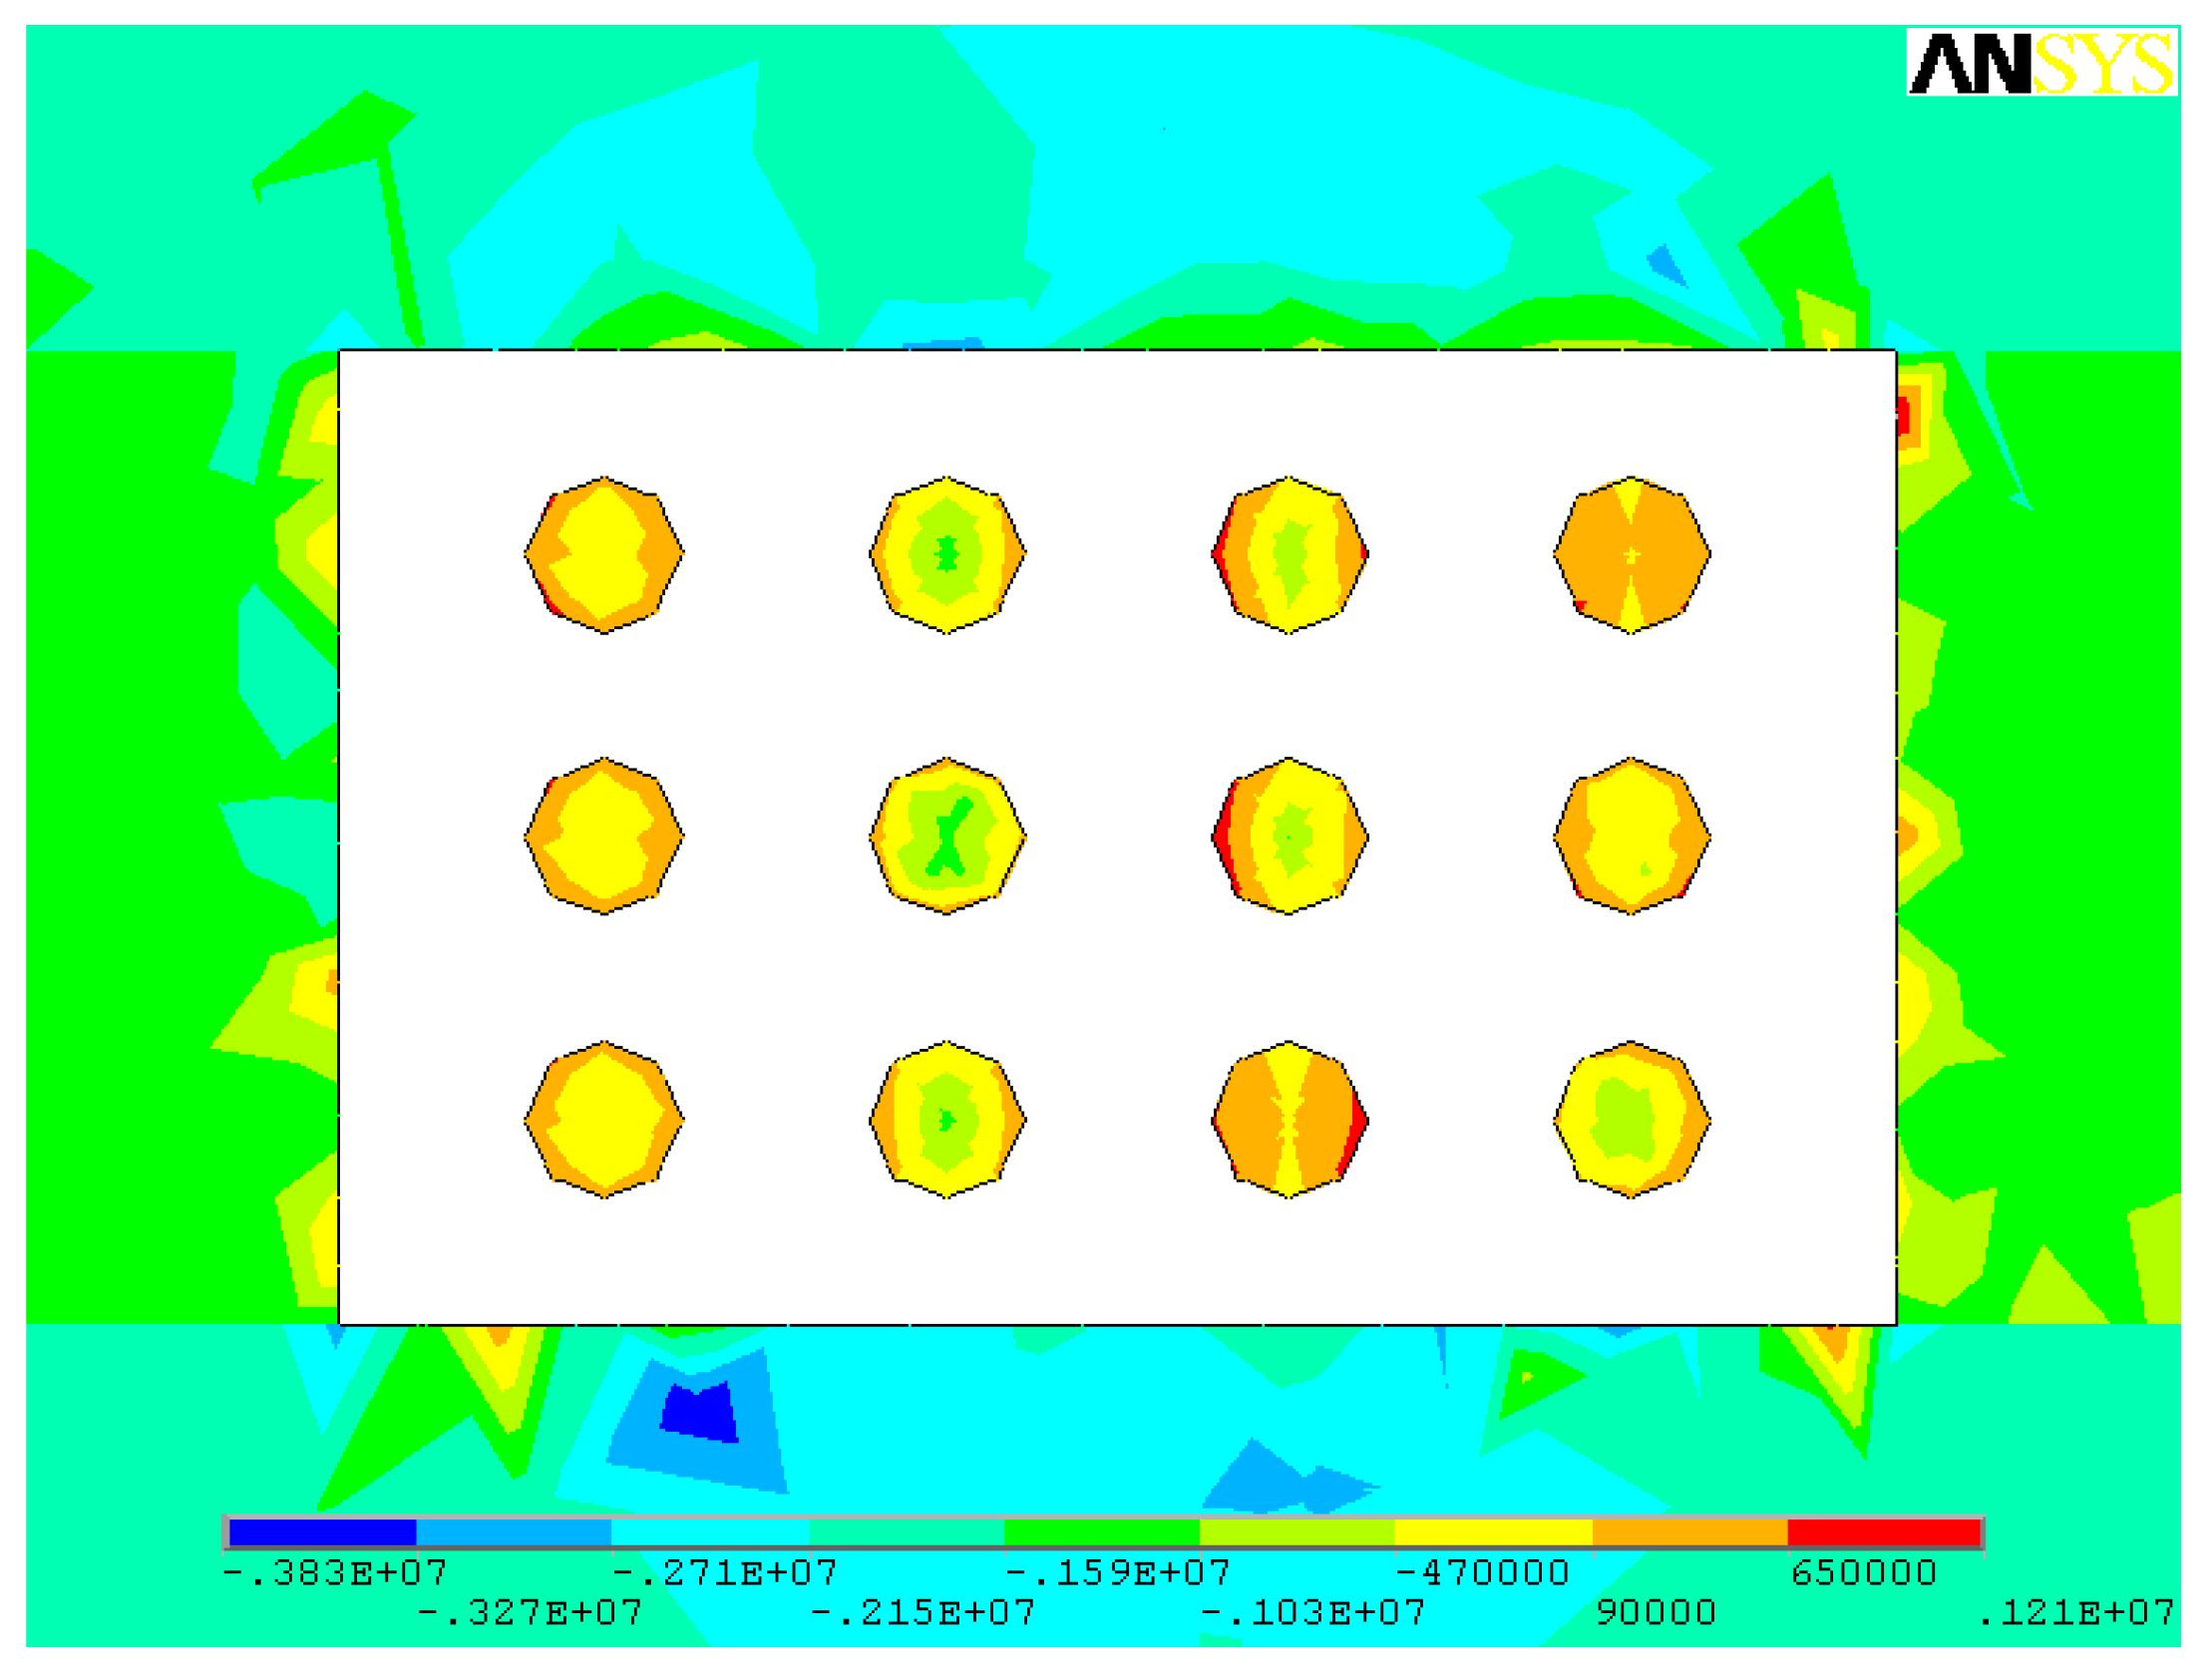
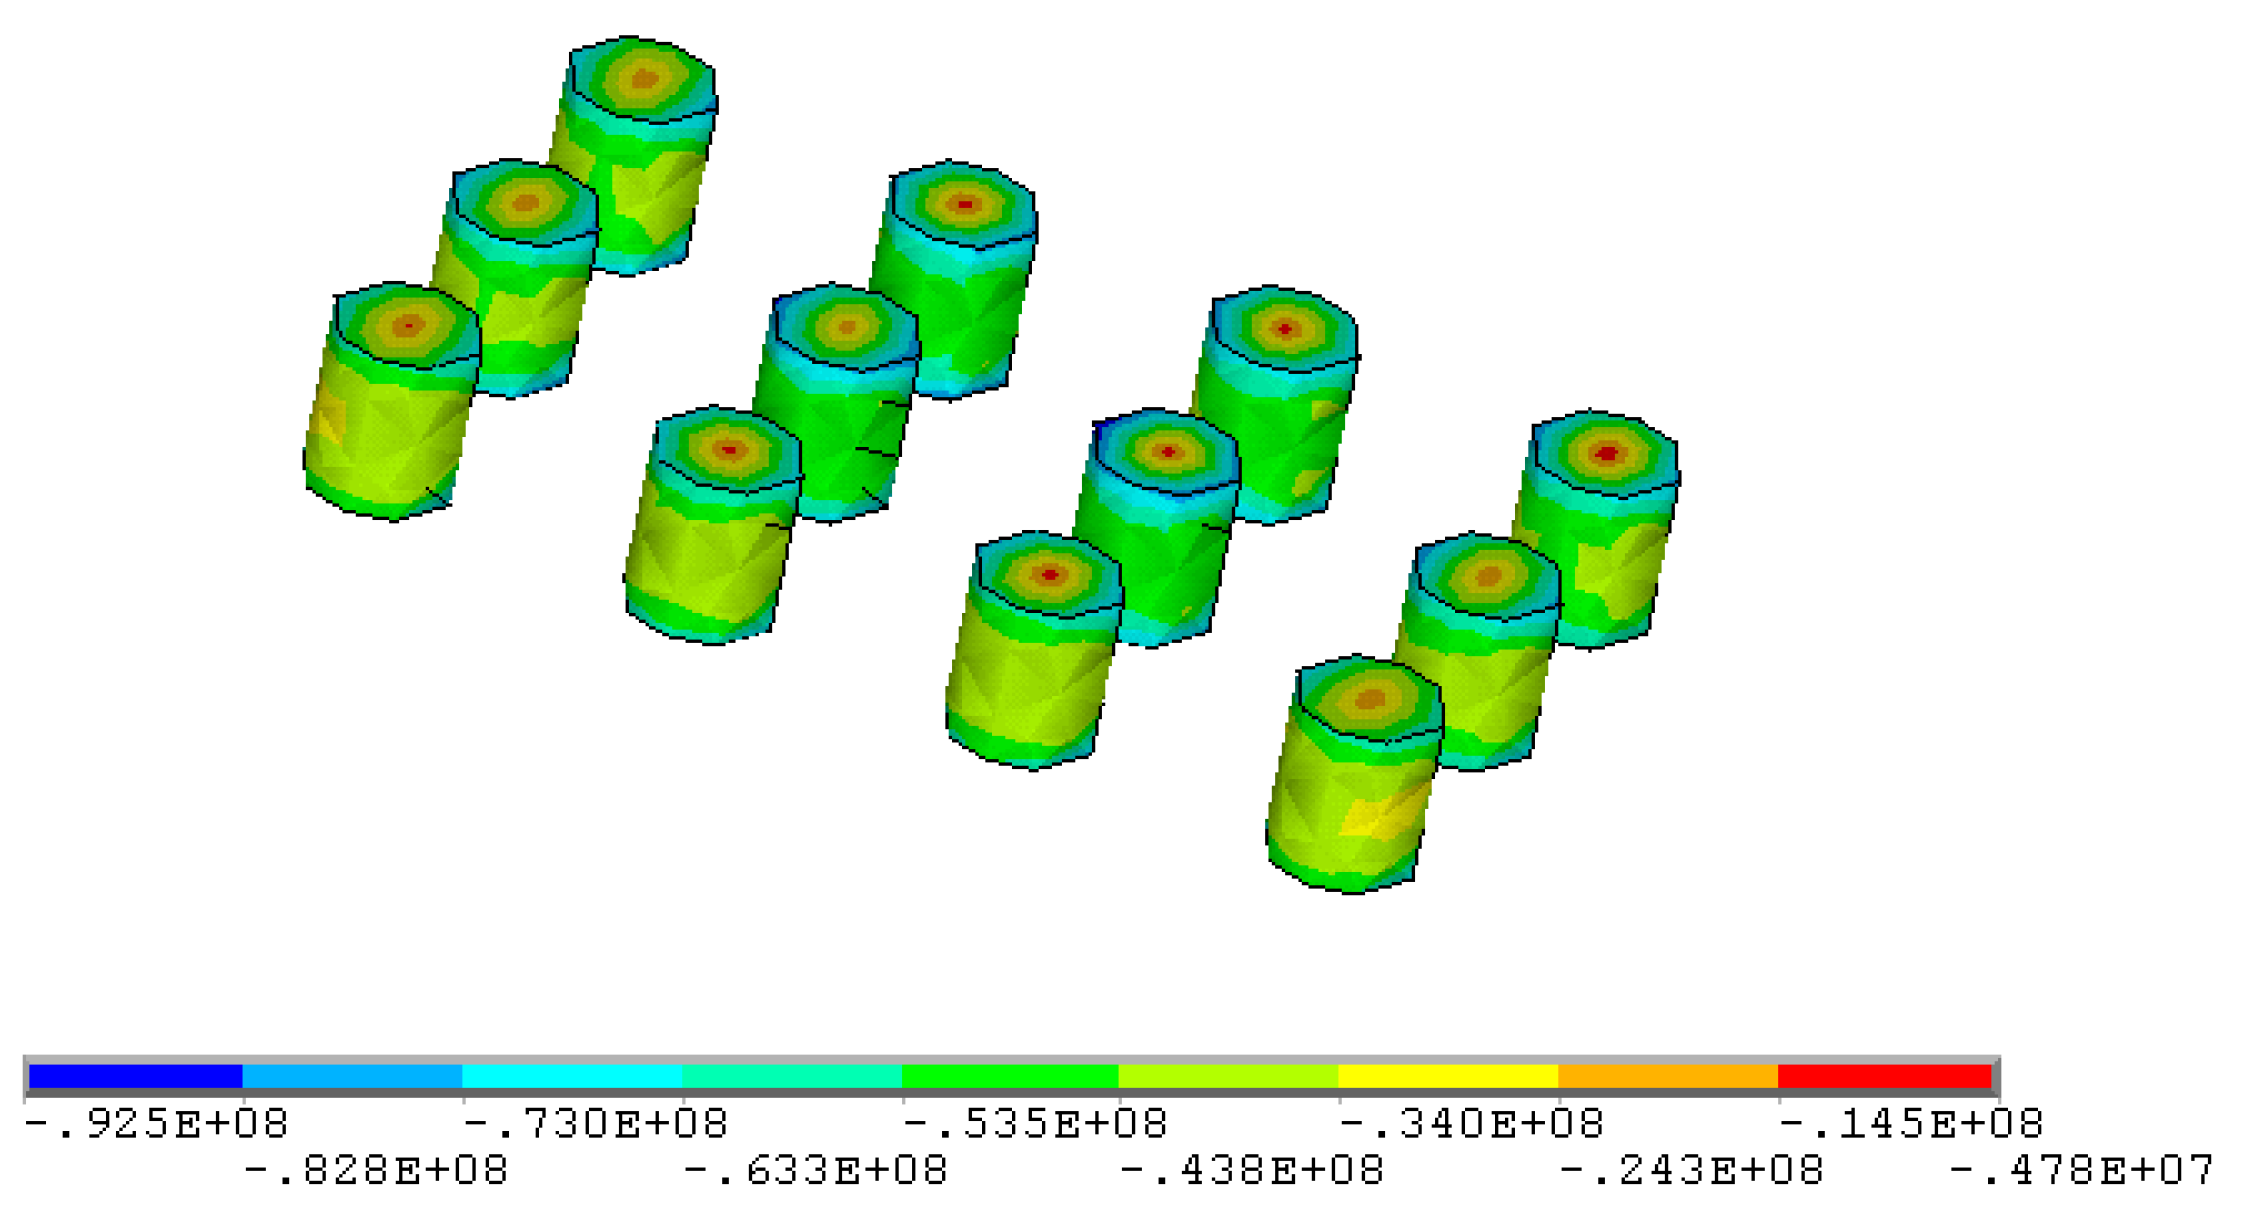
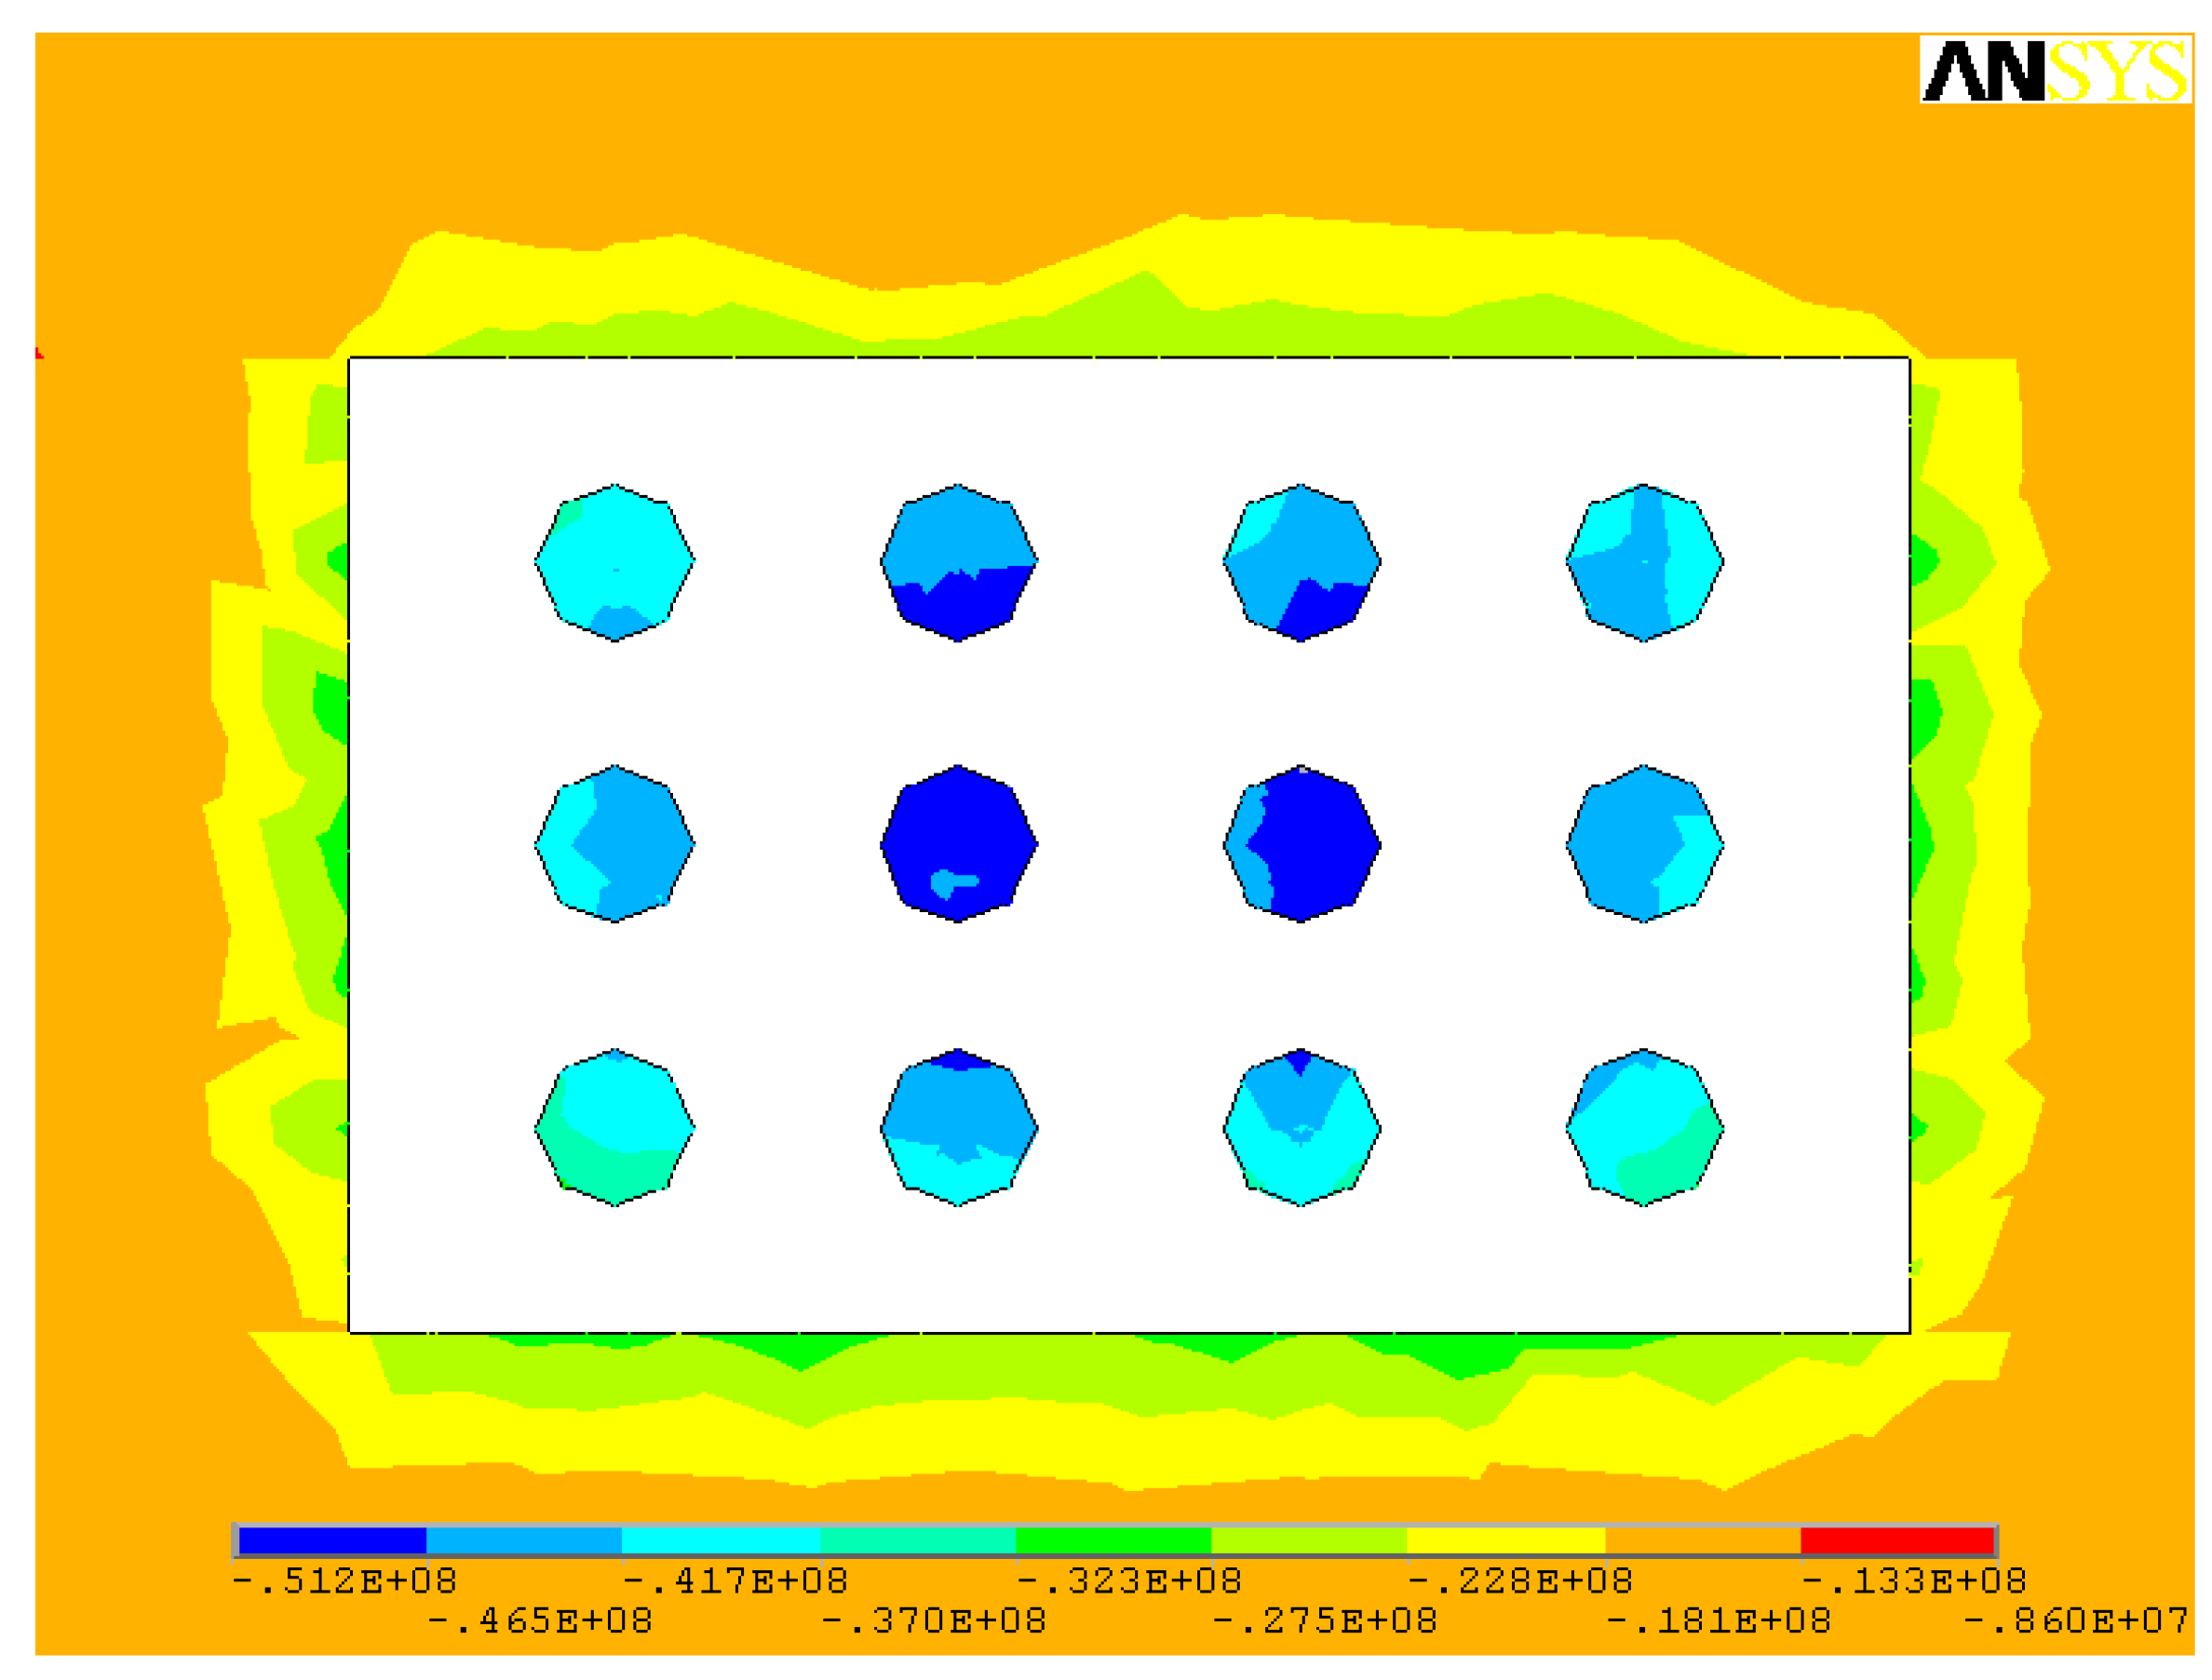
- When open stoping is applied to gently inclined medium-thick ore body, pillars are less affected by shear stress, and shear stress contributes little to pillar failure; the tensile stresses mainly occur in the middle of the pillars and within stope roofs and floors. Pillars mainly suffer compressive stress, especially the compressive stress concentrations that are prone to occur to the junction of the pillars, stope side walls, as well as roofs and floors.
- 3.
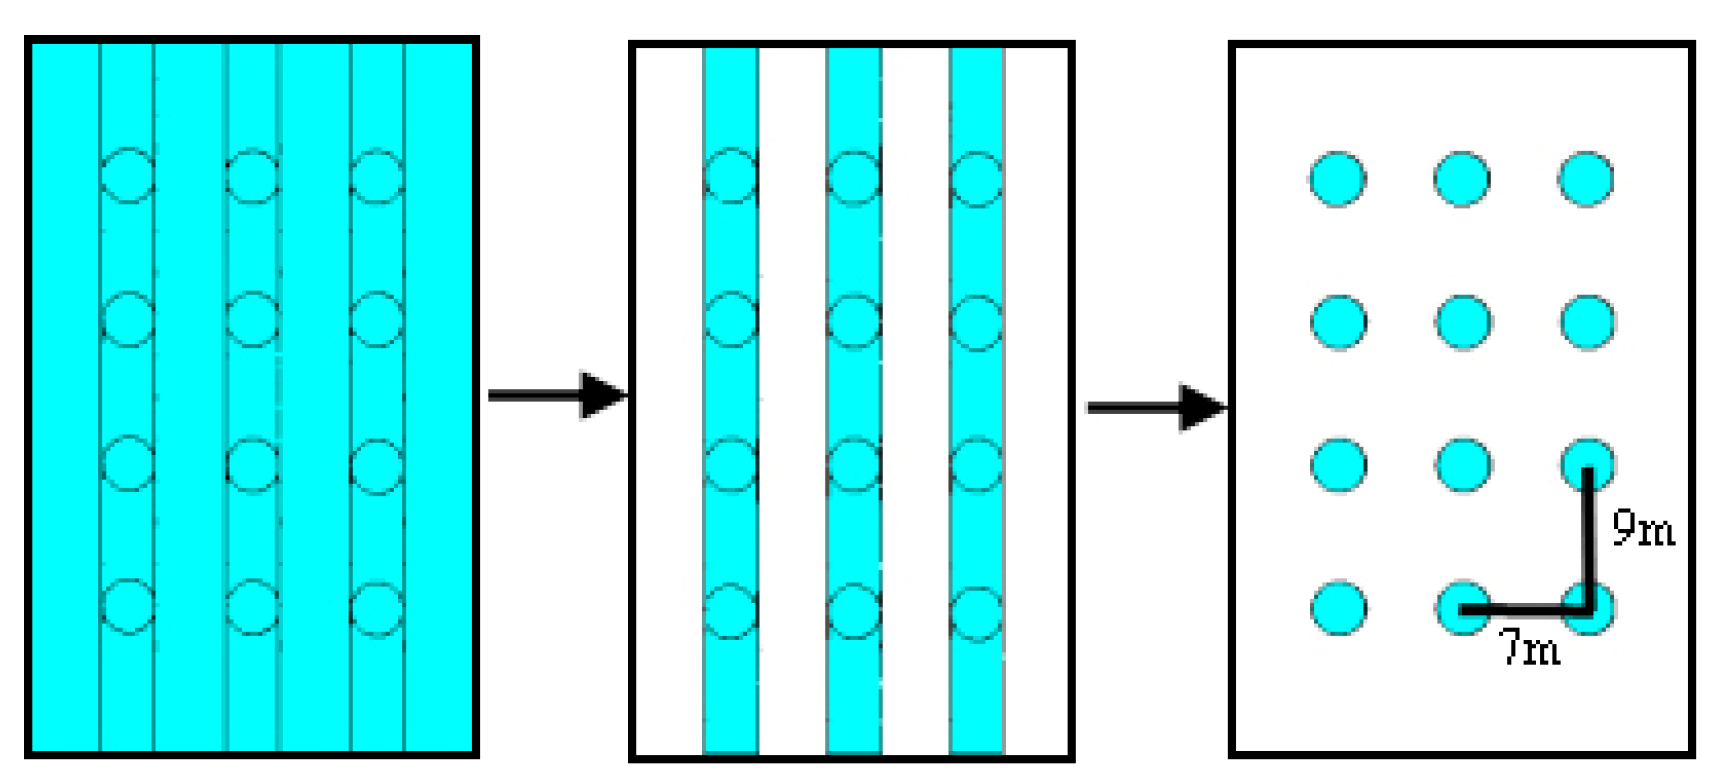
- The optimal structural parameters of the room and pillar method for the gently inclined medium-thick ore body are: stope height 4.5 m, pillar diameter 4 m, pillar spacing 7 m, and pillar row spacing 8 m. The onsite mining trial show that the optimized parameters are beneficial to realize the equilibrium of safety and economy, while the ore recovery rate reaches 82%.
Author Contributions
Funding
Data Availability Statement
Conflicts of Interest
References
- Guo, Q.Q.; Yu, H.X.; Dan, Z.Y.; Li, S. Mining method optimization of gently inclined and soft broken complex ore body based on ahp and topsis: Taking miao-ling gold mine of china as an example. Sustainability 2021, 13, 12503. [Google Scholar] [CrossRef]
- Wu, J. Research on sublevel open stoping recovery processes of inclined medium-thick orebody on the basis of physical simulation experiments. PLoS ONE 2020, 15, e0232640. [Google Scholar] [CrossRef] [PubMed]
- Li, X.S.; Wang, Y.M.; Yang, S.; Xiong, J.; Zhao, K. Research progress in the mining technology of the slowly inclined, thin to medium thick phosphate rock transition from open-pit to underground mine. Appl. Math. Nonlinear Sci. 2021, 6, 319–334. [Google Scholar] [CrossRef]
- Ge, Q.F.; Sun, X.S.; Zhu, W.G.; Chen, Q.G. Research of mining method for difficult-to-mine ore bodies in deep mine. Adv. Mater. Res. 2014, 962–965, 1041–1046. [Google Scholar] [CrossRef]
- Serrano, A.; Olalla, C. Ultimate bearing capacity of rock masses. Int. J. Rock Mech. Min. Sci. Geomech. Abstr. 1994, 31, 93–106. [Google Scholar] [CrossRef]
- Bazaluk, O.; Petlovanyi, M.; Zubko, S.; Lozynskyi, V.; Sai, K. Instability Assessment of Hanging Wall Rocks during Underground Mining of Iron Ores. Minerals 2021, 11, 858. [Google Scholar] [CrossRef]
- Wu, A.X.; Huang, M.Q.; Han, B.; Wang, Y.M.; Yu, S.F.; Miao, X.X. Orthogonal design and numerical simulation of room and pillar configurations in fractured stopes. J. Cent. South Univ. 2014, 21, 3338–3344. [Google Scholar] [CrossRef]
- Mikaeil, R.; Bakhshinezhad, H.; Haghshenas, S.S.; Ataei, M. Stability Analysis of Tunnel Support Systems Using Numerical and Intelligent Simulations (Case Study: Kouhin Tunnel of Qazvin-Rasht Railway). Rud.-Geološko-Naft. Zb. 2019, 34, 1–10. [Google Scholar] [CrossRef] [Green Version]
- Zhao, K.; Wang, Q.; Li, Q.; Yan, Y.J.; Yu, X.; Wang, J.Q.; Cao, S. Optimization calculation of stope structure parameters based on mathews stabilization graph method. J. Vibroeng. 2019, 21, 1227–1239. [Google Scholar]
- Qin, X.S.; Cao, H.; Wang, Z.X.; Zheng, Z.J. Analysis on safe thickness of the horizontal separation pillar in the upward horizontal slicing and filling method. IOP Conf. Ser. Earth Environ. Sci. 2021, 861, 052051. [Google Scholar] [CrossRef]
- Lan, M.; Liu, Z.; Li, X. Multi-objective optimization and multi-attribute decision making on structural parameters of stage backfilling stope. J. Cent. South Univ. 2019, 50, 375–383. [Google Scholar]
- Liu, D.; Shao, A.; Jin, C.; Ding, C.; Fan, F. Numerical model building for broken ore body and optimization of stope structural parameters. J. Cent. South Univ. 2019, 50, 437–444. [Google Scholar]
- Qin, X.S.; Cao, H.; Guo, L.J. Sensitivity analysis of factors influencing pillar stability in the deep stope of underground salt mine. IOP Conf. Ser. Earth Environ. Sci. 2020, 570, 022002. [Google Scholar] [CrossRef]
- Yao, G.H.; Wu, A.X.; Wang, Y.M. Stability analysis of stope retention pillars in broken rock conditions. J. Univ. Sci. Technol. Beijing 2011, 33, 400–405. [Google Scholar]
- Ma, M.H.; Guo, Q.F.; Pan, J.L.; Ma, C.; Cai, M.F. Optimal Support Solution for a Soft Rock Roadway Based on the Drucker–Prager Yield Criteria. Minerals 2022, 12, 1. [Google Scholar] [CrossRef]
- Drucker, D.C.; Prager, W. Soil mechanics and plastic analysis or limit design. Quart. Appl. Math. 1952, 10, 157–165. [Google Scholar] [CrossRef] [Green Version]


| Ore Rock Type | σc /MPa | σt /MPa | τ /MPa | c /MPa | φ /(°) | E /GPa | ρ /g·cm−3 | μ |
|---|---|---|---|---|---|---|---|---|
| Argillaceous Limestone | 58.30 | 3.76 | 36.81 | 3.47 | 28.38 | 9.37 | 2.74 | 0.25 |
| Mudstone | 35.42 | 1.99 | 30.64 | 1.14 | 17.79 | 4.51 | 2.79 | 0.19 |
| Siltstone | 77.14 | 2.78 | 37.57 | 4.08 | 35.97 | 14.88 | 2.64 | 0.27 |
| Ore body | 97.62 | 2.07 | 50.86 | 6.58 | 42.93 | 12.60 | 4.00 | 0.22 |
| No. | Stress Parameter | Step 1 (Before Mining) | Step 2 (Mining Strip Rooms) | Step 3 (Mining Strip Pillars) |
|---|---|---|---|---|
| 1 | σ1 (MPa) | −1.84~−0.49 | −14.2~4.68 | −26.0~4.42 |
| 2 | σ2 (MPa) | −2.07~−0.98 | −16.3~−1.3 | −36.4~1.41 |
| 3 | σ3 (MPa) | −16.4~−12.5 | −68.5~−16.4 | −142.0~−10.9 |
| 4 | τxy (MPa) | −0.15~0.12 | −1.70~−1.54 | −9.48~9.63 |
| 5 | τyz (MPa) | −0.67~0.70 | −21.7~22.9 | −25.3~25.8 |
| 6 | τzx (MPa) | −0.007~0.177 | 2.16~2.83 | −32.3~34.7 |
| Factor | Stope Height/m | Pillar Diameter/m | Pillar Spacing/m | Pillar Row Spacing/m | |
|---|---|---|---|---|---|
| Scheme | |||||
| 1 | 2.5 | 2 | 4 | 6 | |
| 2 | 2.5 | 3 | 6 | 8 | |
| 3 | 2.5 | 4 | 8 | 10 | |
| 4 | 3.5 | 2 | 5 | 8 | |
| 5 | 3.5 | 3 | 7 | 7 | |
| 6 | 3.5 | 4 | 6 | 9 | |
| 7 | 4.5 | 2 | 6 | 7 | |
| 8 | 4.5 | 3 | 5 | 9 | |
| 9 | 4.5 | 4 | 7 | 8 | |
| No. | Stress Parameter | Scheme 1 | Scheme 2 | Scheme 3 |
|---|---|---|---|---|
| 2 m × 4 m × 6 m | 3 m × 6 m × 8 m | 4 m × 8 m × 10 m | ||
| 1 | σ1/MPa | −25.6~5.83 | −20.3~4.04 | −19.6~4.33 |
| 2 | σ3/MPa | −143.0~−1.98 | −118.0~−6.25 | −123.0~−6.22 |
| 3 | τxz/MPa | −33.7~36.3 | −27.9~27.4 | −28.0~25.0 |
| No. | Stress Parameter | Scheme 4 | Scheme 5 | Scheme 6 |
|---|---|---|---|---|
| 2 m × 5 m × 8 m | 3 m × 7 m × 7 m | 4 m × 6 m × 9 m | ||
| 1 | σ1/MPa | −24.6~4.96 | −17.9~4.34 | −14.4~3.18 |
| 2 | σ3/MPa | −155.0~−1.08 | −123.0~−3.91 | −86.8~−6.46 |
| 3 | τxz/MPa | −39.9~37.3 | −28.0~27.2 | −19.6~19.6 |
| No. | Stress Parameter | Scheme 7 | Scheme 8 | Scheme 9 |
|---|---|---|---|---|
| 2 m × 6 m × 7 m | 3 m × 5 m × 9 m | 4 m × 7 m × 8 m | ||
| 1 | σ1/MPa | −25.3~6.01 | −19.3~4.61 | −16.3~3.89 |
| 2 | σ3/MPa | −155.0~−1.1 | −113.0~−2.68 | −92.5~−4.78 |
| 3 | τxz/MPa | −35.3~37.8 | −27.6~28.3 | −20.6~21.0 |
Publisher’s Note: MDPI stays neutral with regard to jurisdictional claims in published maps and institutional affiliations. |
© 2022 by the authors. Licensee MDPI, Basel, Switzerland. This article is an open access article distributed under the terms and conditions of the Creative Commons Attribution (CC BY) license (https://creativecommons.org/licenses/by/4.0/).
Share and Cite
Qiu, H.-Y.; Huang, M.-Q.; Weng, Y.-J. Stability Evaluation and Structural Parameters Optimization of Stope Based on Area Bearing Theory. Minerals 2022, 12, 808. https://doi.org/10.3390/min12070808
Qiu H-Y, Huang M-Q, Weng Y-J. Stability Evaluation and Structural Parameters Optimization of Stope Based on Area Bearing Theory. Minerals. 2022; 12(7):808. https://doi.org/10.3390/min12070808
Chicago/Turabian StyleQiu, Hao-Yu, Ming-Qing Huang, and Ya-Jie Weng. 2022. "Stability Evaluation and Structural Parameters Optimization of Stope Based on Area Bearing Theory" Minerals 12, no. 7: 808. https://doi.org/10.3390/min12070808
APA StyleQiu, H.-Y., Huang, M.-Q., & Weng, Y.-J. (2022). Stability Evaluation and Structural Parameters Optimization of Stope Based on Area Bearing Theory. Minerals, 12(7), 808. https://doi.org/10.3390/min12070808