Article

A Novel Method for Conducting a Geoenvironmental Assessment of Undiscovered ISR-Amenable Uranium Resources: Proof-of-Concept in the Texas Coastal Plain

1
Geology, Energy and Minerals Science Center, U.S. Geological Survey, Reston, VA 20192, USA
2
Oklahoma-Texas Water Science Center, U.S. Geological Survey, Austin, TX 78754, USA
3
Colorado Science Center, U.S. Geological Survey, Denver, CO 80225, USA
4
New Mexico Water Science Center, U.S. Geological Survey, Albuquerque, NM 87113, USA
5
Geology, Geochemistry and Geophysics Science Center, U.S. Geological Survey, Geology, Denver, CO 80225, USA
*
Author to whom correspondence should be addressed.
Current affiliation: Mineral Resources Program, U.S. Geological Survey, Albuquerque, NM 87113, USA.
Current affiliation: International Boundary & Water Commission, El Paso, TX 79902, USA.
§
Now retired.
Minerals 2022, 12(6), 747; https://doi.org/10.3390/min12060747
Submission received: 25 March 2022 / Revised: 19 May 2022 / Accepted: 2 June 2022 / Published: 12 June 2022
(This article belongs to the Special Issue Environmentally Sound In-Situ Recovery Mining of Uranium)

Abstract

:
A geoenvironmental assessment methodology was developed to estimate waste quantities and disturbances that could be associated with the extraction of undiscovered uranium resources and identify areas on the landscape where uranium and other constituents of potential concern (COPCs) that may co-occur with uranium deposits in this region are likely to persist, if introduced into the environment. Prior to this work, a method was lacking to quantitively assess the environmental aspects associated with potential development of undiscovered uranium resources at a scale of a uranium resource assessment. The mining method of in situ recovery (ISR) was historically used to extract uranium from deposits in the Goliad Sand of the Texas Coastal Plain. For this reason, the study’s methodology projected the following types of wastes and disturbances commonly associated with ISR based on historical ISR mining records: the mine area, affected aquifer volume, mine pore volume, water pumped and disposed during uranium extraction and restoration, and radon emissions. Within the tract permissive for the occurrence of undiscovered uranium resources, maps and statistics of factors were derived that indicate the potential contaminant pathways. The percentage of days meeting the criteria for air stagnation indicate the potential for radon accumulation; the geochemical mobility of COPCs in groundwater in combination with effective recharge indicates the potential for infiltration of surface-derived COPCs; the geochemical mobility of COPCs in groundwater combined with hydraulic conductivity indicates the propensity for transmitting fluids away from contaminated or mined aquifers; and finally, geochemical mobility of COPCs in surface water combined with the factor for climatic erosivity (R factor) indicates the potential for COPCs to persist in surface waters due to runoff. This work resulted in a new methodology that can be applied to any undiscovered mineral resource to better understand possible wastes and disturbances associated with extraction and identify areas on the landscape where COPCs are likely to persist.

1. Introduction

An assessment of undiscovered uranium resources hosted in Tertiary sedimentary sequences of the Texas Coastal Plain estimated 37 probable deposits and about 33,000 t of contained U3O8 within the permissive tract, consisting of the Pliocene Goliad Sand, the Pleistocene Willis Sand, and the Lissie Formation (Figure 1) [1]. The permissive tract is a region that is geologically or hydrologically permissive for the occurrence of uranium deposits. The availability of uranium resources for development in the future, however, is not only dependent upon the existence of the uranium resource, but how societies choose to either use uranium resources or refrain from their development. Decisions on whether to develop uranium resources could be influenced by environmental changes to air, land, and water from extraction [2]. As such, it is necessary to identify the potential environmental effects of mining the uranium deposits. Depending on the deposit type, mining technique, and ore processing methods, the environmental effects may or may not occur when the uranium is “developed” or extracted during mining and possibly milling. Predicting the potential environmental effects is challenging because the occurrence and extent of environmental effects depend, in part, on several site-specific factors related to the uranium deposit, such as the intrinsic geology, climate and hydrological settings, as well as the mine and restoration design, and management practices. These factors are usually unknown and not provided as part of a traditional undiscovered uranium resource assessment but can be generalized in a regional sense.
In the absence of site-specific information, a geoenvironmental assessment may serve as an alternative to attempting to predict the potential environmental effects of future mining [3]. A geoenvironmental assessment provides information about the inherent attributes that might be associated with potential uranium deposits and how those attributes may influence or be influenced by the environment, if and when uranium extraction occurs [3]. This type of information could potentially be used to reduce the scale of adverse effects and minimize the time, cost, and effort expended on control, monitoring, and containment of potential environmental contaminants [4]. For example, uranium deposits designated for production that have the ability to create acidic waters may have distinctive environmental differences when mined compared to uranium deposit types with no acid-generating capacity [5], or that contain gangue minerals having a high potential for acid neutralization or a natural attenuation of trace contaminants (such as arsenic) and radionuclides (such as uranium, radium, and radon). Because the costs of mine closure and reclamation constitute a noteworthy portion of overall mining costs, deposits that can be mined in a manner that produces less waste, uses less water, or disturbs as little of the land as possible may have distinct economic and environmental advantages over deposits that yield large amounts of waste, use large amounts of water, or disturb large areas of land [5].
To enhance our understanding of how to possibly mitigate, minimize, and (or) avoid potential environmental effects of future development of undiscovered uranium deposits, a framework and approach for conducting a geoenvironmental assessment was developed [3]. The premise of this geoenvironmental assessment framework was to provide an approach to understand the likely amounts of wastewater, waste rock, tailings, radon, and land disturbance associated with undiscovered uranium deposits [5] and identify locations where constituents of concern are inherently likely to persist on the landscape. This framework is based on a source-to-receptor conceptual model (Figure 2). The geoenvironmental framework suggests that the type of mining determines which waste products are most likely to occur. Furthermore, the potential for contaminant pathways can be evaluated to determine the climatic, hydrogeologic, and geochemical factors that could influence the potential for the persistence of constituents of potential concern (COPCs) in air, soil, groundwater, and surface water [3]. This framework is transparent and, in theory, can be applied to potentially understand water and land use requirements needed for uranium extraction as well as highlight areas in the environment that are most vulnerable to the persistence of contaminants. The likelihood of contaminant migration from the mine-related water and waste rock is based on several factors: (1) the deposit type and its geologic characteristics; (2) likely mining methods within the permissive tract; (3) the types and quantities of wastes generally associated with the likely mining method; (4) the intrinsic regional geology, hydrology and climate, including weathering effects, coupled with (5) the potential of the environmental media (water, soil, and air) for enhancing the concentration, release or mobilization of the constituents of concern. The geoenvironmental framework has not been previously tested or applied to an undiscovered uranium resource assessment and, therefore, a proof-of-concept is needed to demonstrate how existing datasets can be used to conduct a geoenvironmental assessment on a regional scale to yield quantitative results.
The goal of this study is to identify and determine how existing data can be used to conduct a geoenvironmental assessment of undiscovered uranium resources reported in the resource assessment of the Goliad Sand, Willis Sand, and Lissie Formation in the Texas Coastal Plain. Specific objectives include developing quantitative methods to: (1) refine the conceptual source-to-receptor model for the Goliad/Willis/Lissie geoenvironmental assessment unit, (2) estimate the probable quantities of waste and disturbance (volumes of waste water, disturbed land areas, radon emissions, and extent of aquifer disturbance) associated with the extraction of undiscovered uranium resources of the roll front type; (3) identify COPCs; and (4) map and summarize the statistics of factors that indicate the potential for the contaminant pathways identified in the conceptual model.

2. Methods and Data

The geoenvironmental assessment consists of four steps, which are based on companion studies. First, the source-to-receptor conceptual model of the undiscovered uranium resources (Figure 2) is refined to identify and prioritize the most likely wastes and disturbances, contaminant pathways and constituents of potential concern (COPCs) specific to the study area (permissive tract) based on historical data. Second, the probable quantities of wastes and disturbances likely associated with development of the estimated undiscovered uranium resources according to the conceptual model are quantified. Third, frameworks are developed that summarize data indicating the intrinsic hydrogeologic, geochemical, and climatic factors that influence where constituents of concern are likely to persist based on the contaminant pathways outlined in the conceptual model. Fourth, the information from these companion studies is combined to create maps that identify areas of the landscape where COPCs are likely to persist based on the hydrogeologic, geochemical, and climatic framework that is specific to the likely contaminant pathways outlined in the conceptual model. Additionally, statistics are extracted of each of the spatial indicators or combinations of indicators that describe the potential for persistence of COPCs within the geoenvironmental assessment unit.

2.1. Conceptual Geoenvironmental Model

A conceptual model was developed based on reported publicly available data and information gathered on historical mining operations in permissive tracts. The conceptual model was then used to prioritize the most likely mining methods, waste types, historical quantities of waste, COPCs, contaminant pathways, and factors affecting the persistence of the COPCs (Figure 2).

2.2. Quantifying Probable Wastes

The quantities of mine area, exempted aquifer volume, affected aquifer volume, mine pore volume, water pumped and disposed during uranium extraction and restoration, and radon emissions from historical ISR operations in the Goliad Sand were identified [6]. The Willis Sand and Lissie Formation were not previously mined. Historical data normalized by U3O8 production are applied to estimates of undiscovered uranium resources in the resource assessment [1] to estimate wastes and disturbances for the most likely mining method, assuming they are similar to historical mining operations.

2.3. Hydrogeologic, Geochemical, and Climatic Framework

Geospatial data were identified that quantify the historical factors that indicate the climatic, geochemical, and hydrological conditions within the Goliad/Willis/Lissie assessment unit that influence the dispersion of COPCs. These factors include the most likely important contaminant transport pathways into air, land, and water that potentially lead to exposures throughout the life cycle of uranium mining and milling, according to the conceptual model. Geospatial analysis is conducted for the Goliad/Willis/Lissie assessment unit [1]. GIS overlays and maps were derived from previous publications by Blake et al. (geochemistry) [7], Reitz et al. (recharge) [8], Teeple et al. (hydraulic conductivity/transmissivity) [9,10], National Resource Conservation Service (R factor) [11], and Stengel et al. (air stagnation) [12].

2.4. Assessing Areas of Likely Persistence of Constituents of Concern

Geospatial data of the hydrogeologic, geochemical, and climatic factors (identified above) that indicate the potential for the persistence of constituents of concern in various environmental media (air, land, water) are combined and(or) mapped and their statistics analyzed within the permissive tract. The zonal statistics tool was then used to extract statistics for each embayment (Houston and Rio Grande) to create a summary table. This table corresponds to data illustrated in one- or two-factor maps that indicate the potential for the persistence of COPCs for the contaminant pathways evaluated in this demonstration.

3. Results

This work is intended to be a regional geoenvironmental assessment to match the scale of an undiscovered uranium resource assessment, therefore is not amenable to the local, site-specific scale of a mine location. This demonstration provides an example of how this method can be applied to compare geoenvironmental aspects between the Rio Grande Embayment and the Houston Embayment within the select permissive tract defined in a previous undiscovered uranium resource assessment of the Texas Coastal Plain (Figure 1) [1]. Together, the geographic areal extent of the permissive tract and the vertical extent of these formations and associated aquifers delineate the full extents of the study area. The geoenvironmental assessment results below highlight the input from the conceptual geoenvironmental model, the historical wastes and disturbances from historical mining, and the hydrogeologic, geochemical, and climatic frameworks in companion studies [6,7,9,12,13].

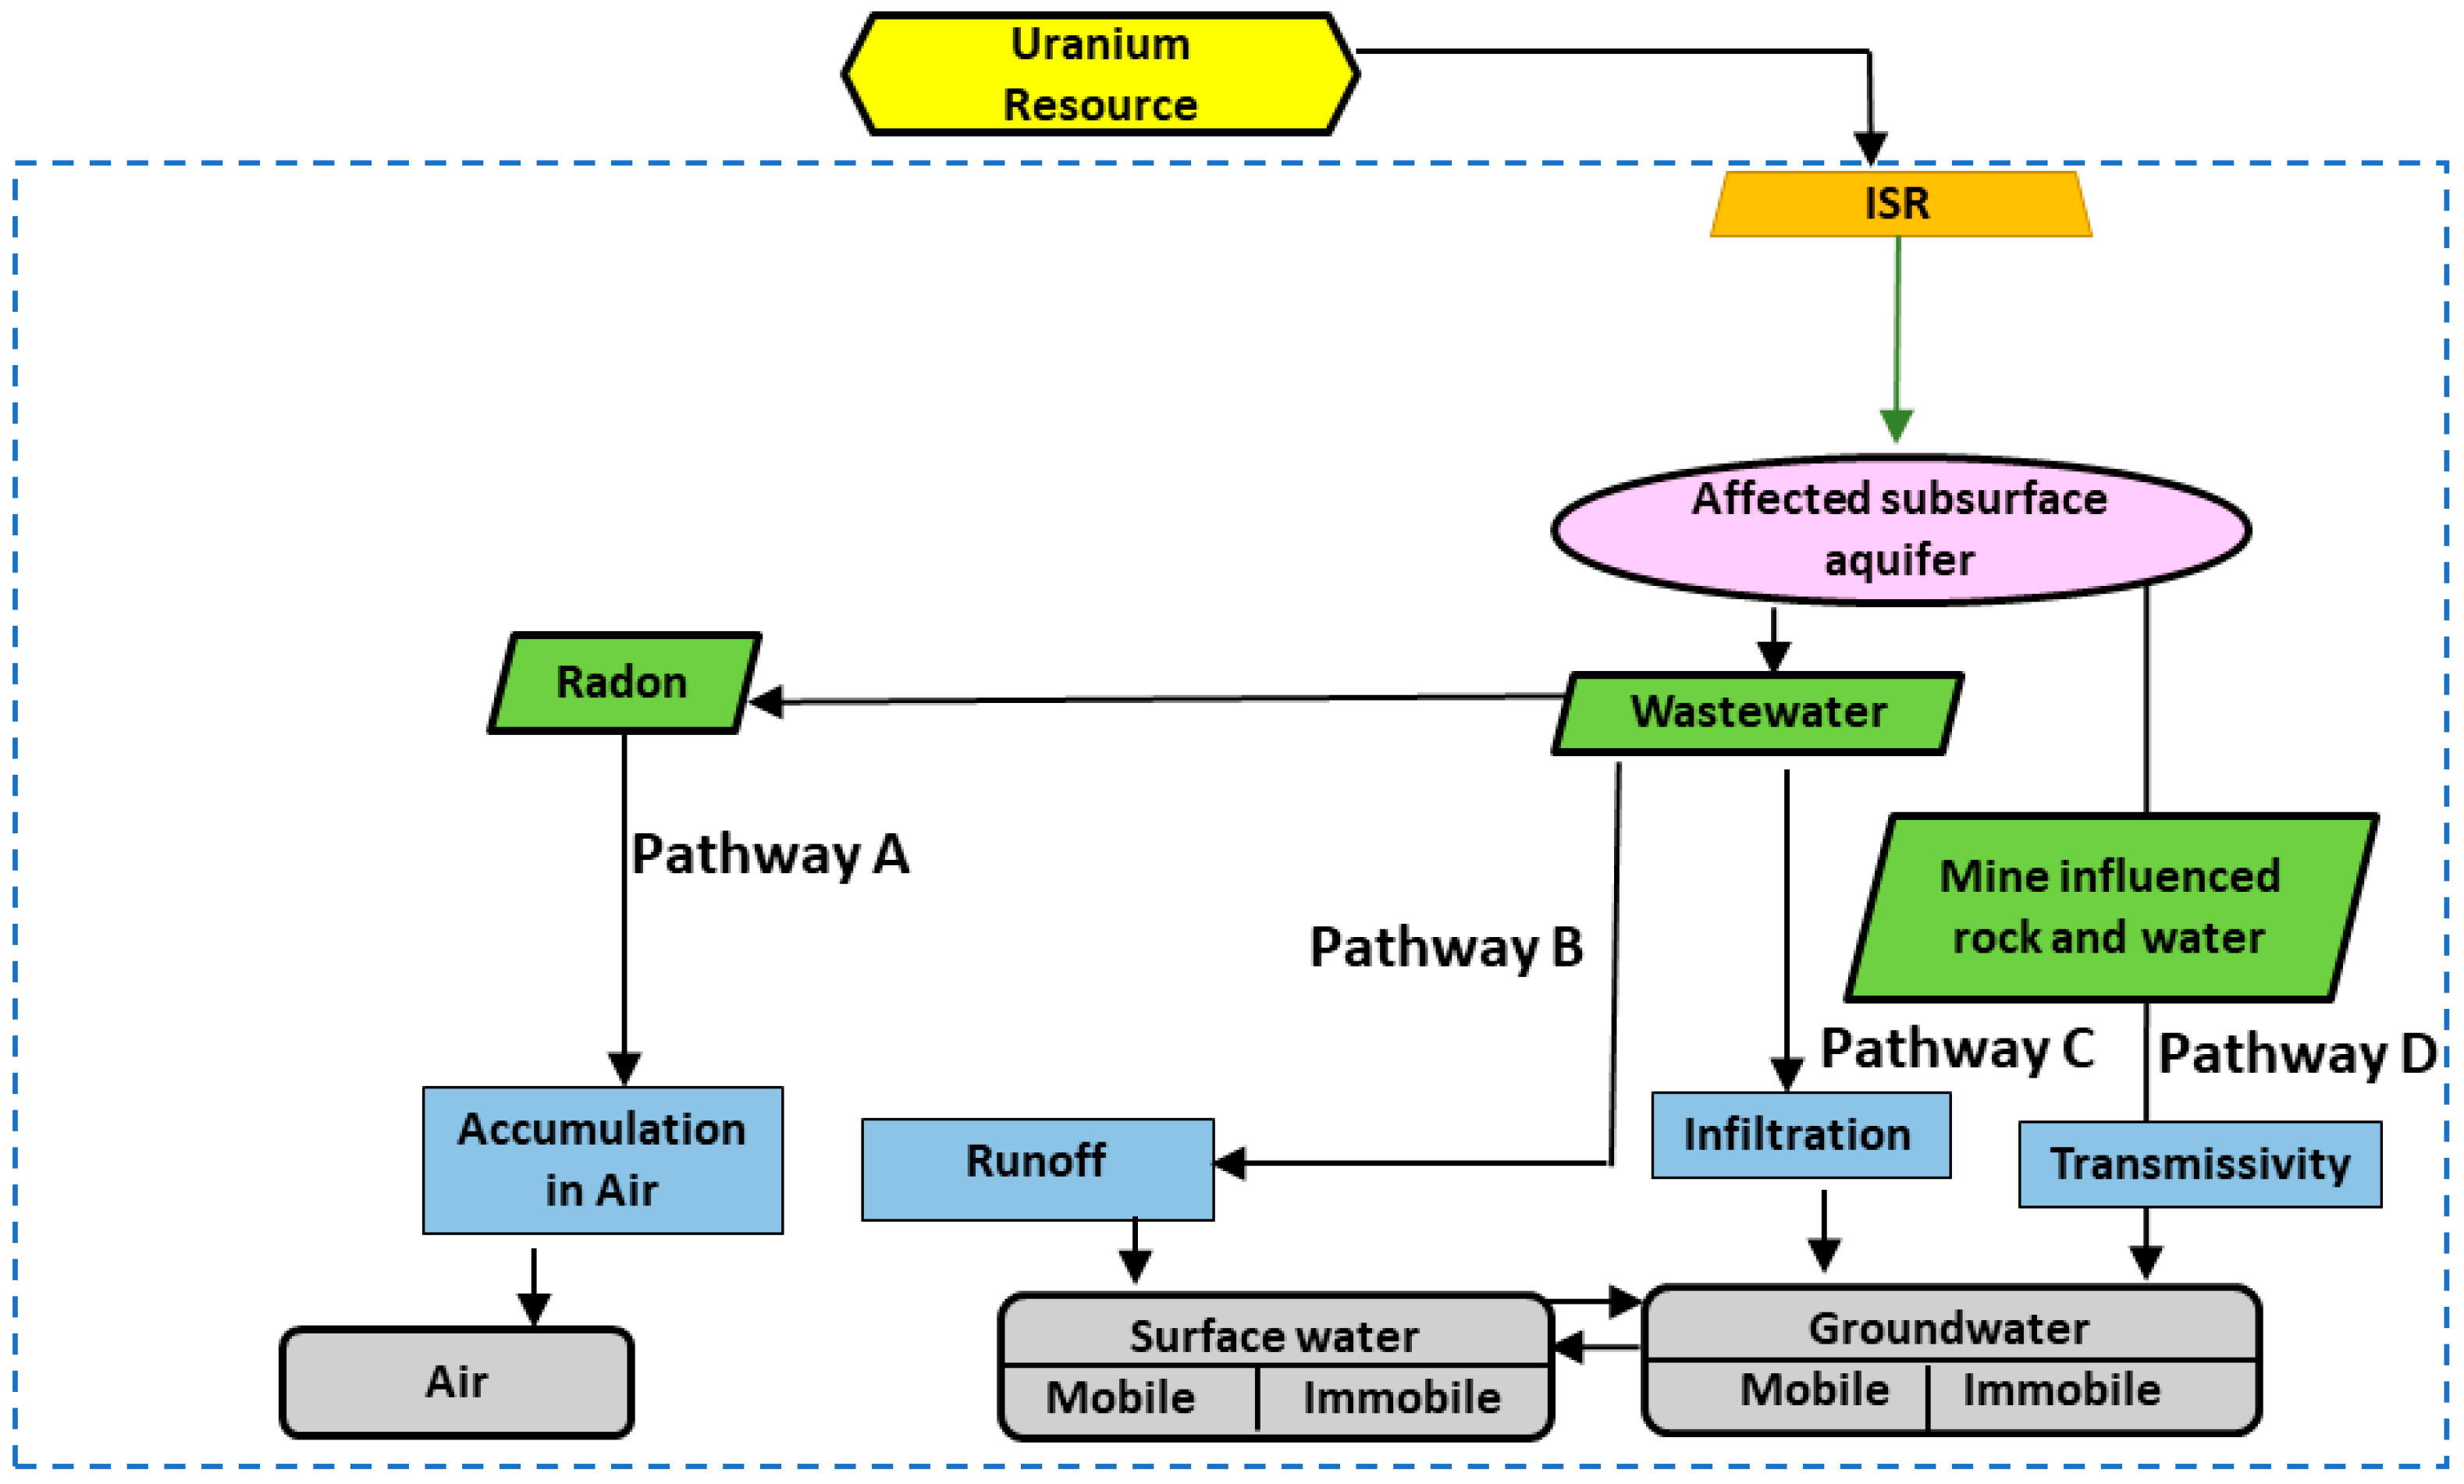
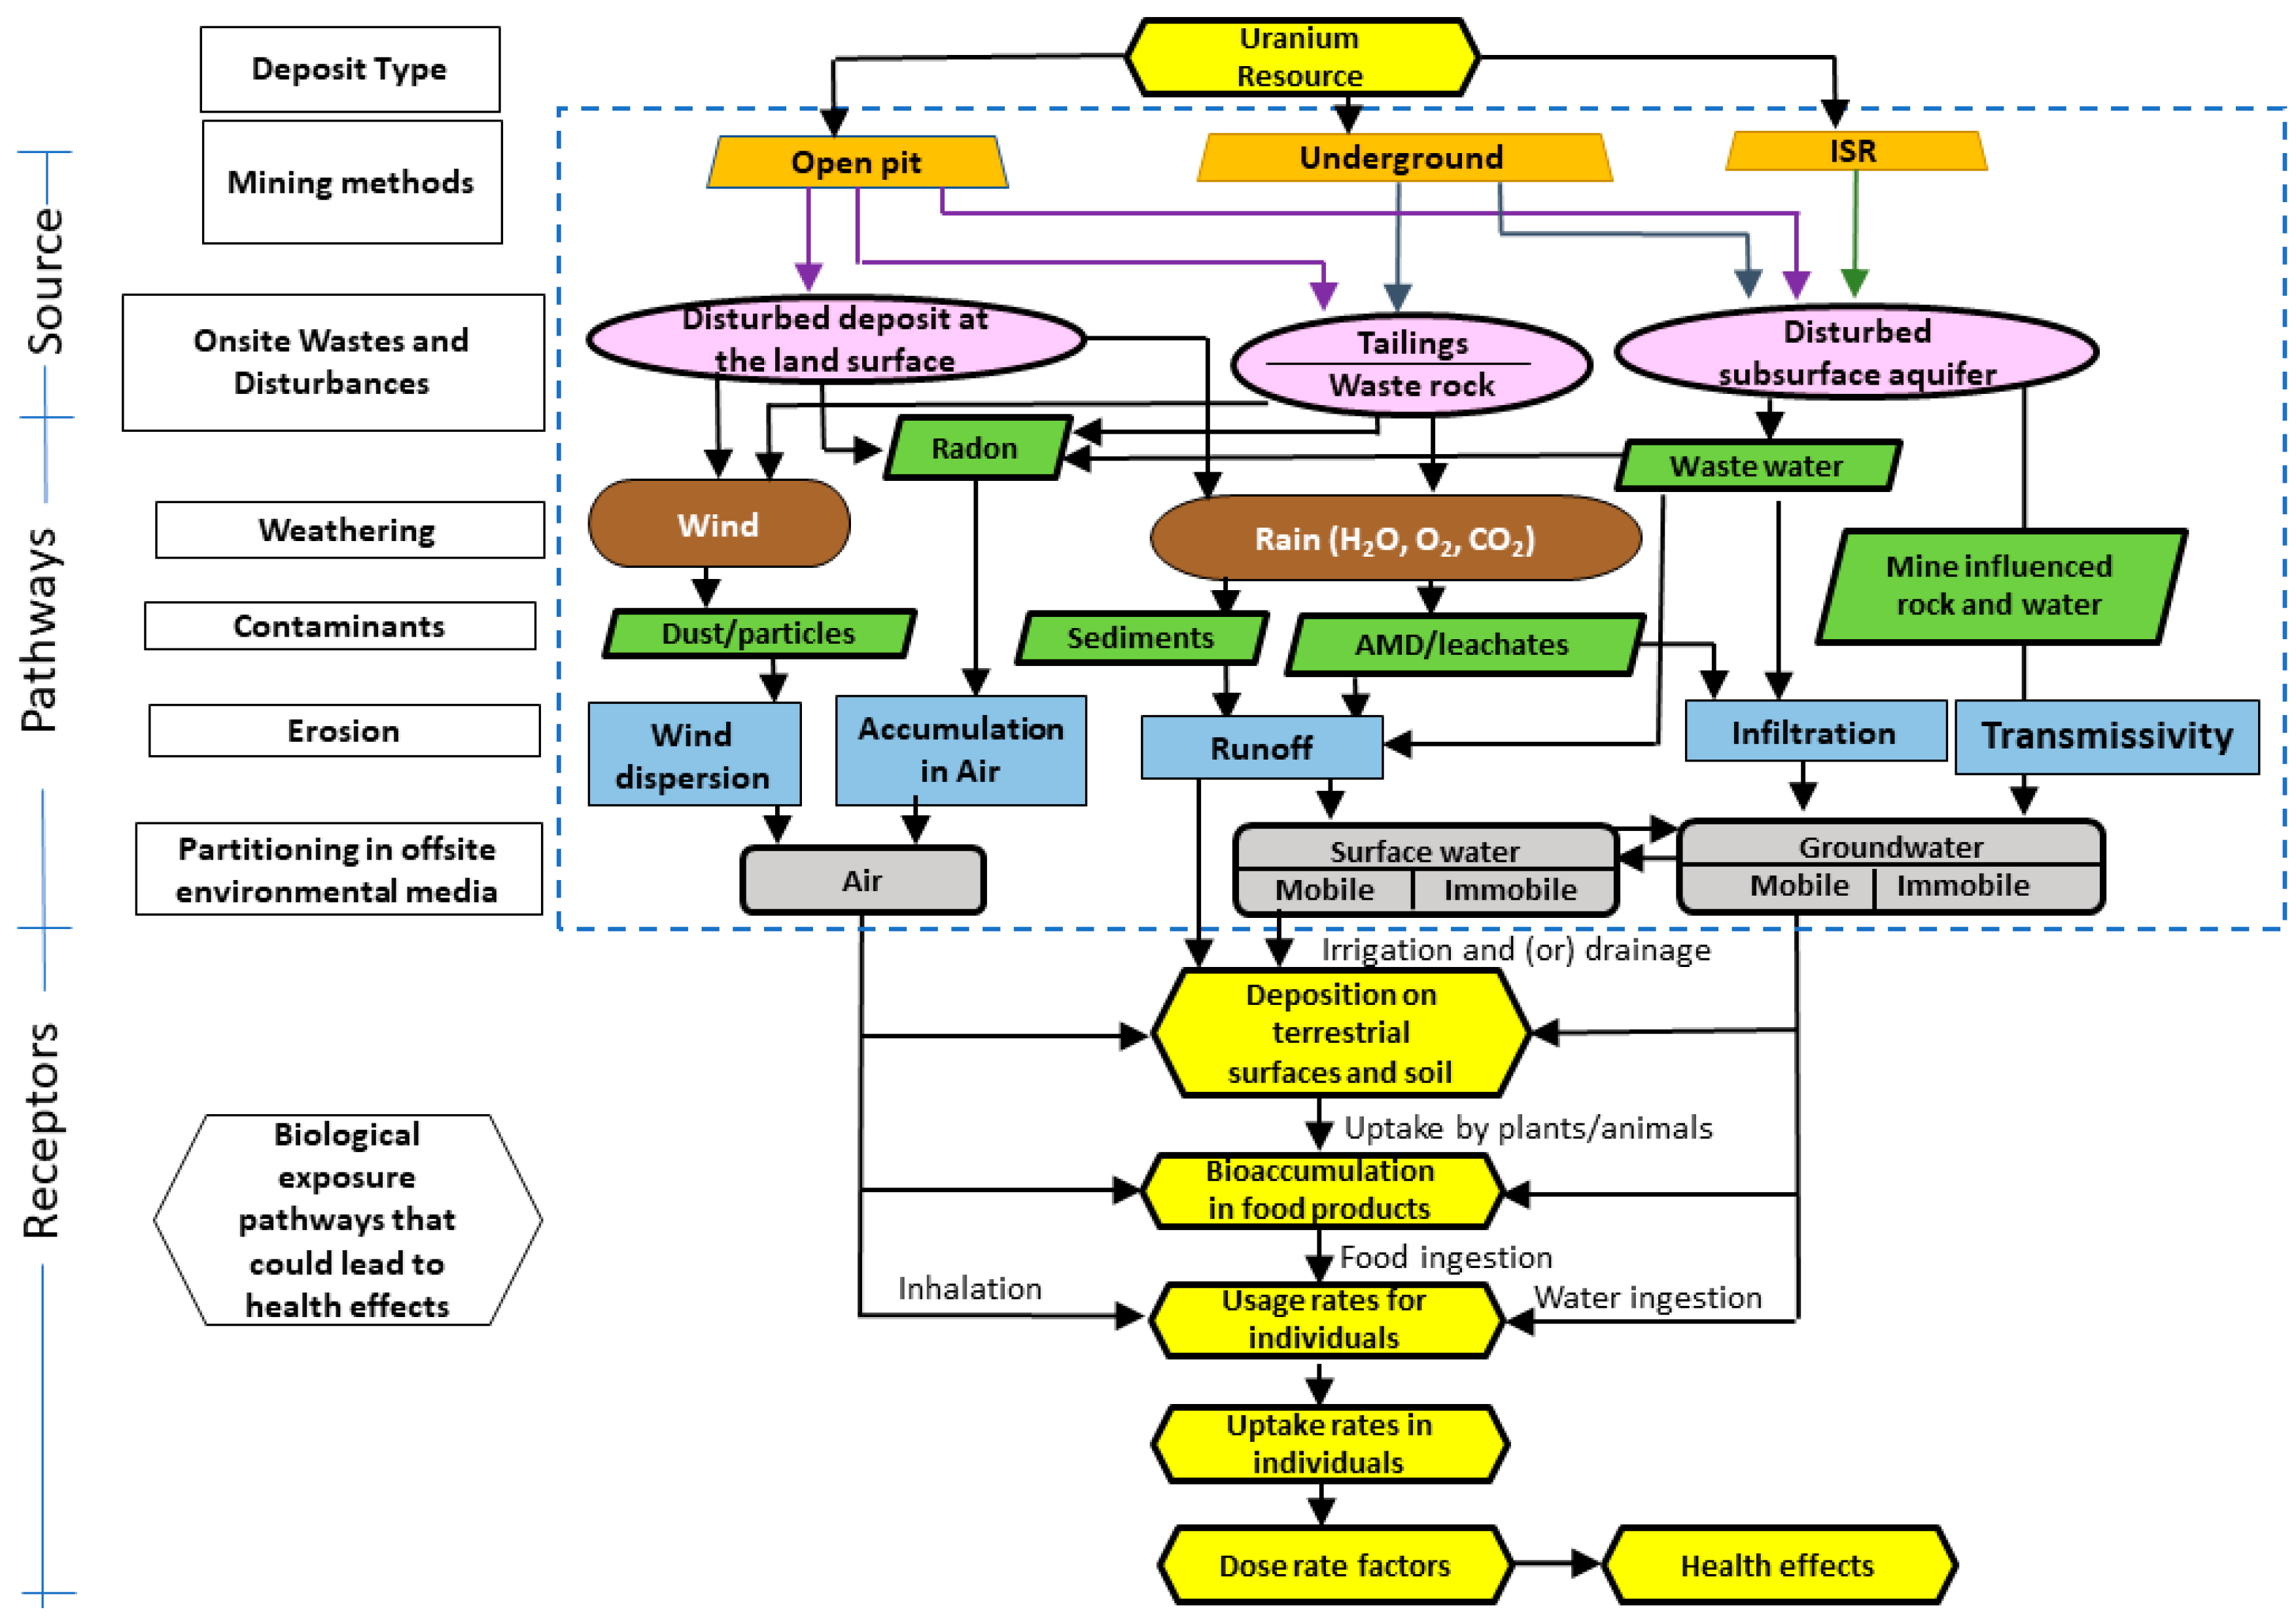
3.1. Conceptual Geoenvironmental Model

This study builds upon a geoenvironmental model summarizing descriptive and quantitative information derived from environmental studies and existing databases to depict potential environmental concerns associated with mining the uranium roll-front deposits in the Texas Coastal Plain [13]. There are at least 169 identified uranium deposits in the entire Texas Coastal Plain that have produced approximately 36,287 t of uranium oxide (U3O8) in total [1], using both open pit and ISR extraction techniques. However, of the three units in the study area (Goliad Sand, Willis Sand, and Lissie Formation), only deposits in the Goliad Sand have been mined and all of the historical operations (Alta Mesa, Kingsville Dome, Mt. Lucas, (La) Palangana, Palangana Dome, and Rosita) employed ISR methods. Furthermore, approximately 90 percent of the remaining undiscovered, unmined deposits are thought to be amenable to ISR [14]. Assuming that historical production reflects future production, it is likely that future mining will be conducted via ISR. As such, for this study, only the ISR source-to-receptor pathways were considered in the conceptual geoenvironmental model for our study area [13] (Figure 3).
The following potential contaminant pathways are prioritized within the permissive tract for ISR uranium extraction operations (Figure 3):
  • Accumulation of radon in air (Pathway A);
  • Runoff of wastewaters stored at the surface into surface waters (Pathway B);
  • Infiltration of wastewaters from surface to groundwater (Pathway C);
  • Migration of COPCs in mine-influenced water from the mined aquifers to adjacent aquifers (Pathway D).

3.2. Quantities of Waste and Affected Areas and Aquifer Volumes, and Radon Emissions

Since 1975, ISR has been used to extract uranium in Texas [15]. ISR is a solution mining technique in which locally pumped groundwater is amended with a complexing agent (often carbonate) and an oxidant (often oxygen) to create a leaching solution (lixiviant). The lixiviant is injected into the subsurface sediments to dissolve the uranium from the minerals in the deposit. The groundwater containing the dissolved uranium and other constituents is then pumped to the surface and sent to an ion exchange plant where uranium is concentrated and precipitated to produce yellowcake. The water is amended with additional oxidant and complexing agent and recirculated through the mining zone. Generally, during the uranium production step, some of the water is recycled, some is treated, and some is disposed of by evaporation or deep well disposal, depending on the water balance, mine design, regulatory limits, availability of land surface for ponds, and availability of deep wells for disposal [16]. Usually during the ISR extraction phase, it is estimated that 1–4 percent more water is pumped than is injected to keep an inward gradient that helps leaching fluids being inadvertently transported outside of the mining zone [17,18].
The following indicators of ISR’s “environmental footprint” have been previously identified and quantified: mine area, affected aquifer volume, mine pore volume, water pumped and disposed during uranium extraction and restoration, and radon emitted [6]. These indicators were normalized by the amount of uranium produced. The following linear regressions of the relationship between quantities of environmental footprints versus uranium production are used to project the potential quantities associated with the reported amount of undiscovered uranium resources projected in the Goliad Sand, Willis Sand, and Lissie Formation (as metric tons, t, of U3O8) that were previously assessed [1]:
Mine Area (m2) = 1784 × Mass U3O8 (t U3O8) R2 = 0.94
Total Water Disposed (m3) = 1807 × Mass U3O8 (t U3O8) R2 = 0.80
Mine Pore Volume (m3) = 194 × Mass U3O8 (t U3O8) R2 = 0.91
Affected Aquifer Volume (m3) = 662 × Mass U3O8 (t U3O8) R2 = 0.77
Water Pumped During Uranium Production (m3) = 35,424 × Mass U3O8 (t U3O8) R2 = 0.93
Water Extracted During Restoration (m3) = 4429 × Mass U3O8 (t U3O8) R2 = 0.93
Water Disposed During Uranium Production (non-restoration) (m3) = 702 × Mass U3O8 (t U3O8) R2 = 0.84
Water Disposed During Restoration (m3) = 1542 × Mass U3O8 (t U3O8) R2 = 0.90
Radon Emitted (Becquerel, Bq) = 1.1 × 10¹¹ × Mass U3O8 (t U3O8) R2 = 0.68
These equations were derived from the fitting data from the six mines completed in the Goliad Sand to the selected model, Y = m × X, where Y is the indicator value, m is the slope of the fitted line through the origin, and X is the estimated mass of undiscovered uranium (t U3O8). This model assumes Y must be 0 when X = 0, that is, there is no water use, disposal, or disturbance if there is no uranium production through ISR. These calculations are based on only six points and, therefore, the equations could change as new data are added. The current data do show relatively good correlations to a liner model through the origin. The R2 is a measure of correlation strength; that is, whether the two variables are linearly dependent. The R2 ranges from 0.68 to 0.94. All ISR operations also require an aquifer exemption, but the volume of aquifer exempted exhibited a poor linear correlation with the amount of uranium produced by the linear model [6] and were therefore not included here. As such, the volumes of aquifer exempted from the Clean Water Act regulations for the purposes of uranium extraction are not always delineated according to ore body size. Therefore, prediction of aquifer exemption water volumes is challenging, but nevertheless should be considered as an important environmental footprint of ISR. Table 1 provides a summary of projected environmental footprints based on Equations (1)–(9) for the indicated amounts of undiscovered U3O8 (t) associated with the stated percentile of probability distribution projected in the undiscovered uranium resource assessment [1].

3.3. Hydrogeologic, Geochemical, and Climatic Framework

A review of the geologic, hydrologic, climatic, and geochemical frameworks within the study area is used to identify data that can be used to indicate the potential for the persistence of the COPCs on the landscape for each of the potential pathways identified in the conceptual model: (1) accumulation of radon in air, (2) dispersion of constituents of concern of surface stored wastes into surface water via runoff, (3) the infiltration of COPCs from surface stored wastes into groundwater, and (4) the migration of mine-influenced groundwater into adjacent aquifers.

3.3.1. Geologic Framework

The geoenvironmental assessment unit comprises the Goliad Sand, Willis Sand, and Lissie Formation in the Texas Coastal Plain [1] and the associated above-ground areas and aquifer units (Figure 1). This assessment unit is hereafter referred to as the Goliad/Willis/Lissie geoenvironmental assessment unit. The geoenvironmental assessment unit is divided into the Rio Grande Embayment and the Houston Embayment, which are separated by the San Marcos Arch. There are several deposit types in the Texas Coastal Plain. The Goliad Sand hosts several known uranium ore bodies in salt domes such as Palangana Dome and Kingsville Dome [19]. In the middle Pliocene (Goliad Sand) in Texas, roll-type deposits are preferentially formed in regressive sequences and arid environments but the wet climates recorded in the upper Goliad did not favor the formation of roll-type deposits [14]. Ore bodies typically are narrow and long, with lengths ranging from meters to kilometers [14]. The southwestern region of the study area, the Rio Grande Embayment, exhibits conditions favorable for roll-front type uranium deposits. The northeastern region of the study area, the Houston Embayment, is less favorable, but permissive, for roll-front-type deposits [14].
Host rocks of the uranium deposits of Texas Coastal Plain are poorly consolidated sandstones, interbedded with, or overlain by, volcanic ash or tuffaceous beds. The deposits are located along faults and often associated with hydrocarbons, methane, and(or) hydrogen sulfide [20]. Reduced ore minerals include pitchblende and coffinite associated with anomalous concentrations of molybdenum, selenium, vanadium, and phosphorus [20]. In oxidized zones of the deposits, U(VI) minerals include uranyl phosphates, vanadates, and silicates [20,21]. Elements found in elevated concentrations near mill tailings at an inactive uranium mill in Falls City, Texas include: arsenic, barium, chromium, iron, lead, selenium, radium, and vanadium [22]. Because uranium is a radioactive element, the daughter products of its most abundant isotope, uranium-238, are also often present—radium-226 and radon-222 as well as their progeny. Some of the early ISR operations invoked an ammonium-based lixiviant; however, its use has long been discontinued due to difficulties in groundwater restoration following extraction [23]. Elements associated with ISR lixiviants also include chloride, which is used to regenerate ion-exchange columns. For demonstration of this geoenvironmental assessment, constituents of potential concern (COPC) to the environment commonly associated with ISR operations considered include uranium (U), molybdenum (Mo), arsenic (As), vanadium (V), and selenium (Se) [24].

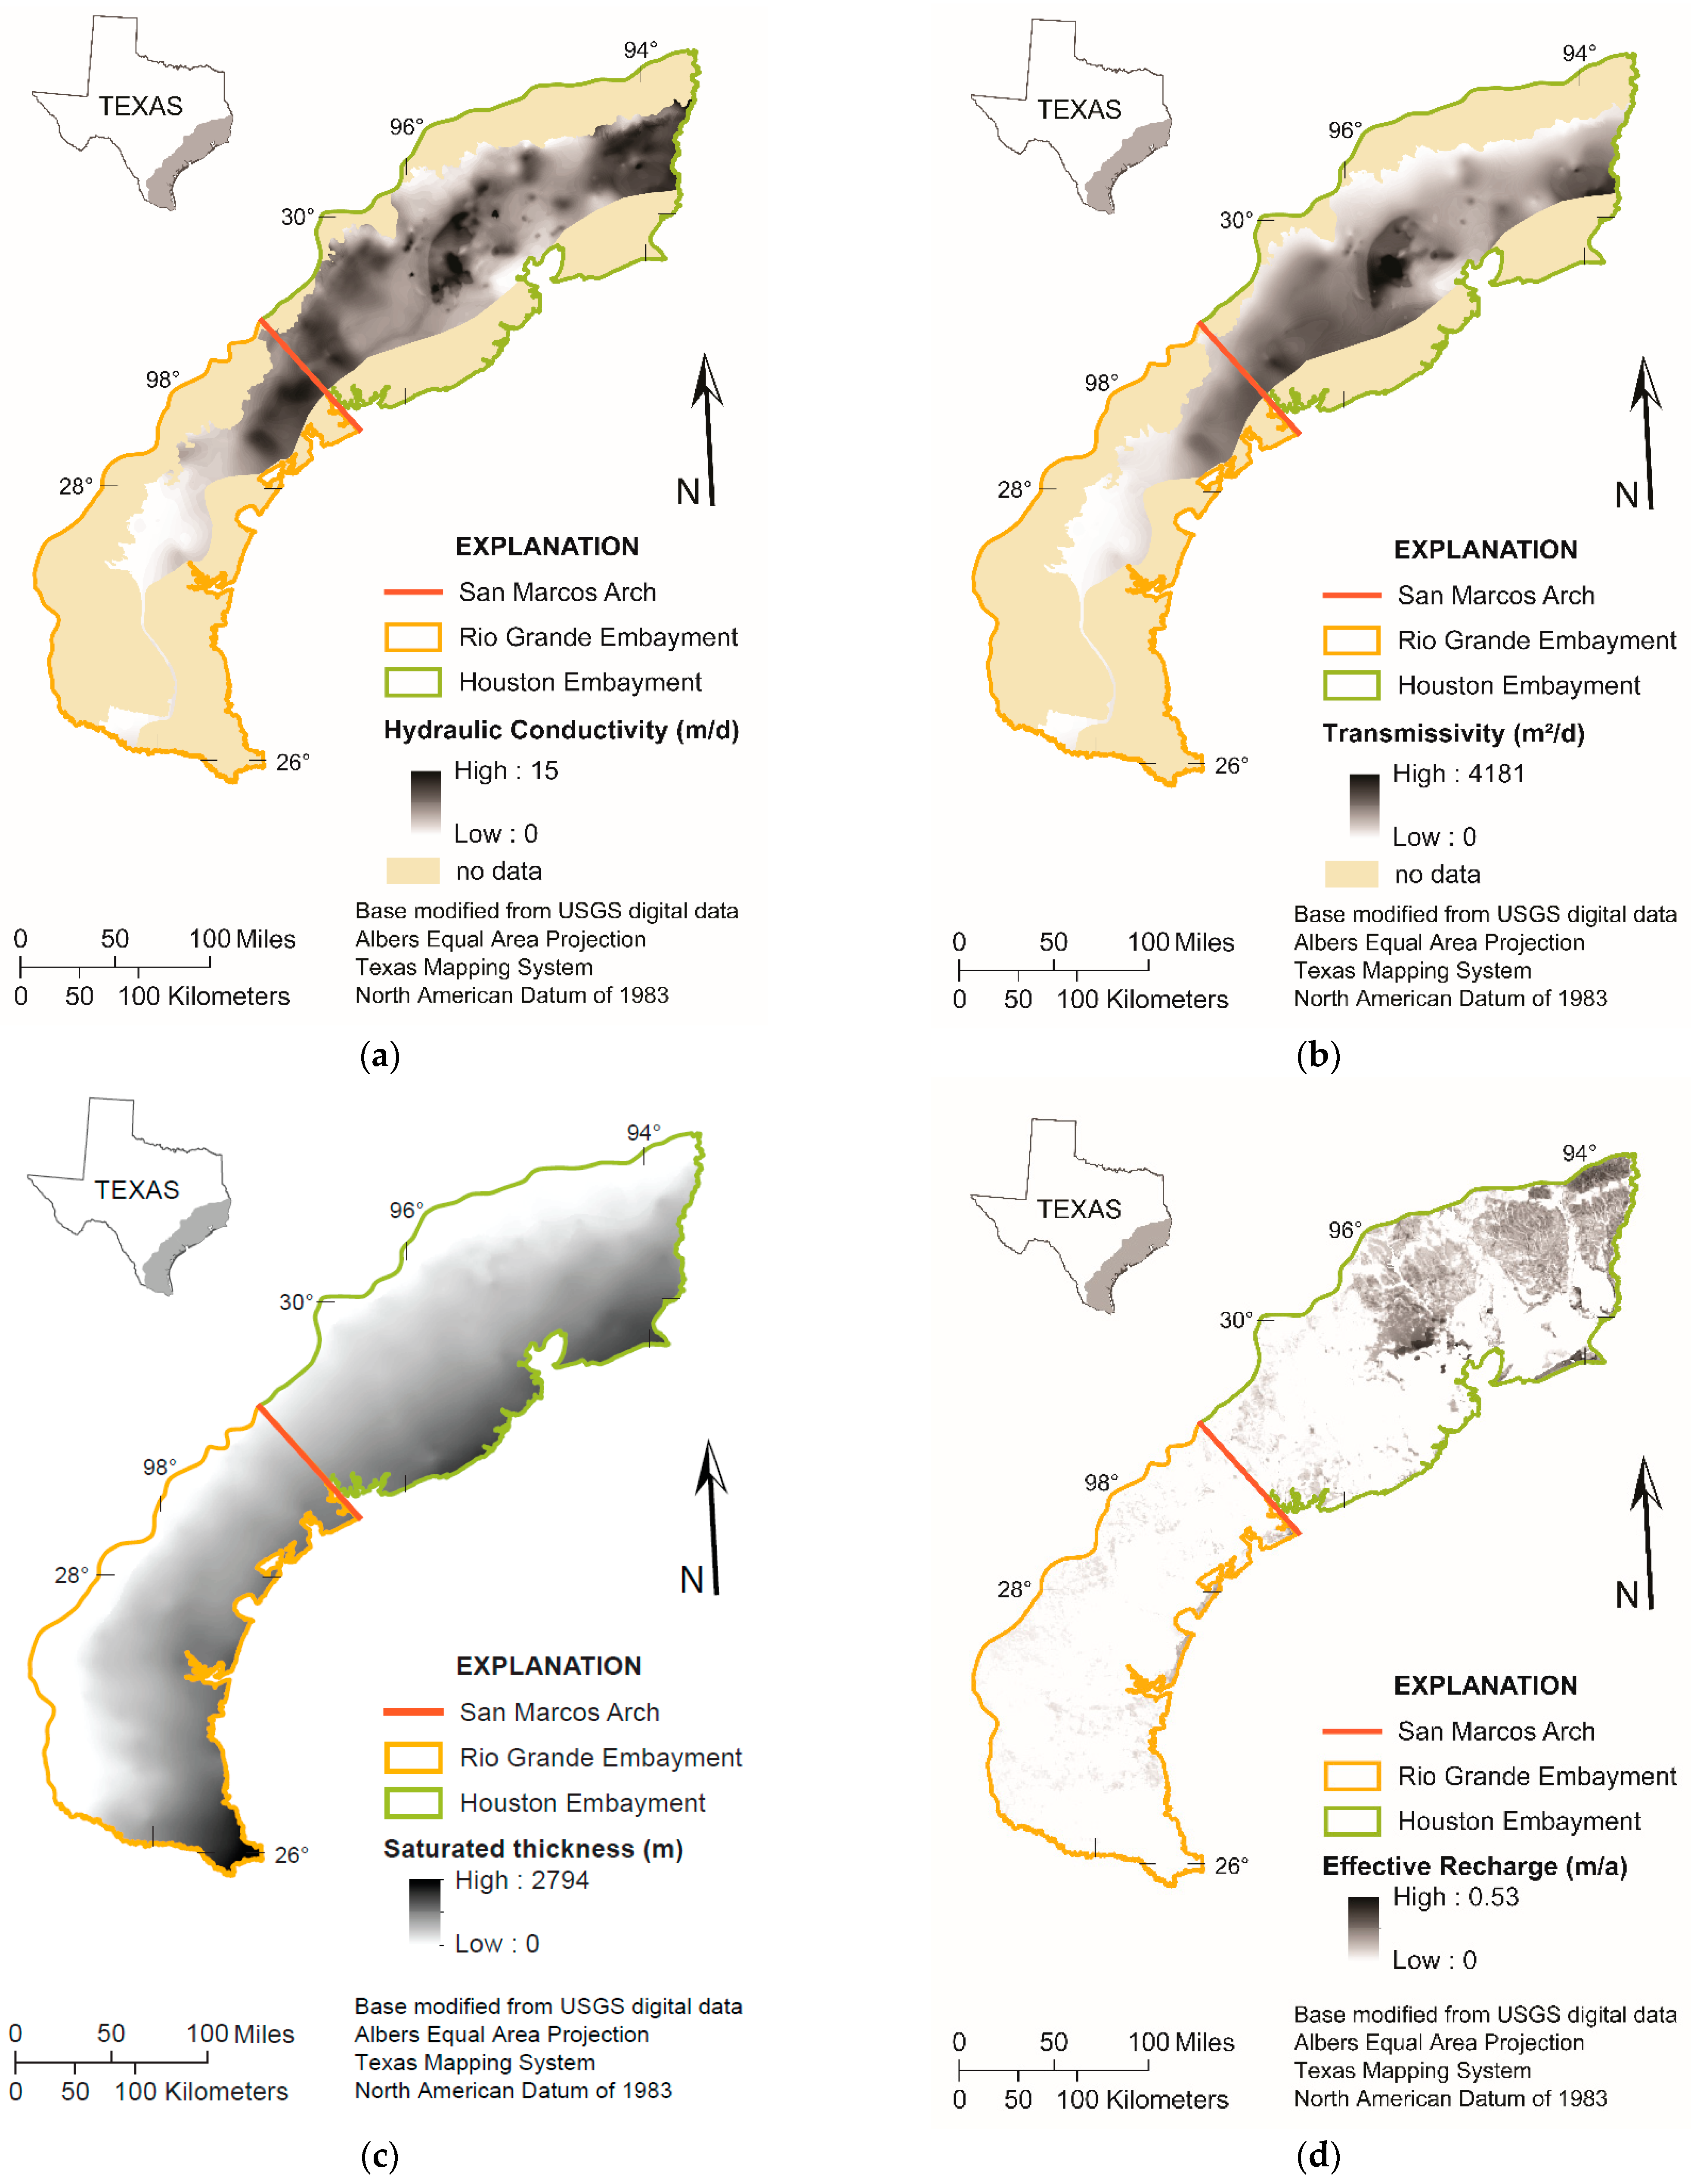
3.3.2. Hydrogeologic Framework

A hydrogeologic framework of the Goliad/Willis/Lissie geoenvironmental assessment unit has been described in detail elsewhere [9]. In brief, in the geoenvironmental assessment unit, there are three contiguous aquifer units consisting of the alluvium, Chicot, and Evangeline aquifer units (Table 2). The alluvial unit is its own unit but has typically been grouped with the Chicot aquifer in regional studies. The Lissie and Beaumont Formations contain the Chicot aquifer while the upper part of the Lagarto Clay and the Goliad Sand contain the Evangeline aquifer. The Evangeline aquifer is the most heavily used aquifer in the Texas Coastal Plain [25]. The Evangeline aquifer (along with the Chicot and Jasper aquifers) is used for water supply: municipal supply, commercial and industrial use, and irrigation [26]. These aquifers/formations are not separated by an aquitard and, for the purposes of this assessment, were combined to reflect the possibility that water can flow between units. Although the Chicot and Evangeline are mostly sand, there are extensive clay lenses throughout that may act as confining units that are necessary for ISR [9].
Transmissivity is a parameter that relates to the rate at which groundwater flows horizontally through the entire saturated portion of an aquifer. Transmissivity is a product of hydraulic conductivity and saturated thickness. Hydraulic conductivity describes the ease with which a fluid (usually water) can move through pore spaces. Teeple et al. [9,10] derived an equivalent horizontal hydraulic conductivity (Figure 4a) and equivalent transmissivity (Figure 4b) for the composite aquifer system (Alluvial, Chicot, Evangeline) from the U.S. Geological Survey (USGS) Source Water Assessment Program (SWAP) [33,34] datasets. The saturated thickness maps were calculated from water-table altitudes (2007–2016) within the composite aquifer system in the geoenvironmental assessment unit [9,10]. Transmissivity and hydraulic conductivity are important indicators of the potential for mine-impacted groundwater to flow from the mining zone; however, the SWAP dataset does not cover all of the permissive tract.
Equivalent hydraulic conductivity values in the Houston embayment were slightly higher than equivalent hydraulic conductivity values in the Rio Grande embayment with a range of 0–15 m per day (m/d) while the Rio Grande embayment ranged from 0–9 m/d (Figure 4a) [9]. The average equivalent hydraulic conductivity for both embayments was about 4 m/d, with the Houston embayment having an average of about 5 m/d, and the Rio Grande embayment having an average of about 3 m/d. Similar to the equivalent hydraulic conductivity values, the equivalent transmissivity values in the Houston embayment were higher than equivalent transmissivity values in the Rio Grande embayment with a range of 0–4181 square meters per day (m2/d) while the Rio Grande embayment ranged from 0–1871 m2/d (Figure 4b) [9]. The average equivalent transmissivity for both embayments was about 938 m2/d, with the Houston embayment having an average of about 1089 m2/d, and the Rio Grande embayment having an average of about 565 m2/d. Saturated thickness ranges from 0 to 2786 m, generally increasing from the northeast to the southwestern portion of the permissive tract (Figure 4c). Although equivalent hydraulic conductivity values in this paper provide some indication of the ease of groundwater flow, a homogeneous aquifer is assumed and does not incorporate clay lenses, faults, dikes, or salt domes, which may influence the flow of groundwater.
Effective recharge provides an indicator of the potential for infiltration of surface-derived COPCs. The effective recharge map (Figure 4d) was clipped to the study area from average annual maps of recharge across the continental United States (U.S.) used for estimating the average balance of local water availability [8]. Effective recharge ranges from 0 to 0.53 m/a, with the highest areas of recharge in the northeast portion of the study area. Recharge is higher in the upper portion of the Houston Embayment and along the southern border where recharge is up to 0.53 m/a. High areas of effective recharge are fewer in the Rio Grande Embayment, where it ranges from 0 to 0.32 m/a.

3.3.3. Geochemical Framework

Generally, groundwater will be affected and wastewater will be produced in areas where the ore deposit is saturated, regardless of the mining method. Whether or not the COPCs become or remain dissolved in the aquifer outside of the mining zone is, in part, a matter of geochemistry. To understand the potential effects of ISR on groundwater water quality, a geochemical analysis of factors that indicate geochemical mobility of COPCs in surface and groundwater can be used. For the purposes of this demonstration, the analysis from Blake et al. [7] was used to better understand factors that influence the regional geochemical mobility. The Blake et al. study is an application of concepts of trace element mobility from Smith (2007) [35] and geochemical barriers based upon pH ranges from Perel’man (1986) [36]. This method is the result of multiple iterations of geochemical parameters evaluated for their effect on element mobility [7]. Maps of the “environmental condition” that indicate the potential for mobility of constituents of concern are illustrated in Figure 5a,b for both surface and groundwater, respectively [7]. Figure 5c shows the number of surface and groundwater samples falling into each environmental condition category. According to Blake et al., the majority of groundwater and surface water data meet the criteria for Environmental Condition 3 (pH ≥ 6.5 to <8.5, oxic) (Figure 5c).
Identifying the potential mobility of the COPCs based only on the pe and pH master variables, however, is a complex task given the numerous factors that may affect aqueous mobility. Blake et al. attempted to simplify some of the complexities to provide a proof-of-concept of such an approach. The depictions (Figure 5) were made by Blake et al. based on the water quality measurements in conjunction with pe-pH diagrams, empirical data comparisons to detection limits (Blake et al. [7]), and known geochemical mechanisms (Blake et al. [7]) that may affect mobility [7]. In addition, Blake et al. [7] describe mobility in two categories, “mobile” or “scarcely mobile to immobile”. Details of these considerations are included in the main text and the supplemental material in Blake et al. [7]. Blake et al. provide a table of mobility for each COPC for each environmental condition [7]. In addition, Blake et al. [7] suggest that in hydrologic unit codes (HUC-12) represented by the Environmental Condition 3 (pH ≥ 6.5 to <8.5, oxic), As, Mo, Se, U, and V are generally expected to be mobile, but As, Mo, and V could become sequestered in solid phases if sorptive substrates such as iron oxides are present. Likewise, if solubilities of scavenging minerals are exceeded, mobilities of these elements will be greatly reduced.
While the summary table provided in Blake et al. [7] represents a generic overview of elemental mobility for the purposes of this demonstration based on theoretical thermodynamics and empirical observations of available water quality data from the study area, the user should be aware of caveats and limitations. Specifically, elemental mobility can be greatly impacted by the presence of other minerals, complexing agents, and concentrations of COPCs that can influence uptake of elements via sorption, solid precipitation, and other mechanisms. Furthermore, the data used in the geochemical evaluation were compiled from multiple aquifers and depths across the large watershed scale. This analysis is designed to capture the regional geochemistry and is not intended to be conducted at the local site-specific scale of uranium extraction. It is plausible that there could be significant variations in geochemical conditions over smaller scales because uranium roll fronts tend to be highly localized structures that contain sharp boundaries in redox conditions and localized perturbations to the mined aquifers during extraction via ISR. However, as intended, this approach provides a broad view of how geochemical data can be spatially aggregated to conduct an evaluation of the most common conditions that would influence contaminant mobility at the regional scale of an undiscovered uranium resource assessment in which the exact deposit locations are unknown, the permissive tract spans kilometers, and the depths encompass multiple geologic units and aquifers.

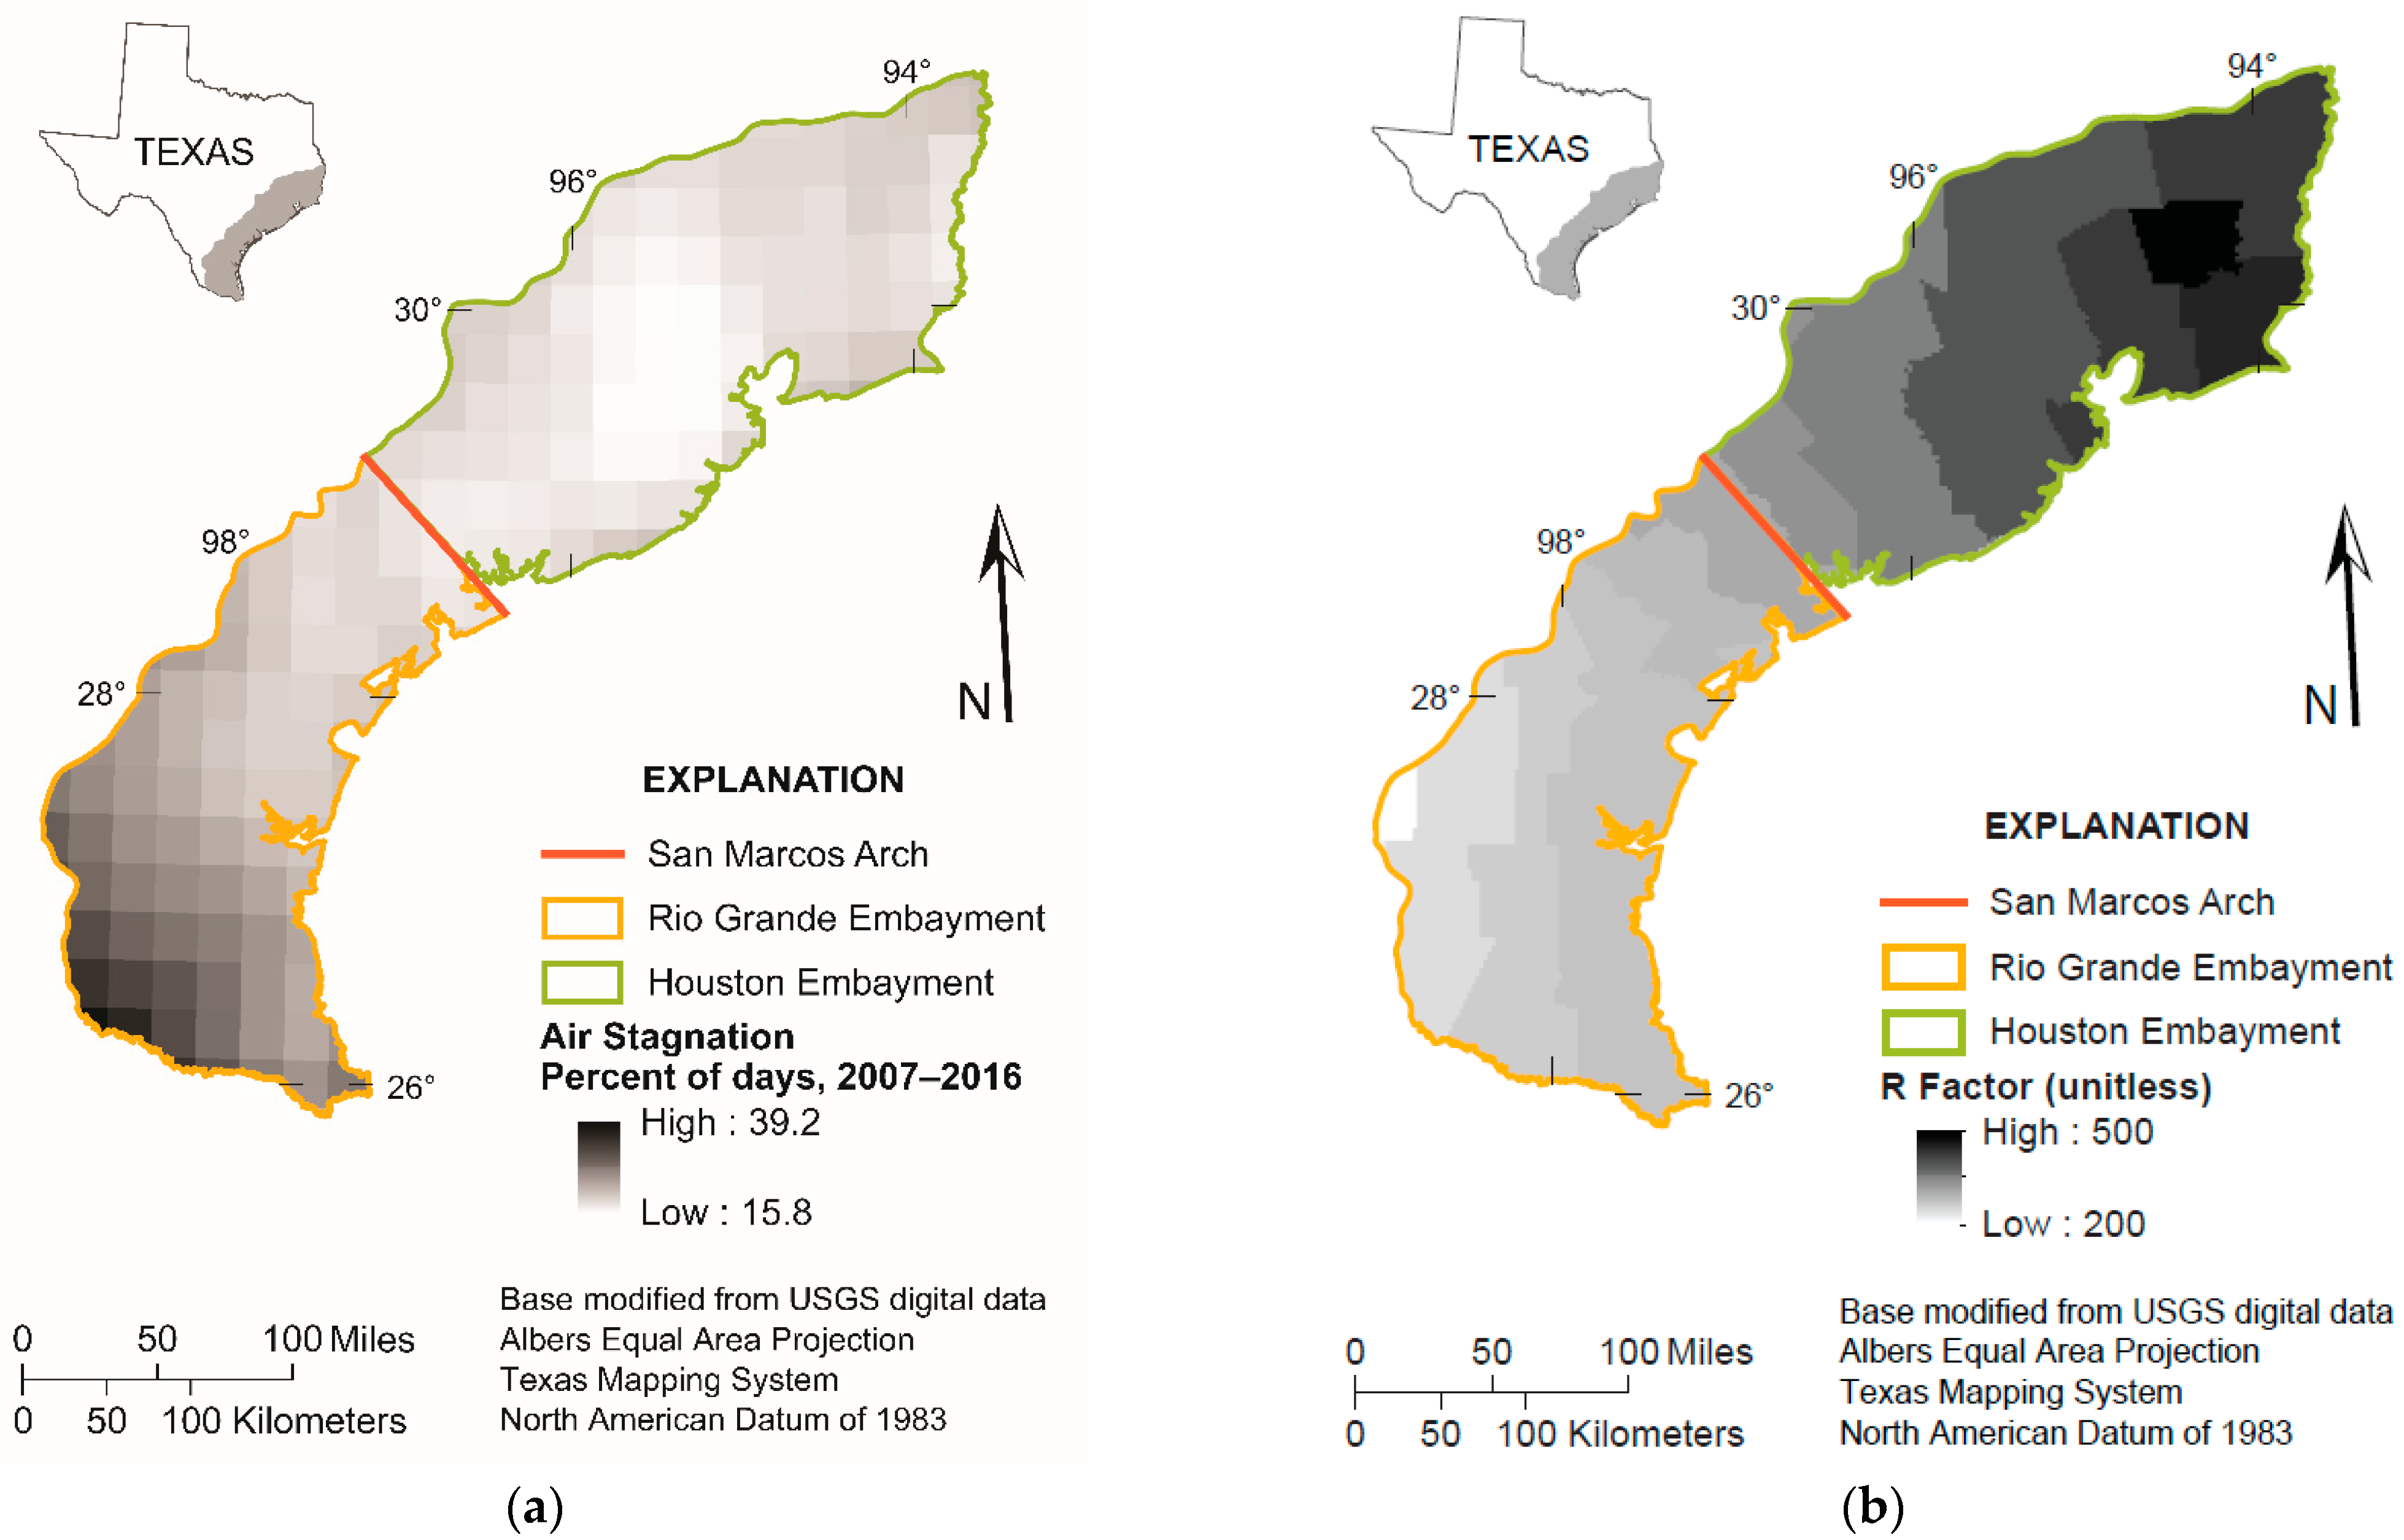
3.3.4. Climatic Framework

The major pathways affected by climate (Figure 3) include the radon dispersion into air and runoff of wastewater stored at the surface into nearby surface waters. Air stagnation is an indicator of the potential for radon to accumulate in air. The air stagnation map (Figure 6a) [37] is based on a modified version of Wang and Angell’s (1999) algorithm, which defines a stagnation day as one with [38]:
  • Sea level geostrophic wind less than or equal to 8 m/s (if there is a temperature inversion below 85,000 Pa, then less than or equal to 10 m/s);
  • Wind speed at 50,000 Pa of pressure less than or equal to 13 m/s; and
  • No precipitation.
The 10-year air stagnation index map displays the percentage of days that met these air stagnation index criteria from 2007 to 2016 (Figure 6a). Based on the results presented here, this proof-of-concept was successful in demonstrating the use of the National Oceanic and Atmospheric Administration’s air stagnation index data within a GIS environment [12].
Mine-related wastewater stored on the land surface is susceptible to dispersion due to runoff and can be a source of mining-related COPCs to nearby land surfaces or surface water. The potential for dispersion of COPCs by rainfall is indicated by the factor for climate erosivity (R factor). The U.S. Department of Agriculture established R factors for sites throughout the country, which are used as surrogate measures of the effect that rainfall has on erosion from a particular site [39]. The average erosion force of rain is calculated by taking into account the amount of rainfall and the peak intensity of each storm and finding the long-term average [40]. The R factor is an indication of the two important characteristics of a storm determining its erosivity: the amount of rainfall and peak intensity sustained over an extended period [40]. The R factor data were obtained from the Soil Survey Geographic Database (SSURGO) database, which contains information about soil collected by the National Cooperative Soil Survey (NRCS) over the course of a century [11] (Figure 6b).

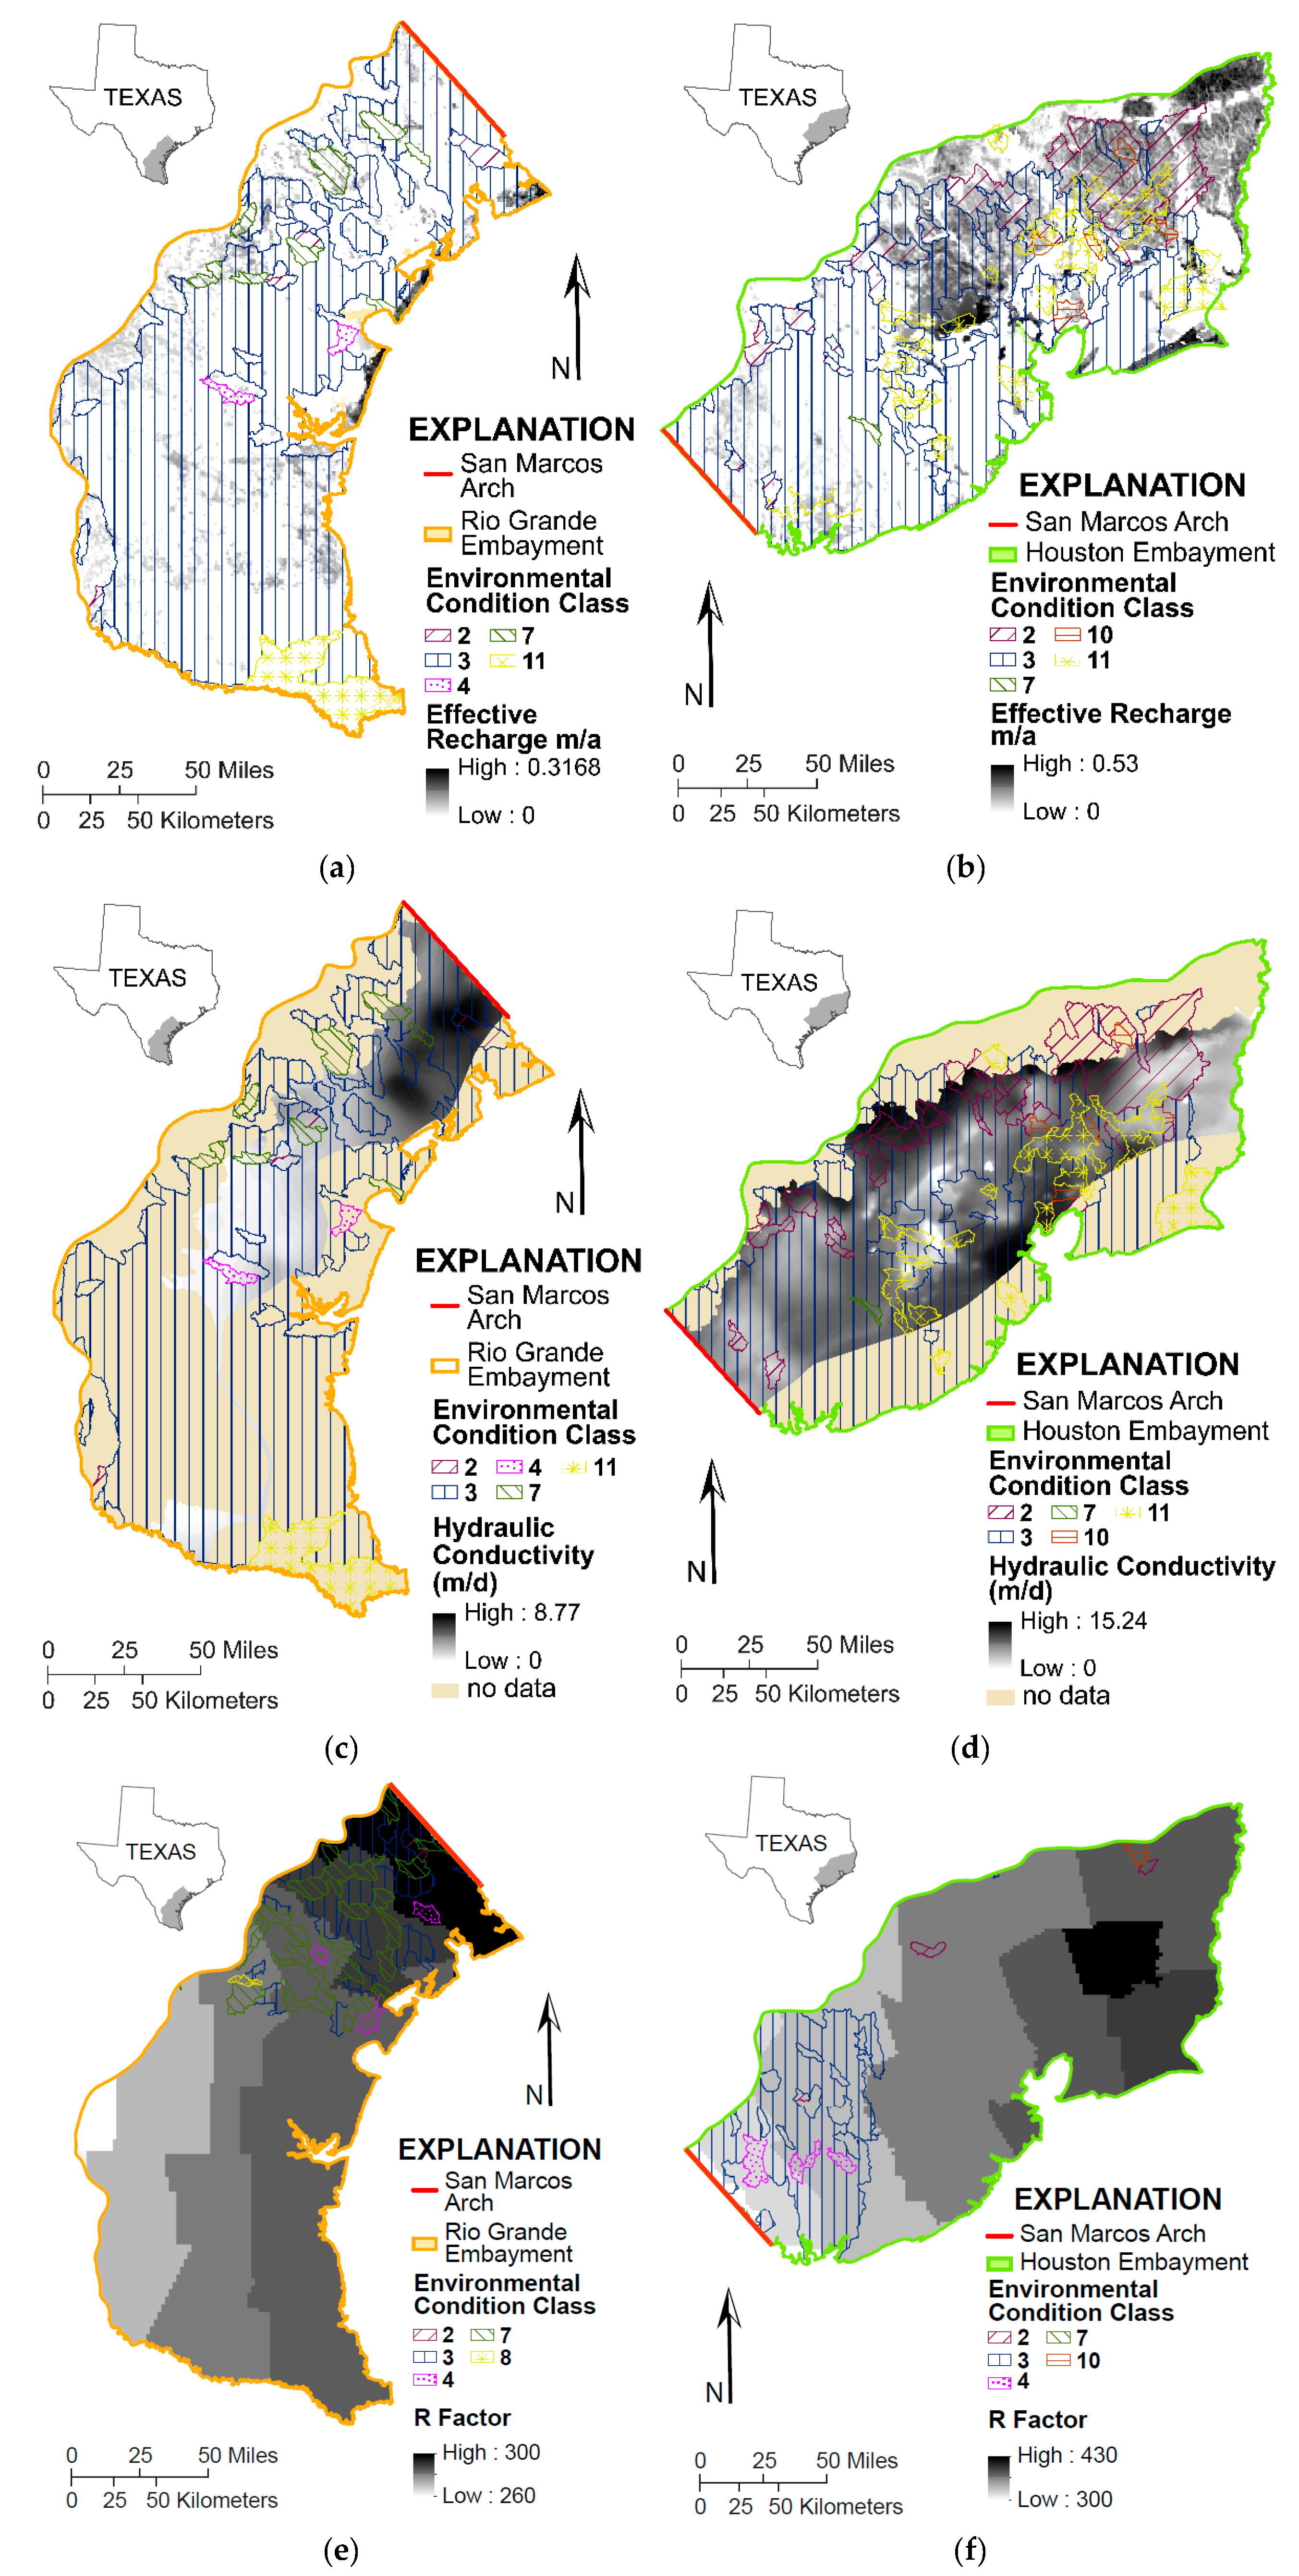
3.4. Spatial and Statistical Assessment of the Potential for the Persistence of Constituents of Potential Concern

The areas where COPCs derived from wastes from uranium resource extraction via ISR are likely to persist is determined by first overlaying the indicator maps identified from the discussion of the geochemical, hydrogeologic, and climatic frameworks, as follows (Figure 7):
  • Pathway A: accumulation of radon gas (indicated by the air stagnation index [33]);
  • Pathway B: runoff of wastewaters stored at the surface into surface waters is likely in areas prone to water erosion (indicated by the R factor [11]) and areas with a potential of geochemical mobility for the COPCs (indicated by the geochemical environmental conditions of surface water [7]);
  • Pathway C: infiltration of spilled, leached or leaked wastewater from surface into groundwater (indicated by effective recharge [41]) and the potential of geochemical mobility for the COPCs (indicated by geochemical environmental conditions of groundwater [7]);
  • Pathway D: migration of COPCs from a disturbed mined aquifer (indicated by transmissivity [9,10]) and the potential of geochemical mobility for the COPCs (indicated by geochemical environmental conditions of groundwater [7]).
The historical percentage of days meeting the criteria for air stagnation indicate the potential for the accumulation of radon and is an example of a single-factor indicator without additional overlays (Figure 6a). Two factors representing the potential for physical mobility of COPCs and geochemical mobility can be combined to indicate the potential for migration of COPCs in water (Figure 7). The darker areas of the maps are locations that historically exhibited the greatest percentage of air stagnation days, effective recharge, R factors, and saturated thickness. As such, these are also areas where accumulation of radon in air (Figure 6a), infiltration of COPCs into groundwater from the surface (Figure 7a,b), migration of mine-related waters away from mine impacted aquifers into nearby aquifers (Figure 7c,d), and runoff of surface COPCs into nearby surface waters or land surfaces (Figure 7e,f) are most likely to occur. The environmental condition category is also displayed on these maps to provide insight as to whether conditions in groundwater and surface water also favor geochemical mobility in these areas with high physical mobility.
An example of how a statistical analysis of the percentage of air stagnation days, effective recharge, R factors, and hydraulic conductivity can be applied on a regional scale is demonstrated by comparing the indicators for persistence of contaminants due to these pathways between the Houston and Rio Grande Embayments. For example, the statistics of the single-factor air stagnation data exhibit an average of 18 percent of days that met the criteria for air stagnation in the Houston Embayment whereas the Rio Grande Embayment had an average of 24 percent.
The two-factor maps also highlight the indicators of physical mobility in areas of differing potential for chemical mobility in groundwater or surface water (Figure 7) according to the geochemical environmental conditions outlined by Blake et al. [7]. Environmental Condition 2 has the highest effective recharge in the Houston Embayment, but has a lower likelihood of samples being greater than 0.2 µg/L of uranium according to Blake et al. (Figure 7a,b and Table 3) [7]. Conversely, Environmental Condition 7, which has a higher likelihood of uranium mobility [7], has the lowest average effective recharge. Generally, surface and groundwaters in the Houston Embayment have a higher likelihood of the persistence of uranium than the Rio Grande Embayment (Figure 7c–f) because it exhibits a higher average R factor (which implies greater potential for runoff), effective recharge (which indicates greater infiltration), and hydraulic conductivity (which implies a higher ease of groundwater flow from mining zones) within areas where uranium is more likely to be mobile (that is, Environmental Condition 7) according to Blake and others [7]), if there is a source of uranium.

4. Discussion

This example of a geoenvironmental assessment method results in a scientifically based examination of the potential environmental aspects and processes that are most likely to be related to future extraction of undiscovered uranium resources, should they be found to exist and subsequently developed. This method overcomes challenges and the difficulty in predicting the environmental effects of undiscovered resources due to the lack of site-specific factors related to the location and attributes of a specific uranium deposit and its development. Instead, focusing on the historical factors, including mining methods, data on wastes and disturbances, and intrinsic hydrologic, geologic, geochemical, and climatic settings, allows us better to project factors that most likely indicate the potential for environmental effects. This method is not intended to replace site-specific environmental assessments, but instead provides a coarse quantitative comparison of environmental aspects of undiscovered uranium resource assessments across a geographic region, such as a part of the Texas Coastal Plain as shown herein, or across the U.S., if developed using ISR extraction methods. The method allows for: (1) comparison of probable waste and disturbance on a regional scale for a given amount of undiscovered uranium resources and (2) the identification of the natural conditions on a regional scale in a permissive tract that exhibits conditions favoring the potential persistence of the COPCs. The maps generated herein can be compared with spatial data such as critical habitat areas, national parks, population densities, water resource maps, agricultural areas, or other maps related to environmental health as a planning tool for considering mineral resources and potential environmental impacts of their extraction in a sustainable development framework.
This assessment, including maps and statistics, represents regional-scale trends, is therefore not intended for use in site-specific, local or small-scale applications. Rather, the scale of this application is intended to match the regional or national scale of an undiscovered uranium resource assessment where the exact location of deposits is unknown and, therefore, the mine locations are unknown. The aquifers for this study were also combined to create a composite aquifer system to match the geologic units that were evaluated in the undiscovered uranium resource assessment, which in essence were also combined. Because the undiscovered uranium resource locations are estimated at the scale of the permissive tract, uranium could occur in any of the associated different aquifers across the permissive tract. Furthermore, these aquifer units are not separated by an impermeable layer such as an aquitard; therefore, it is not unreasonable that fluids might flow between aquifers comprising the composite aquifer unit in this study. This is especially important for any future mining done via ISR. Both hydrological and geochemical data were derived from various aquifer units at depth; therefore, the data aggregated would effectively represent averages across these large scales in both the vertical and horizonal directions. Several other limitations to this approach need to be considered:
  • First, future mining is likely to take place in deeper and (or) lower grade deposits [42,43], which could affect both waste amounts and extent of aquifer disturbances.
  • Quantities of wastes and affected areas could also be influenced by waste management, mining methods, and restoration/reclamation/remediation methods that may differ in the future from the historical uranium extraction operations.
  • The mass of undiscovered U3O8 resources used to normalize waste production and disturbed areas were projected based solely on grade and tonnage relationships of previous ISR and open pit mines in Texas grouped together. The ore production estimates were made regardless of solution chemistry, such as ammonium lixiviant, which is not currently used and perhaps dictated the water use. As such, the rate of uranium production, could cause differences in the relationships presented (Table 1).
  • Data are based on only six ISR operations (Table 1); therefore, additional data points could result in a considerable change to the modeled linear fit.
  • Any future analysis is dependent on availability of data and the scale at which data are available. In addition, the limitations of each of the original datasets should be considered.
  • Maps used in this study, such as the runoff maps, the equivalent hydraulic conductivity and equivalent transmissivity maps, exhibit coarse grid sizes or are based on spatially scant data and are therefore not applicable to a specific site.
  • The maps do not show specific areas where uranium deposits are most favorable; it must be acknowledged that minable uranium deposits are not equally dispersed throughout the permissive tract. The locations of the undiscovered uranium deposits are unknown and, therefore, the locations of future mining are also unknown at a local scale.
  • The maps do not reflect sources of the COPCs, therefore, because an area exhibits conditions for both physical transport and geochemical mobility, the potential persistence of a COPC is not guaranteed if a COPC source is not present. The maps show where a COPC would persist if it were present in the environment in either a uranium deposit, or in waste produced by mining the uranium deposit.
  • Finally, although the boundary for the geoenvironmental assessment is consistent with the boundary for the uranium resource assessment [1], the migration of COPCs outside the boundary is possible.
While this assessment does not address these limitations or the many factors that account for the occurrence and persistence of COPCs, it does demonstrate how principal factors can be systematically identified, combined, analyzed, and scientifically quantified. Geoenvironmental assessments are region-specific in areas permissive for undiscovered uranium resources. Accordingly, the assessment implicitly reflects parameters that both directly and indirectly affect water and land use, such as regulatory framework, water supply, availability of disposal sites, laws dictating the use of groundwater and surface water, and the reuse and recycling of process effluents, as well as mineralogy, deposit type, mining method, and economics. Likewise, the regional nature of the geoenvironmental assessment also better reflects the climatic, hydrogeologic, and geologic factors that influence the depth to water, rainfall, terrane, and characteristics of each orebody.
Future studies can build on this approach by incorporating greater complexity as more data become available. Although this geoenvironmental assessment is localized in the one assessment unit in the Texas Coastal Plain for the purposes of demonstration, the methods and data types can be extended (or applied) to any location in the world. As such, this type of approach is generic in nature because it can be applied to the geoenvironmental assessment of any natural mineral resource by using data specific to the resource type, expected extraction methods, and geographic location. Although this method was conducted manually, it serves as a proof-of-concept demonstrating both the methods and data types that can be used to conduct a geoenvironmental assessment. This methodology could be amenable to a more rapid assessment methods utilizing modernized machine learning and artificial intelligence tools [44], if sufficiently large quantities of data are available.

Author Contributions

T.J.G. contributed to: conceptualization, methodology, validation, formal analysis, investigation, data curation, writing—original draft preparation, writing—review and editing, visualization, supervision, project administration, and funding acquisition. T.J.G., V.G.S., K.W.-D., J.B., A.T., D.H., D.B.Y. and K.D.B. contributed to: conceptualization, methodology, validation, formal analysis, investigation, data curation, visualization and writing—review and editing. S.C. contributed to data curation and visualization. All authors have read and agreed to the published version of the manuscript.

Funding

This research was funded by the Energy Resources Program in the Energy and Minerals Mission Area and the Environmental Health Program in the Ecosystems Mission Area of the U.S. Geological Survey.

Data Availability Statement

All data are published and publicly available, as cited in the manuscript. The quantities of mine area, exempted aquifer volume, affected aquifer volume, mine pore volume, water pumped and disposed during uranium extraction and restoration, and radon emissions from historical ISR operations in the Goliad Sand were found in Gallegos et al. [6]. GIS overlays and maps were derived from previous publications by Blake et al. (Geochemistry) [7], Reitz et al. (recharge) [8], Teeple et al. (hydraulic conductivity) [9,10], National Resource Conservation Service (R factor) [11], and Stengel et al. (air stagnation) [12].

Acknowledgments

Special thanks to all those who assisted with data analysis and visualization. The authors appreciate feedback provided by the uranium mining industry and the regulatory community. We also thank the reviewers for their thoughtful comments.

Conflicts of Interest

The authors declare no conflict of interest.

References

  1. Mihalasky, M.J.; Hall, S.M.; Hammarstrom, J.M.; Tureck, K.R.; Hannon, M.T.; Breit, G.N.; Zielinski, R.A.; Elliott, B. Assessment of Undiscovered Sandstone-Hosted Uranium Resources in the Texas Coastal Plain, 2015: U.S. Geological Survey Fact Sheet: 2015-3069; U.S. Geological Survey: Reston, VA, USA, 2015; p. 4.
  2. U.S. Geological Survey. Facing Tomorrow’s Challenges—U.S. Geological Survey Science in the Decade 2007–2017: U.S. Geological Survey Circular 1309; Government Printing Office: Reston, VA, USA, 2007.
  3. Gallegos, T.J.; Walton-Day, K.; Seal, R.R., II. Conceptual Framework and Approach for Conducting a Geoenvironmental Assessment of Undiscovered Uranium Resources: U.S. Geological Survey Scientific Investigations Report 2018-5104; U.S. Geological Survey: Reston, VA. USA, 2020; p. 28. [CrossRef]
  4. Anastas, P.T.; Zimmerman, J.B. Design through the 12 principles of green engineering. Environ. Sci. Technol. 2003, 37, 94A–101A. [Google Scholar] [CrossRef] [PubMed]
  5. National Academy of Science. Evolutionary and Revolutionary Technologies for Mining; National Academy Press: Washington, DC, USA, 2002; p. 102. [Google Scholar]
  6. Gallegos, T.J.; Scott, A.M.; Stengel, V.G.; Teeple, A.P. A Methodology to Assess the Historical Environmental Footprint of In-Situ Recovery (ISR) of Uranium: A Demonstration in the Goliad Sand in the Texas Coastal Plain, USA. Minerals 2022, 12, 369. [Google Scholar] [CrossRef]
  7. Blake, J.M.; Walton-Day, K.; Gallegos, T.J.; Yager, D.B.; Humberson, D.; Stengel, V.; Teeple, A.; Becher, K. New Geochemical Framework and Geographic Information System Methodologies to Assess Element Occurrence, Persistence, and Mobility in Groundwater and Surface Water. Minerals 2022, 12, 411. [Google Scholar] [CrossRef]
  8. Reitz, M.; Sanford, W.E.; Senay, G.B.; Cazenas, J. Annual Estimates of Recharge, Quick-Flow Runoff, and Evapotranspiration for the Contiguous U.S. Using Empirical Regression Equations. JAWRA J. Am. Water Resour. Assoc. 2017, 53, 961–983. [Google Scholar] [CrossRef]
  9. Teeple, A.P.; Becher, K.D.; Walton-Day, K.; Humberson, D.G.; Gallegos, T.J. Development and Description of a Composite Hydrogeologic Framework for Inclusion in a Geoenvironmental Assessment of Undiscovered Uranium Resources in Pliocene- to Pleistocene-Age Geologic Units of the Texas Coastal Plain. Minerals 2022, 12, 420. [Google Scholar] [CrossRef]
  10. Teeple, A.P. Data Used for Developing a Composite Hydrogeologic Framework for Inclusion in a Geoenvironmental Assessment of Undis-covered Uranium Resources in Pliocene- to Pleistocene-Age Geologic Units of the Texas Coastal Plain, U.S. Geological Survey Data Release; U.S. Geological Survey: Reston, VA, USA, 2022. [CrossRef]
  11. Natural Resources Conservation Service (NRCS). Soil Survey Geographic (SSURGO) Database for Texas; United States Department of Agriculture: Temple, TX, USA, 2017.
  12. Stengel, V.G.; Humberson, D.G.; Gallegos, T.J. Conterminous U.S. Air Stagnation Index, Number of Days, 2007–2016: U.S. Geological Survey Data Release; U.S. Geological Survey: Reston, VA, USA, 2020. [CrossRef]
  13. Walton-Day, K.; Blake, J.M.; Seal, R.R.; Gallegos, T.J.; Dupree, J.; Becher, K. Geoenvironmental Model for Roll-Type Uranium Deposits in the Texas Gulf Coast. Minerals, 2022; in press. [Google Scholar]
  14. Hall, S.M.; Mihalasky, M.J.; Tureck, K.R.; Hammarstrom, J.M.; Hannon, M.T. Genetic and grade and tonnage models for sandstone-hosted roll-type uranium deposits, Texas Coastal Plain, USA. Ore Geol. Rev. 2017, 80, 716–753. [Google Scholar] [CrossRef]
  15. Weinzapfel, A. Guidebook: Texas Uranium Belt 1981; South Texas Geological Society: San Antonio, TX, USA, 1981; p. 16, (Unpaginated). [Google Scholar]
  16. Gallegos, T.J.; Bern, C.R.; Birdwell, J.E.; Haines, S.S.; Engle, M.A. The Role of Water in Unconventional In Situ Energy Resource Extraction Technologies In Food, Energy, and Water: The Chemistry Connection; Ahuja, S., Ed.; Elsevier: Waltham, MA, USA, 2015; pp. 183–211. [Google Scholar]
  17. U.S. Nuclear Regulatory Commission. Environmental Impact Statement for the Lost Creek ISR Project in Sweetwater County, Wyoming Supplement to the Generic Environmental Impact Statement for In-Situ Leach Uranium Milling Facilities: Final Report; U.S. Nuclear Regulatory Commission: Washington, DC, USA, 2011; p. 735.
  18. Uranium Energy Corp. Goliad Project: Draft Environmental Assessment for a Proposed In Situ Uranium Mining Facility-License Application No. R06064; Uranium Energy Corp.: Corpus Christi, TX, USA, 2011. [Google Scholar]
  19. Dahlkamp, F.J. Uranium Deposits of the World: USA and Latin America; Springer: Berlin, Germany, 2010. [Google Scholar]
  20. Davis, J.A.; Curtis, G.P. Consideration of Geochemical Issues in Groundwater Restoration at Uranium in-situ Leach Mining Facilities; NUREG/CR-6870; U.S. Nuclear Regulatory Commission. Division of Fuel, Engineering, and Radiological Research & U.S. Geological Survey: Washington, DC, USA, 2007.
  21. Dahlkamp, F.J. Uranium Ore Deposits; Springer: Berlin, Germay, 1993. [Google Scholar]
  22. U.S. Environmental Protection Agency. Final Environmental Impact Statement for Standards for the Control of Byproduct Materials from Uranium Ore Processing (40 CFR 192): Volume 1; EPA 520/1-83-008; U. S. Envioronmental Protection Agency: Washington, DC, USA, 1983; p. 291.
  23. Buma, G.; Johnson, P.H.; Bienek, G.K.; Watson, C.G.; Noyes, H.; Capuano, R. Analysis of Groundwater Criteria and Recent Restoration Attempts after In Situ Uranium Leaching; U.S. Bureau of Mines: Washington, DC, USA, 1981; p. 302.
  24. U.S. Environmental Protection Agency. Report to Congress: Potential Health and Environmental Hazards of Uranium Mine Wastes; EPA 520/1·63-007; U. S. Envioronmental Protection Agency: Washington, DC, USA, 1983; p. 782.
  25. Nicot, J.P.; Scanlon, B.R.; Yang, C.; Gates, J.B. Geological and Geographical Attributes of the South Texas Uranium Province; Bureau of Economic Geology and Texas Commission on Environmental Quality: Austin, TX, USA, 2010; p. 156. [Google Scholar]
  26. Kasmarek, M.C.; Robinson, J.L. Hydrogeology and Simulation of Ground-Water Flow and Land-Surface Subsidence in the Northern Part of the Gulf Coast Aquifer System, Texas: U.S. Geological Survey Scientific Investigations Report 2004-5102; U.S. Geological Survey: Reston, VA, USA, 2004; p. 111. [CrossRef]
  27. Baker, E.T. Stratigraphic and Hydrogeologic Framework of Part of the Coastal Plain of Texas: Texas Department of Water Resources Report 236; U.S. Geological Survey: Reston, VA, USA, 1979; p. 43.
  28. Solis, I. Upper Tertiary and Quaternary depositional systems, Central Coastal Plain, Texas: Report of Investigations No. 108; The University of Texas at Austin, Bureau of Economic Geology: Austin, TX, USA, 1981; p. 89. [Google Scholar]
  29. George, P.G.; Mace, R.E.; Petrossian, R. Aquifers of Texas: Report 380; Texas Water Development Board: Austin, TX, USA, 2011; p. 182.
  30. Young, S.C.; Knox, P.R.; Baker, E.; Budge, T.; Hamlin, S.; Galloway, B.; Kalbouss, R.; Deeds, N. Hydrostratigraphy of the Gulf Coast Aquifer from the Brazos River to the Rio Grande; Texas Water Development Board: Austin, TX, USA, 2010; p. 203. Available online: https://www.twdb.texas.gov/publications/reports/contracted_reports/doc/0804830795_Gulf_coast_hydrostrati.graphy_wcover.pdf (accessed on 12 October 2021).
  31. Young, S.C.; Ewing, T.; Hamlin, S.; Baker, E.; Lupton, D. Updating the Hydrogeologic Framework of the Northern Portion of the Gulf Coast Aquifer; Texas Water Development Board: Austin, TX, USA, 2012; p. 285. Available online: https://www.twdb.texas.gov/publications/reports/contracted_reports/doc/1004831113_GulfCoast.pdf (accessed on 12 October 2021).
  32. Young, S.C.; Jigmond, M.; Deeds, N.; Blainey, J.; Ewing, T.E.; Banerj, D. Final Report—Identification of Potential Brackish Groundwater Production Area—Gulf Coast Aquifer System: Prepared for the Texas Water Development Board; Texas Water Development Board: Austin, TX, USA, 2016; p. 636. Available online: https://www.twdb.texas.gov/publications/reports/contracted_reports/doc/1600011947_InteraGulf_Coast_Brackish.pdf?d=12869.600000023842 (accessed on 1 March 2022).
  33. Strom, E.W.; Houston, N.A.; Garcia, C.A. Selected Hydrogeologic Datasets for the Evangeline Aquifer, Texas: U.S. Geological Survey Open-File Report 03-298, 1 CD-ROM; U.S. Geological Survey: Reston, VA, USA, 2003. [Google Scholar] [CrossRef]
  34. Strom, E.W.; Houston, N.A.; Garcia, C.A. Selected Hydrogeologic Datasets for the Chicot Aquifer, Texas: U.S. Geological Survey Open-File Report 03-297, 1 CD-ROM; U.S. Geological Survey: Reston, VA, USA, 2003. [Google Scholar] [CrossRef]
  35. Smith, K.S. Strategies to predict metal mobility in surficial mining environments. In Understanding and Responding to Hazardous Substances at Mine Sites in the Western United States; DeGraff, J.V., Ed.; Geological Society of America Reviews in Engineering Geology; Geological Society of America: Boulder, CO, USA, 2007; Volume XVII, pp. 25–45. [Google Scholar]
  36. Perel’man, A.I. Geochemical barriers: Theory and practical applications. Appl. Geochem. 1986, 1, 669–680. [Google Scholar] [CrossRef]
  37. National Oceanic and Atmospheric Administration. Air Stagnation Index Maps; NOAA: Washington, DC, USA. Available online: https://www.ncdc.noaa.gov/societal-impacts/air-stagnation/201808 (accessed on 7 June 2017).
  38. Wang, J.X.L.; Angell, J.K. Air Stagnation Climatology for the United States (1948–1998). In NOAA/Air Resources Laboratory ATLAS, No.1; NOAA: Washington, DC, USA, 1999. [Google Scholar]
  39. U.S. Environmental Protection Agency. Stormwater Phase II Final Rule: Construction Rainfall Erosivity Waiver Fact Sheet; USEPA Office of Water: Washington, DC, USA, 2012; p. 12.
  40. U.S. Department of Agriculture. Revised Universal Soil Loss Equation Version 2 (RUSLE2) Handbook; U.S. Department of Agriculture: Washington, DC, USA, 2001; p. 81. Available online: https://www.nrcs.usda.gov/Internet/FSE_DOCUMENTS/nrcs144p2_025079.pdf (accessed on 5 March 2022).
  41. Reitz, M.; Sanford, W.E.; Senay, G.B.; Cazenas, J. Annual Estimates of Recharge, Quick-Flow Runoff, and ET for the Contiguous US Using Empirical Regression Equations, 2000-2013: U.S. Geological Survey Data Release; U.S. Geological Survey: Reston, VA, USA, 2017. [CrossRef]
  42. Mudd, G.M.; Diesendorf, M. Sustainability of uranium mining and milling: Toward quantifying resources and eco-efficiency. Environ. Sci. Technol. 2008, 42, 2624–2630. [Google Scholar] [CrossRef] [PubMed]
  43. Mudd, G.M. The future of yellowcake: A global assessment of uranium resources and mining. Sci. Total Environ. 2014, 472, 590–607. [Google Scholar] [CrossRef] [PubMed]
  44. Khan, Q.; Liaqat, M.U.; Mohamed, M.M. A comparative assessment of modeling groundwater vulnerability using DRASTIC method from GIS and a novel classification method using machine learning classifiers. Geocarto Int. 2021, 1–19. [Google Scholar] [CrossRef]
Figure 1. Map depicting the Texas Coast Plain. This study focused on the tract delineated by Mihalasky, Hall, and others 2015 [1] consisting of the Goliad Sand, Willis Sand, and Lissie Formation, permissive for the occurrence of undiscovered uranium resources, surficial alluvial sediments and associated above-ground areas and aquifer units. Shown also are the Houston and Rio Grande Embayments separated by the San Marcos Arch.
Minerals 12 00747 g001
Figure 2. Source-to-receptor model for the geoenvironmental assessment modified after Gallegos et al. [3]. In situ recovery (ISR) is the method that has been used to extract uranium from the Goliad Sand.
Minerals 12 00747 g002
Figure 3. Conceptual source-to-receptor model for in situ uranium recovery (ISR) of undiscovered uranium resources in the Goliad Sand, Willis Formation, and Lissie Formation and alluvial sediments in the Texas Coastal Plain. Pathways are not listed in any specific order or importance.
Minerals 12 00747 g003
Figure 4. Maps of equivalent (a) hydraulic conductivity, (b) transmissivity, and (c) saturated thickness for the composite aquifer system (Aquifers: Alluvial, Chicot, Evangeline) in the assessment unit [9,10]. Map of (d) effective recharge [8] within the permissive tract; the maximum effective recharge of 0.53 m/a is found in the Houston Embayment.
Minerals 12 00747 g004
Figure 5. Spatial plots of the mode of the environmental conditions by hydrologic unit code (HUC) reported in (a) NURE groundwater data and (b) NURE surface water data. (c) Distribution of environmental conditions from Blake et al., 2022 [7].
Minerals 12 00747 g005
Figure 6. (a) The 10-year air stagnation index showing the percentage of days meeting criteria for air stagnation from 2007 to 2016 [12,37] and (b) R factor [11].
Minerals 12 00747 g006
Figure 7. Maps indicating the potential for the persistence of (a,b) surface-derived COPCs in groundwater, (c,d) the migration of COPCs into adjacent aquifers, and (e,f) the runoff of COPCs from wastes stored at the surface into surface waters in the Rio Grande and Houston Embayments. Note that gray scales are different for each map.
Minerals 12 00747 g007
Table 1. Summary of modeled environmental footprints for the amounts of undiscovered uranium indicated at stated percentiles of probability distribution in the Goliad Sand/Willis Sand/Lissie Formation projected in the undiscovered uranium resource assessment [1].
Rio Grande EmbaymentHistorical Factor 2 (per t U3O8)Mean10th Percentile50th Percentile90th Percentile
Indicated amount of undiscovered U3O8 (t) associated with stated percentile of probability distribution 1-3.0 × 1045.9 × 1042.4 × 1049.0 × 103
Mine Area (m2)1.8 × 1035.3 × 1071.1 × 1084.3 × 1071.6 × 107
Min. Affected Aquifer Volume 3 (m3)6.6 × 1022.0 × 1073.9 × 1071.6 × 1076.0 × 106
Mine Pore Volume 3 (m3)1.9 × 1025.8 × 1061.1 × 1074.7 × 1061.8 × 106
Water pumped during uranium production (m3)3.5 × 1041.1 × 1092.1 × 1098.5 × 1083.2 × 108
Water extracted during restoration 3 (m3)4.4 × 1031.3 × 1082.6 × 1081.1 × 1084.0 × 107
Total Water disposed (m3)1.8 × 1035.4 × 1071.1 × 1084.3 × 1071.6 × 107
Water disposed during uranium production (non-restoration) (m3)7.0 × 1022.1 × 1074.1 × 1071.7 × 1076.4 × 106
Water disposed during restoration 3 (m3)1.5 × 1034.6 × 1079.1 × 1073.7 × 1071.4 × 107
Radon Emitted (Bq)1.1 × 10113.2 × 10156.3 × 10152.5 × 10159.6 × 1014
Houston EmbaymentHistorical Factor 2 (per t U3O8)Mean10th Percentile50th percentile90th percentile
Indicated amount of undiscovered U3O8 (t) associated with stated percentile of probability distribution 1-3.2 × 1037.3 × 1032.4 × 1031.7 × 102
Mine Area (m2)1.8 × 1035.7 × 1061.3 × 1074.3 × 1063.0 × 105
Min. Affected Aquifer Volume 3 (m3)6.6 × 1022.1 × 1064.8 × 1061.6 × 1061.1 × 105
Mine Pore Volume 3 (m3)1.9 × 1026.2 × 1051.4 × 1064.7 × 1053.3 × 104
Water pumped during uranium production (m3)3.5 × 1041.1 × 1082.6 × 1088.5 × 1075.9 × 106
Water extracted during restoration 3 (m3)4.4 × 1031.4 × 1073.2 × 1071.1 × 1077.4 × 105
Total Water disposed (m3)1.8 × 1035.7 × 1061.3 × 1074.3 × 1063.0 × 105
Water disposed during uranium production (non-restoration) (m3)7.0 × 1022.2 × 1065.1 × 1061.7 × 1061.2 × 105
Water disposed during restoration 3 (m3)1.5 × 1034.9 × 1061.1 × 1073.7 × 1062.6 × 105
Radon Emitted (Bq)1.1 × 10113.4 × 10147.7 × 10142.5 × 10141.8 × 1013
Notes: 1 Source: [1], 2 See Equations (1)–(9) derived from study on historical data from six uranium ISR operations completed in the Goliad Sand in the Texas Coastal Plain [6]. 3 Data were derived from only five ISR operations.
Table 2. Hydrogeologic and geologic units, lithology, and thicknesses of the units that comprise the Gulf Coast aquifer system in the Texas Coastal Plain.
Hydrogeologic UnitGeologic UnitLithologyRelative Thickness (m) 1Maximum Thickness (m) 1
AlluvialAlluvial depositssands with silts and clays0–90 2unknown 2
ChicotBeaumont Formationclays, silts, and sands25–195 3436 3
ChicotLissie Formationreddish, orange, and grey fine- to coarse-grained and crossbedded sands40–190263
ChicotWillis Sandreddish, coarse and gravelly sands50–165286
EvangelineGoliad Sandmedium to coarse unconsolidated sands65–6701328
EvangelineLagarto Clay (upper part)fine to coarse unconsolidated sands and clays85–245486
Sources of data: [1,9,27,28,29,30,31,32]. 1 Values are modified from geologic layers found in Young and others (2010, 2012, and 2016). 2 The geologic layers from Young and others (2010, 2012, and 2016) did not include the alluvial deposits, so literature values were used. 3 Includes the thickness of any alluvial deposits present in the area.
Table 3. Summary statistics for the Rio Grande Embayment and the Houston Embayment within the Permissive Track Assessment.
Environmental ConditionMinMaxRangeMeanStd. Dev.Median
Effective Recharge (m/a) 1
Houston Embayment
Environmental Condition 200.30.30.090.070.099
Environmental Condition 300.480.480.030.070
Environmental Condition 7000000
Environmental Condition 1000.270.270.080.080.076
Environmental Condition 1100.530.530.040.090
Rio Grande Embayment
Environmental Condition 200.040.0400.010
Environmental Condition 300.320.320.010.020
Environmental Condition 400.040.0400.010
Environmental Condition 700.160.160.010.020
Environmental Condition 1100.090.09000
R factor 1
Houston Embayment
Environmental Condition 23504308040027400
Environmental Condition 330040010034414350
Environmental Condition 43303502033810330
Environmental Condition 730030003000300
Environmental Condition 1043043004300430
Rio Grande Embayment
Environmental Condition 230030003000300
Environmental Condition 32603004028512280
Environmental Condition 42703003027913270
Environmental Condition 72603004027711280
Environmental Condition 826026002600260
Percentage of Days Meeting the Criteria for Air Stagnation During the 10-year Period from 2017–2016
Houston (HE)162711181.218
Rio Grande (RE)183922244.423
Equivalent Hydraulic Conductivity (m/d) 1
Houston Embayment
Environmental Condition 20.08.78.74.12.33.9
Environmental Condition 30.015.215.24.41.84.3
Environmental Condition 73.54.61.14.00.33.9
Environmental Condition 101.76.95.34.31.54.2
Environmental Condition 111.111.010.04.41.74.0
Rio Grande Embayment
Environmental Condition 20.68.88.24.73.12.6
Environmental Condition 30.08.78.72.52.51.4
Environmental Condition 40.31.41.10.70.40.7
Environmental Condition 70.07.27.23.02.02.1
Note: 1 The environmental conditions for the R factor would be in surface water, and those for effective recharge and hydraulic conductivity would be in groundwater.
Publisher’s Note: MDPI stays neutral with regard to jurisdictional claims in published maps and institutional affiliations.

