Article

Optimization and Stability of the Bottom Structure Parameters of the Deep Sublevel Stope with Delayed Backfilling

1
School of Civil and Resources Engineering, University of Science and Technology Beijing, Beijing 100083, China
2
State Key Laboratory of High-Efficient Mining and Safety of Metal Mines of Ministry of Education, University of Science and Technology Beijing, Beijing 100083, China
*
Authors to whom correspondence should be addressed.
Minerals 2022, 12(6), 709; https://doi.org/10.3390/min12060709
Submission received: 8 April 2022 / Revised: 17 May 2022 / Accepted: 30 May 2022 / Published: 1 June 2022
(This article belongs to the Topic Mining Safety and Sustainability)

Abstract

:
This study analyzes the stability and optimizes the parameters of the bottom structure in sublevel stoping with the delayed backfilling method, improves production efficiency, and increases the ore recovery ratio under the premise of ensuring safe production. Theoretical formulas are used to calculate the stability of the pillar with the bottom structure. Numerical simulation is used to study the stability of muck slash during excavation. Finally, the optimization parameters of the bottom structure are obtained by combining a similar physical experimental model and numerical simulation. The results show that the excavation of the muck slash caused different degrees of deformation at the roof and floor of the roadway. The largest stress occurred at the roadway crossing, whereas the smallest stress was in the middle area. The excavation also caused the secondary stress concentration at the adjacent bottom structure but did not significantly impact its stability. During the mining process, the largest displacement deformation occurred at the roadway crossing, and the influence of mining disturbance on the stability of the bottom structure involves timeliness and periodicity. Considering the recovery ratio, dilution ratio, and stability, the spacing of the extracted ore drift is recommended to be 9 m. This study ensures the stability of the bottom structure in the mining process and obtained reasonable parameters of the extracted ore drift, which provides a scientific way for the mines that use sublevel stoping with the delayed backfilling method.

1. Introduction

The bottom structure of the sublevel stoping with the delayed backfill method is a chamber group composed of a series of muck slash, drilling drift, and extracted ore drift [1]. The layout and parameters of the bottom structure have a great influence on the efficiency of the mining method, labor productivity, ore blocked out, ore dilution and loss, and drawing work safety. Its stability is the key to ensuring the safety and efficiency of ore mining [2,3]. However, in the mining process, it will be subjected to the stress redistribution caused by excavation disturbance and the rock burst effect caused by stope blasting and ore falling [4]. Especially after entering deep mining, given complex factors such as high ground stress and dynamic disturbance, the deformation of the bottom structure roadway is significantly increased, and the stability problem is prominent, which poses a great threat and trouble to the safety of stope production and the efficient recovery of ore. Furthermore, the shallow mining method is challenging to apply to the subsequent deep mining of the mine [5].
In recent years, research on the bottom structure of stope has mainly optimized the main parameters and determined the optimal bottom structure form of stope using theoretical formulas and mathematical analysis. It predicted the failure of the roof, floor, and surrounding rock [6,7,8,9,10,11,12,13,14,15,16] and analyzed the stability of the bottom structure in the process of excavation disturbance combined with numerical simulation [17,18,19,20,21,22,23]. Previous studies have mainly focused on the parameter design of the muck slash in the caving method and the distribution and change of stress in excavation disturbance. Different muck slash was selected according to the technical and economic indicators, such as the ore recovery ratio. The stability of the stope bottom structure was analyzed from the surrounding rock of the bottom structure, the support of the roadway, and the interaction between ore and rock [24,25,26,27,28,29,30,31]. However, studies on the bottom structure of the sublevel stoping with the delayed backfill method are limited, and the parameter optimization of the extracted ore drift is also less involved. Therefore, studying the relevant parameters of the extracted ore drift is crucial to the loss and dilution of the ore in the mining process.
Empirical formula and FLAC3D numerical simulation software are used to study the stability, stress variation characteristics, displacement characteristics, and failure characteristics of the bottom structure in different periods of the sublevel stoping with the delayed backfill method and evaluate the stability of the bottom structure. A similar physical model test and PFC3D particle flow software are also used to examine the influence of the spacing between the extracted ore drift in the bottom structure of the stope on the ore loss and dilution level. A set of optimal parameters are here estimated to provide a basis for designing the bottom structure in the sublevel stoping with the delaying backfilling mining method.

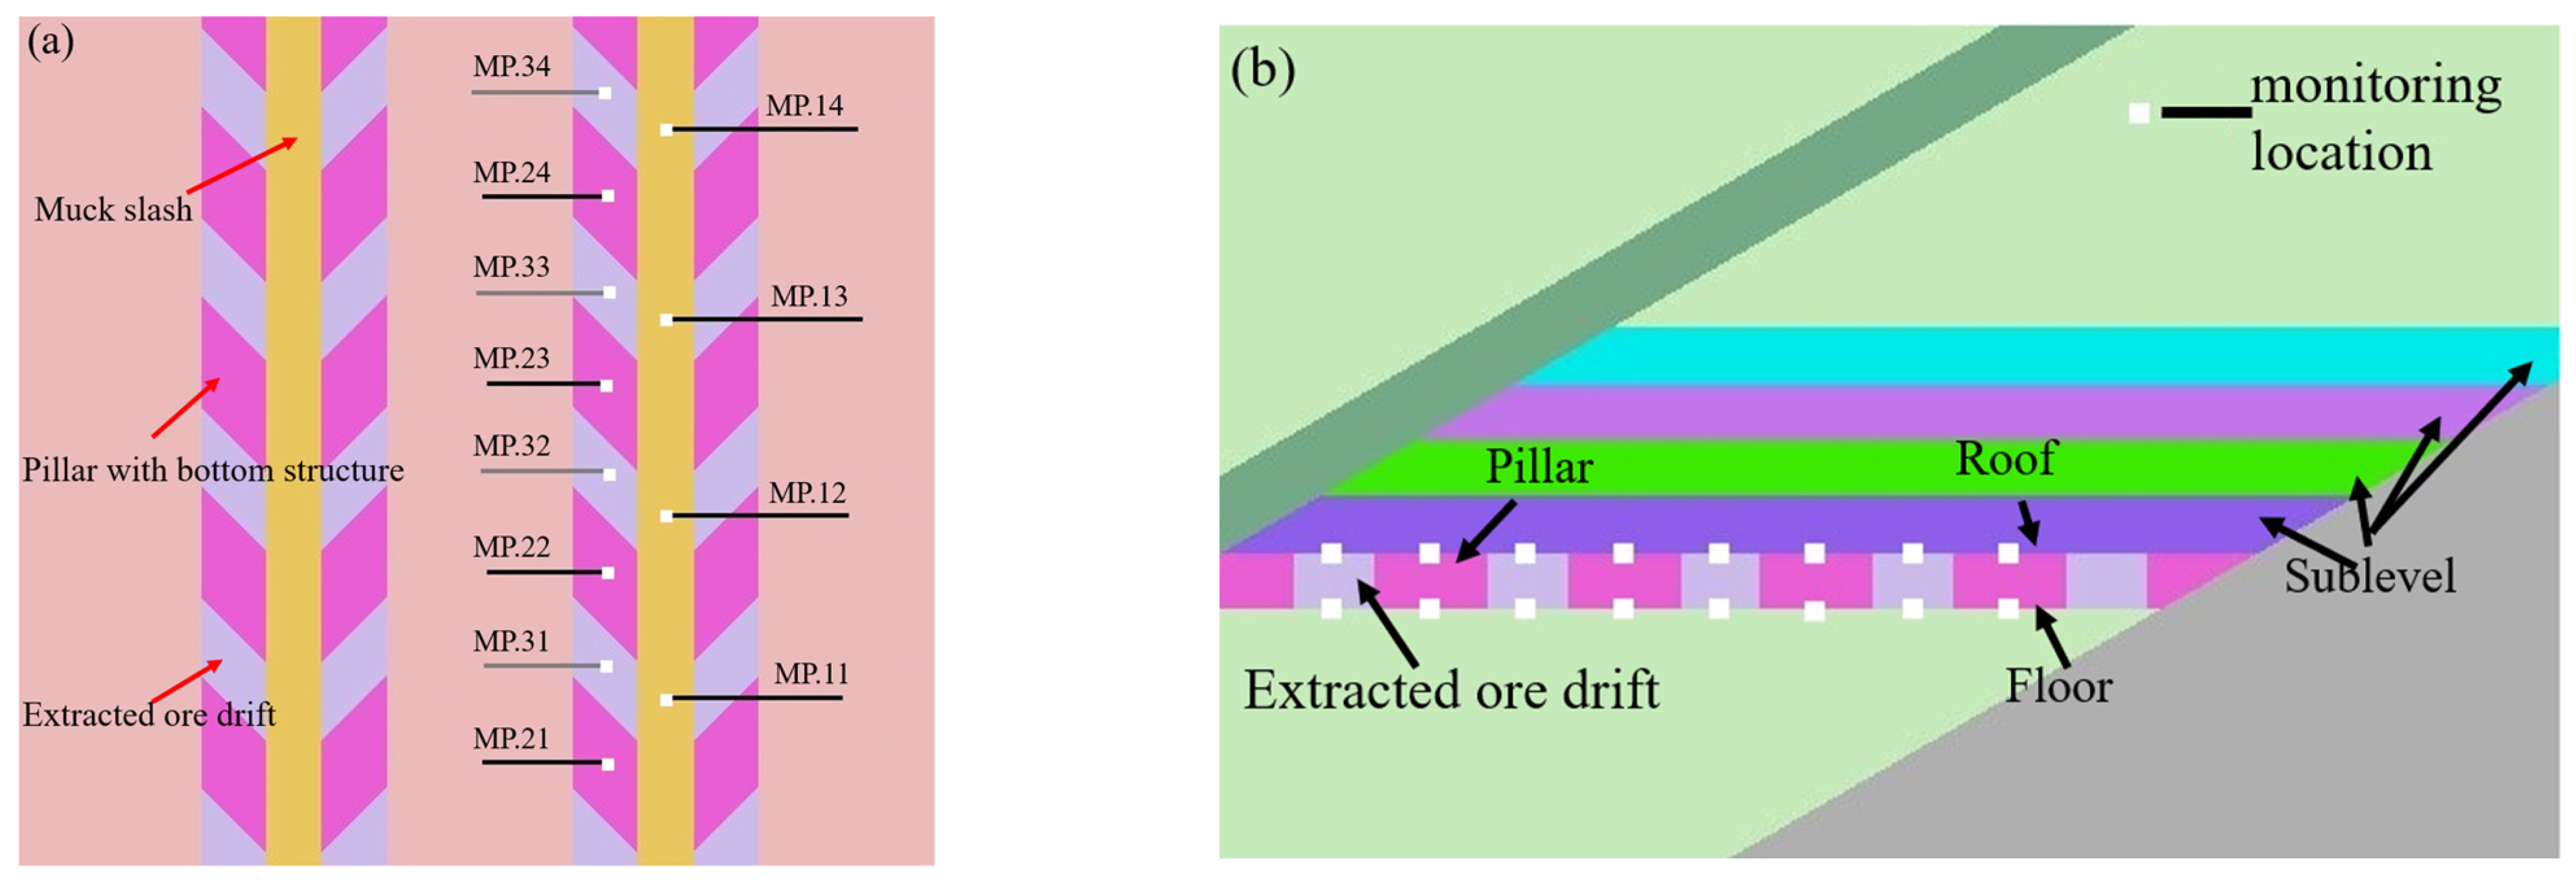
2. Engineering Background

A gold mine adopts sublevel stoping with the delayed backfill method. The orebody level of a gold mine is −600–155 m. In order to study the stability of the bottom structure in the mining, the first and second sublevel of −616 m is selected for analysis. The maximum horizontal thickness of the orebody in this area is 105 m, and the minimum thickness is 57 m. The dip angle of the orebody close to the hanging wall is 25°, and the dip angle of the footwall is 48°. According to the actual geological work on site, the mine rock is mainly composed of granitic rock and has good stability. The physical and mechanical parameters of mine rock are shown in Table 1.
In the mining, the ore body is mined from bottom to top, in the order of room to pillar. The width of the room and pillar in the stope is 10 m, the sublevel height is 15 m, the bank height is 60 m, and the length of the room is the horizontal thickness of the ore body. The section size of the stope track is 3.2 m × 3.0 m, and the section size of the air connection is 2.0 m × 2.0 m. The stope model is established through SURPAC, as shown in Figure 1.

3. Stability Analysis of Bottom Structure

3.1. Study on Size of Bottom Structure

In the sublevel stoping with the delayed backfill method, the bottom structure of the muck slash can be simplified to a single pillar. In theory, the tangential stress on the sidewall surface of the pillar is the largest. The pillar’s surface is affected by dynamic loads, such as mining blasting in practice. The fissure is abnormally developed, forming a ground stress fracture layer of 0.4–1 m, and the maximum stress value is transferred to the center of the pillar [32]. According to structural mechanics theory, when calculating the strength of pillars, the stress distribution in continuous or discontinuous pillars is uniform, and the stress mainly causes the failure of pillars in the vertical direction [33]. The pillar calculation generally does not consider the pillar weight unless it is very high. The required cross-sectional area to ensure pillar strength can be calculated according to the allowable bearing strength equation, as in Equation (1) [34]:
S γ H k s σ o k f n
where S represents pillar support area (m2), γ represents rock bulk density (kg/m3), H represents stope distance to surface depth (m), k represents load coefficient, s represents the cross-sectional area of the pillar (m2), σ0 represents the UCS of the pillar (MPa), and n represents safety factor (3–5 when the surface does not allow collapse or long-term retention).
The equation of relative pillar area is obtained from Equation (1), as shown in Equation (2):
s S γ H k σ o k f
When calculating the strength of the pillar, ensuring that the pillar is not affected by blasting shock and avoiding the longitudinal bending of the pillar are necessary. Therefore, the condition that the unknown parameter kf needs to meet is kf ≥ 2ω, where ω is the minimum resistance line of the room blasting. According to the mechanical parameters of mine rock in Table 1, at the level of −616 m, kf = 1.2, n = 2, k = 0.6, and the length of the pillar edge is a. The pillar size obtained from Equation (2) satisfies the following conditions:
a ≥ 4.29 m,
Field investigation reveals that, at −616 m level, the pillar with a small size and less than 4 m has different degrees of damage, but the size greater than 4 m, there is basically no failure form. Figure 2 is the typical failure form of the pillar in the field; most of the failures occurred at the root of the pillar. Figure 2a shows that three obvious parallel joints run through the pillar, and shear failure occurs along the joint surface under pressure. Over time, the failure will expand from the surface to the interior and eventually lose the support capacity. Figure 2b shows poor pillar stability. The root has been broken, which is prone to instability. In the later stage, the corresponding types of cross-section pillars should be strengthened.

3.2. Numerical Simulation

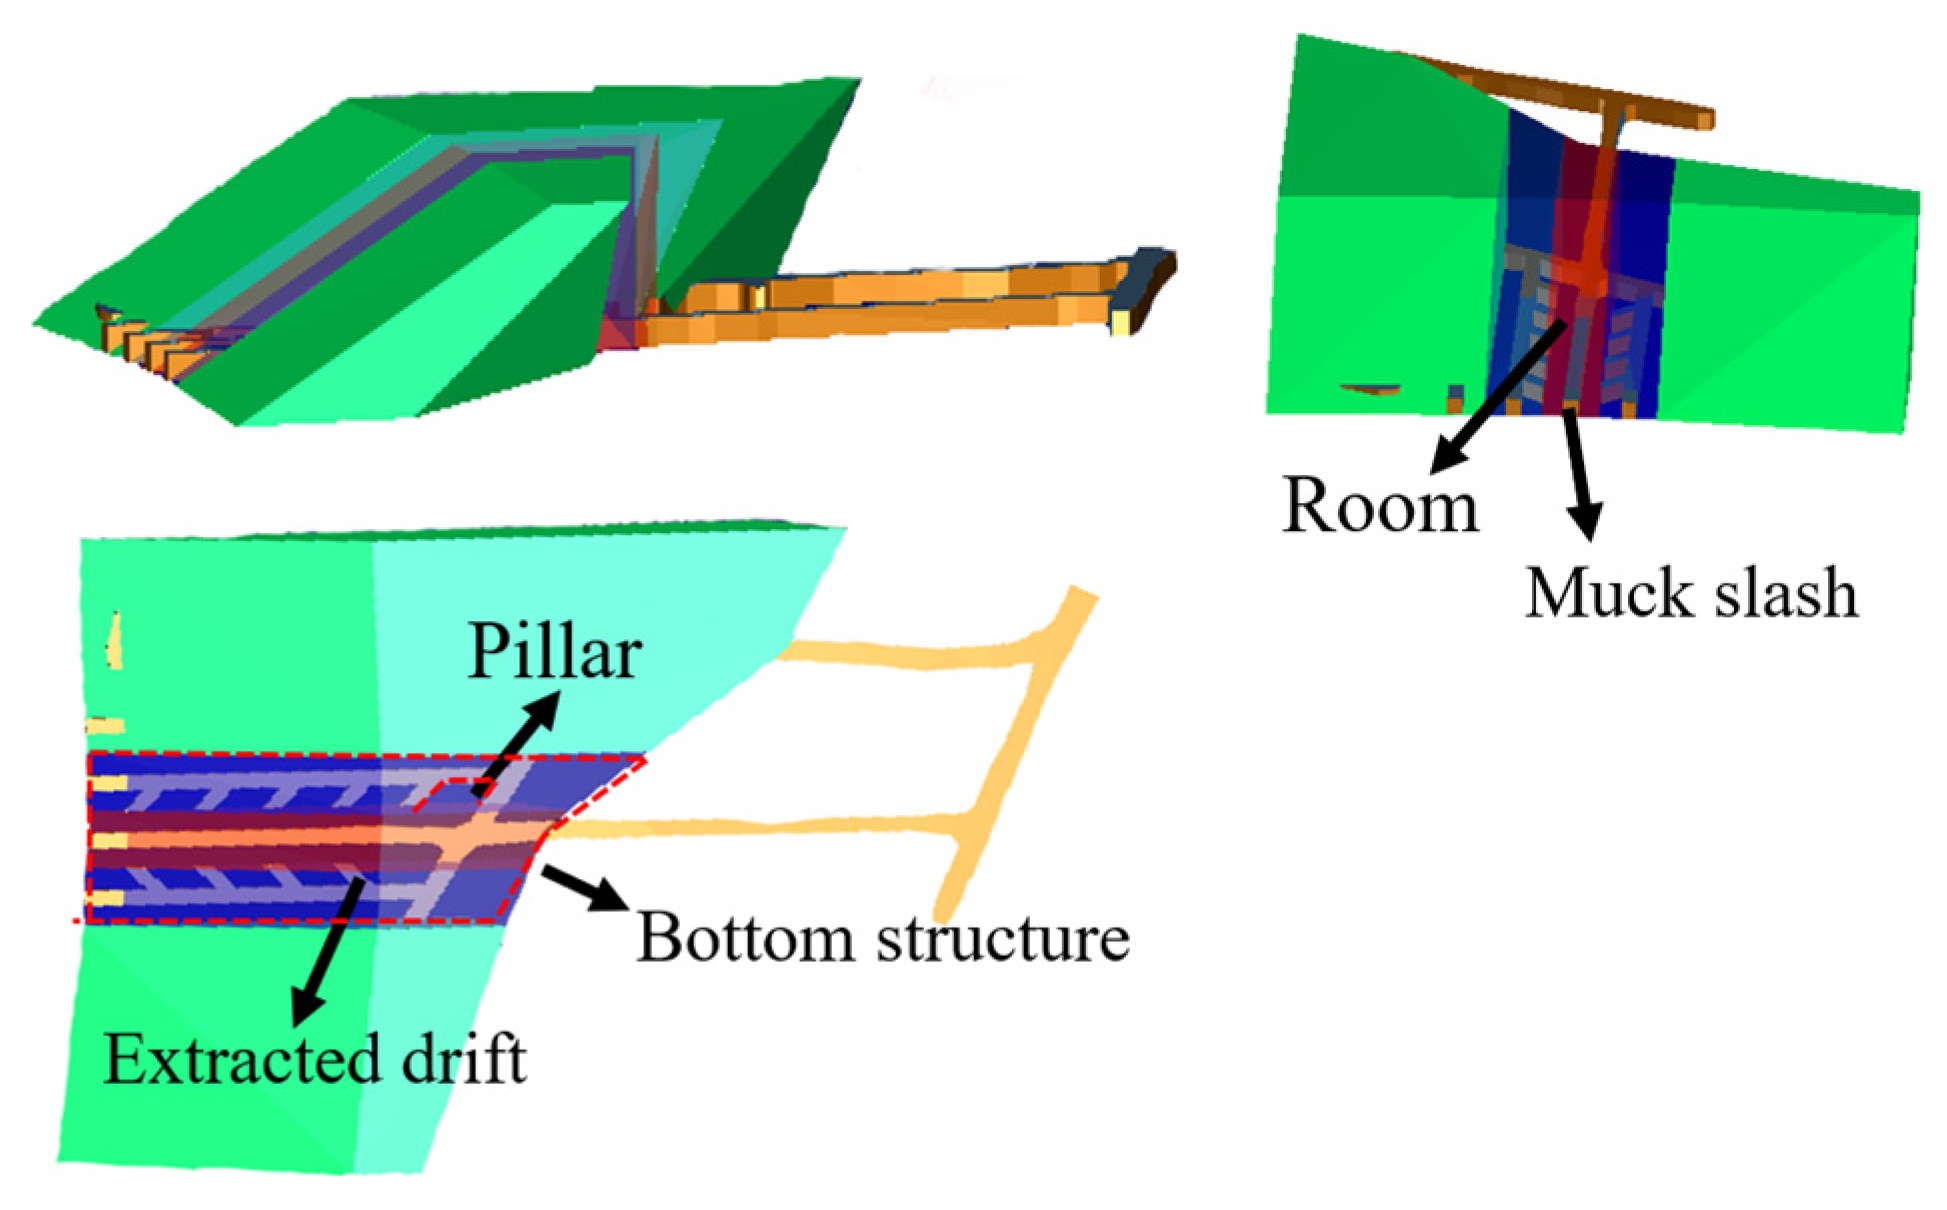
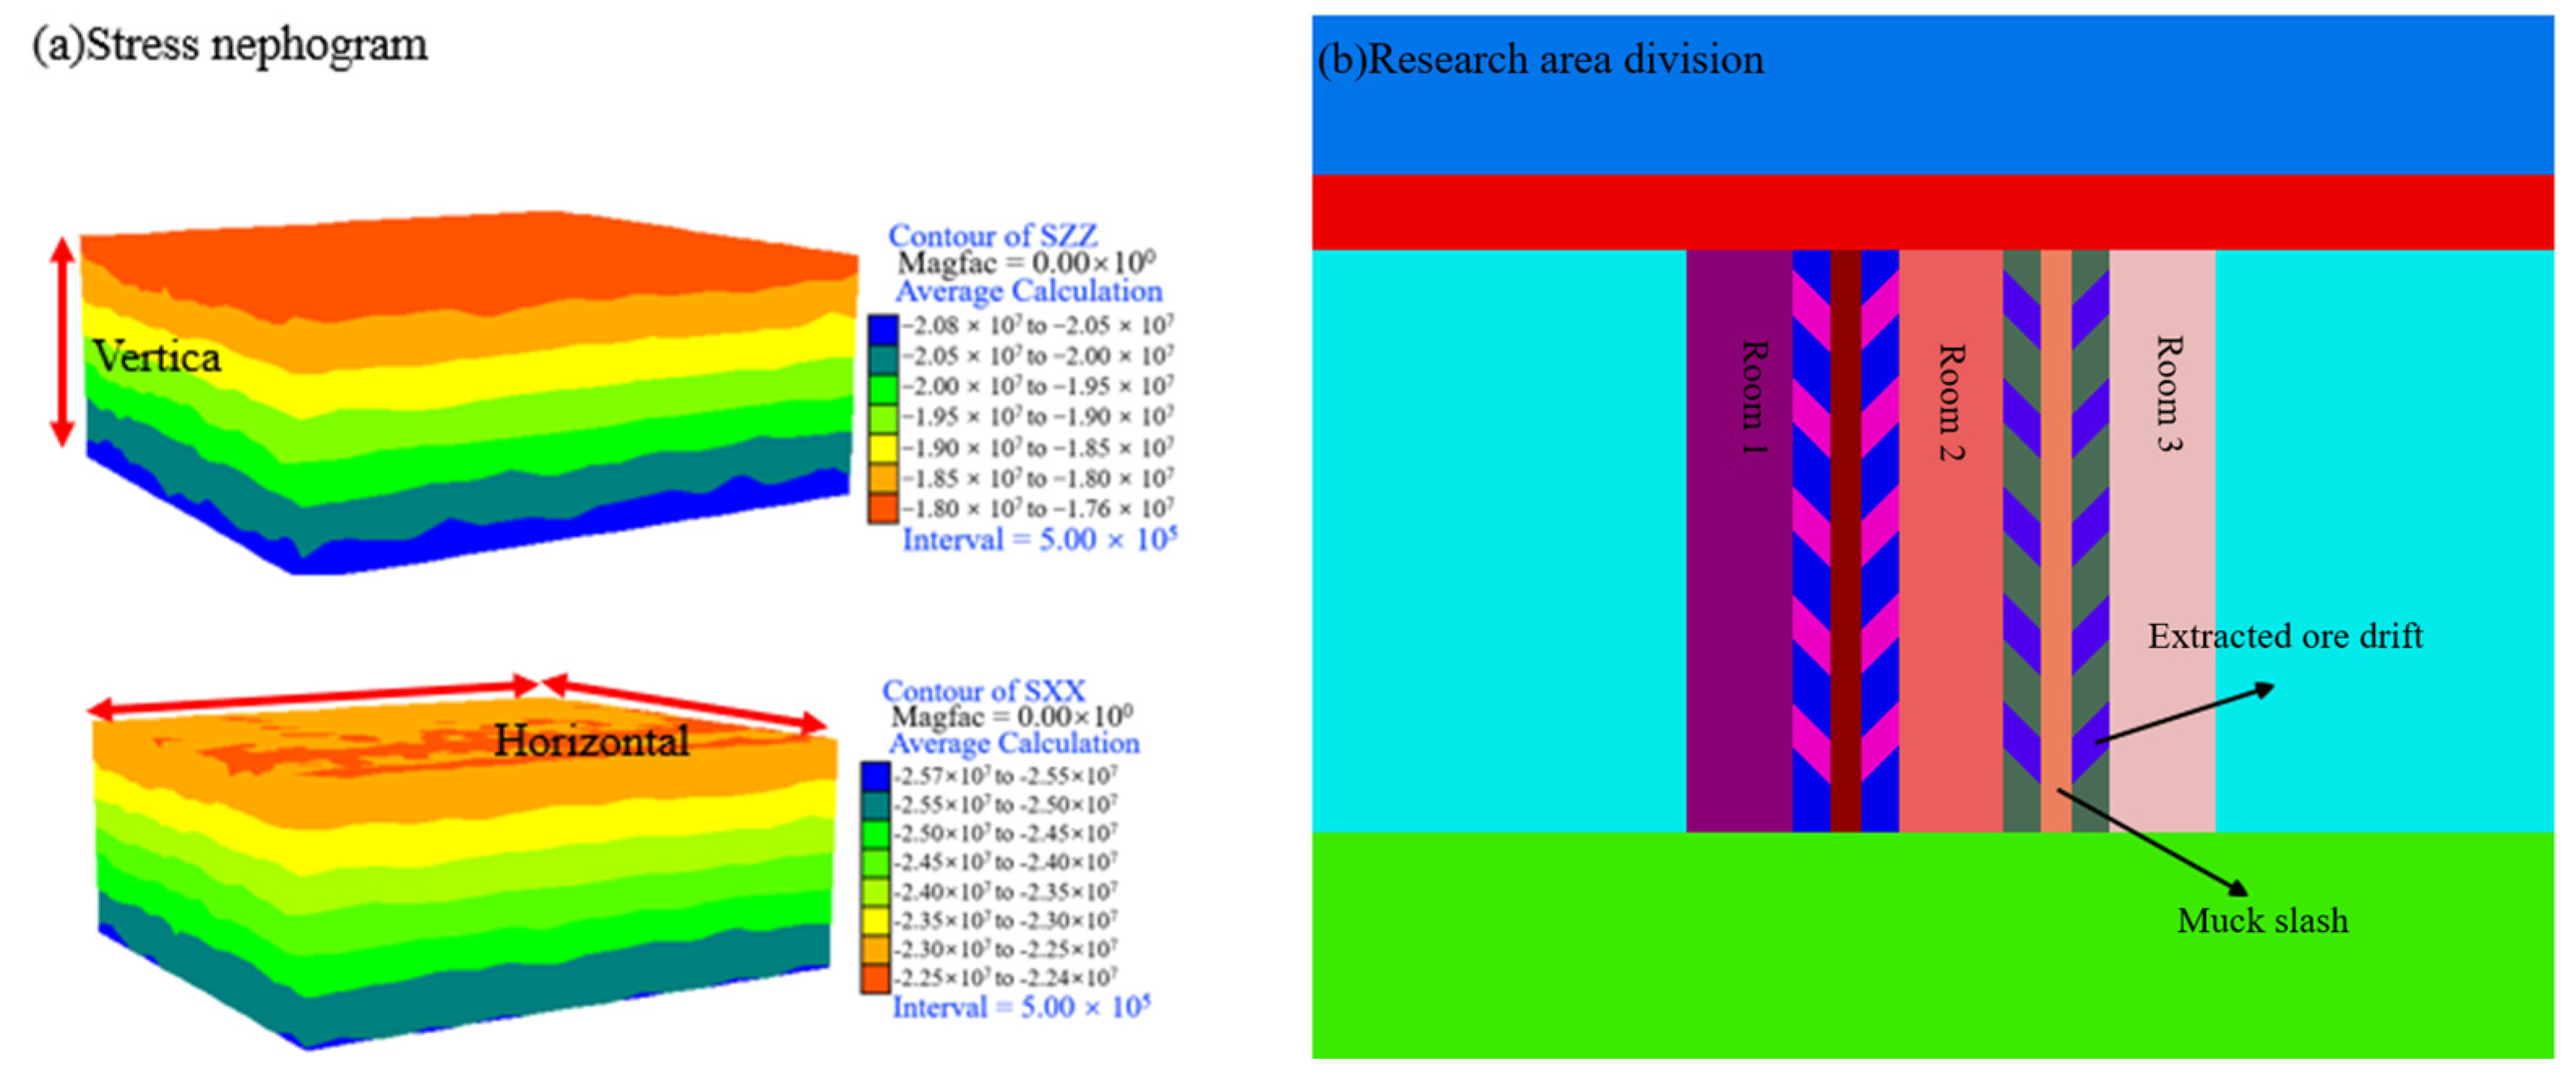
3.2.1. Establish Model

For the stability analysis of the bottom structure, given the complex ground stress, the general theoretical calculation cannot be completed. Therefore, this study uses numerical analysis to simulate the ultimate span between the extracted ore drift of deep stope under the condition of no support. According to the actual situation of the mine, considering the Saint-Venant principle, the influence of boundary on the excavation of the central stope is reduced, and the calculation range is selected to be more than three times that of the excavation area. Considering the ore body and surrounding rock and the pitch angle, the length, width, and height are determined to be 300 m × 270 m × 120 m. After the model is established by ANSYS software (ANASYS2019, American ANSYS company), it is calculated by FLAC3D according to different lithological groups. The model is meshed by four-node tetrahedral elements. The calculation model is composed of 308,130 zones and 417,809 grid points. The mine rock mechanics parameters used in the calculation are shown in Table 2.
The stress field of underground engineering existed before excavation. In this simulation, the two-stage elastic–plastic solution was used to obtain the initial stress field of the stope in sedimentary consolidation through the gravity effect of the overlying formation. The stress state of rock mass at a depth of H from the surface is expressed in Equations (3) and (4). The Mohr–Coulomb criterion is used for the mechanical model of mine rock, as shown in Equation (5) [33].
σ x = σ y = μ 1 μ σ
σ 2 = γ H ,
f s = σ 1 σ 3 1 + s i n φ 1 s i n φ 2 c 1 + s i n φ 1 s i n φ
where γ represents Poisson ratio, M represents average rock weight, H represents depth from surface (m), c represents cohesion, φ represents the internal friction angle, and fs represents the destroy judgment coefficient.
Considering the constitutive characteristics of mine rock, the continuity of medium, and boundary conditions, the stress loaded on the top of the model is found to be 19.46 MPa, and the horizontal stress loaded on the model’s boundary is 24.3 MPa. Figure 3a shows the stress nephogram in the vertical and horizontal directions of the initial stress field, and Figure 3b shows the research area division of the model. This study selects the scheme with the minimum spacing between extracted ore drift of 7 m for numerical simulation. By analyzing the stability of the small spacing, the parameter basis is provided for the design of a larger spacing of the extracted ore drift, and the recovery ratio of the ore is improved under the premise of ensuring safety.

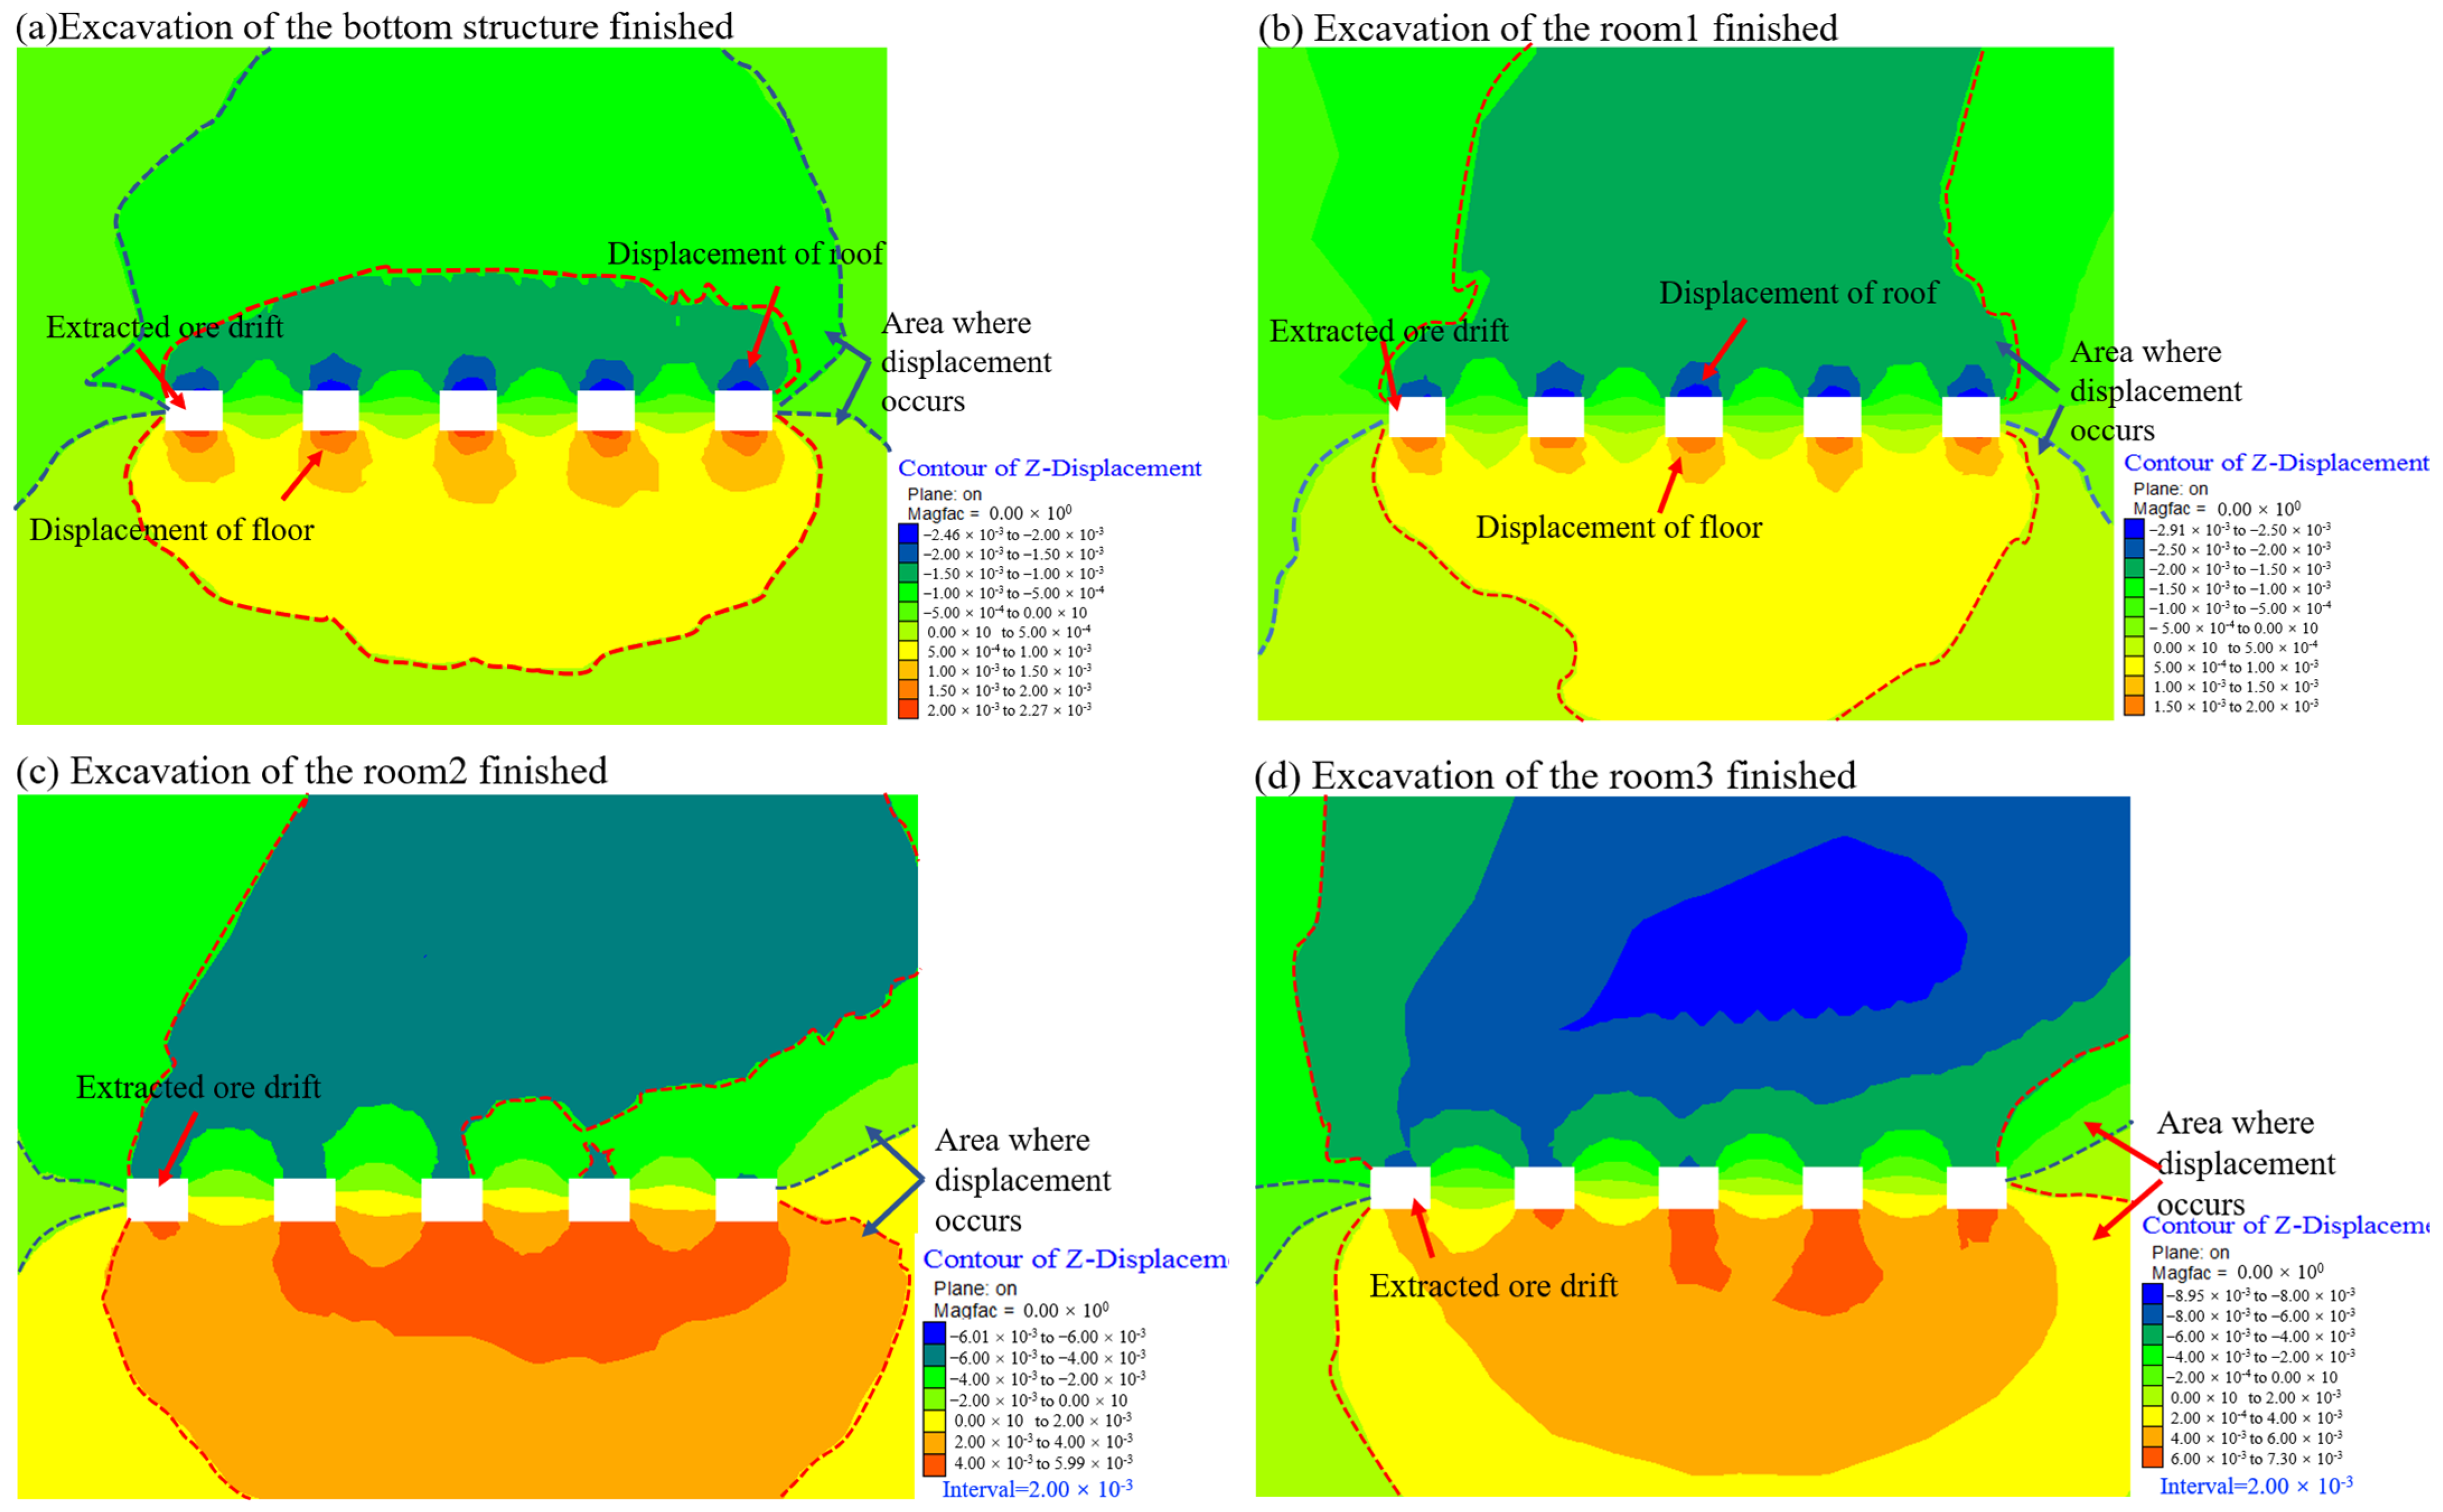
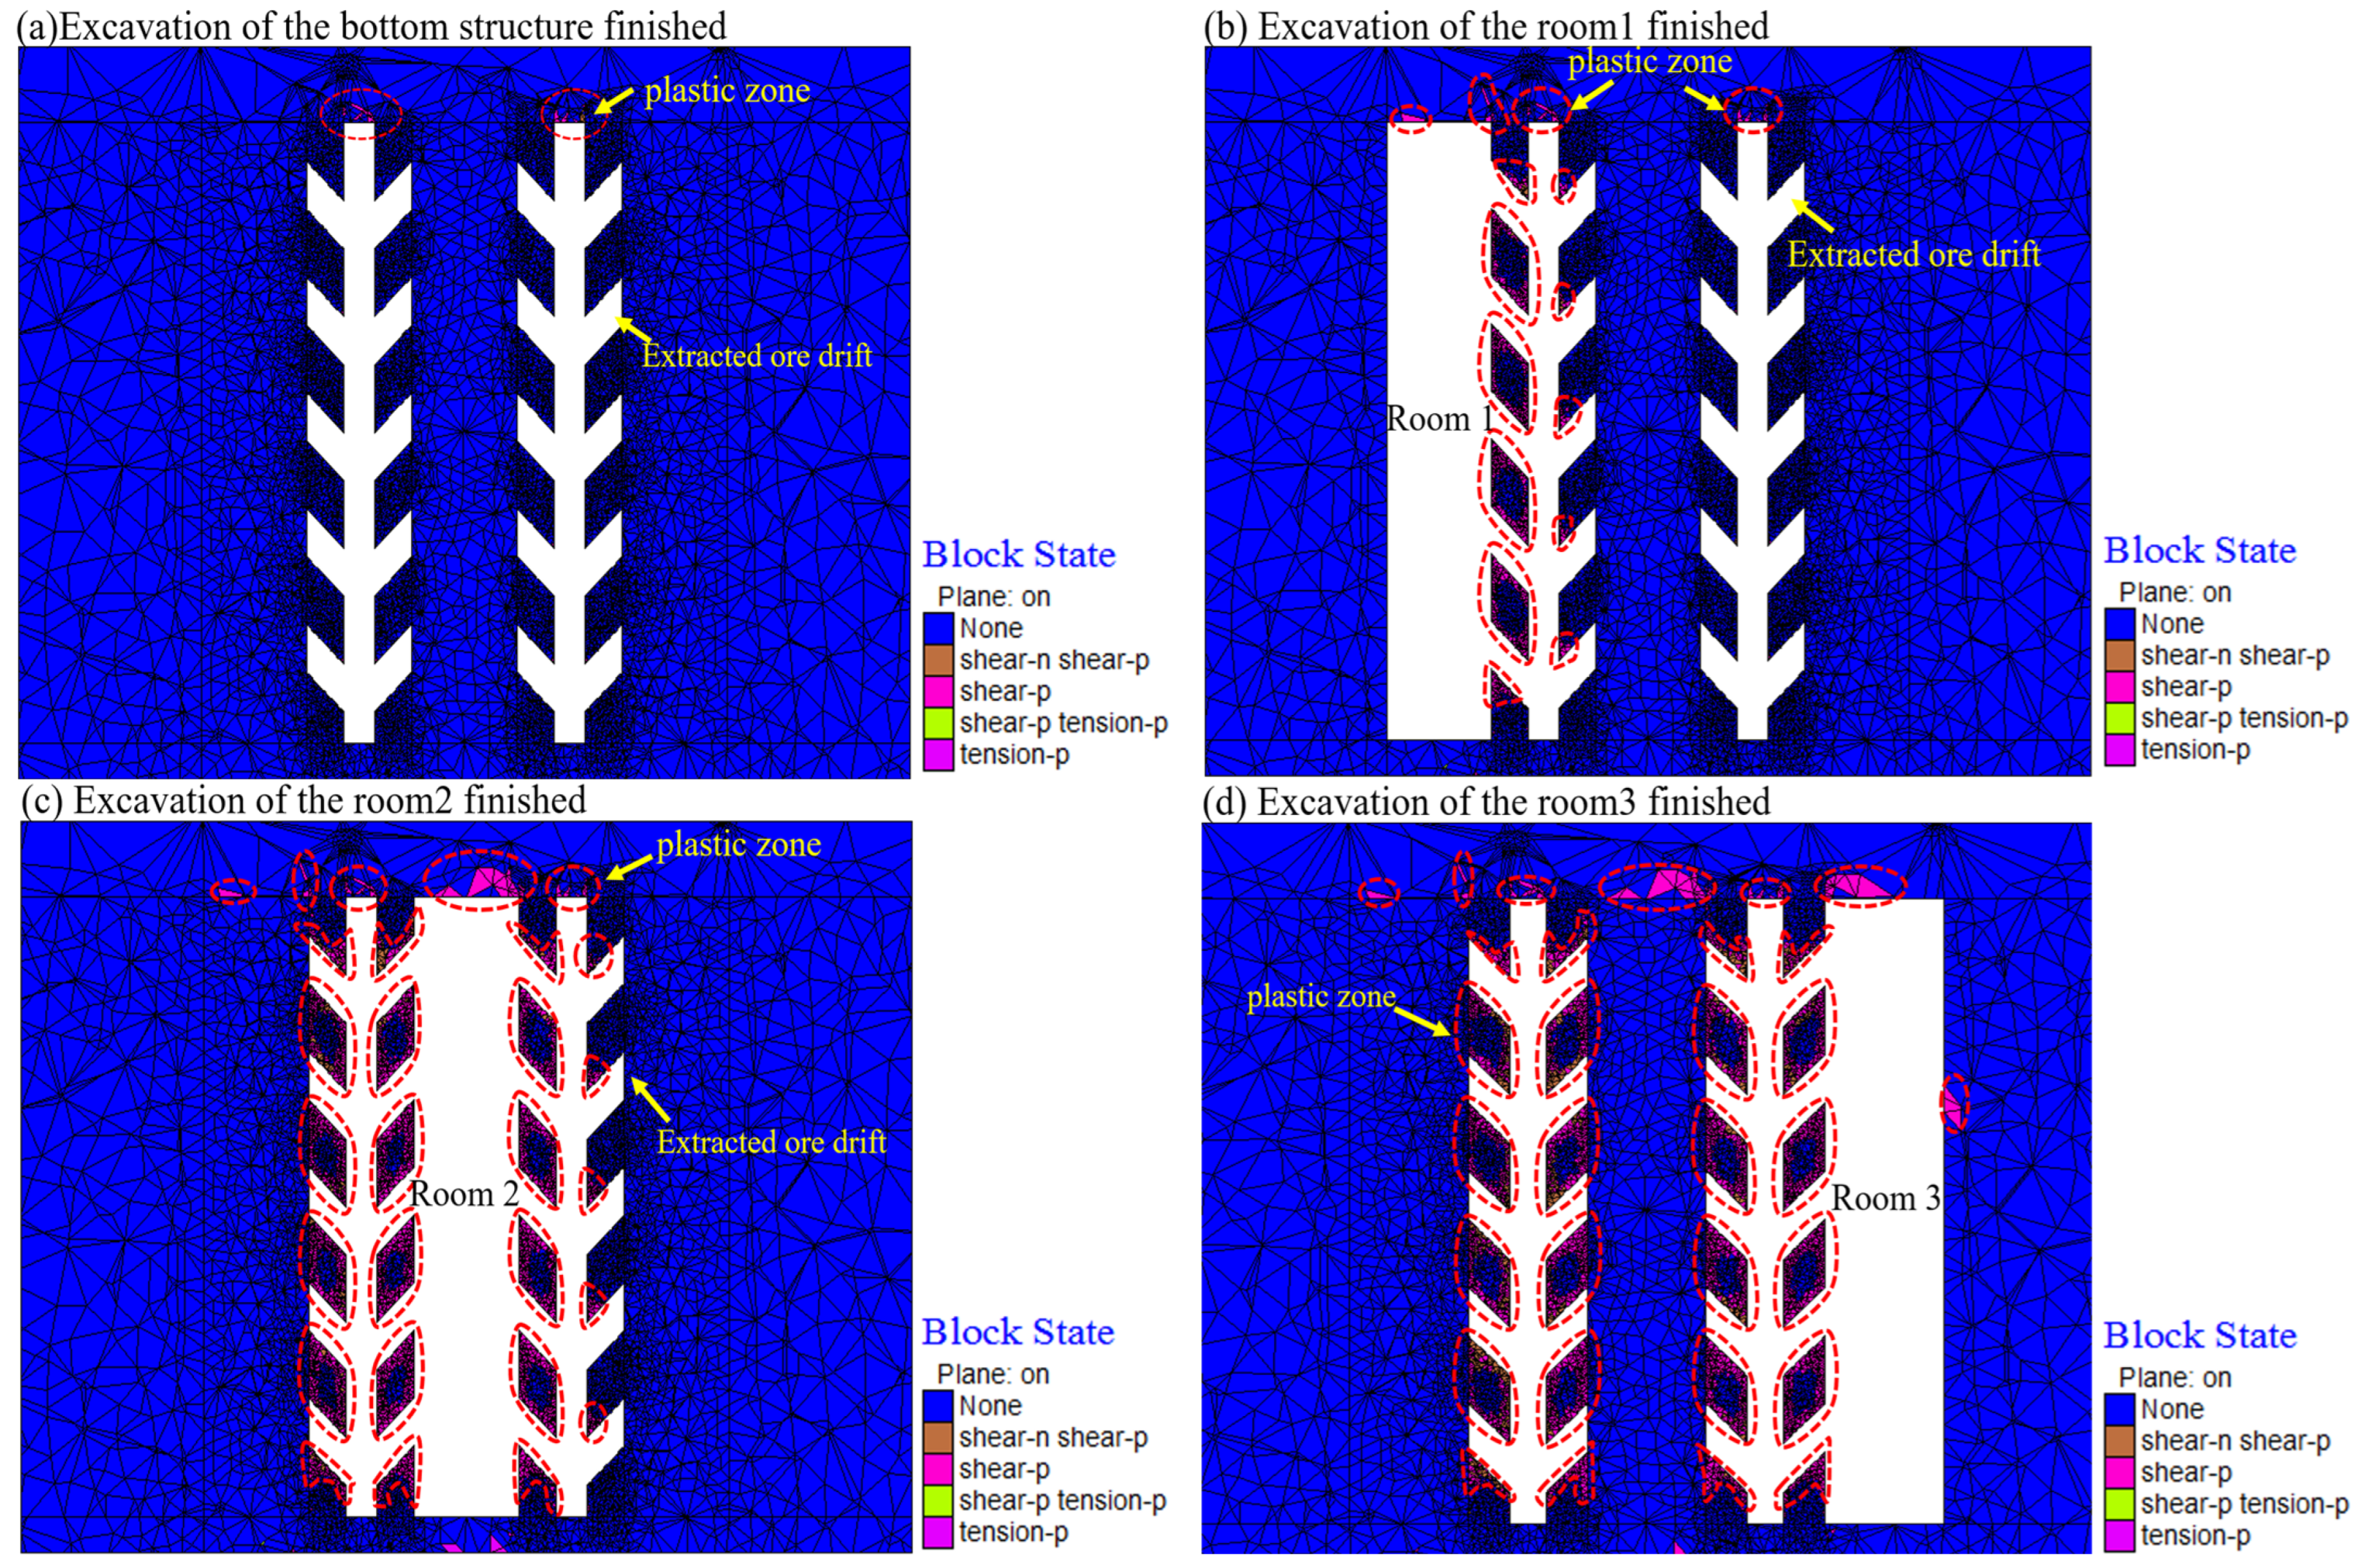
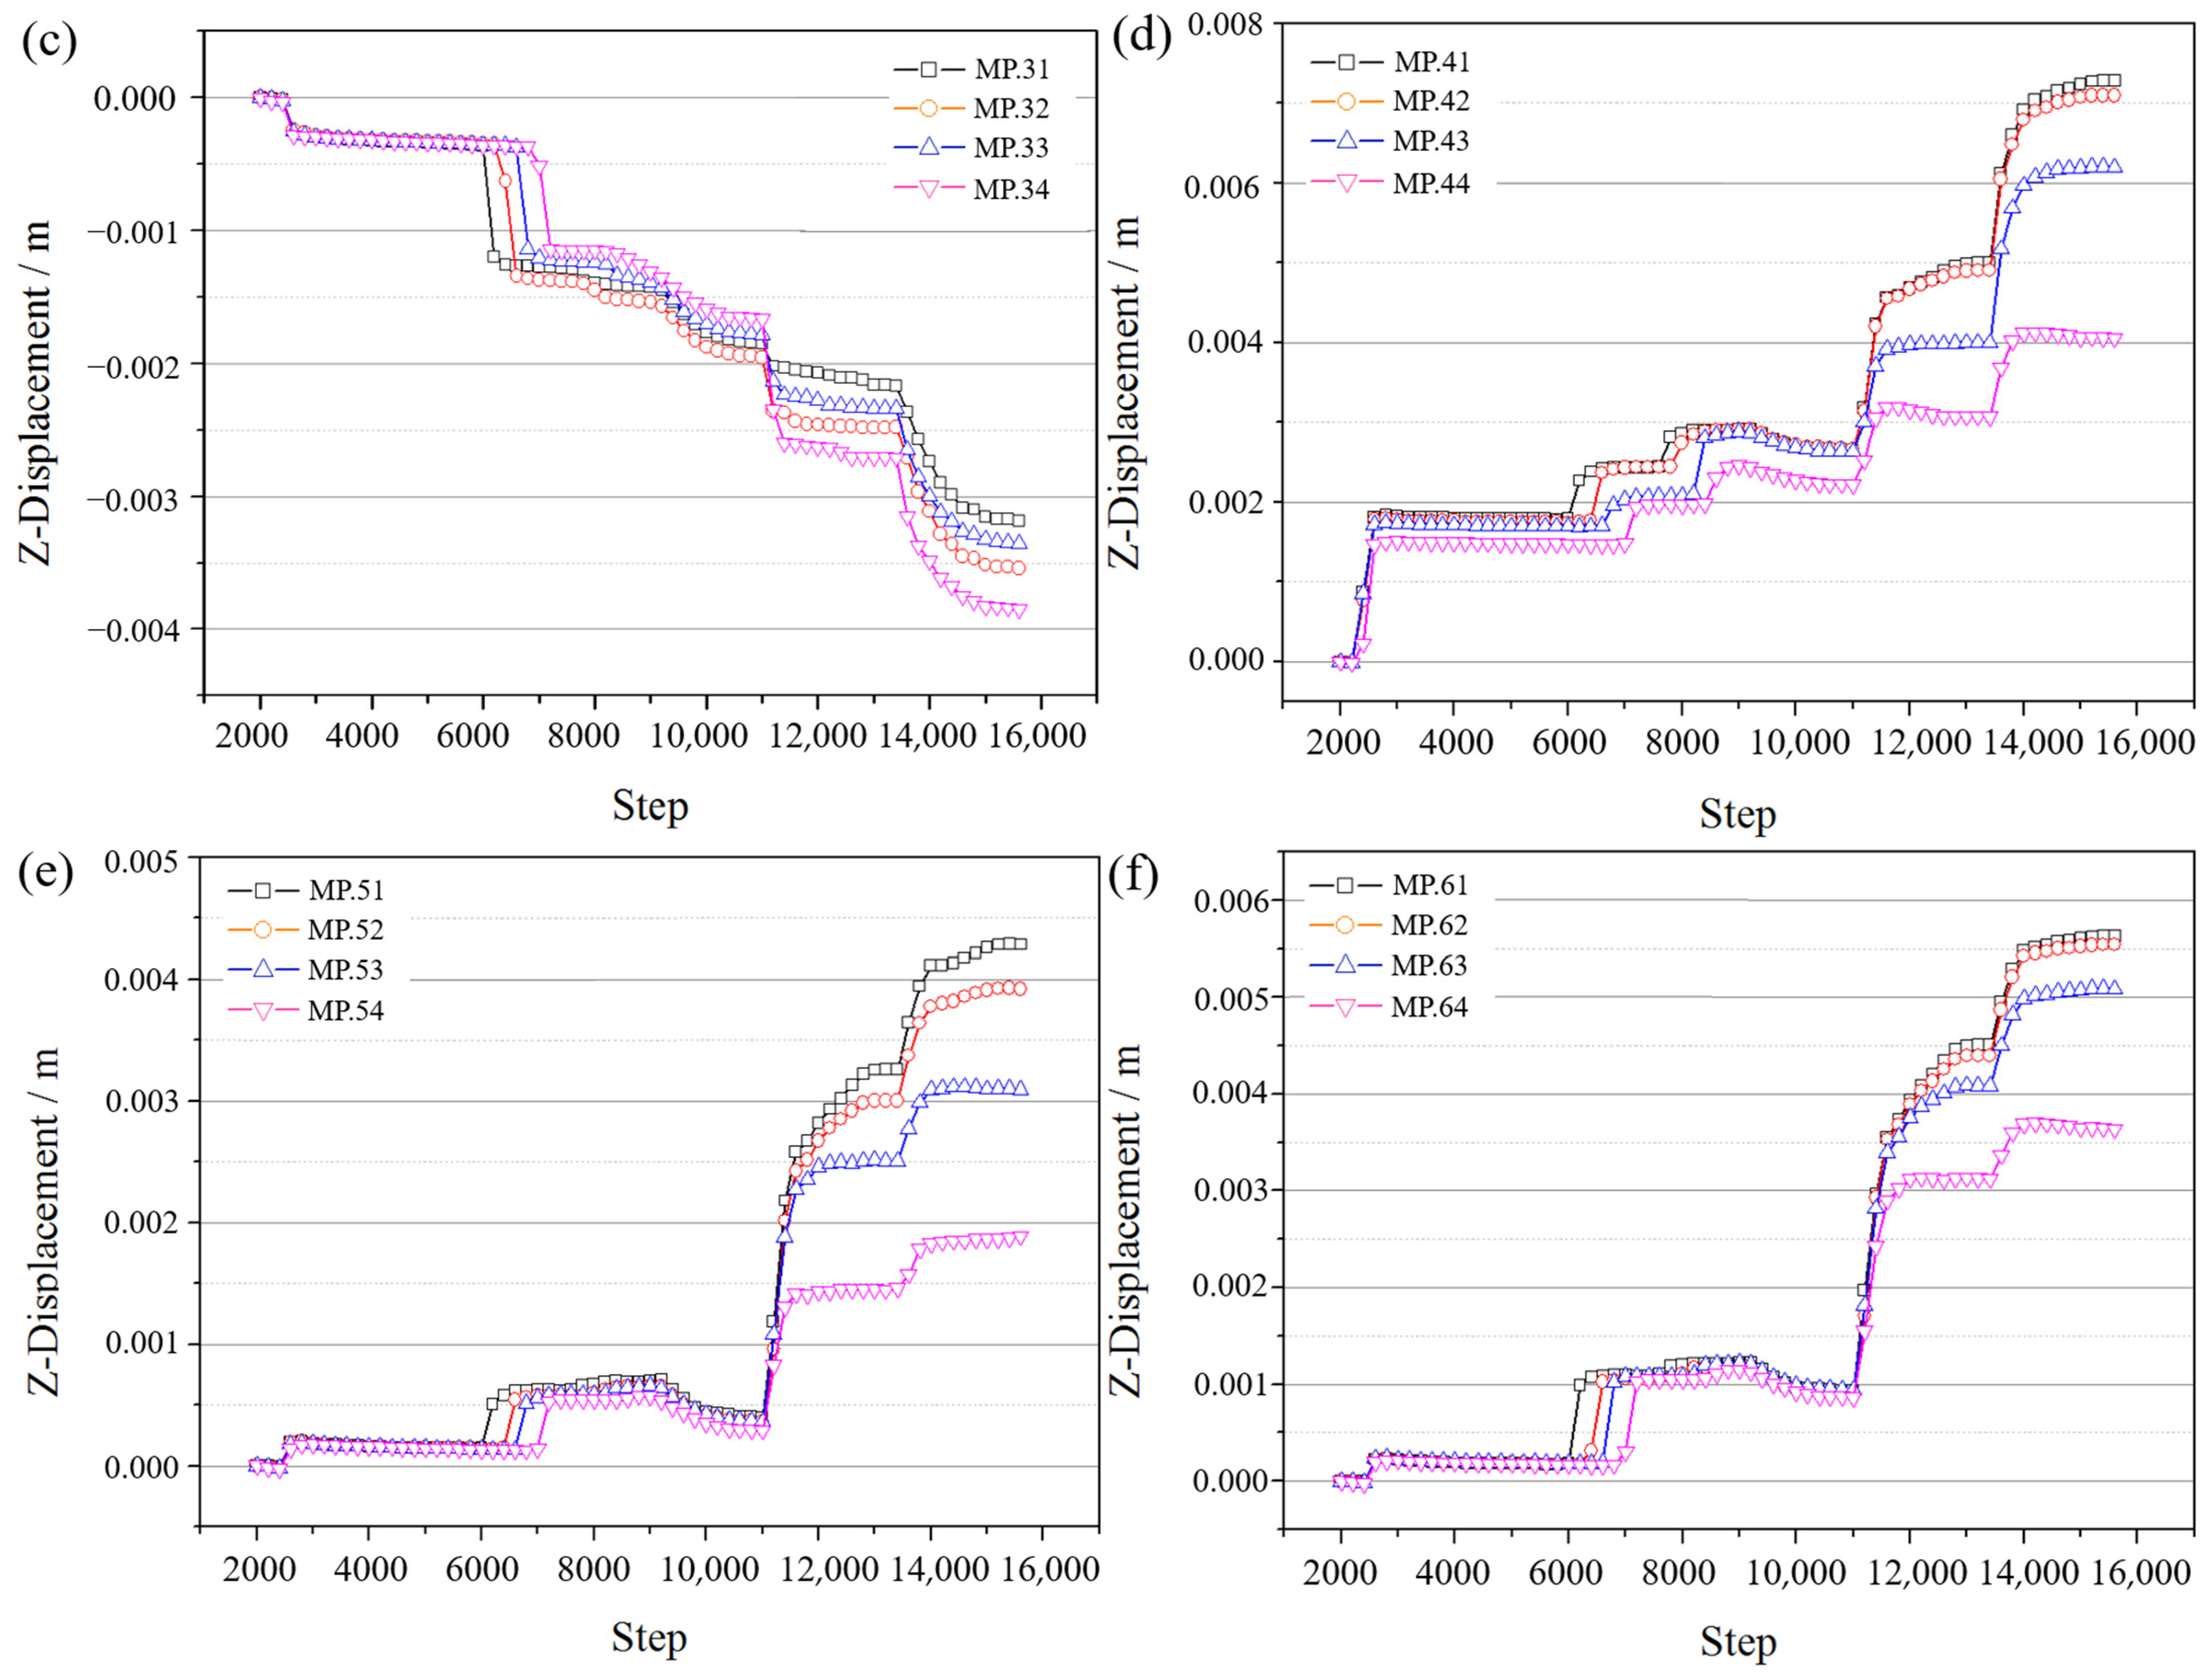
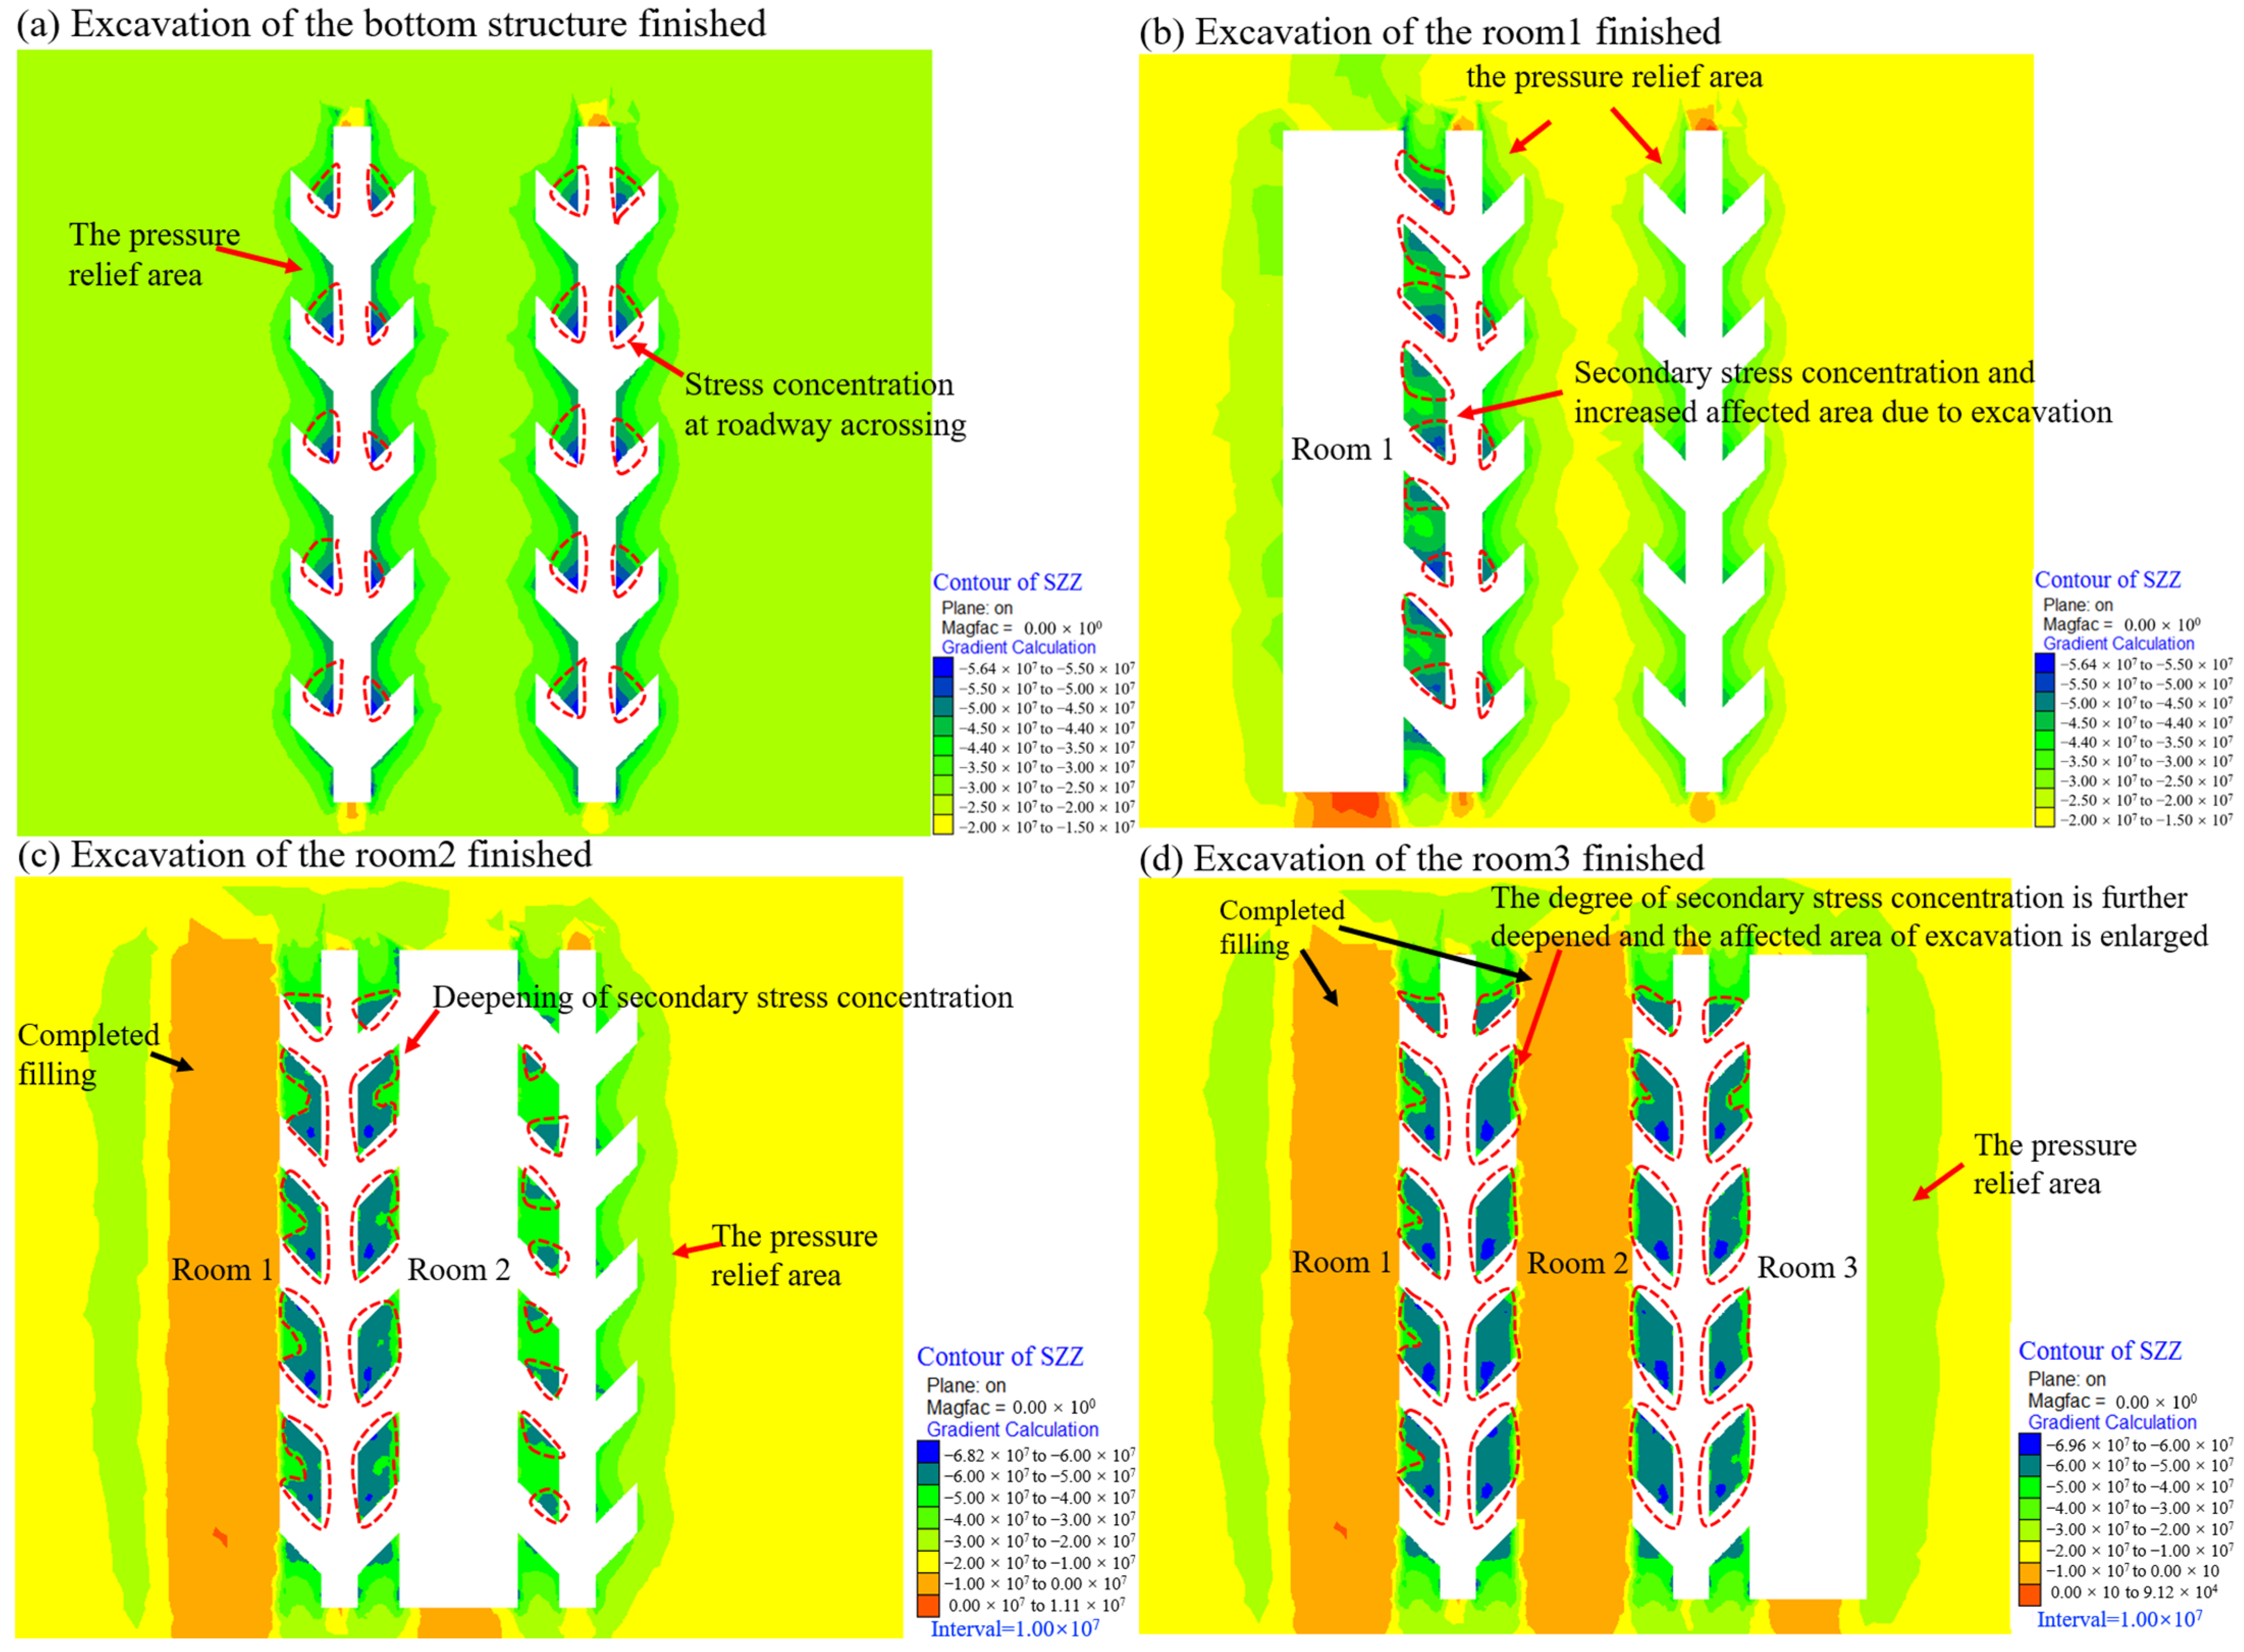
3.2.2. Simulation Result Analysis

(1)
Stress analysis during excavation
Figure 4 illustrates the stress distribution nephogram of the bottom structure during excavation. The maximum principal stress of the rock mass after excavation has been redistributed. The two sides of the roadway and the shallow part of the roof and floor are in the pressure relief area. The deep part of the roof and floor of the roadway and the shallow part of the two bottom angles of the roadway are in the stress concentration area. Figure 4a shows that the disturbance stress caused by excavation is concentrated on the bottom structure, and the stress value is the largest at the intersection tip of the roadway. After excavation, the stress on the two sides of the extracted ore drift and muck slash is significantly greater than that outside the bottom structure. The stress decreases gradually from the bottom structure area to the outside. According to the process of room excavation in Figure 4b–d, in the process of room excavation, the influence area is larger than that of the roadway excavation. The excavation of the room causes the secondary concentration of the structural stress near the bottom, and the stress concentration area of the bottom structure changes obviously. The stress concentration value is the highest at the tip and gradually decreases from the outside to the inside, showing an elliptical distribution. The excavation of the three rooms does not significantly impact each other, indicating that the bottom structure is stable under this parameter.
(2)
Displacement analysis during excavation
Figure 5 presents the displacement nephogram of the roof and floor in the mining process shown in the section diagram of the bottom structure of the pillar. After excavating the bottom structure, the roof and floor of the roadway have different degrees of deformation, and the bottom structure also has a small amount of settlement. With the mining of the ore body, the hanging area of the rock mass increases, and the initial stress balance system is destroyed. Under the action of the internal unbalanced stress, the surrounding rock seeks a new balance through deformation. The deformation process of the rock mass makes the accumulated stress of the surrounding rock release and transfer continuously. Simultaneously, the deformation of the bottom structural displacement also means that the energy is absorbed inside. The above figures’ comparison shows that the bottom structure’s displacement caused by room 1 mainly concentrates on the roof and floor. When rooms 2 and 3 are stoping, the displacement of the bottom structure changed greatly, and the displacement increased by three times. With the mining of the room, the area with large displacement continues to expand to the surrounding, and the bottom structure bears more stress transfer caused by mining.
(3)
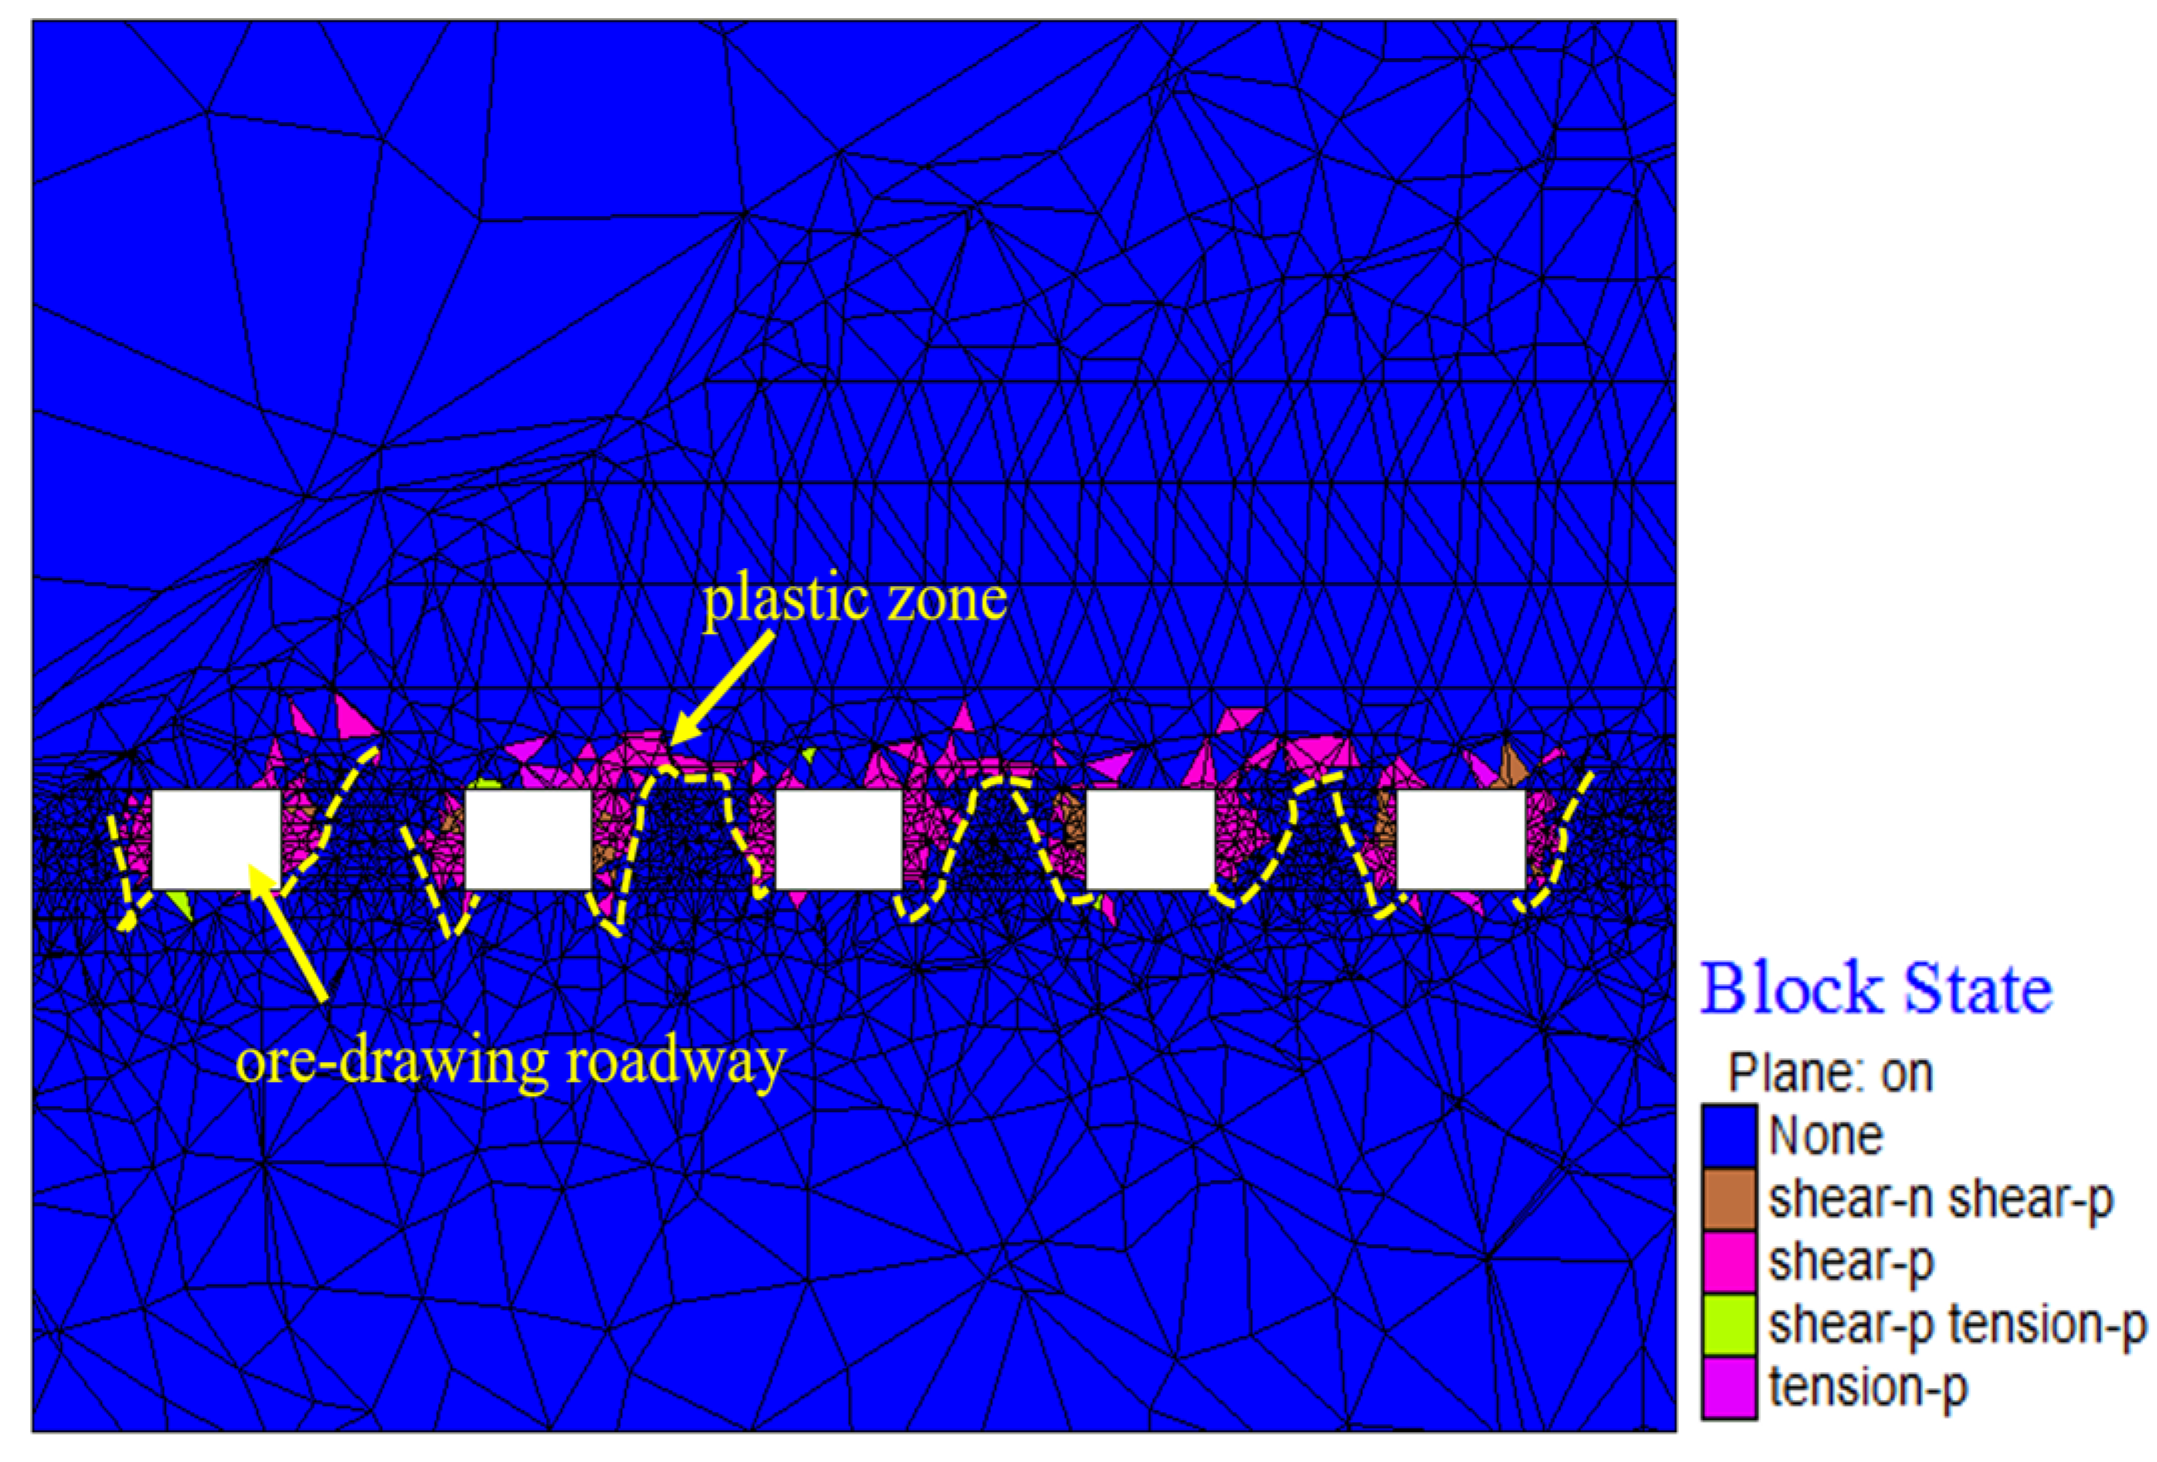
Plastic-zone analysis during excavation
Figure 6 shows the plastic area where the deformation of the soil cannot be recovered during the excavation of the room; Figure 6a shows that, after the excavation of the bottom structure, only a small area of failure zone is generated near the hanging wall of the roadway. The main fracture surface is close to the hanging wall, and the rock mass is mainly selvage. However, the poor stability leads to the failure of the rock mass. Figure 6b–d shows that the stress of the adjacent bottom structure of room 1 increases significantly after excavation, and the stress concentration at the intersection of the muck slash and the extracted ore drift is more pronounced. The stress concentration of both sides of the bottom structure is caused again after the excavation of room 2, which has a certain influence on the bottom structure of room 1. The failure zone of the ore body of the bottom structure on both sides is further increased, and a circle of plastic zone is formed in the periphery. Only the middle elliptical area has not been destroyed. After the excavation of room 3, the stress of the bottom structure is further increased, and the plastic zone area of the bottom structure is close to half of the total area. Only the middle part does not occur plastic deformation, and the bottom structure is in a critical state of failure. Throughout the development of the plastic zone, the influence of mining disturbance on the stability of the bottom structure has timeliness and stages.
Figure 7 illustrates that the failure range of the bottom structure is in the shape of a funnel, and the middle failure area is the largest. The main reason is that, after the formation of the bottom structure, the pillar bears the coating pressure on the excavation area, forming the compression-shear failure, which causes the local failure of the bottom structure. However, the bottom structure is not fully yielding and is still stable.
(4)
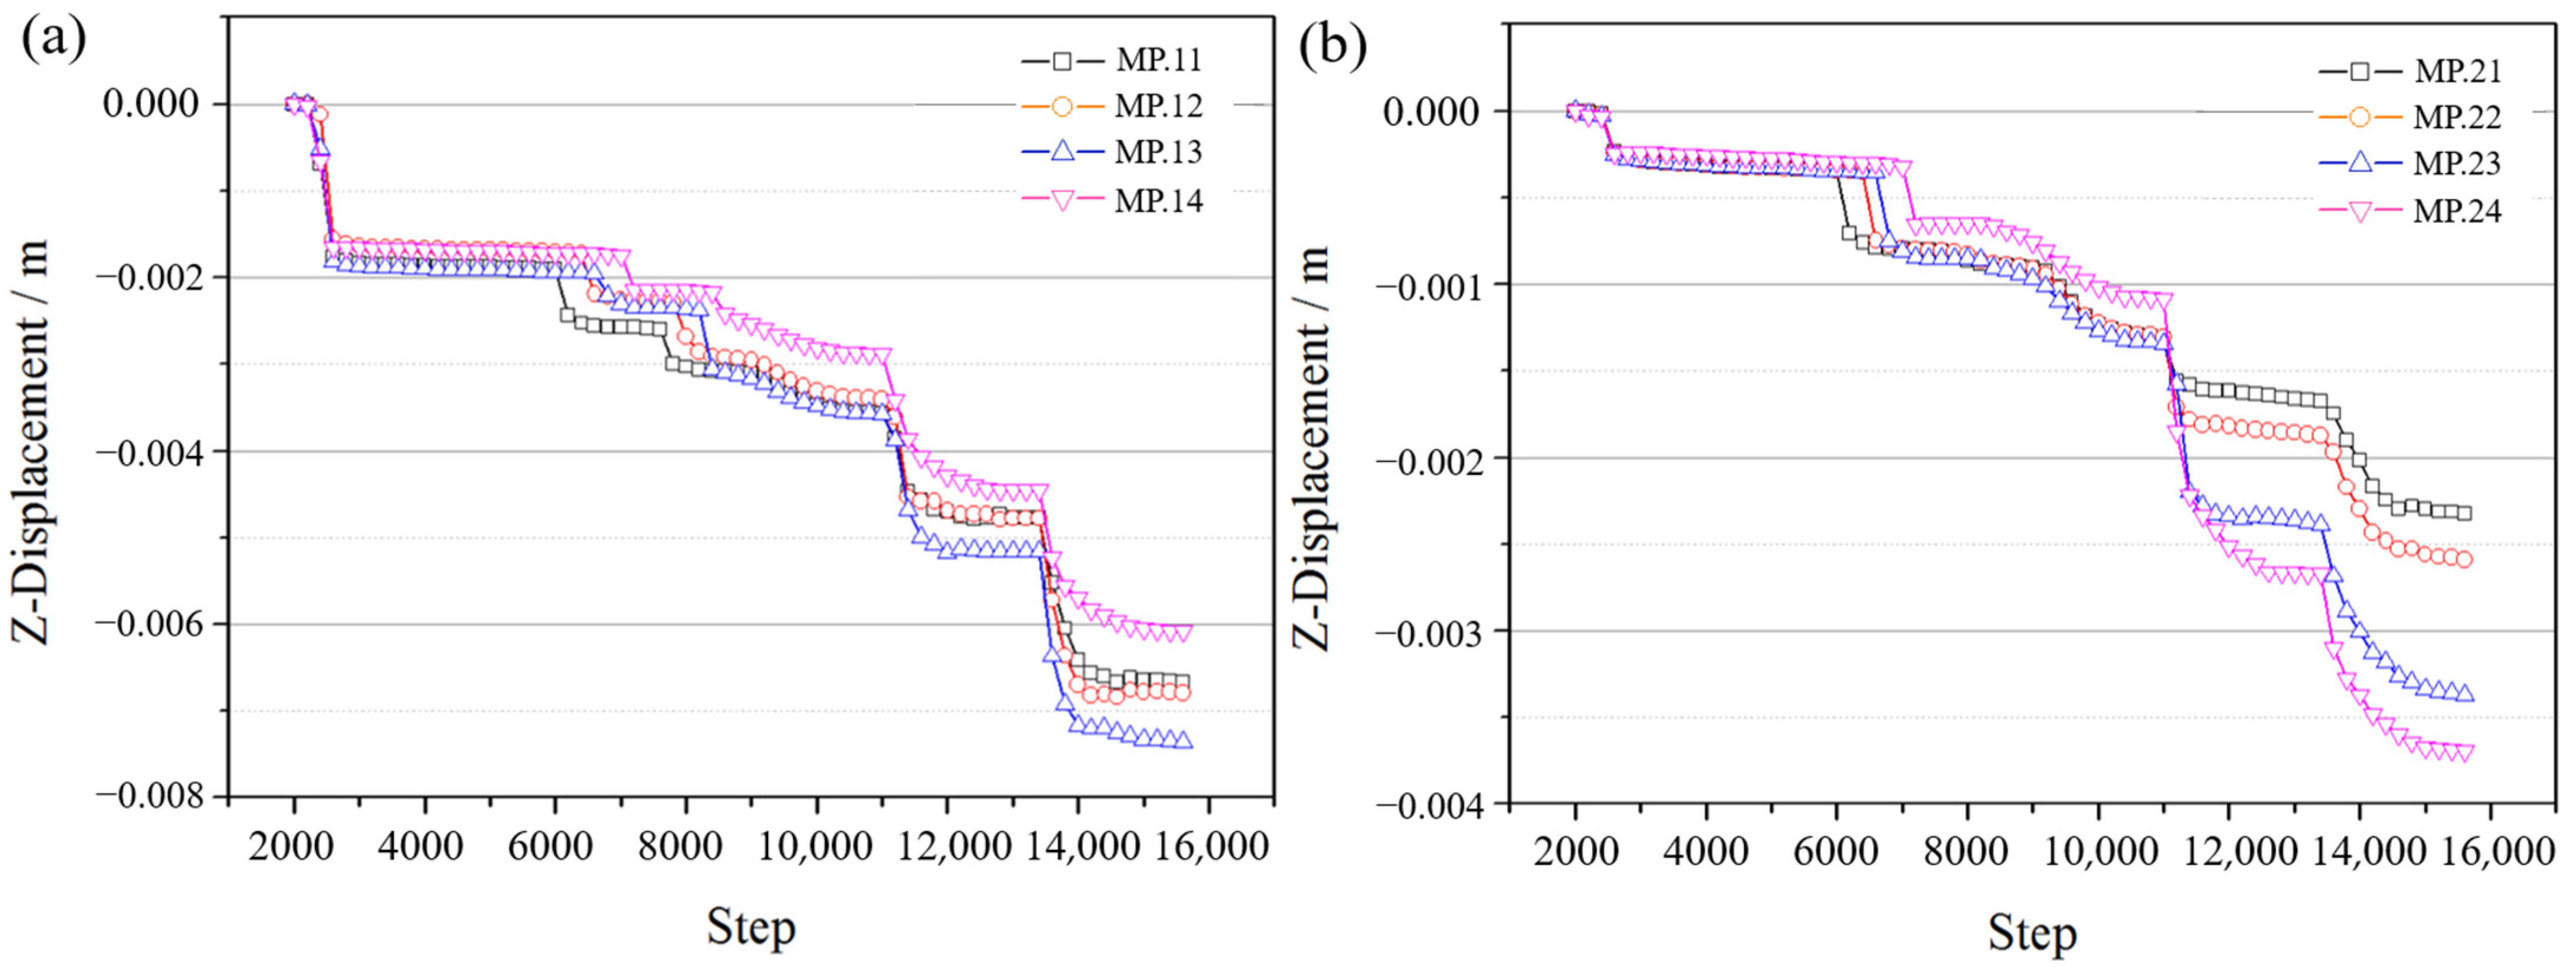
Displacement monitoring analysis
Figure 8 shows the distribution of displacement monitoring points in the bottom structure. MP represents the monitoring point. According to the displacement change of the roof and floor, 24 monitoring points are arranged in the bottom structure. The first group of MPs is located at the intersection of the roadway roof, numbered 11–14. The second group of MPs is located in the center of the roof of the extracted ore drift, numbered 21–24. The third group of MPs is located in the center of the pillar of the bottom structure, numbered 31–34. The layout points of the fourth, fifth, and sixth groups are located on the bottom floor at the same position as the first three groups.
Figure 9 shows each monitoring point’s displacement process in the bottom structure. The displacement variation of the roof and floor in the bottom structure is similar. The displacement and deformation of the roof and floor at the roadway intersection are the largest, and most of the roof subsidence and floor heave occur in the mining process. A small amount of displacement is caused after excavation, but the deformation is limited. During room excavation, the displacement of the roof and floor changes significantly and gradually stabilizes with the mining.

4. Spacing Optimization of Extracted Ore Drift with Bottom Structure

The extracted ore drift is the key channel for drawing. When the spacing is too wide, the stress superposition is reduced, and the stability of the roadway is improved. However, the residual ore in the ridge and the footwall between the roadway increase, and the ore recovery ratio cannot be guaranteed [35]. Therefore, the spacing of extracted ore drift involves ore recovery and roadway stability. Its essence is to achieve a reasonable balance between ore recovery and roadway stability and maximize ore recovery to ensure roadway stability.

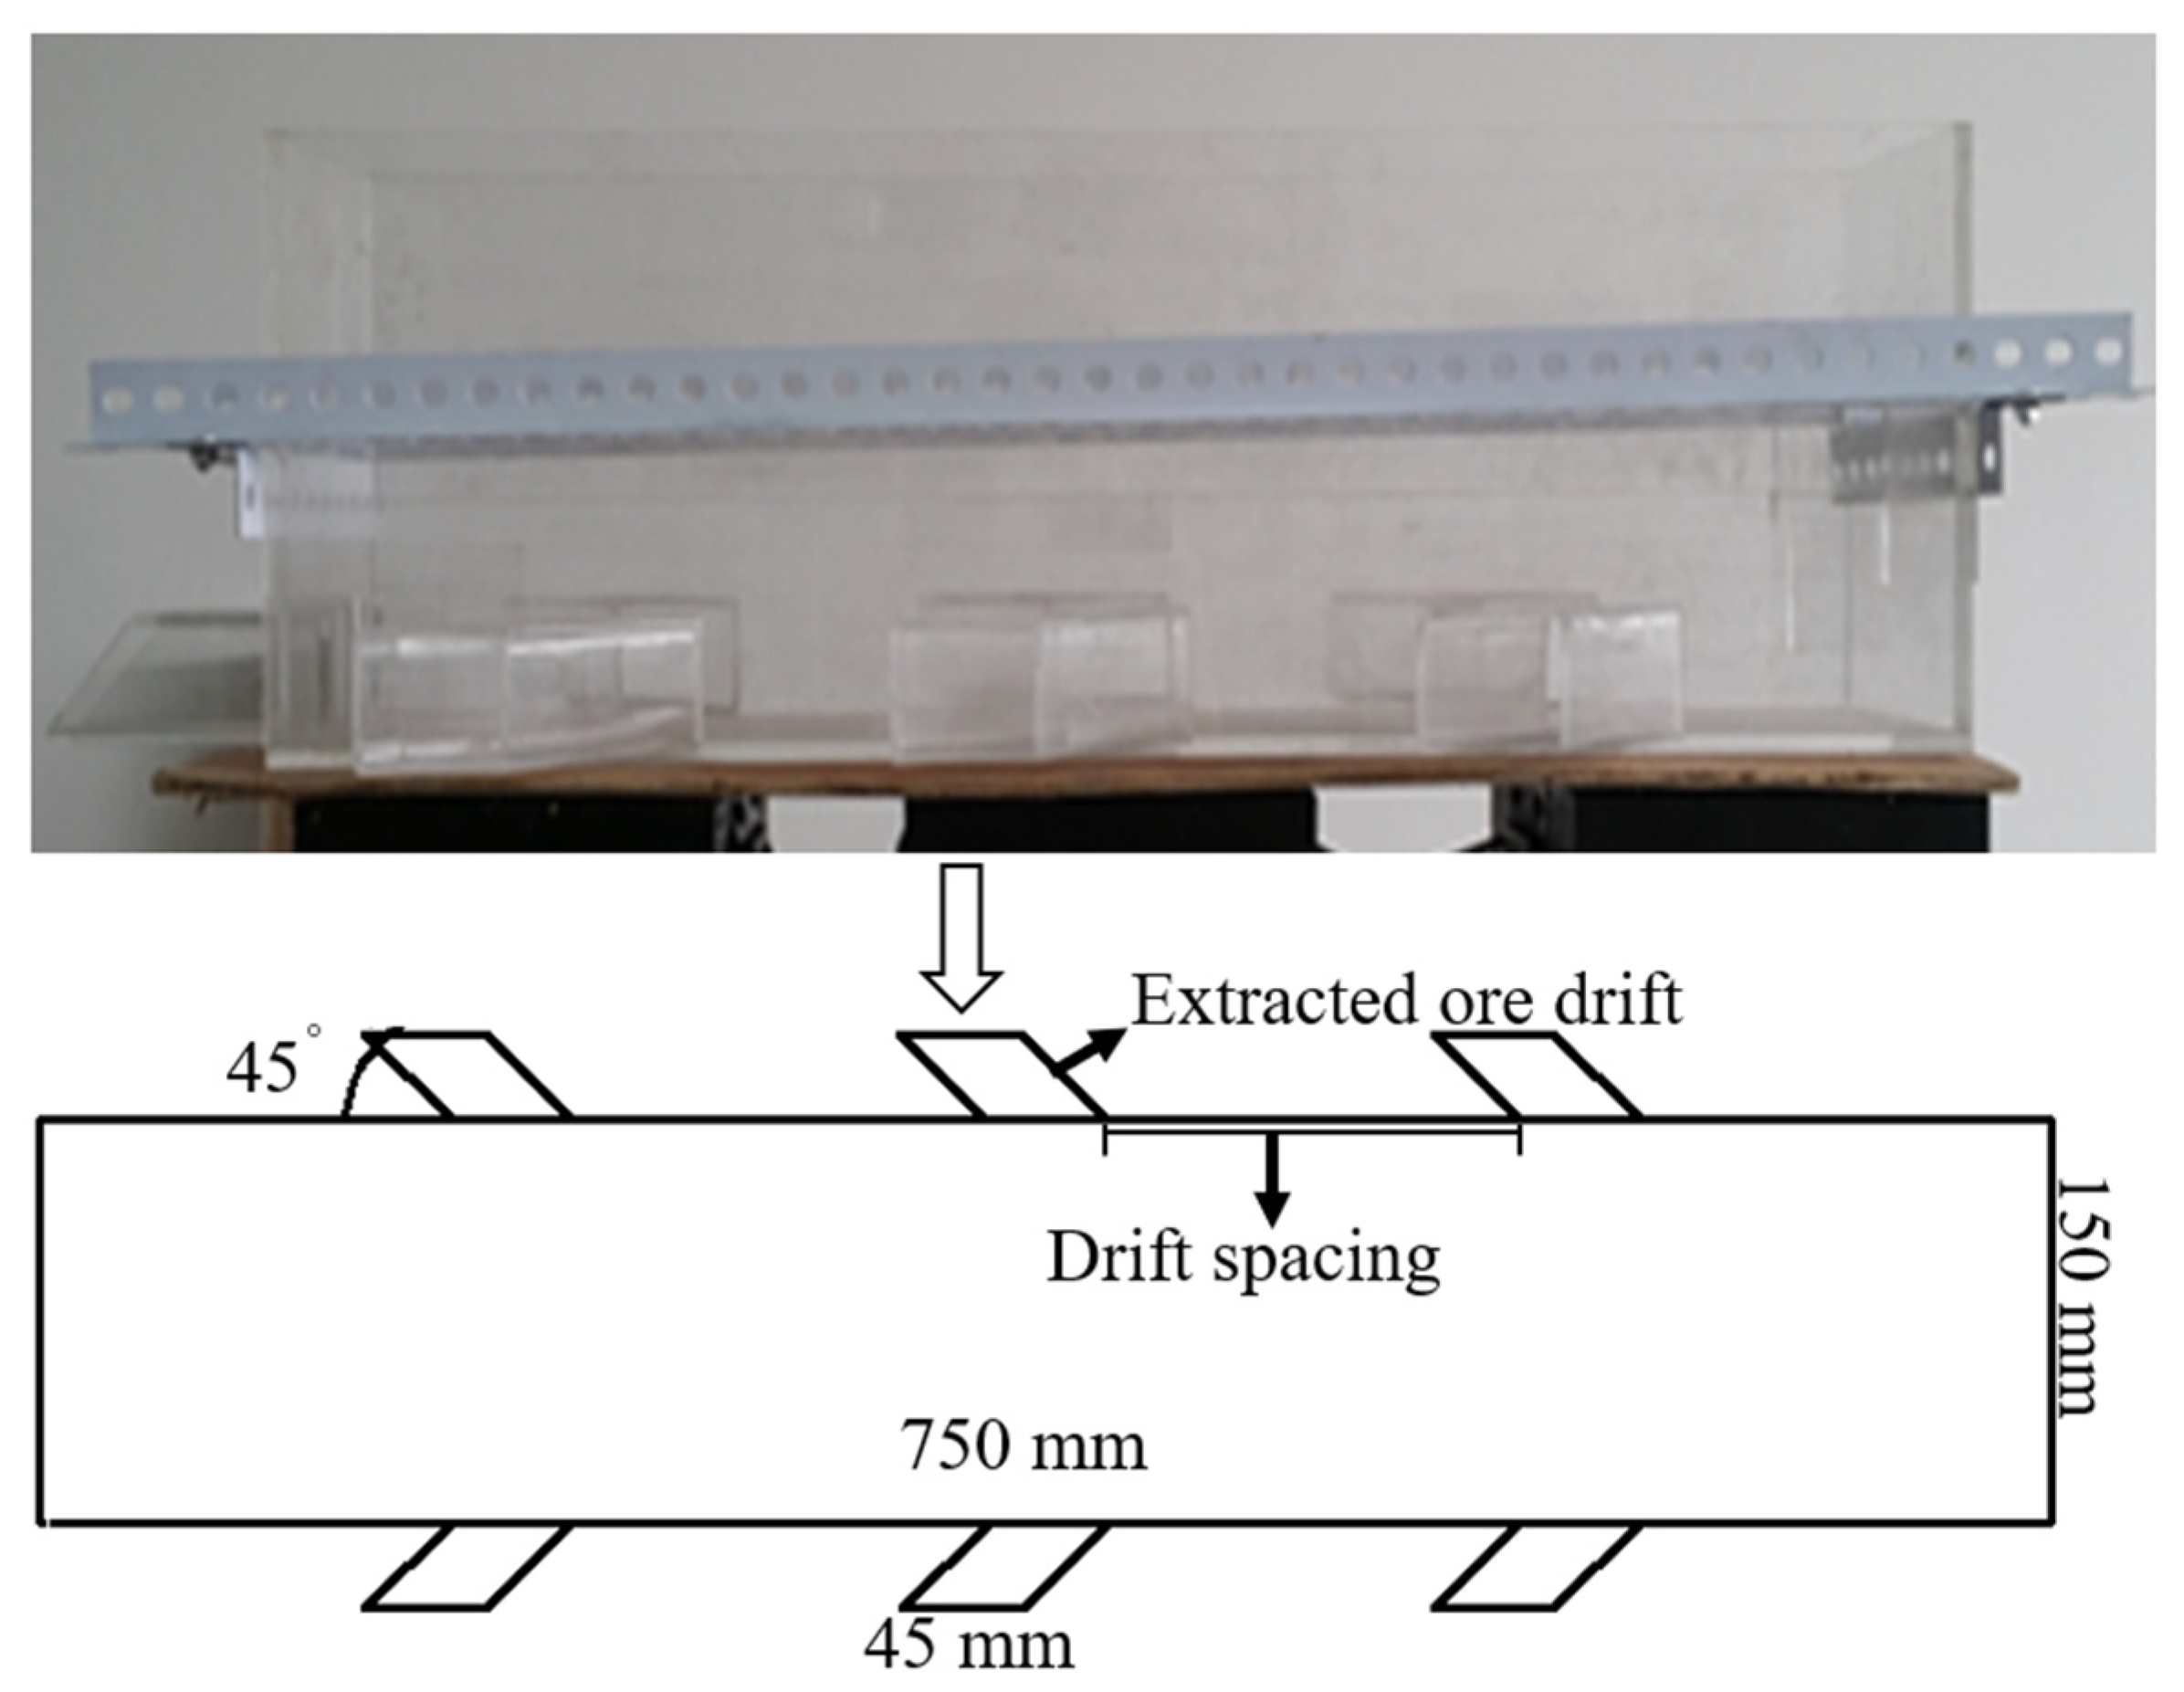
4.1. Physical Modeling Experiment

4.1.1. Model Design and Material Selection

This experiment adopts a 3D ore model. According to the stope size and roadway layout, the model ratio was 1:66.6, the model size was 750 × 150 × 225 mm, extracted ore drift size was 45 × 45 mm. The roadway had a symmetrical layout. The experimental model is shown in Figure 10. The bulk density of ore and waste rock selected in this experiment was 1.98 g/cm3 and 1.68 g/cm3, respectively. The ore block size range of the stope in the gold mine was 400~800 mm, and the waste rock block size range was 600~1000 mm. According to the geometric similarity in the similarity theory, the particle size of ore and rock in the experiment is ground according to the geometric size ratio of 1:66.6. The ore and waste rock used in the experiment were obtained from mine production. The particle size of ore and waste rock were ground to 6~12 mm and 9~15 mm, respectively; after screening by lattice sieve, they were mixed according to the experiment’s proportion of particle size distribution.

4.1.2. Experimental Design and Steps

According to the requirements of the mining method, the spacing was set to 7, 8, 9, 10, 11, 12, and 13 m, taking the roadway spacing as variable parameters. During the experiment, each group was filled with one waste rock and four ore layers, and three to five groups of extracted ore drifts were arranged. After mucking was completed, the drawing was started. In the experiment, a small spoon was used for ore drawing. According to the one-time ore drawing amount in actual production and the proportion of the physical model, the ore drawing amount per shovel was about 25 g. When the ore drawing was similar to that of waste rock, the drawing was stopped, and the drawing of the next ore drift was carried out after weighing. In order to ensure the uniform ore drawing of each ore drift, the next drift for ore drawing was changed after every 20 shovels. This drawing was terminated when all of the extracted ore drift was unable to be drawn. Then the ore was sorted as in the drawing model, the spacing of the extracted ore drift was adjusted, the ore and rock were screened, the total ore waste rock was counted, and the ore drawing experiment for the next scheme was prepared. The experimental process is shown in Figure 11.

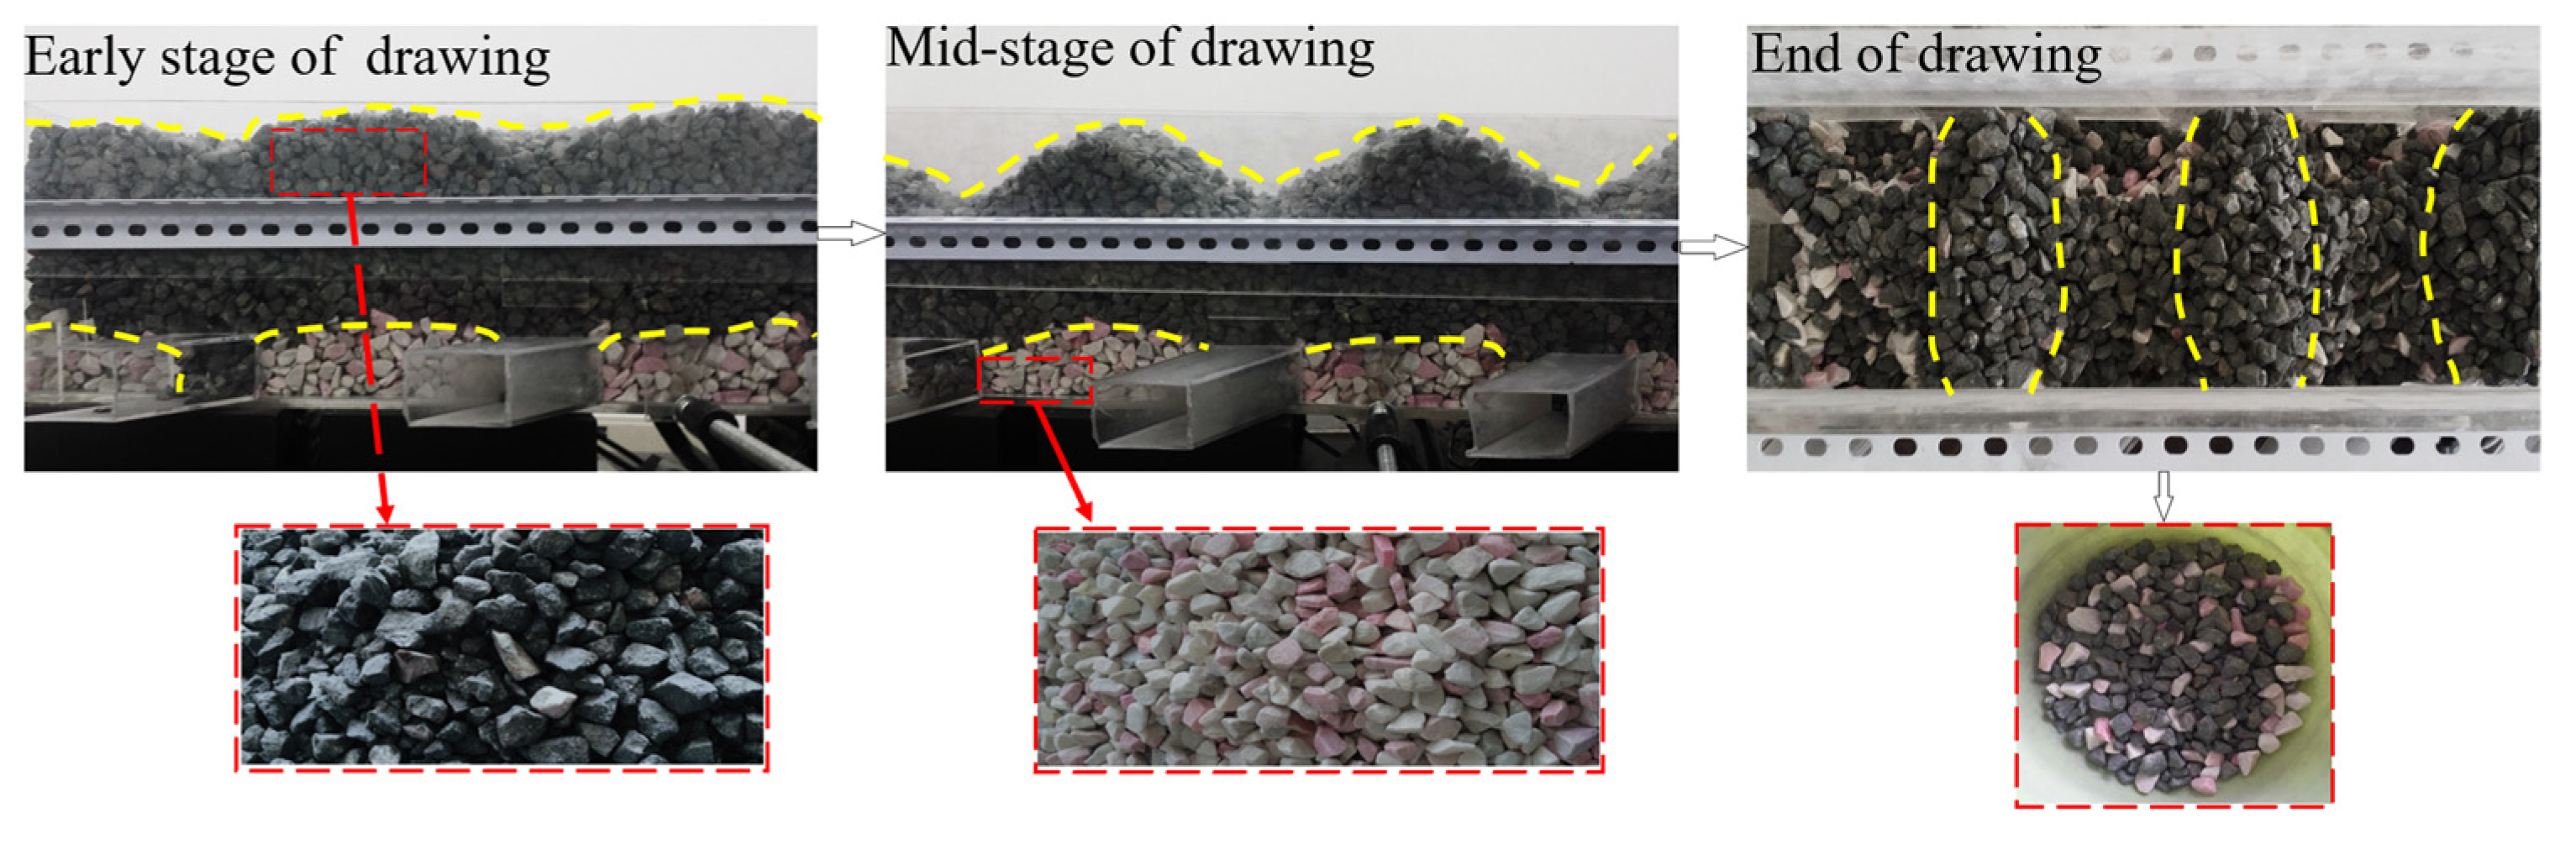
4.1.3. Experimental Result Analysis

The drawing experiment was carried out according to the above experimental scheme. Under different experimental schemes, ore quantity, waste rock quantity, total mine rock quantity, dilution ratio, and ore recovery ratio were obtained. The relationship between ore loss dilution ratio and ore drawing roadway spacing was obtained by fitting the results of the different ore drawing roadway spacing. The experimental results are shown in Figure 12.
Figure 12 shows that the change trends of ore recovery ratio and dilution ratio are the same, and the two establish a slight downward trend with the increase in the spacing of the mining roadway. When the spacing is 7–10 m, the change is gentle and suddenly drops at 10 m. When the spacing is 11 m–13 m, it is gradually stable, and the overall trend is flat–steep–flat. Combined with experimental observation and analysis of ore–rock movement law, when the spacing becomes larger, the number of outlets decreases, and the recovery ratio decreases. When the spacing is 10 m, the recovery ratio decreases sharply because of the decline of one outlet.

4.2. Numerical Simulation Analysis

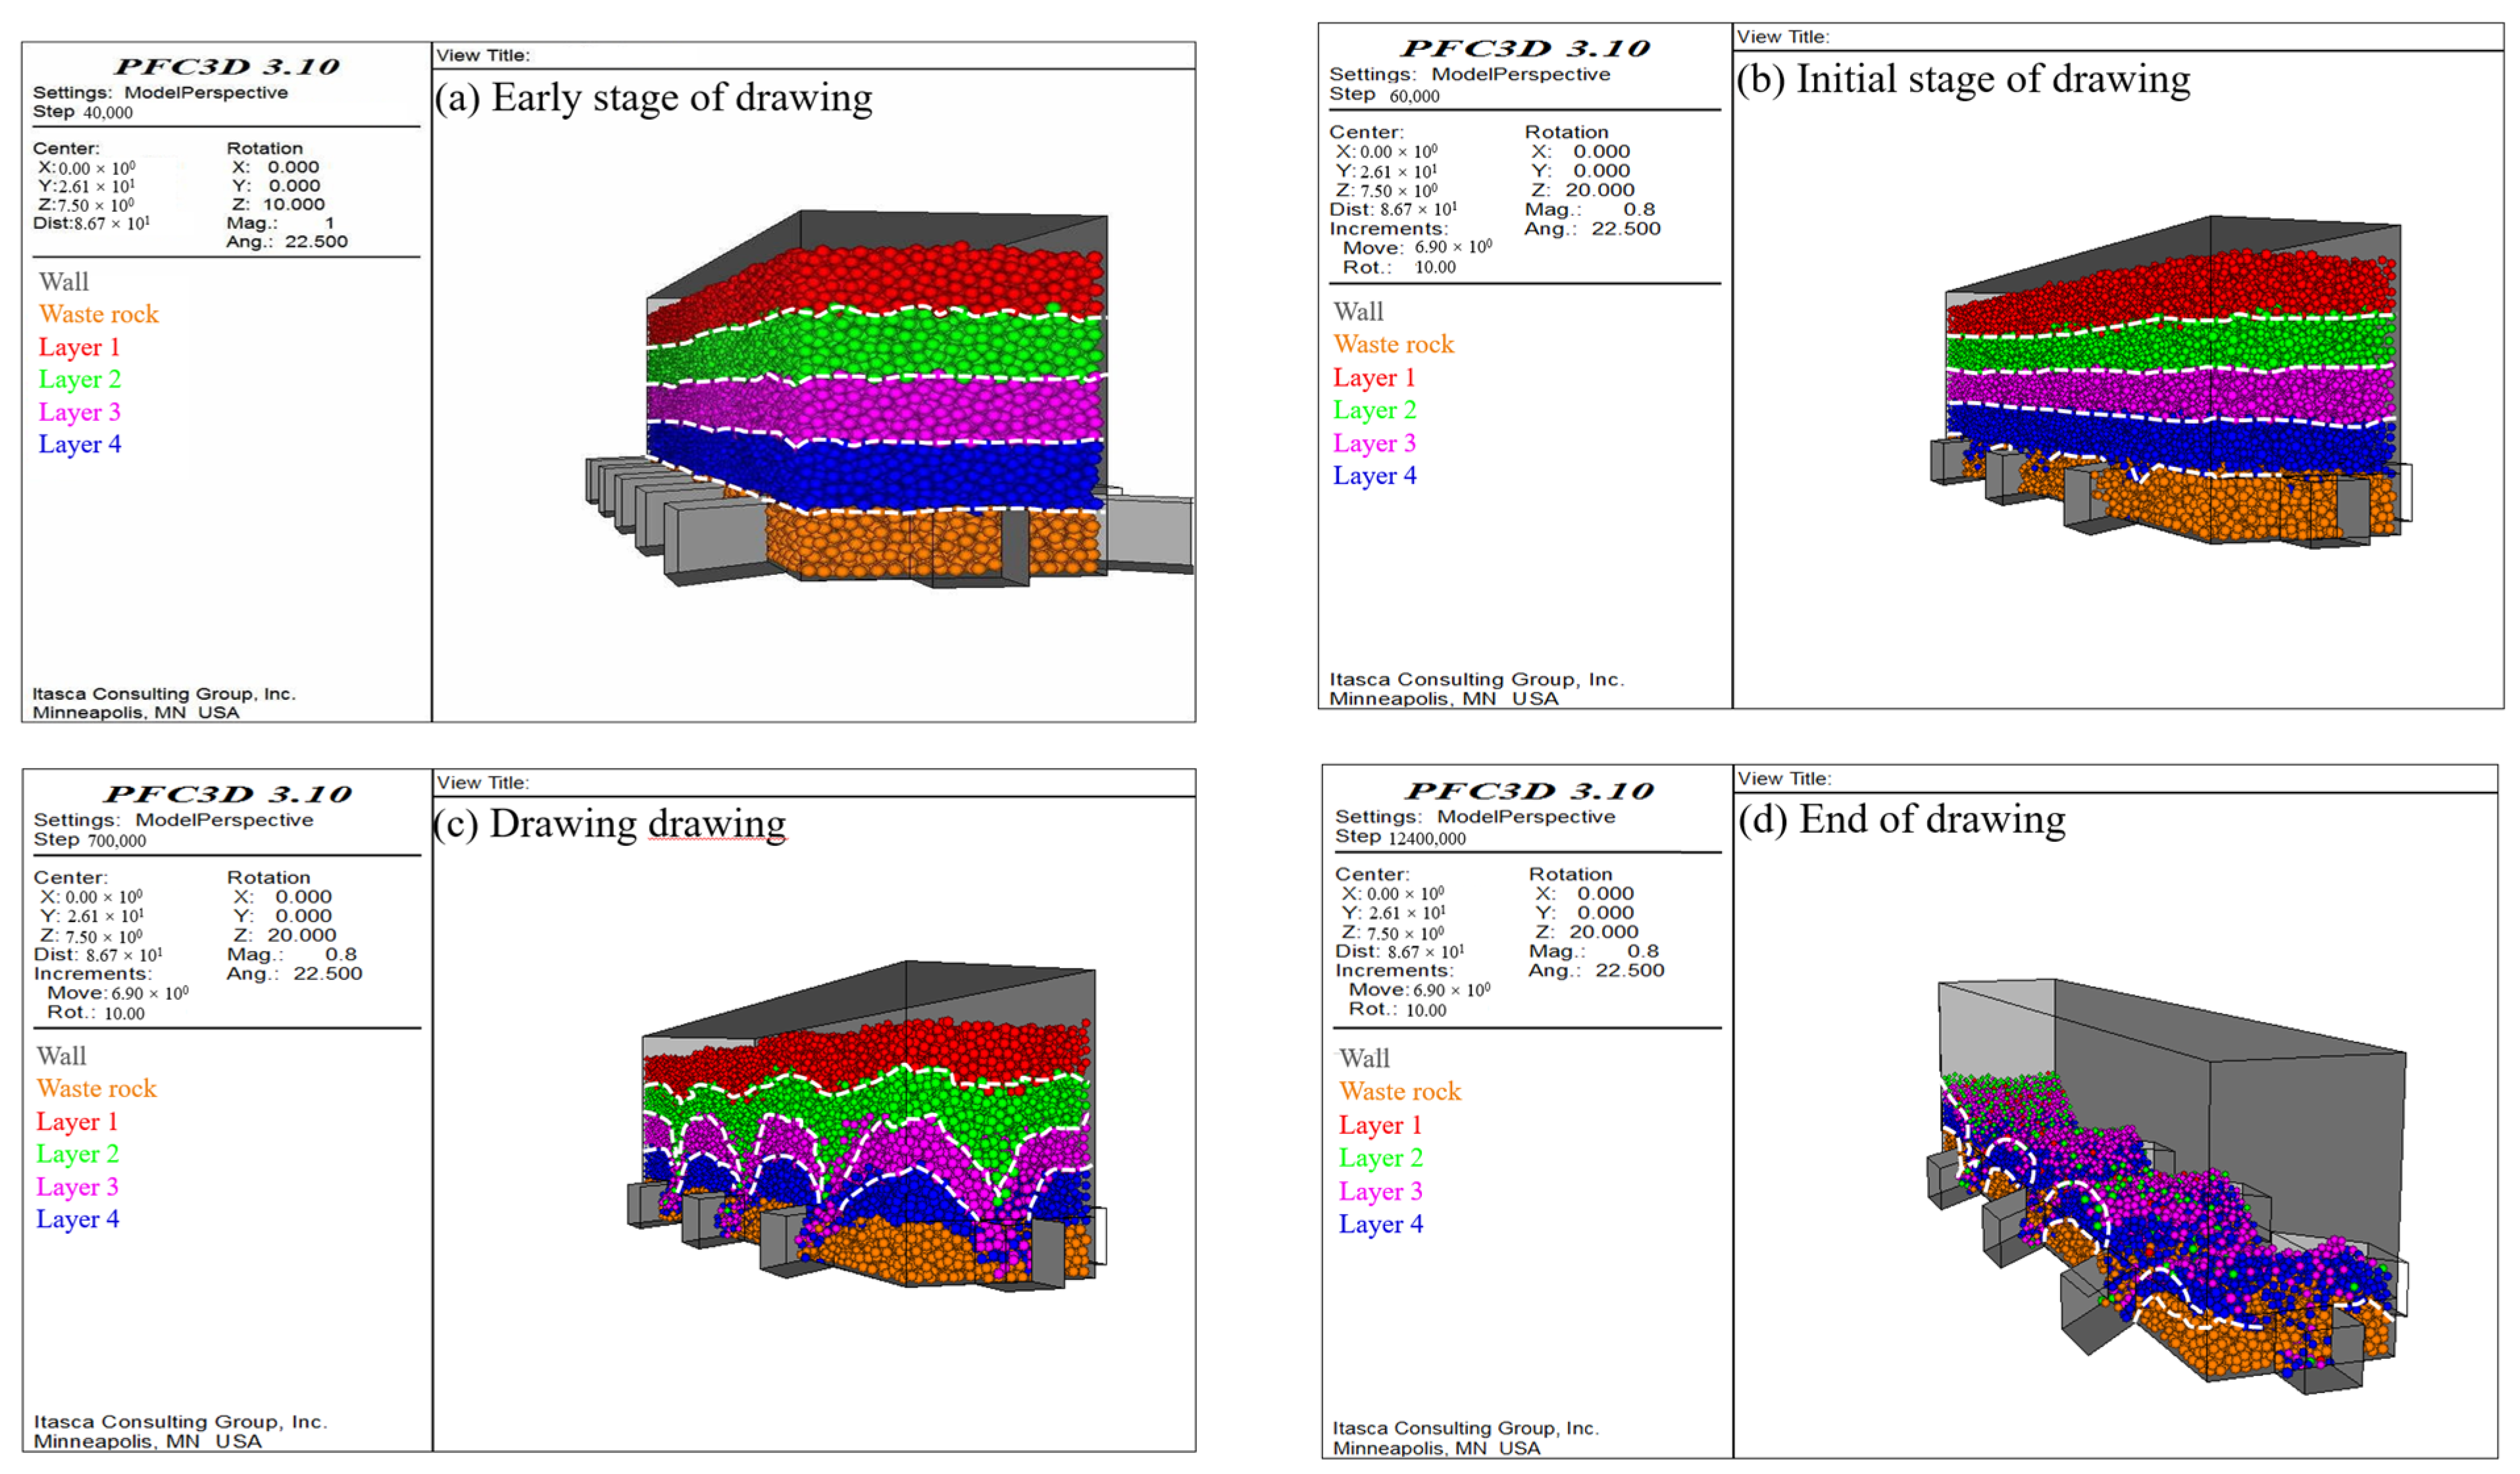
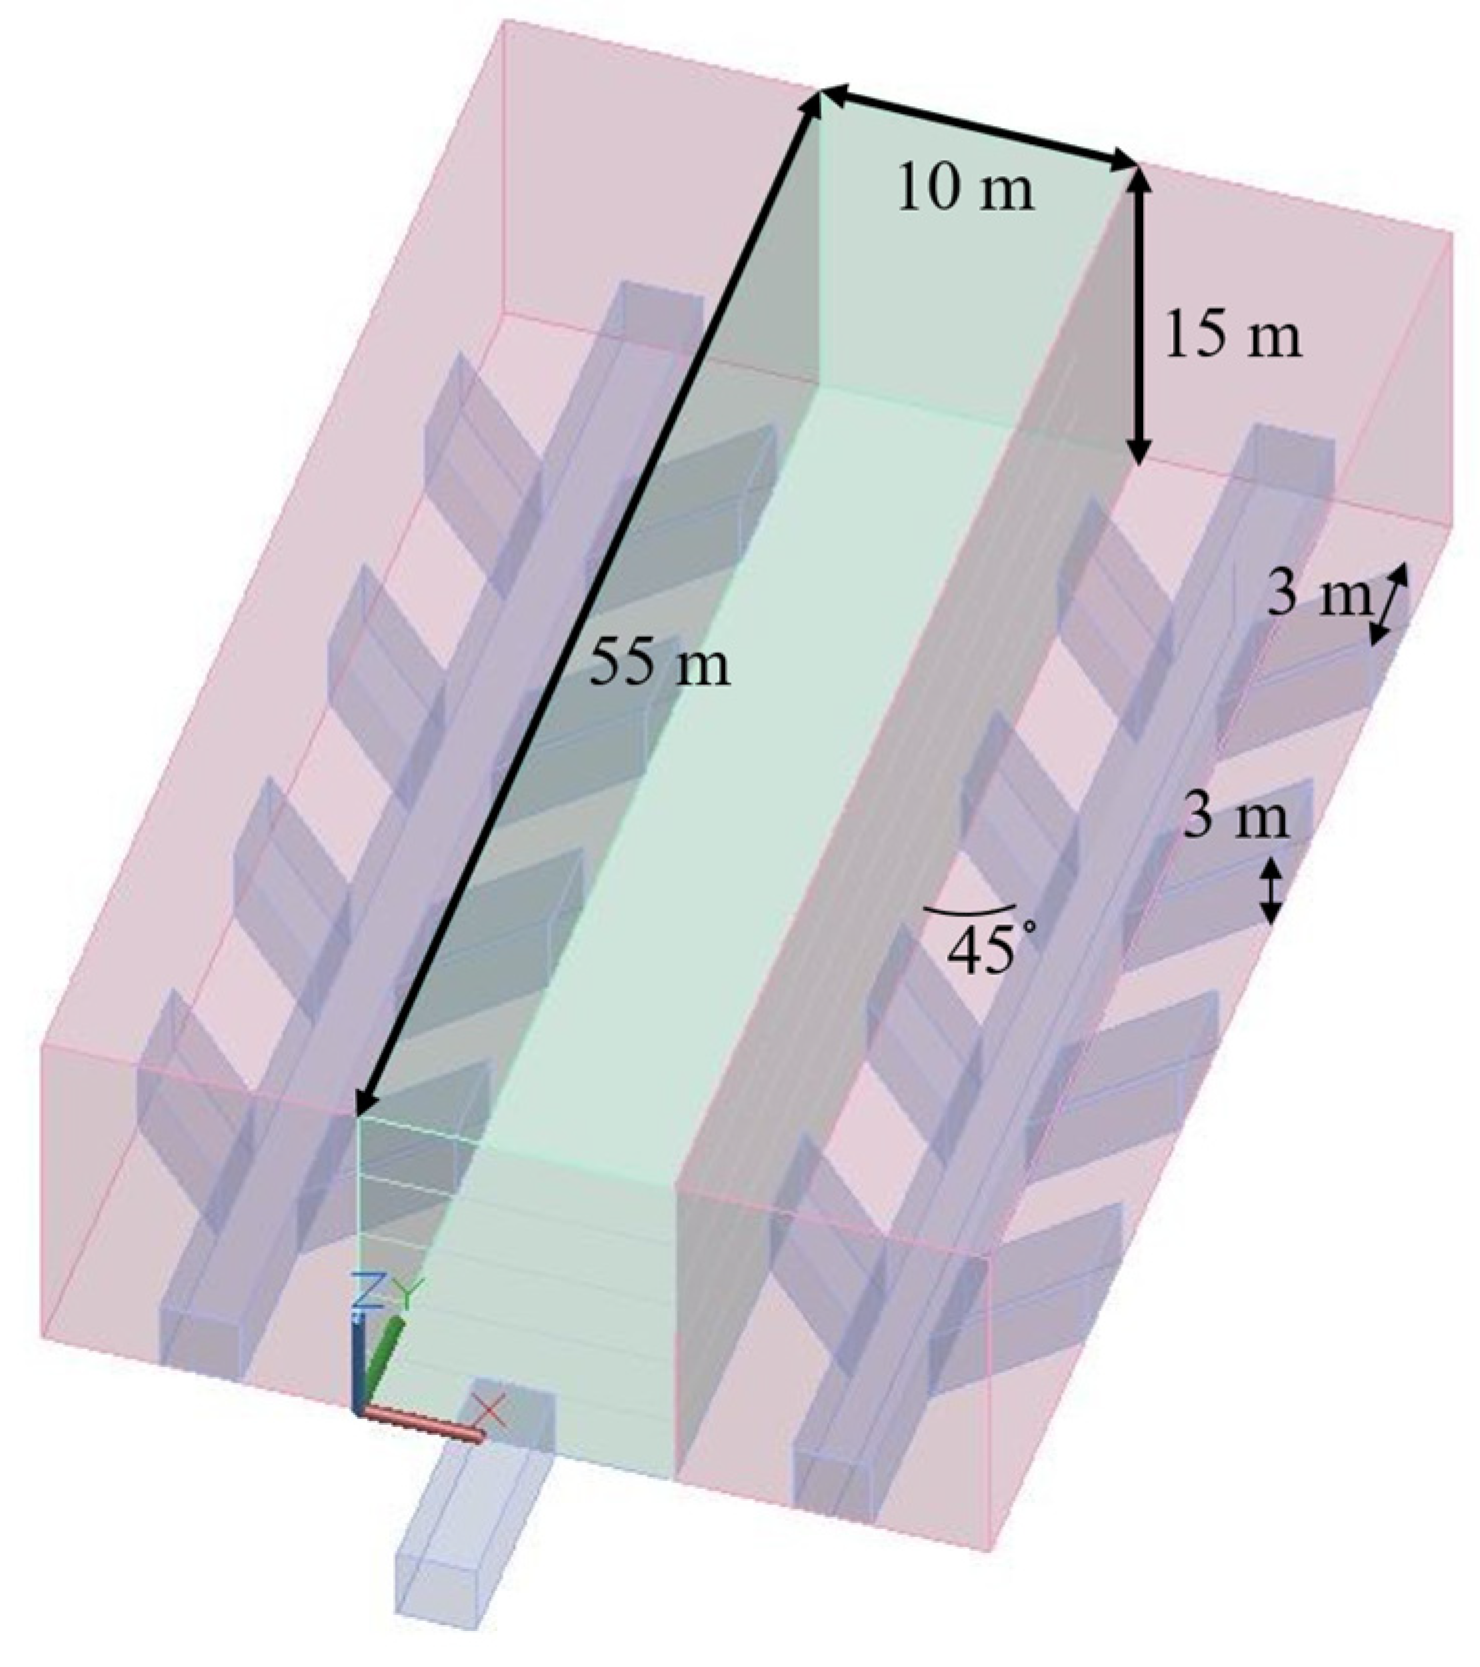
4.2.1. Establishment of Mining Model

According to the indoor rock mechanics test and field data, the simplified stope model is established using PFC3D numerical simulation software. The size of the model is X × Y × Z = 55 m × 10 m × 15 m, the size of the extracted ore drift is X × Y = 3 m × 3 m, the angle is 45°, the radius of the ore is 18 mm, and the waste rock is 19 mm. The mechanical parameters of the ore and rock are shown in Table 3. The spacing of 7 m is selected as the research object for numerical simulation analysis. The initial mining model is shown in Figure 13.

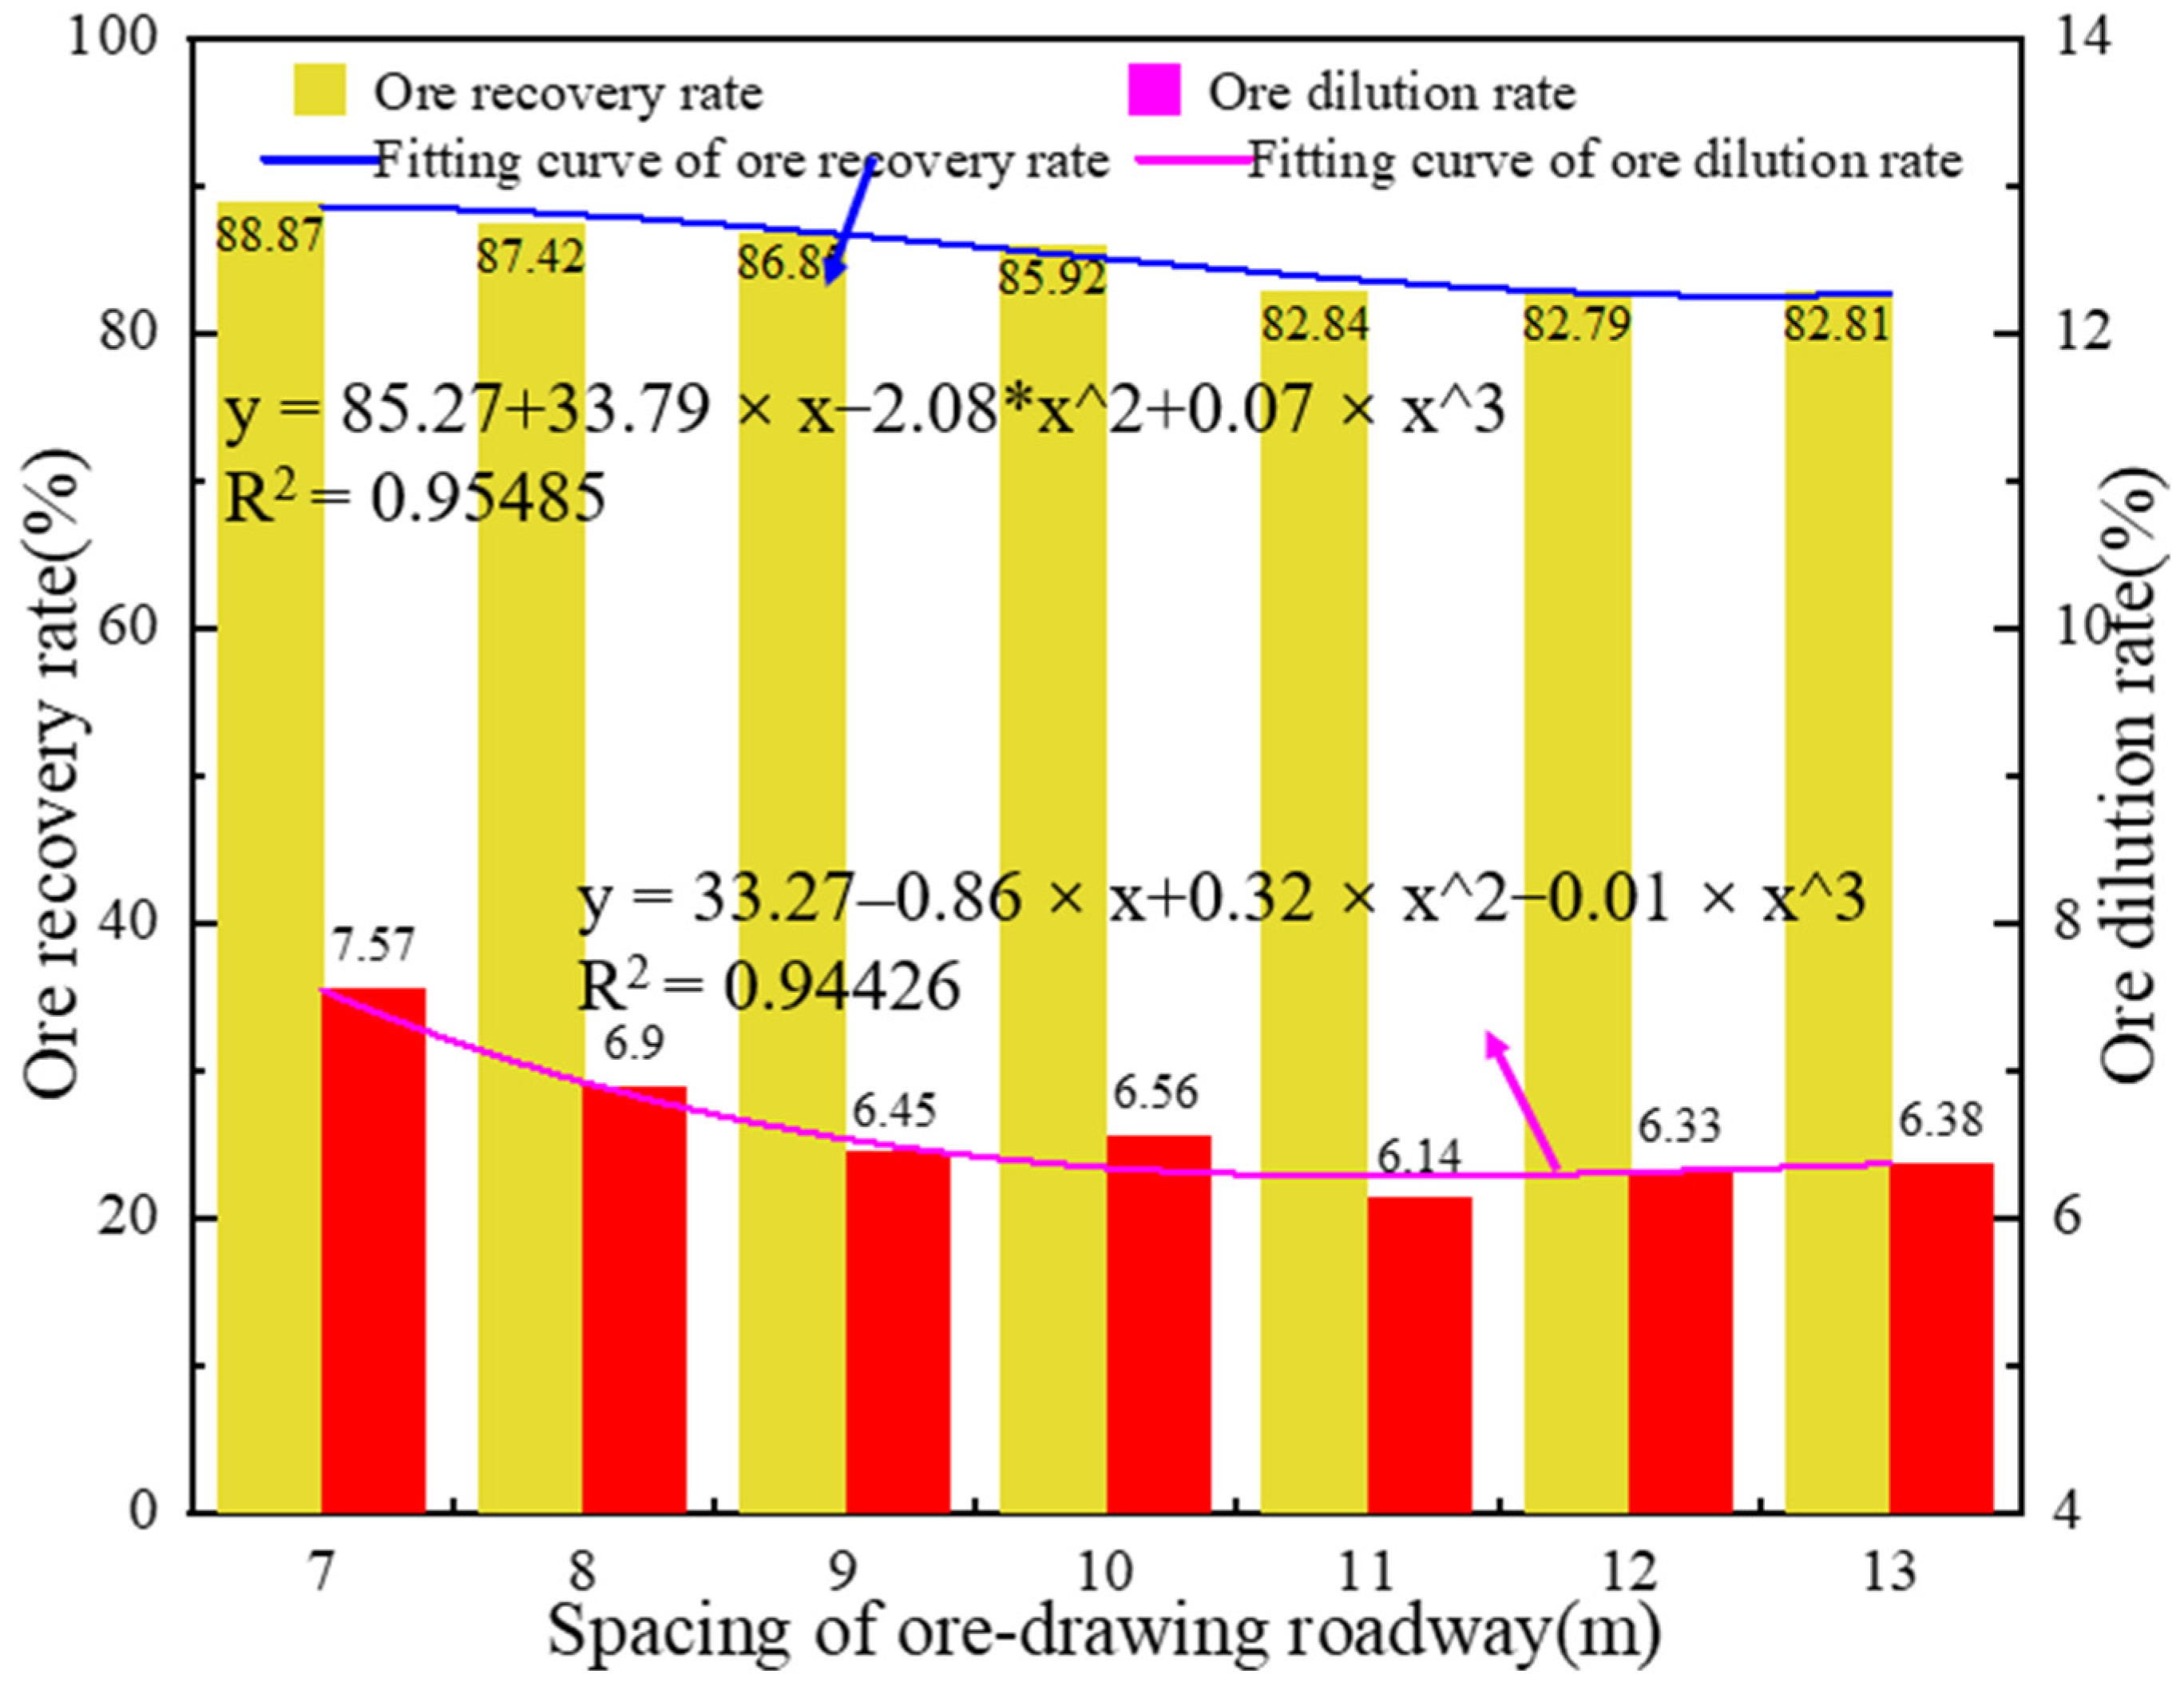
4.2.2. Drawing Simulation Results Analysis

The following is a comprehensive analysis of the flow of ore and rock in the ore body. The study examines the outflow of ore and waste rock and the distribution of ore and rock in the ore body in each period of the drawing process. It intuitively shows the whole drawing process, obtains the output of ore and waste rock after completing the drawing process and the residual parts of ore and waste rock in the ore body, and calculates the ore recovery ratio and dilution ratio.
Figure 14 illustrates the schematic diagram of each stage in the drawing. In Figure 14a, the radius expansion method fills the particles. After the particle filling is completed, the initial balance is carried out. Figure 14b shows that the movement of the upper orebody is not evident in the early stage of drawing. Most of the mine rock mixtures released for the first time are waste rocks, and only a small amount of ore is released. Figure 14c is the drawing process. A small movement occurs in the middle ore body, and the ore flow law is the same as the laboratory physical model experiment. Figure 14d is the final drawing. The ore flow diagram of each stage shows that the mine rock mixture released for the first time is mostly waste rock, and only a small amount of ore is released. After drawing, the ore in the upper part of the outlet is released first and gradually forms a funnel shape. Only a small amount of intermediate ore moves. After the drawing is cut off, a large amount of waste rock is found at both spont mouth ends. The ore in the upper is less, and most of the ore is in the lower part. Finally, more ore is seen in the middle of the spont mouth and at the top of the hanging wall.
Figure 15 shows the relationship between the extracted ore drift spacing and the ore recovery and dilution ratio in the numerical simulation. Its change trend is consistent with the experimental trend of a similar physical model when the dilution ratio is constant in the number of spont mouths. With the increase in spacing, the residual ore and rock increase, the residual waste rock at the bottom increases, and the dilution ratio decreases. When the number of the spont mouth increases, ore and rock drawing increase, and the dilution ratio increases. Considering the recovery ratio and dilution ratio, using the parameter of 9–10 m is recommended for the spacing between the extracted ore drift.

5. Conclusions

(1)
The numerical analysis shows that the excavation of the muck slash caused different degrees of deformation at the roof and floor of the roadway. The roadway has two sides. The shallow part of the roof and floor are in the pressure relief area. The deep and shallow strata of the two bottom corners of the roadway are in the stress concentration area. The excavation of the adjacent two roadways does not affect each other. The largest stress occurred at the roadway crossing, whereas stress is the smallest in the middle area. Stress is symmetrically distributed, and only a small area of the failure zone is generated near the hanging wall at the roadway.
(2)
During the excavation of the room, the secondary stress concentration at the adjacent bottom structure and the stress concentration area of the bottom structure are significantly changed but did not significantly impact its stability. It only affects the near bottom structure to bear more stress transfer.
(3)
In mining, the displacement deformation of the roof and floor at the intersection is the largest and gradually tends to be stable with the mining. The influence of mining disturbance on the stability of the bottom structure has timeliness and periodicity.
(4)
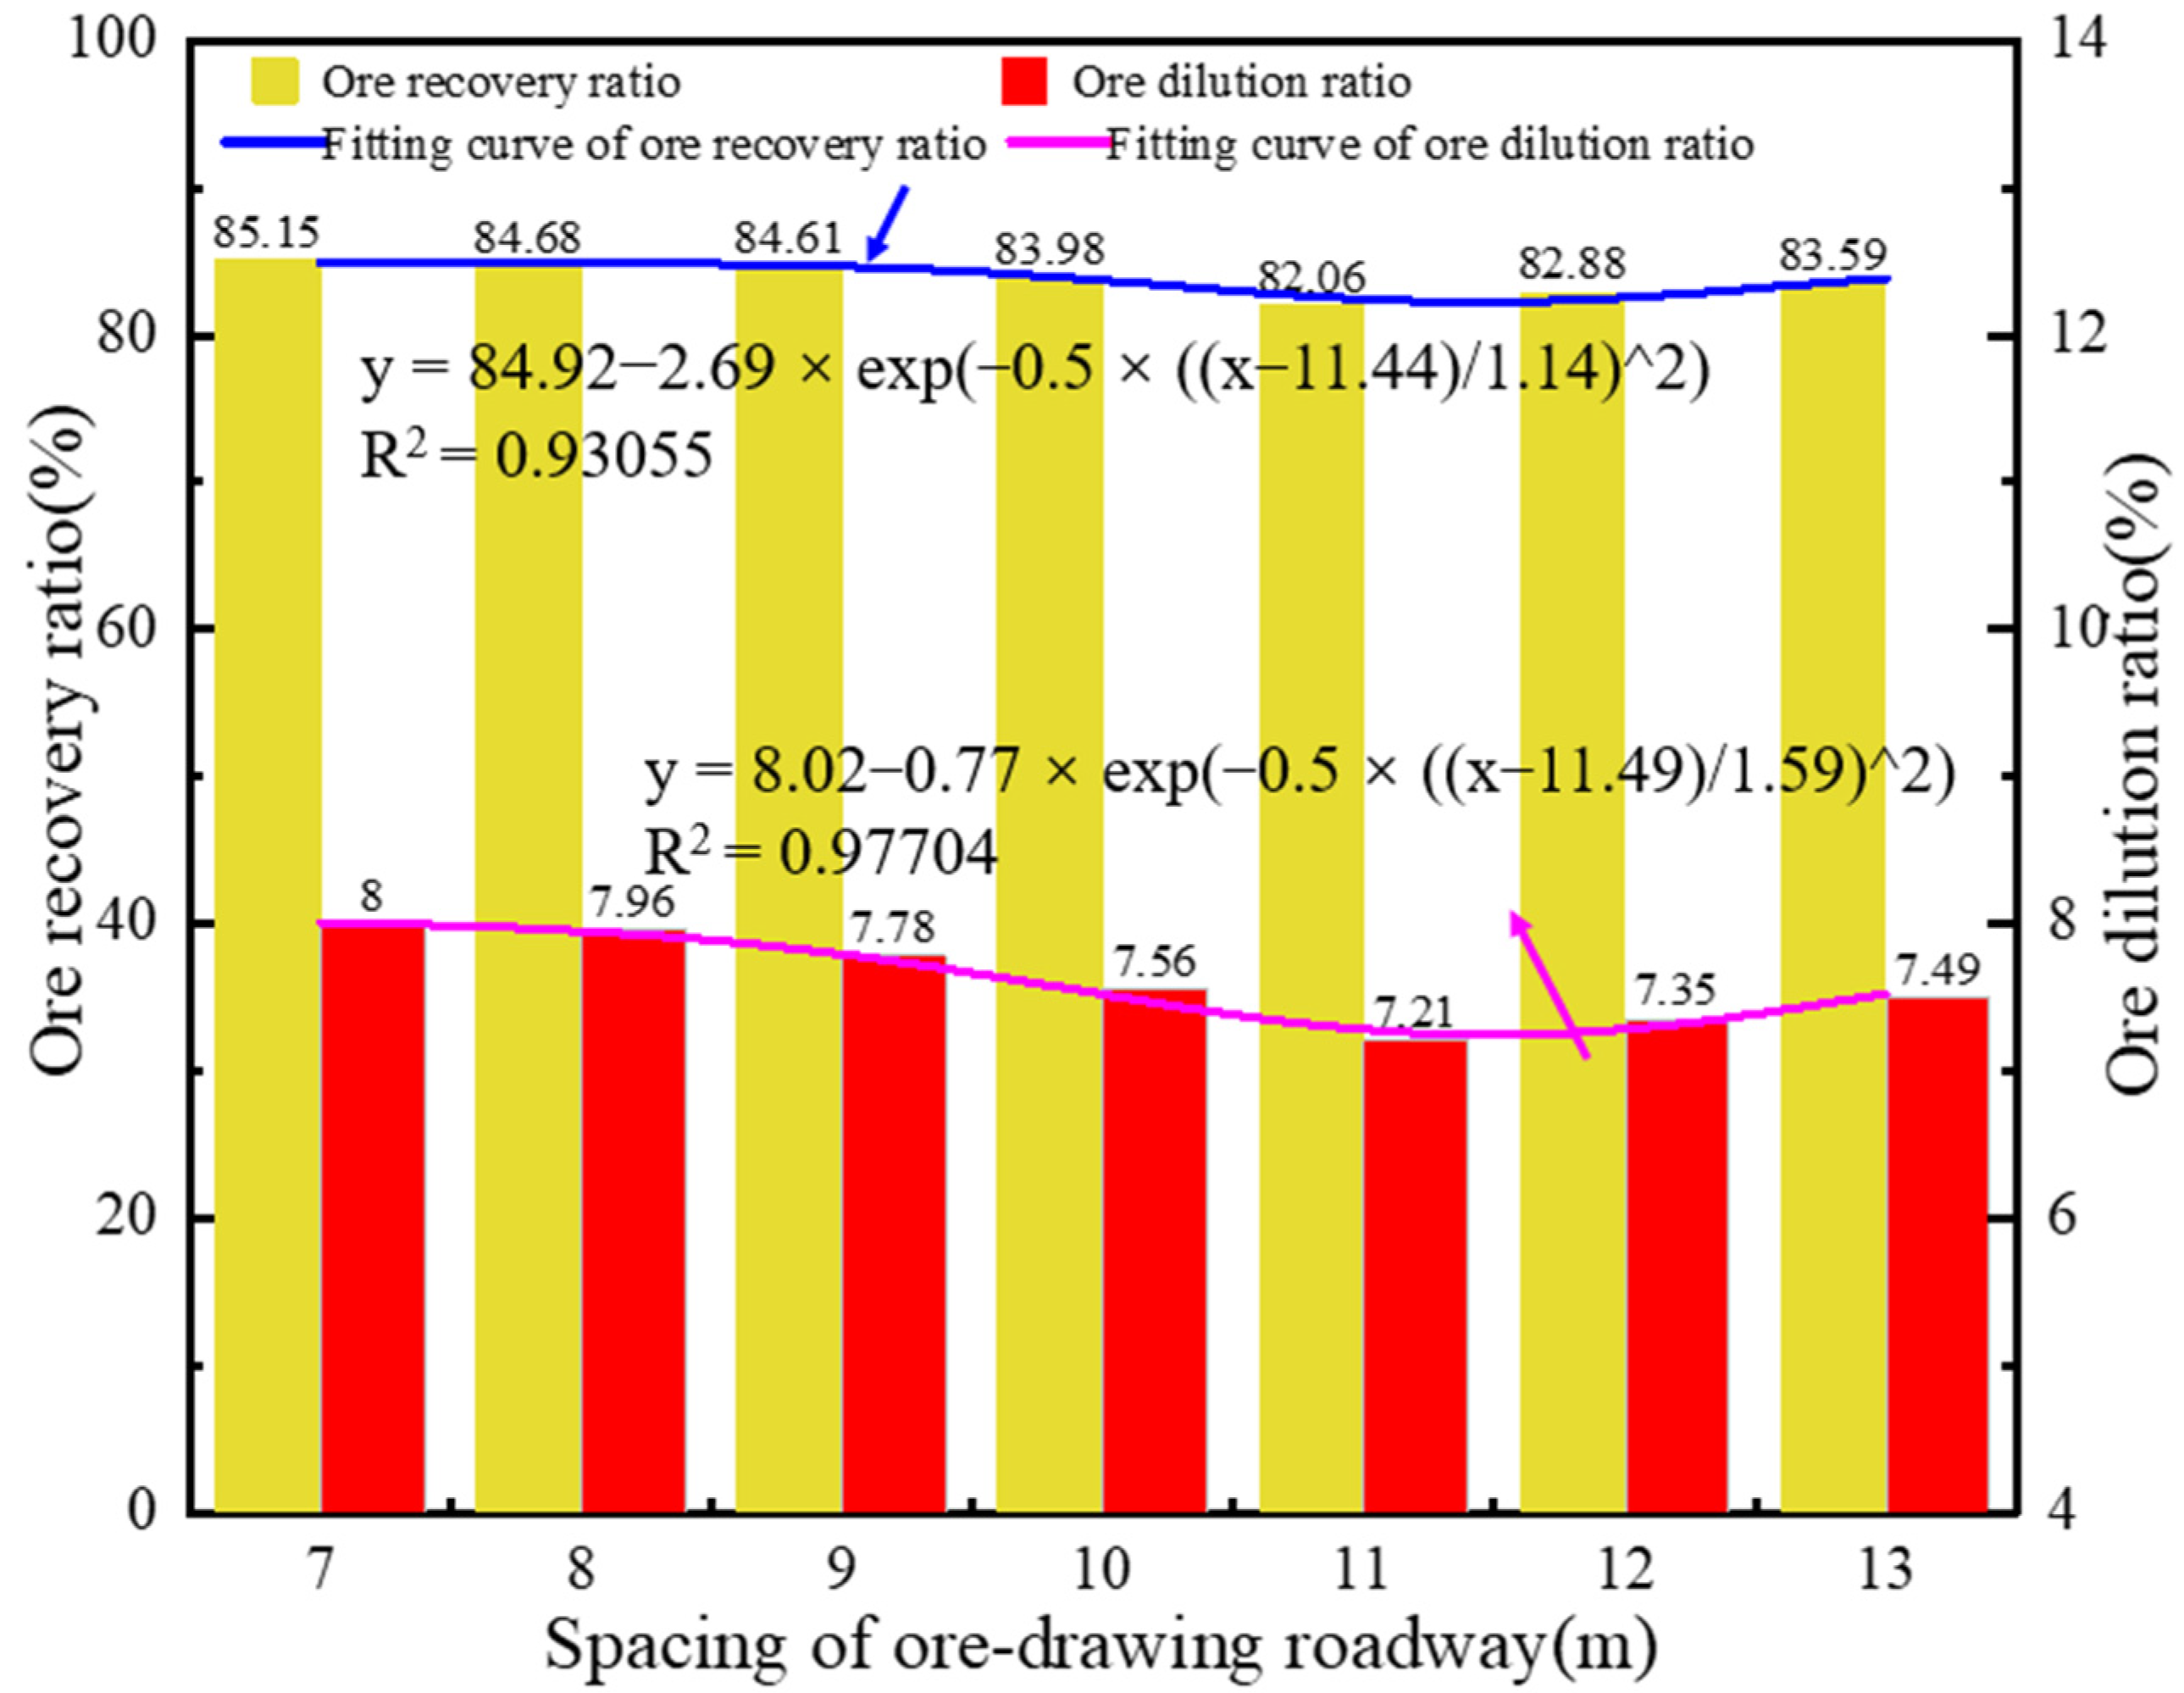
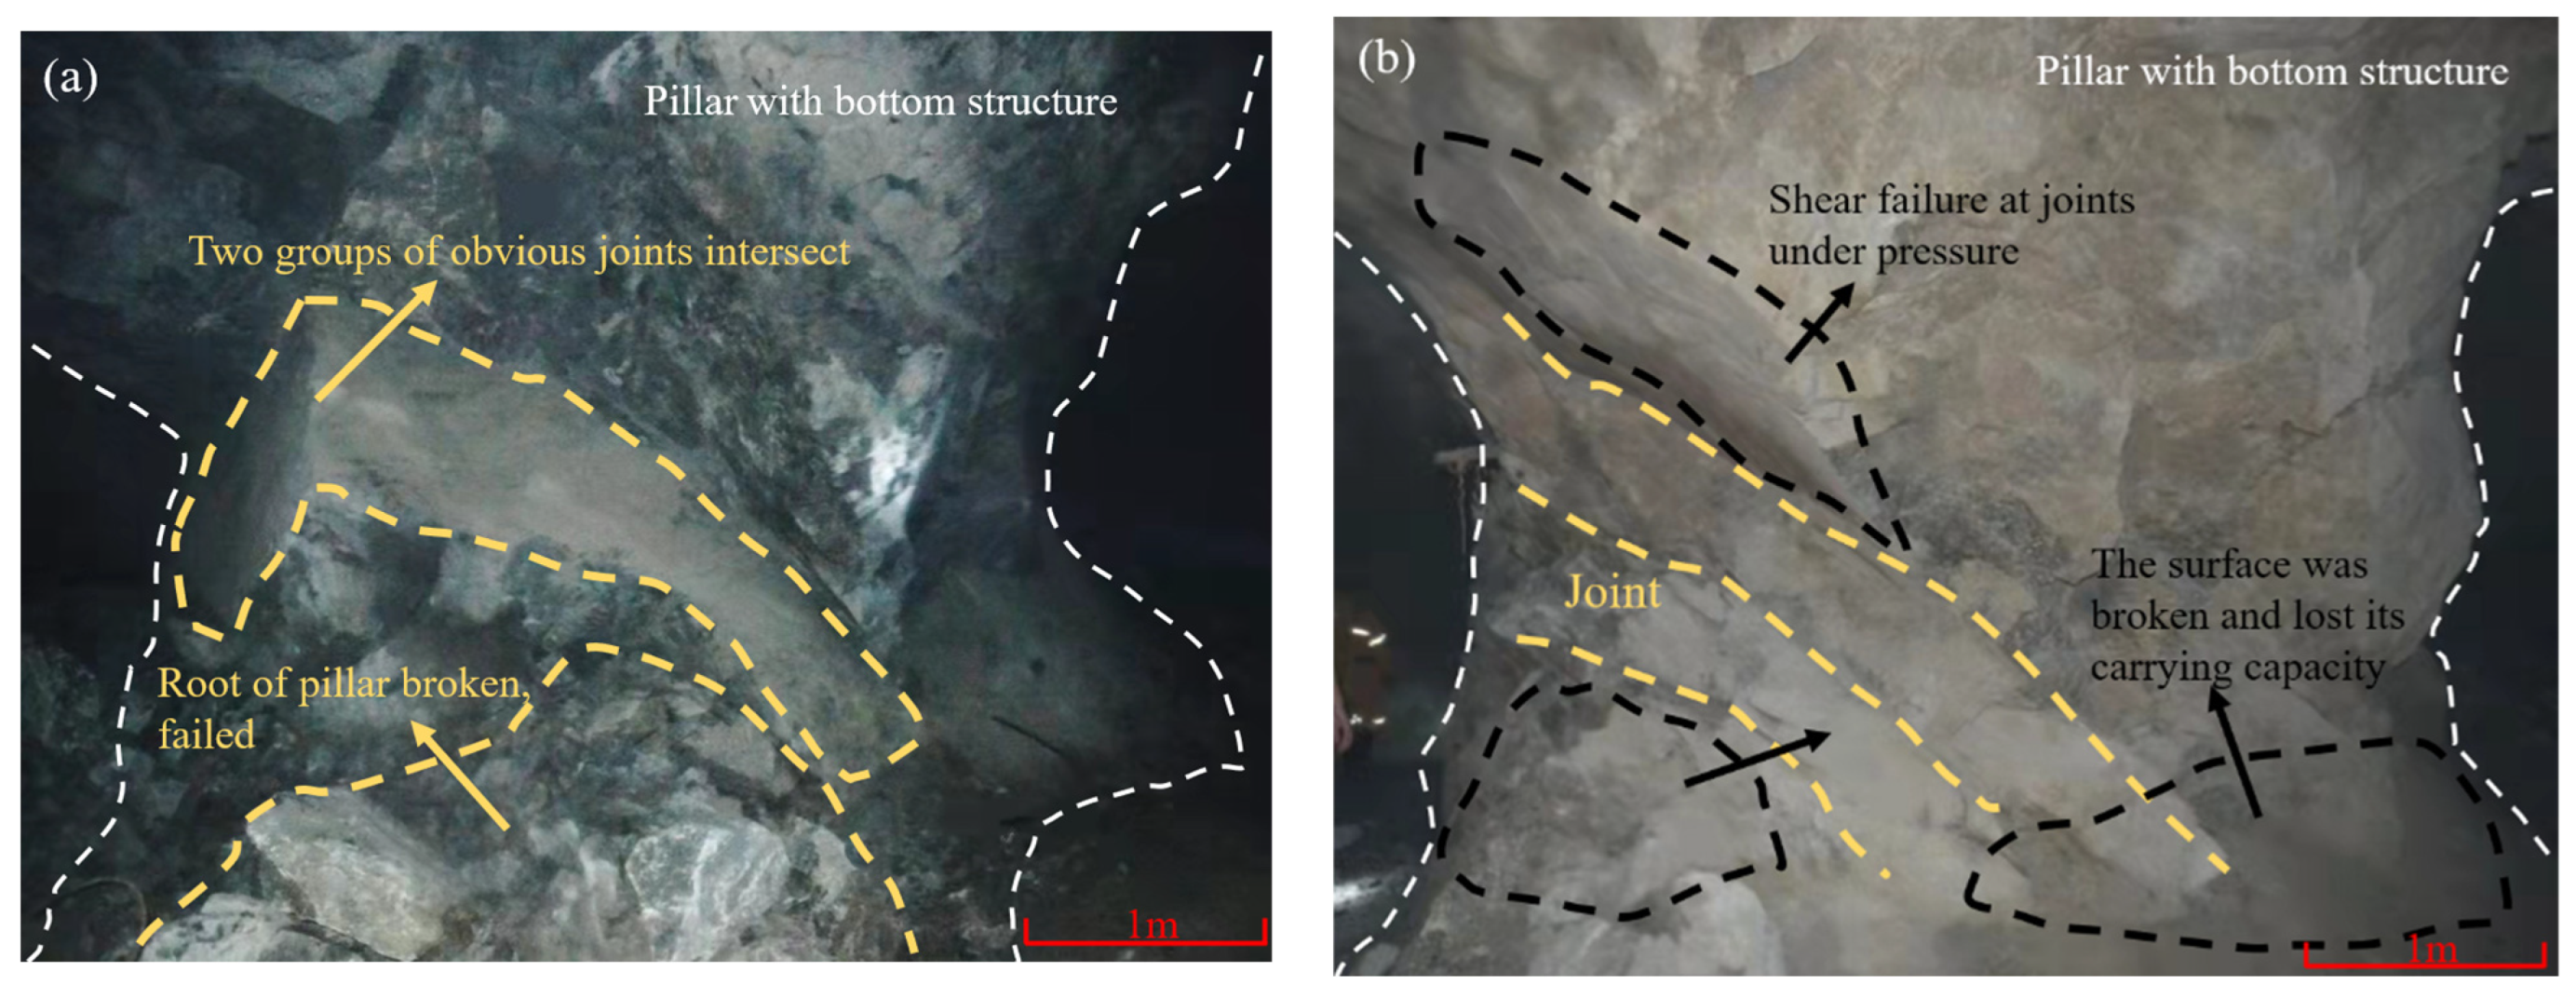
In the stope of this study, the bottom structure of the mining roadway is simplified as a single pillar when the sublevel stoping with delayed backfill method is used. When the actual size of the pillar is less than the theoretical, the pillar will be destroyed along the joint or at the root. Considering the recovery ratio, dilution ratio, and stability, the spacing of the extracted ore drift is recommended to be 9 m, which can be increased to 10 m if stability is poor.

Author Contributions

Conceptualization, M.G. and Y.T.; methodology, Y.T.; software, M.G.; validation, Y.T. and D.C.; formal analysis, M.G.; investigation, D.C.; resources, Y.T. and S.C.; data curation, M.G.; writing—original draft preparation, M.G.; writing—review and editing, Y.T. and W.S.; funding acquisition, Y.T. and W.S. All authors have read and agreed to the published version of the manuscript.

Funding

This work was financially supported by the National Natural Science Foundation of China, grant number 52004019 and Fundamental Research Fund for the Central Universities(FRF-BD-20-03A).

Data Availability Statement

Not applicable.

Acknowledgments

The author gratefully acknowledge all the professors for their guidance and help during testing and writing.

Conflicts of Interest

The authors declare no conflict of interest.

References

  1. Changbin, Y.; Guoyuan, X. Numerical Simulation Analysis of Dynamic Stability of Vertically Arranged Underground Chambers under dynamic load. J. Cent. South Univ. 2006, 37, 593–599. [Google Scholar]
  2. Delentas, A.; Benardos, A.; Nomikos, P. Analyzing Stability Conditions and Ore Dilution in Open Stope Mining. Minerals 2021, 11, 1404. [Google Scholar] [CrossRef]
  3. Li, S.; Zhao, Z.; Yu, H.; Wang, X. The Recent Progress China Has Made in the Backfill Mining Method, Part II: The Composition and Typical Examples of Backfill Systems. Minerals 2021, 11, 1362. [Google Scholar] [CrossRef]
  4. Lu, J.; Chu, H.; Lin, S.; Gong, Y. Research on the stability of bottom structure based on FLAC3D numerical simulation. Min. Res. Dev. 2020, 40, 19–23. [Google Scholar]
  5. Li, X.; Yao, J.; Gong, F. Dynamic problems in deep mining of hard rock metal mines. Chin. J. Nonferrous Met. 2011, 21, 2551–2563. [Google Scholar] [CrossRef]
  6. Cheng, J.; Zhang, Q.; Xue, X.; Wang, S.; Cao, R. Optimization of stope structure parameters based on AHP and TOPSIS method. Min. Metall. Eng. 2014, 34, 1–5. [Google Scholar]
  7. Ma, M.; Guo, Q.; Pan, J.; Ma, C.; Cai, M. Optimal Support Solution for a Soft Rock Roadway Based on the Drucker–Prager Yield Criteria. Minerals 2022, 12, 1. [Google Scholar] [CrossRef]
  8. Bai, X.; Marcotte, D.; Simon, R. Underground stope optimization with network flow method. Comput. Geosci. 2013, 52, 361–371. [Google Scholar] [CrossRef]
  9. Sameera, S.D.S.; Erkan, T.; Ali, A.M.W. Designing an optimal stope layout for underground mining based on a heuristic algorithm. Int. J. Min. Sci. Technol. 2015, 25, 767–772. [Google Scholar]
  10. Yin, S.; Wu, A.; Li, X. Orthogonal range analysis on sensitivity of influencing factors of pillar stability. J. Coal 2012, 37, 48–52. [Google Scholar] [CrossRef]
  11. Shi, Y.; Ye, Y.; Hu, N.; Jiao, Y.; Wang, X. Physical Simulation Test on Surrounding Rock Deformation of Roof Rockburst in Continuous Tunneling Roadway. Minerals 2021, 11, 1335. [Google Scholar] [CrossRef]
  12. Lan, M.; Liu, Z.; Li, X. Multi-objective multi-attribute optimization of structural parameters of subsequent filling stope. J. Cent. South Univ. 2019, 50, 375–383. [Google Scholar]
  13. Qi, C.; Chen, Q. Evolutionary Random Forest Algorithms for Predicting the Maximum Failure Depth of Open Stope Hangingwalls. IEEE Access 2018, 6, 72808–72813. [Google Scholar] [CrossRef]
  14. Yu, Y.; Lu, J.; Chen, D.; Pan, Y.; Zhao, X.; Zhang, L. Study on the Stability Principle of Mechanical Structure of Roadway with Composite Roof. Minerals 2021, 11, 1003. [Google Scholar] [CrossRef]
  15. Nan, S.; Qian, G.; Liu, Z. Numerical Simulation of Fluid-Solid Coupling in Surrounding Rock and Parameter Optimization for Filling Mining. Int. Symp. Mine Saf. Sci. Eng. 2011, 26, 1639–1647. [Google Scholar]
  16. Feng, X.; Ding, Z.; Hu, Q.; Zhao, X.; Ali, M.; Banquando, J.T. Orthogonal Numerical Analysis of Deformation and Failure Characteristics of Deep Roadway in Coal Mines: A Case Study. Minerals 2022, 12, 185. [Google Scholar] [CrossRef]
  17. Zhang, D.; Bai, J.; Yan, S.; Wang, R.; Meng, N.; Wang, G. Investigation on the Failure Mechanism of Weak Floors in Deep and High-Stress Roadway and the Corresponding Control Technology. Minerals 2021, 11, 1408. [Google Scholar] [CrossRef]
  18. Zhang, Z.; Shi, X.; Qiu, X. Using Mathews synthetic chart and dynamic and static load numerical simulation to evaluate stope stability of inclined ore body. J. Nonferrous Met. China 2022, 1–11. Available online: http://kns.cnki.net/kcms/detail/43.1238.TG.20210831.1316.005.html (accessed on 12 February 2022).
  19. Wang, X.; Wang, C.; Zhang, Q.; Yuan, J.; Chen, B. Analysis of stope stability based on ANSYS program. Met. Mine 2008, 08, 17–20. [Google Scholar]
  20. Liu, D.; Shao, A.; Jin, C.; Ding, S.; Fan, F. Construction of numerical calculation model of underground broken orebody and optimization of stope structure parameters. J. Cent. South Univ. 2019, 50, 437–444. [Google Scholar]
  21. Xu, W.; Song, W.; Du, J.; Mei, L.; Liu, B. Stability Analysis of Excavation Disturbance of Bottom Structure Roadway Group in Metal Mine. Undergr. Space Eng. J. 2014, 10, 689–696. [Google Scholar]
  22. Huang, Y.; Yang, W.; Li, Y.; Guo, W. Spatial Distribution Characteristics of Plastic Failure and Grouting Diffusion within Deep Roadway Surrounding Rock under Three-Dimensional Unequal Ground Stress and Its Application. Minerals 2022, 12, 296. [Google Scholar] [CrossRef]
  23. Zhu, D.; Wang, J.; Gong, W.; Sun, Z. Model Test and Numerical Study on Surrounding Rock Deformation and Overburden Strata Movement Law of Gob-Side Entry Retaining via Roof Cutting. Minerals 2020, 10, 458. [Google Scholar] [CrossRef]
  24. Wenjie, G. Optimization of stope structure parameters based on MIDAS-GTS. Min. Res. Dev. 2017, 37, 1–5. [Google Scholar] [CrossRef]
  25. Milic, V.; Radovanovic, M. Determination of the main parameters of semi-level induced caving method with lateral loading. J. Min. Sci. 2021, 57, 76–85. [Google Scholar] [CrossRef]
  26. Wang, S.; Li, X. Grade Distribution Modeling within the Bauxite Seams of the Wachangping Mine, China, Using a Multi-Step Interpolation Algorithm. Minerals 2017, 7, 71. [Google Scholar] [CrossRef] [Green Version]
  27. Huang, Y.; Dai, X.; Bai, Y.; Wang, L. Optimization of stope bottom structure and improvement of ore extraction process in high-stage stope. Min. Metall. Eng. 2013, 33, 21–24, 29. [Google Scholar]
  28. Wu, P.; Chen, L.; Li, M.; Wang, L.; Wang, X.; Zhang, W. Surrounding Rock Stability Control Technology of Roadway in Large Inclination Seam with Weak Structural Plane in Roof. Minerals 2021, 11, 881. [Google Scholar] [CrossRef]
  29. Zhao, H.; Liu, Y.; Li, J.; Xu, J. Analysis of damage process and zoning failure characteristics of floor rock mass under isolated island coal pillar. J. China Univ. Min. Technol. 2021, 50, 963–974. [Google Scholar]
  30. Zhang, C.; Song, W.; Fu, J.; Li, Y. Rock mass stability analysis under seabed mining disturbance. J. China Univ. Min. Technol. 2020, 49, 1035–1045. [Google Scholar]
  31. Xie, X.; Xie, H.; Tian, H.; Xiong, H.; Li, J. Study on meso-mechanism of pillar damage and fracture instability under excavation disturbance. Min. Metall. Eng. 2019, 39, 30–36. [Google Scholar]
  32. Wang, G.; Yuan, Y.; Gao, Y.; Sun, M.; Ge, Y. Optimization of bottom structure of large diameter deep hole stage open stope and subsequent filling mining method. World Nonferrous Met. 2021, 22, 31–32. [Google Scholar]
  33. Zhao, K.; Yan, H.; Feng, X.; Wang, X.; Zhang, J.; Zhao, K. Pillar stability analysis based on energy method. J. Mech. 2016, 48, 976–983. [Google Scholar]
  34. Song, W.; Cao, S.; Fu, J.; Jiang, G.; Wu, F. Sensitivity analysis of influencing factors of pillar stability and its application. Geotech. Mech. 2014, 35, 271–277. [Google Scholar]
  35. Guo, J.; Li, M.; Wang, X. Study on the spacing of ore drawing roadway of broken ore body in Xujiagou copper mine, Shaanxi. Met. Mine 2018, 1, 58–62. [Google Scholar]
Figure 1. Stope solid model.
Minerals 12 00709 g001
Figure 2. Typical pillar damage. (a) Pillar joint failure (b) Pillar root failure.
Minerals 12 00709 g002
Figure 3. Initial diagram of the calculation model.
Minerals 12 00709 g003
Figure 4. Stress distribution of bottom structure.
Minerals 12 00709 g004
Figure 5. Displacement of the excavation.
Minerals 12 00709 g005
Figure 6. Distribution of plastic zone.
Minerals 12 00709 g006
Figure 7. Left view after excavation.
Minerals 12 00709 g007
Figure 8. Distribution of monitoring points. (a) Top view of MP layout (b) Side view of MP layout.
Minerals 12 00709 g008
Figure 9. Displacement curve of each monitoring point. (a) The first group of MPs (b) The second group of MPs (c) The third group of MPs (d) The fourth group of MPs (e) The fifth group of MPs (f) The sixth group of MPs.
Minerals 12 00709 g009aMinerals 12 00709 g009b
Figure 10. Experimental model diagram.
Minerals 12 00709 g010
Figure 11. The drawing process.
Minerals 12 00709 g011
Figure 12. Effects of different mining roadway spacings on recovery ratio and dilution ratio.
Minerals 12 00709 g012
Figure 13. Drawing of ore drawing model.
Minerals 12 00709 g013
Figure 14. Schematic diagram of the drawing process.
Minerals 12 00709 g014
Figure 15. Influence of different spacing of extracted ore drift on recovery ratio and dilution ratio.
Minerals 12 00709 g015
Table 1. Physical and mechanical parameters of ore and rock.
Mechanical ParameterHanging WallFootwallOre BodyMain Fracture Surface
natural density g/cm32.72.722.822.73
Cohesion C/MPa4.64.84.72.2
angle of internal friction
φ/(°)
35393734
p-wave velocities m/s4943540150295014
tensile strength MPa2.402.502.451.02
compressive strength MPa72.085.070.042.0
elastic modulus E/GPa16212013
Poisson ratio γ0.220.210.240.22
Table 2. Parameter of bulk modulus and shear modulus.
Mechanical ParameterHanging WallFootwallOre BodyMain Fracture Surface
volume modulus K/Kpa9.5212.0712.827.74
shear modulus G/Mpa13.1117.3616.1310.66
Table 3. Parameter table of numerical simulation.
MaterialTangential
Stiffness (N·m−1)
Normal Stiffness
(N·m−1)
Density
(kg/m3)
Friction
Coefficient
surrounding rock1.2 × 1081.2 × 108/0.35
ore1.0 × 1081.0 × 10827000.3
rock1.0 × 1081.0 × 10830000.3
Publisher’s Note: MDPI stays neutral with regard to jurisdictional claims in published maps and institutional affiliations.

