Article

Study on the Alteration of Pore Parameters of Shale with Different Natural Fractures under Supercritical Carbon Dioxide Seepage

1
State Key Laboratory of Oil & Gas Reservoir Geology and Exploitation, Chengdu University of Technology, Chengdu 610059, China
2
Southwest Oil & Gas Field Company, PetroChina, Chongqing 400707, China
3
China Coal Technology and Engineering Group Co., Ltd., Coal Mining Research Institute, Beijing 100013, China
4
Energy and Geoscience Institute, The University of Utah, Salt Lake City, UT 84108, USA
*
Author to whom correspondence should be addressed.
Minerals 2022, 12(6), 660; https://doi.org/10.3390/min12060660
Submission received: 14 April 2022 / Revised: 13 May 2022 / Accepted: 16 May 2022 / Published: 24 May 2022

Abstract

:
Supercritical CO2 can reduce formation fracture pressure, form more complex fractures in the near-well zone, and replace methane to complete carbon sequestration, which is an important direction for the efficient development of deep shale gas with carbon sequestration. In this paper, based on the scCO2 fracturing field test parameters and the characteristics of common shale calcite filled natural fractures, we simulated the porosity change in shale with three kinds of fractures (no fracture, named NF; axial natural fracture, named AF; and transversal natural fracture, named TF) under scCO2 seepage, and carried out the experimental verification of shale under supercritical CO2 seepage. It was found that: (1) At the same pressure, when the temperature is greater than the critical temperature, the shale porosity of three kinds of fractures gradually increases with the injection of CO2, and the higher the temperature, the more obvious the increase in porosity. (2) At the same temperature and different pressures, the effect of pressure change on the porosity of shale specimens was more obvious than that of temperature. (3) Multi-field coupling experiments of shale under supercritical CO2 seepage revealed that the porosity of all three shale specimens at the same temperature and pressure increased after CO2 injection, and the relative increase in shale porosity measured experimentally was basically consistent with the numerical simulation results. This paper reveals the mechanism of the effect of different temperatures and pressures of scCO2 and different natural fractures on the change in shale porosity, which can be used to optimize the CO2 injection in supercritical CO2 fracturing and carbon sequestration.

1. Introduction

Deep shale gas in China is buried up to 5000 m in depth, with high in situ stress [1], complex natural fractures, high plasticity, and high fracturing pressure. Even though the volume of fluid used in single well fracturing is more than twice as much as that in shallow and medium layers, it is still difficult to achieve sufficient stimulated reservoir volume, and the effect of increasing production is not satisfactory [2]. Because of the properties of supercritical carbon dioxide (scCO2, SC-CO2 or SCCO2) fluids, they are widely used in other industries, such as petroleum engineering [3], material construction [4], food processing [5], solid solubility [6,7], and solid aromatic compounds absorption [8]. In addition to being more environmentally friendly than other fracturing fluids, scCO2 fracturing can increase formation pressure and create more fractures. Moreover, scCO2 can adsorb methane on rock surfaces and help to extract it, which further improves the overall shale gas production. Additionally, supercritical CO2 fracturing is a new waterless fracturing method for the shale gas reservoir [9]. After scCO2 is injected into shale reservoirs, it will cause dissolution damage to the microscopic morphology and mineral composition of shale, resulting in the weakening of the macroscopic mechanical properties of shale and an increase in reservoir pore-permeability parameters [10]. In summary, the scCO2 fracturing is an important research orientation for the efficient development of deep shale gas and carbon sequestration [11,12,13]. In this study, in order to clarify the influence mechanism of scCO2 on the porosity of fractured shale under different conditions, variable parameter experiments or numerical simulations are generally used to quantitatively evaluate the pore alteration.
Researchers have studied the alteration of the pore characteristics of conventional rocks caused by scCO2. Lahann et al. [14] conducted experiments on high-temperature and high-pressure CO2 brine treatment of shales and found that the content of K, Mg, and Ca elements in the filtrate was significantly elevated. Alemu et al. [15] carried out experimental studies for the reaction process of scCO2 with capped shales at different temperatures and pressures and found that mineral elements and silica increase in aqueous solutions. Wang et al. [16] experimentally studied the reaction of dolomite with dry and wet scCO2 reactions and found that controlling different temperatures and reaction times will result in different degrees and morphologies of carbonate mineralization. Wang et al. [17] investigated CO2–water–rock interactions under hydrothermal conditions and found that the corrosion of feldspar and clay minerals increased with increasing temperature. Jung et al. [18] found extensive pyrite oxidation of shale–CO2–brine in the presence of oxygen, resulting in enhanced calcite and dolomite dissolution, by geochemical experiments.
Researchers have studied the interaction between scCO2 and rocks. Xu et al. [19,20] performed numerical simulations using TOUGHREACT to analyze the mass transfer and CO2 sequestration efficiency between sandstone and shale layers. Tian et al. [21,22] found a CO2 transport pattern within the cap for minerals with different inhomogeneous arrangements. Gherardi et al. [23] used intermittent simulations and one- and two-dimensional simulations to investigate the carbon sequestration. Dalkhaa et al. [24] used the chemical reaction simulation program TOUGHREACT to predict the interaction of fluids and rock minerals with injected CO2 in the reservoir.
Related scholars have confirmed the existence of a chemical reaction between scCO2 and rocks using chemical fluid flow dissolution experiments in high-temperature autoclave and chemical reaction simulation software, and obtained the law of rocks subjected to acid dissolution under scCO2 conditions. However, the related studies are based on carbon geological sequestration engineering as the research background. In the scCO2 fracturing to develop shale gas engineering, due to the phase parameters of scCO2, fluid, temperature, pressure, and rock properties are different from those in the previous studies. Thus, the relevant conclusions cannot be directly applied to the scCO2 fracturing to develop shale gas reservoir engineering.
In the process of production enhancement, the alteration of pore characteristics of rocks directly affects the effect of production enhancement transformation, and has an obvious influence on the oil and gas production of the final transformed reservoir. For the alteration of rock pore characteristics by scCO2, scholars have carried out research mainly based on the engineering background of carbon geological sequestration, and the related progress is shown as follows.
Scholars have studied on the alteration of pore characteristics of conventional rocks by scCO2 treatment. Emberley et al. [25] and Liu et al. [26] found that scCO2 dissolved a variety of minerals (including quartz, feldspar, some carbonates, illites, etc.), and also changed the original pore structure and left irregular etch marks on the surface of these mineral crystals. He et al. [27] found that mineral particles were significantly deformed by the action of scCO2, and many particles were cleaved by microfractures and micropores of different sizes, and in rocks with weak cementation. Cai et al. [28,29] conducted the experimental investigation on the rock breaking characteristics of scCO2 jets, and they found that scCO2 creates more micro- and macro- complex fracture morphology, and a larger fracture volume and CO2 absorption rate than those in the hydraulic fracturing.
Scholars have studied the alteration of shale pore characteristics by scCO2 treatment. Okamoto et al. [30] found that CO2 changed the pore throat distribution of rocks when studying the interaction of carbon sequestered cap mud shale with CO2. Davila et al. [31] carried out experiments for shale, limestone and marl at different temperatures and pressures to study the changes in rock porosity, pore structure and permeability during carbon sequestration. Edlmann et al. [32] found that the fracture conductivity was controlled by multiple factors, such as stress conditions and chemical reaction rates during scCO2 fracturing. Wollenweber et al. [33] found that CO2 could reduce capillary breakthrough in caprock in the study of carbon sequestration efficiency. Bourg et al. [34] found that the permeability of shales and mudstones depends heavily on the volume fraction of clay, that permeability may be extremely low even in the presence of fractures, and that the wettability of rock mineral surfaces can be affected by CO2. Yin et al. [35] and Zhou et al. [36] treated Longmaxi shale with scCO2 and subcritical CO2 for more than 20 days and found that the reaction of scCO2 with shale had a limited effect on pore morphology and mesopore distribution, but the effect on micropores is significant.
In summary, relevant scholars have studied the change pattern of rock pores during carbon sequestration, but most of them consider the rock as a sealing cap rather than a reservoir. On the other hand, the current literature rarely considers the natural macroscopic fractures in shale reservoirs. However, in actual engineering, macroscopic natural calcite-filled fractures will reopen when under stress, affecting the extent of the transformation wave during scCO2 fracturing. Therefore, in order to simulate the actual dynamic flow conditions, the scCO2 fracturing field test parameters and the common natural fracture characteristics of calcite filling in cores are considered. Additionally, TOUGHREACT software is used to study the porosity change mechanism of fractured shale under scCO2 multi-field coupling based on the reaction mechanism between supercritical CO2 and minerals. In this study, the effect of scCO2 on the porosity change in fractured shale under different conditions (such as temperature, pressure and fracture parameters) will provide guidance for the selection of parameters in the field fracturing design.

2. Multi-Scale Natural Fracture Distribution and Filling Characteristics of Shale

Natural fractures in shales are widespread and have a significant impact on the extension of fractured hydraulic fractures and the safety of carbon sequestration [37]. Gale et al. [38] characterized natural fractures in four Barnett Shale cores for fracture orientation, geometry, and closure. The natural fractures were found to be more common, narrower in size (typically around 0.05 mm), and often filled with calcite in a trapezoidal arrangement. Additionally, it is believed that smaller filled fractures will behave in the same way as mechanically weak surfaces during hydraulic fracturing, which can be reactivated when subjected to stress.

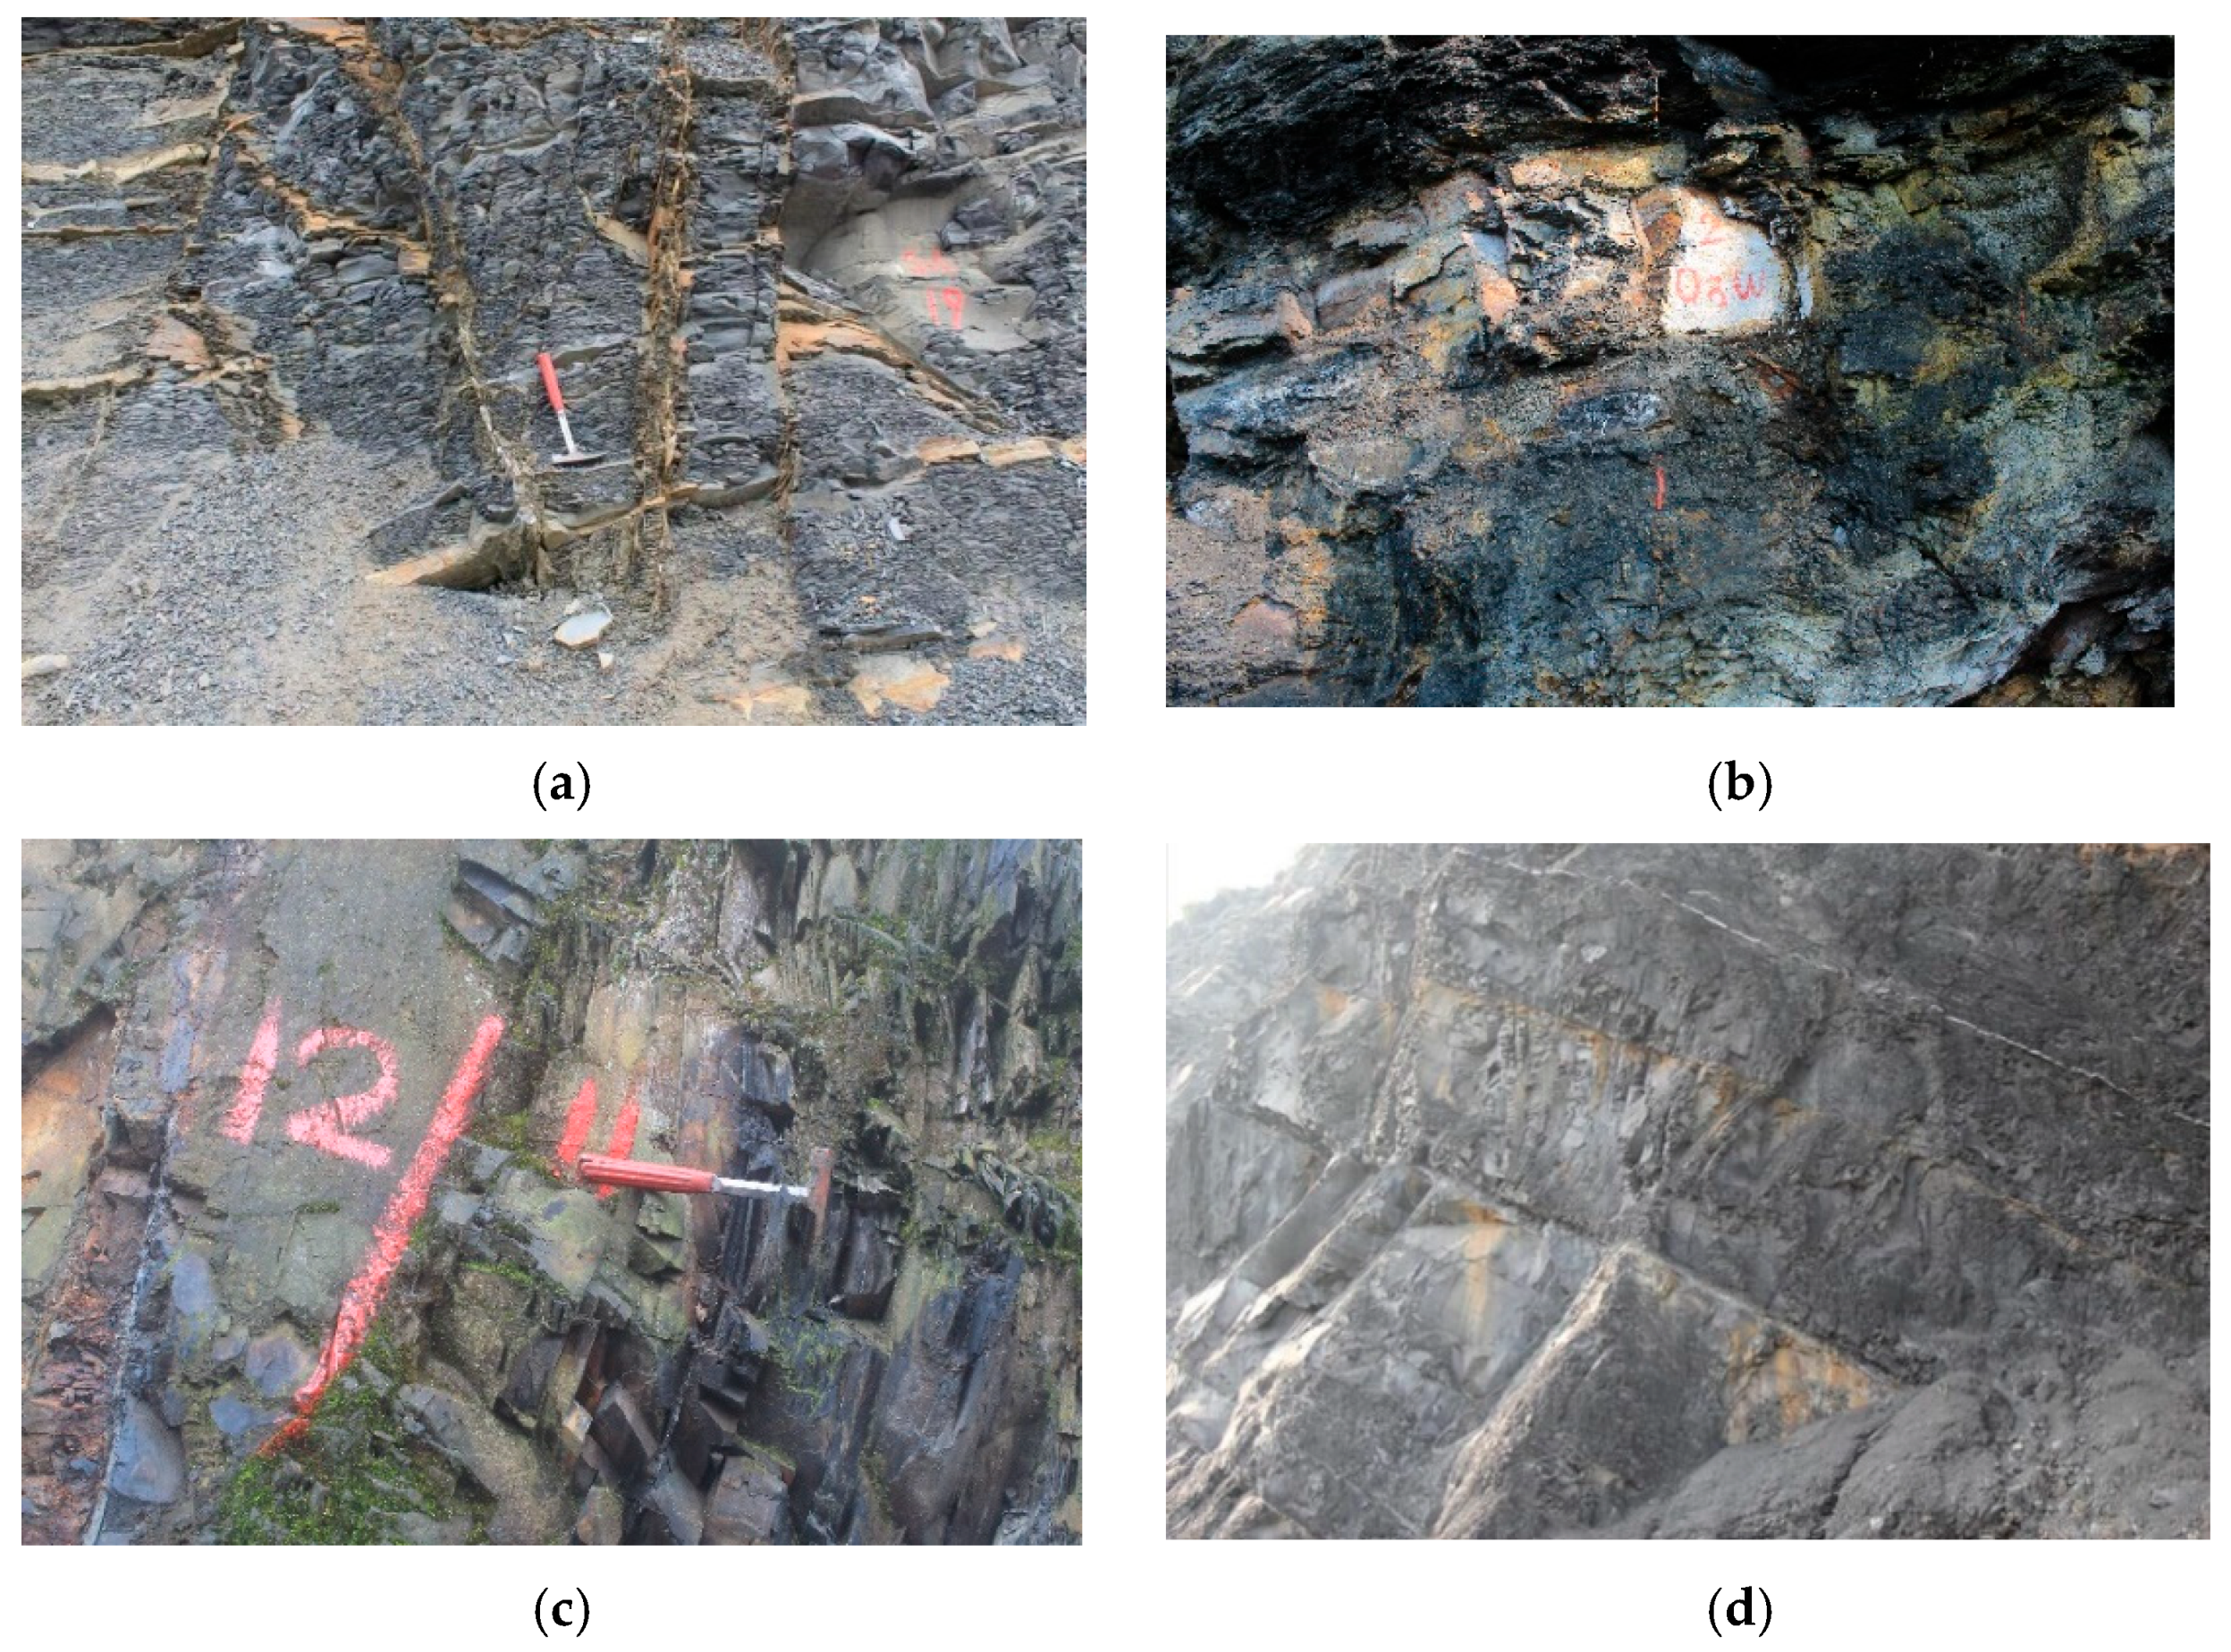
2.1. Characteristics of Macroscopic Fractures in Field Shale Outcrops

In order to study the characteristics of multi-scale natural fracture distribution in the shales of the Wufeng Formation (O3w)-Longmaxi Formation (S1l) in Sichuan, we carried out field outcrop profile investigations in four typical geological sections of the Longmaxi Formation-Wufeng Formation in the Sichuan Basin, namely, Xishui Qilongcun in Guizhou, Qijiang Yiziquan in Chongqing, Qijiang Guanyinqiao in Chongqing, and Changning Shuanghe in Changning.
The field outcrops of the four typical Longmaxi–Wufeng Formation shales were investigated (Figure 1), and it was found that fractures of different degrees were developed in the profiles, mainly divided into natural laminated fractures and high-angle fractures. The calcite-filled high-angle (the fracture direction is at a 90° angle to the shale laminae direction) natural fractures account for more of the tectonic fractures. For example, the fracture density of the Longmaxi section in Xishui is 3–7 fractures/m, and its high-angle and horizontal fractures account for the largest proportion. The fractures in the Xishui and Changning sections are dominated by high-angle diagonal intersection fractures, accounting for more than 60% of the total, followed by low-angle and horizontal fractures.

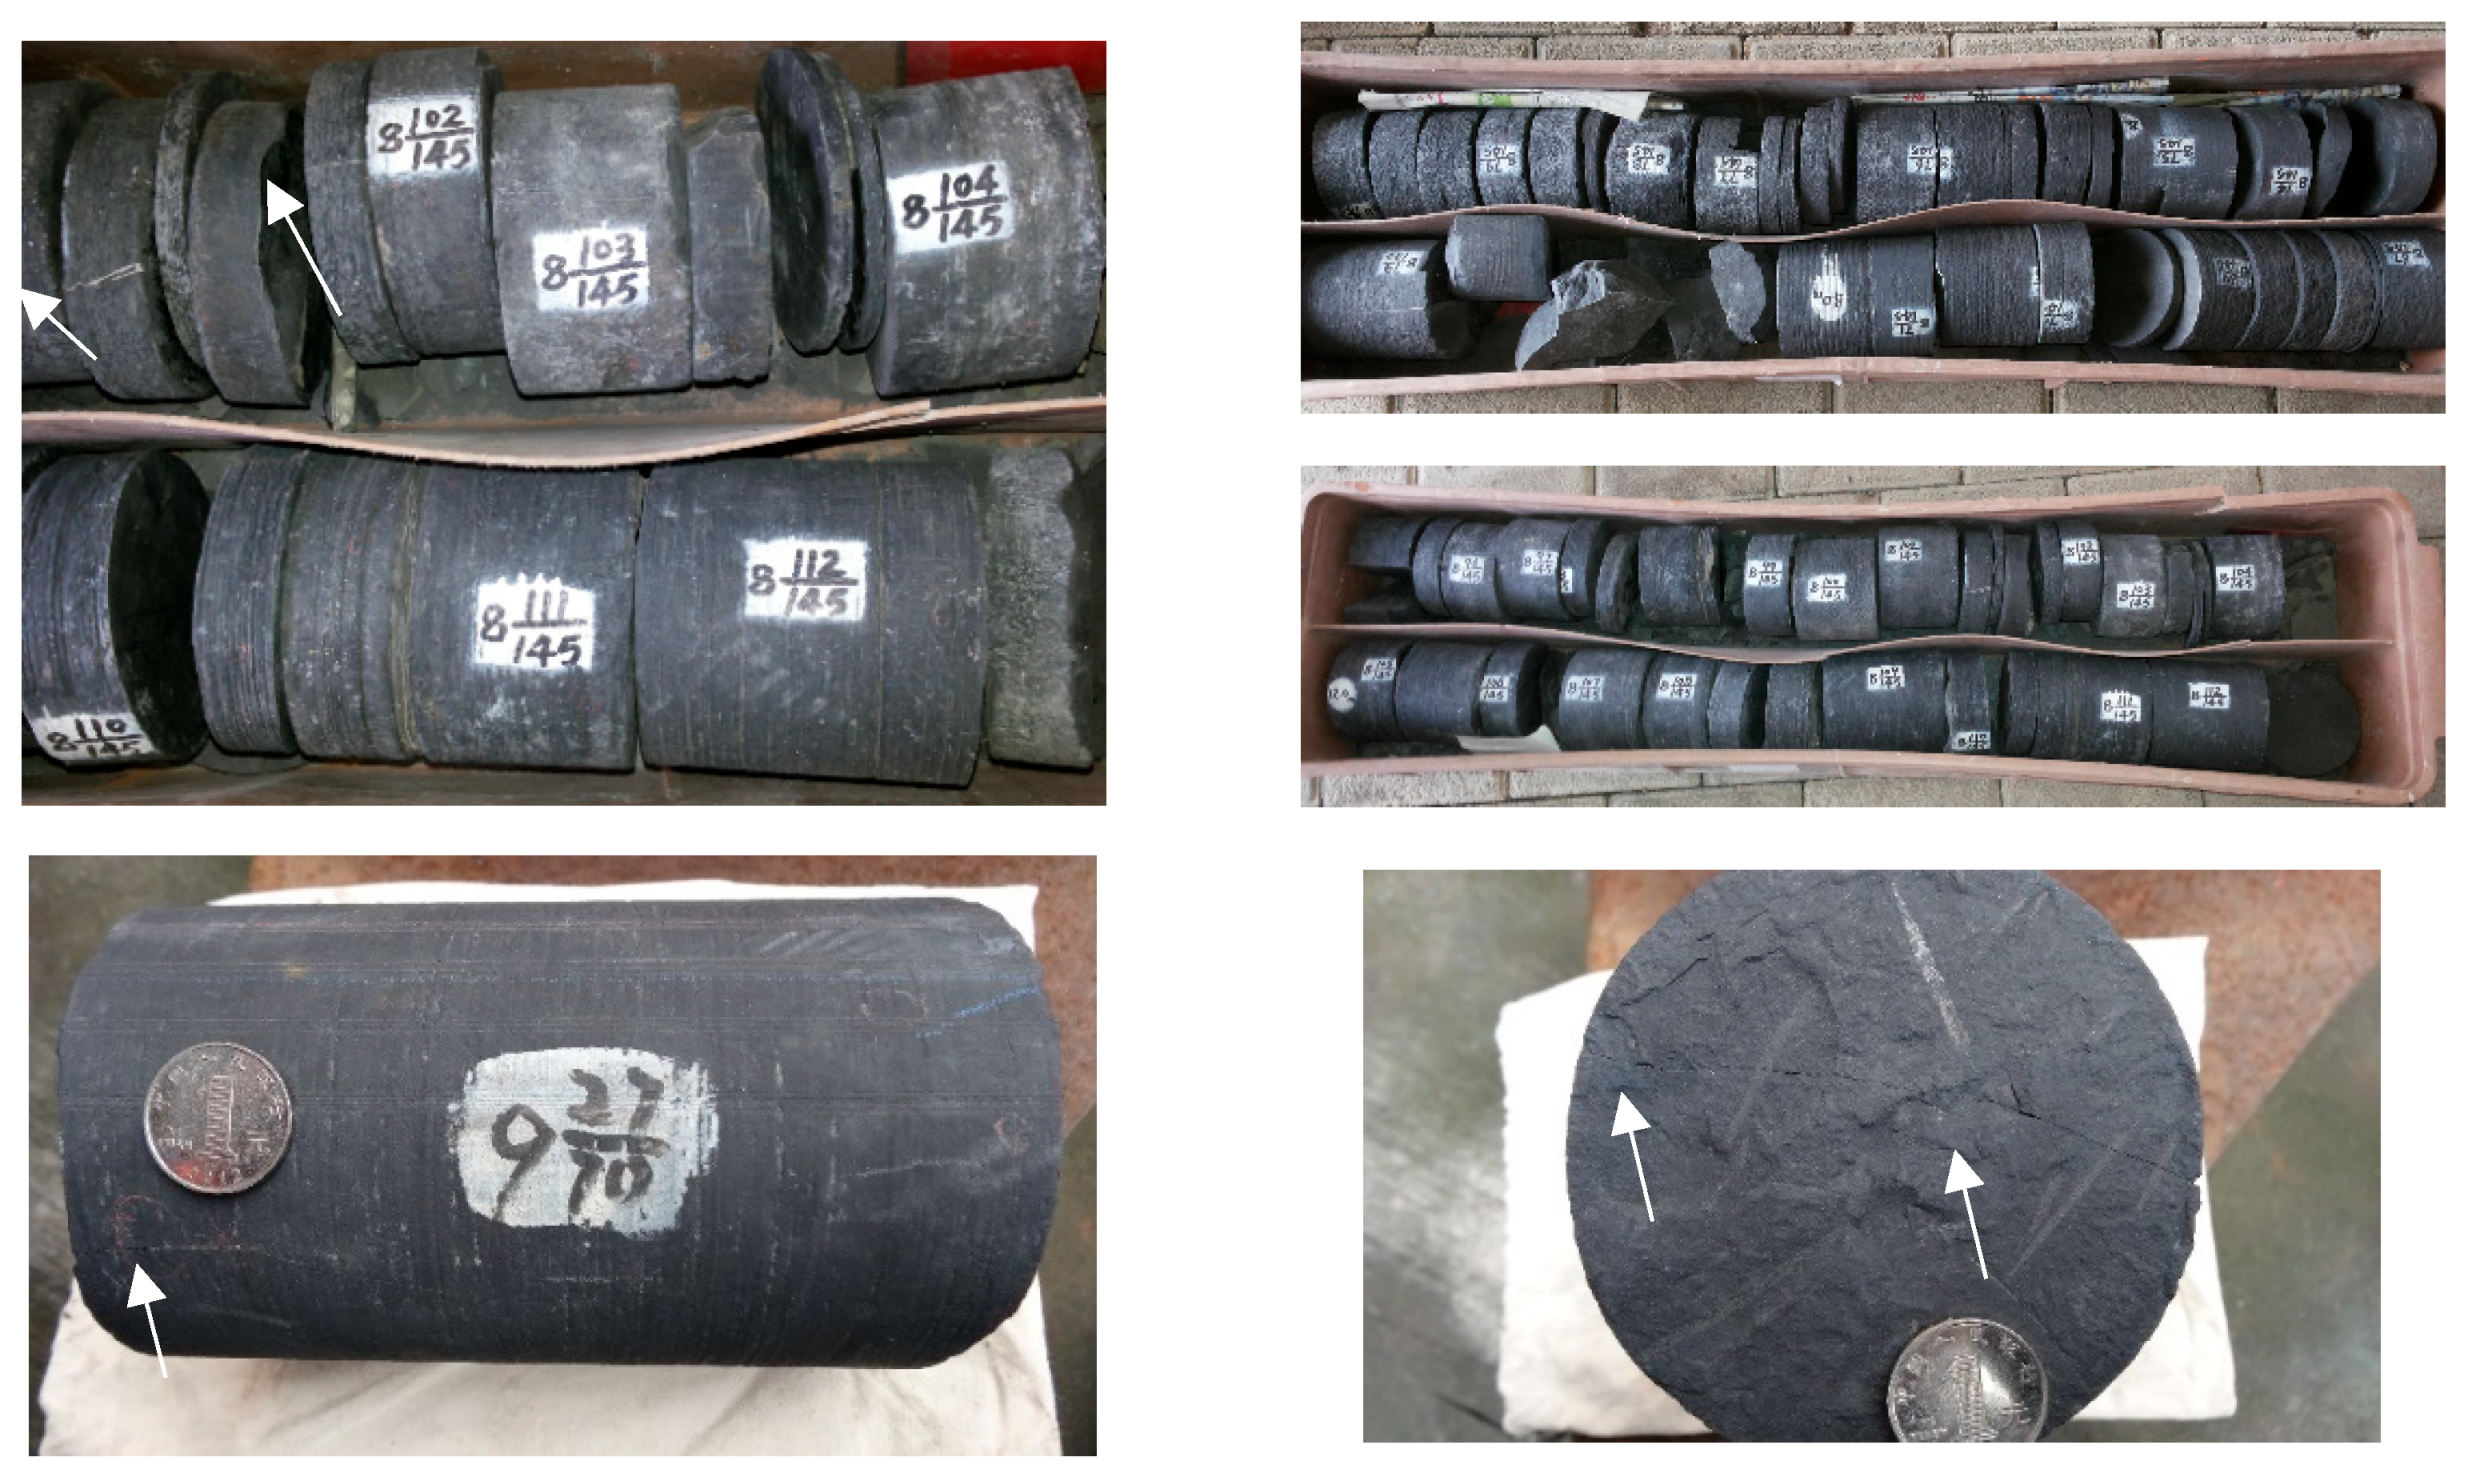
2.2. Fracture Characteristics of Downhole Shale Core

According to the core observation results of three shale gas wells in the east Sichuan area [39], in addition to the common laminated fractures that are relatively developed, the shale is also very well developed with tectonic fractures, which are 0.1–1 mm wide (Figure 2), and some of them are semi-filled or fully filled with calcite. The high-angle fractures in some wells are very developed, and the proportion of high-angle fractures with fracture dip angle greater than 45° is as high as 60%. The calcite-filled fractures of shale in this area account for more than 90% of the total number of fractures, while the rest are filled with pyrite and a small amount of mixed calcite–pyrite filling.
By evaluating the fracture distribution of the downhole cores in the Fuling area, it is found that: the full-size core laminae in this area are clear, while the natural laminae joints are more developed; there is more graptolite on the laminae, and more high-angle natural fractures are seen laterally; most of the calcite filled fractures are filled, and the degree of filling is mostly full, and a small amount are partially filled, as shown in Figure 2.

2.3. Downhole Imaging Logging Fracture Characteristics

The interpretation of imaging logs can be used to accurately evaluate the natural fracture characteristics of the reservoir in a shale gas deviated well in east Sichuan. More highly resistive fractures with continuous sinusoidal curves were found on the FMI log images, demonstrating that the fractures in more well sections are fully filled with high-resistivity minerals [39], as shown in Figure 3.
Therefore, high-angle natural fractures are mostly developed in the Longmaxi–Wufeng Formation shales in Sichuan, accounting for more than 60% of the total number of fractures. Additionally, filling fractures are mostly seen in high-angle fractures, and the degree of filling is mostly full filling, with calcite filling fractures accounting for more than 90% of the total number of fractures. In the actual study, the fracture model is focused on high-angle and low-angle natural fractures, and the complete filling of calcite in the fractures is more often considered.

3. Simulation of Shale CO2 Injection Considering Different Angles of Natural Fracture Filling

The main objectives of the simulations in this paper are: (a) to study the effect of different calcite filling fracture orientations on shale porosity at a constant pressure and different temperatures; (b) to study the effect of different calcite filling fracture orientations on shale porosity at a constant temperature and different pressures.

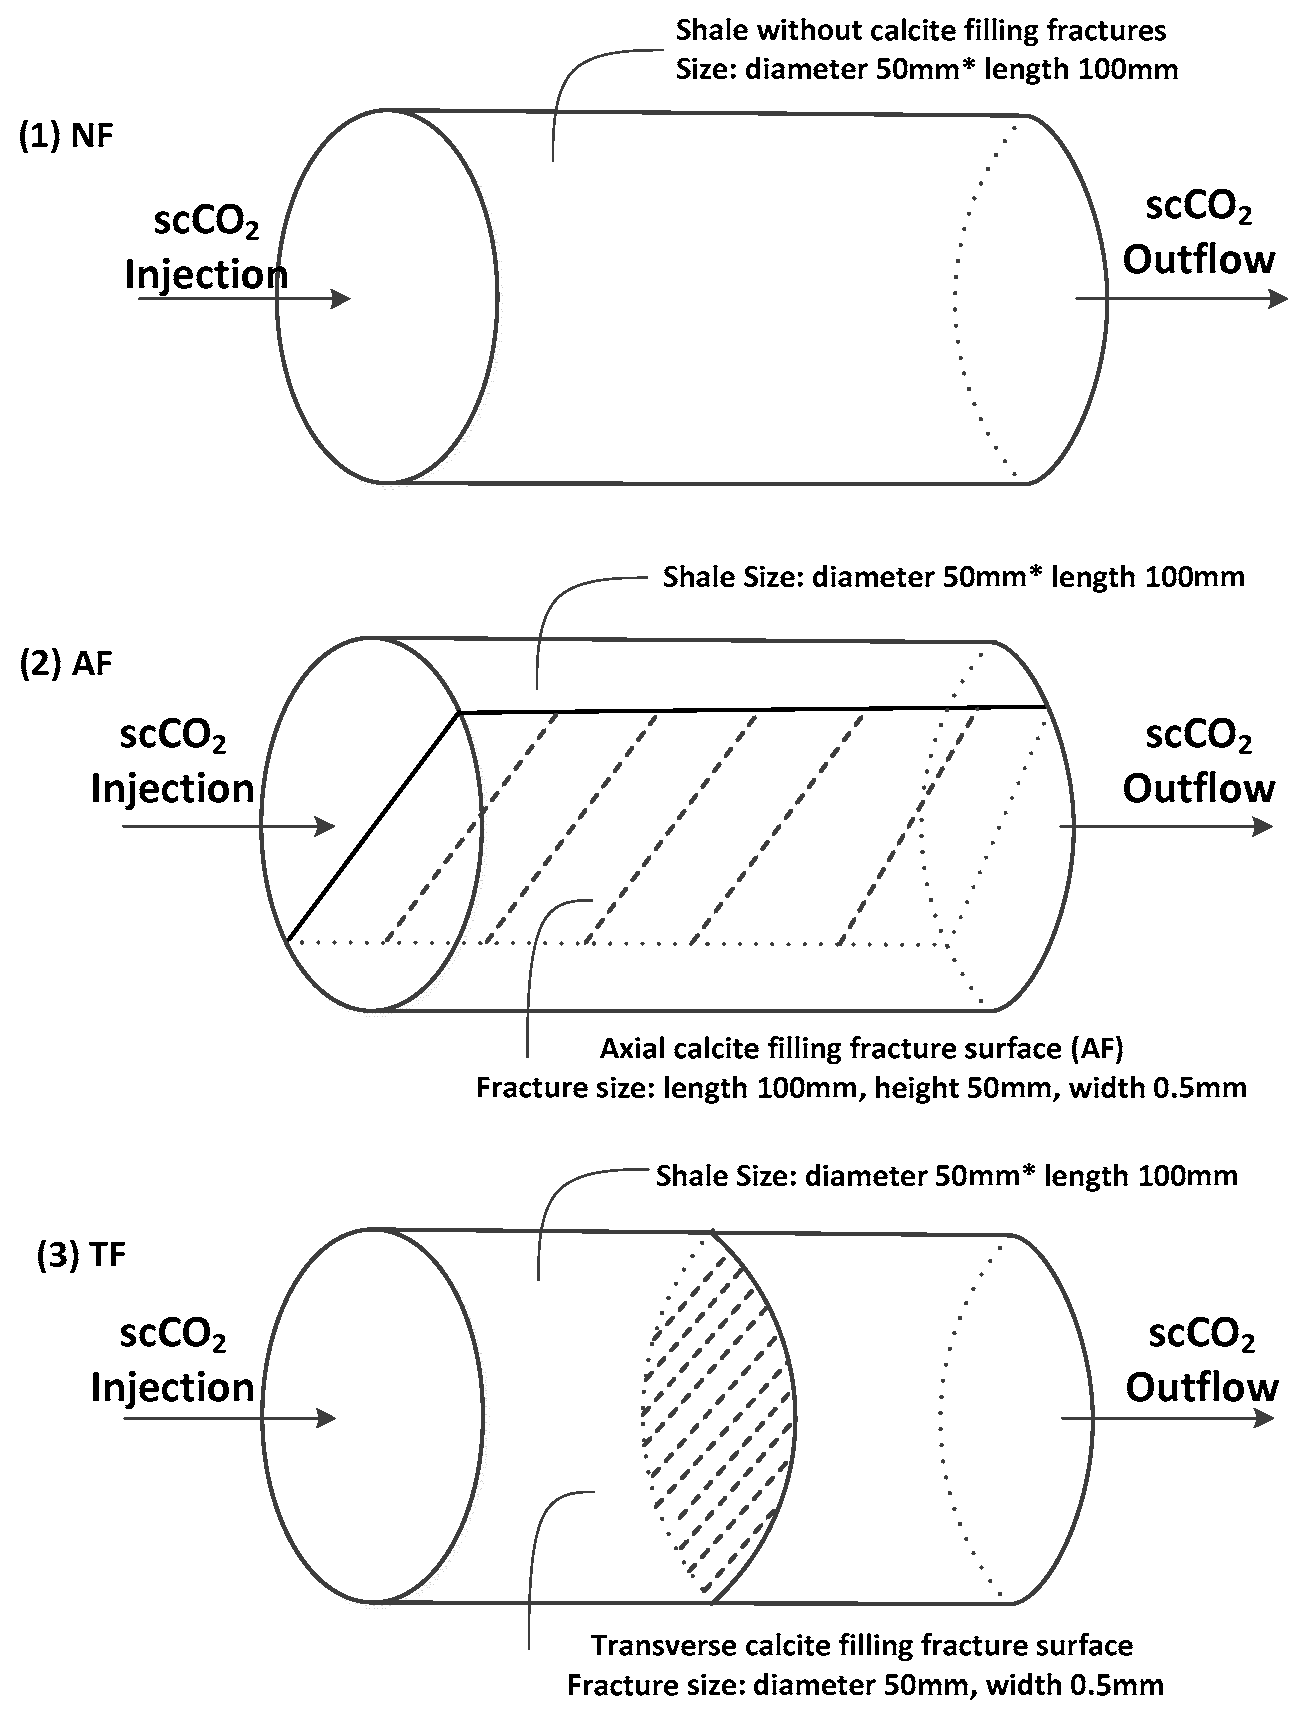
3.1. Experimental Conceptual Model

3.1.1. Geometric Model Setup

To simulate the experimental conditions, a conceptual model of a columnar shale core containing calcite-filled fractures with a core diameter of 50 mm and a height of 100 mm was established. Additionally, three kinds of simulation specimens were set up to combine three common natural fracture scenarios [37]: no fracture, named NF, axial natural fracture, named AF and transversal natural fracture, named TF. The calcite-filled fracture widths of the collected shale cores with calcite filled fractures were generally found to be between 0.4 and 0.7 mm; and according to the summary of relevant literature on natural fracture spreading characteristics, the calcite-filled fracture widths in the southern Sichuan and Fuling regions were more often distributed between 0.4 and 0.6 mm and the injection model and geometric parameters of the simulation specimens under the three conditions are shown in Figure 4.

3.1.2. Initial Parameters of the Simulation Specimen and Fracture Parameters Setting

Based on the relevant test results, the matrix porosity of the model is set to 5% and the initial permeability is 4.00 × 10⁻⁴ mD. Based on the law of the influence of natural fractures on the overall pore permeability parameters of the core column found in the base physical parameters test, the porosity of filled fractures is higher than that of the matrix, but there is no mature experimental method for pore permeability testing of filled fractures. Therefore, in this paper, based on the simulation research results related to the self-sealing of natural fracture faults in carbon sequestration engineering [12,13,40], the fracture porosity is set to 50% in this paper. In addition, it is assumed that there is no gap between the filled fracture and the matrix cementation surface of the core, and no gas flow will occur.
Based on the results of mineral fraction testing, it was found that the sum of calcite and dolomite, the mineral fractions of the shale cores in this group, accounted for about 50% of the total minerals, and the content of both was generally 15% to 30% of the overall perspective, so the calcite and dolomite content could be set at 25% each, and the remaining 50% of the other minerals did not react with scCO2. The highest percentage of calcite filled fractures was observed through the cores, and the mineral grains grew regularly and densely cemented, and they blistered violently when encountering dilute hydrochloric acid, which proved that the calcite purity was high.

3.1.3. Core Pore Fluid Geochemical Parameters Setting

According to nine wells including JY1, JY2HF, JY3HF, JY4HF, and JY11-4 in Jiaoshiba, Fuling, and Chongqing, the water content saturation of the underlying Longmaxi Formation in the Wufeng Formation Sublayer 1 ranges from 30% to 60%, with an average value of 41.7% [41]. In addition, the water content of the Silurian shale is 1.18% to 1.68% [42] and combined with the core porosity of 3% to 5% generally obtained from the tests in this paper, it can also be calculated that the water content saturation of shale in this area is between 30% and 50%. Therefore, the water content saturation can be approximated to be 40% in this paper. To simulate the formation conditions, pore water transport with CO2 is not considered during the scCO2 injection action.
Based on the analytical test of extracted water from a shale gas field in southwest China [43], the average values of the shale gas reservoir water geochemical parameters of two blocks were calculated and set as the ion distribution of the initial formation water solution in the model of this paper, as shown in Table 1.

3.2. Engineering Parameters Acquisition

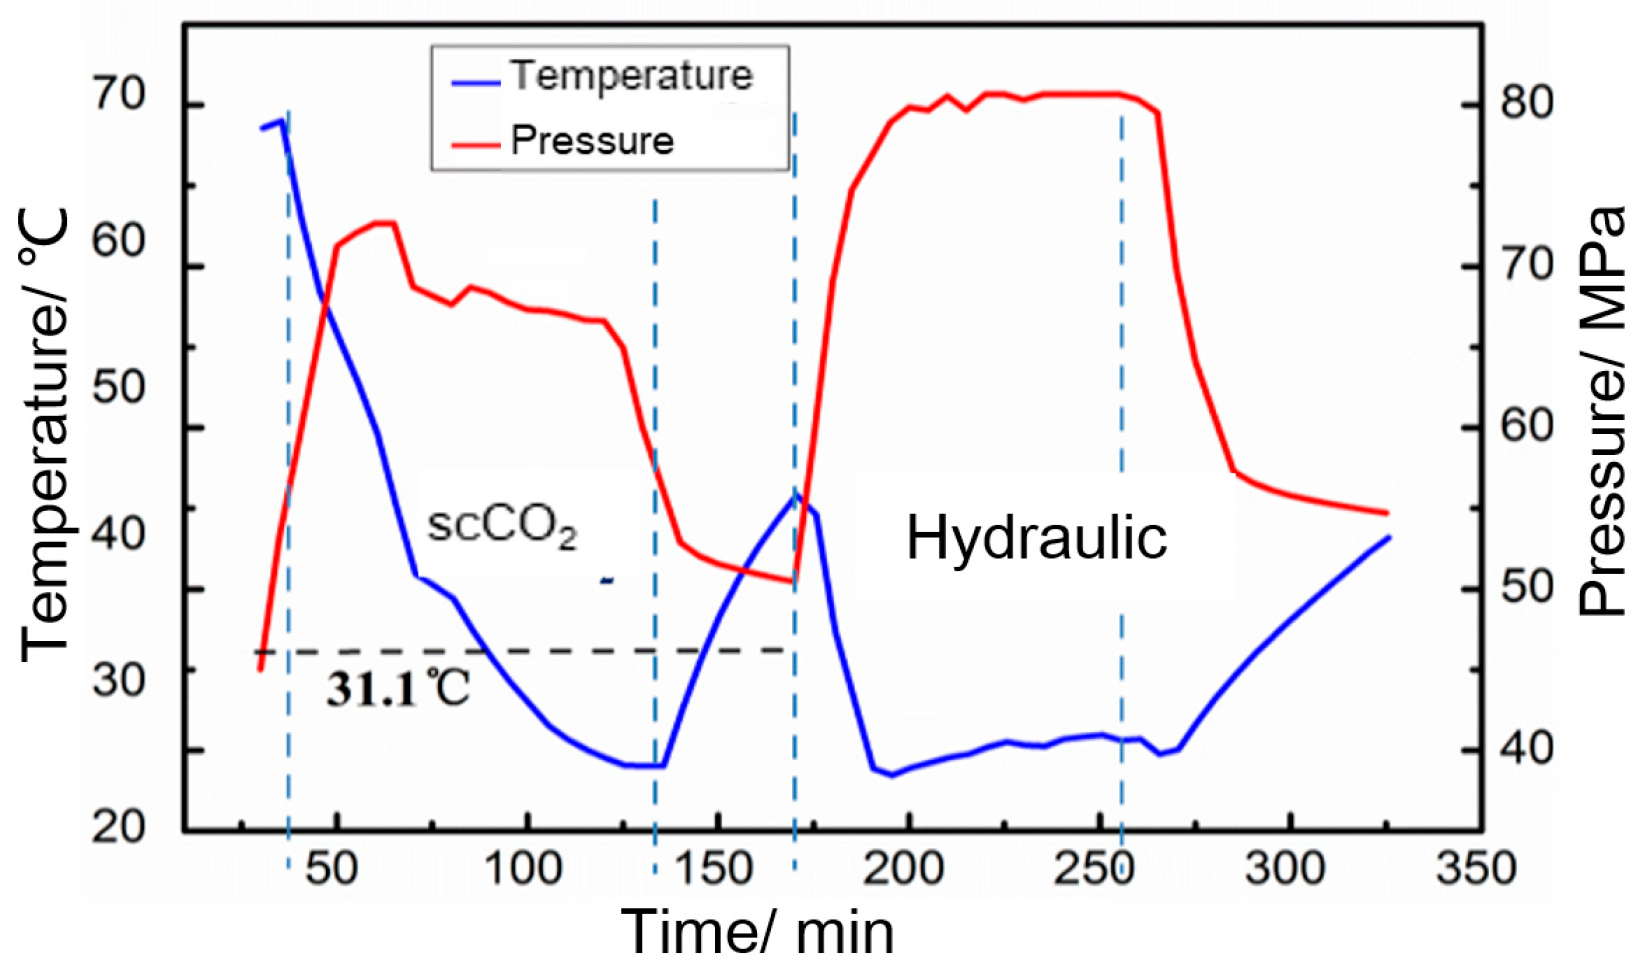
3.2.1. CO2 Fracturing Field Test to Obtain Bottomhole Temperature and Pressure

In June 2017, a successful field test of onshore shale gas scCO2 fracturing was conducted in Yan’an, Shaanxi, China [44]. The scCO2 fracturing can effectively improve the fracture complexity of shale gas reservoirs, which increases the fracture modification volume and formation energy, and increases the seepage volume, and significantly increases shale gas production.
This on-site scCO2 fracturing field test has two main stages: the front scCO2 energy-boosting fracturing stage and the hydraulic sand addition fracturing stage. Real-time downhole temperature and pressure variations throughout the fracturing were obtained through temperature and pressure monitoring devices installed at the bottom of the downhole tubing, as shown in Figure 5. In this paper, we focus on the temperature–pressure variation in the front CO2 enrichment phase (0~150 min in Figure 5).

3.2.2. Simulated Temperature Conditions Setting

From the temperature–pressure monitoring curve, it can be seen that the wellbore temperature decreases continuously during CO2 injection. Since the CO2 injected at the wellhead comes from the liquid low-temperature CO2 stored in the tanker, the low-temperature CO2 exchanges heat with the higher-temperature reservoir during the injection process, causing the temperature at the bottom of the well to decrease continuously. In this test, from the start of CO2 injection to the final stopping of the pump, the temperature at the bottom of the well decreases from 67 °C to 24 °C, and the CO2 is in a supercritical state for most of the injection phase. When the CO2 injection is stopped, the bottomhole temperature rose back to 42 °C quickly, due the heat exchange between the reservoir and the wellbore. During this period, the temperature and pressure of CO2 have reached the supercritical state for a short time.
The change in temperature has a significant effect on the phase change in scCO2, which also affects the chemical reaction with fractured shale. Therefore, this paper carries out numerical simulations at temperatures of 30, 40, 50, and 60 °C based on the actual temperature change interval of the project, focusing on the effect of pressure change on the reaction at 50 °C.

3.2.3. Simulated Pressure Conditions Setting

The initial pressure of the formation is about 30 MPa, which gradually increases to 72 MPa with the injection of scCO2, and then decreases to a stable injection stage where the pressure is basically maintained at about 50 MPa. Considering the initial pressure of the formation and the real partial pressure of the injected scCO2 fluid, it can be assumed that the net pressure of the supercritical fluid grows from 0 to 20 MPa. Therefore, the simulated injection pressures in this paper are set as follows: 5, 10, 15, 20 MPa, focusing on the effect of temperature change on the reaction at 20 MPa.

3.2.4. Simulation Calculation Time Setting

Based on the field construction tests, it is known that the time consumed for a single layer section of scCO2 fracturing single well involved in this paper is generally 3 to 6 h. Considering the low viscosity and easy diffusion of scCO2, and the fact that the formation temperature and pressure will return to the original value soon after the construction is completed, the action time of scCO2 and shale reservoir at the specified temperature and pressure is generally short. Therefore, in this paper, the simulation time is set to 6 h for injection.

3.3. Simulation Scheme Design

A total of 21 simulations were performed, with the control variables of different fracture conditions, temperature, and pressure, and the simulation experimental scheme is shown in Table 2. To facilitate single-factor control against temperature and pressure variations, one of the two variables was fixed according to typical engineering values to study the effect of the other variable on porosity. Seven groups of numerical simulation experiments under temperature and pressure were designed, with three samples in each group, namely NF shale, AF shale, and TF shale.

3.4. Chemical Kinetic Simulation Software and Solution Methods

3.4.1. TOUGHREACT Software and Solution Process

In this paper, the study is carried out using the multiphase, reactive solute transport numerical simulation software TOUGHREACT. The software was developed by Lawrence Berkeley National Laboratory, USA, and its first version was released in August 2004 at the Energy Sciences and Technology Software Center (ESTSC) of the U.S. Department of Energy, where it is one of the most utilized software. The software has been successfully applied to a wide range of geological and environmental engineering studies, such as geological sequestration [45,46], geological disposal of nuclear waste [47], and groundwater quality assessment [12], and is gradually being introduced into petroleum development-related studies [48]. However, there are few studies that have introduced the software into the efficient development of scCO2-enhanced shale gas.

3.4.2. Software Algorithm Implementation

TOUGHREACT can better consider physical and chemical homogeneous and inhomogeneous cases in 1D, 2D and 3D media. The software uses the integral finite difference method in the spatial dissection of the model. The fluid transport equation, the heat conduction equation and the derived mass transfer equation for chemical substances can be solved by the Integral Finite Differences (IFD) method [49].
The software uses the sequential iterative method in solving the fluid flow, solute transport and geochemical reaction equations. After the flow equations are solved, fluid velocity and phase saturation changes are used to calculate the water phase transport and track the total gas concentration. For chemical component transport, the convection and diffusion of various solutes are solved component by component, and the concentrations are obtained by solving the mass conservation equation and then substituted into the chemical reaction model for calculation. The Newton–Raphson iterative method is used to solve the system of equilibrium-kinetic chemical reaction equations of the mixed system on a grid basis one by one.

3.4.3. Software Solution Process

The process mainly consists of solving the coupled non-isothermal multiphase fluid flow, solution flow mass transfer and geochemical reactions. The main solution flow is shown as follows.
  • Multi-phase fluid flow
After entering the time step, the flow and heat transfer equations are first solved to obtain different grid temperatures and pressures; the mass and fluid flow rate of each component are solved based on the calculation results.
  • Solution flow mass transfer
The solved temperature and pressure field parameters are combined to obtain the mass transfer results for each component of the dissolved and gaseous phases in water; based on the temperature and pressure obtained from the previous calculations, the defined chemical reaction sub-model calculations are invoked on each grid one by one.
  • Chemical reaction invocation
If the chemical reaction calculation results converge, this proves that there is no obvious phase change, and the next step of chemical and physical parameter assignment is updated, followed by the next time step cycle operation.
  • Dissolution discrimination and iterative calculation
If the chemical reaction calculation results do not converge, this proves that there is a dissolution, precipitation and other obvious phase changes. Then, in the cycle back, solid phase or gas phase substances are introduced for mass transfer, the dissolved phase in the water and gas phases of each component mass transfer results are re-solved, calculations can continue until the chemical reaction convergence, then all the time steps of the calculation are completed.
In the actual calculation process, the geometric parameters are first entered in the input file of the software according to the geometric model of this paper. Then, in the input file of geochemical parameters, we define the chemical ion species and their initial contents in the initial pore fluid and set the relevant chemical reactions and their secondary products according to the requirements of this paper. The various physicochemical parameters of scCO2 are queried and written into the injection fluid file according to different temperature and pressure conditions. The total injection time is set, and the time step and other parameters are calculated. The software is imported and is started to run, and finally the porosity values corresponding to different times are obtained after the result file is obtained.

4. Study of Porosity of Fractured Shale under CO2 Conditions with Temperature and Pressure

A total of 12 simulations in four groups at constant pressure and different temperatures were completed according to the simulation scheme, and the variation in porosity with temperature and pressure parameters was obtained. A total of 12 simulations (including the same three groups of experiments in different temperature simulations) in four groups at constant temperature and different pressures were completed according to the simulation scheme, and the laws of porosity variation with temperature parameters were obtained.

4.1. Variation in Porosity with Temperature for Simulation Specimens with Different Natural Fracture Patterns

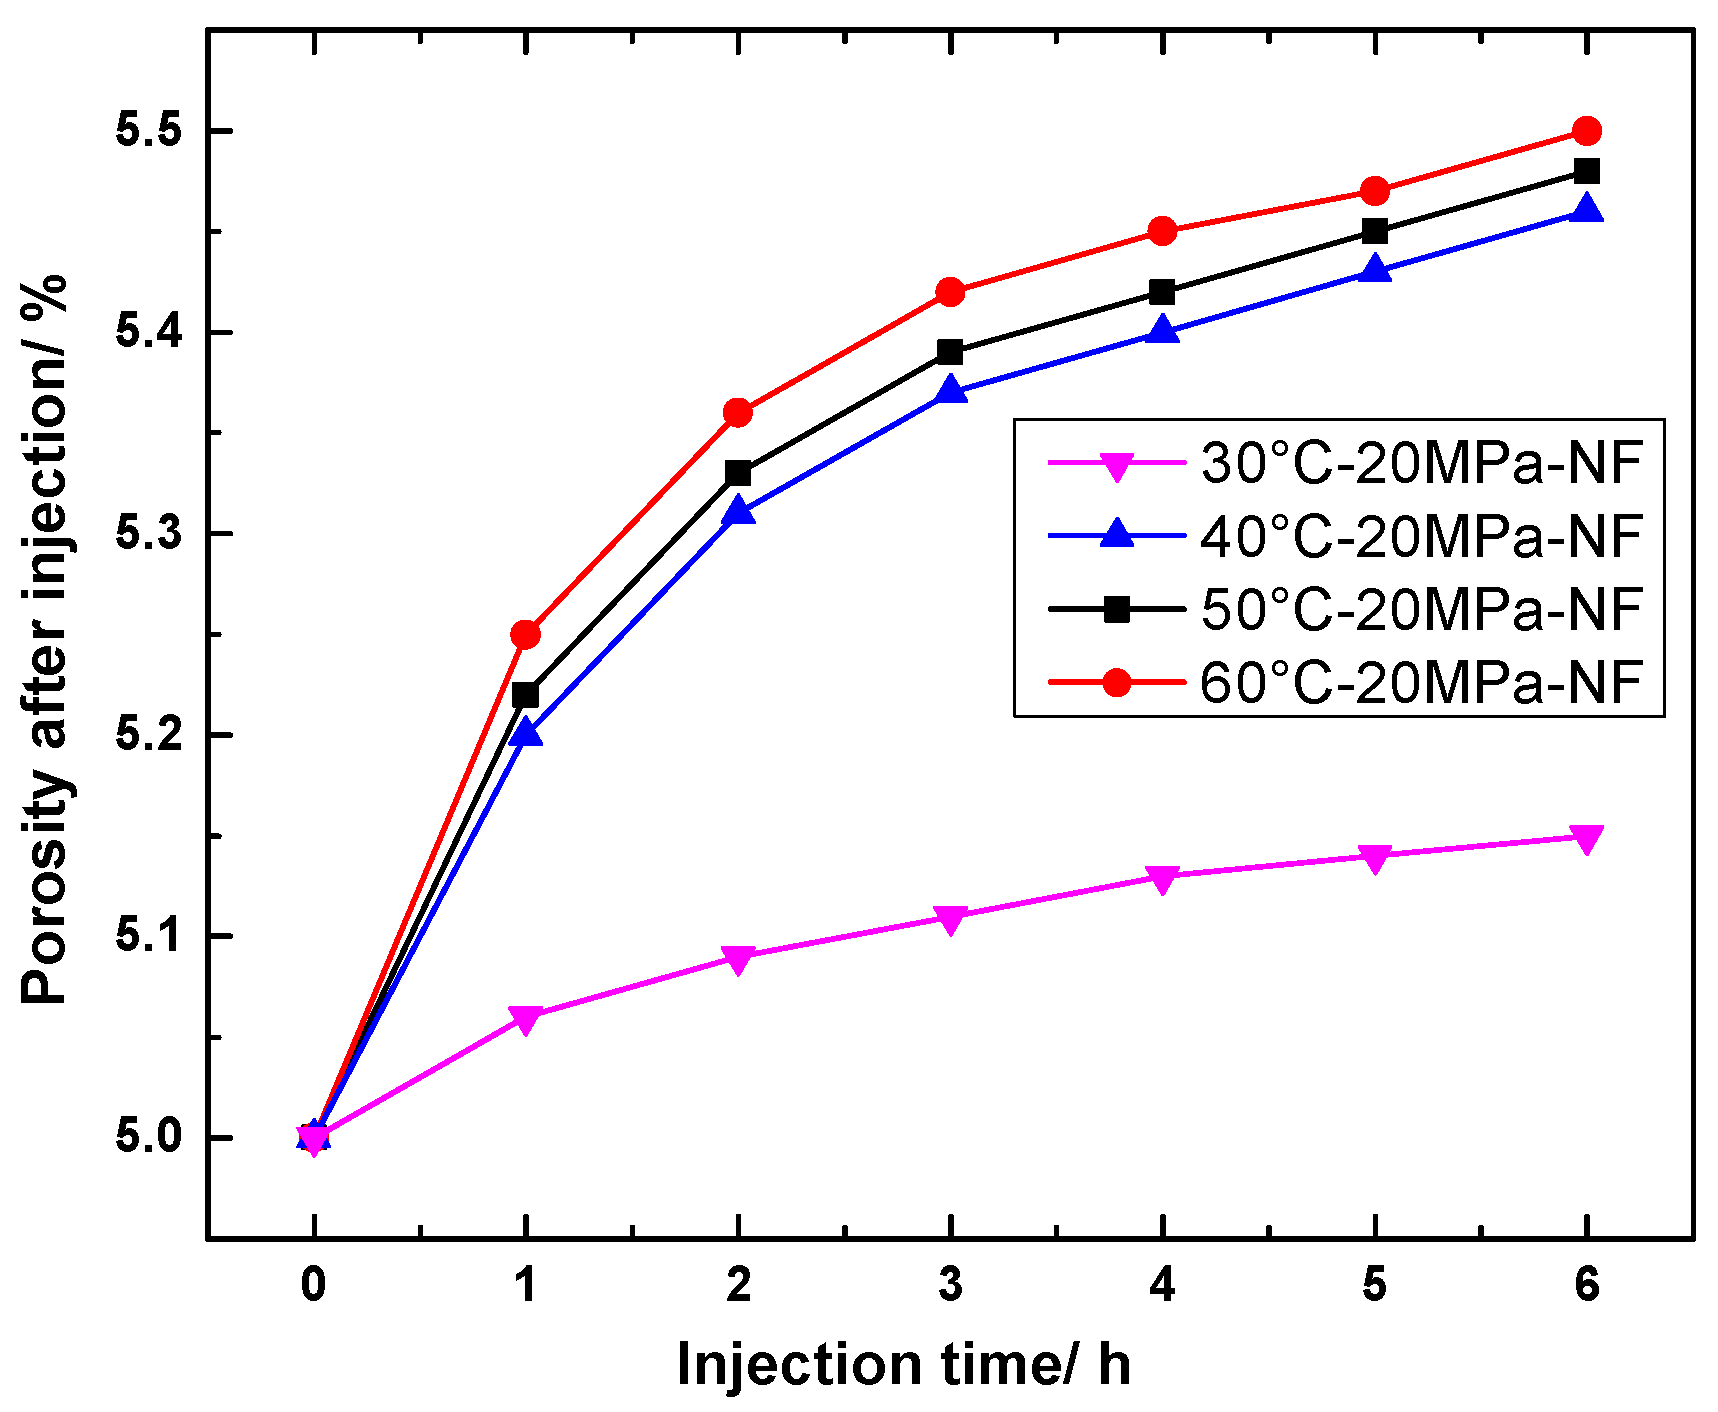
4.1.1. Change in Porosity of NF Specimens

As shown in Figure 6, the initial permeability of the specimens was the same, but with the injection of CO2, the porosity of shale gradually increased in all groups. However, the porosity growth rate of the four specimens changed significantly when the temperature was different. At the beginning of the reaction, the chemical reaction rate is higher, so there is a sharp variation in porosity; at the later step, the concentration of products around the fracture is higher, the chemical changes in carbon dioxide and rock minerals have tended to react completely, so the porosity grows more and more slowly. The porosity growth in the scCO2 group was faster when the temperature was 40 °C, 50 °C, and 60 °C. The porosity increased from the initial 5% to about 5.2% in the first 1 h, but then the growth became slower and faster at higher temperatures. This is caused by the positive temperature dependence of the chemical reaction rate of calcite and dolomite in the scCO2 dissolved shale matrix [30,31].
When the temperature was 30 °C, the porosity growth was significantly slower, and the final porosity was about 5.15% after 6 h of simulation time. Since it is below the supercritical temperature (31 °C), CO2 is not in the supercritical state at this time, and near the supercritical point, changes in temperature and pressure will cause sudden changes in physical properties, and density and viscosity changes are very obvious, and the density and viscosity of CO2 at this time are significantly greater than that of supercritical CO2, which impedes the flow and slows down the mass transfer rate in the solution, resulting in the final chemical reaction rate. The final chemical reaction rate is significantly reduced.

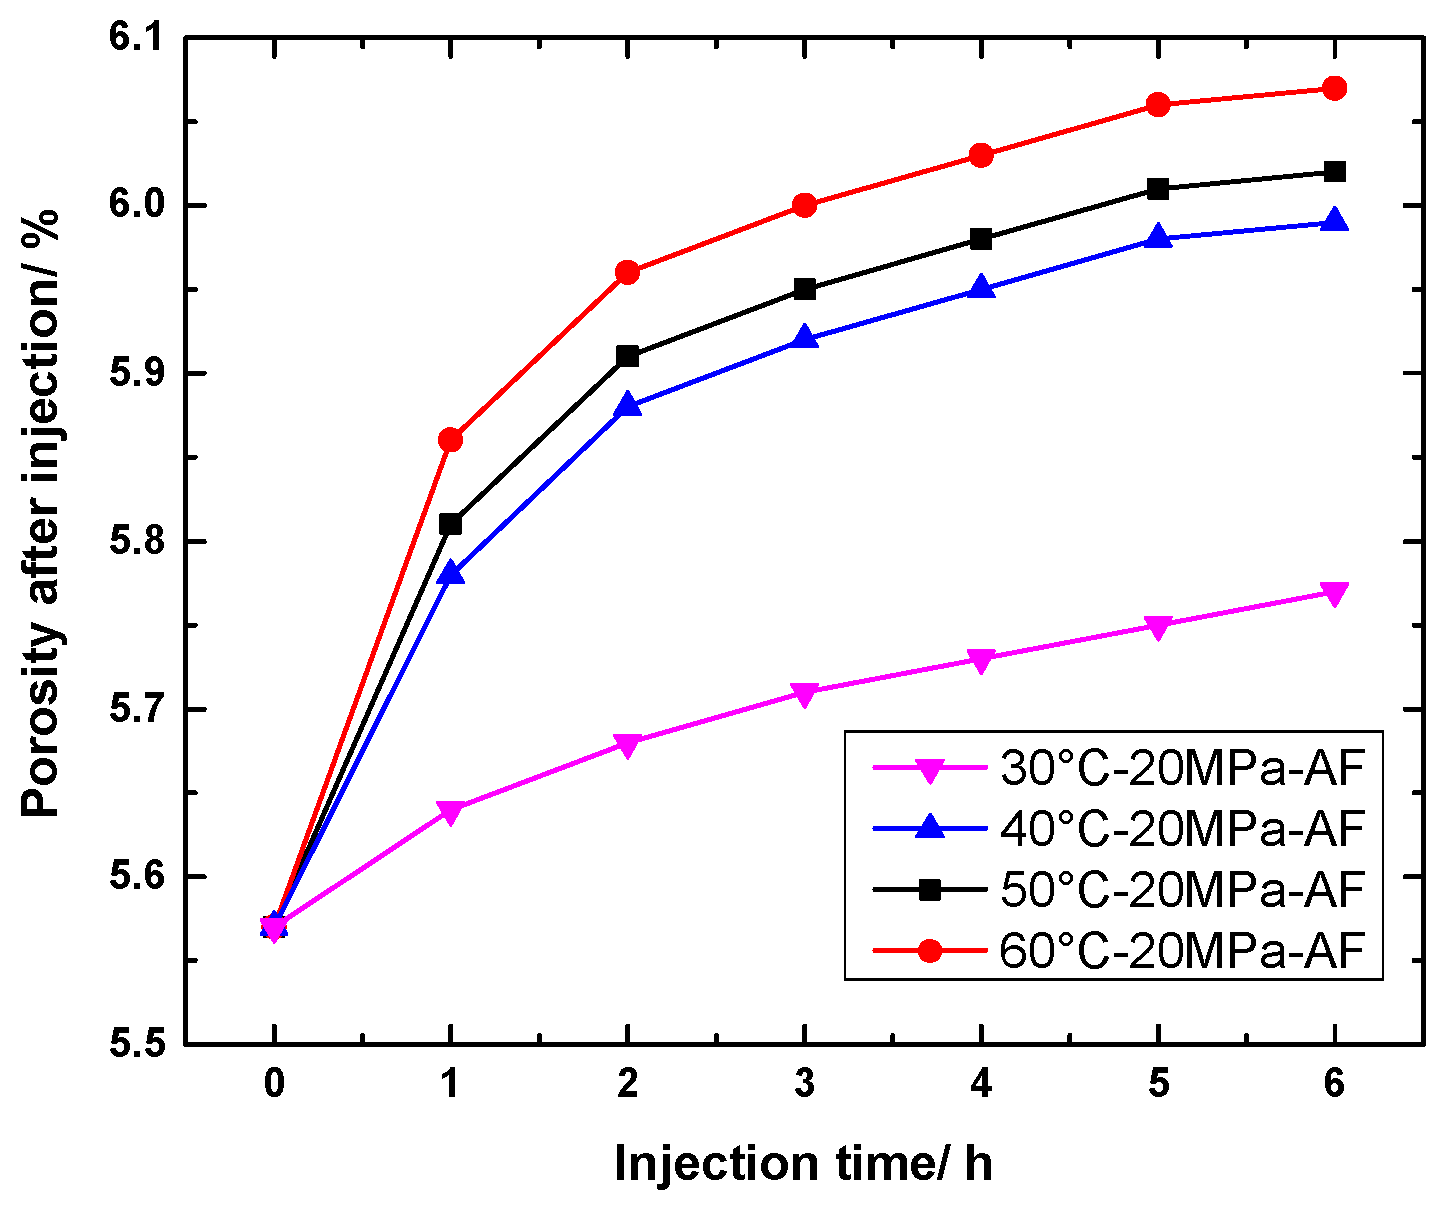
4.1.2. Change in Porosity of AF Specimen

As shown in Figure 7, the initial permeability of the specimen is high at this time due to the existence of AF fractures. With the injection of scCO2, the trend of increasing porosity of the shale at different temperatures is not different from that of the NF specimen group as a whole. However, the porosity increased rapidly during the initial injection, from about 5.55% to nearly 5.8% during the initial 1 h of treatment; but the increase rate gradually slowed down afterwards. Because of the higher porosity of calcite-filled fractures, scCO2 percolated along the fractures as the dominant channel; and the higher calcite content in the fractures was more easily dissolved by scCO2, which intensified the formation of the dominant percolation channel and led to more fluid accumulation in the fractures, reducing the contact area between scCO2 and shale, resulting in a slower reaction rate.

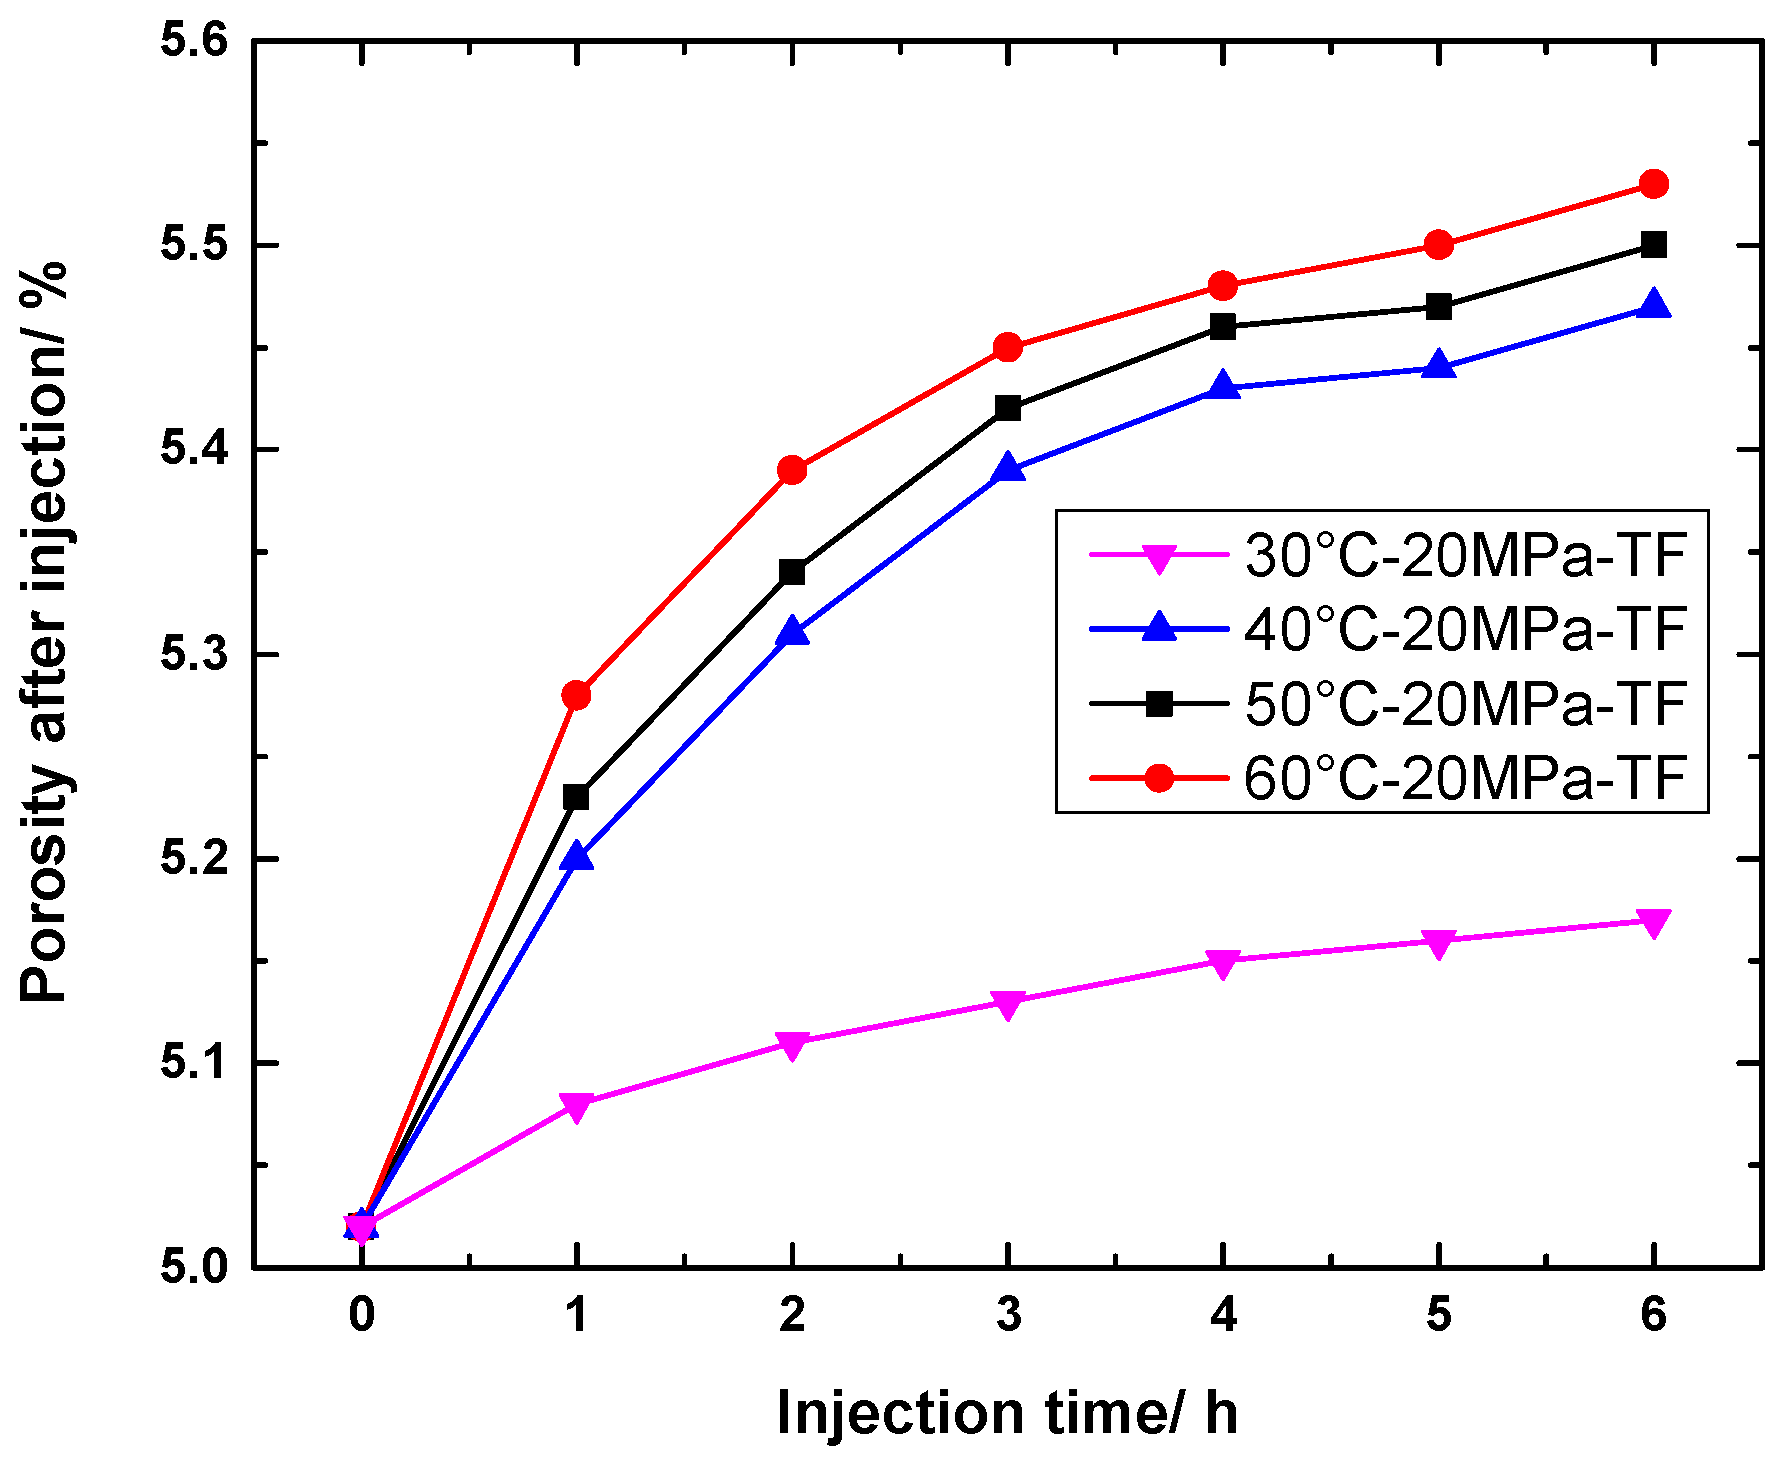
4.1.3. Change in Porosity of TF Specimens

As shown in Figure 8, the overall variation trend of TF specimens is not different from that of NF specimens, and the porosity of each group is slightly higher than that of specimens without natural fractures due to the presence of natural fractures, and is significantly lower than that of AF specimens. Because the transverse fracture surface is perpendicular to the injection direction, the calcite within the fracture surface reacts with scCO2 at a more stable rate in the specimen cross-section. Additionally, because the overall area of TF is small, the effect on the initial porosity is also small (5% without fracture porosity and about 5.02% with transverse fracture), and the amount of additional calcite for scCO2 reaction is not large, so the overall trend of change is not altered. Therefore, in scCO2 fracturing construction, the effect of TF on its chemical reaction can be basically ignored, and it can be regarded as an ordinary shale matrix.

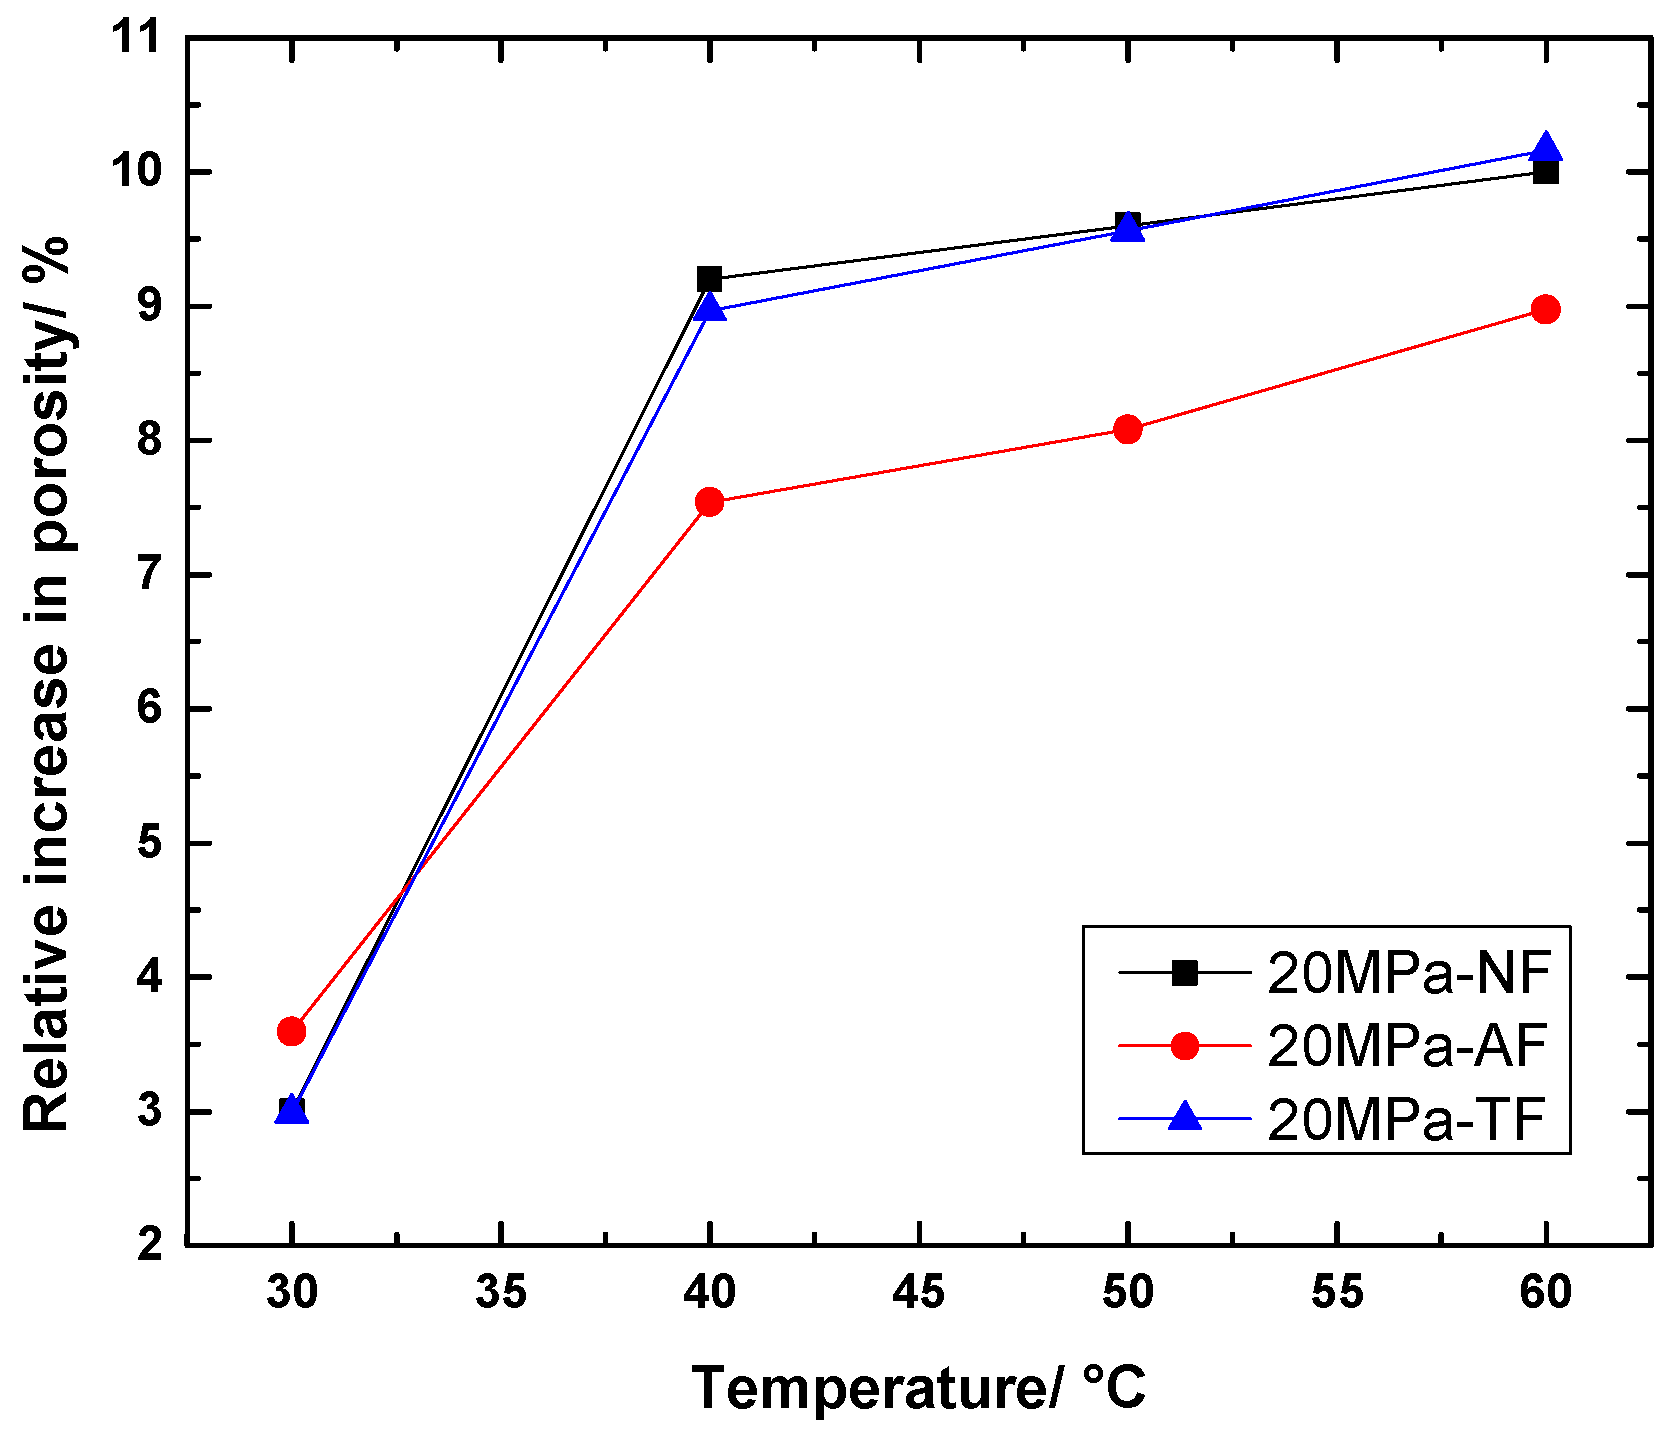
4.1.4. Change in Relative Porosity Growth with Temperature

In order to better compare with each other and summarize the chemical reaction rate change law with temperature for the three fracture cases, the absolute increase in the post-reaction porosity over the initial porosity value was defined as the final porosity relative increase, considering the different magnitudes of the initial porosity. The relative growth of final porosity integrally reflects the average chemical reaction rate and the final reaction dissolution of scCO2 with different fracture morphology specimens under different temperatures and pressures.
R = ϕ t ϕ 0 ϕ 0
where R is the relative increase in final porosity; ϕ t is porosity of the specimen after reaction time t; ϕ 0 is initial porosity of the specimen before reaction.
The relationship between the relative growth of the final porosity for the same pressure with different temperatures and fracture cases for this group of experiments is shown in Figure 9. It is found that the overall degree of reaction is in an increasing state as the temperature increases. At the temperature of 30 °C, the porosity of all three sets of cores increased slightly due to the low degree of reaction below the temperature of the supercritical state. Additionally, after reaching the supercritical state, the relative increase in porosity of the rocks is 2.5 to 3 times that of the relative increase in the subcritical state group.
From the comparison of different fracture types, it is obvious that: the difference between TF and NF specimens is small; however, AF specimens have higher reaction rate and reaction volume than the other two groups at 30 °C. This is related to the pooling effect of calcite-filled fractures and more calcite being slowly dissolved by (subcritical state) CO2. In contrast, when the temperature exceeds the supercritical state (above 40 °C in the figure), the degree of reaction between scCO2 and shale increases significantly, and the dominant channel formed after the axial calcite-filled fractures are finished being dissolved by scCO2 allows more gas to scramble, which reduces the contact area between scCO2 and shale overall, resulting in a lower absolute increase in final porosity than the other two groups.

4.2. Variation in Porosity with Pressure for Specimens with Different Natural Fracture Patterns

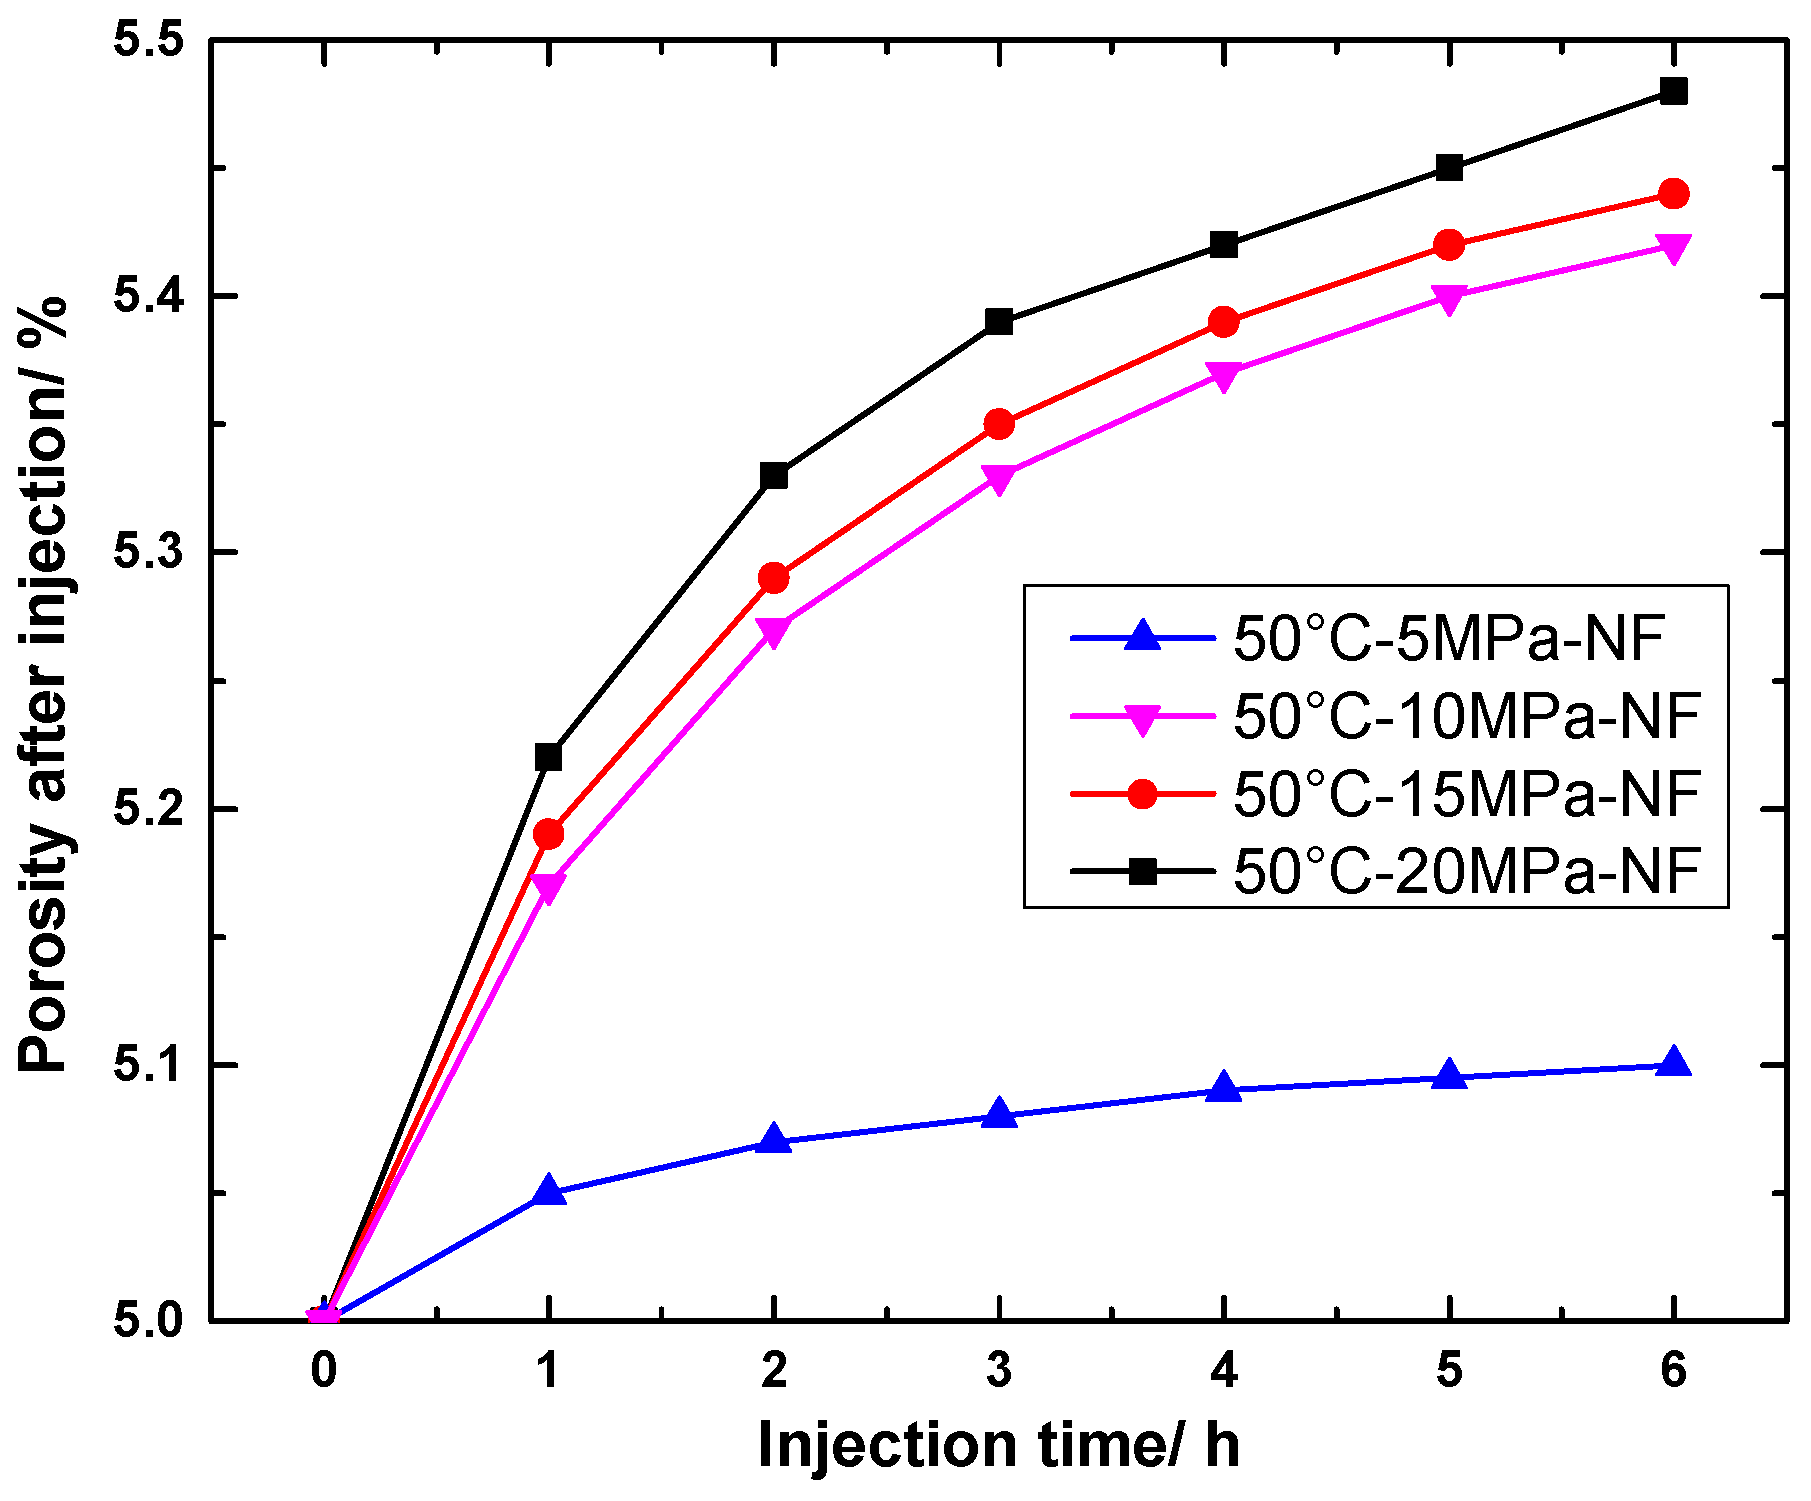
4.2.1. Change in Porosity of NF Specimens

As shown in Figure 10, the overall trend shows that the porosity gradually increases with increasing injection time. This is similar to the trend and basic mechanism of constant pressure and changing temperature in the previous section: when the temperature pressure of CO2 did not reach the supercritical state (critical pressure 7.3 MPa), it contributed little to the increase in porosity of shale, and the curve grew more and more slowly and flattened in the later stage of injection, and finally the porosity increased only from 5% to 5.08% after 6 h of injection. Meanwhile, in the other groups, the reaction between scCO2 and the porosity of the 20 MPa group increased the most obviously, from 5% to about 5.5% finally after 6 h of injection, because the reaction degree of scCO2 and shale increased with the increase in pressure.

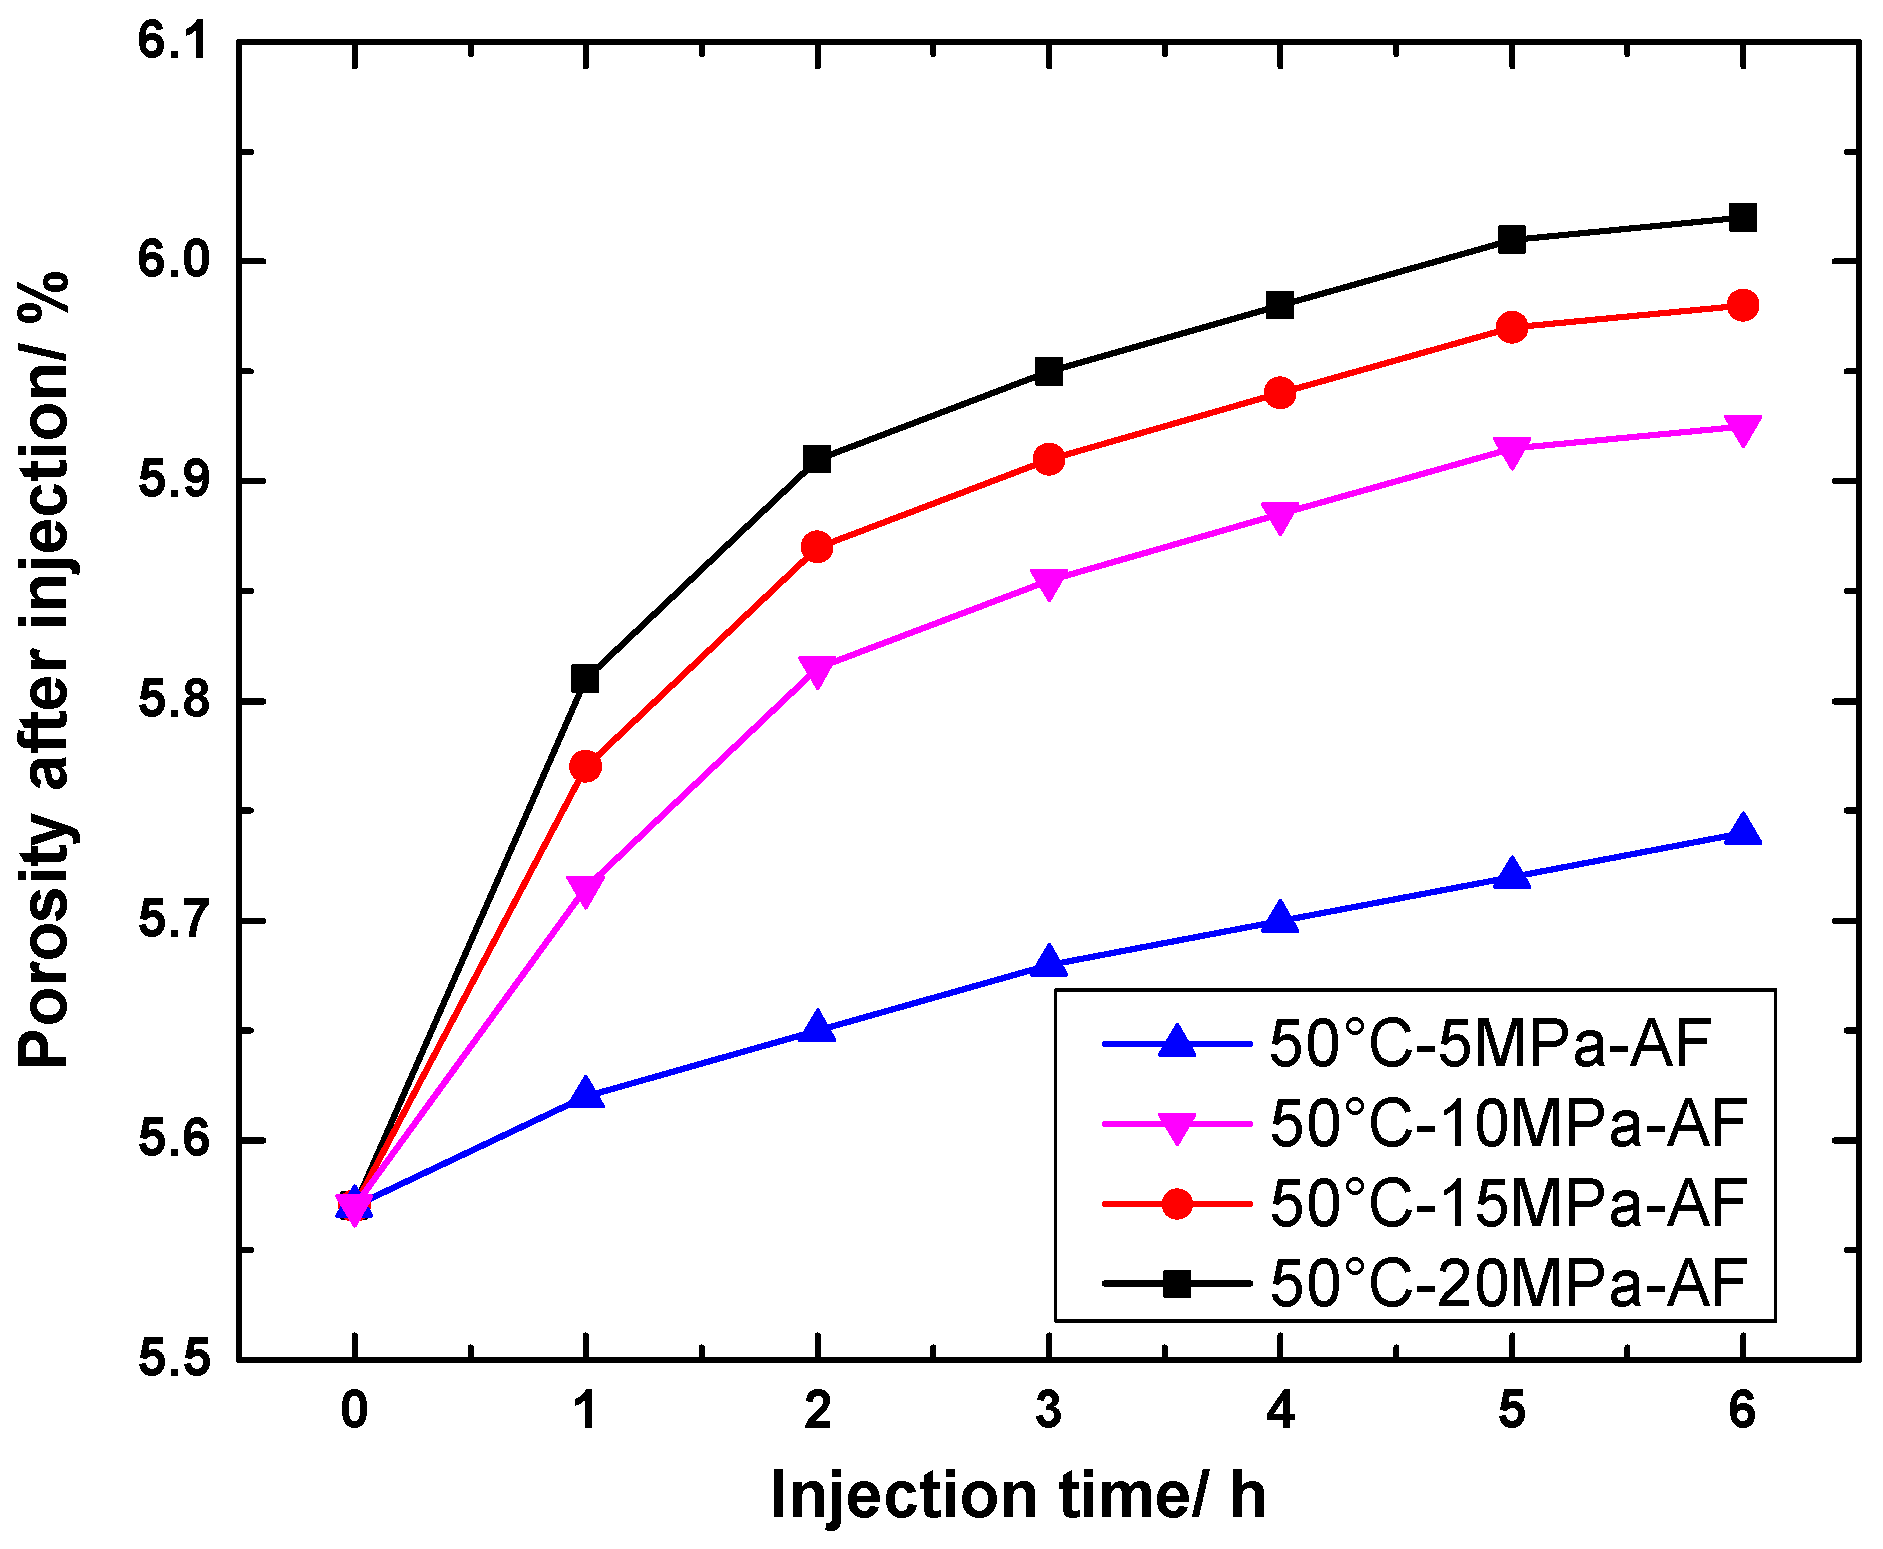
4.2.2. Change in Porosity of AF Specimens

As shown in Figure 11, the overall porosity variation law with time is consistent with that of the group without fractures. However, the porosity of this group grows more under the pressure of 5 MPa than that of the fracture-free group, and it grows steadily and slowly in a straight line at the later stage of injection. This shows that the AF containing calcite means that the (subcritical) CO2 can show some improvement on the overall permeability at a lower pressure.

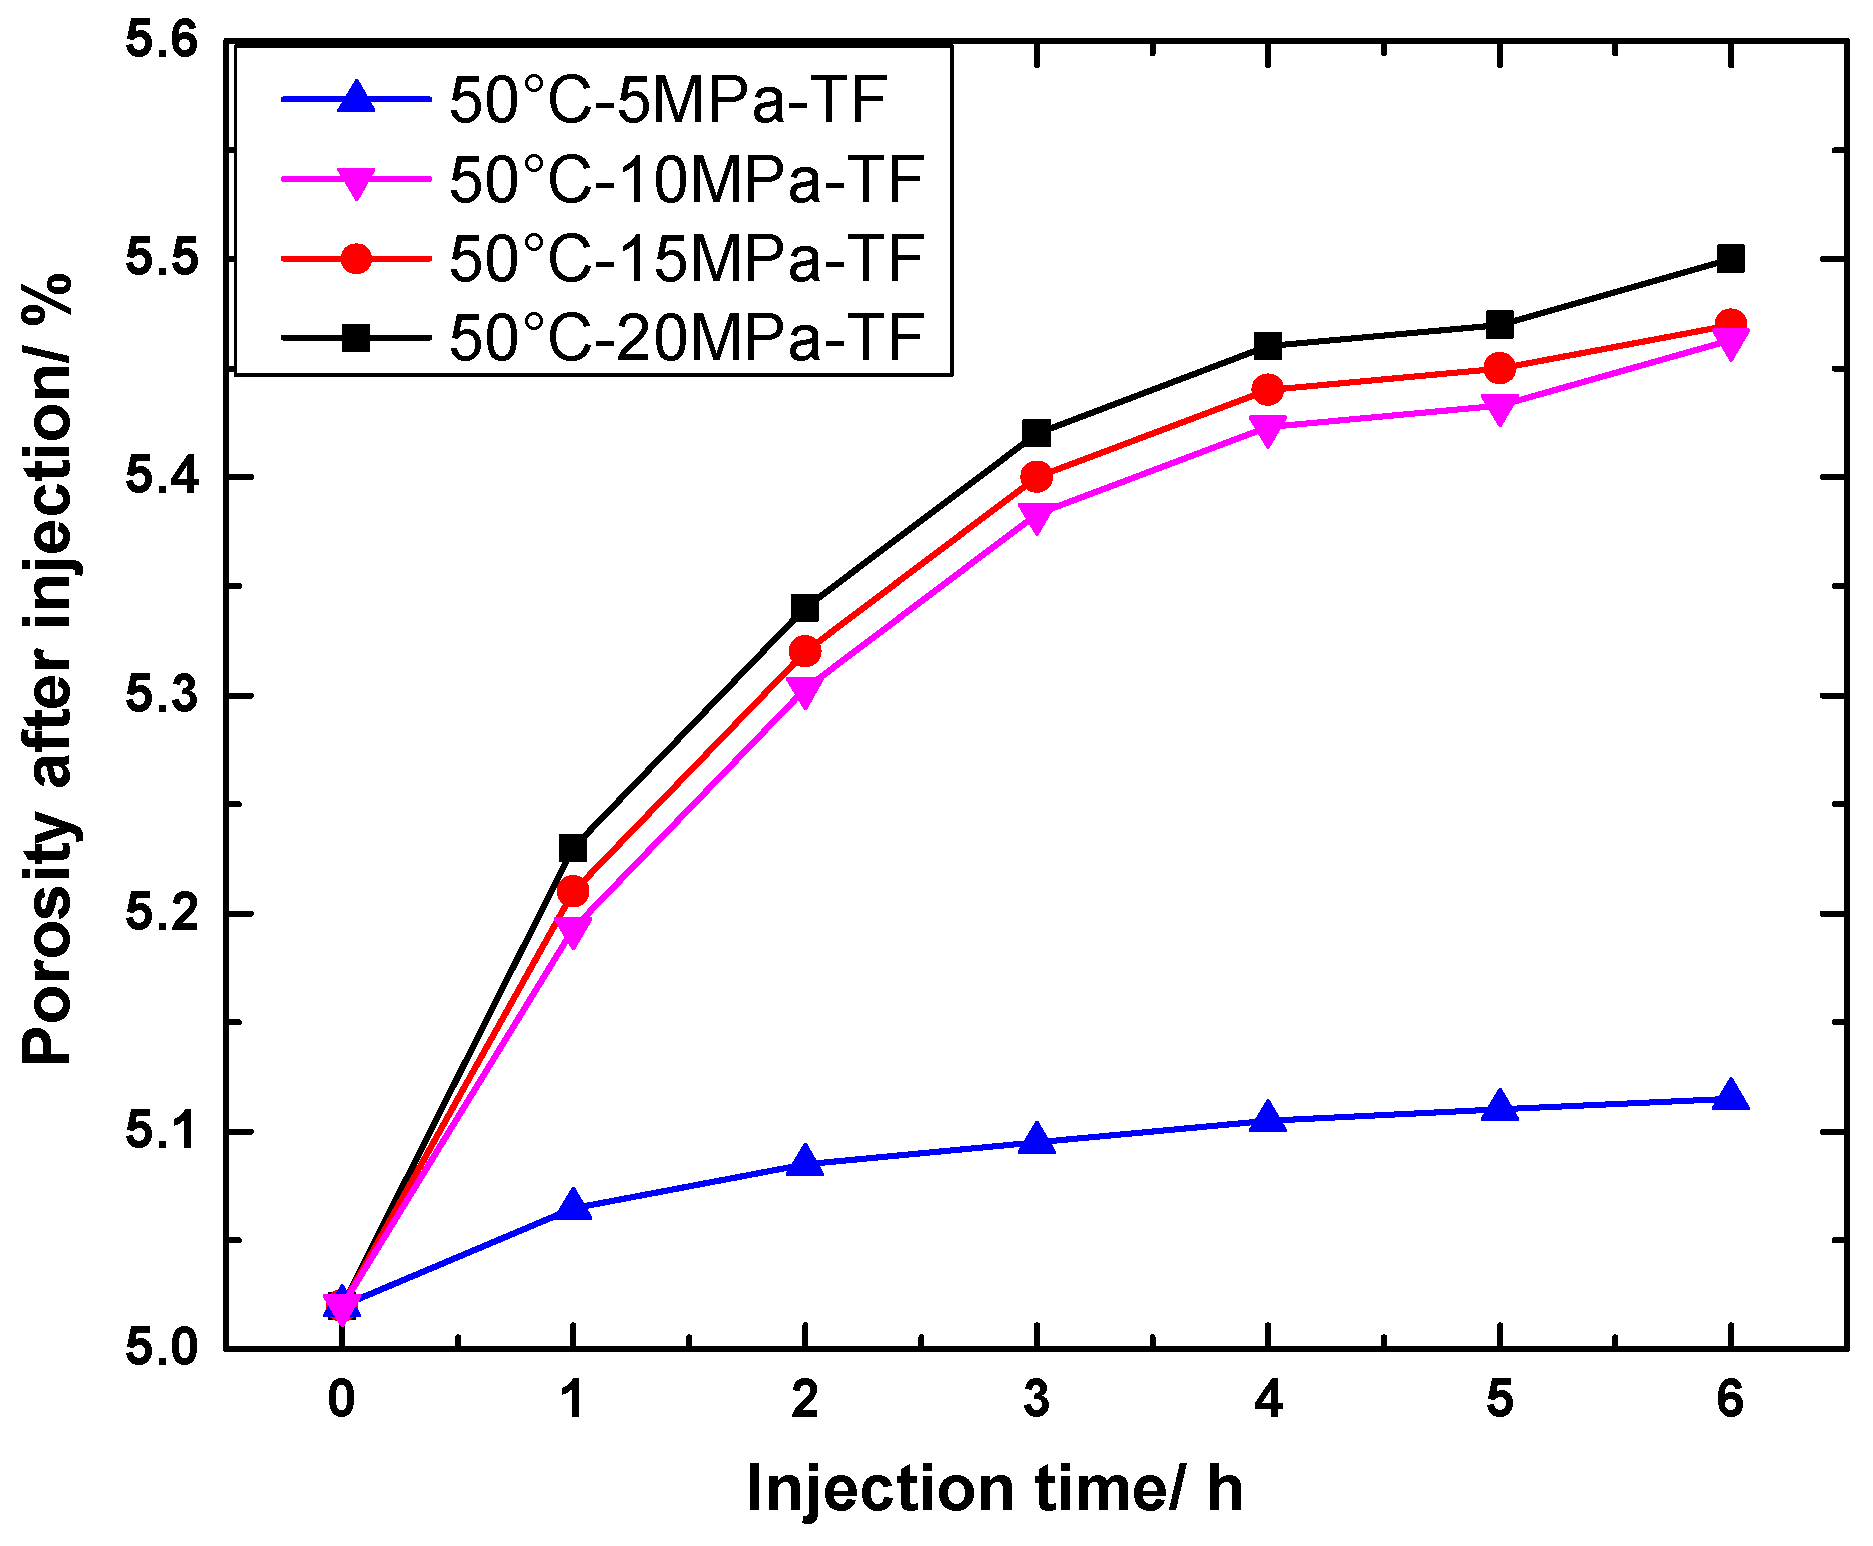
4.2.3. Change in Porosity of TF Specimens

The porosity evolution pattern of the TF specimen group is shown in Figure 12, and the overall trend is similar to that of the NF specimen group. It is also found that the porosity of the shale slowly increases at low pressures, so the effect of lateral calcite filling of natural fractures on scCO2 injection can also be neglected at this point.

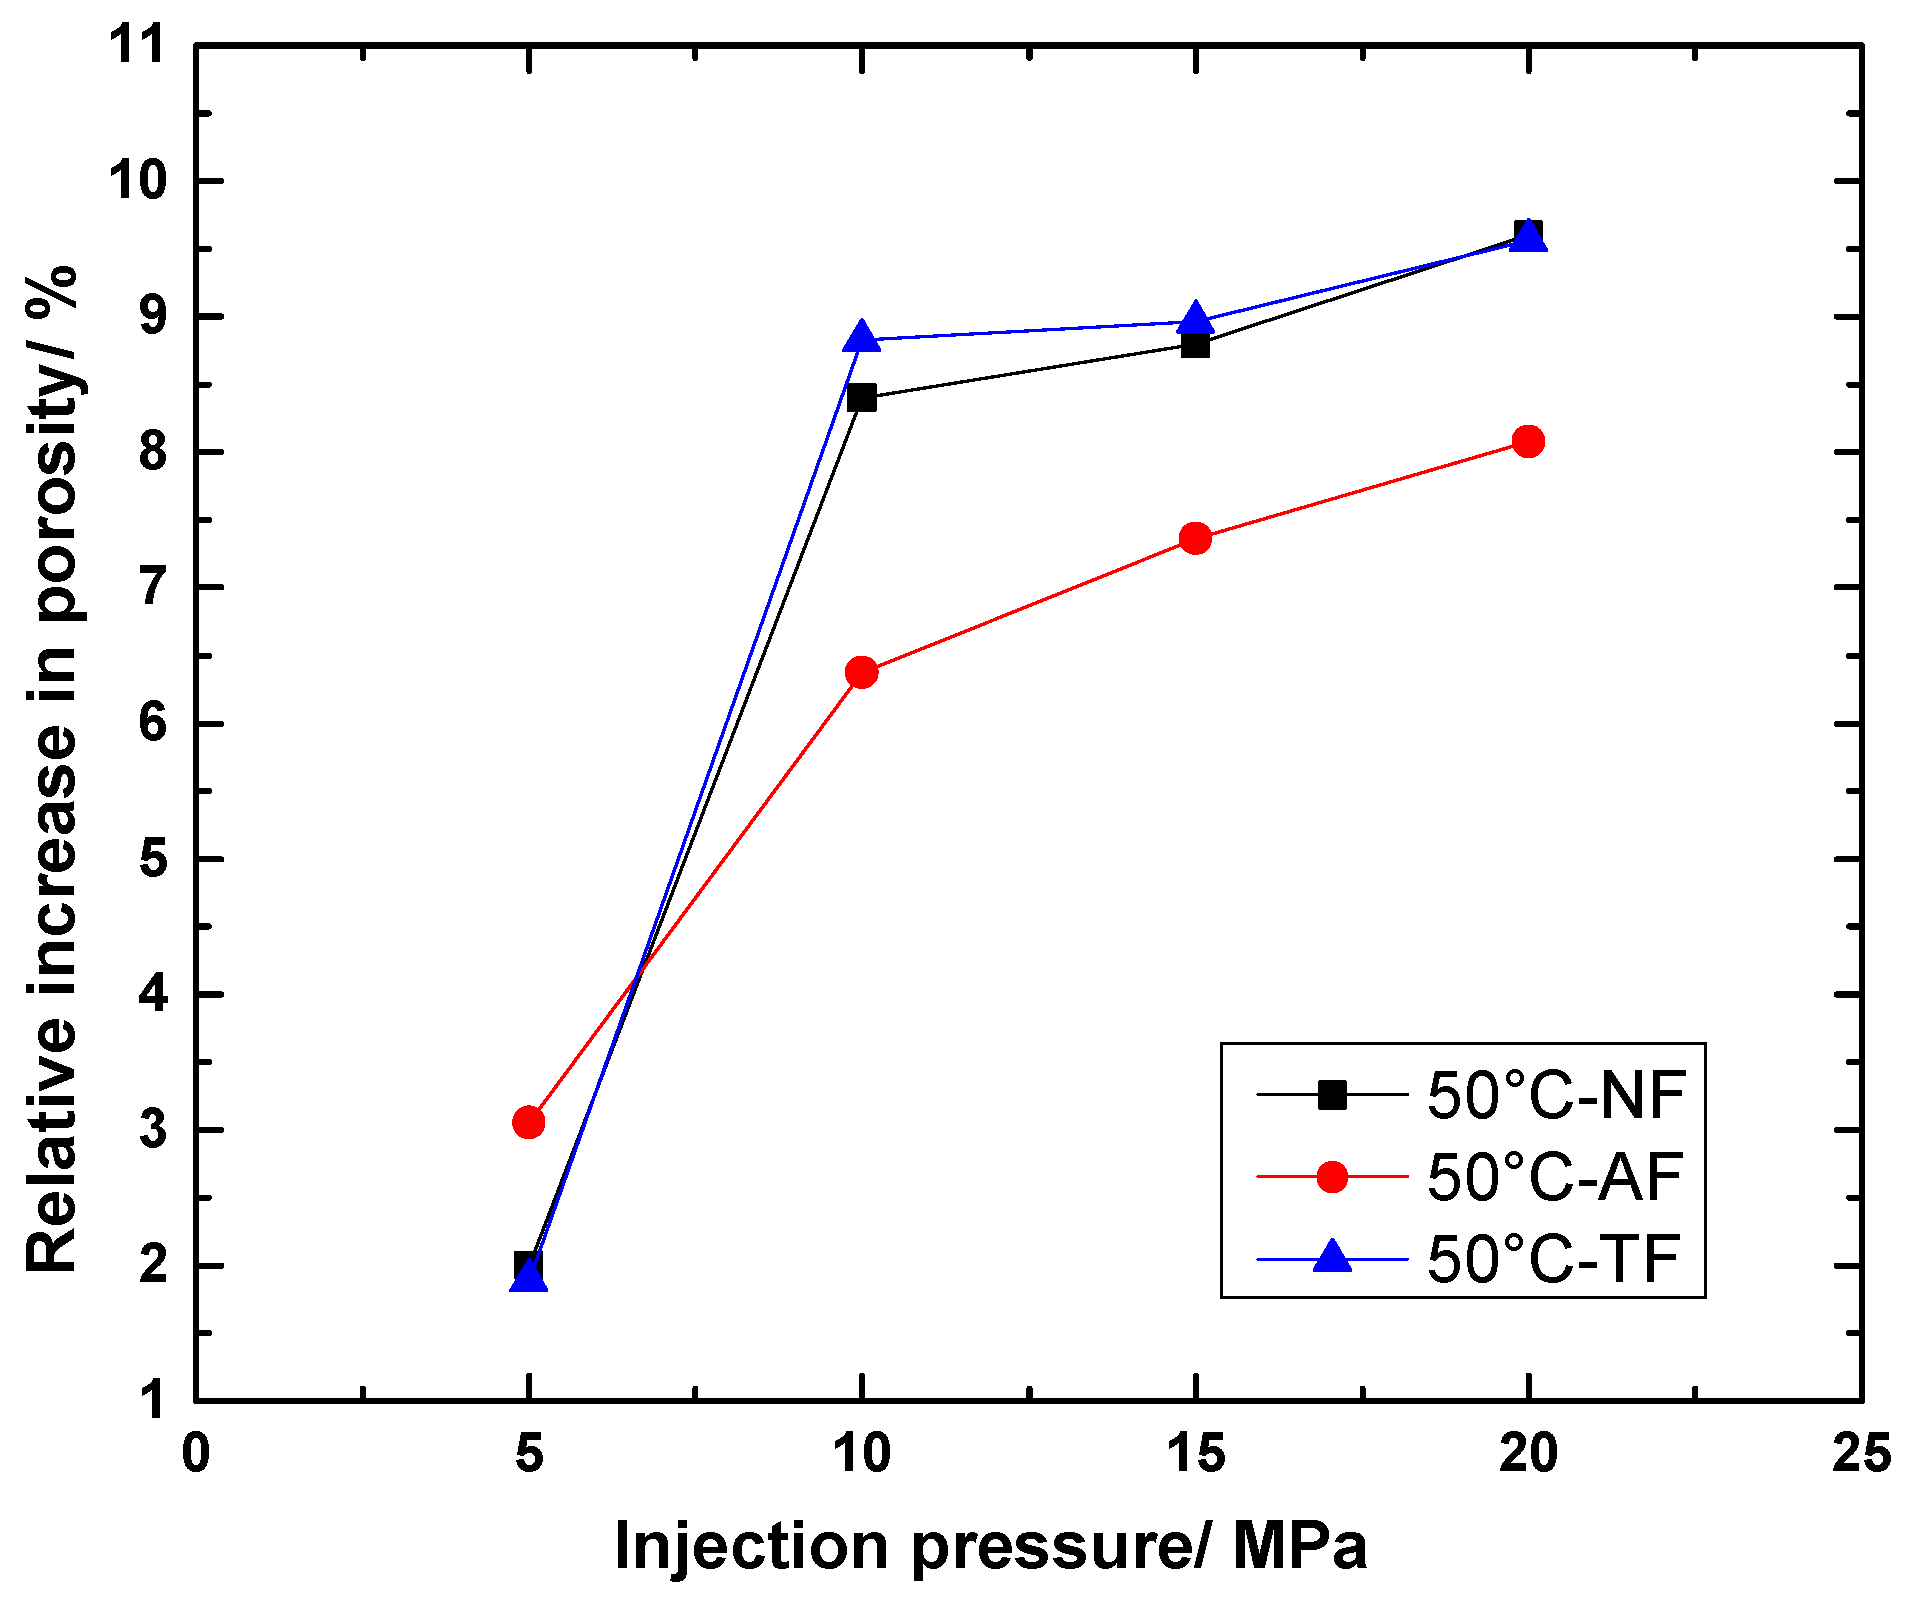
4.2.4. Change in Relative Porosity Growth with Pressure

The relative growth of porosity at the same temperature and different pressures in this group of experiments is shown in Figure 13. It is found that with the increase in pressure, the overall porosity growth is in a rising state. At a pressure of 5 MPa, the porosity of all three groups of cores increases to a lesser extent, because the reaction rate was slower and the degree of reaction is lower below the pressure of the supercritical state. In contrast, after reaching the supercritical state, the relative increase in porosity of the rocks is three to four times that of the subcritical state group. It can be seen that the pressure changes before and after the supercritical state are more sensitive to the extent of the reaction and the final increase in porosity than the temperature changes (after the supercritical state, the relative increase in porosity is 2.5 to 3 times higher than that before the supercritical state). From the viewpoint of the mechanism of chemical reaction, the pressure rise directly increases the partial pressure and concentration of scCO2, which exponentially increases the supply of reactants and drives the reaction in the direction of dissolution; however, the temperature rise only increases the reaction rate, which enables the reaction to be completed in a shorter period of time, but the final change in the degree of reaction is not obvious, resulting in little change in the amount of dissolution reaction.
From the comparison of different fracture types, it is obvious that: under the conditions of this paper, the porosity changes in TF and NF specimens are less different; however, the final porosity growth of AF specimens under 5 MPa is slightly higher than the other two groups, which is related to the pooling effect of calcite-filled fractures and more calcite being slowly dissolved by (subcritical state) CO2. When the pressure exceeds the supercritical state (above 10 MPa in the figure), the reaction rate between scCO2 and shale increases and the reaction degree is more complete. The dominant channel formed after the axial calcite-filled fractures are dissolved by scCO2 makes more gas flow, which reduces the contact area between scCO2 and shale in general, resulting in a lower relative increase in final porosity than that found in the other two groups.

5. Experimental Verification of Multi-Field Coupling of Supercritical CO2 with Shale

In order to verify the conclusions of numerical simulations in this paper, scCO2 long time flow injection experiments were carried out at 50 °C under the pore pressure of 20 MPa.

5.1. Experimental Samples and Scheme

Based on the actual engineering parameters, this verification focuses on the typical working conditions at 50 °C and 20 MPa. In addition, to verify the effects of scCO2 at a lower temperature and pressure and CO2 injection without reaching the supercritical state on the porosity of the core, a control experiment was set up at a temperature of 40 °C and pressure of 10 MPa, as well as a temperature of 50 °C and pressure of 5 MPa, and the experimental scheme is shown in Table 3. Group No. 1 and group No. 2 compare the effect of temperature on porosity change; group No. 1 and group No. 3 compare the effect of injected pore pressure; and group No. 1 and group No. 2—together as a typical supercritical state—compare the effect of supercritical state and subcritical state on porosity change with group No. 3.
The main purpose of the experiment is to test the percentage change in porosity before and after scCO2 injection and compare it with the numerical simulation results for analysis. Due to the difficulty of drilling specimens containing calcite fractures, it was not possible to collect complete specimens containing calcite-filled fractures of 50 mm in diameter and 100 mm in height. Therefore, in this paper, only three specimens without calcite fractures were drilled to simulate the flow of CO2 injection into shale at different temperatures and pressures.

5.2. Main Experimental Steps

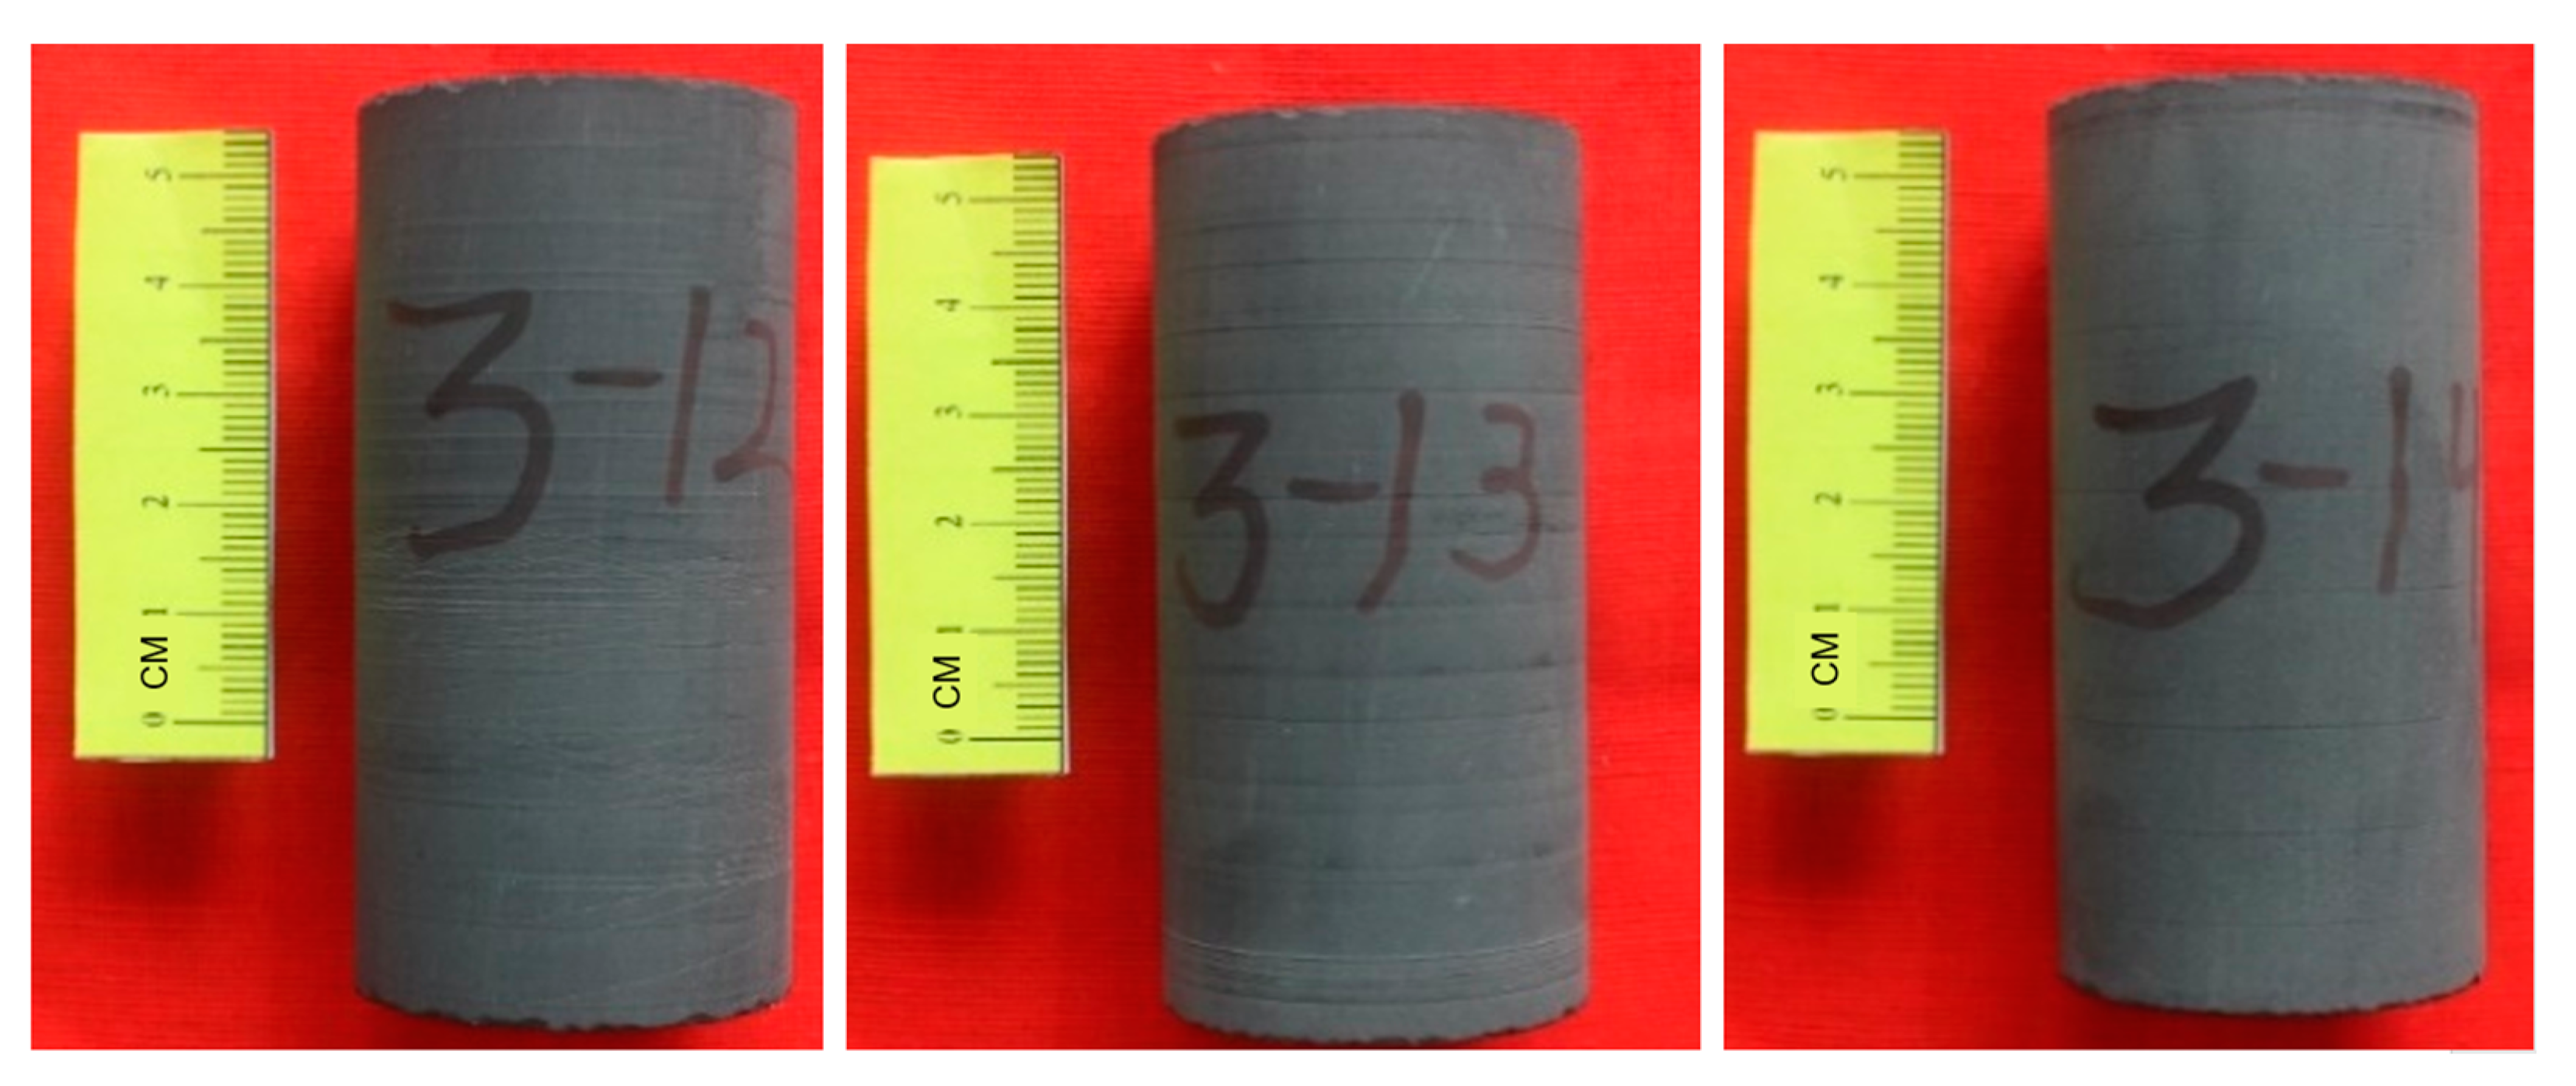
5.2.1. Core Pretreatment and Initial Porosity Testing

  • The cores were drilled and cut according to the relevant standards, dried and tested for basic geometric parameters, and small samples were kept for later scanning electron microscopy microscopic morphology testing (Figure 14).
  • Considering the influence of thermal expansion of the specimen and the deformation of the rock skeleton and pore joints under the surrounding pressure and pore pressure on the measured porosity, the same conditions of external temperature, surrounding pressure and pore pressure as those of the scCO2 injection experiment were used to test the initial porosity before the experiment. The porosity of the cores under the design temperature, pore pressure and surrounding pressure was measured according to the petroleum industry standard “pulse decay method” as the initial porosity before the reaction using the pressure pulse measurement rock porosity device.
  • Using the drying box, precision electronic scales, measuring cylinder, dropper and other devices, the formation water prepared was saturated according to Table 1 into the shale core; the size of the core water content saturation was adjusted by continuous drying, saturation, and weighing, so that it reached the design value (the simulation part of this paper is set to 40%); cling film was used to seal and wrap the water content specimens; conditions of no light and airtight storage were used; and then preparations were made for scCO2 long time flow experiments.

5.2.2. The scCO2 Injection Experiment

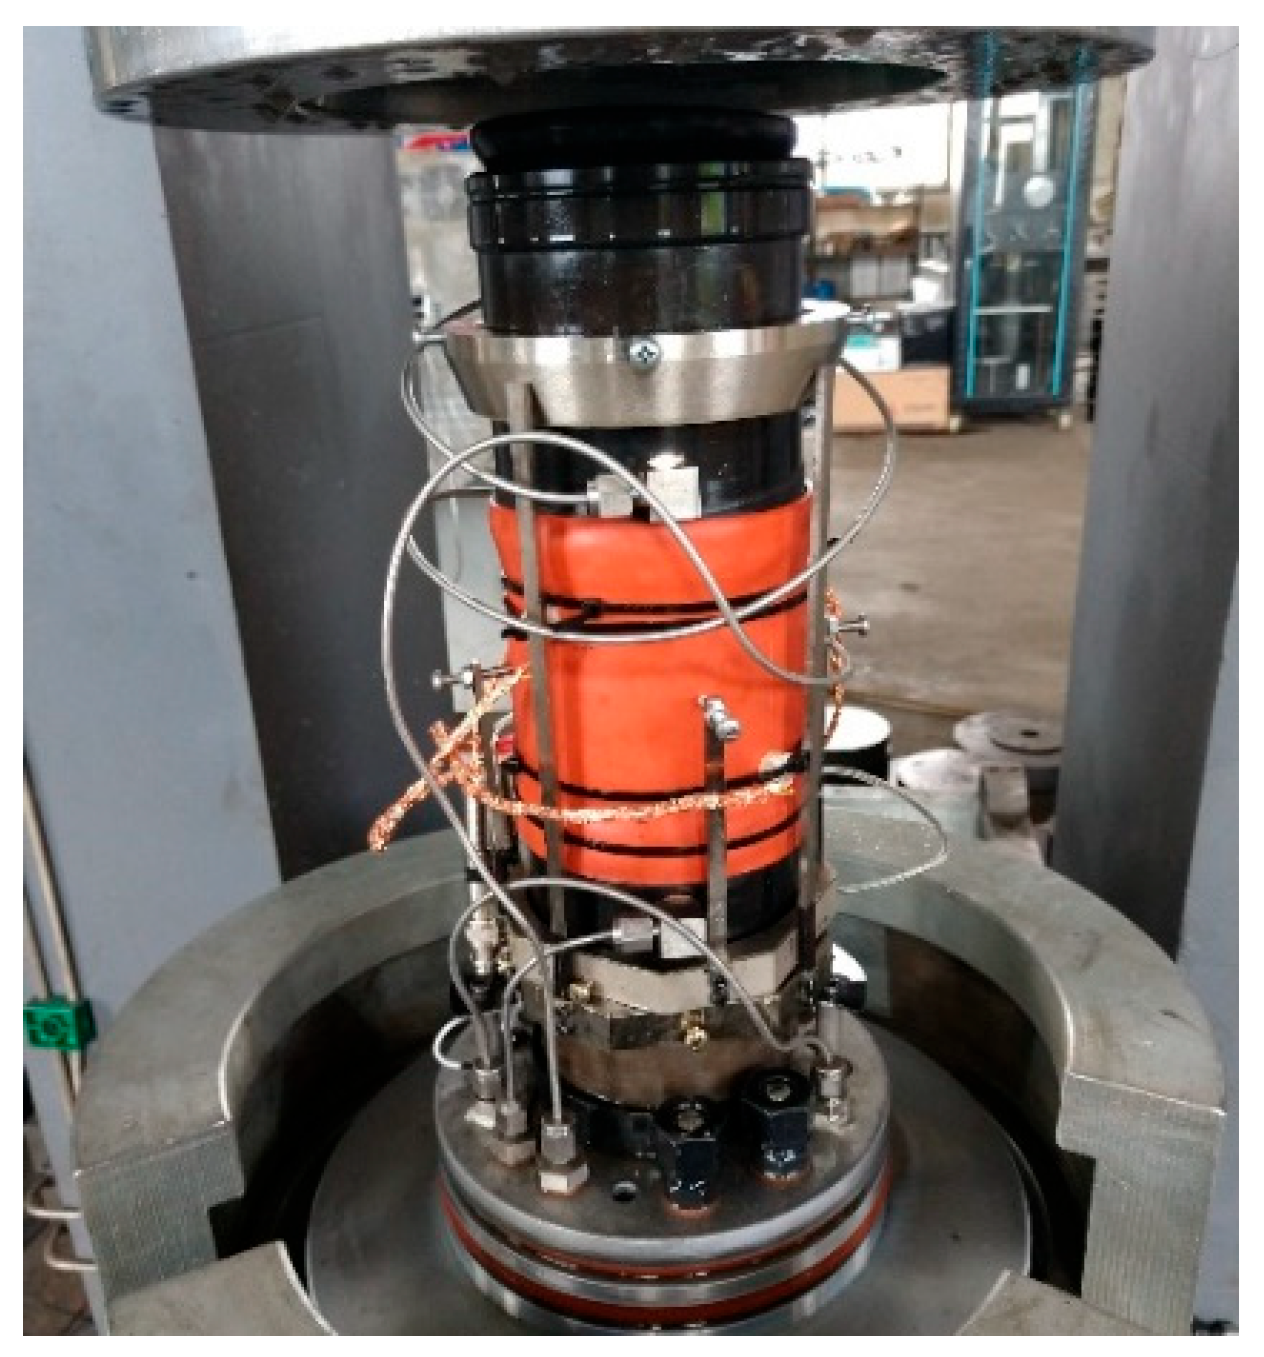
  • The multi-field coupling experimental system and related basic experimental operation steps were adopted, the sealed specimen was installed to the specimen table inside the enclosure cylinder, and the fluid injection line and sensor line were connected inside the enclosure, as shown in Figure 15.
  • In order to prevent scCO2 from flowing too fast and to ensure that the upstream and downstream pressures of the core are basically the same, a regulator was installed at the gas outlet end of the enclosing pressure chamber, and its limit pressure was set to the upstream injection pressure during the experiment, and with the upstream pressurization injection, the excess gas exceeding the limit pressure was discharged through the pressure relief port of the regulator. The reliability of the seal was tested after installation.
  • Temperature, circumferential pressure and axial pressure was applied to the specimen until the required value according to the experimental plan, scCO2 was injected, and the injection experiment was officially begun.
  • After completing the injection for 6 h, close the upstream injection device of the core was closed and the pressure relief valve was opened to drain the saturated scCO2 in the core. After completing the reduction of temperature and surrounding pressure, the surrounding pressure chamber was opened to remove the cores.

5.2.3. Testing the Porosity of the Injected Cores

After removing the cores and drying them, the porosity was tested again at the corresponding designed temperature and pressure, and the final relative porosity growth was calculated and compared with the initial porosity.

5.2.4. Comparison of Microscopic Morphology before and after the Experiment

Scanning electron microscope tests were conducted on the small, fragmented samples left during core drilling and cutting and the samples after the scCO2 flow experiment to compare the microscopic morphological changes in the shale samples before and after the scCO2 flow experiment.

5.3. Experimental Results Analysis Verification

5.3.1. Porosity Comparison

The comparison of the porosity and relative growth before and after the experiment obtained from the test is shown in Table 4. The final porosity relative growth measured by the experiment under three temperature and pressure conditions is plotted against the porosity relative growth obtained by simulation, as shown in Figure 16. It is found that the proportional relationship between the porosity growth in the three groups is basically the same; the relative porosity growth measured experimentally in groups 1, 2 and 3 are 6.2%, 5.8% and 1.2%, respectively, while those obtained from numerical simulation are 9.6%, 9.2% and 2.0%, respectively. The ratio of relative porosity growth under the three different temperature pressure experimental groups is 5.1:4.8:1, and the ratio of the three simulated groups is 4.8:4.6:1; the overall ratio is relatively close, which proves that the simulation method is well adapted under different temperatures and pressures. Therefore, it can be determined that the simulations in this paper under different temperatures and pressures can reflect the real shale porosity variation law.

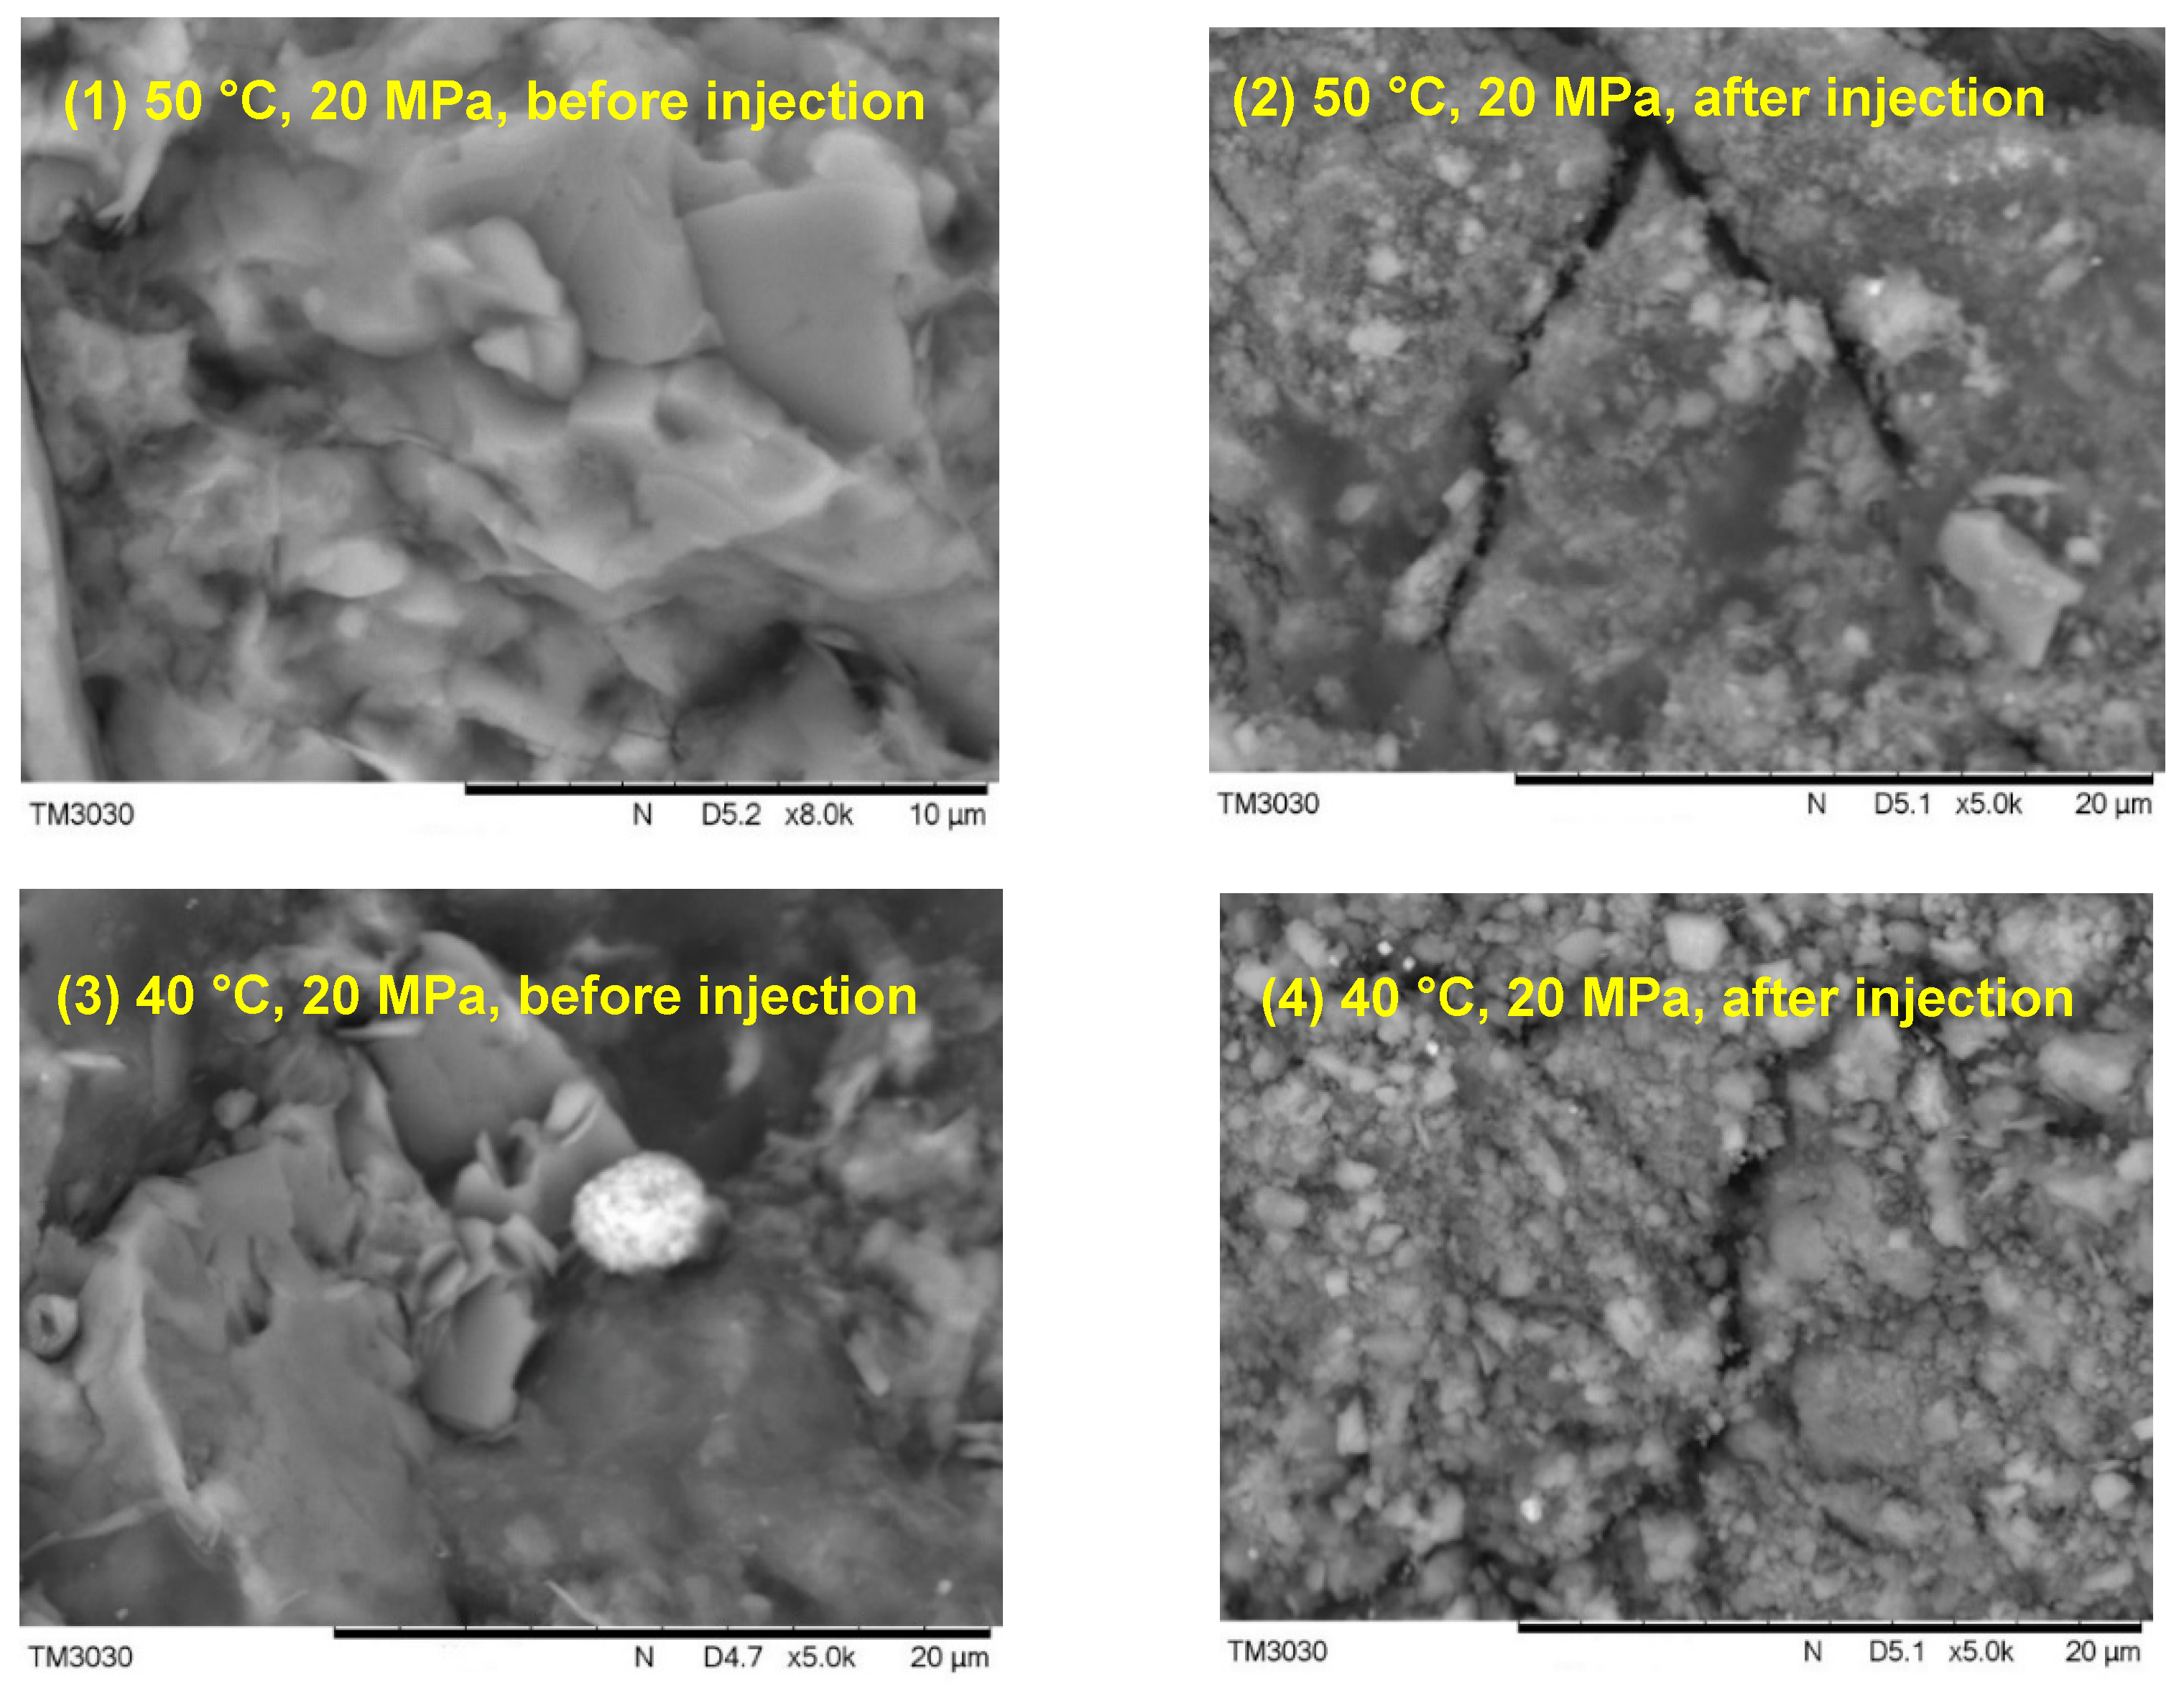
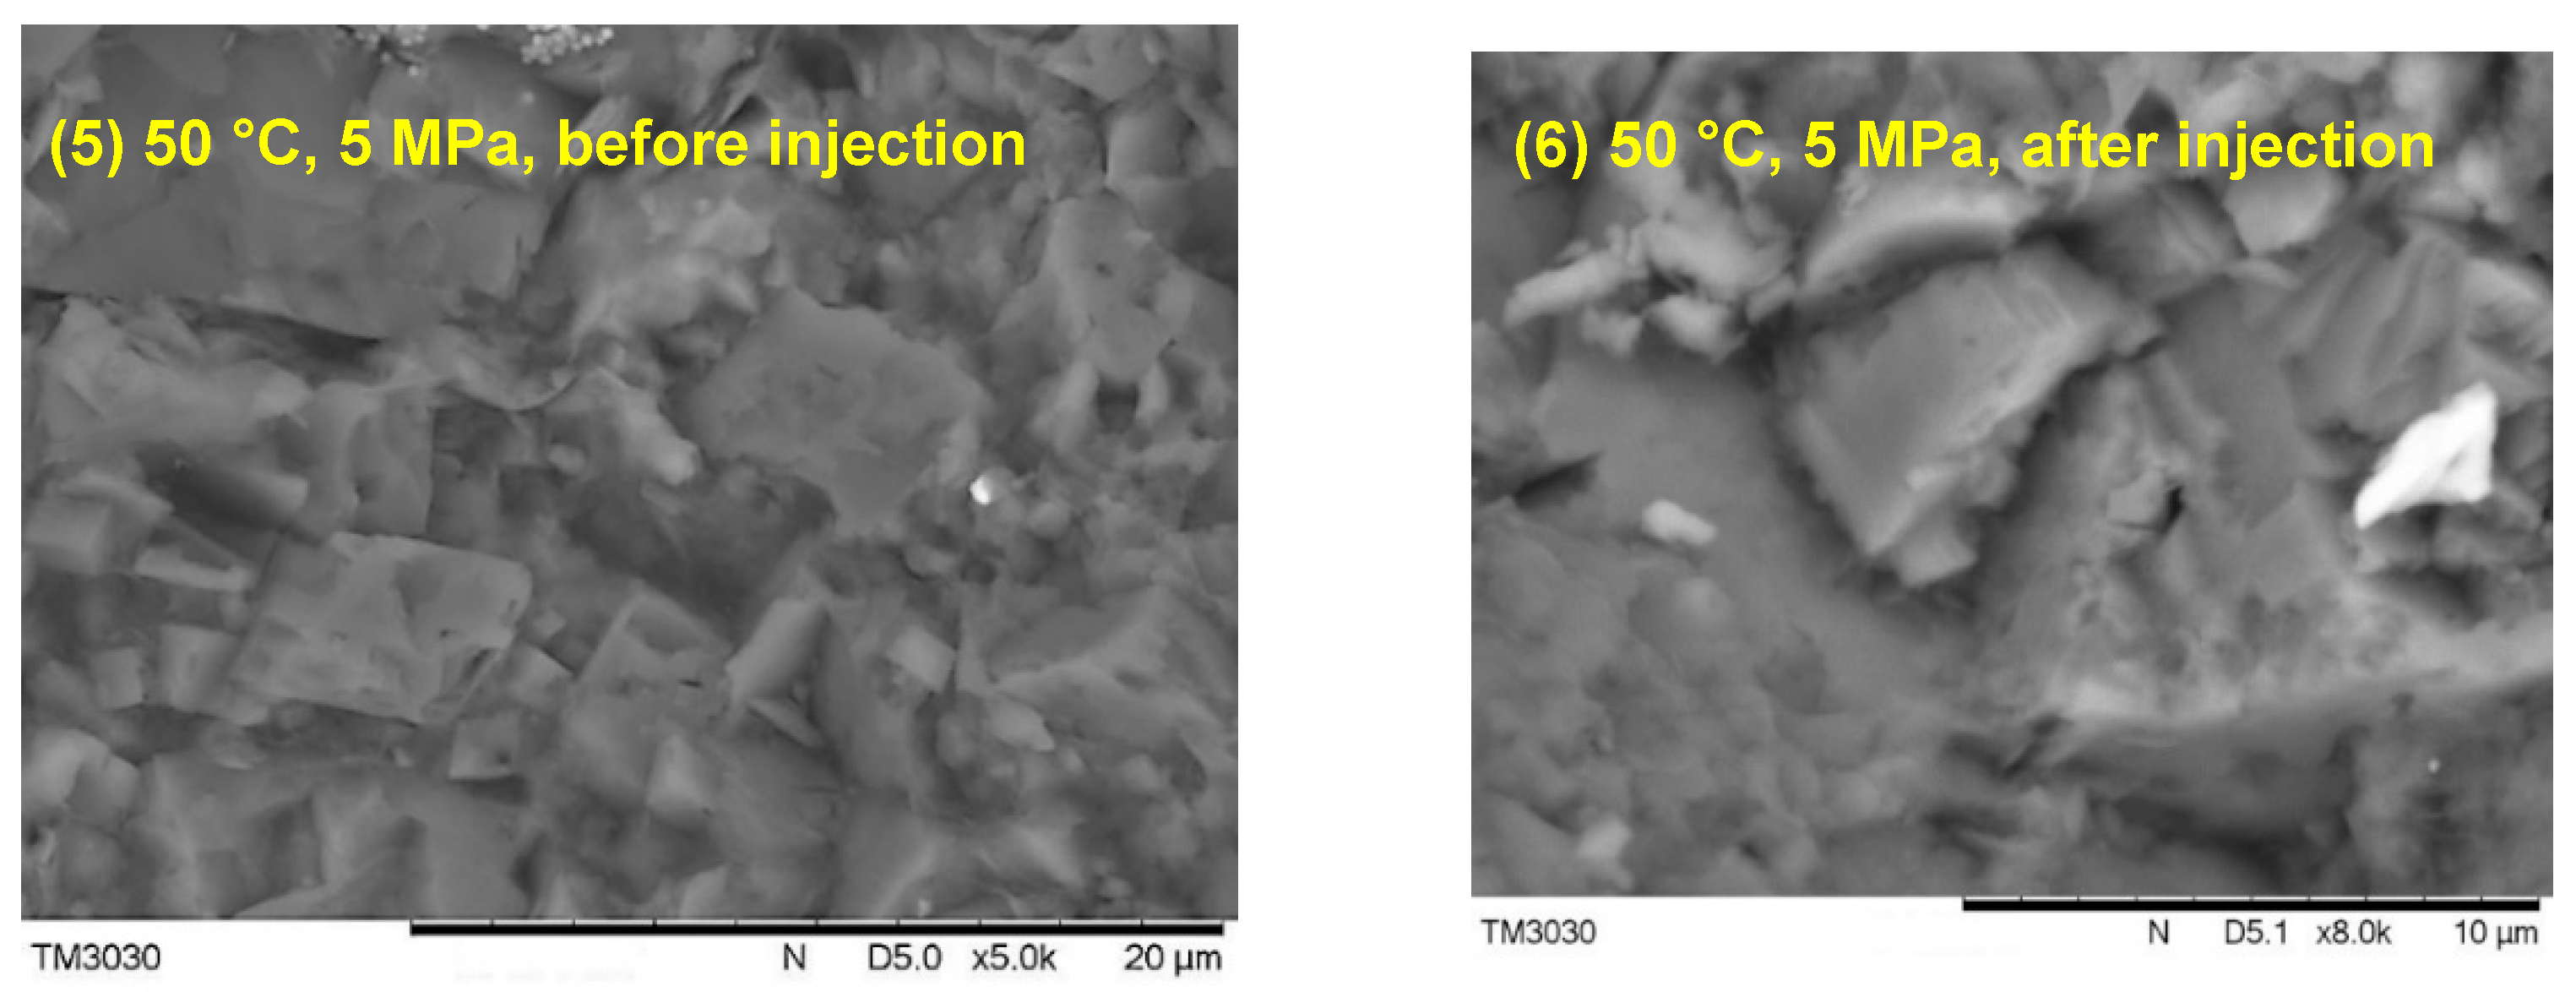
5.3.2. Scanning Electron Microscopy Microscopic Morphology Verification

To further investigate the structural changes in the pore joints of the three specimens tested in this experiment, microscopic morphology tests were conducted on the core fragments after CO2 injection using scanning electron microscopy. The fragments collected during the core processing before the experiment were collected and treated at the same high temperature as the experiment, and the SEM test was carried out as the control group before the scCO2 injection experiment, and the small fragments in the middle of the core were collected after the experiment for the SEM test as the surface micromorphology after the experiment. The comparison of the SEM microstructure of the three specimens before and after the experiment is shown in Figure 17.
As shown in subfigures (1) and (2) in Figure 17, the cemented surface was dense before CO2 injection at 50 °C and 20 MPa, and the mineral surface was regular and angular; however, after scCO2 injection, the shale surface showed a large number of fractured fragments, exfoliated minerals, and deeper crossed microfractures were left on the fractured surface. This proves that scCO2 reacts with shale minerals faster and ruptures more under this condition, probably precisely because the shale specimens in this group are all in this type of more severely damaged morphology in the matrix, so the relative amount of final porosity growth is larger.
Similar phenomena were found in the specimens at 40 °C and 20 MPa in Figure 17, subfigures (3) and (4). Before the injection of CO2, the minerals were densely cemented, and the cement was clearly visible on the microscopic surface of the shale, with fewer microfractures overall; when the scCO2 was injected at 40 °C and 20 MPa for 6 h, more tiny fracture fragments were also found on the surface of the shale, and some dissolution microfractures were also formed. However, because the ambient temperature of this group of specimens was 40 °C, which was lower than that of the 50 °C experimental group, the reaction rate of scCO2 dissolution of shale minerals was slightly reduced, and not as many cracks and broken pieces were produced as in the 50 °C experimental group, so the relative increase in final porosity was smaller.
As shown in Figure 17 in subfigures (5) and (6), before and after CO2 injection at 50 °C and 5 MPa, there is little difference in the microscopic surface morphology of shale, with dense cementation between minerals, fewer microfractures, and no obvious CO2-induced fracture fragments found on the surface of mineral grains. It proves that the shale matrix minerals do not change significantly after the CO2 injection and percolation at 50 °C and low pressure. Therefore, the relative increase in final porosity is extremely small.
Therefore, the comparative evaluation of the microscopic morphology of the three shale specimens before and after the reaction after the validation experiment confirms the difference in the degree of damage to shale porosity by scCO2 at different temperatures and pressures and verifies the accuracy of the porosity obtained from the numerical simulation.

6. Conclusions

  • Considering the field shale outcrop field study and core observation, it is found that high-angle natural fractures are mostly developed in the Longmaxi–Wufeng Formation shale in Sichuan, accounting for more than 60%; high-angle fractures are mostly seen in all calcite filled fractures; and calcite filled fractures account for more than 90% of the total number of filled fractures.
  • The numerical simulation found that the porosity of shale gradually increased with the injection of CO2 under the same pressure (5, 10, 15, 20 MPa). Additionally, the higher the temperature, the more obvious the increase in porosity (from a 5% increase to more than 5.2%). However, when the temperature is lower than the critical point temperature, the porosity does not change obviously because the CO2 is no longer in the supercritical state and the reaction rate is low.
  • The numerical simulation shows that the porosity of AF specimen grows faster than TF specimen and NF specimen in the same time under the same pressure and different temperatures, but the growth of porosity gradually slows down afterwards. The porosity change pattern of TF specimens is not different from that of NF. The reason is related to the dominant pooling effect of axial calcite fracture and the premature reaction with scCO2.
  • Numerical simulations found that at the same temperature with different pressures, the effect of pressure variation on the porosity of specimens is more obvious than that of temperature. This is because high gas pressure can increase the concentration of reactants, while high temperature only increases the rate of reaction, but cannot change the degree of final reaction.
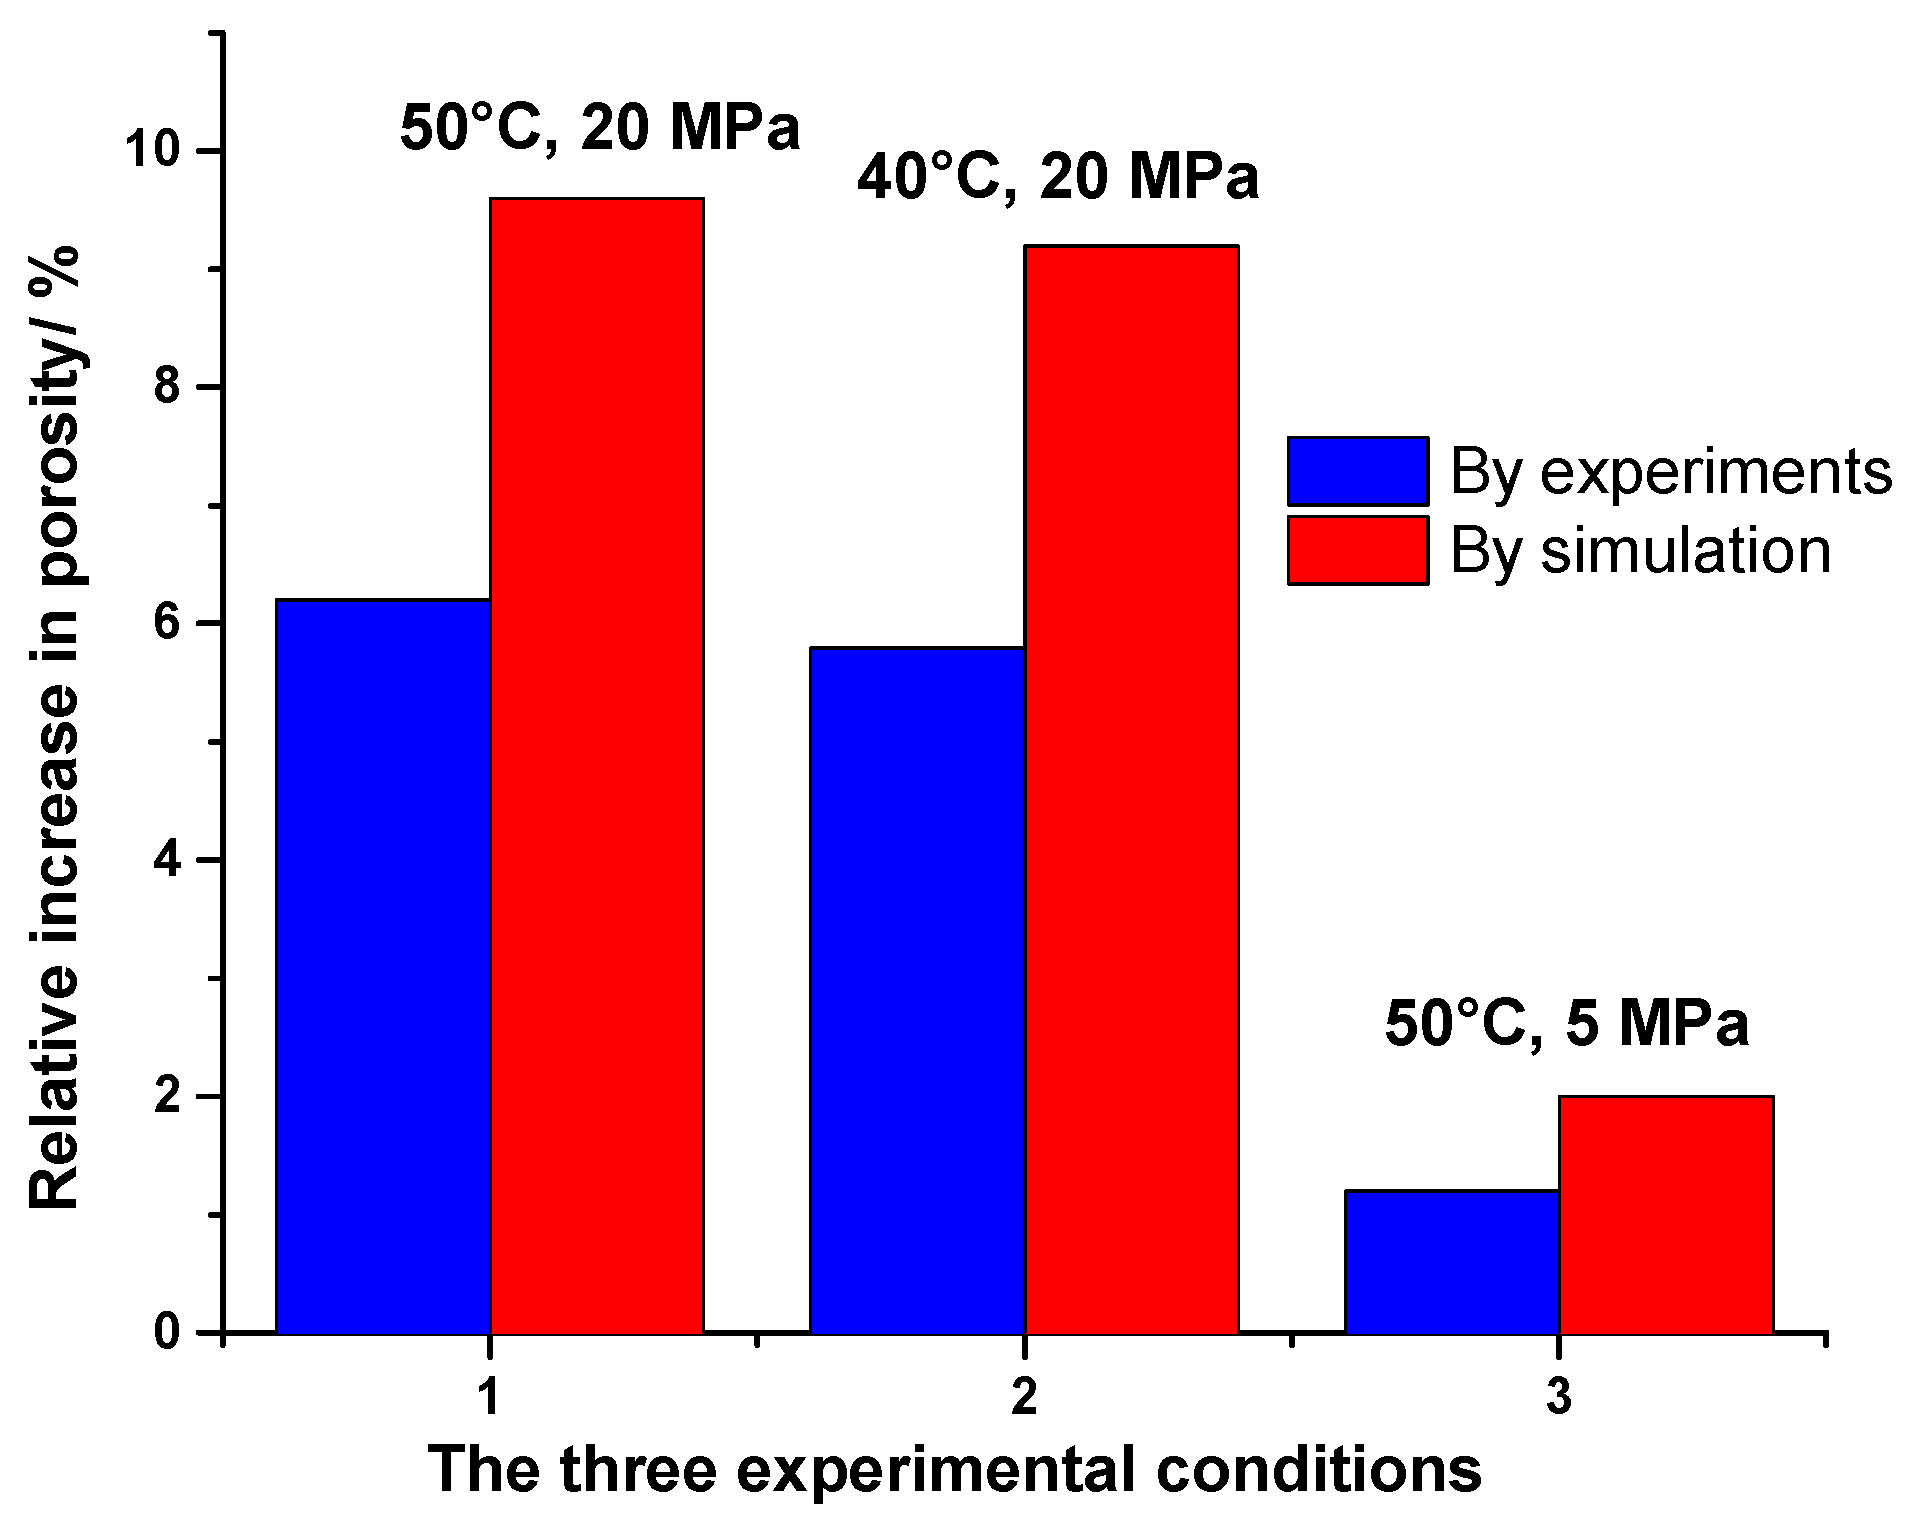
  • Experimental verification revealed that the porosity of all three shale specimens under the same temperature and pressure increased after the CO2 injection flow, and the relative increase in porosity between the three samples measured experimentally was basically consistent with the numerical simulation results. Scanning electron microscopy (SEM) before and after the experiments showed that the microstructure of the shale was more severely damaged by scCO2 at a higher temperature and pressure, producing more tiny fragments and microfractures, while the microstructure of the specimens that did not reach the supercritical state condition did not change obviously before and after the CO2 injection; this verified the accuracy of the simulation results.
  • In scCO2 fracturing construction, this conclusion can be used to optimize the pressure and time interval of CO2 injection, so that the CO2 can fully exchange heat with the formation to achieve the supercritical state and achieve better effect of shale gas production enhancement.

Author Contributions

L.T. has put forward the conceptualization, complete the main investigation and the original draft preparation. J.H. has complete the methodology of the simulation and done the editing of writing. Y.F. has conduct the data processing and formal analysis. J.D.M. has done the supervision and project administration. All authors have read and agreed to the published version of the manuscript.

Funding

This research was funded by the National Natural Science Foundation of China (No. 52192625, 51692622). This research was funded by Open Fund (PLC20210305) of State Key Laboratory of Oil & Gas Reservoir Geology and Exploitation (Chengdu University of Technology).

Institutional Review Board Statement

Not applicable.

Informed Consent Statement

Not applicable.

Data Availability Statement

Not applicable.

Acknowledgments

We would like to thank the University of Utah for offering the software. And We would like to thank Ting Xiao and Vivek Patil for kind-hearted help on the simulation. Additionally, we would like to thank Yanchang Petroleum (Group) Co., Ltd. for conducting the first field test on scCO2 fracturing in shale gas formation.

Conflicts of Interest

The authors declare no conflict of interest.

References

  1. Zhu, H.; Tang, X.; Liu, Q.; Li, K.; Xiao, J.; Jiang, S.; McLennan, J.D. 4D multi-physical stress modelling during shale gas production: A case study of Sichuan Basin shale gas reservoir, China. J. Pet. Sci. Eng. 2018, 167, 929–943. [Google Scholar] [CrossRef]
  2. Zhu, H.; Tang, X.; Song, Y.; Li, K.; Xiao, J.; Dusseault, M.; McLennan, J.D. An infill well fracturing model and its microseismic events barrier effect: A case in fuling shale gas reservoir. SPE J. 2021, 26, 113–134. [Google Scholar] [CrossRef]
  3. Bennion, B.; Bachu, S. Relative permeability characteristics for supercritical CO2 displacing water in a variety of potential sequestration zones. In Proceedings of the SPE Annual Technical Conference and Exhibition, Dallas, TX, USA, 9–12 October 2005. [Google Scholar] [CrossRef]
  4. Schremp, F.W.; Roberson, G.R. Effect of supercritical carbon dioxide (CO2) on construction materials. SPE J. 1975, 15, 227–233. [Google Scholar] [CrossRef]
  5. Raventós, M.; Duarte, S.; Alarcón, R. Application and Possibilities of Supercritical CO2 Extraction in Food Processing Industry: An Overview. Food Sci. Technol. Int. 2002, 8, 269–284. [Google Scholar] [CrossRef]
  6. Lashkarbolooki, M.; Vaferi, B.; Rahimpour, M.R. Comparison the capability of artificial neural network (ANN) and EOS for prediction of solid solubilities in supercritical carbon dioxide. Fluid Phase Equilibria 2011, 308, 35–43. [Google Scholar] [CrossRef]
  7. Rezaei, T.; Nazarpour, V.; Shahini, N.; Bahmani, S.; Shahkar, A.; Abdihaji, M.; Ahmadi, S.; Shahdost, F.T. A universal methodology for reliable predicting the non-steroidal anti-inflammatory drug solubility in supercritical carbon dioxide. Sci. Rep. 2022, 12, 1043. [Google Scholar] [CrossRef]
  8. Vaferi, B.; Karimi, M.; Azizi, M.; Esmaeili, H. Comparison between the artificial neural network, SAFT and PRSV approach in obtaining the solubility of solid aromatic compounds in supercritical carbon dioxide. J. Supercrit. Fluids 2013, 77, 44–51. [Google Scholar] [CrossRef]
  9. Middleton, R.S.; Carey, J.W.; Currier, R.P.; Hyman, J.D.; Kang, Q.; Karra, S.; Jiménez-Martínez, J.; Porter, M.L.; Viswanathan, H.S. Shale gas and non-aqueous fracturing fluids: Opportunities and challenges for supercritical CO2. Appl. Energy 2015, 147, 500–509. [Google Scholar] [CrossRef] [Green Version]
  10. Liu, Q.; Tao, L.; Zhu, H.; Lei, Z.; Jiang, S.; McLennan, J.D. Macroscale mechanical and microscale structural changes in Chinese Wufeng shale with supercritical carbon dioxide fracturing. SPE J. 2018, 23, 691–703. [Google Scholar] [CrossRef]
  11. Xiao, T.; Dai, Z.; McPherson, B.; Viswanathan, H.; Jia, W. Reactive transport modeling of arsenic mobilization in shallow groundwater: Impacts of CO2 and brine leakage. Geomech. Geophys. Geo-Energy Geo-Resour. 2017, 3, 339–350. [Google Scholar] [CrossRef]
  12. Xiao, T.; McPherson, B.; Pan, F.; Esser, R.; Jia, W.; Bordelon, A.; Bacon, D. Potential chemical impacts of CO2 leakage on underground source of drinking water assessed by quantitative risk analysis. Int. J. Greenh. Gas Control. 2016, 50, 305–316. [Google Scholar] [CrossRef] [Green Version]
  13. Xiao, T.; Kweon, H.; McPherson, B.; Deo, M. Wormhole Generations in Indiana limestone with CO2 intrusion: Numerical simulations based on core flooding experiments. Energy Fuels 2017, 31, 12487–12499. [Google Scholar] [CrossRef]
  14. Lahann, R.; Mastalerz, M.; Rupp, J.A.; Drobniak, A. Influence of CO2 on New Albany Shale composition and pore structure. Int. J. Coal Geol. 2013, 108, 2–9. [Google Scholar] [CrossRef]
  15. Alemu, B.L.; Aagaard, P.; Munz, I.A.; Skurtveit, E. Caprock interaction with CO2: A laboratory study of reactivity of shale with supercritical CO2 and brine. Appl. Geochem. 2011, 26, 1975–1989. [Google Scholar] [CrossRef]
  16. Wang, X.; Alvarado, V.; Swoboda-Colberg, N.; Kaszuba, J.P. Reactivity of dolomite in water-saturated supercritical carbon dioxide: Significance for carbon capture and storage and for enhanced oil and gas recovery. Energy Convers. Manag. 2013, 65, 564–573. [Google Scholar] [CrossRef]
  17. Wang, T.; Wang, H.; Zhang, F.; Xu, T. Simulation of CO2-water-rock interactions on geologic CO2 sequestration under geological conditions of China. Mar. Pollut. Bull. 2013, 76, 307–314. [Google Scholar] [CrossRef]
  18. Jung, H.B.; Um, W.; Cantrell, K.J. Effect of oxygen co-injected with carbon dioxide on Gothic shale caprock- CO2-brine interaction during geologic carbon sequestration. Chem. Geol. 2013, 354, 1–14. [Google Scholar] [CrossRef]
  19. Xu, T.; Apps, J.A.; Pruess, K. Mineral sequestration of carbon dioxide in a sandstone–shale system. Chem. Geol. 2005, 217, 295–318. [Google Scholar] [CrossRef]
  20. Xu, T.; Zheng, L.; Tian, H. Reactive transport modeling for CO2 geological sequestration. J. Pet. Sci. Eng. 2011, 78, 765–777. [Google Scholar] [CrossRef] [Green Version]
  21. Tian, H.; Pan, F.; Xu, T.; McPherson, B.J.; Yue, G.; Mandalaparty, P. Impacts of hydrological heterogeneities on caprock mineral alteration and containment of CO2 in geological storage sites. Int. J. Greenh. Gas Control. 2014, 24, 30–42. [Google Scholar] [CrossRef]
  22. Tian, H.; Xu, T.; Li, Y.; Yang, Z.; Wang, F. Evolution of sealing efficiency for CO2 geological storage due to mineral alteration within a hydrogeologically heterogeneous caprock. Appl. Geochem. 2015, 63, 380–397. [Google Scholar] [CrossRef]
  23. Gherardi, F.; Xu, T.; Pruess, K. Numerical modeling of self-limiting and self-enhancing caprock alteration induced by CO2 storage in a depleted gas reservoir. Chem. Geol. 2007, 244, 103–129. [Google Scholar] [CrossRef] [Green Version]
  24. Dalkhaa, C.; Shevalier, M.; Nightingale, M.; Mayer, B. 2-D reactive transport modeling of the fate of CO2 injected into a saline aquifer in the Wabamun Lake Area, Alberta, Canada. Appl. Geochem. 2013, 38, 10–23. [Google Scholar] [CrossRef]
  25. Emberley, S.; Hutcheon, I.; Shevalier, M.; Durocher, K.; Mayer, B.; Gunter, W.D.; Perkins, E.H. Monitoring of fluid–rock interaction and CO2 storage through produced fluid sampling at the Weyburn CO2-injection enhanced oil recovery site, Saskatchewan, Canada. Appl. Geochem. 2005, 20, 1131–1157. [Google Scholar] [CrossRef]
  26. Liu, F.; Lu, P.; Griffith, C.; Hedges, S.W.; Soong, Y.; Hellevang, H.; Zhu, C. CO2–brine–caprock interaction: Reactivity experiments on Eau Claire shale and a review of relevant literature. Int. J. Greenh. Gas Control. 2012, 7, 153–167. [Google Scholar] [CrossRef] [Green Version]
  27. He, Z.; Li, G.; Tian, S.; Wang, H.; Shen, Z.; Li, J. SEM analysis on rock failure mechanism by supercritical CO2 jet impingement. J. Pet. Sci. Eng. 2016, 146, 111–120. [Google Scholar] [CrossRef]
  28. Cai, C.; Kang, Y.; Wang, X.; Hu, Y.; Huang, M.; Liu, Y.; Liu, J.; Chen, H.; Li, X. Experimental study on shale fracturing enhancement by using multi-times pulse supercritical carbon dioxide (SC-CO2) jet. J. Pet. Sci. Eng. 2019, 178, 948–963. [Google Scholar] [CrossRef]
  29. Cai, C.; Kang, Y.; Yang, Y.; Wang, X.; Li, Y.; Huang, M.; Wu, J. The effect of shale bedding on supercritical CO2 jet fracturing: An experimental study. J. Pet. Sci. Eng. 2020, 195, 107798. [Google Scholar] [CrossRef]
  30. Okamoto, I.; Li, X.; Ohsumi, T. Effect of supercritical CO2 as the organic solvent on cap rock sealing performance for underground storage. Energy 2005, 30, 2344–2351. [Google Scholar] [CrossRef]
  31. Davila, G.; Cama, J.; Luquot, L.; Soler, J.M.; Ayora, C. Experimental and modeling study of the interaction between a crushed marl caprock and CO2-rich solutions under different pressure and temperature conditions. Chem. Geol. 2017, 448, 26–42. [Google Scholar] [CrossRef]
  32. Edlmann, K.; Haszeldine, S.; McDermott, C.I. Experimental investigation into the sealing capability of naturally fractured shale caprocks to supercritical carbon dioxide flow. Environ. Earth Sci. 2013, 70, 3393–3409. [Google Scholar] [CrossRef] [Green Version]
  33. Wollenweber, J.; Alles, S.; Busch, A.; Krooss, B.M.; Stanjek, H.; Littke, R. Experimental investigation of the CO2 sealing efficiency of caprocks. Int. J. Greenh. Gas Control. 2010, 4, 231–241. [Google Scholar] [CrossRef]
  34. Bourg, I.C.; Beckingham, L.E.; DePaolo, D.J. The nanoscale basis of CO2 trapping for geologic storage. Environ. Sci. Technol. 2015, 49, 10265–10284. [Google Scholar] [CrossRef]
  35. Yin, H.; Zhou, J.; Jiang, Y.; Xian, X.; Liu, Q. Physical and structural changes in shale associated with supercritical CO2 exposure. Fuel 2016, 184, 289–303. [Google Scholar] [CrossRef]
  36. Zhou, J.; Yin, H.; Tan, J.; Jiang, Y.; Xian, X.; Liu, Q.; Ju, Y. Pore structural characterization of shales treated by sub-critical and supercritical CO2 exposure. J. Nanosci. Nanotechnol. 2017, 17, 6603–6613. [Google Scholar] [CrossRef]
  37. Zhu, H.; Tao, L.; Liu, Q.; Lei, Z.; Jiang, S.; McLennan, J.D. Fracture characteristics and change of permeability under the influence of natural fractures: Experimental study of Wufeng-Longmaxi shale. SPE Reserv. Eval. Eng. 2017, 21, 225–237. [Google Scholar] [CrossRef]
  38. Gale, J.F.W.; Reed, R.M.; Holder, J. Natural fractures in the Barnett Shale and their importance for hydraulic fracture treatments. Am. Assoc. Pet. Geol. Bull. 2007, 91, 603–622. [Google Scholar] [CrossRef]
  39. Wu, K. Pore Fracture Characterization of Typical Shale Gas Reservoirs in Eastern Sichuan; Southwest Petroleum University: Chengdu, China, 2015. (In Chinese) [Google Scholar]
  40. Evans, K.; Toth, R.; Tobi, O.; Jarrett, S.; Natalia, B.; Tim, C.; Ghahfarokhi, P. Fracture Analysis before and after hydraulic fracturing in the marcellus shale using the mohr-coulomb failure criteria. In Proceedings of the SPE/AAPG/SEG Unconventional Resources Technology Conference, Denver, CO, USA, 22–24 July 2019. [Google Scholar] [CrossRef]
  41. Dai, F. 2018 Shale Pores and Shale Gas Occurrence Mechanism of Longmaxi and Niutitang Formations in Eastern Sichuan-Western Hunan; China University of Geosciences: Wuhan, China, 2018. [Google Scholar]
  42. Wu, Y.; Fan, T.; Jiang, S.; Yang, X.; Ding, H.; Meng, M.; Wei, D. Methane adsorption capacities of the lower paleozoic marine shales in the Yangtze platform, South China. Energy Fuels 2015, 29, 4160–4167. [Google Scholar] [CrossRef]
  43. Wang, D.; Chen, L.L.; He, M.; Mei, X. Characteristics of Shale Gas Produced Water. Environ. Monit. Manag. Technol. 2018, 30, 50–53. (In Chinese) [Google Scholar]
  44. Hu, Y. Mechanism and Experimental Research of Supercritical Carbon Dioxide Fracturing Shale; Wuhan University: Wuhan, China, 2017. (In Chinese) [Google Scholar]
  45. Xu, T.; Sonnenthal, E.; Spycher, N.; Pruess, K. TOUGHREACT—A simulation program for non-isothermal multiphase reactive geochemical transport in variably saturated geologic media: Applications to geothermal injectivity and CO2 geological sequestration. Comput. Geosci. 2006, 32, 145–165. [Google Scholar] [CrossRef]
  46. Xu, T.; Feng, G.; Shi, Y. On fluid–rock chemical interaction in CO2-based geothermal systems. J. Geochem. Explor. 2014, 144, 179–193. [Google Scholar] [CrossRef]
  47. Plampin, M.R.; Neuzil, C.E. Multiphase Flow and Underpressured Shale at the Bruce Nuclear Site, Ontario, Canada; Geological Society, London, Special Publications: Bath, UK, 2018; SP482.5. [Google Scholar] [CrossRef] [Green Version]
  48. Oldenburg, C.M.; Law, D.H.-S.; LeGallo, Y.; White, S.P. Mixing of CO2 and CH4 in gas reservoirs: Code comparison studies. Greenh. Gas Control. Technol. 2003, 1, 443–448. [Google Scholar]
  49. Narasimhan, T.N.; Witherspoon, P.A. An integrated finite difference method for analyzing fluid flow in porous media. Water Resour. Res. 1976, 12, 57–64. [Google Scholar] [CrossRef] [Green Version]
Figure 1. Four kinds of typical shale outcrops where calcite filled with high angle natural fractures were found. (a) High-angle fractures filled with calcite in the Longmaxi Formation, Xishui. (b) High-angle joints filled with calcite in rupture surface of the Wufeng Formation, Qijiang. (c) High-angle fractures in the Longmaxi Formation, Wansheng. (d) Longmaxi Formation horizontal joints fully filled with calcite, Changning.
Minerals 12 00660 g001
Figure 2. Calcite-filled fracture in downhole cores of Longmaxi Formation in Fuling.
Minerals 12 00660 g002
Figure 3. Characteristics of high-resistance fracture and faults of shale in east Sichuan on FMI images (Adapted with permission from Ref. [39]. Copyright 2015, Ke Wu).
Minerals 12 00660 g003
Figure 4. Conceptual diagram of shale with three different calcite filled fractures.
Minerals 12 00660 g004
Figure 5. Bottom temperature and pressure monitoring results of Yan-A well during scCO2 fracturing (Adapted with permission from Ref. [44]. Copyright 2017, Yi Hu).
Minerals 12 00660 g005
Figure 6. Variation in porosity with time for NF specimens at different temperatures under the same pressure of 20 MPa.
Minerals 12 00660 g006
Figure 7. Variation in porosity with time for AF specimens at different temperatures under the same pressure of 20 MPa.
Minerals 12 00660 g007
Figure 8. Variation in porosity with time for TF specimens at different temperatures under the same pressure of 20 MPa.
Minerals 12 00660 g008
Figure 9. Relative increase in final porosity of shale with different fracture patterns after different temperatures over 6 h of scCO2 treatment.
Minerals 12 00660 g009
Figure 10. Variation in porosity with time for NF specimens under different pressures.
Minerals 12 00660 g010
Figure 11. Variation in porosity with time for AF specimens under different pressures.
Minerals 12 00660 g011
Figure 12. Variation in porosity with time for TF specimens under different pressures.
Minerals 12 00660 g012
Figure 13. Relative increase in final porosity for the same action time and temperature.
Minerals 12 00660 g013
Figure 14. Shale cores of 50 mm in diameter and 100 mm in height collected from the same outcrop. Non-English in figure indicate centimeter.
Minerals 12 00660 g014
Figure 15. Specimen seal installed in the pressure chamber.
Minerals 12 00660 g015
Figure 16. Comparison of the relative increase in final porosity obtained from experiments and simulations under different temperature and pressure conditions.
Minerals 12 00660 g016
Figure 17. Comparison of the microscopic surface morphology of three specimens before and after CO2 injection for the validation experiment.
Minerals 12 00660 g017aMinerals 12 00660 g017b
Table 1. Geochemical parameters of produced water from a shale gas field in southwest China.
Test TypeA Area Test ResultC Area Test ResultAverage Result
pH6.41~7.086.61~6.966.50~7.04
K+ (mg/L)240~388261~370250~379
Na+ (mg/L)10,800~21,30010,800~12,90010,800~17,100
Ca2+ (mg/L)942~14581308~19701125~1714
Mg2+ (mg/L)112~188114~145113~167
Ba2+ (mg/L)1000~1346128~148564~747
Sr2+ (mg/L)432~56698~259265~421
Cl (mg/L)18,500~36,80016,200~27,70017,350~32,250
Table 2. Parameter settings for each group of the simulation experiment.
Group No.Temperature/°CInjection Pore Pressure/MPaRemarks
1505
  • Temperature 50 °C and pressure 20 MPa is the typical working condition group.
  • Other parameters are adjusted on this group.
  • Each group is simulated with columnar specimens containing three crack patterns.
210
315
420
530
640
760
Table 3. Experimental validation scheme of multi-field coupling of supercritical CO2 with shale.
No.Specimen
No.
Temperature/°CInjection Pressure/MPaExternal Pressure/MPaConditionsRemarks
13–12502025Fracturing typical filed working conditions
23–13402025Typical working conditions in temperature change.Comparison with typical working condition of group No. 1
33–1450510Not reaching the supercritical stateCompared with group No. 1 and No. 2 which reach the supercritical state
Table 4. Porosity changes before and after the experiment and numerical simulation.
No.Temperature/°CInjection Pressure/MPaPorosity at High Temperature and Pressure before Injection/%Porosity at High Temperature and Pressure after Injection/%Relative Increase in Final Porosity/%Relative Increase in Porosity Obtained from Simulation/%
150203.163.366.29.6
240203.193.385.89.2
35053.423.461.22.0
Publisher’s Note: MDPI stays neutral with regard to jurisdictional claims in published maps and institutional affiliations.

