Article

Fusion of Lineament Factor (LF) Map Analysis and Multifractal Technique for Massive Sulfide Copper Exploration: The Sahlabad Area, East Iran

by
Aref Shirazi
1,
Ardeshir Hezarkhani
1,* and
Amin Beiranvand Pour
2,*
1
Department of Mining Engineering, Amirkabir University of Technology (Tehran Polytechnic), Tehran 1591634311, Iran
2
Institute of Oceanography and Environment (INOS), University Malaysia Terengganu (UMT), Kuala Nerus 21030, Terengganu, Malaysia
*
Authors to whom correspondence should be addressed.
Minerals 2022, 12(5), 549; https://doi.org/10.3390/min12050549
Submission received: 18 March 2022 / Revised: 22 April 2022 / Accepted: 26 April 2022 / Published: 28 April 2022

Abstract

:
Fault systems are characteristically one of the main factors controlling massive sulfide mineralization. The main objective of this study was to investigate the relationship between fault systems and host lithology with massive sulfide copper mineralization in the Sahlabad area, South Khorasan province, east of Iran. Subsequently, the rose diagram analysis, Fry analysis, lineament factor (LF) map analysis and multifractal technique were implemented for geological and geophysical data. Airborne geophysical analysis (aeromagnetometric data) was executed to determine the presence of intrusive and extrusive masses associated with structural systems. Accordingly, the relationship between the formation boundaries and the fault system was understood. Results indicate that the NW-SE fault systems are controlling the lithology of the host rock for copper mineralization in the Sahlabad area. Hence, the NW-SE fault systems are consistent with the main trend of lithological units related to massive sulfide copper mineralization in the area. Additionally, the distance of copper deposits, mines and indices in the Sahlabad area with fault systems was calculated and interpreted. Fieldwork results confirm that the NW-SE fault systems are entirely matched with several massive sulfide copper mineralizations in the area. This study demonstrates that the fusion of lineament factor (LF) map analysis and multifractal technique is a valuable and inexpensive approach for exploring massive sulfide mineralization in metallogenic provinces.

1. Introduction

The spatial distribution of mineral reserves is controlled by various parameters [1,2]. The most important controllers of ore mineralization distribution at regional scale are host-rock lithology, intrusive or extrusive masses and structural systems [3,4]. Therefore, to identify areas of mineral potential, determining the relationship between mineralization and structural features is of great importance [5,6,7]. Numerous studies analyzed the relationship between structural features controlling mineralization and the spatial distribution of mineral resources [7,8,9,10,11]. The purpose of these studies was to extract exploratory keys to identify new high-potential areas [8]. The relationship between structural features such as the fault system and ore mineralization has been identified through various methods such as fractal analysis, fault density mapping and combining this information with geochemical layers and remote sensing data [9,10,11,12,13]. In the regions where field information has not been collected, remote sensing surveys are used to identify lineaments such as faults and fractures [13,14,15]. Simultaneous use of aeromagnetic data analysis with remote sensing data helps to generate an accurate structural map [16,17,18,19,20]. In the case of structural field data collected and mapped by geologists, the analysis of behavior and impact of structural systems, especially major faults in the spatial distribution of mineralization, could be performed using analytical methods such as fault density mapping and the analytic hierarchy process (AHP) decision method in combination with other information layers [21]. Multifractal analysis, rose diagram analysis and Fry analysis were used in fault interpretation and determining the relationship between mineralization and the fault system [22,23,24,25,26].
Massive sulfide mineralization is typically associated with regional fault systems, which are documented in many regions such as the Main Urals Fault (MUF), South Urals, the Selwyn Basin, Canada and the North Australian Craton [27,28,29]. The Sahlabad area located in South Khorasan province, east of Iran, has a large number of copper mines, deposits and indices (Figure 1A). Mesgaran ore deposit is one of the biggest copper mineralizations (Cyprus-type massive sulfide) in the study area, in which the regional fault system acts as a controlling structural factor for copper mineralization [30,31,32]. According to the volume, extent and trend of their distribution in the region, to identify the mineralization potentials of copper in this area, structural controlling factors and their relationship with mineralization zones need to be determined.
In the present study, in order to analyze the relationship between the fault system and massive sulfide copper mineralization in the Sahlabad area, rose diagram analysis, Fry analysis, multifractal technique and lineament factor (LF) map were implemented. To investigate the host-rock lithological trend, aeromagnetic data analysis was also used. Thus, the main faults controlling the host lithology trend and playing a key role to determine the spatial distribution of mineralization were identified. Finally, fractal analysis was used to extract more detailed characteristics of the relationship between the fault system and the mineralization distribution in the area. Consequently, high-potential areas were categorized in terms of control by the fault system and the relationship of each mineralization point with the map of the nearest community of high-intensity LFs. This approach provides innovative and valuable information about the fault systems controlling massive sulfide copper mineralization in the study area. The main objectives of this investigation were: (1) to provide a rose diagram analysis for fault systems in the region including major faults, minor faults, inferred faults, thrust faults; (2) to apply Fry analysis to the spatial distribution of mineralization points in the region; (3) to perform airborne magnetometric analysis to identify deep faults controlling the host lithology trend; and (4) to generate a lineament factor (LF) map and concentration–area (C-A) fractal analysis to classify different LF communities.

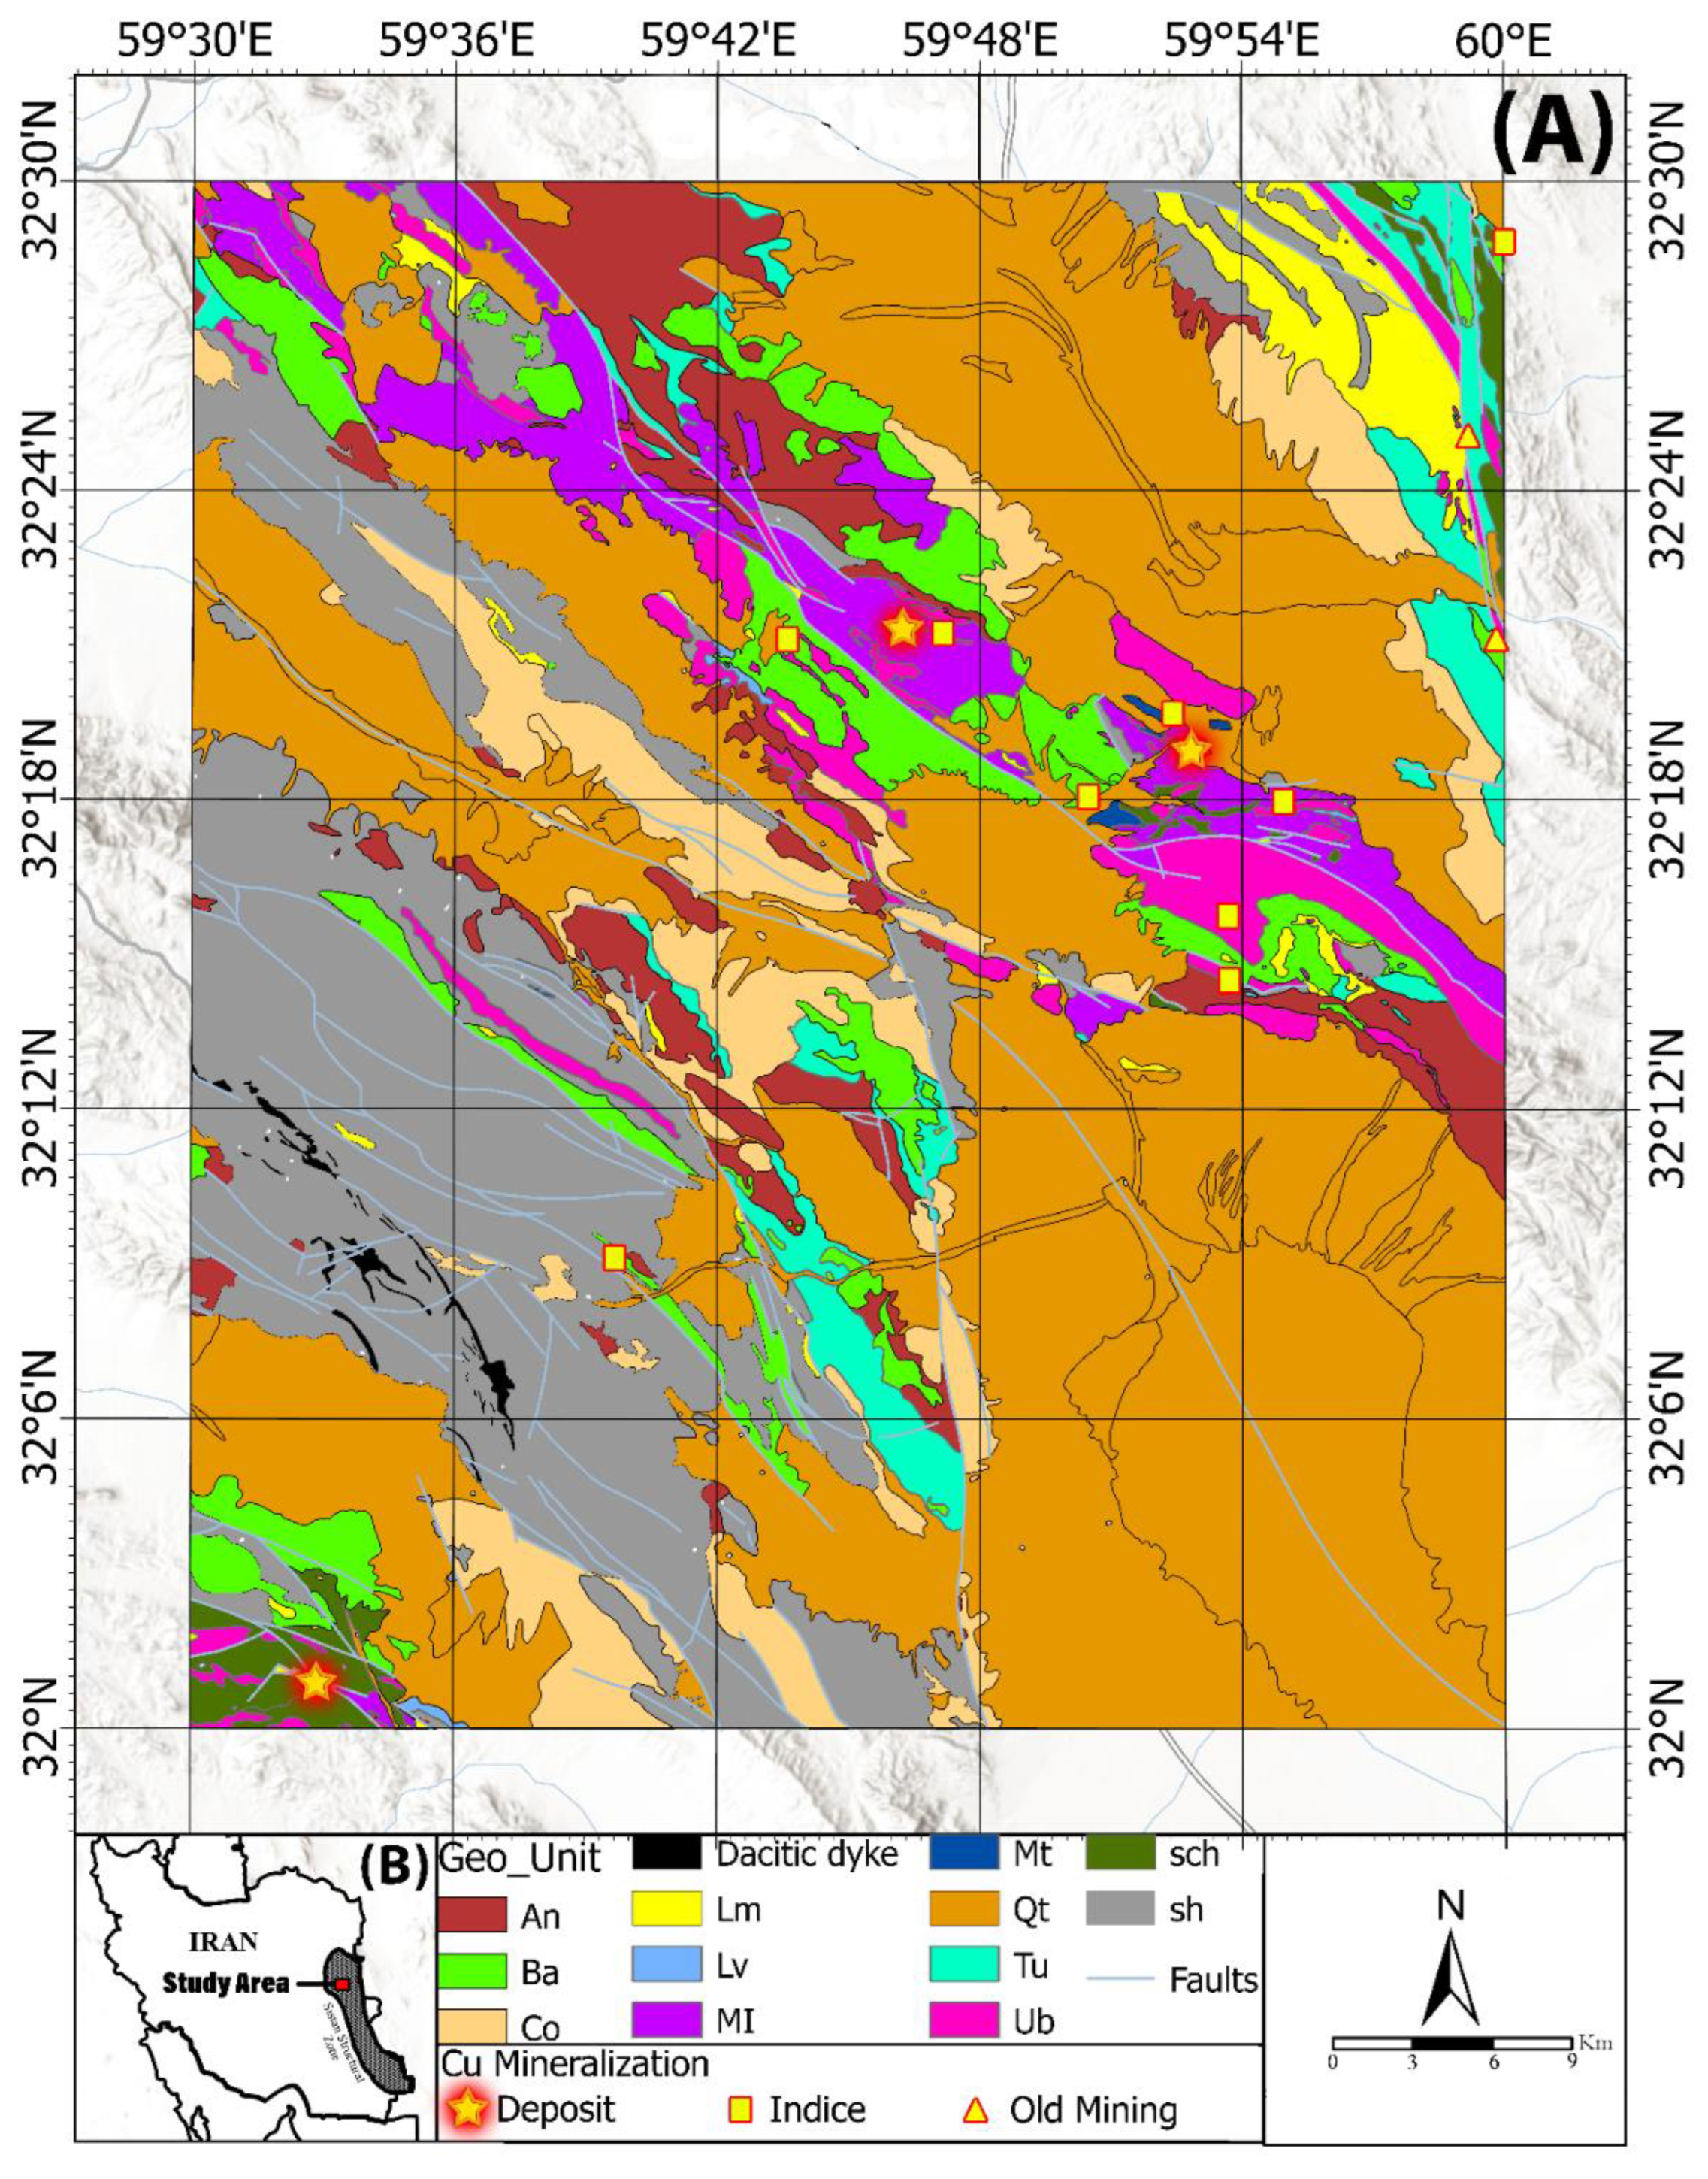
2. Geology of the Study Area

The Sahlabad area is located in the east of Iran and South Khorasan province. It is positioned between longitudes 59°30′ E to 60° E and latitudes 32° to 32°30′ N (Figure 1A,B). The study area is completely located in the flysch belt and ophiolite melange in the Sistan structural zone of eastern Iran [33]. This structural zone is situated between the Nehbandan fault (in the west) and Harirod fault (in the east) and is 800 km long and 200 km wide [34,35]. Based on the geological map of Sahlabad, the regional faults of the area are divided into four categories: major faults, minor faults, inferred faults and thrust faults. This zone has undergone evolutionary stages from oceanic to continental crust and is one of the derivations of the “young Tethys” type [35,36,37]. In this area, igneous, metamorphic and sedimentary lithological units related to the Late Cretaceous to Neogene are exposed [38]. The Sahlabad area is entirely located in the flysch and colored melange belt of eastern Iran. The geological formations observed in the area include rocks with the characteristics of this belt, which are attributed to the Upper Cretaceous and Lower Tertiary, and the volcanic cover and younger Tertiary sediments [36].

2.1. Regional Tectonics

The Sahlabad area belongs to the ophiolitic melanges and flysch belts of eastern Iran and is located in the Lut structural block. The main trend of the belt is north-south, which gradually changes to the southeast-northwest. The intense folding of the flysch deposits and the irregular structure of the melange complexes indicate high compaction in the area [40]. The most severe crustal deformation has occurred at the southwestern tip of the region, where a narrow zone of thrust and metamorphosis (metamorphic ophiolitic melanges) indicates the close connection of the flysch and ophiolitic melanges belt to the Lut structural block. Folding and crushing, along with tilting, which results in a random mixing of different types of rock, characterize the ophiolitic melange complexes of the region [41]. Narrow and intense folding and longitudinal faulting with post-Middle Eocene (Oligocene) age have affected the volcanic and sedimentary formations of the Paleogene. The Cretaceous-era Zar-Kooh mountain flysches are trusted on the Eocene sediments of Bezo Mountain in a southwesterly direction [37,38]. The uniform tectonical motions create a system of parallel mountain ranges and the depressions between them that characterize the current topography. Neogene deposition in the depressions has led to moderate folding and minor faults [33,36]. Andesites and basalts, as representative of the youngest volcanic rocks (Neogene, probably Early Quaternary), show soft tilt (with a slope of about 20°) in the lower units and with a semi-real position in the higher units [34,35].

2.2. Copper Mineralization in the Study Area

Due to the diversity of lithology consisting of ultrabasic, alkaline-based volcanic, intermediate and acidic rock units, metamorphic rocks, listwanites and other rock units in the Sahlabad area, there are mineralization potentials for copper, gold, nickel, chromium and magnesite. Old mining activity and excavations have been reported in the study area. Copper mineralization in the study region (mines, deposits and indices) was investigated and classified from various reports obtained from exploratory studies in the Sahlabad area, such as geological map reports, economic geology reports, preliminary and detailed exploration reports of mineral areas, etc., [39,42,43,44,45,46]. The location of copper mines, deposits and indices in the Sahlabad area are marked on the geology map (Figure 1A). Copper mineralizations such as malachite, chalcopyrite and chalcocite were observed and documented in the study area. Figure 2A–F show polished sections of copper mineralizations selected from the Mesgaran deposit, Chah-Rasteh deposit and Zahri deposit. Classified information about 14 copper mineralization zones in the Sahlabad area is presented in Table 1.

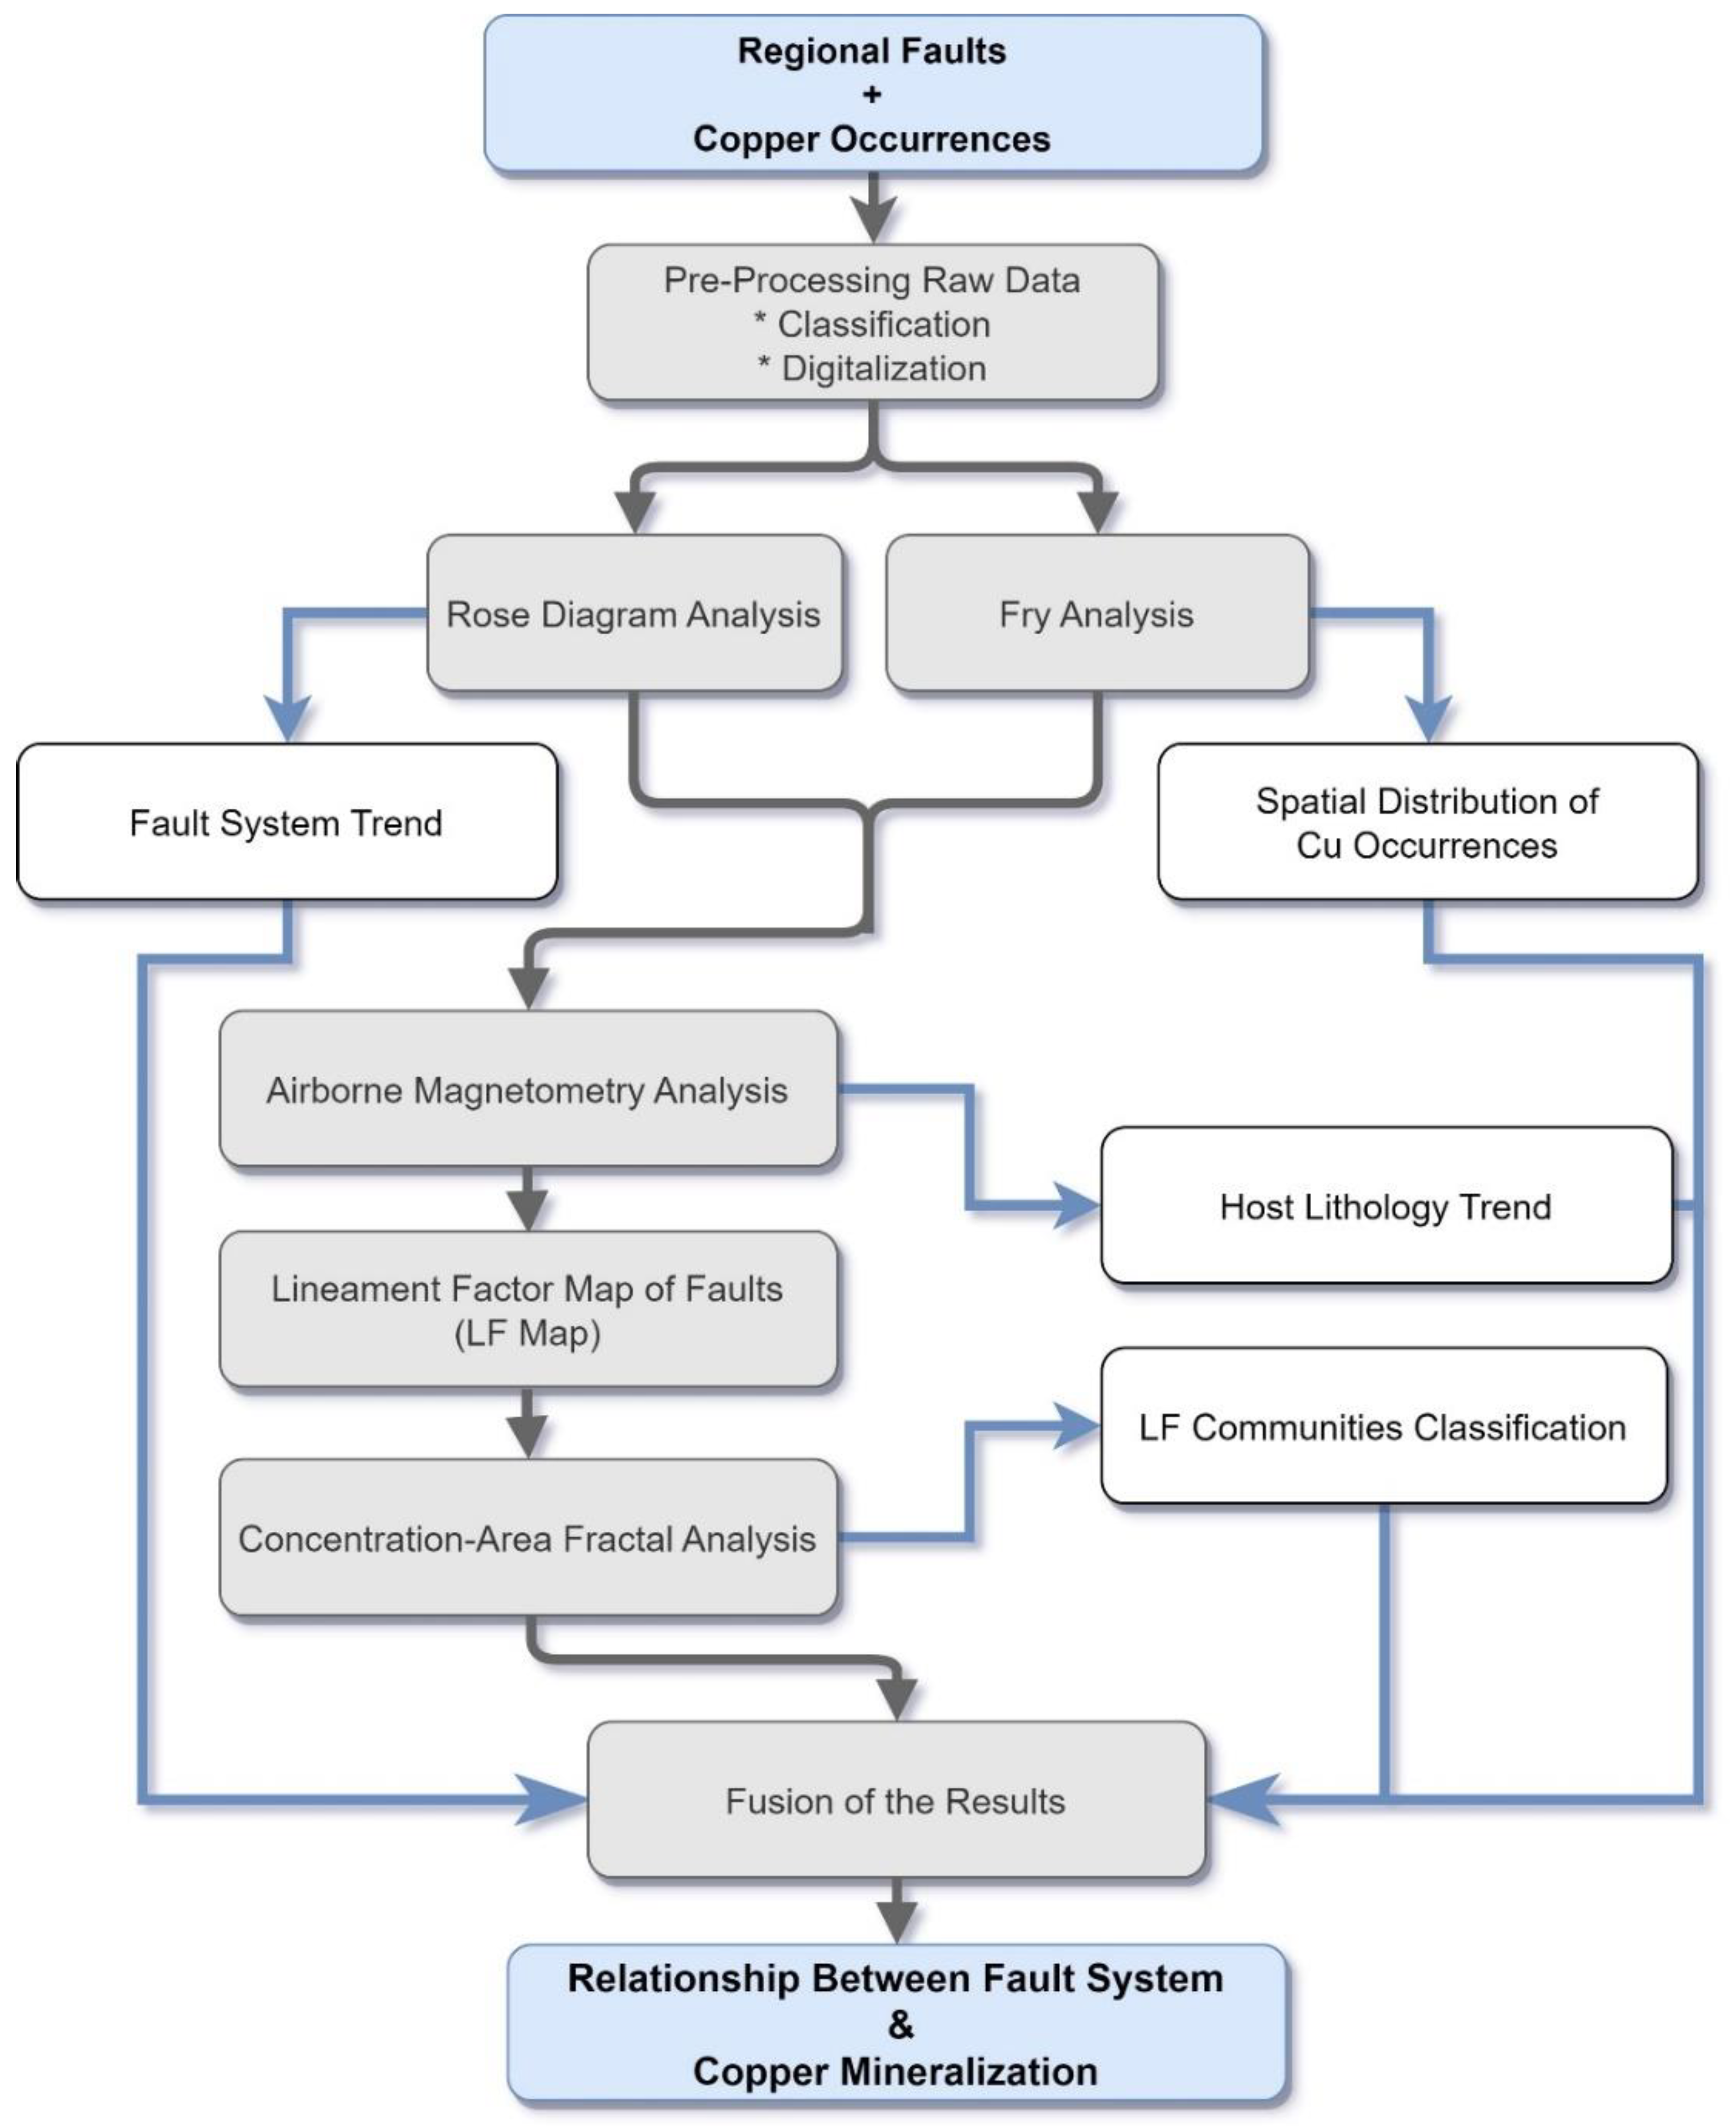
3. Materials and Methods

3.1. Geology and Geophysical Data

Geological data, including lithological map of area, structural features (fault system and lineaments) and location of copper ore deposits, old mines and indices were collected from the reports of the Geological Survey of Iran (GSI) as well as the Ministry of Industry, Mines and Trade of Iran [39,42,47]. Network data of 7.5 km of Iranian airborne magnetometry between 1974 and 1976 were commissioned by the Geological Survey of Iran (GSI) by the American company Aero Service, one of the largest companies active in the field of airborne geophysics at that time. The distance between the flight lines was 7.5 km, the fixed flight altitude was 300 m above the ground, and the distance between the vertical flight control lines was 40 km. The aircraft used to record this data was a twin-engine aircraft with a cesium vapor magnetometer mounted on it (with sensitivity of 0.002 nT). This data collection was performed in 62 separate flight blocks and was presented at an acceptable level in terms of quality [48]. An overview of methodological flowchart is presented in Figure 3.

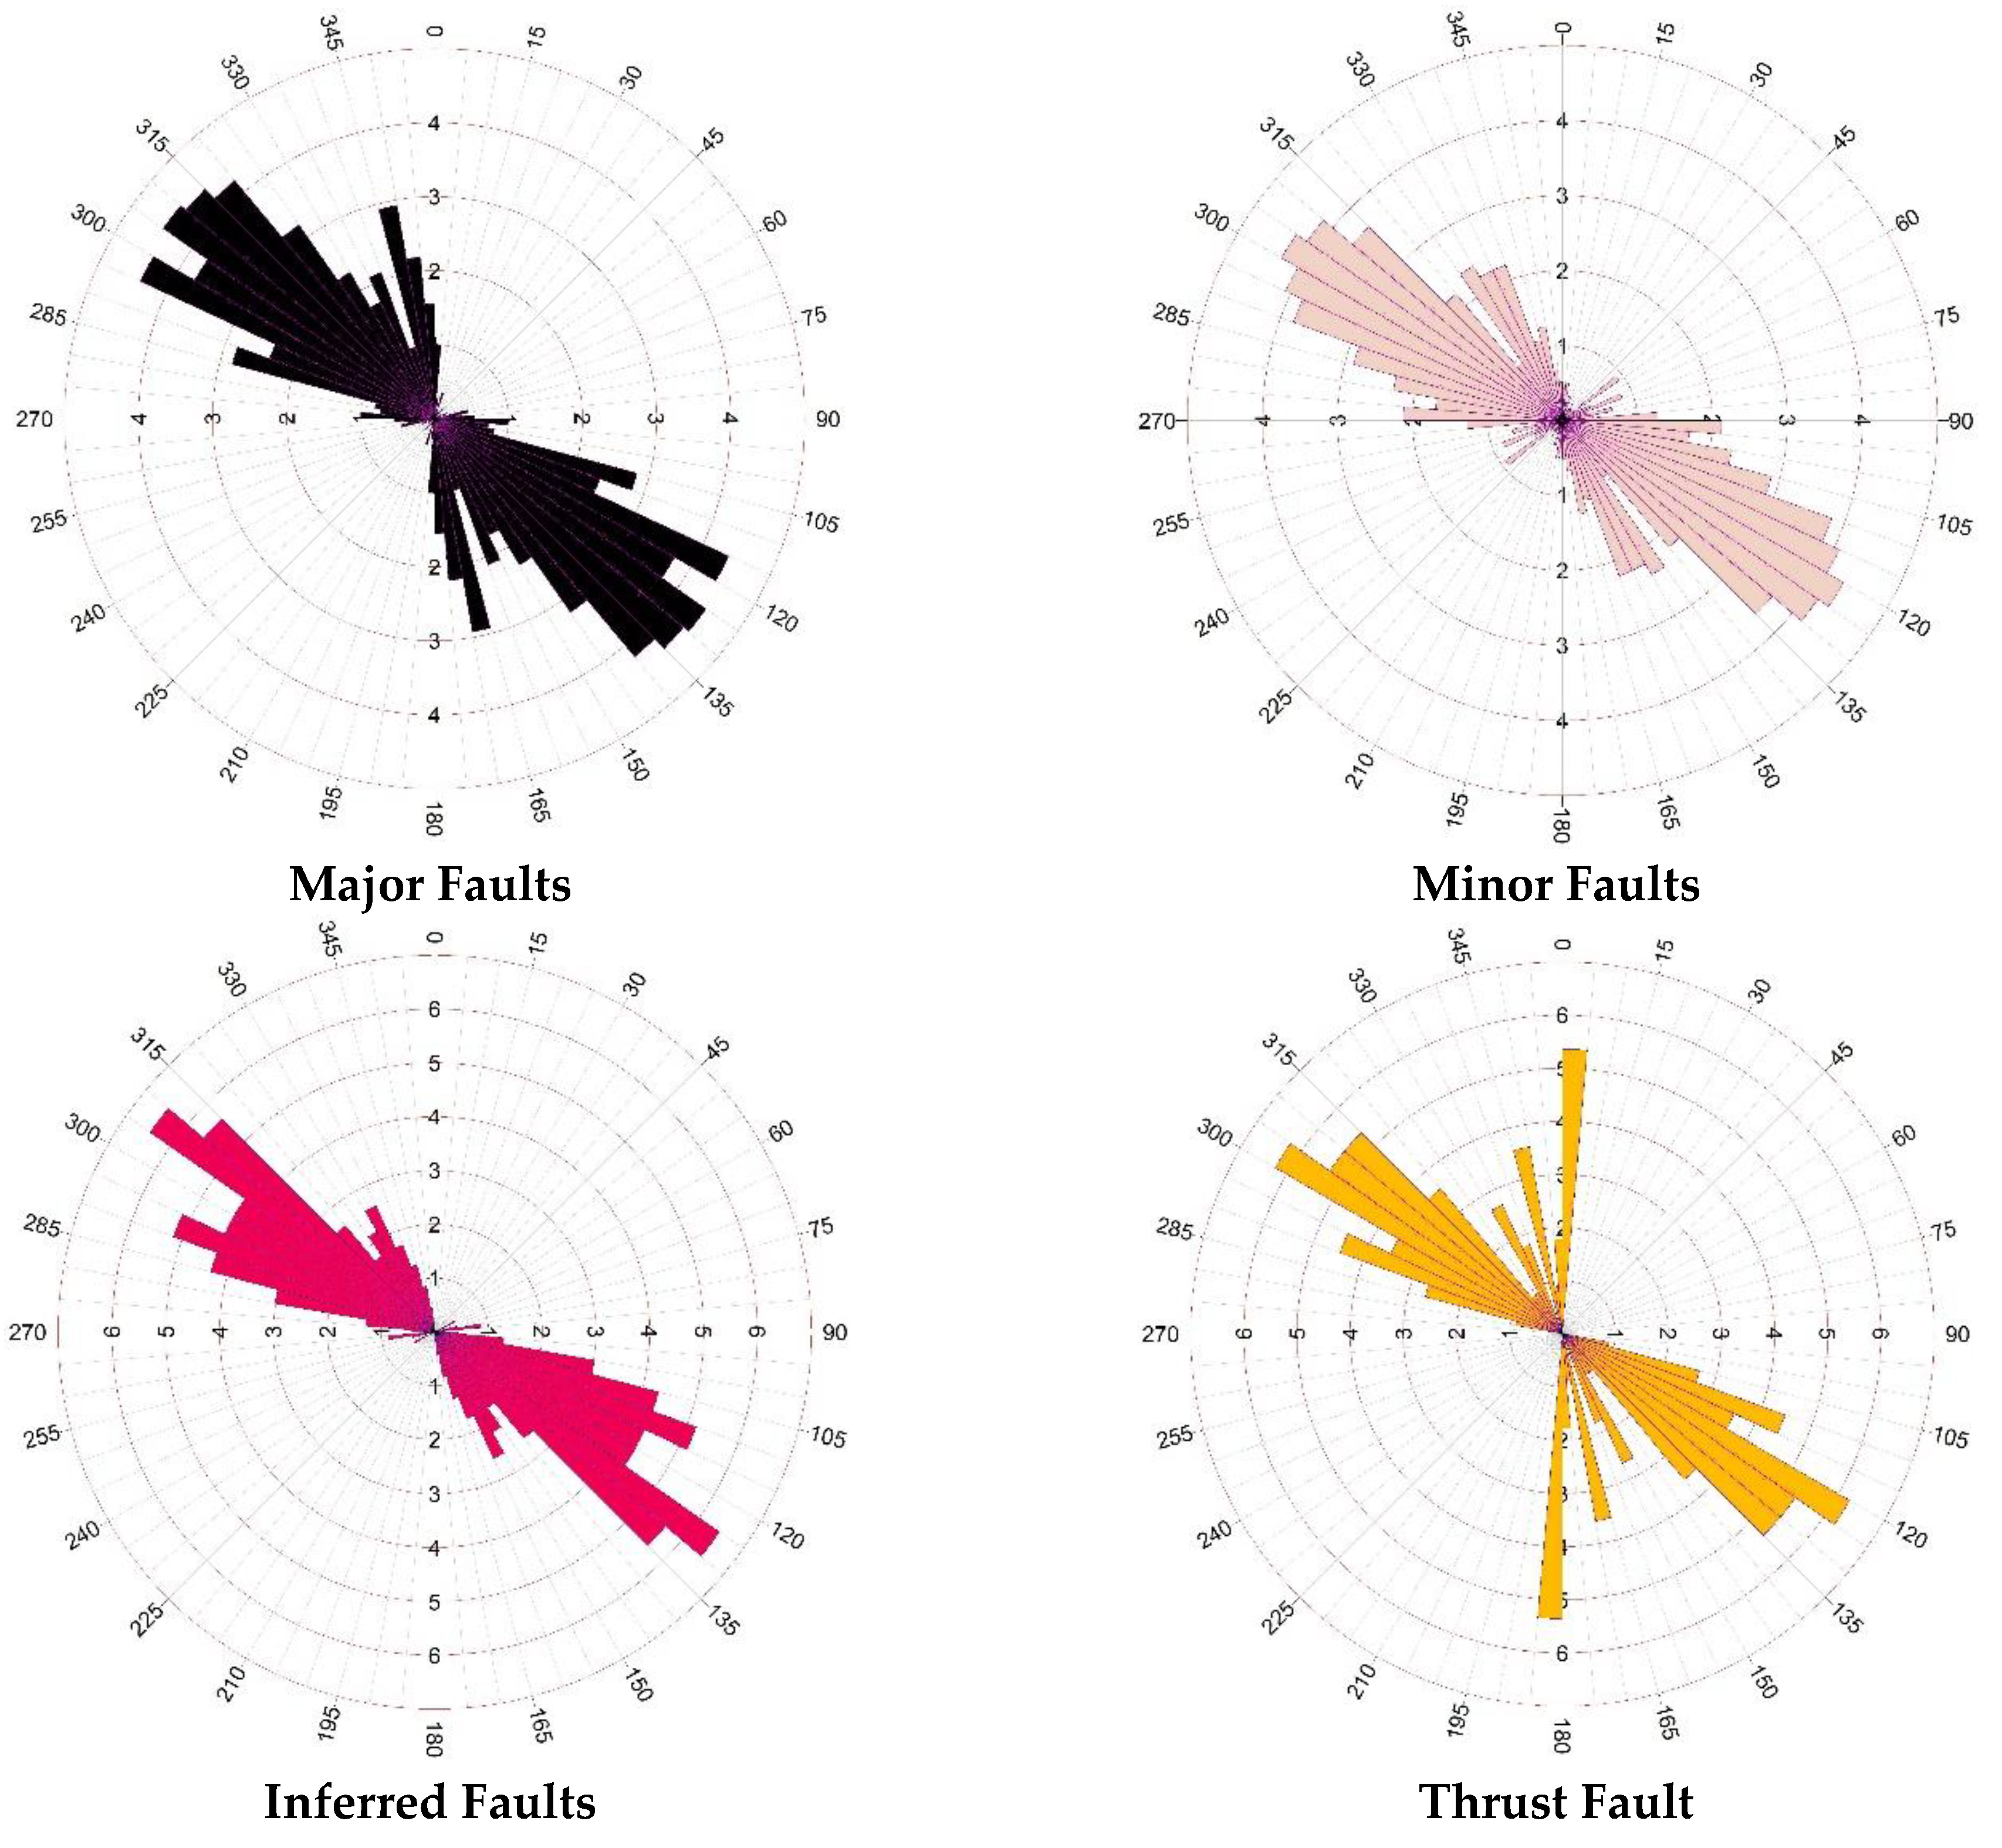
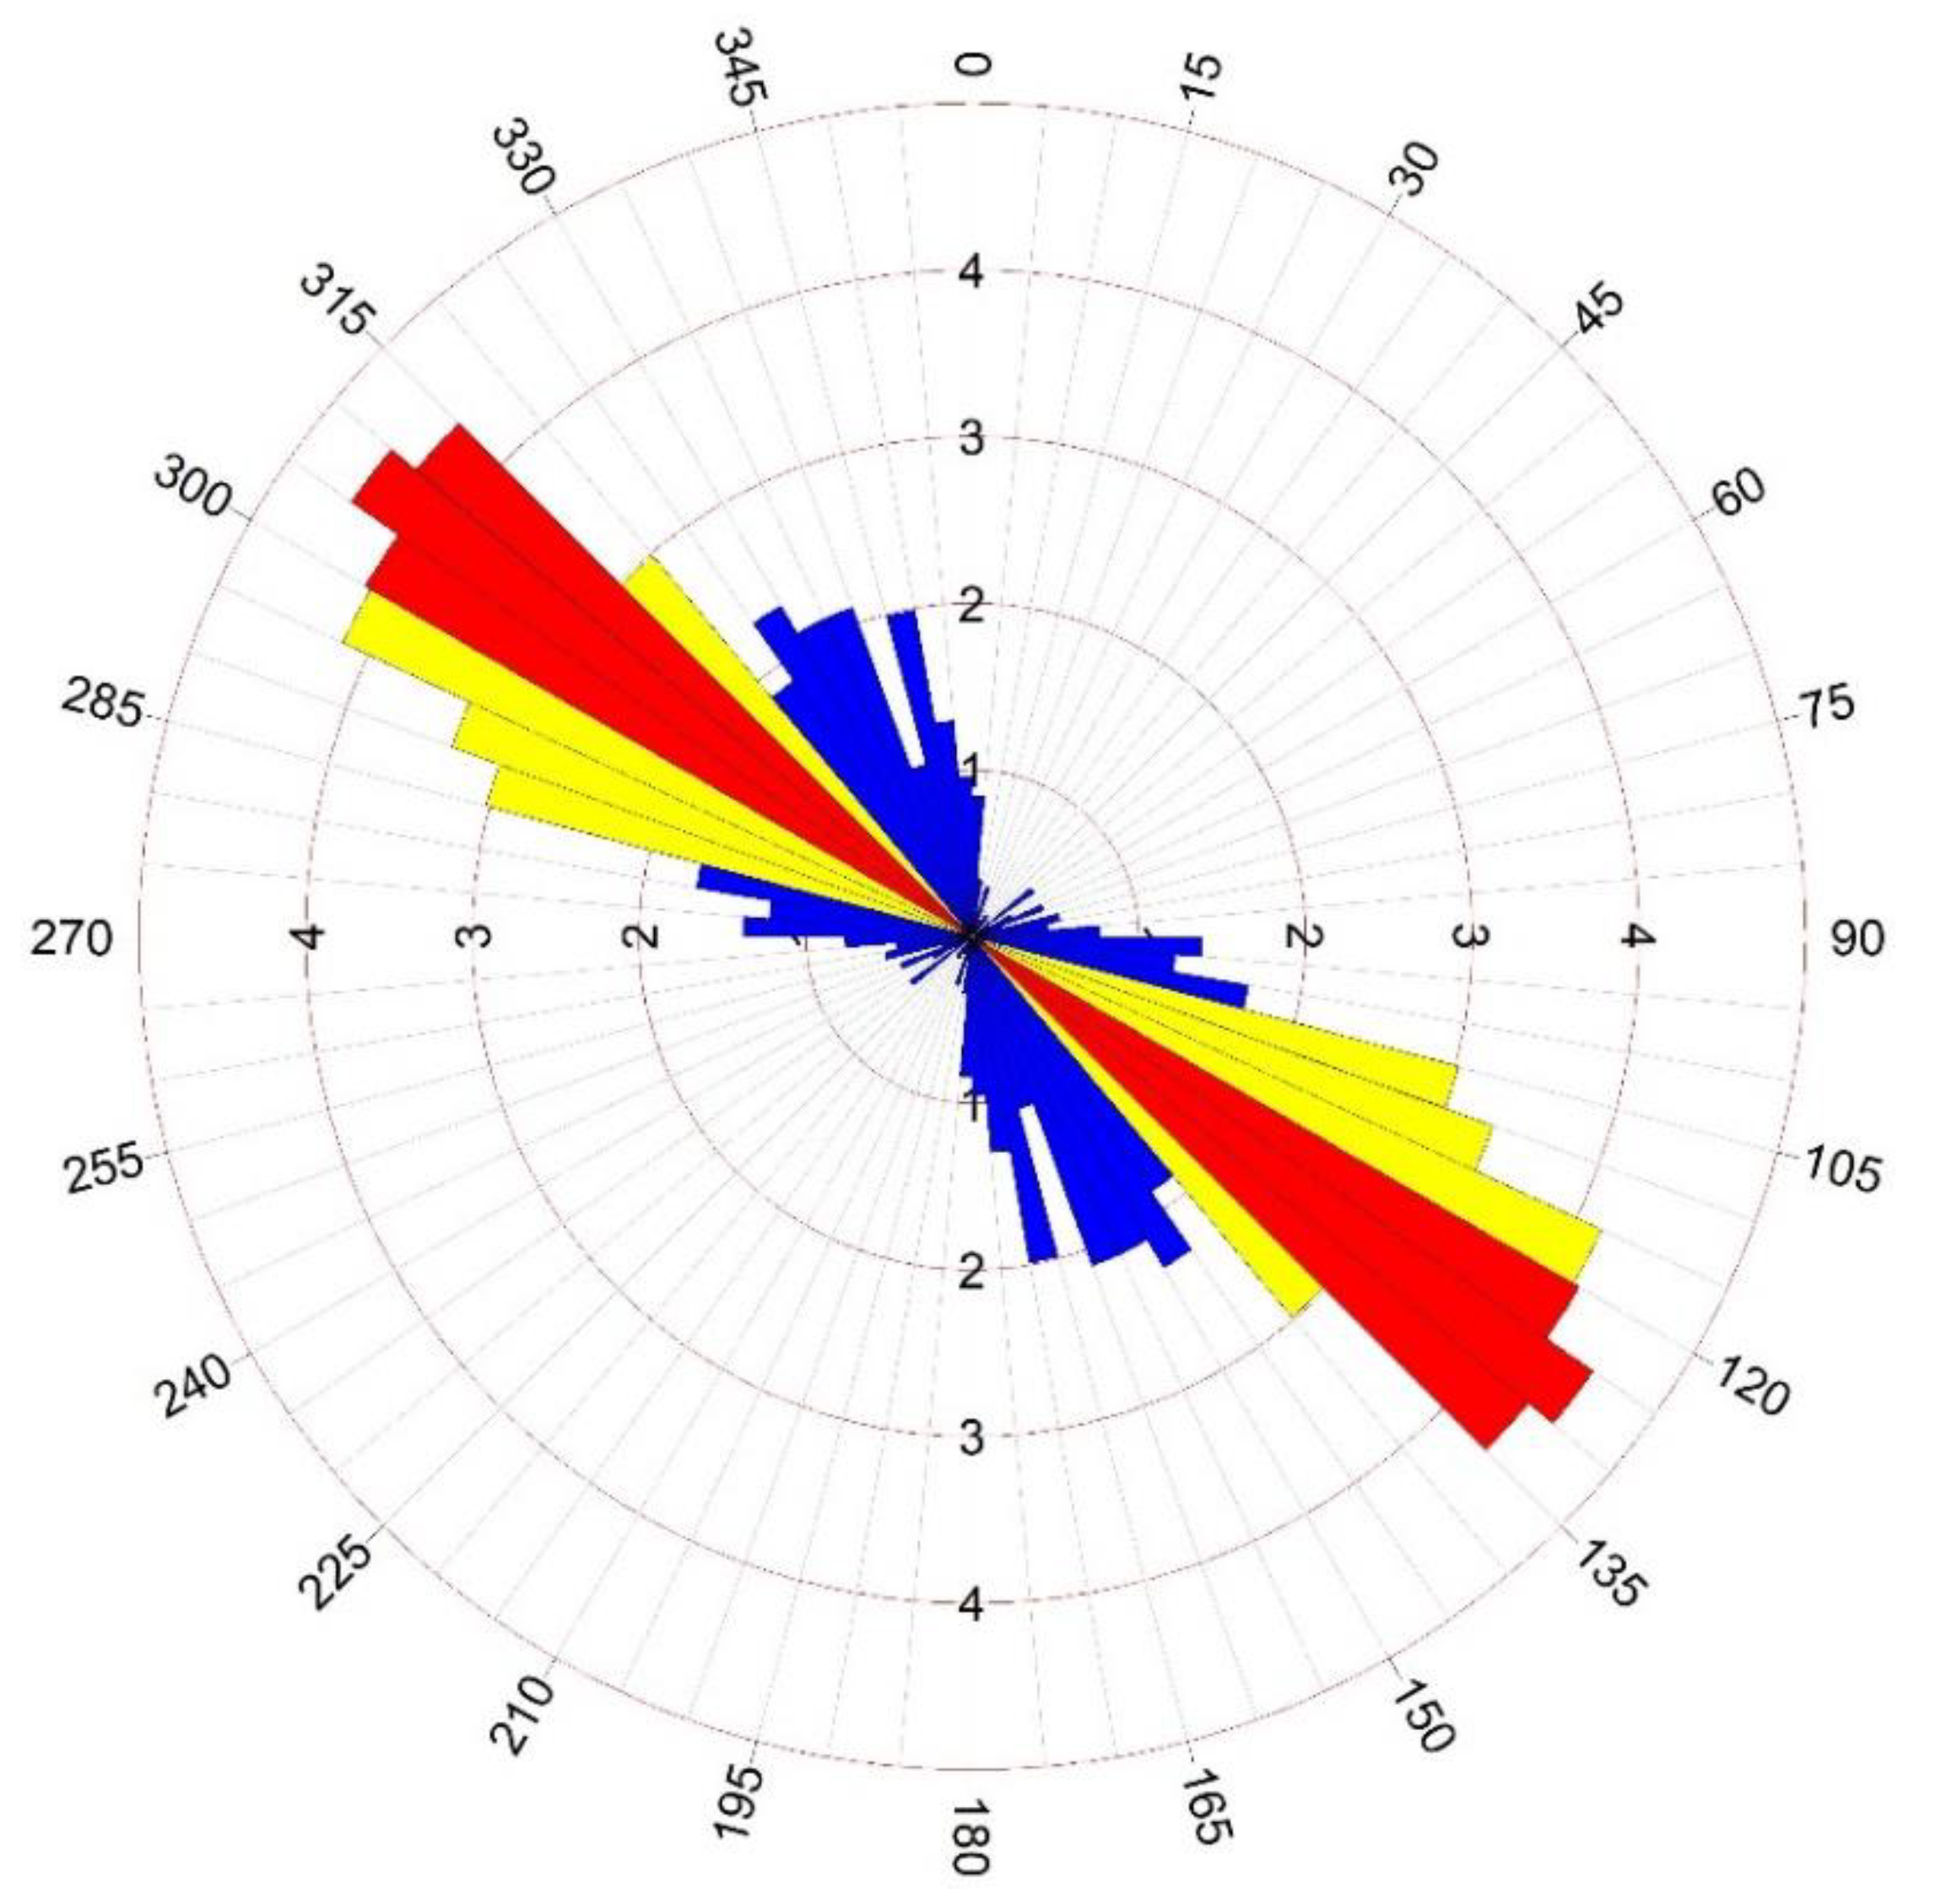
3.2. Rose Diagram Analysis
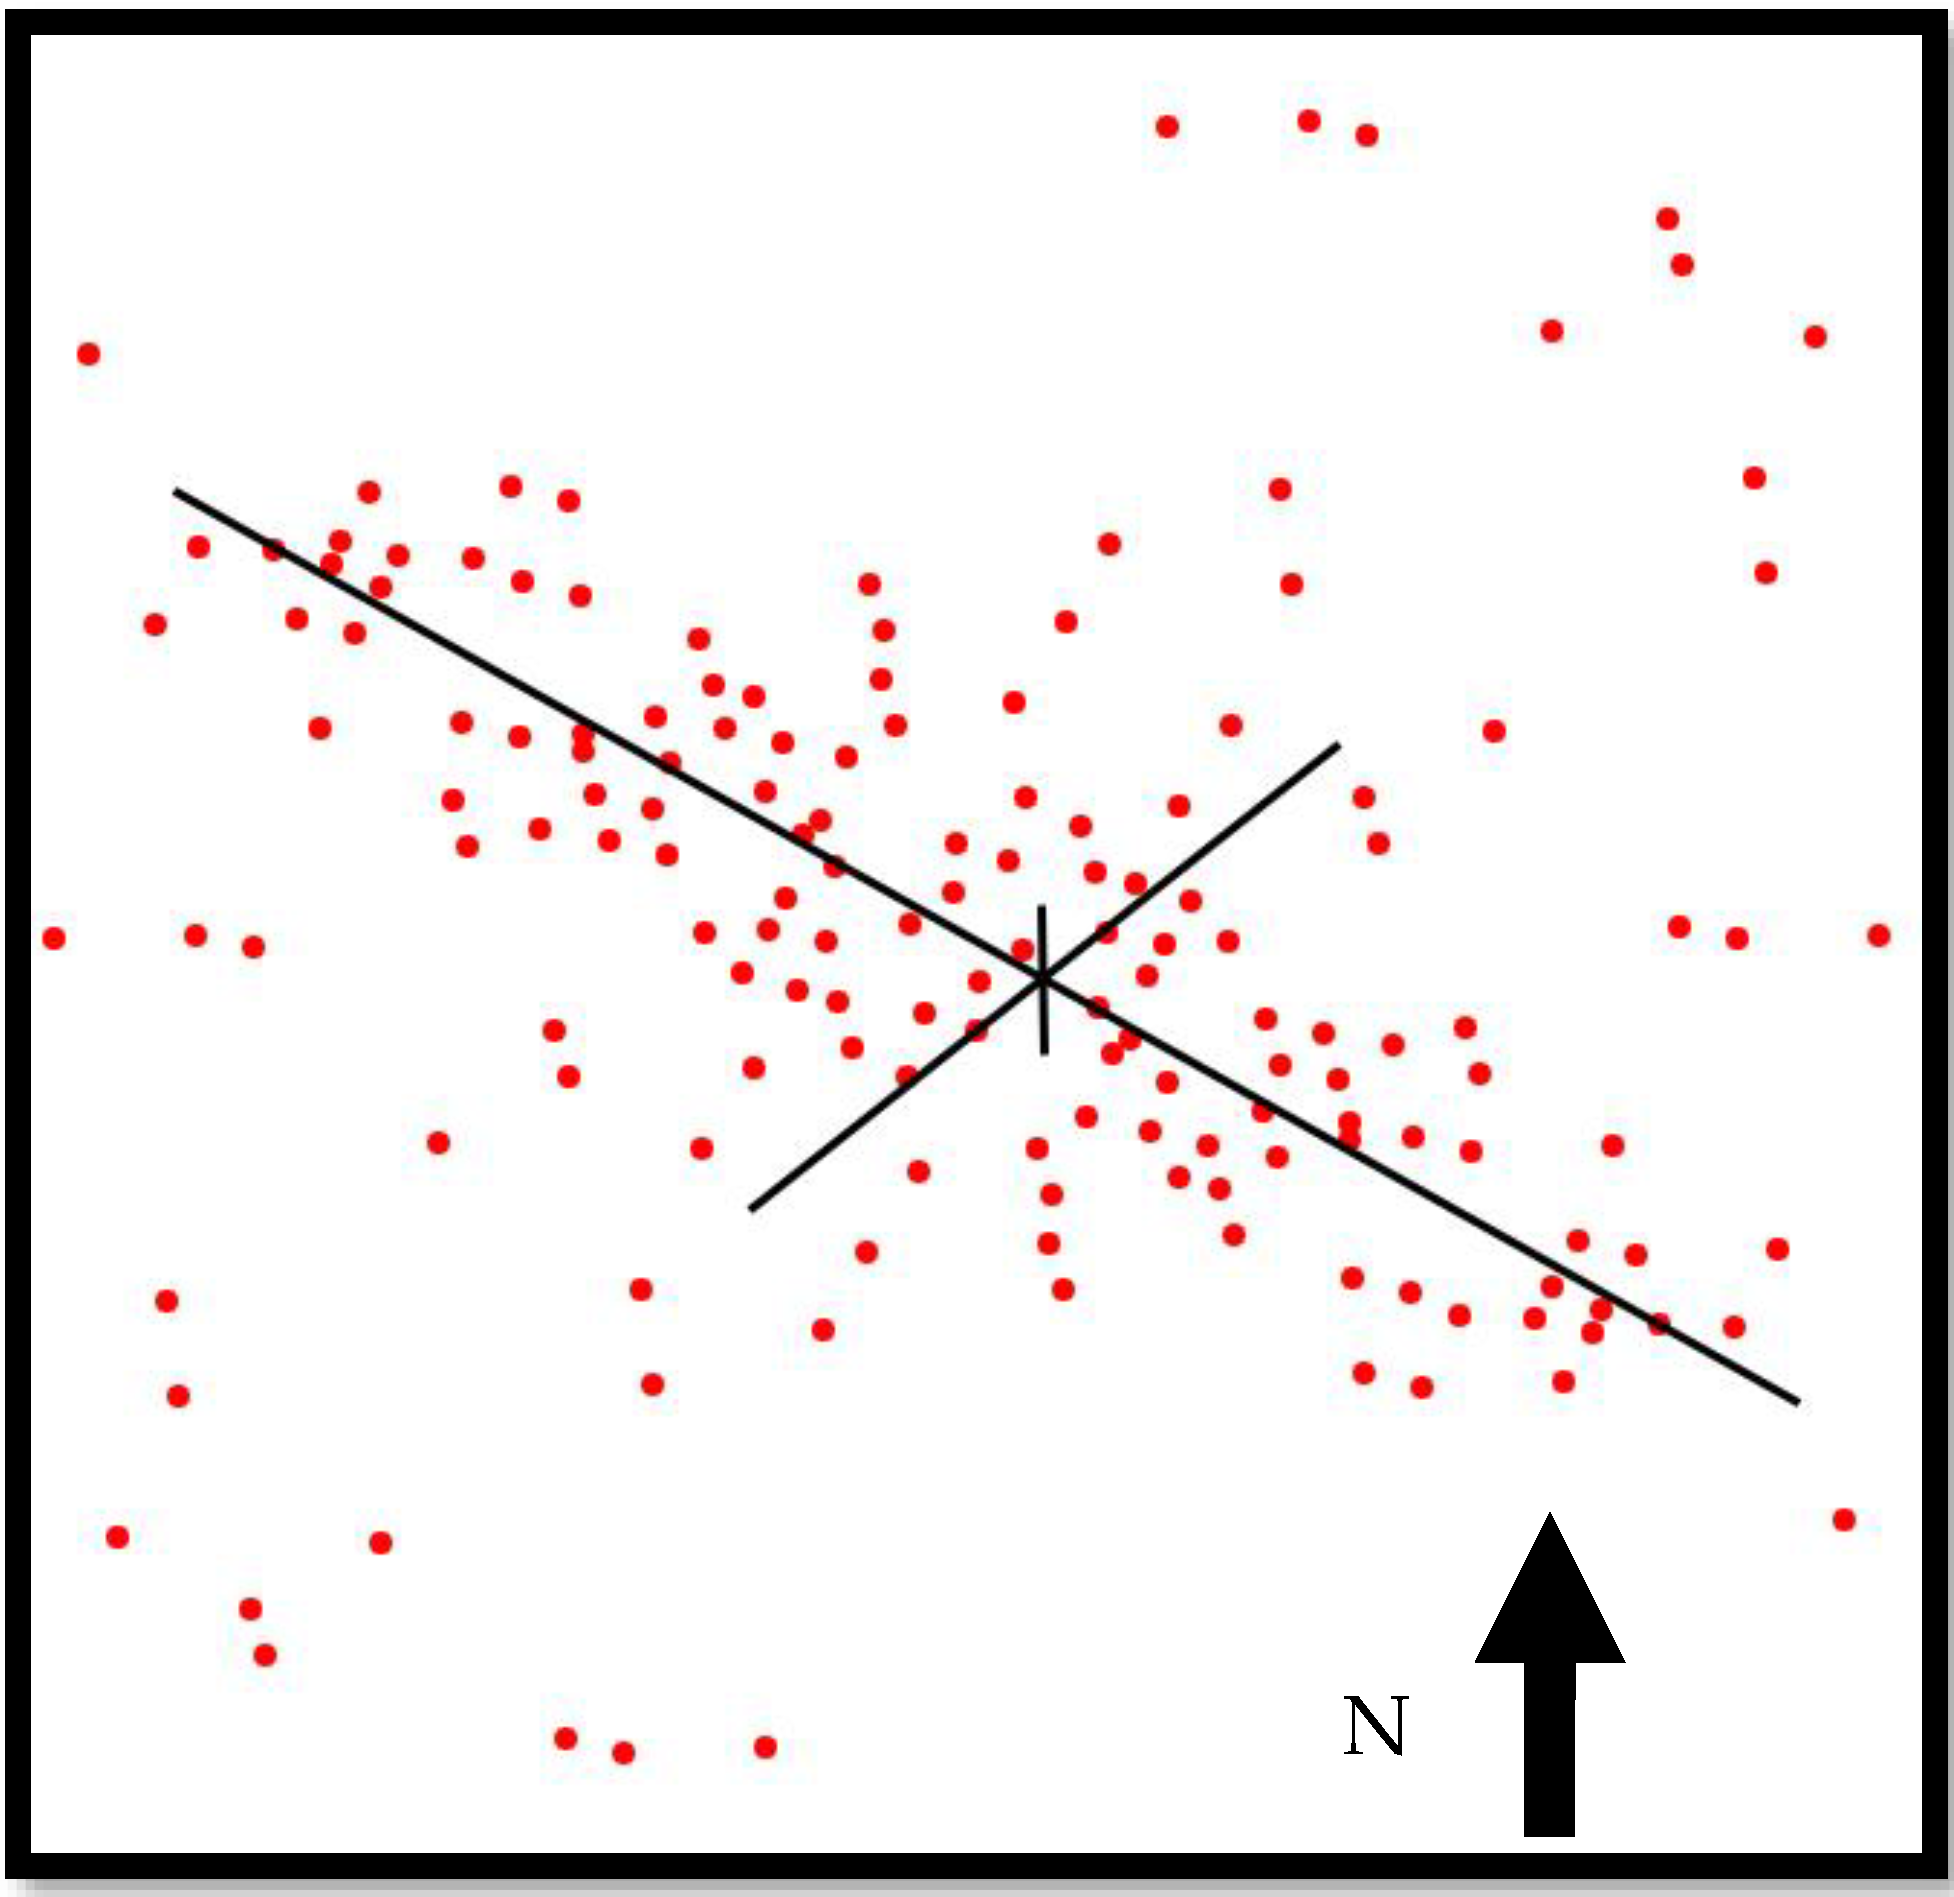
Rose diagram is a type of circular histogram used to display directional data and the repetition rate of each category. This diagram is used in structural geology to show the trend of faults, fractures, lineaments and dykes [49,50]. In this study, rose diagram analysis was used to investigate the trend of faults in the Sahlabad region, which was subsequently compared to copper mineralization information as well as the host lithology trend. By analyzing the trend of faults and lithology, as well as the trend of copper mineralization in the area, it is possible to find out the effect of controlling faults [51,52].

3.3. Fry Analysis

Fry analysis is a complementary method in structural geological studies, which can be used to study the distribution of mineralization in a region and its relationship with linear structures. In other words, the application of Fry analysis method is useful in linear and directional analysis. This analysis is used to investigate the patterns of mineralization dispersion at the regional scale and also to describe mineralization zones, such as the direction of mineralization, for high-grade zones and the distribution of grade at a deposit scale [53,54,55]. Spatial distribution of mines, deposits and mineral indices is affected by factors such as formation environment, host rocks and other mineralization factors as well as structural controllers such as faults. Considering the importance of information about the spatial distribution of mineralizations, which is an important factor in regional exploration and mineral potential detection, in this study, the role of structural controllers in the spatial distribution of copper mineralization in Sahlabad area was investigated [56,57,58].

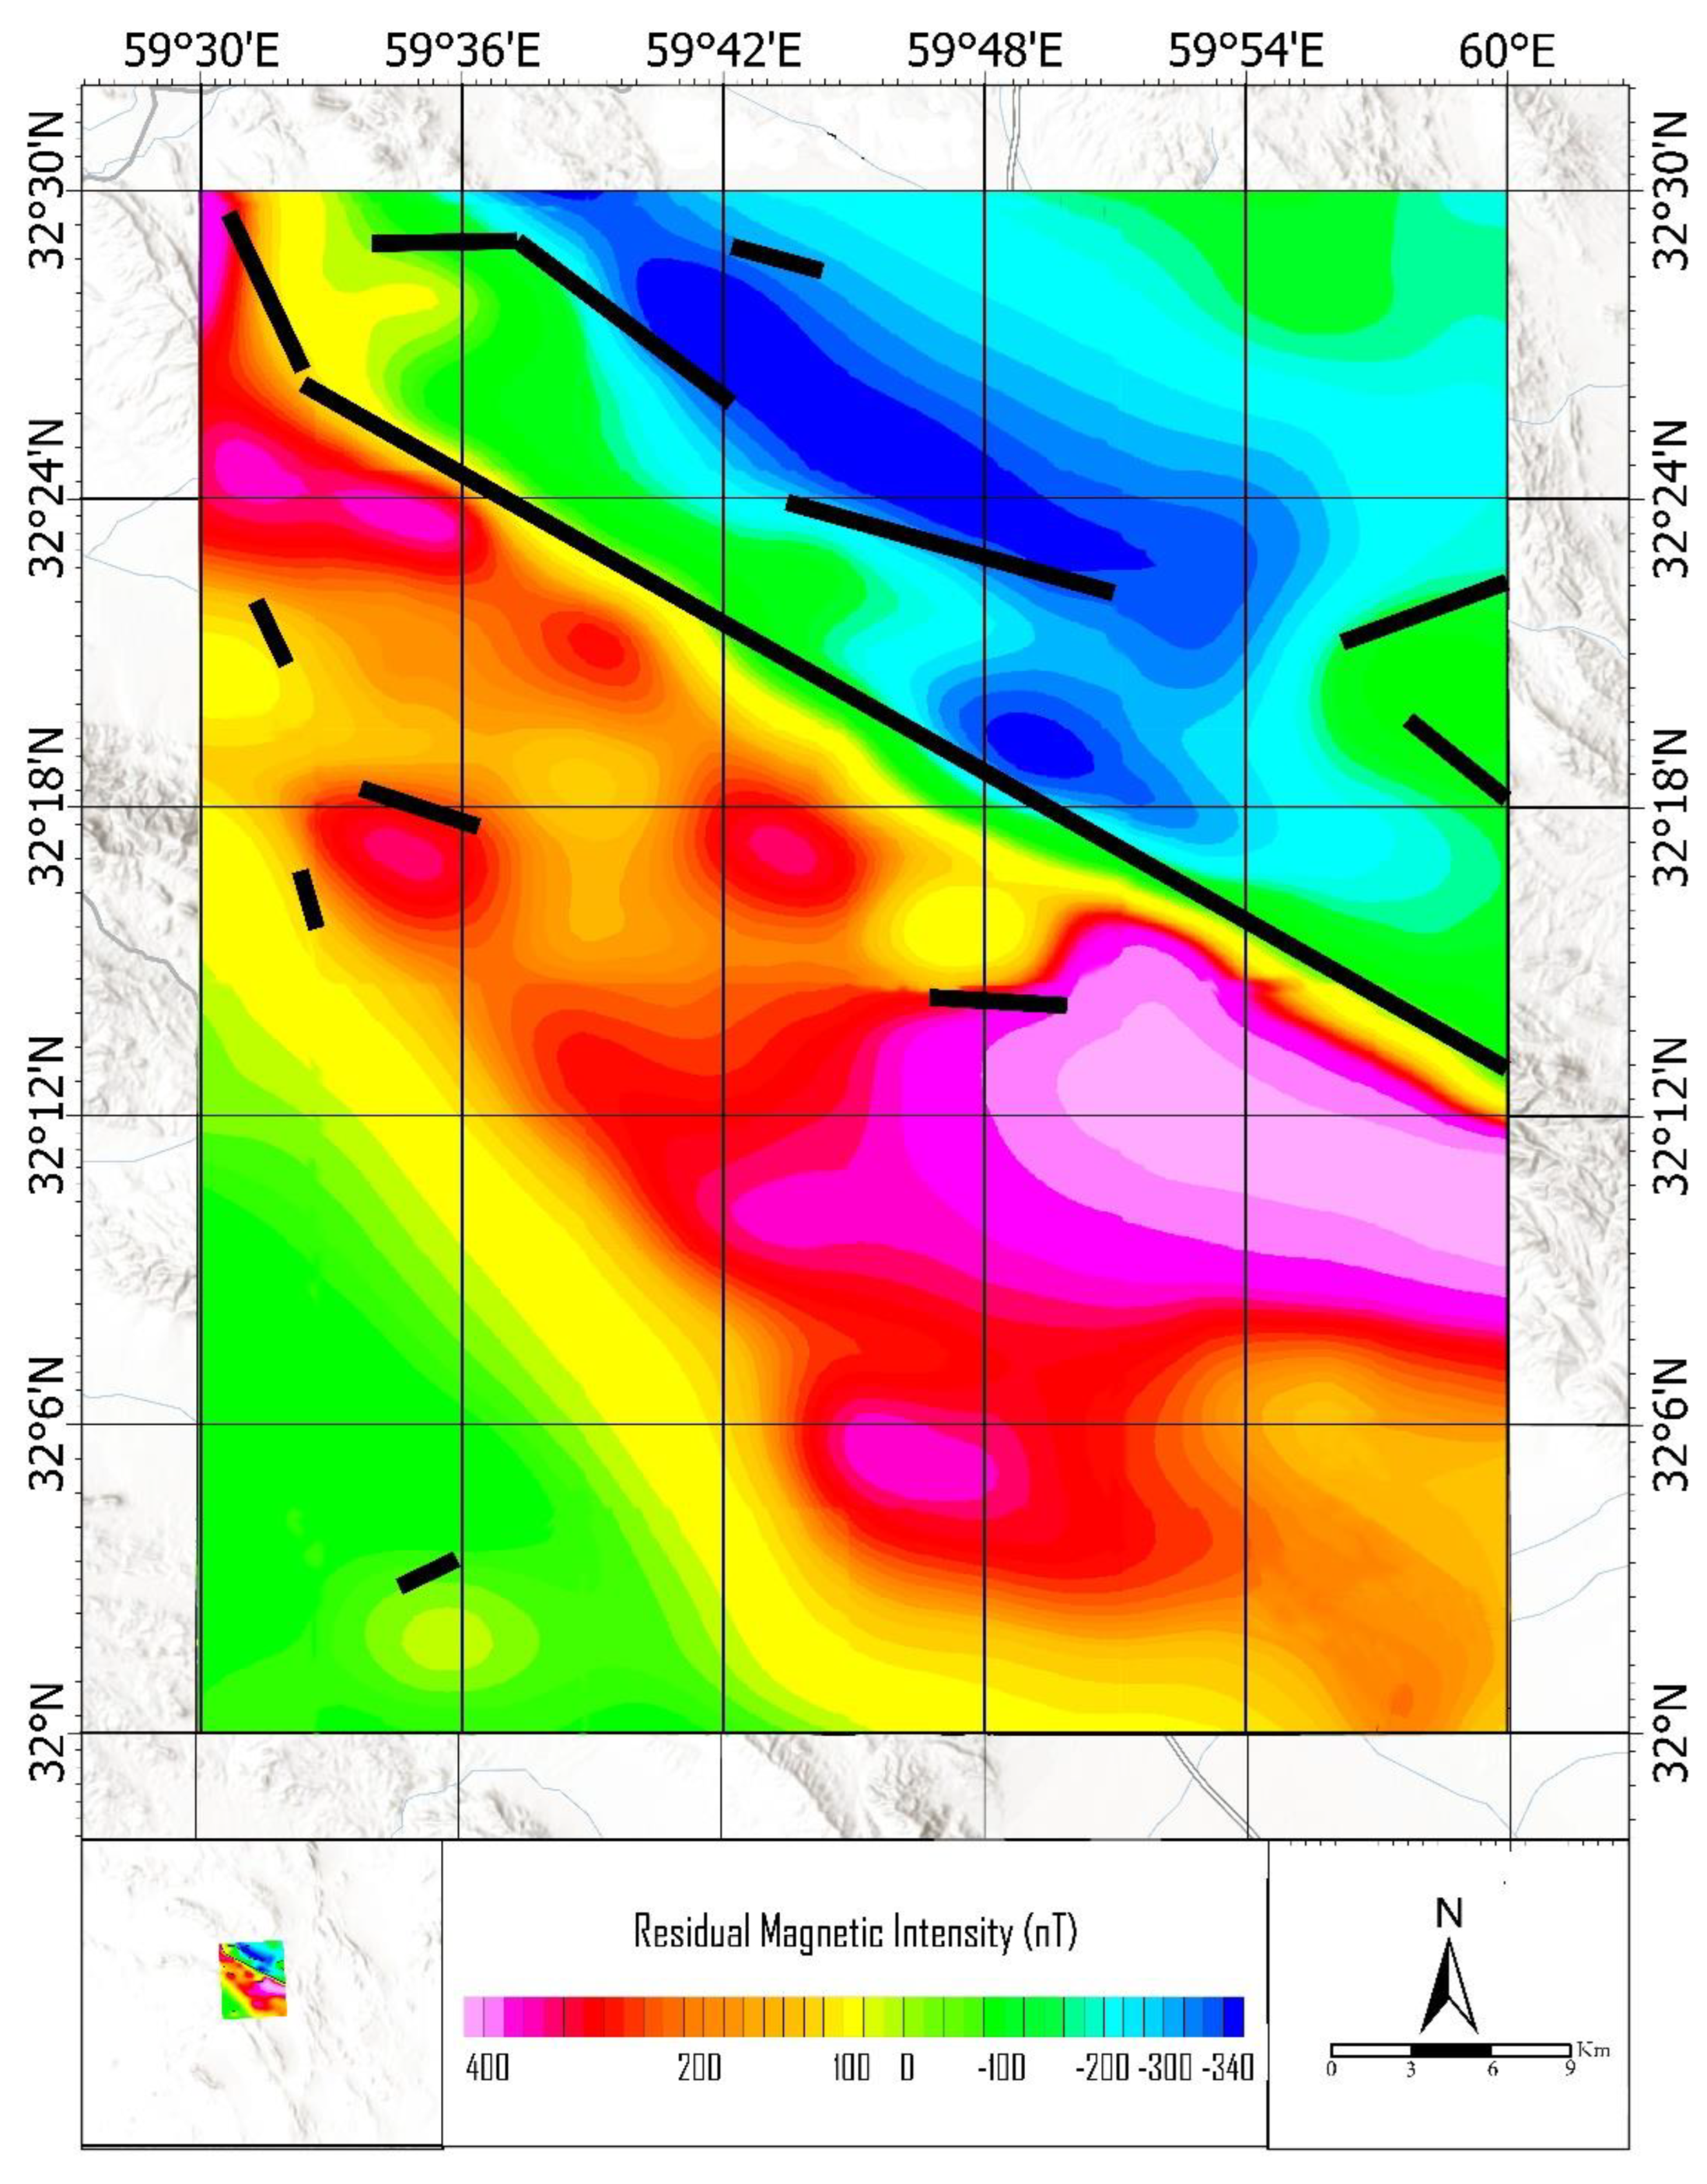
3.4. Airborne Magnetometry Analysis

Airborne magnetic data of Sahlabad region were isolated from these data and were used after corrections. In this study, gradient tensor method was used to analyze airborne magnetic data. The purpose of analyzing airborne magnetic data is to identify the position and trend of intrusive masses and to investigate their relationship with regional faults. There are various methods for analyzing magnetometric geophysical data, which use gradient analysis to detect geological lineaments. Some methods use only dx and dy horizontal gradients or only dz vertical gradients. However, in the gradient tensor method, horizontal gradients and vertical gradients are used simultaneously (dx, dy and dz). It provides more accurate and acceptable results in detecting lines on the border of magnetic anomalies [6,16]. For this purpose, using the gradient tensor method, a map of the residual magnetic intensity was prepared, and the faults associated with these masses were investigated.

3.5. Concentration–Area (C-A) Fractal Analysis

Fractal is a geometric structure that is obtained by enlarging each part of this structure in a certain proportion to the original structure. In other words, a fractal is a structure whose every part is the same as its whole. Fractals are seen from the same distance and closeness. This feature is called self-similarity [59,60]. Fractals are one of the most important tools in computer graphics and can be used in many ways [61,62]. The purpose of concentration–area fractal analysis is to examine the parameters related to the concentration and the area occupied by it. An exponential equation is given below for the aggregation of materials or fractal properties.
A ( ν ) ν α
A ( ν ) is the cumulative area enclosed by contours whose corresponding degree is greater than or equal to ν. The value of α represents dimension of fractal corresponding to different amplitudes [63,64]. In this study, in order to classify the results of the lineament factor (LF) map, concentration–area (C–A) fractal analysis was used. The result of this analysis is the presentation of different groups that have different degrees of importance in the control of mineralization by faults.

4. Analysis and Results

4.1. Rose Diagram Analysis

In this study, in order to study the trend of faults in the area, rose diagrams of faults were generated. Rose diagrams for each type of fault are shown in Figure 4. A rose diagram of all the faults in the area is shown in Figure 5. The distance between the classes is 5 degrees; the average direction angle of faults is 129.8° (230.2°) with a confidence interval of 2.9° (95%). Figure 5 shows the frequency percentage of faults in the extended intervals. Faults are divided into three categories based on frequency percentage: low frequency, medium and frequent, which are distinguished by blue, yellow and red colors, respectively. As shown in the diagram, the main direction of the faults in the area is in the range of 115 to 135 degrees, which can be understood that the main extension of the faults is northwest-southeast.

4.2. Fry Analysis

After analyzing the rose diagram of regional faults and detecting the trend of the fault system in the region, which was identified as northwest-southeast. Fry analysis was performed to determine the mineralization trend of copper in the Sahlabad region. One of the main purposes of this study was to compare the trend of the fault system and the mineralization trend in the area. The locations of 14 mines, ores and mineral indices of copper in the Sahlabad area were drawn as dots on a separate layer, and then Fry analysis was performed on it. The result of this analysis is presented in Figure 6.
Based on Figure 6 as the result of Fry analysis, the mineralization trend of copper in the Sahlabad area is mostly northwest-southeast. By comparing the result of Fry analysis and Rose diagram analysis of faults in the Sahlabad area, it is evident that the mineralization trend in the area conforms to the dominant trend of faults. Therefore, in order to identify areas with high potential for copper mineralization, the study of faults is of great importance and is considered as a valuable exploratory key. Considering that the trend of copper mineralization is coincident with the trend of the Sahlabad fault system, in order to confirm the control of mineralization by faults, other trends such as host mineralization lithology and hydrothermal alterations should be examined.

4.3. Lithology Trend Analysis

Using airborne magnetic data of the Sahlabad area, a residual map of the magnetic intensity was produced. Figure 7 shows the residual magnetic map of the Sahlabad area. Results show that there is a magnetic dipole with a northwest-southeast trend, which according to the geological map of the area, is related to basaltic, andesitic, granite and ophiolite melange units in the area. In this regard, there are effects of serpentinization and a high probability of alteration effects due to the proximity of carbonate masses with basic and ultrabasic masses. According to airborne geophysical evidence and the geological map, there is a possibility of copper mineralization in this area, especially in the central parts of the area.
In this analysis, the purpose of analyzing airborne magnetic data was to identify faults that are associated with intrusive masses in the area. In other words, these faults, in addition to having an older formation time than other faults, also play a major role in controlling the lithological trend in the area. Using the gradient tensor method and intensity magnetic field map of the area, geological lineaments related to intrusive masses were identified. Figure 7 shows the geological lineament obtained from the magnetic field intensity map of the Sahlabad area. The lineaments identified by this method are in accordance with the faults in the geological map (see Figure 1). Since the main purpose of the magnetometric study was to study intrusive masses, the faults shown in Figure 7 are considered deep faults that have defined the boundary and trend of igneous masses.
The main fault trend, which extends from the northwest to the east of the map, generally defines the boundary of the ophiolitic melange unit with basaltic, ultrabasic and andesitic massifs. Expansion and formation of ophiolitic melanges in the Sahlabad region (northwest-southeast) have occurred in the direction of this fault. Therefore, it can be considered as the main fault that controls the lithology trend in the area. The faults north of the map are also located at the boundary of basaltic and andesitic units, and thus the elongation of these massifs is evident along the faults. Other faults that are shorter than the others also show control over the extension of intrusive masses in the area. It is noteworthy that because the faults were identified based on airborne magnetic analysis, the boundary of the intrusive masses in the area plays an essential role in the final result. Therefore, they are clearly shown linearly and based on the boundaries of geological units.

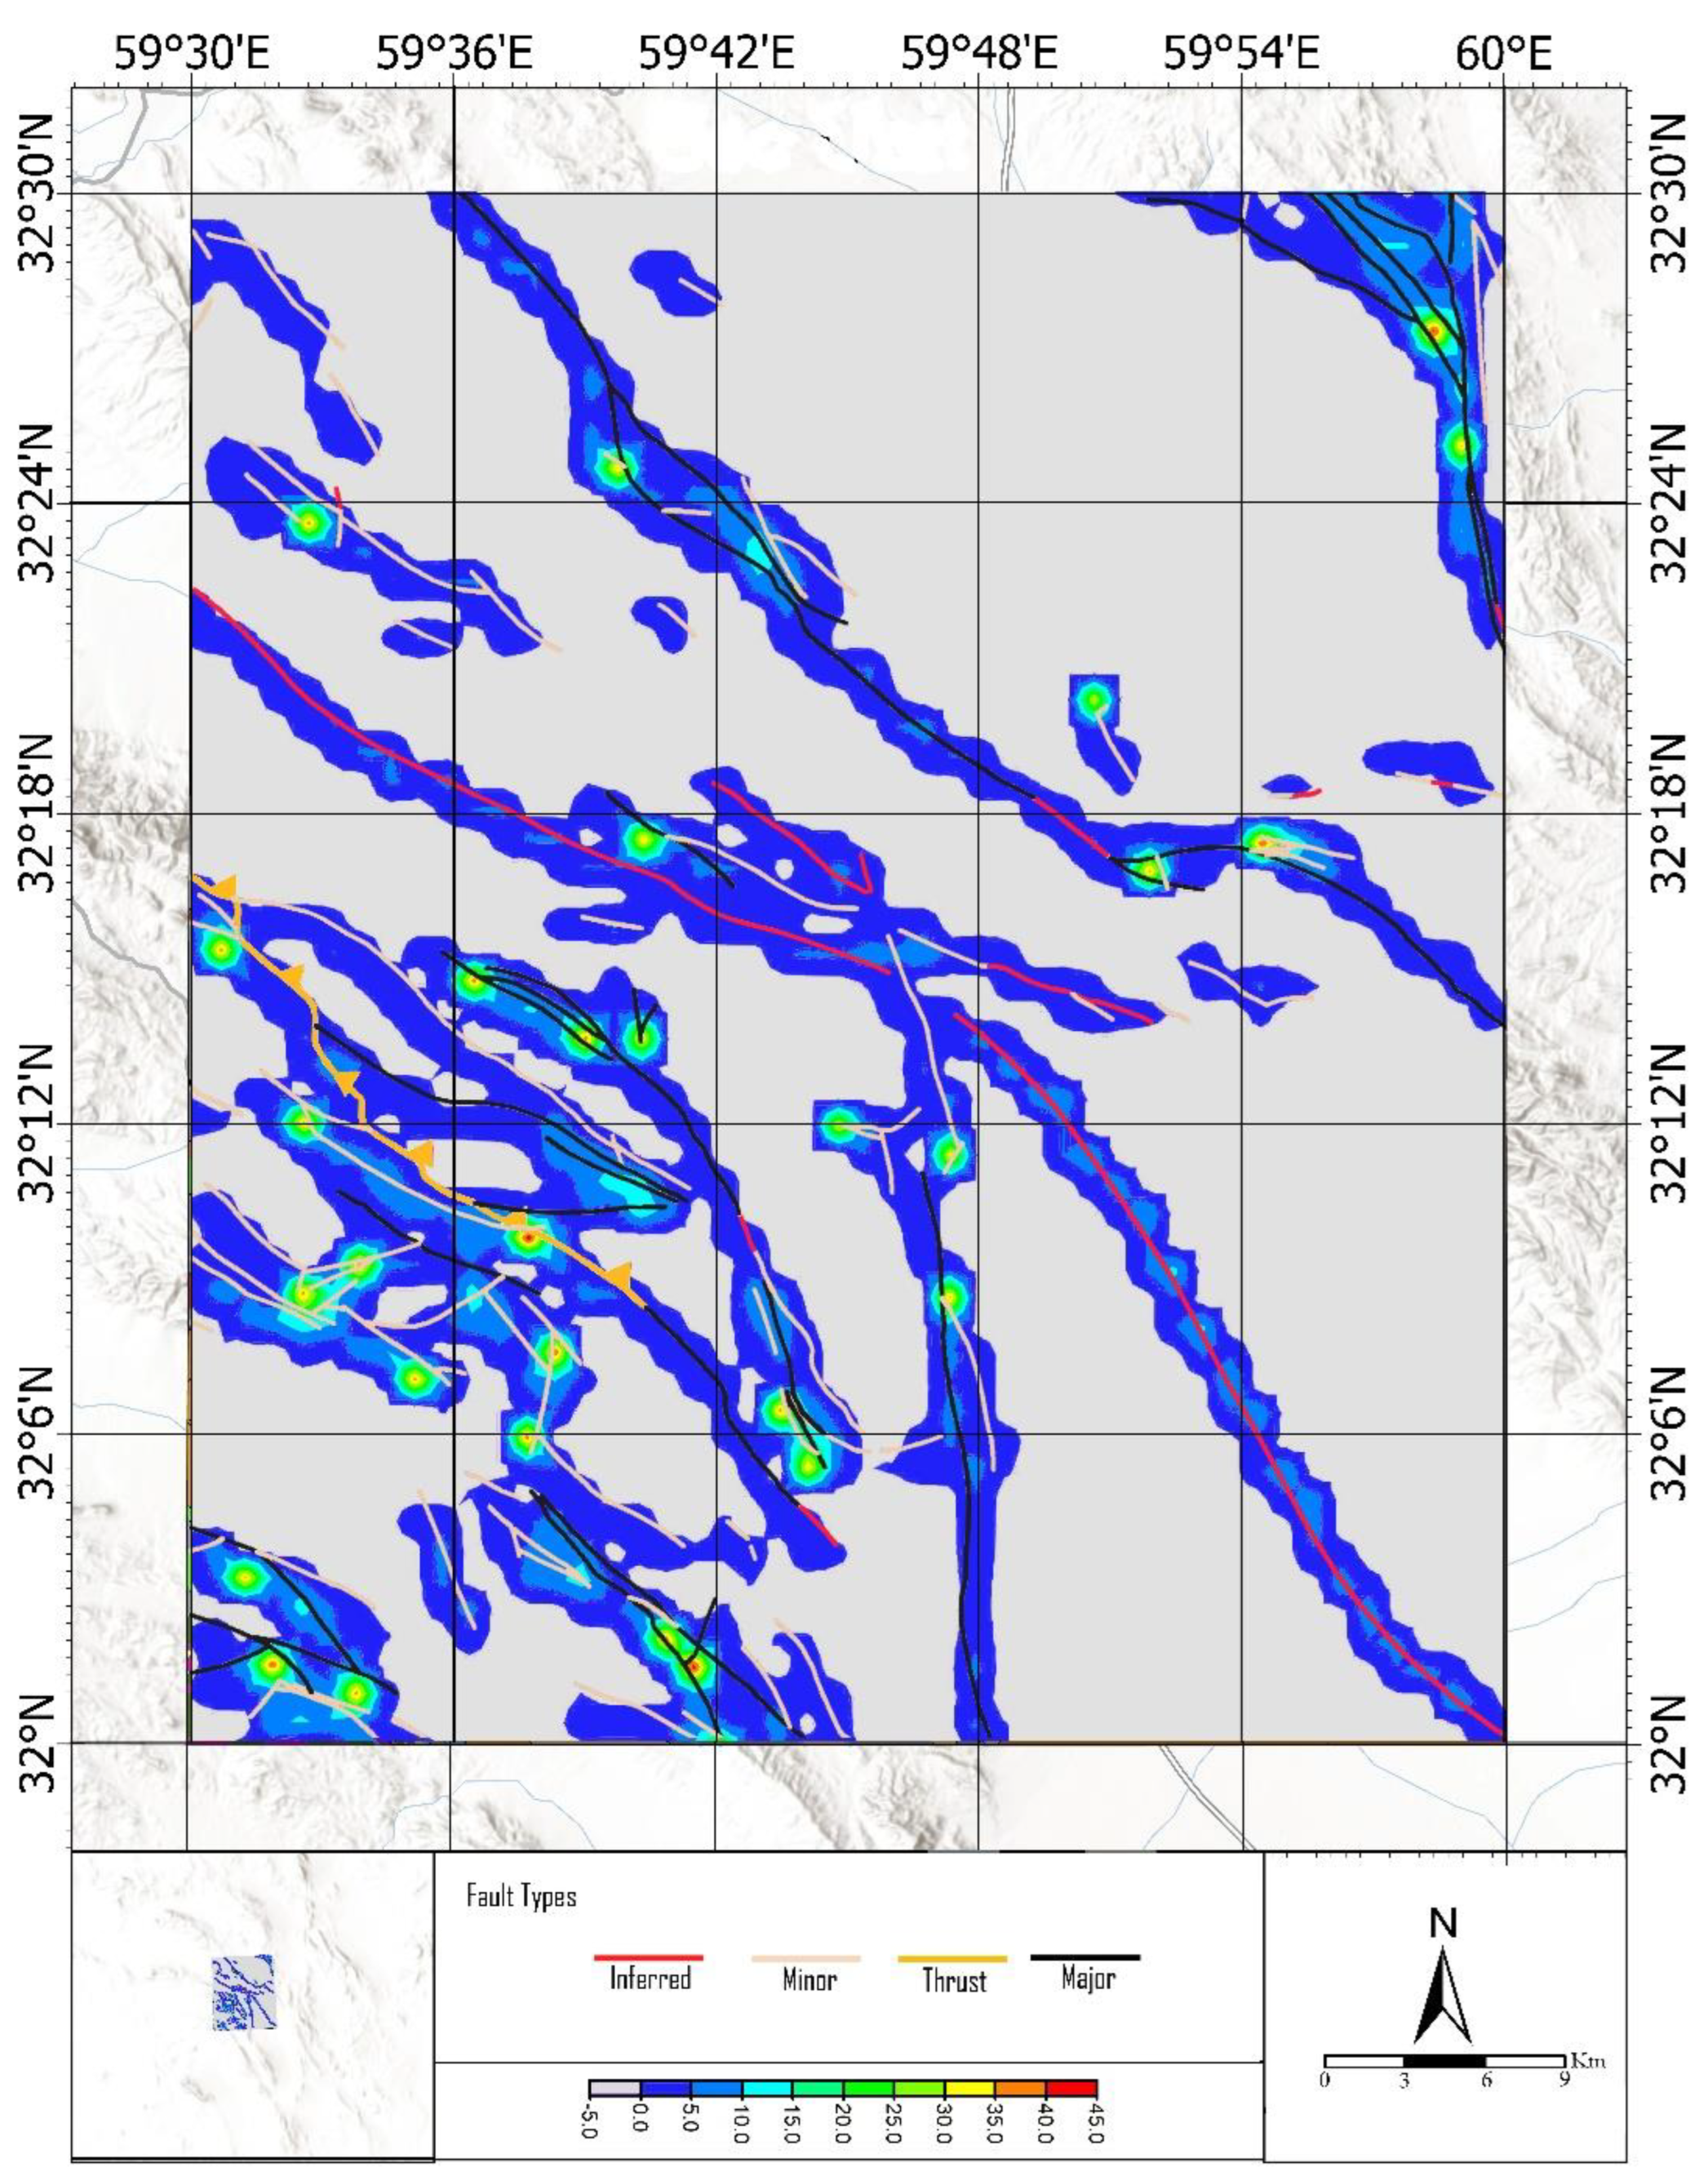
4.4. Lineament Factor (LF) Map Analysis

The lineament factor (LF) map scores various parameters related to faults based on their degree of importance and finally shows the areas that are important in terms of fault activity. The parameters used in this study were: (i) frequency of faults, (ii) length of the faults and (iii) number of fault intersections. Initially, the network of the Sahlabad area was divided into 100-square-meter cells in order to study the faults and draw an LF map using the RockWorks software package. The scores of these factors were considered from top to bottom 1, 2 and 3, respectively [51,65]. The frequency of fault intersections plays an important role in the formation of magmatic and hydrothermal deposits because these intersections create a suitable space for mineralization in the bedrock [66]. However, the length of faults is also an important factor in the formation of hydrothermal deposits and leads to fluid conduction. The frequency of faults including structures before and after mineralization is the least important among the mentioned factors [67,68]. The lineament factor map is presented in Figure 8. According to the lineament factor map, based on the above-mentioned scores, the effect of fault control on copper mineralization in the Sahlabad area is shown. The importance of fault control in copper mineralization, from gray (lowest) to red (highest), is shown in the LF map. In order to determine the threshold of the impact of faults on copper mineralization, grouping was performed using fractal methods.

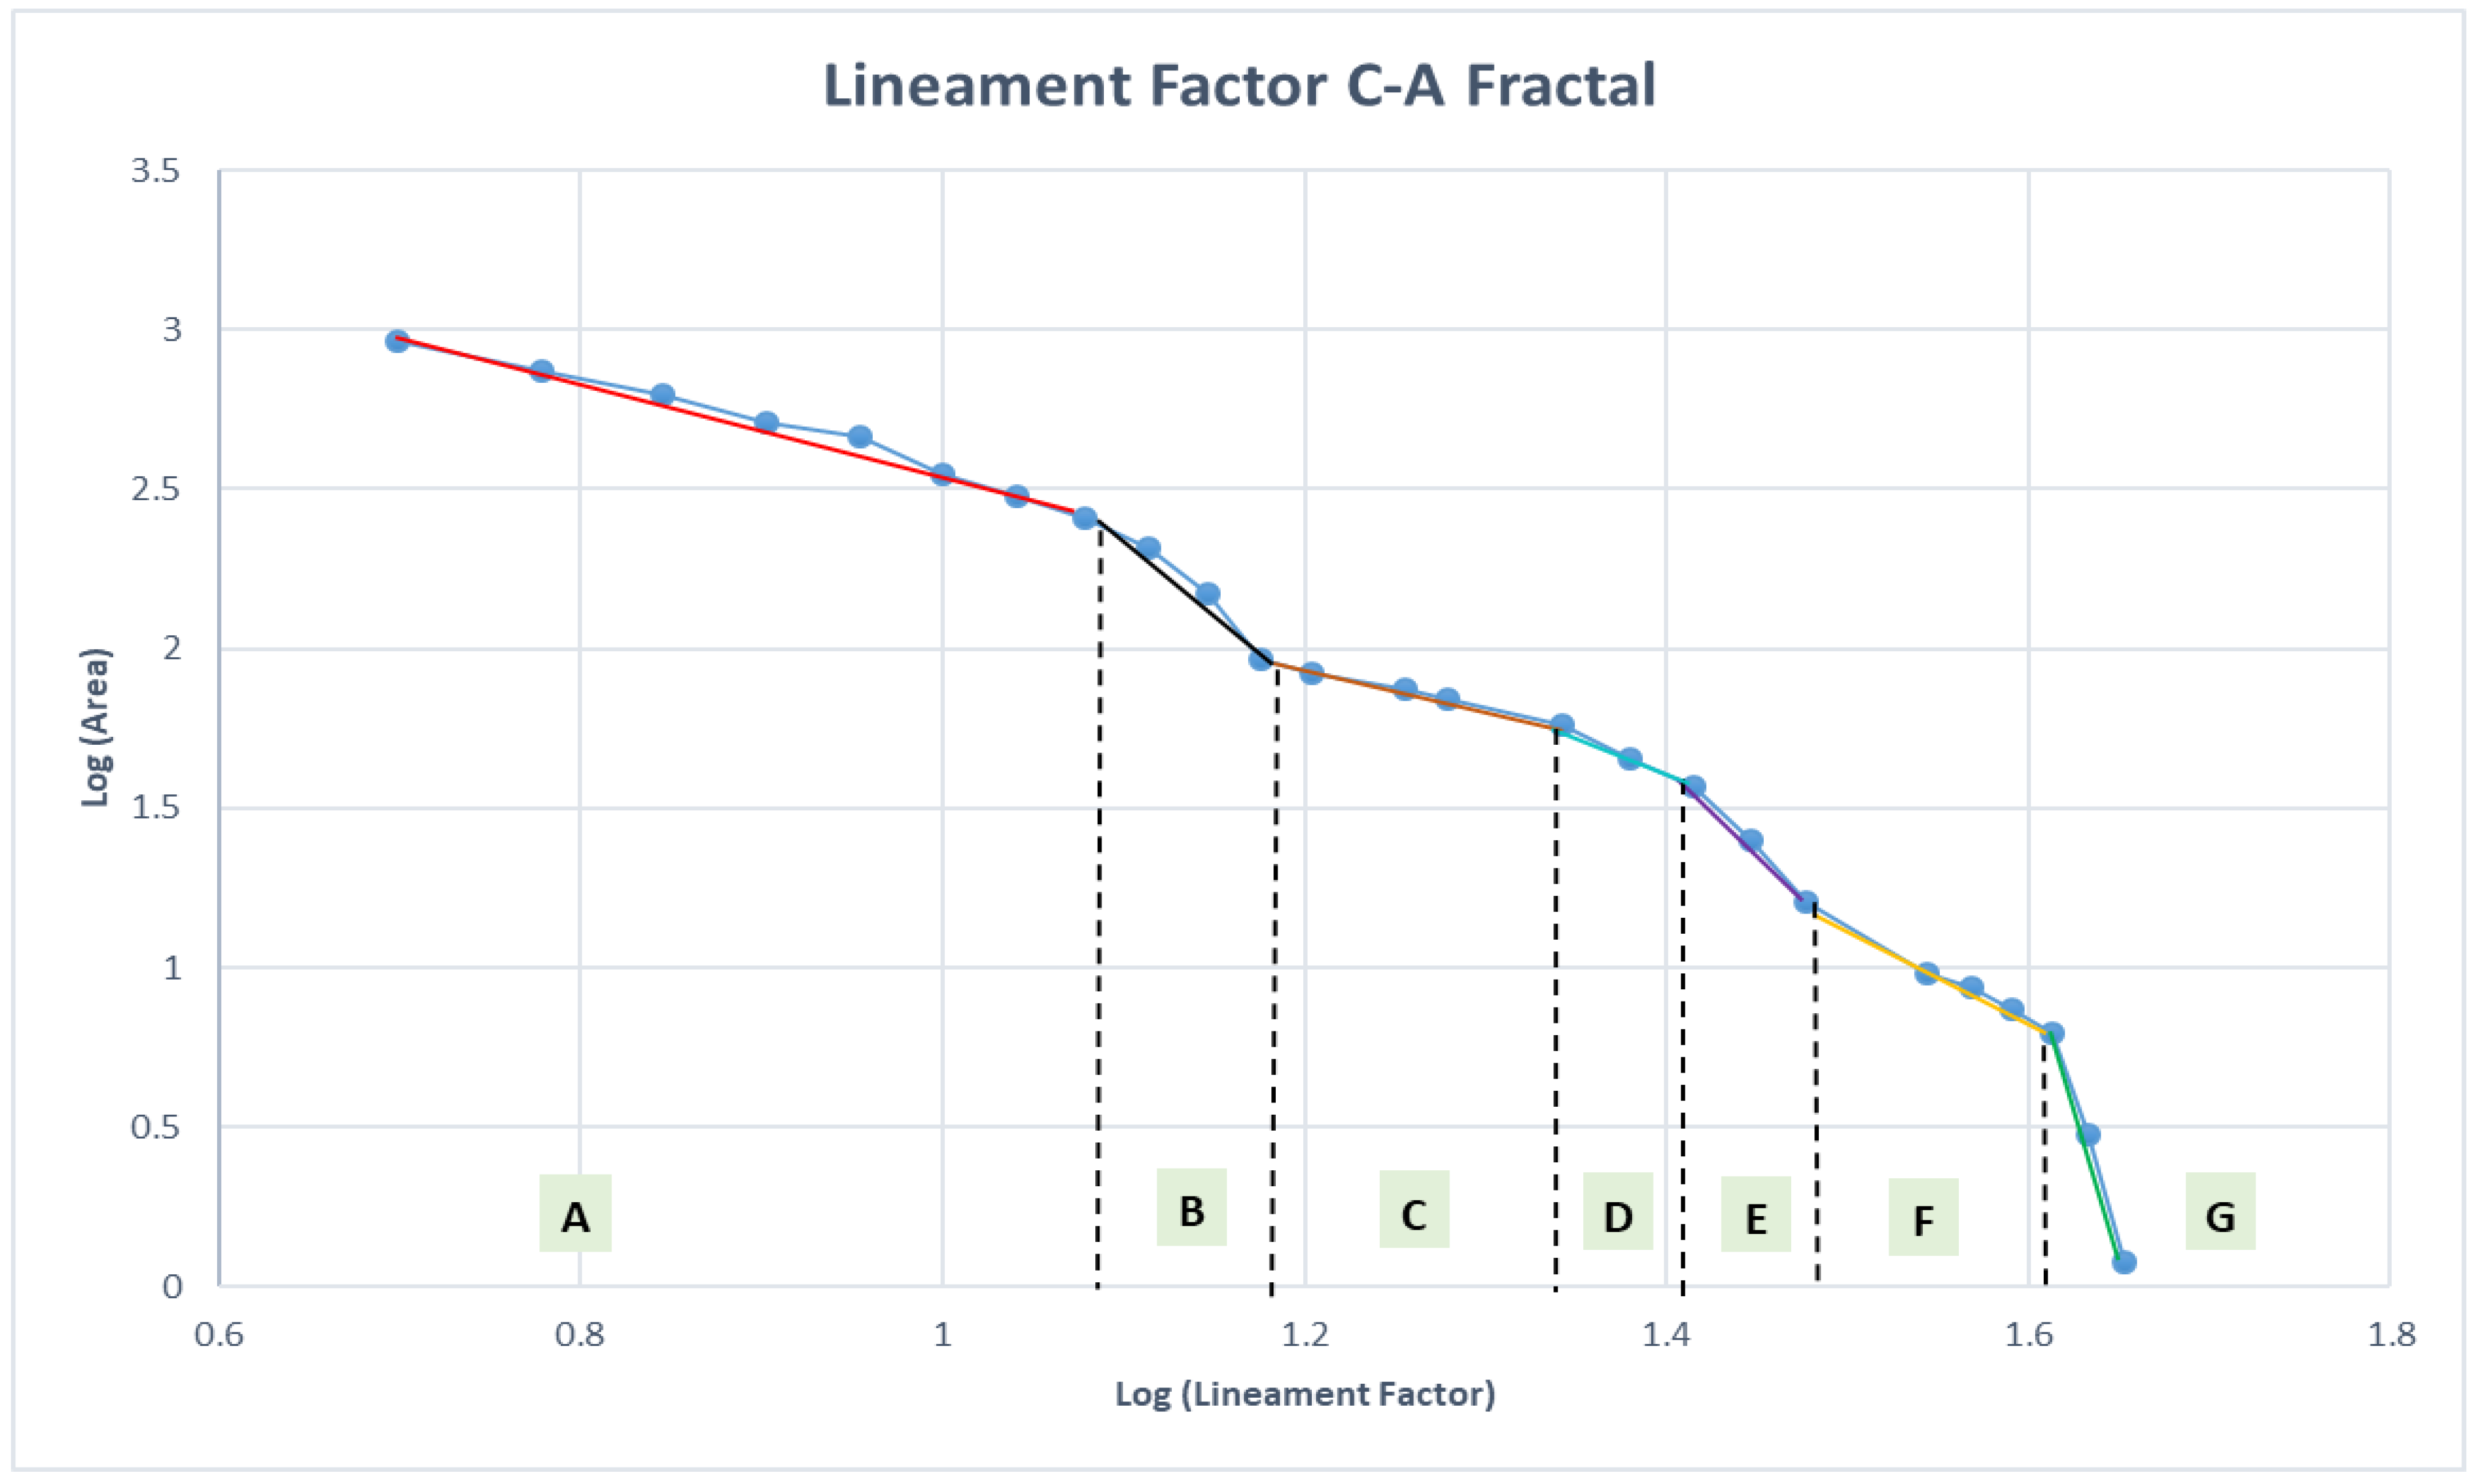
LF Map Classification by Fractal Modeling
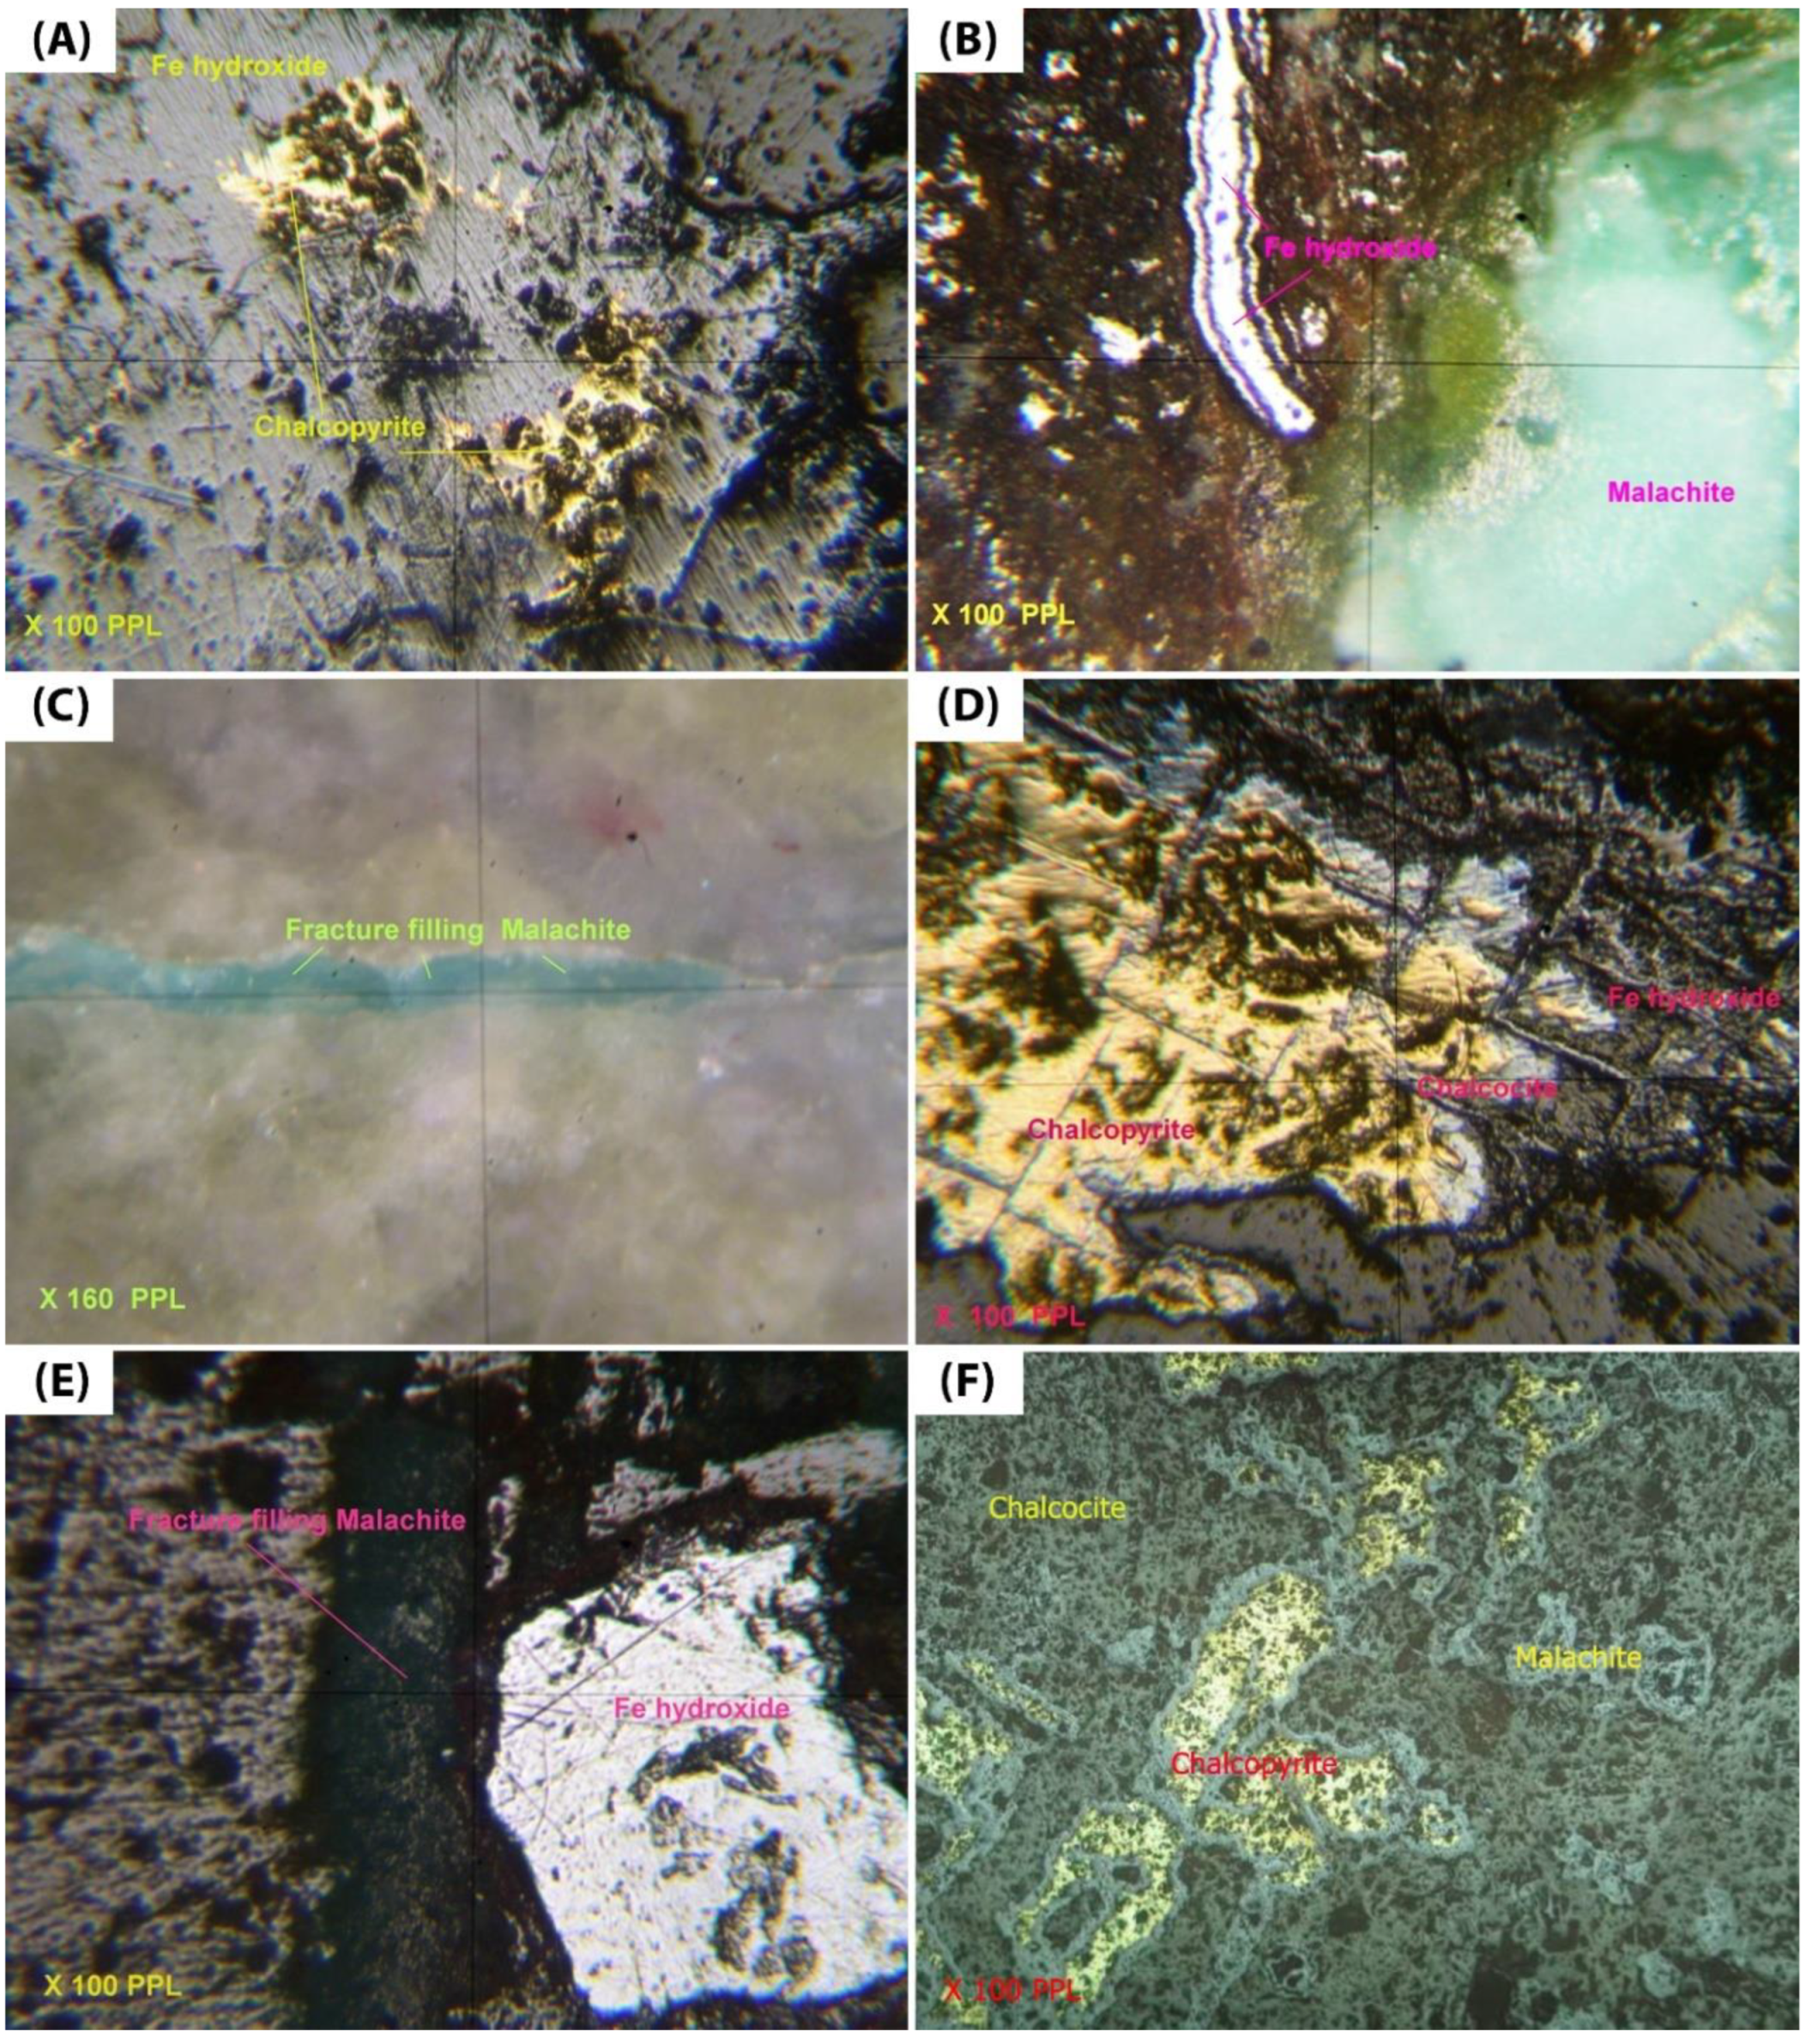
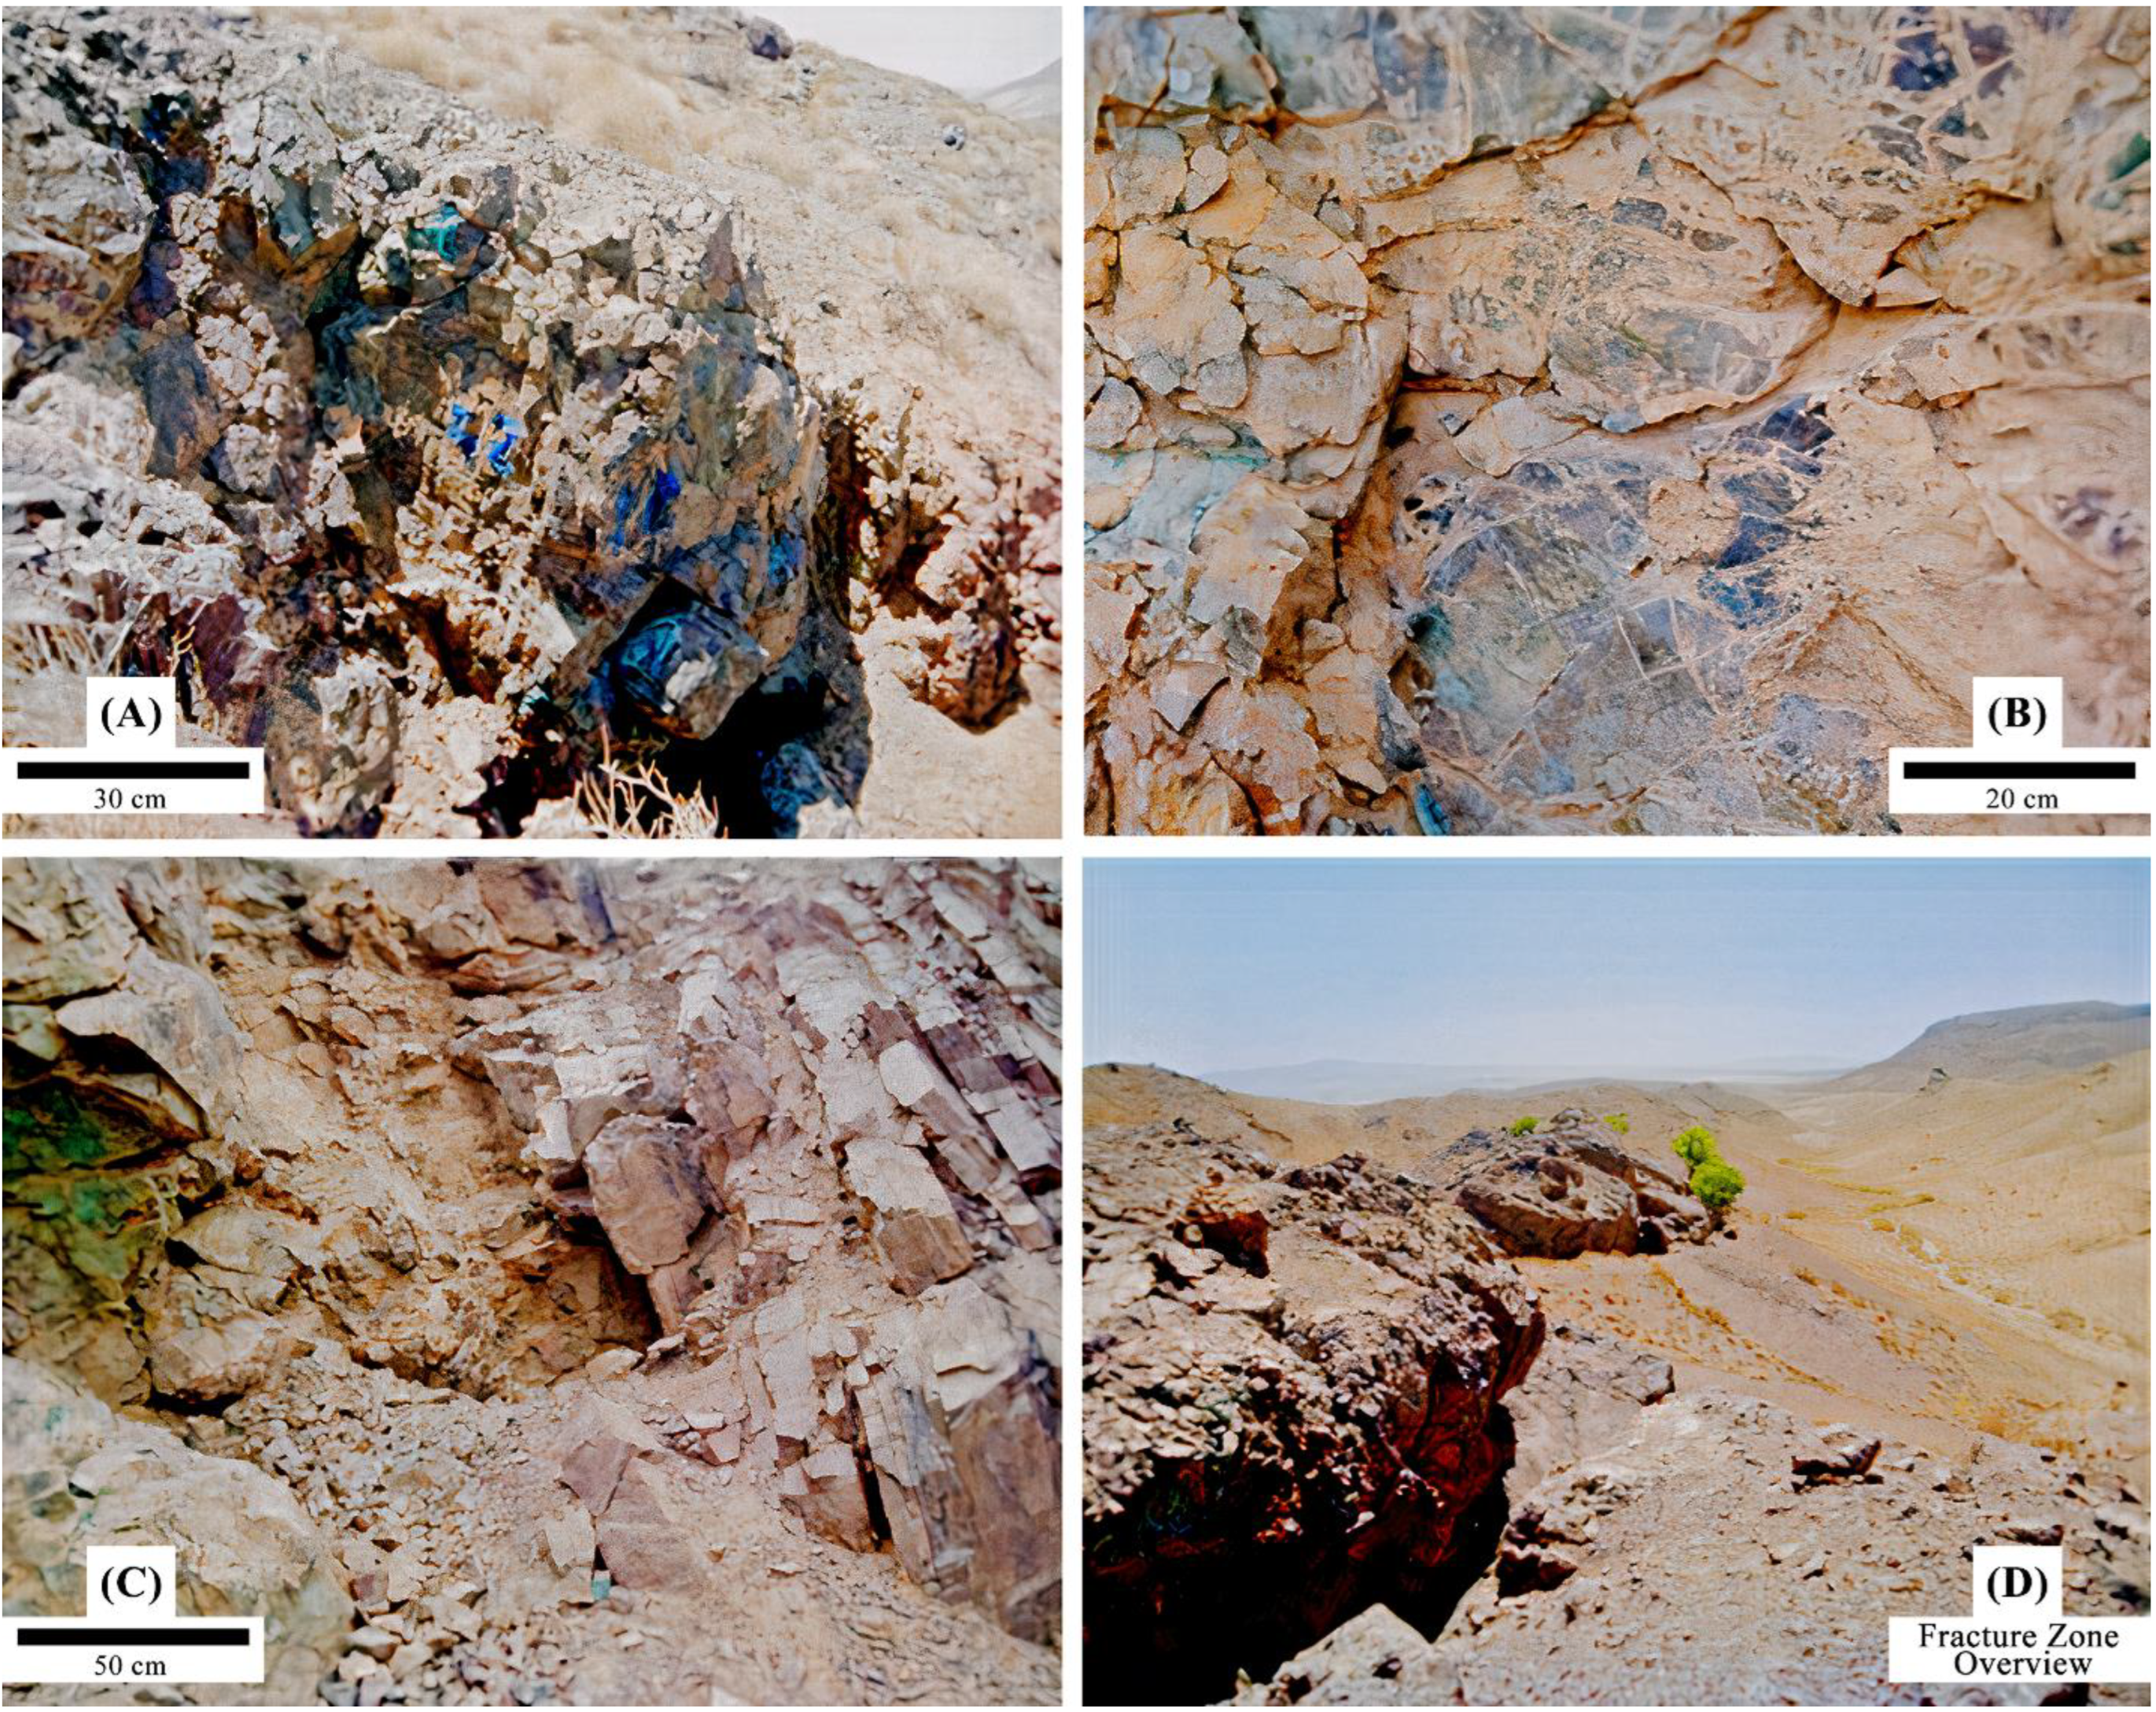
Based on the map presented in Figure 8, the fractal diagram of the concentration–area (C–A) of the faults was produced. According to the LF values shown in Figure 8, the area associated with lower LF values to higher LF values was calculated using Surfer software. Then, based on the concentration–area (C–A) fractal methodology, logarithmic values were examined and are shown in Figure 9. The C–A fractal diagram is shown in Figure 9. The diagram shows the multifractal nature of faults in the Sahlabad area. The results of the fractal classification of faults are presented in Table 2.
According to Table 2, three communities and seven sub-communities were identified in terms of the LF concentration of faults in the area. The first community is the background in which the cell counts in this class are calculated from 12 to 25. The second community shows the average intensity of the LF concentration of faults in which the range of cell values is 15 to 30. The third community, which is introduced as the community of a high-intensity concentration of LFs, includes values above 30. Now, based on the map presented in Figure 8, the important areas in terms of fault activity can be easily distinguished and studied. The distance of each of the existing copper mineralizations (mines, ores and indices) from the regional faults and the LF high-intensity community of the faults is presented in Table 3.

4.5. Field Evidence

In order to conduct a field check, some points were selected as the target. These points are typically andesite-basalt and ultrabasic rocks, which are the host rocks of copper mineralization in the Sahlabad area. Generally, surface exposures of copper mineralization in the form of malachite and azurite were observed in the faults and fractures associated with andesitic-basaltic outcrops. An overview of copper mineralization in the faults and fracture zone is shown in Figure 10A–D. The reason for choosing these points as control points was the presence of andesite-basalt and ultrabasic rock units and the conformity of this lithology on one of the parts of the community in the high-intensity LF map (see Figure 8). Moreover, these zones are in line with the copper mineralization trend (analyzed by Fry analysis) on a regional scale. As shown in Figure 10, copper oxide mineralization is widespread in the outcrops of these areas.

5. Discussion

The exploration of massive sulfide mineralization involves specific, robust and tailored exploration techniques, which can be further developed using geology and geophysical data. Massive sulfide deposits are diligently related to low-angle detachment faults [27,29]. They are typically hosted in various altered ultramafic rocks (tectonic melange) and are enriched in Au, Ag, Co, Cu, Zn, Ni [28]. Because of their complex tectonic settings, these deposits are difficult to explore. In this study, using analytical methods such as the rose diagram, Fry analysis, lineament factor (LF) map, multifractal technique and aeromagnetic data analysis, the regional trend of faults systems and the trend of massive sulfide copper mineralization in host rock were investigated in the Sahlabad area, South Khorasan province, east of Iran. Due to the boundary of lithologies of mineralization host rock in the Sahlabad area, which can be seen from the residual magnetic field map and geological map, the fault system has played an important role in orienting the host lithology.
The concentration–area (C-A) multifractal technique, which was applied on the lineament factor (LF) map, divided the fault lineament factor community into seven sub-communities. In order to simplify the results, these sub-communities were divided into three general communities, which are background, medium intensity and high intensity. Then, in order to investigate the relationship between copper occurrences (deposits, mines and indices) with the fault system, the distances of these anomalies to the LF high-intensity community of faults were measured. According to Table 3, about 60% of these anomalies are coincident with the fault system, and on average, all copper occurrences in the Sahlabad area are within 500 m of regional faults and 2 km from the LF high-intensity community. The main development of the present study, compared to previous studies, is the fusion of airborne (aeromagnetic) geophysical data with the regional fault system information derived from geological data. It is worth mentioning that before this research, no study had been conducted on the relationship between the fault system and copper mineralization in the Sahlabad area. The NW-SE fault systems are, along with the main trend of lithological units, related to massive sulfide copper mineralization in the area. Field evidence established that the NW-SE fault systems are matched with a number of massive sulfide copper mineralizations.

6. Conclusions

In this study, the relationship between the fault system and copper mineralization in the Sahlabad area, South Khorasan province, east of Iran, was identified. The lineament factor (LF) map was generated, and multifractal analysis was implemented. The main achievements of this research are:
  • In general, the trend of faults at the regional scale is northwest-southeast, which is consistent with the trend of lithology units related to mineralization.
  • Based on the classified information related to faults in mines, deposits and copper indices of the Sahlabad area, it is observed that in most cases, mineralization has taken place at the fault systems that have a trend perpendicular to the faults in the area.
  • Studies on airborne magnetometric data indicate that the faults identified by this method are faults associated with intrusive masses, and thus the faults control the lithology trend in the area.
  • Overall, it can be said that the faults in the area control the bedrock lithology and the source of massive sulfide copper mineralization in the region, while the regional faults (on a mining scale) in mines, deposits and indices control the mineralization in the region.
The distance of copper mineralization in the Sahlabad area from regional faults and also from the community of high-intensity lineament factors (LFs) is on average 500 m and 2 km, respectively. It is noteworthy that a number of mineralizations correspond exactly to the regional faults as well as the high-intensity linear factor community.
In conclusion, the approach developed in this study is a valuable and inexpensive tool for exploring massive sulfide mineralization in metallogenic provinces.

Author Contributions

All authors have contributed to writing and editing this article. Writing original draft preparation, A.S. and A.H.; supervision, A.H. and A.B.P.; writing—review and editing, A.B.P. and A.S. All authors have read and agreed to the published version of the manuscript.

Funding

This research received no external funding.

Data Availability Statement

Not applicable.

Acknowledgments

We would appreciate Department of Mining and Metallurgy Engineering Amirkabir University of Technology (Tehran Polytechnic). This study is part of the research activity carried out during the first author’s PhD research at Department of Mining and Metallurgy Engineering Amirkabir University of Technology (Tehran Polytechnic). The Institute of Oceanography and Environment (INOS), Universiti Malaysia Terengganu (UMT) is also acknowledged for providing facilities during editing, rewritten and re-organizing the manuscript.

Conflicts of Interest

The authors declare no conflict of interest.

References

  1. Hoggard, M.J.; Czarnota, K.; Richards, F.D.; Huston, D.L.; Jaques, A.L.; Ghelichkhan, S. Global distribution of sediment-hosted metals controlled by craton edge stability. Nat. Geosci. 2020, 13, 504–510. [Google Scholar] [CrossRef]
  2. Prior, Á.; Benndorf, J.; Mueller, U. Resource and grade control model updating for underground mining production settings. Math. Geosci. 2021, 53, 757–779. [Google Scholar] [CrossRef]
  3. Baseri, F.; Nezafati, N. Structural and Chemical Controllers of the North and Northwest of Torud Based on Involved Fluid Studies, Structural and Geochemical Analyses. Teh. Glas. 2021, 15, 339–349. [Google Scholar] [CrossRef]
  4. Tuduri, J.; Chauvet, A.; Barbanson, L.; Labriki, M.; Dubois, M.; Trapy, P.-H.; Lahfid, A.; Poujol, M.; Melleton, J.; Badra, L. Structural control, magmatic-hydrothermal evolution and formation of hornfels-hosted, intrusion-related gold deposits: Insight from the Thaghassa deposit in Eastern Anti-Atlas, Morocco. Ore Geol. Rev. 2018, 97, 171–198. [Google Scholar] [CrossRef] [Green Version]
  5. Malaekeh, A.; Ghassemi, M.R.; Afzal, P.; Solgi, A. Fractal Modeling and Relationship between Thrust Faults and Carbonate-Hosted Pb-Zn Mineralization in Alborz Mountains, Northern Iran. Geochemistry 2021, 81, 125803. [Google Scholar] [CrossRef]
  6. Ghasempoor, F.; Heyhat, M.R.; Khatib, M.M. Investigation of the Relationship between Faults and Joints with Copper Mineralization, Using Remote Sensing and Magnetism in Vorezg Region (East of Ghaen-Birjand). J. Tecton. 2020, 4, 35–57. [Google Scholar]
  7. Shirazy, A.; Shirazi, A.; Hezarkhani, A. Behavioral Analysis of Geochemical Elements in Mineral Exploration: Methodology and Case Study; LAP LAMBERT Academic Publishing: Saarbrücken, Germany, 2020. [Google Scholar]
  8. Shirazy, A.; Shirazi, A.; Hezarkhani, A. Advanced Integrated Methods in Mineral Exploration; LAP LAMBERT Academic Publishing: Saarbrücken, Germany, 2022; p. 160. [Google Scholar]
  9. Haddad-Martim, P.M.; Carranza, E.J.M.; de Souza Filho, C.R. The fractal nature of structural controls on ore formation: The case of the iron oxide copper-gold deposits in the Carajás Mineral Province, Brazilian Amazon. Econ. Geol. 2018, 113, 1499–1524. [Google Scholar] [CrossRef]
  10. Sun, T.; Xu, Y.; Yu, X.; Liu, W.; Li, R.; Hu, Z.; Wang, Y. Structural controls on copper mineralization in the Tongling Ore District, Eastern China: Evidence from spatial analysis. Minerals 2018, 8, 254. [Google Scholar] [CrossRef] [Green Version]
  11. Zhang, L.C.; Bai, Y.; Zhu, M.T.; Huang, K.; Peng, Z.D. Regional heterogeneous temporal–spatial distribution of gold deposits in the North China Craton: A review. Geol. J. 2020, 55, 5646–5663. [Google Scholar] [CrossRef]
  12. Nadoll, P.; Sośnicka, M.; Kraemer, D.; Duschl, F. Post-Variscan structurally-controlled hydrothermal Zn-Fe-Pb sulfide and F-Ba mineralization in deep-seated Paleozoic units of the North German Basin: A review. Ore Geol. Rev. 2019, 106, 273–299. [Google Scholar] [CrossRef]
  13. Aita, S.K.; Omar, A.E. Exploration of uranium and mineral deposits using remote sensing data and GIS applications, Serbal area, Southwestern Sinai, Egypt. Arab. J. Geosci. 2021, 14, 2214. [Google Scholar] [CrossRef]
  14. Dasgupta, S.; Mukherjee, S. Remote sensing in lineament identification: Examples from western India. In Developments in Structural Geology and Tectonics; Elsevier: Amsterdam, The Netherlands, 2019; Volume 5, pp. 205–221. [Google Scholar]
  15. Moradpour, H.; Rostami Paydar, G.; Pour, A.B.; Valizadeh Kamran, K.; Feizizadeh, B.; Muslim, A.M.; Hossain, M.S. Landsat-7 and ASTER remote sensing satellite imagery for identification of iron skarn mineralization in metamorphic regions. Geocarto Int. 2020, 35, 1–28. [Google Scholar] [CrossRef]
  16. Eldosouky, A.M.; El-Qassas, R.A.; Pour, A.B.; Mohamed, H.; Sekandari, M. Integration of ASTER satellite imagery and 3D inversion of aeromagnetic data for deep mineral exploration. Adv. Space Res. 2021, 68, 3641–3662. [Google Scholar] [CrossRef]
  17. Riahi, S.; Bahroudi, A.; Abedi, M.; Aslani, S.; Elyasi, G.R. Integration of airborne geophysics and satellite imagery data for exploration targeting in porphyry Cu systems: Chahargonbad district, Iran. Geophys. Prospect. 2021, 69, 1116–1137. [Google Scholar] [CrossRef]
  18. Uwiduhaye, J.d.A.; Ngaruye, J.C.; Saibi, H. Defining potential mineral exploration targets from the interpretation of aeromagnetic data in western Rwanda. Ore Geol. Rev. 2021, 128, 103927. [Google Scholar] [CrossRef]
  19. Shebl, A.; Csámer, Á. Reappraisal of DEMs, Radar and optical datasets in lineaments extraction with emphasis on the spatial context. Remote Sens. Appl. Soc. Environ. 2021, 24, 100617. [Google Scholar] [CrossRef]
  20. Innocent, A.J.; Chidubem, E.O.; Chibuzor, N.A. Analysis of aeromagnetic anomalies and structural lineaments for mineral and hydrocarbon exploration in Ikom and its environs southeastern Nigeria. J. Afr. Earth Sci. 2019, 151, 274–285. [Google Scholar] [CrossRef]
  21. Hedayat, B.; Ahmadi, M.E.; Nazerian, H.; Shirazi, A.; Shirazy, A. Feasibility of Simultaneous Application of Fuzzy Neural Network and TOPSIS Integrated Method in Potential Mapping of Lead and Zinc Mineralization in Isfahan-Khomein Metallogeny Zone. Open J. Geol. 2022, 12, 215–233. [Google Scholar] [CrossRef]
  22. Nicolis, O. Review chapter on mineral exploration section. In Methods and Applications in Petroleum and Mineral Exploration and Engineering Geology; Elsevier: Amsterdam, The Netherlands, 2021; pp. 231–235. [Google Scholar]
  23. Nicolis, O. Statistical analysis of geological faults for characterizing mineral deposits. In Methods and Applications in Petroleum and Mineral Exploration and Engineering Geology; Elsevier: Amsterdam, The Netherlands, 2021; pp. 285–293. [Google Scholar]
  24. Khosravi, V.; Shirazi, A.; Shirazy, A.; Hezarkhani, A.; Pour, A.B. Hybrid Fuzzy-Analytic Hierarchy Process (AHP) Model for Porphyry Copper Prospecting in Simorgh Area, Eastern Lut Block of Iran. Mining 2022, 2, 1–12. [Google Scholar] [CrossRef]
  25. Talebi, H.; Mueller, U.; Peeters, L.J.; Otto, A.; de Caritat, P.; Tolosana-Delgado, R.; van den Boogaart, K.G. Stochastic Modelling of Mineral Exploration Targets. Math. Geosci. 2022, 54, 593–621. [Google Scholar] [CrossRef]
  26. Shahbazi, S.; Ghaderi, M.; Afzal, P. Prognosis of of gold mineralization phases by multifractal modeling in the Zehabad epithermal deposit, NW Iran. Iran. J. Earth Sci. 2021, 13, 31–40. [Google Scholar]
  27. Betts, P.G.; Giles, D.; Lister, G. Aeromagnetic patterns of half-graben and basin inversion: Implications for sediment-hosted massive sulfide Pb–Zn–Ag exploration. J. Struct. Geol. 2004, 26, 1137–1156. [Google Scholar] [CrossRef]
  28. Patten, C.G.; Coltat, R.; Junge, M.; Peillod, A.; Ulrich, M.; Manatschal, G.; Kolb, J. Ultramafic-hosted volcanogenic massive sulfide deposits: An overlooked sub-class of VMS deposit forming in complex tectonic environments. Earth-Sci. Rev. 2021, 224, 103891. [Google Scholar] [CrossRef]
  29. Melekestseva, I.Y.; Zaykov, V.; Nimis, P.; Tret’Yakov, G.; Tessalina, S. Cu–(Ni–Co–Au)-bearing massive sulfide deposits associated with mafic–ultramafic rocks of the Main Urals Fault, South Urals: Geological structures, ore textural and mineralogical features, comparison with modern analogs. Ore Geol. Rev. 2013, 52, 18–36. [Google Scholar] [CrossRef]
  30. Agharezaei, M.; Hezarkhani, A. Delineation of geochemical anomalies based on Cu by the boxplot as an exploratory data analysis (EDA) method and concentration-volume (CV) fractal modeling in Mesgaran mining area, Eastern Iran. Open J. Geol. 2016, 6, 1269–1278. [Google Scholar] [CrossRef] [Green Version]
  31. Shirazi, A.; Shirazy, A.; Karami, J. Remote sensing to identify copper alterations and promising regions, Sarbishe, South Khorasan, Iran. Int. J. Geol. Earth Sci. 2018, 4, 36–52. [Google Scholar]
  32. Shirazy, A.; Hezarkhani, A.; Shirazi, A.; Timkin, T.V.; Voroshilov, V.G. Geophysical explorations by resistivity and induced polarization methods for the copper deposit, South Khorasan, Iran. Bull. Tomsk. Polytech. Univ. Geo Assets Eng. 2022, 333, 99–110. [Google Scholar] [CrossRef]
  33. Tirrul, R.; Bell, I.; Griffis, R.; Camp, V. The Sistan suture zone of eastern Iran. Geol. Soc. Am. Bull. 1983, 94, 134–150. [Google Scholar] [CrossRef]
  34. Reyre, D.; Mohafez, S. A First Contribution of the NIOC-ERAP Agreements to the Knowledge of Iranian Geology; Editions Technip: Paris, France, 1972. [Google Scholar]
  35. Nabavi, M. An Introduction to the Iranian Geology; Geological Survey of Iran: Tehran, Iran, 1976; Volume 110. [Google Scholar]
  36. Samani, B.; Ashtari, M. The development of geology in Sistan and Baluchestan region. Q. J. Earth Sci. 1991, 4, 26–40. [Google Scholar]
  37. Carey, S.W. The Expanding Earth; Elsevier: Amsterdam, The Netherlands; Oxford, UK; New York, NY, USA, 1976; p. 488. [Google Scholar]
  38. Alavi, M. Sedimentary and structural characteristics of the Paleo-Tethys remnants in northeastern Iran. Geol. Soc. Am. Bull. 1991, 103, 983–992. [Google Scholar] [CrossRef]
  39. Navai, I. Geological Map of Sahlabad Area (on Sacale 1:100,000); Geological Survey of Iran (GSI): Tehran, Iran, 1974. [Google Scholar]
  40. Ghorbani, M. Geological Setting and Crustal Structure of Iran. In The Geology of Iran: Tectonic, Magmatism and Metamorphism; Springer: Berlin/Heidelberg, Germany, 2021; pp. 1–22. [Google Scholar]
  41. Ghorbani, M. A summary of geology of Iran. In The Economic Geology of Iran; Springer: Berlin/Heidelberg, Germany, 2013; pp. 45–64. [Google Scholar]
  42. Monazami Bagherzade, R. Economic Geology Report (Hammer Exploration) Sahlabad Sheet (Scale 1:100,000); Geological Survey and Mineral Exploration of Northeast Iran: South Khorasan Province, Iran, 2001; p. 20. [Google Scholar]
  43. Samimi Namin, M. Report on Potential Detection and Preliminary Exploration of Iron, Gold and Copper in Sarbisheh City; Madankav Consulting Engineers Co.: Tehran, Iran, 2006; p. 238. [Google Scholar]
  44. Zaman, Z.K. Detailed Exploration Operation Report of Kooh Kheiri Copper Deposit; Industries and Mines Organization of South Khorasan Province, Iran: South Khorasan Province, Iran, 2012. [Google Scholar]
  45. Kav, P.K. Detailed Exploration Report of Mesgaran Copper Deposit; Parsi Kan Kav Eng. Co.: Soth Khorasan Province, Iran, 2013; p. 477. [Google Scholar]
  46. Jalili, F. Detailed Exploration Operation Report of Zahri Copper Deposite; Industries and Mines Organization of South Khorasan Province: South Khorasan Province, Iran, 2014. [Google Scholar]
  47. GSI. Report of Systematic Geochemical Explorations in the Sahlabad Area (Sheet on Scale 1:100,000—Geochemistry of Stream Sediments); Geological Survey of IRAN (GSI): Tehran, Iran, 2001; p. 644. [Google Scholar]
  48. Friedberg, J.L.; Yousefi, E. Aeromagnetic Map of Iran: Quaderangle, No. D7, Based on Airborne Survey by Aero Service Corporation under Contract to the Geological Survey of Iran; Geological Survey of Iran: Tehran, Iran, 1978. [Google Scholar]
  49. Hill, J.S. Post-Orogenic Uplift, Young Faults, and Mantle Reorganization in the Appalachians. Ph.D. Thesis, The University of North Carolina at Chapel Hill, Chapel Hill, NC, USA, 2018. [Google Scholar]
  50. Akgün, E.; İnceöz, M.; Manap, H.S. Geological lineament analyses application to a fault segment on the east Anatolian fault zone. In Proceedings of the International Multidisciplinary Scientific GeoConference: SGEM, Albena, Bulgaria, 28 June–6 July 2019; Volume 19, pp. 547–552. [Google Scholar]
  51. Ahmadfaraj, M.; Mirmohammadi, M.; Afzal, P.; Yasrebi, A.B.; Carranza, E.J. Fractal modeling and fry analysis of the relationship between structures and Cu mineralization in Saveh region, Central Iran. Ore Geol. Rev. 2019, 107, 172–185. [Google Scholar] [CrossRef]
  52. Wu, R.; Chen, J.; Zhao, J.; Chen, J.; Chen, S. Identifying Geochemical Anomalies Associated with Gold Mineralization Using Factor Analysis and Spectrum–Area Multifractal Model in Laowan District, Qinling-Dabie Metallogenic Belt, Central China. Minerals 2020, 10, 229. [Google Scholar] [CrossRef] [Green Version]
  53. Maanijou, M.; Daneshvar, N.; Alipoor, R.; Azizi, H. Spatial Analysis on Gold Mineralization in Southwest Saqqez Using Point Pattern, Fry and Fractal Analyses. Geotectonics 2020, 54, 589–604. [Google Scholar] [CrossRef]
  54. Behyari, M.; Rahimsouri, Y.; Hoseinzadeh, E.; Kurd, N. Evaluating of lithological and structural controls on the barite mineralization by using the remote sensing, Fry and fractal methods, Northwest Iran. Arab. J. Geosci. 2019, 12, 167. [Google Scholar] [CrossRef]
  55. Nguemhe Fils, S.C.; Mimba, M.E.; Nyeck, B.; Nforba, M.T.; Kankeu, B.; Njandjock Nouck, P.; Hell, J.V. GIS-Based Spatial Analysis of Regional-Scale Structural Controls on Gold Mineralization Along the Betare-Oya Shear Zone, Eastern Cameroon. Nat. Resour. Res. 2020, 29, 3457–3477. [Google Scholar] [CrossRef]
  56. Amirihanza, H.; Shafieibafti, S.; Derakhshani, R.; Khojastehfar, S. Controls on Cu mineralization in central part of the Kerman porphyry copper belt, SE Iran: Constraints from structural and spatial pattern analysis. J. Struct. Geol. 2018, 116, 159–177. [Google Scholar] [CrossRef]
  57. Habibkhah, N.; Hassani, H.; Maghsoudi, A.; Honarmand, M. Application of numerical techniques to the recognition of structural controls on porphyry Cu mineralization: A case study of Dehaj area, Central Iran. Geosyst. Eng. 2020, 23, 159–167. [Google Scholar] [CrossRef]
  58. Zheng, D.; Ni, C.; Zhang, S.; Chen, Z.; Zhong, J.; Zhu, J.; Li, Y.; Yan, Y. Significance of the spatial point pattern and Fry analysis in mineral exploration. Arab. J. Geosci. 2020, 13, 883. [Google Scholar] [CrossRef]
  59. Anguera, J.; Andújar, A.; Jayasinghe, J.; Chakravarthy, V.; Chowdary, P.; Pijoan, J.L.; Ali, T.; Cattani, C. Fractal antennas: An historical perspective. Fractal Fract. 2020, 4, 3. [Google Scholar] [CrossRef] [Green Version]
  60. Karaca, Y.; Baleanu, D. A novel R/S fractal analysis and wavelet entropy characterization approach for robust forecasting based on self-similar time series modeling. Fractals 2020, 28, 2040032. [Google Scholar] [CrossRef]
  61. Babič, M.; Mihelič, J.; Cali, M. Complex network characterization using graph theory and fractal geometry: The case study of lung cancer DNA sequences. Appl. Sci. 2020, 10, 3037. [Google Scholar] [CrossRef]
  62. Sadeghi, B.; Cohen, D.R. Category-based fractal modelling: A novel model to integrate the geology into the data for more effective processing and interpretation. J. Geochem. Explor. 2021, 226, 106783. [Google Scholar] [CrossRef]
  63. Nazarpour, A. Application of CA fractal model and exploratory data analysis (EDA) to delineate geochemical anomalies in the: Takab 1: 25,000 geochemical sheet, NW Iran. Iran. J. Earth Sci. 2018, 10, 173–180. [Google Scholar]
  64. Saadati, H.; Afzal, P.; Torshizian, H.; Solgi, A. Geochemical exploration for lithium in NE Iran using the geochemical mapping prospectivity index, staged factor analysis, and a fractal model. Geochem. Explor. Environ. Anal. 2020, 20, 461–472. [Google Scholar] [CrossRef]
  65. Asadi, H.H.; Sansoleimani, A.; Fatehi, M.; Carranza, E.J.M. An AHP–TOPSIS predictive model for district-scale mapping of porphyry Cu–Au potential: A case study from Salafchegan area (central Iran). Nat. Resour. Res. 2016, 25, 417–429. [Google Scholar] [CrossRef]
  66. Berger, B.R.; Ayuso, R.A.; Wynn, J.C.; Seal, R.R. Preliminary model of porphyry copper deposits. US Geol. Surv. Open-File Rep. 2008, 1321, 55. [Google Scholar]
  67. Pirajno, F. Hydrothermal Processes and Mineral Systems; Springer Science & Business Media: Berlin/Heidelberg, Germany, 2008. [Google Scholar]
  68. Carranza, E.J.M. Controls on mineral deposit occurrence inferred from analysis of their spatial pattern and spatial association with geological features. Ore Geol. Rev. 2009, 35, 383–400. [Google Scholar] [CrossRef]
Figure 1. (A) Geological map of Sahlabad area (scale of 1:100,000) (modified [39]). Abbreviations: An = Andesite, Ba = Basalt, Co = Conglomerate, Dd = Dacitic dyke, Lm = Limestone, Lv = Listwanite, Ml = Ophiolite melange, Mt = Metadiabase, Qt = Quaternary sediments, Tu = Tuff, Ub = Ultrabasic rocks, Sch = Schist, Sh = Shale and sandstone. (B) Geographical location of Sistan structural zone in Iran.
Minerals 12 00549 g001
Figure 2. Selected polished sections prepared from collected samples of copper mineralizations in the Sahlabad area. (A) Mesgaran Deposit: Chalcopyrite and Fe-hydroxide; (B) Mesgaran Deposit: Malachite and Fe-hydroxide; (C) Chah-Rasteh Deposit: Fracture Filling Malachite; (D) Chah-Rasteh Deposit: Chalcocite, Fe-hydroxide and Chalcopyrite; (E) Zahri Deposit: Fracture Filling Malachite and Fe-hydroxide; (F) Zahri Deposit: Chalcopyrite, Malachite and Chalcocite.
Minerals 12 00549 g002
Figure 3. An overview of methodological flowchart used in this study.
Minerals 12 00549 g003
Figure 4. Rose diagram of faults by each of the types in the study area. The exact locations of the faults according to the colors assigned in the rose diagrams are shown in Figure 8 as a map.
Minerals 12 00549 g004
Figure 5. Rose diagram of all faults in the study area. Faults are divided into three categories based on frequency percentage: low frequency, medium and frequent, which are distinguished by blue, yellow and red colors, respectively.
Minerals 12 00549 g005
Figure 6. Fry analysis related to copper mineralization dispersion in the study area.
Minerals 12 00549 g006
Figure 7. Map of changes in residual magnetic field intensity and faults identified by airborne magnetometry in the Sahlabad area.
Minerals 12 00549 g007
Figure 8. Lineament factor (LF) map of Sahlabad area. The faults in the map are divided into four categories, inferred, minor, thrust and major, which are marked with red, cream, yellow and black colors, respectively. Faults were identified using information extracted from the geological map (Geological Survey of Iran (GSI)).
Minerals 12 00549 g008
Figure 9. Concentration–area (C–A) fractal diagram of faults in the Sahlabad area. The trend change is indicated by colored lines, and each sub-community is marked with the letters A to G, respectively.
Minerals 12 00549 g009
Figure 10. View of copper mineralization (malachite-azurite) points in fracture zone and andesitic-basaltic bedrock. (AC) Malachite-azurite mineralization in field survey (high-intensity LF); (D) an overview of fracture zone in field check points.
Minerals 12 00549 g010
Table 1. Classified information of 14 copper mineralization points in Sahlabad area.
RowCopper Mineralization NameAnomaly Center CoordinatesAnomaly Area
(Km2)
AlterationLithology
(Host Rock)
Cu Dominant Mineral
Longitude (E)Latitude (N)
1Mesgaran Deposit59°52′49″32°18′58′8Phy + Arg + Pp + Chl + QtzBa + AnbCpy + Mch
2Chah-Rasteh Deposit59°46′15″32° 21′19″4Phy + Arg + Pp + Chl + CabAn + AnbCh + Mch
3Zahri Deposit59°32′52″32°00′50″2Phy + Arg + Pp + HemUb + SchCpy + Ch + Mch
4Kasrab Abandoned Mine59° 59′45″32°21′05″3.8Phy + Arg + Pp + SepUbMch
5Cheshme-Zangi Abandoned Mine59°59′08″32°25′02″2.5Phy + Arg + Pp + SilicificationLimestone shale + ListwaniteCpy + Mch
6Shir-Shotor Indice59°53′50″32°14′28″1Arg + Pp + SepAn + Serpentinite (Ub)Mch + Az
7Dastgerd Indice59°43′39″32°21′03″2Arg + Pp + Sep + HemHarzburgiteMch
8Torshaab Indice59°59′56″32°28′48″5Phy + Arg + Pp + Hem + LmSchMch + Az
9Chah-Anjir Indice59°53′37″32°15′44″2Pp + SepSerpentinite (Ub)Mch + Az
10Zargaran Indice59°47′09″32°21′14″1Phy + Arg + Pp + Lm + Goe + HemAn + DbMch + Az
11West Mesgaran Indice59°52′26″32°19′36″1.5Arg + Pp + Hem + LmMtdCpy + Mch + Az
12Mirsimin Indice59° 54′58″32°17′53″9Arg + Pp + HemDbCpy + Mch + Az
13Kuharod Indice59°50′31″32°18′01″1Phy + Arg + Pp + HemDbMch
14Barghan Indice59° 39′38″32°09′05″2Arg + Pp + Lm + Geo + HemDb + LimestoneMch
Abbreviations: Cpy = Chalcopyrite, Py = Pyrite, Mch = Malachite, Ch = Chalcocite, Az = Azorite, Ba = Basalt, An = Andesite, Anb = Andesite-Basalt, Ub = Ultrabasic, Sch = Schist, Db = Diabase, Mtd = Metadiabase, Chl = Chlorite Alteration, Qtz = Quartz Alteration, Cab = Carbonate Alteration, Pp = Propylitic Alteration, Arg = Argillic Alteration, Phy = Phyllic Alteration, Sep = Serpentine Alteration, Hem = Hematite Alteration, Lm = Limonite Alteration, Goe = Goethite Alteration.
Table 2. Range of lineament factor values obtained from the concentration–area (C–A) fractal model of faults in the Sahlabad area.
CommunitiesBackgroundMedium IntensityHigh Intensity
Sub-CommunitiesABGDEFG
LF ThresholdLess than 1212–1515–2222–2626–3030–41More than 41
Table 3. Copper mineralization distance from regional faults and LF high-intensity community.
Distance from LF High-Intensity Community
(Km)
Distance from Regional Faults
(Km)
Copper MineralizationRow
1.91.1Mesgaran Deposit1
4.10.95Chah-Rasteh Deposit2
0.45CoincidentZahri Deposit3
4.3CoincidentKasrab Abandoned Mine4
CoincidentCoincidentCheshme-Zangi Abandoned Mine5
2.79CoincidentShir-Shotor Indice6
3.671.64Dastgerd Indice7
1.8CoincidentTorshaab Indice8
1.520.8Chah-Anjir Indice9
3.51.49Zargaran Indice10
1.341.25West Mesgaran Indice11
CoincidentCoincidentMirsimin Indice12
1CoincidentKuharod Indice13
1.59CoincidentBarghan Indice14
1.990.51Average Distance (Km)
Publisher’s Note: MDPI stays neutral with regard to jurisdictional claims in published maps and institutional affiliations.

