Article

Geochemistry and Mineralogy of Ferromanganese Crusts from the Western Cocos-Nazca Spreading Centre, Pacific

by
Dominik Zawadzki
1,*,
Łukasz Maciąg
1,
Iker Blasco
2,
Francisco Javier González
2,
Benjamin Wernette
3,
Egidio Marino
2,
Gabriela A. Kozub-Budzyń
4,
Adam Piestrzyński
4,
Rafał J. Wróbel
5 and
Kevin McCartney
6
1
Institute of Marine and Environmental Sciences, University of Szczecin, Adama Mickiewicza 16, 70-383 Szczecin, Poland
2
Geological Survey of Spain (IGME-CSIC), 28003 Madrid, Spain
3
Earth and Ocean Sciences, Duke University, 9 Circuit Drive, Durham, NC 27708, USA
4
Faculty of Geology, Geophysics and Environmental Protection, AGH University of Science and Technology, 30-059 Kraków, Poland
5
Faculty of Chemical Technology and Engineering, West Pomeranian University of Technology, Pułaskiego 10, 70-322 Szczecin, Poland
6
Department of Environmental Science and Sustainability, University of Maine at Presque Isle, Presque Isle, ME 04769, USA
*
Author to whom correspondence should be addressed.
Minerals 2022, 12(5), 538; https://doi.org/10.3390/min12050538
Submission received: 21 March 2022 / Revised: 12 April 2022 / Accepted: 22 April 2022 / Published: 26 April 2022
(This article belongs to the Special Issue Oceanic Ferromanganese Deposits)

Abstract

:
Late Pleistocene–Holocene rocks from the western part of Cocos-Nazca Spreading Centre (C-NSC) include ferromanganese crusts that elucidate the geochemistry and mineralogy of a deep-sea geological setting. Six representative Fe-Mn crust samples were studied using petrological methods, such as optical transmitted light microscopy, energy dispersive X-ray fluorescence spectrometry, inductively coupled plasma mass spectrometry, bulk X-ray diffraction, scanning electron microscopy and electron probe microanalysis. Geochemical, mineralogical and petrological signatures indicate complex formation influenced by mild hydrothermal processes. These crusts consist mostly of mixed birnessite, todorokite-buserite, and Mn-(Fe) vernadite with traces of diagenetic manganates (asbolane), Fe-oxides and oxyhydroxides or hydrothermally associated and relatively pure Mn-oxyhydroxides (manganite). The average Mn/Fe ratio is 2.7, which suggests predominant mixed hydrogenous-early diagenetic crusts with hydrothermal influences. The mean concentrations of three prospective metals (Ni, Cu and Co) are low: 0.17, 0.08 and 0.025 wt %, respectively. The total content of ΣREY is also low, and ranges from 81 to 741 mg/kg (mean 339 mg/kg). We interpret the complex geochemical and mineralogical data to reflect mixed origin of the crusts, initially related with formation of hydrothermal plume over the region. This process occurred during further interactions with seawater from which additional diagenetic and hydrogenetic elemental signatures were acquired.

1. Introduction

Despite more than 40 years of research on marine ferromanganese (Fe-Mn) crusts, knowledge remains limited and new discoveries provide added geochemical and mineralogical data on formation mechanisms, from either Exclusive Economic Zones (EEZ) [1,2,3,4], or from waters outside national jurisdictions [5,6,7]. Recently, high-resolution analyses of critical minerals and elements have focused on crusts formation to distinguish hydrogenetic and diagenetic origins [8]. In addition, numerous studies have addressed the identification and distribution of critical metals, such as rare earth elements and yttrium (REY), cobalt or platinum in mineral phases [9,10,11]. Studies of crusts from the South China Sea, Western Pacific Ocean and Canary Island Seamount Province note that light REY are preferentially adsorbed onto δ-MnO2 (vernadite), while heavy REY are associated with amorphous Fe-oxides and hydroxides, mainly FeOOH. Several authors concentrate on growth rate estimation and crustal formation stages reconstruction [12,13], while others focus on mineral resource assessment at regional and local scales, with particular emphasis on critical elements (e.g., Co, Te, REY) [14,15]. The Be isotope age models indicate continuous growth from ocean substrate to surface at Takuyo-Daigo Seamount, NW Pacific, with a fairly constant growth rate of 2.3–3.5 mm/Myr during the past 17 Ma [13].
Marine Fe-Mn deposits are traditionally divided into three genetic classes: hydrogenetic, diagenetic and hydrothermal [16,17]. Additionally, mixed-signature crusts have been found [10]. Hydrogenetic Fe-Mn crusts form by precipitation from cold ambient bottom waters, or by a combination of hydrogenetic-hydrothermal input in areas of hydrothermal venting, such as oceanic spreading centres, volcanic arcs, and hotspot volcanoes [18]. Hydrogenetic Fe-Mn crusts contain subequal amounts of Fe and Mn, enriched in Co, Pb, Te, Bi, and Pt relative to concentrations in lithosphere and sea water [19]. These Fe-Mn crusts usually form at hard rock substrates throughout the oceanic basins, including flanks and summits of seamounts, ridges, plateaus, and abyssal hills, at depths between 400 and 7000 m where rocks have been swept clean of sediments at least intermittently for millions of years. In some instances, the Fe-Mn crusts form oxyhydroxide-rich pavements up to 250 mm thick (mean thickness varying within 2–4 cm), mostly on rock outcrops, or coatings on talus debris [20]. The thickest crusts occur in a depth interval of 800 to 2500 m and indicate high concentrations of critical metals [21]. Some studies set this depth in the anoxic zone at depths of about 1 to 1.5 km [22,23,24]. Crust nucleation is extremely slow, with mean growth rates of 1–5 mm/Myr. Mn-oxide hydrothermal crusts, sometimes called “stratabound”, precipitate directly from low temperature hydrothermal fluids, and usually grow significantly at a more rapid rate, even up to 1600–1800 mm/Myr [25].
A number of relatively thin Fe-Mn crusts were unexpectedly discovered and recovered during the April–May 2018 Cocos-Nazca cruise (R/V Sally Ride, Leg 1806), recovered in areas close to the regional spreading centre axis. A few samples were recognized as Fe-Mn crust.
The aim of this contribution is to provide detailed geochemical and mineralogical study of initial Fe-Mn crusts collected from the western portion of Cocos-Nazca Rift (C-NR), with analysis to determine their formation conditions. This is the first study of the Late Quaternary Fe-Mn crust from the western C-NSC.

1.1. Ferromanganese Crust Occurrences in the Cocos-Nazca Ridge
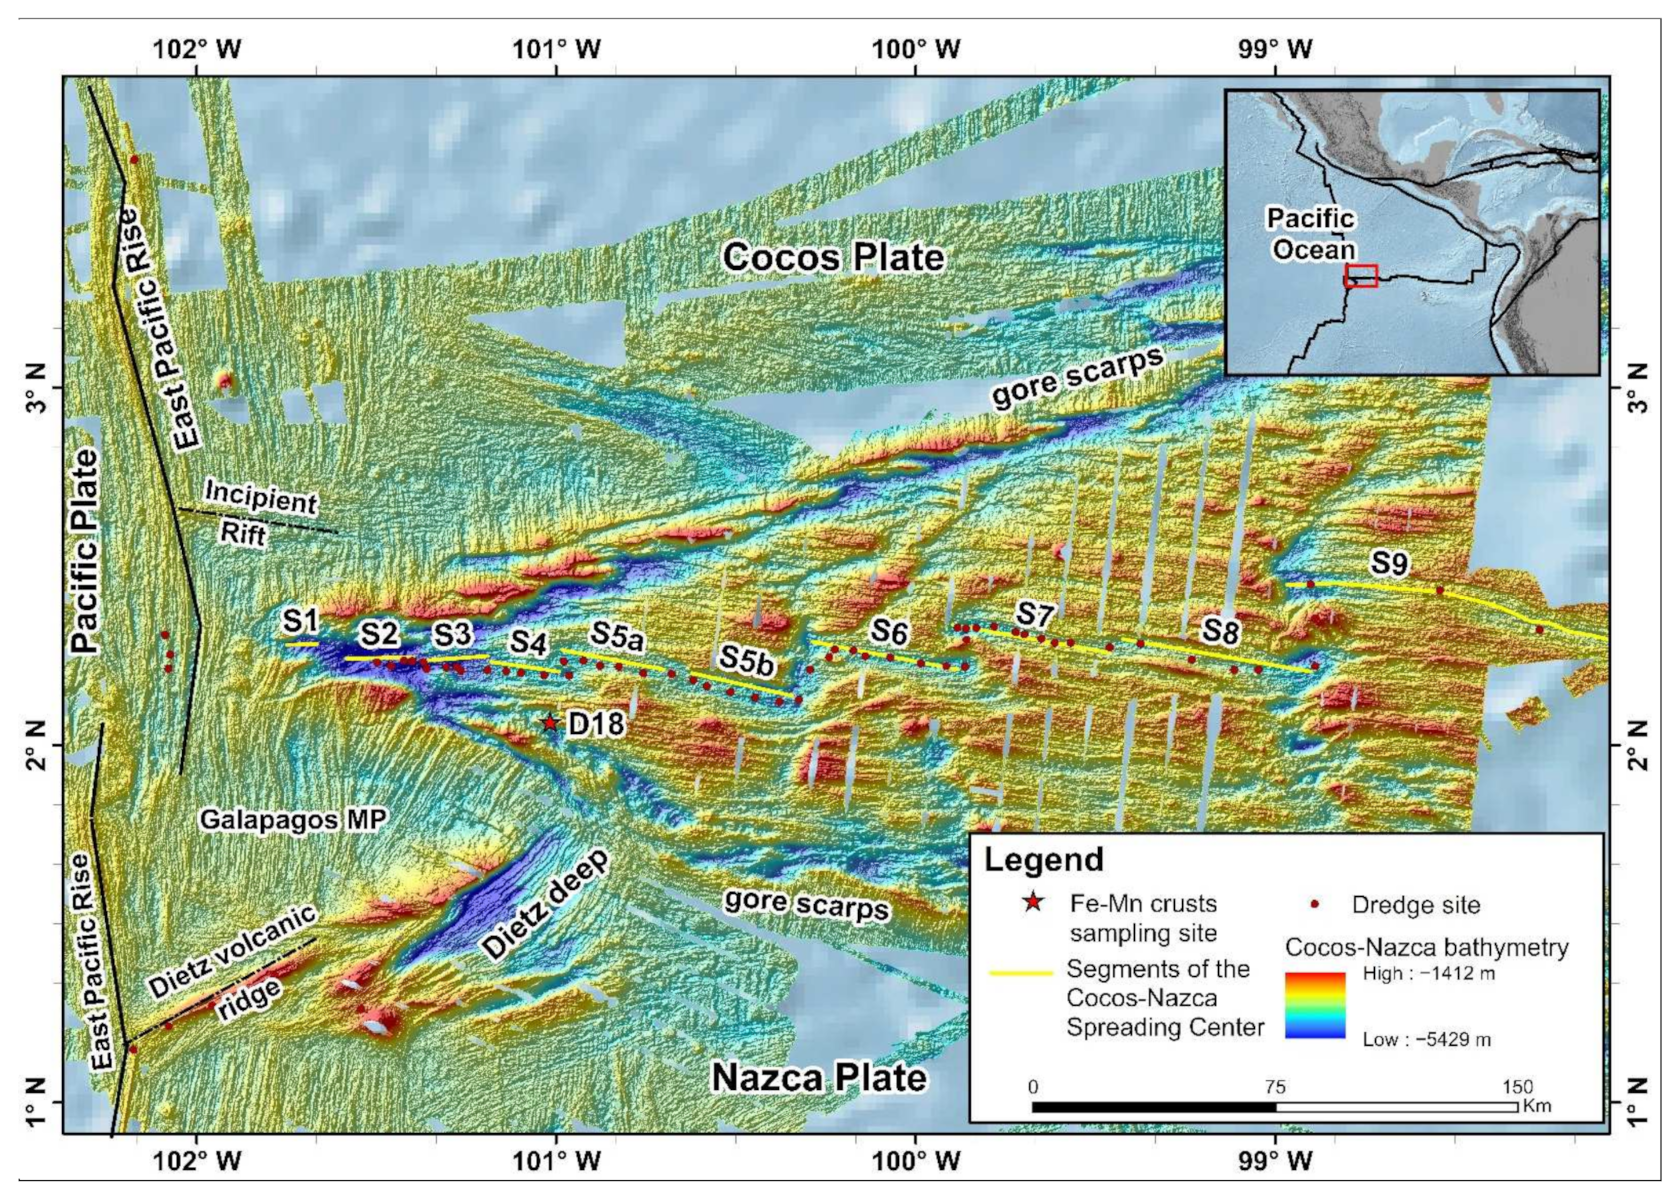
The Galapagos Spreading Center (GSC) located east of the Cocos-Nazca (C-N) region, at approximately 98° W, extensively studied in 1970s and 80s, provide detailed geophysical and geochemical data of the eastern GSC flank [26]. Here, increased heat-flow and associated hydrothermal activity was discovered in a number of localities, especially near seafloor mounds [27,28,29]. Deep Sea Drilling Project (DSDP) Leg 70 provided Fe-Mn crusts with included encrustations of hydrothermal mounds and sedimentary sections [30,31,32]. These localities occur within a zone of high biological productivity associated with sedimentation processes [31]. Sediment thickness consists of foraminifer-nannofossil oozes interbedded with hydrothermally associated nontronite-rich pelagic and siliceous foraminifer-nannofossil oozes [33,34] that increase rapidly and regularly away from the spreading axis. In some cases, the uppermost sediment layer was covered by hydrothermal Fe-Mn crusts and metal-rich muds, especially within intensely oxidized greenish nontronite-rich association [31]. Based on magneto- and biostratigraphy, the hydrothermal activity in the eastern GSC started about 300 ka [35].
The Fe-Mn crusts recovered during Leg 70 consist of brownish-black, flat to saucer-shaped angular fragments, ranging from 10–40 mm width to 1–5 mm thickness. Surface textures were finely granular, though some samples showed botryoidal-concretionary growth patterns [31]. Several fragments were brittle, with freshly broken pieces showing in cross-section dense metallic luster, locally micro-laminated and ubiquitously covered with a thin (<2 mm) coating of soft and porous black Mn-oxides. X-ray diffraction analyses indicated the presence of intermixed todorokite-buserite and birnessite, with lesser unidentified amorphous Fe-Mn phases. Varentsov et al. [36] suggested that the Leg 70 crusts formed in a less oxidized environment, possibly the result of growth at a slightly subsurface level or influenced by discharged hydrothermal plume solutions. Additionally, admixtures of dioctahedral Fe-rich smectite (nontronite), Fe-mica (celadonite), quartz, feldspars, zeolites (phillipsite), calcite, goethite and halite were observed. U-Pb dating estimated that the Fe-Mn crusts formed on mound tops at about 20–60 ka [37].
Moore and Vogt [38] first studied C-N hydrothermal and hydrothermally altered hydrogenetic manganese crusts and described 2–6 cm thick intervals from two sites near the Galapagos spreading axis. Those samples were characterized by low Fe/Mn and 232Th/238U ratios, as well as deposition rates several orders of magnitude faster than more common hydrogenetic nodules, with estimated age of these crusts given as 2400 to 300 ka [38]. A few hydrothermal and mixed hydrothermal-hydrogenetic crusts were discovered around hydrothermal vents in the eastern part of GSC during the GARIMAS project (Galapagos Rift Massive Sulphides) during the middle 1980s aboard the R/V Sonne. These samples were dominated mainly by Mn (up to 82% as MnO) and some were characterized by increased Fe content (45–55% as Fe2O3). These iron-rich samples were composed mainly of amorphic Fe-oxides, birnessite and clay minerals (mainly montmorillonite and illite) [39,40]. REE concentration in GARIMAS samples was low and ranged from 1.3–9.0 mg/kg. The samples described in this study are likely younger than previously described crusts, since the collection sites are west of C-NSC at a distance near (16 km) to the spreading axis.

1.2. Study Area

The Cocos-Nazca Spreading Center is located in the eastern equatorial Pacific Ocean (Figure 1). The C-N portion studied here consists of nine second-order ridge segments, marked s1 to s9 on Figure 1, which generally increase in length from west (s1; ~14 km) to east (s9; >50 km). Off-axis bathymetry indicates linear axis-parallel ridges with well-defined magnetic anomalies that show normal magmatic spreading [41]. The C-N axis is deepest near Hess Deep (~4100 m along s2) and progressively shoals eastwards to ~2700 m along s9 accompanied by an increase in segment spreading rate westwards. Smith and Schouten [42] suggested full-spreading rates of 16, 19, and 24 mm/yr for s1 to s3, respectively, and plate motion model NUVEL-1A [43] estimated full-spreading rate of 40 mm/yr for segments located further east. Recently obtained data show rifting progression related to formation of magmatic spreading center over the first three segments (s1–s3), which opened between Cocos and Galapagos at the current extremely slow rates of ~16–24 mm/yr. Segments s4–s9 occurred prior to 1.4 Ma in the faster-spreading regime (~40 mm/yr) [41]. The distribution of Bouguer mantle anomalies suggest that crustal thickness increased from west to east. Lonsdale [44] proposed the transition from tectonic to magmatic seafloor spreading to occur in vicinity of s2. Smith et al. [45] established that the axis orientations for s1, s2 and s3 differ from those located further to the east, with the transition from Cocos-Galapagos to Cocos-Nazca Spreading Center [42,45,46].
Prior to the 2018 research cruise aboard the R/V Sally Ride (SR1806), rock sampling in this area had been limited to eight dredges collected along ~350 km of the rift length [47,48,49], and ODP 147 (Sites 894–895) located in the Hess Deep and nearby Intrarift Ridge [50,51,52,53]. Before this contribution, the off-axis C-N abyssal hills were unsampled.
In a broader context, C-NR separates the Cocos Plate from the Nazca Plate and Galapagos Microplate (MP) (Figure 1). Traditionally, the location where C-N tip plates meet the East Pacific Rise (EPR) has been described as a ridge-ridge-ridge triple junction [54], however recent studies have shown that the rift tip terminates ~35 km east of EPR. The oceanic crust was fractured about ~0.5 Ma and shifted from EPR [42,44,55,56]. Transient rifts to the north (Incipient Rift, ~2°40′ N) and south (Dietz Volcanic Ridge, ~1°10′ N) of C-N form true ridge-ridge-ridge intersections with their adjacent EPR segments. Toward the east, the C-N merges into what is more commonly called the GSC. Westward propagation (~65 mm/yr [57]) of C-N has produced a V-shaped gore, the bounding faults of which mark the transition from the rough C-N topography to smoother terrain of EPR-generated Cocos and Nazca Plates (Figure 1). The Galapagos Spreading Center includes at least 12 active vent fields, however only five of these are confirmed with the remaining seven inferred [58,59].

2. Materials and Methods

2.1. Sample Collection and Data Processing

The Fe-Mn crust samples from C-NSC were collected during an April–May 2018 cruise abroad R/V Sally Ride (SR1806). The cruise aim was to perform geophysical surveys and dredge rock samples along the western C-NSC, with the overall goal to elucidate development of magmatic seafloor spreading near the Galapagos Triple Junction.
Dredge sites were selected based on bathymetric data acquired with the Kongsberg EM122 multibeam echosounder and logged by Kongsberg 123 SIS software (Seafloor Information System, v. 4.3.2; Kongsberg Maritime, Kongsberg, Norway). Dredge D18 was deployed (5 April 2018) off-axis, with start and end coordinates of 2°4.30′ N; 101°1.47′ W and 2°3.85′ N; 101°1.01′ W, respectively. Samples of Fe-Mn crusts were collected using rectangular rock dredge with total weight of collected samples at ~18 kg. The dredging depth ranged from 3193 to 2814 m and was performed ~20 km perpendicular to the spreading axis and south of segment 4. Five rock types were distinguished onboard: (i) volcanic breccia, (ii) olivine-rich basalt with Fe-Mn crusts, (iii) larger serpentinite breccia, (iv) smaller serpentinite breccia, and (v) basaltic rubble. D18 was the only dredge in which Fe-Mn crust was identified, and unlike other dredges collected during the cruise was visibly older, with an absence of glass and crusts of various thickness. Breccia clasts and basalts fragments were characterized by porphyritic textures with medium to fine grain size [60].

2.2. Methods

Rock pre-processing took place directly onboard. Samples were divided and shipped to the Institute of Marine and Environmental Sciences, University of Szczecin, Poland and to Geological Survey of Spain (The Instituto Geológico y Minero de España = IGME), Madrid, Spain. Selected crustal portions were pulverized in an agate mortar for energy dispersive X-ray fluorescence spectrometry (EDXRF), inductively coupled plasma mass spectrometry (ICP-MS) and X-ray diffraction (XRD). Other sections were prepared for analysis with scanning electron microscope (SEM), as well as electron probe microanalysis (EPMA). For this purpose, five grain mounts from each of four crust samples were cut, mounted in epoxy resin, and polished.
Major elements (Fe, Mn, Si, Al, Mg, K, Ca, Na, P and Ti) were determined by analysis of powdered and press-pelleted samples with a PANalytical Epsilon 3 EDXRF spectrometer (Royston, UK) at the Faculty of Chemical Technology and Engineering, West Pomeranian University of Technology, Szczecin, Poland following methods of [61]. The spectrometer was equipped with silicon drift detector and ceramic X-ray tube (50 kV, 9 W). Analysis was performed in helium atmosphere with a count time of three minutes per sample. Chemical element measurements were estimated by standardless Omnian software.
Minor and trace element concentrations to include rare earth elements and yttrium (REY) were determined following near-total digestion in a mixture of four acids (HNO3, HClO4, HF and HCl) with ICP-MS (ELAN 9000, PerkinElmer Instruments, Waltham, MA, USA) at the Bureau Veritas Commodities Canada Ltd. after [62]. The REY concentrations were normalized to Post-Archean Australian Shale (PAAS) [63]. The Ce anomaly was calculated from = 0.5LaSN + 0.5PrSN [64]. Light to heavy rare earth elements ratio (LREESN/HREESN) was calculated from = (LaSN + 2PrSN + NdSN)/(ErSN + TmSN + YbSN + LuSN) [65].
Back-scattered electron (BSE) images, X-ray compositional mapping, and quantitative analyses of mineral phases were obtained by a JEOL SuperProbe JXA-8230 electron probe microanalyzer (EPMA; JEOL, Tokyo, Japan) at the Laboratory of Critical Elements, AGH University of Science and Technology, Kraków, Poland. The operating conditions were accelerating voltage of 15 kV and probe current 20 nA, with 1 μm diameter beam was used for Fe-Mn oxides, while a 3–5 μm diameter beam was used for P-bearing minerals and aluminosilicates. Counting times of 20 s at the peak and 10 s against both positive (+) and negative (−) backgrounds were applied. Wavelength-Dispersive X-ray Spectroscopy X-ray compositional maps were developed using a 15 kV accelerating voltage, 20 nA beam current, 50 ms dwell time, 1 μm step size and focused beam. Data were corrected with the ZAF procedure (Z = atomic number correction; A = absorption correction; F = characteristic fluorescence correction). In total, 202 analytical spots from the 6 samples were registered: 176 for Mn-Fe oxyhydroxides and oxides, 17 for phyllosilicates and mixtures of clays and Mn-Fe oxyhydroxides, 9 for debris minerals.
Bulk mineralogy was studied with a PANalytical Empyrean diffractometer (Malvern PANalytical, Malvern, UK) at West Pomeranian University of Technology, Szczecin. Analytical settings were as follows: monochromatic CuK-α radiation at 35 kV and 30 mA, scans from 5–85° (2Θ), step size 0.02 (2Θ), application of wide-angle detector (PIXcel 3D, Malvern PANalytical, Malvern, UK). The XRD data were processed by Crystal Impact Match!3 software (Crystal Impact, Bonn, Germany) and crystallography open database (COD) database [66]. Due to the long time span between collection and analysis and free air exposition, some samples that contained birnessite might be partially transformed to buserite and todorokite [67]. For the proper XRD recognition of collapsed phyllomanganates. Before analysis, crust samples were dried for 24 h at 40 °C, then roasted at 105 °C for 24 h [8,68,69,70].
SEM images were obtained by a JEOL JSM 6335F (JEOL, Tokyo, Japan) with a cold (cathode) field-emission electron gun and performed on 8 selected crustal fragments. The SEM maximum resolution was 1.5 μm with 15 kV voltage and 4 mm working distance. The backscattered electron detector was used at 2 μm resolution and 8 mm working distance. Analyses were performed at Centro Nacional de Microscopía Electrónica,, Madrid, Spain. Fragments were selected both from the surface as well as internal layers of those crusts more than 0.2 cm thick: (i) subsamples from the SIO0000BP sample were recovered both from the surface as internal lamination; (ii) parts of sample SIO0000BQ were selected from internal layers, and (iii) from sample SIO00003U as fragments from surface and internal layers.
Mineral types were distinguished based on stoichiometry calculated from EPMA spot data as well as comparison with XRD and SEM images. Both methods indicated several specific features of analyzed minerals such as textural variability, crystal habit, impurities, or amount of indetermined compounds (“rest”). Chemical formulae of selected phases were taken from The Mineralogy Database [71].

2.3. Data Processing, Statistics and Basic Calculations

Basic statistical parameters as well as Pearson correlation coefficients and factor analysis (FA) were conducted with StatSoft Statistica v.8 (StatSoft, Inc., Tulsa, OK, USA). Discrimination and spider diagrams plotted with Grapher v.10 (Golden Software Inc., Golden, CO, USA). The variable cases for statistics were deleted pairwise, where a correlation between each variable pair is calculated where present. FA was performed for all analyzed samples with final factors expressed by normalized varimax rotation enabling to determine potential geological factors that affect crust formation processes.
The Co-chronometer was applied to estimate growth rate (GR) and age of analyzed Fe-Mn crusts [72]. GR was calculated for bulk samples with the equation: GR = 6.8 × 10⁻¹/(Con)1.67 (mm/Myr), where: Con = Co × 50/Fe + Mn (all metal contents in wt %). This method is reliable for age estimation of young Fe-Mn crusts [20]; however, calculated GR should be considered a maximum as this does not include growth hiatuses. Additionally, we applied the “back stripping method” in conjunction with Co-chronometer data, for age estimation of sample SIO000D2 [73]. Total crust thickness and metal contents were measured directly using EPMA for each colloform group in the sample, then the age of each divided textural type was estimated.

3. Results

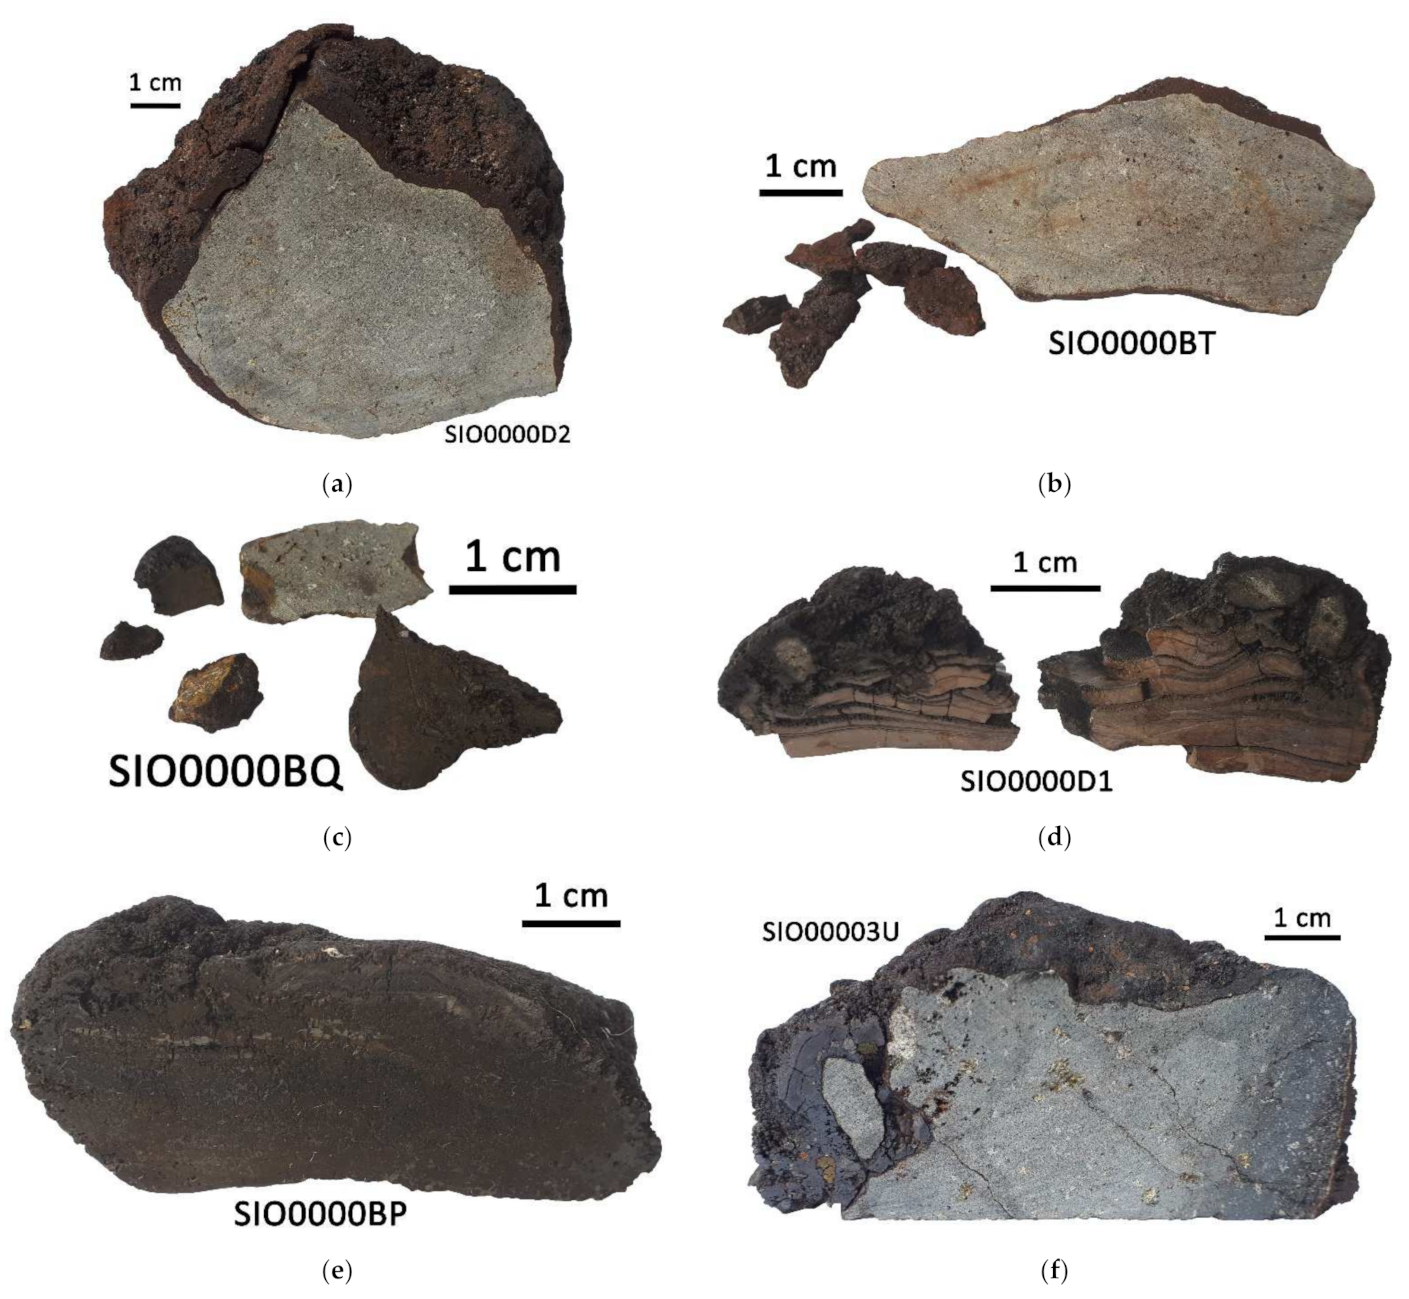
3.1. General Description and Morphology of Crusts

In total, six samples that included Fe-Mn encrustations were chosen for detailed mineralogical and geochemical analysis. These crusts were divided into three textural types according to macroscopic features (Table 1):
  • Non-laminated: Black basaltic substrate, the crust has a smooth botryoidal texture. This crust is fragile and loosely connected to the substrate (Figure 2a–c).
  • Layered: dark grey to brownish crust without substrate. These layered crusts show a submetallic luster and low hardness (Figure 2d,e).
  • Transitional: crust with botryoidal texture. Basalt substrate covered by a thick laminated dark grey crust, and partially thick black non-laminated crust (Figure 2f).
The samples do not show macroscopic traces of phosphatization or signs of thermal alteration. The substrate is usually intensely altered and displays the presence of thin brown-reddish layer of Fe-rich oxyhydroxides mixed with decomposed palagonite. Samples with substrate are generally Fe-richer than those without substrate, as reflected by the slightly reddish hue of crust forming minerals (Figure 2). Additionally, greenish-yellowish patches of Fe-rich clays were observed in the crust-substrate transition zone.

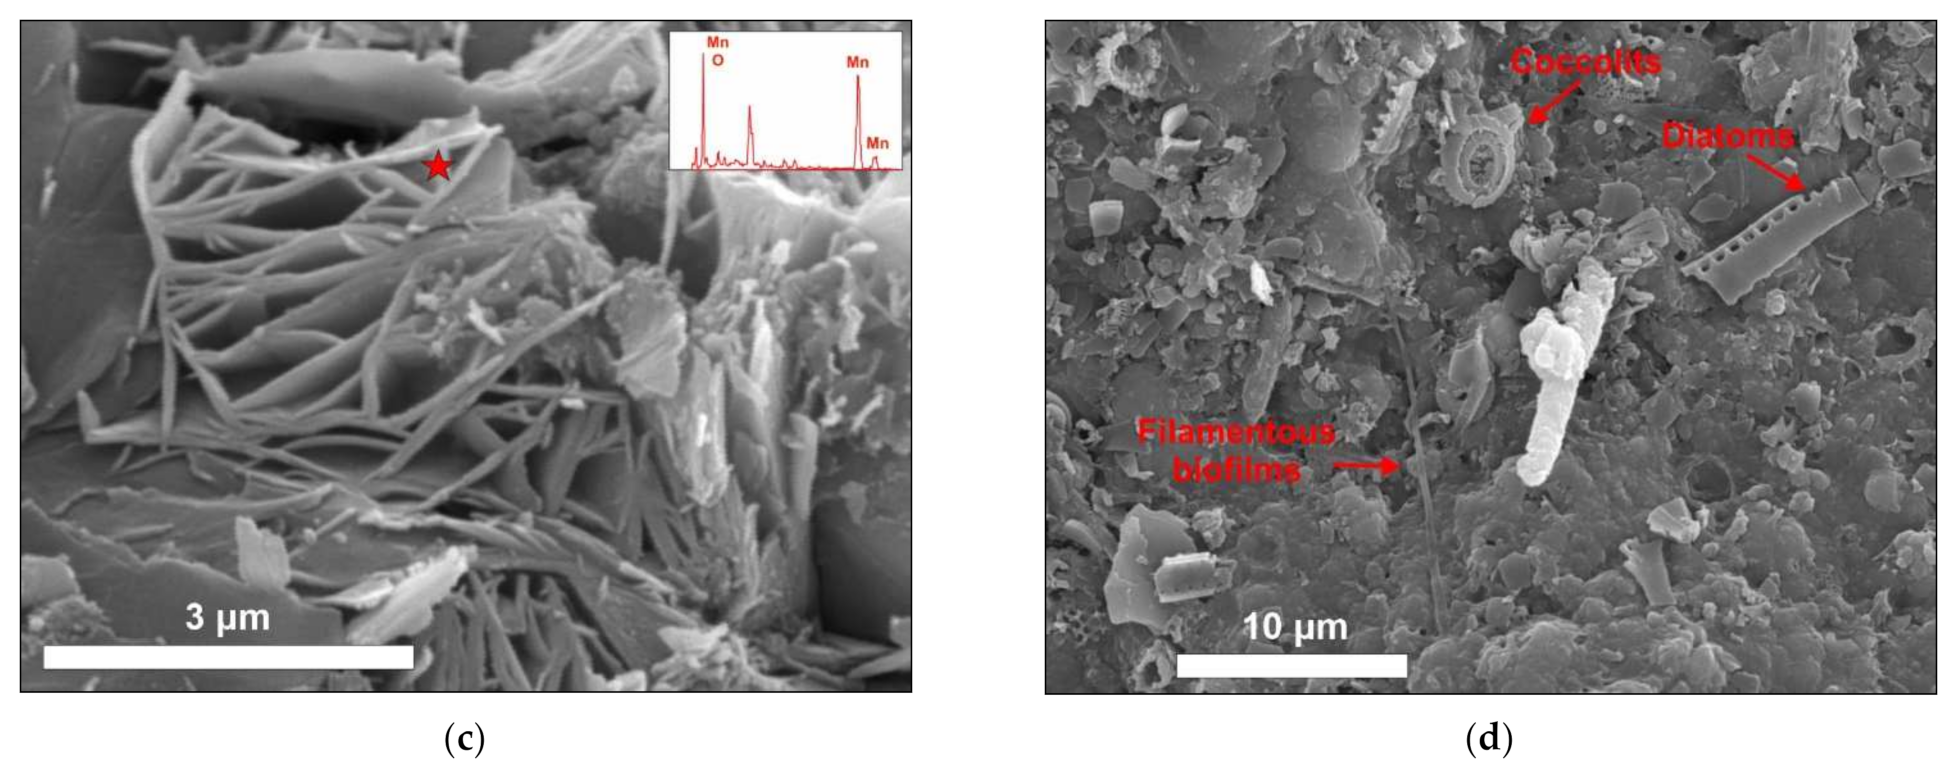
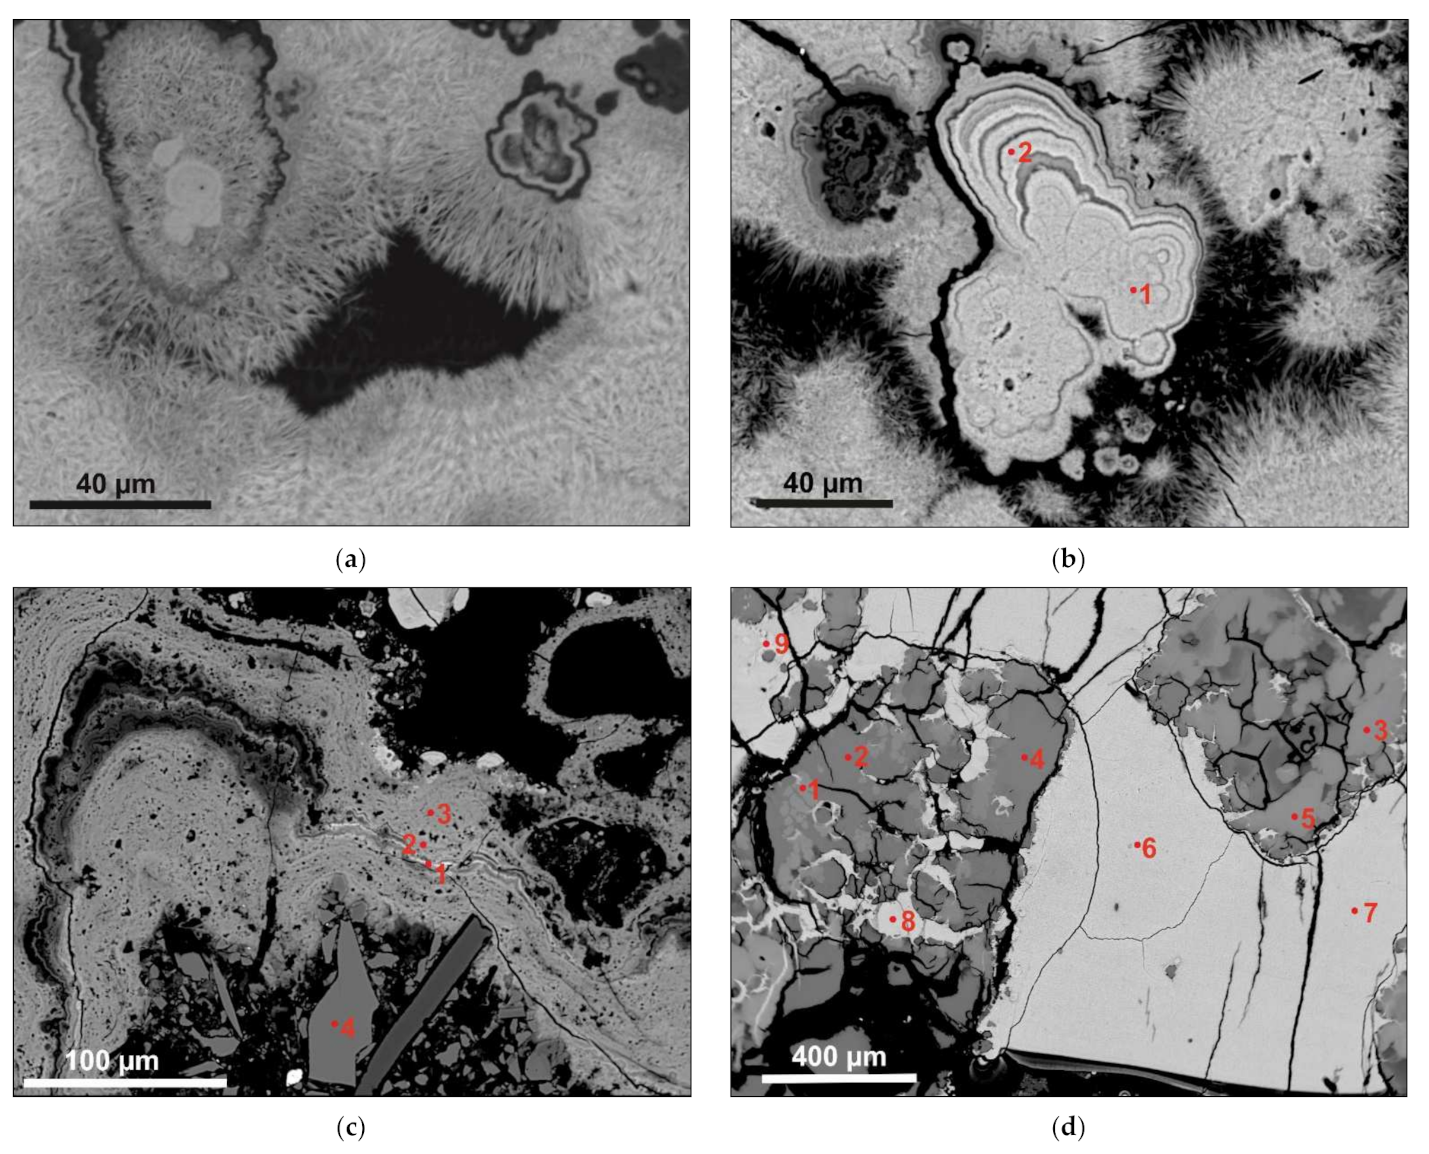
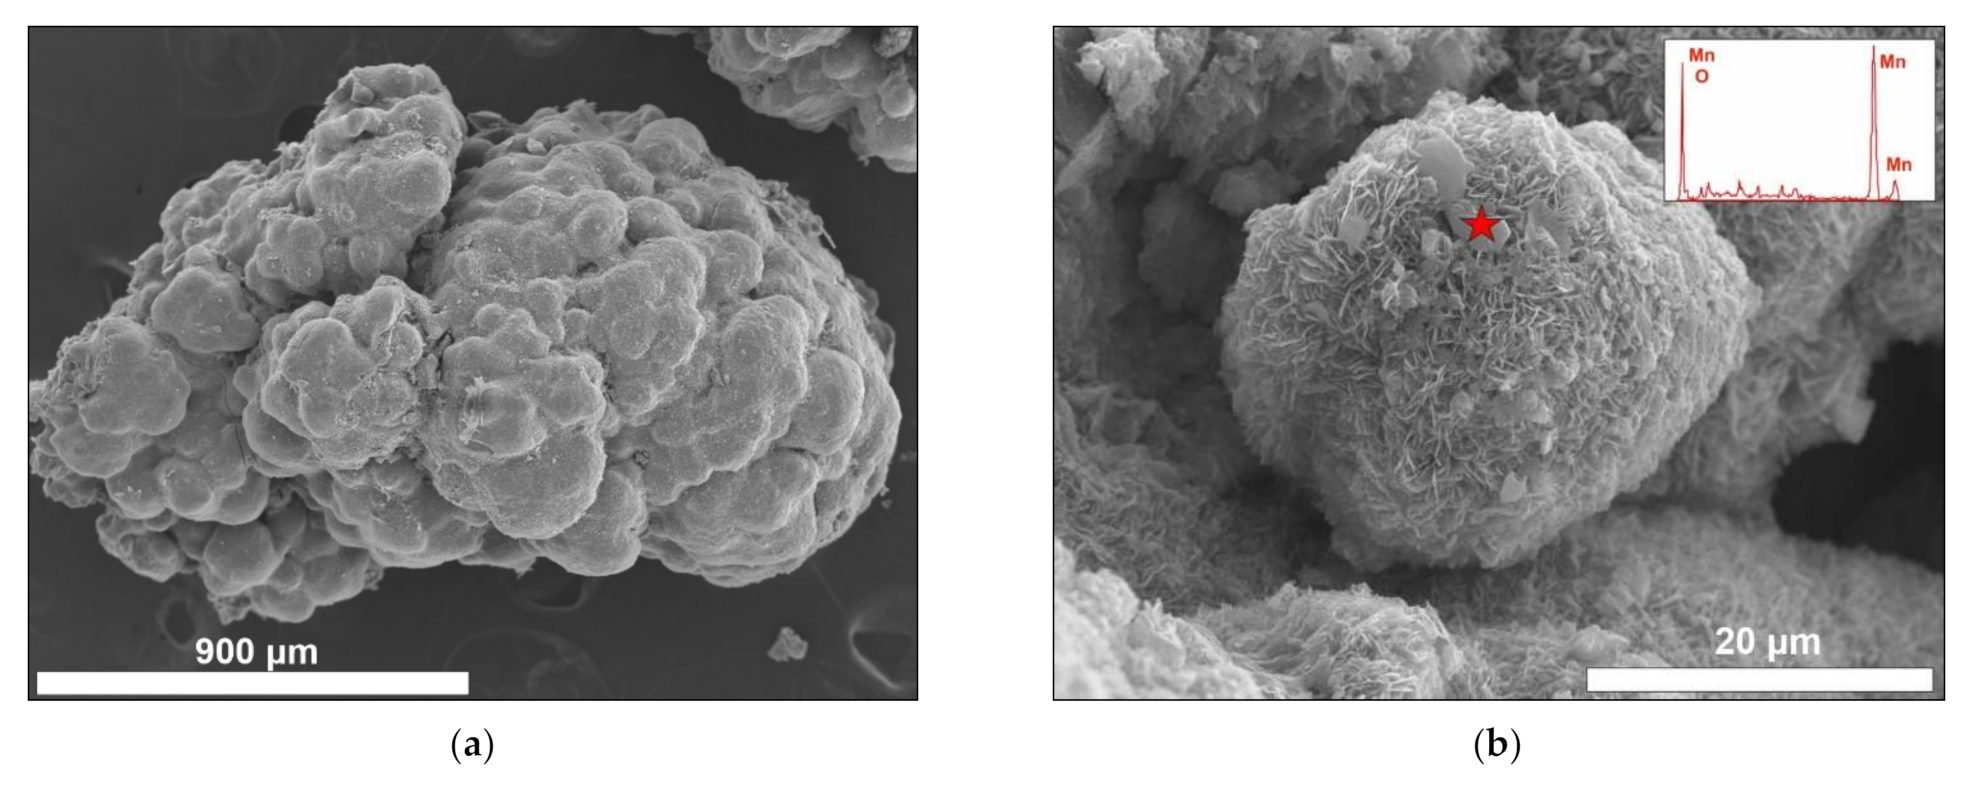
3.2. SEM Textural Description

The analyzed crusts show a large variety of Mn-(Fe) oxyhydroxide growth patterns. The oxyhydroxides are observed as isotropic, low reflectivity and low to no pleochroic micro-crystalline mosaics. SEM analyses indicate low crystallinity of Mn-(Fe) oxyhydroxides, display a micro-botryoidal surface texture as observed in samples SIO0000BP (Figure 3a) and SIO0000BQ. The Mn-(Fe) oxyhydroxides cover previously formed minerals, porosity walls or detrital minerals and bioclasts, especially abundant in sample SIO0000BQ. The bioclasts are fragmented coccoliths and foraminifers, with maximum size 100 µm, included in laminations. Mn-oxyhydroxides forming radial and globular micro-aggregates are observed in sample SIO00003U (Figure 3b) being integrated by acicular micro-crystals of nanometer dimensions with clay-like morphologies (Figure 3c). Sample SIO0000BQ shows filamentous structures of potential microbial growth. The filaments are elongated structures (>10 µm), with a small diameter (~1 µm) and appear commonly in isolated groups often being covered with Fe-Mn-rich oxyhydroxide precipitates (Figure 3d).

3.3. Bulk Analysis

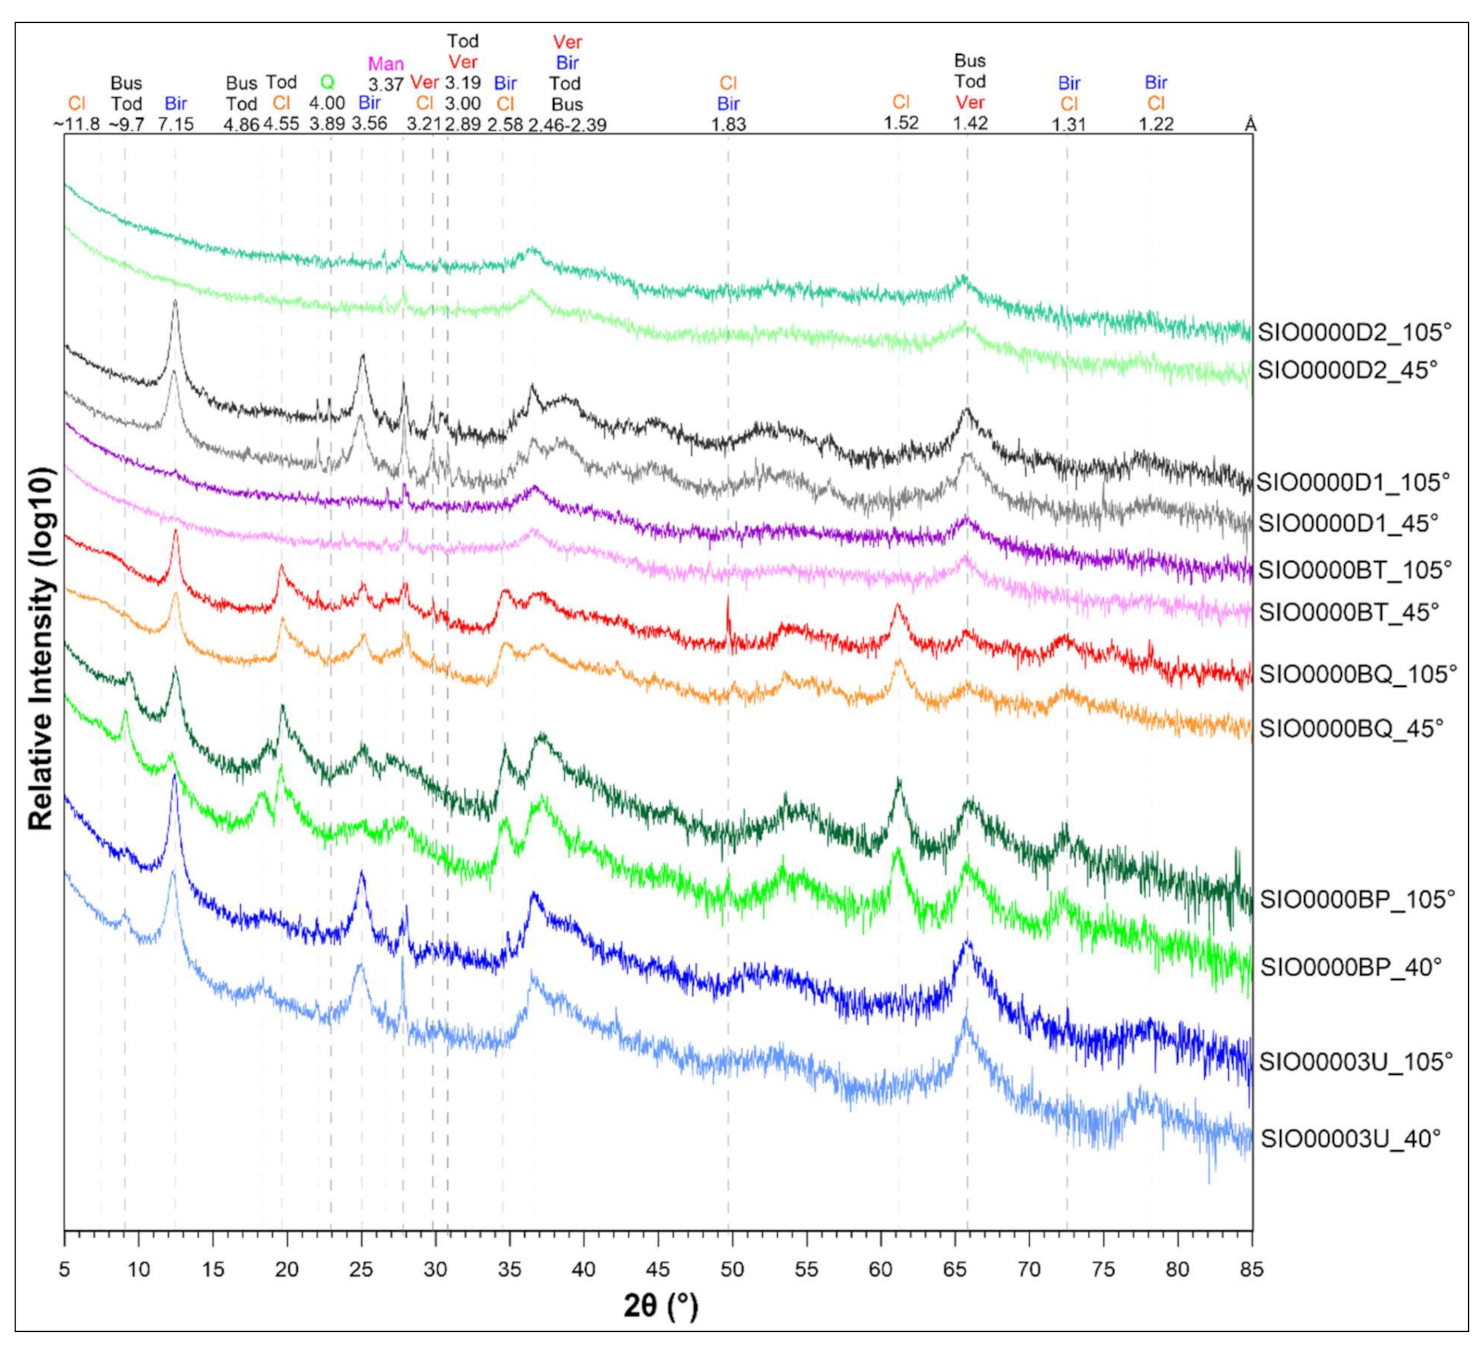
3.3.1. Mineralogy (XRD)

According to comparison of 40 °C heated/105 °C roasted samples, crusts from the study area are composed mainly of ~7 Å phyllomanganates, dominated with birnessite (Na, Ca, K)x (Mn+4, Mn+3)2O4 × 1.5 (H2O), mainly Na-birnessite. The presence of a low amount of collapsed ~10 Å manganates (todorokite-buserite) was observed in samples SIO00003U and SIO0000BP. The relative presence of todorokite (Na, Ca, K)2 (Mn+4, Mn+3)6O12 × 3–4.5 (H2O) in both samples does not exceed a few percent, whereas collapsed buserite (double hydrated birnessite, e.g., Na4Mn14O27 × 21H2O, formally disapproved by the IMA International Mineralogical Association), or pure manganite MnOOH were observed only as traces. Sample roasting indicates a small decrease of ~9.7 Å, 3.58 Å and 3.20 Å reflections, and simultaneous increase of ~7.10 Å and 3.15 Å reflections. Additionally, some samples with collapsed phyllomanganates (SIO0000BP) show slight shift of both high reflections towards the low angles (e.g., 9.7 Å → 9.5 Å or 7.15 Å → 7.10 Å). Additionally, sample SIO0000BP indicated traces of clay minerals (potentially Fe-montmorillonite), which also collapsed during roasting (~11.8 Å). Sample SIO0000D2 is dominated by a low-crystalline vernadite (Mn+4, Fe+3, Ca, Na) (O, OH)2 × n (H2O) and does not show presence of any collapsed phyllomanganates. Sample SIO0000D1 indicates dominance of birnessite, with lower amount of vernadite.
Sample SIO0000BQ indicates birnessite domination, with a low amount of Fe-(Mn) vernadite, whereas sample SIO0000BT shows vernadite domination, traces of collapsing phyllomanganates (buserite) and hydrothermally associated manganite. Full results are shown in Table 2 and Figure 4.

3.3.2. Geochemistry of Major Elements (XRF)

The XRF data showed that Fe and Mn concentrations varied between 5.0–26.9 (mean 16.5 ± 4.1) and 15.0–44.1 (mean 26.6 ± 5.9) wt %, respectively. The average Mn/Fe ratio was 2.7. Crust samples showed Si, Al, Ca and Mg impurities with the mean concentrations of 3.22 ± 0.9, 0.58 ± 0.1, 1.34 ± 0.2 and 0.75 ± 0.1 wt %, respectively. The mean Si/Al ratio was 7.50. Further, the average concentration of alkali metals (Na and K) was low (0.79 ± 0.1 and 0.80 ± 0.2 wt %, respectively). Phosphorus and Ti contents were low (0.063 ± 0.3 and 0.14 ± 0.4 wt %, respectively) (Table 3).

3.3.3. Geochemistry of Minor and Trace Elements (ICP-MS)

Concentrations of the three most prospective metals (∑Cu + Ni + Co) were low and ranged from 0.19 to 0.32 wt % (Table 3), with an average of 0.27 wt %. Among these, Ni was dominant (mean 0.17 ± 0.01 wt %), with less Cu (0.08 ± 0.007 wt %) and Co (0.025 ± 0.007 wt %). All samples show high Zn contents ranging 512–961 mg/kg, with an average of 718 ± 94 mg/kg. Elevated concentrations of As and V were observed in two samples (SIO0000BT and SIO0000D2), with values of As 125 mg/kg, 188 mg/kg and V 532 mg/kg, 549 mg/kg, respectively. Thallium concentrations are also elevated in all samples with a mean of 60 ± 14 mg/kg.
In general, the Ba concentrations are low and vary from 397 to 1639 mg/kg, with an average of 997 ± 221 mg/kg. By contrast, Sr concentrations are lower (205–1146 mg/kg) and average 630 ± 194 mg/kg.
The total REY (∑REY) concentrations for all samples are low and range from 81 to 741 mg/kg (mean 339 mg/kg). The most abundant REY is La, which occurs with a mean concentration of only 77 ± 38 mg/kg. Elevated concentrations were also observed for Y (66 ± 26 mg/kg), Nd (58 ± 27 mg/kg) and Ce (45 ± 20 mg/kg). The studied crusts are characterized by visible negative Ce anomalies ranging 0.25–0.38 and weak positive Eu anomalies (Euan = 1.16–1.45), as well as negative Y anomalies (Figure 5). The PAAS-normalized spider diagrams indicate that samples show depleted LREE relative to HREE (0.34–0.57). Low values of LaSN/LuSN (0.37–0.62) confirm significant REE fractionation and MREE-HREE enrichment.
Broadly, studied crusts are characterized by low trace element concentrations. Te concentrations vary from 0.3 to 3.9 mg/kg (average 1.8 ± 1 mg/kg). Ga concentrations range from 3.7 to 14.1 mg/kg, with a mean of 9.1 ± 2 mg/kg. For most samples, the Mo concentration is low (average 276 ± 66 mg/kg), however two samples (SIO00003U and SIO0000D1) have moderate Mo concentrations (436 and 433 mg/kg respectively). The Th/U ratios vary from 0.12 to 0.65 with an average of 0.46. The mean contents of Th and U are 2.3 and 5.0 mg/kg, respectively.

3.4. Electron Probe Microanalysis

More than 200 point analyses were performed on four selected samples (SIO0000D1, SIO0000D2, SIO00003U, SIO0000BP). The EPMA shows the highest contents represented by Mn (mean 35.64 ± 8.83 wt %) and Fe (mean 11.49 ± 6.65 wt %) as elements that form the main mineralogy. Aluminum-silicates elements show variable contents (0.35 ± 0.22 wt % Al and 2.99 ± 2.30 wt % Si) depending on sample surface area (substrate/oxyhydroxides). Trace elements Ni, Cu and Co show average values 0.45 ± 0.46, 0.15 ± 0.12, and 0.05 ± 0.03 wt %, respectively. In addition are also observed, Ba, Zn, Pb and As values (average 0.11 ± 0.05 wt %, 0.10 ± 0.05 wt %, 0.02 ± 0.01 wt % and 0.06 ± 0.02 wt %, respectively.
The EPMA confirmed presence of Mn-Fe minerals evidenced during XRD analysis, with Mn oxide enriched in Na (birnessite), Fe-Mn oxyhydroxide (vernadite) and Mg (todorokite/buserite). Additionally, trace quantities of pure Mn-oxyhydroxides and thin asbolane-type laminae are identified (Figure 6, Tables S1 and S2). Clay components (e.g., celadonite, Fe-montmorillonite, nontronite, Fe-Mg chlorites) and detrital grains of feldspars, amphiboles, epidote or olivine occur as accessory components.
Identified mineral phases were characterized by varied element concentrations. The analyzed Mn-Fe oxyhydroxides and sporadically relatively pure Mn-oxyhydroxides contained moderate contents of metals, up to 4.9 wt % Ni + Cu + Co (mean 1.11 ± 1.36 wt %). Elevated contents of these metals (usually >1 wt %) occur mainly in thin and Ni-Cu rich colloforms of ferromanganese minerals (Figure 6a,b). Most of the identified vernadite and todorokite-buserite spots show Ni and Cu contents in low range of 0.12 to 0.55 wt %. Todorokite-buserite and rare Mn-oxides are usually poorer in most of metals. Elevated contents of Co (up to 0.43 wt %) occur only in a few analytical spots. Birnessite and vernadite occur mostly as compacted and slightly porous masses, whereas todorokite-buserite form very well developed fine needles surrounding cavities in microfossils (Figure 6a,b).
Minor asbolane-type colloforms, developed as thin and bright layers, show higher Ni and Cu contents, usually >1 wt % (Figure 6a–c). The Mn content varies from 34.2 to 52.2 wt % in birnessite and 9.9 to 40.1 wt % in vernadite. The Fe contents in birnessite reaches maximum 13.5 wt %, whereas in vernadite are up to 35.1 wt %. Todorokite is usually pure and shows only traces of Fe (<0.7 wt %). Similar compositional patterns of Mn and Fe occur in very rare Mn-oxyhydroxides (potentially manganite), show strong similarities to todorokite, with less impurities of alkali/alkaline metals and extremely low contents of critical metals (Table S2).
The Mn-Fe oxyhydroxides host impurities of Si, Al, as well alkali and alkaline metals. The highest amounts of Si and Al occur in Fe-(Mn) vernadite, 5.45 ± 0.91 wt % and 0.52 ± 0.12 wt %, respectively. The lower contents of Si and Al are in birnessite (0.29 ± 0.29 wt %, and 0.3 ± 0.19 wt %, respectively). Todorokite and rare Mn-oxyhydroxides show only traces of these elements. The highest Mg, Na, Ca and K contents occur in todorokite with lower amounts in birnessite (usually 1.5–4.0 wt % each). Vernadite and asbolane layers show lower amounts of alkali and alkaline metals (<4 wt % in total). Additionally, vernadite layers are slightly richer in Ti (up to 0.76 wt %) and P (<0.77 wt %), compared with other Mn-Fe oxyhydroxides. Zn usually dominates over Pb, reaching maximum contents of 0.52 wt % in todorokite-buserite and 0.47 wt % in asbolane. The highest Ba contents of 0.48 wt % occur in todorokite-buserite (Table S2).
A directed crust growth above substrate suggests Ni accumulation and metals dispersion within the crust transitional zone (Figure 7). The Fe-rich colloforms show usually poor Ni content. On the other hand, columnar Mn-oxyhydroxides covered by a thin Fe oxidative layer indicate higher Ni contents.
EPMA, SEM and XRD study of accessory minerals show several substrate alteration products (‘iddingsite’ and clay mixtures, traces of Fe-oxyhydroxides, e.g., ferrihydrite or feroxyhyte), as well as typical detrital components (feldspars, olivine, zoisite). Recognition of clays is considerably complicated by partial mixture with Mn-Fe oxyhydroxides. Alteration phyllosilicates represented by celadonite or ferroceladonite demonstrate high substitution of Fe by Mn (in total 29–30 wt %), traces of Al, as well low contents of K (<2.6 wt %), Mg (<2.2 wt %), Na (<1.4 wt %), Ca (<0.6 wt %) and absence of any other metals. Traces of Y and Cr occur among described components constitute potential structural remnants of alteration products. Celadonite typically fills substrate pores and form thin films on basalts (Figure 6d). Other phyllosilicates included Fe-montmorillonite (nontronite), show lower Si and greater Al substitution and Fe contents compared to celadonite, as well as greater number of metal impurities (<0.13 wt % of ∑Ni + Cu + Co), low Mn substitution (<3.2 wt %) and lack of Y or Cr. Only traces of Zn, Tl, Ti, Ba, P and Cl are observed in Fe-smectite. Nontronite form mainly infillings and thin layers between Mn-Fe oxyhydroxides. Chlorites are represented by Fe-Mg chlorite, with a relatively low substitution of Si and Al by other alkali and alkaline metals. Contents of Si and Al are stable and vary from 20.7–21.1 wt % and 0.73–1.1 wt %, respectively. Fe substitution by Mn is low and below 0.24 wt %. The ∑Ni + Cu + Co content in analyzed clay minerals varied 0.07–0.12 wt % (Table S2).
Many alteration spots show presence of so-called “iddingsite”, a mixture of clay minerals and amorphous Mn-Fe oxyhydroxides. The iddingsite is a typical alteration product of basalts that shows greater relative amounts of Si, K and Mn (2.1 to 2.2 wt %), compared to Fe-montmorillonite. Additionally, several metallic impurities of (Ti, Mn and Ni), alkali and alkaline elements occur. The total content of Ni + Cu + Co is <0.2 wt % (Table S2).
Finally, a few non-identified over- and intergrowths of clay minerals and Mn-Fe oxyhydroxides show a distinctive non-stoichiometric Mn-Fe dominance over Si and Al. Observed Fe content is high (31.0 to 41.3 wt %), with a highly variable amount of Mn (1.3–13.9 wt %). Analyzed masses show relatively low Mg contents (<0.9 wt %), and higher portions of Ca (0.3–1.9 wt %) and Na (0.2–1.1 wt %). Metals that occurred as traces (<0.31 wt % of ∑Ni + Cu + Co; Zn <0.11 wt %) included Ti, P, Pb and Tl, compared with other clays. Spots of non-identified clay and Mn-Fe oxyhydroxide mixtures occur mainly in the substrate portion of analyzed crusts, as thin layers and coatings similar to ‘iddingsite’ (Table S2).
Among typical debris components feldspars (anorthite-labradorite series), decomposed Fe-Mg-K amphiboles (mainly hornblende type), Mg-olivine (forsterite) and epidote (zoisite or clinozoisite) occur, though only in nine EPMA analysis spots, that amount to less than 0.5% of total sampling points (see example at Figure 6c).

3.5. Statistical Analysis
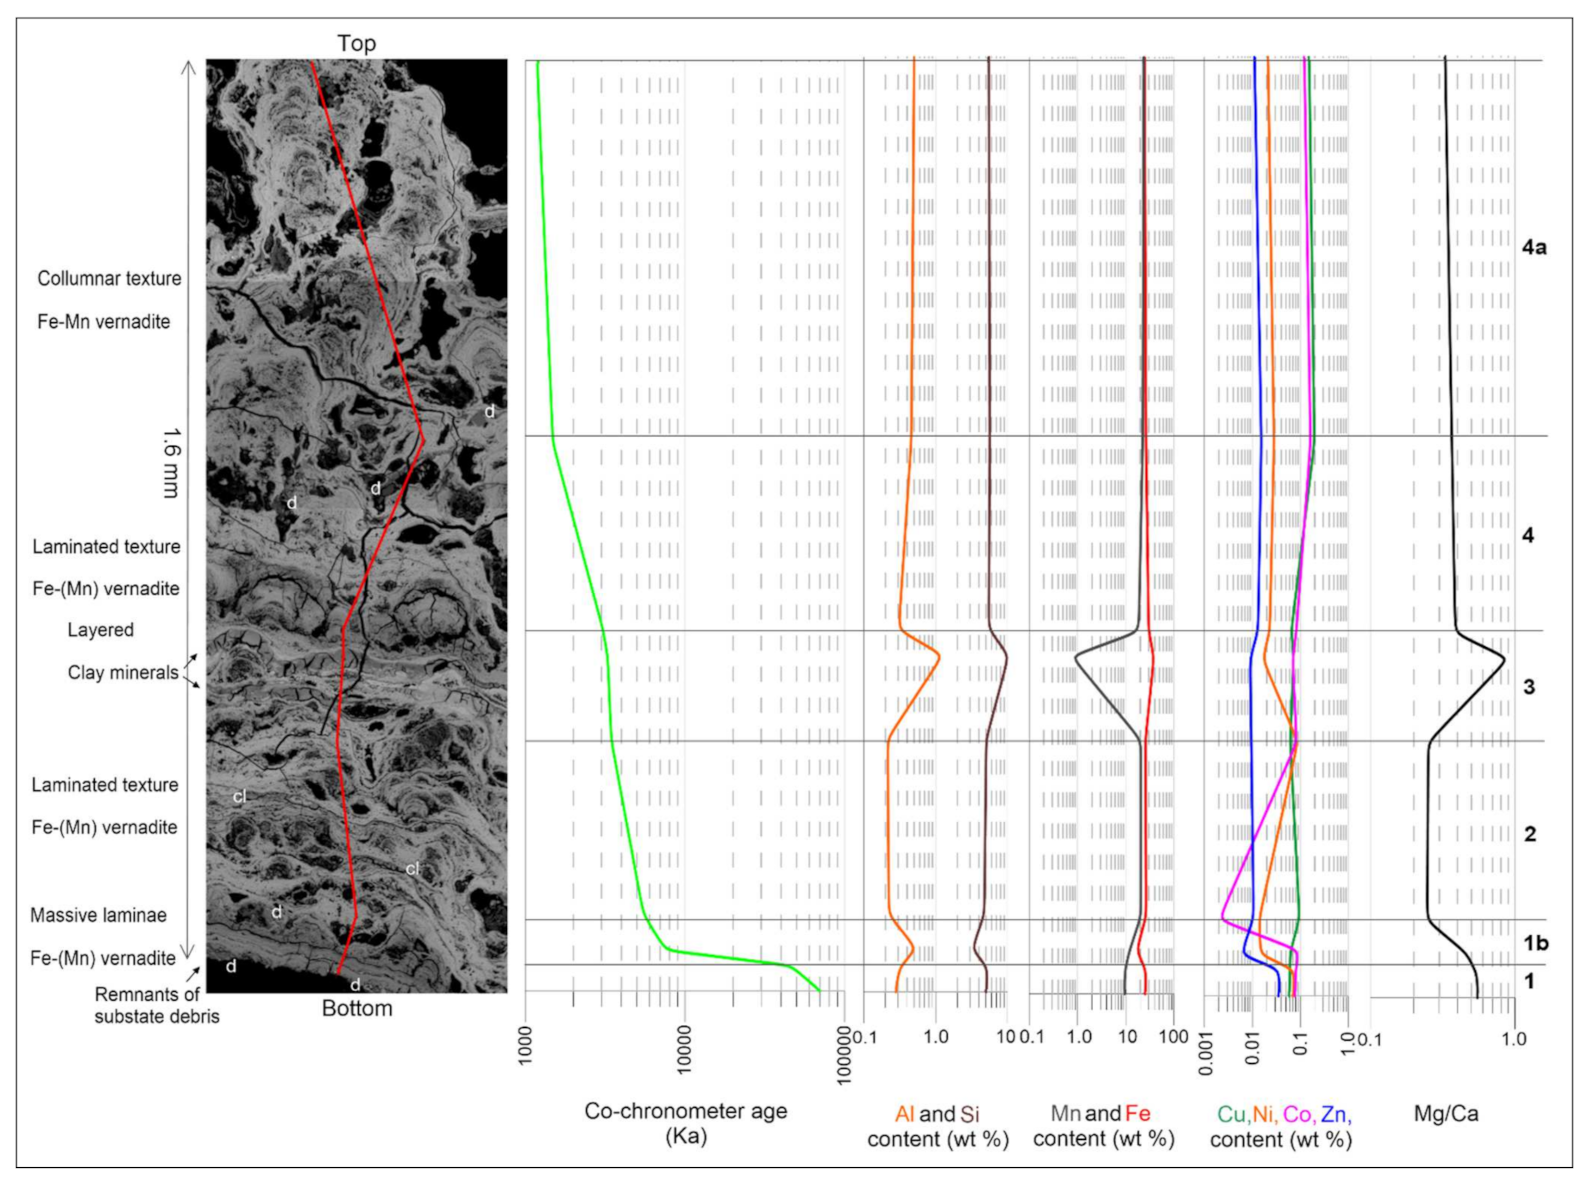
As shown in Table 4, Mn is negatively correlated with Fe, Si, Al, Ti, Co, P, whereas correlation is positive for Na and Mg. Fe is positively correlated with P, Si, Ti, Al, Co and negatively with Mg, Na, K and As. Cu shows strong positive correlations with Ni and Zn. Co shows moderate positive correlation with Ti, P, and C while negative correlation with Na, Mg and K. P is strong positively correlated with Ti, S and negatively with Na and Mg. Three major factors, expressed in a normalized varimax rotation, explain more than 55% of the total variance (Table 4). FA interpretation is presented in the discussion section below.

3.6. Growth Rates

The growth rates of C-NSC crusts vary from 0.10 (SIO0000D2) to 1.94 (SIO0000BP) mm/kyr, with mean 0.66 mm/kyr (Table 5). Assuming lack of any hiatuses, calculated growth rates indicate that maximum C-NSC age of crusts is approximately 86 ka (Late Pleistocene, Marine Isotope Stage MIS5). The “youngest” studied sample (SIO0000BQ) is 9 ka (Late Holocene, Marine Isotope Stage 1 MIS1; Table 5). The mean crust age is 38 ± 25.3 ka, which suggests a relatively young age. This data suggests the samples need to be considered as an “initial” crust.

4. Discussion

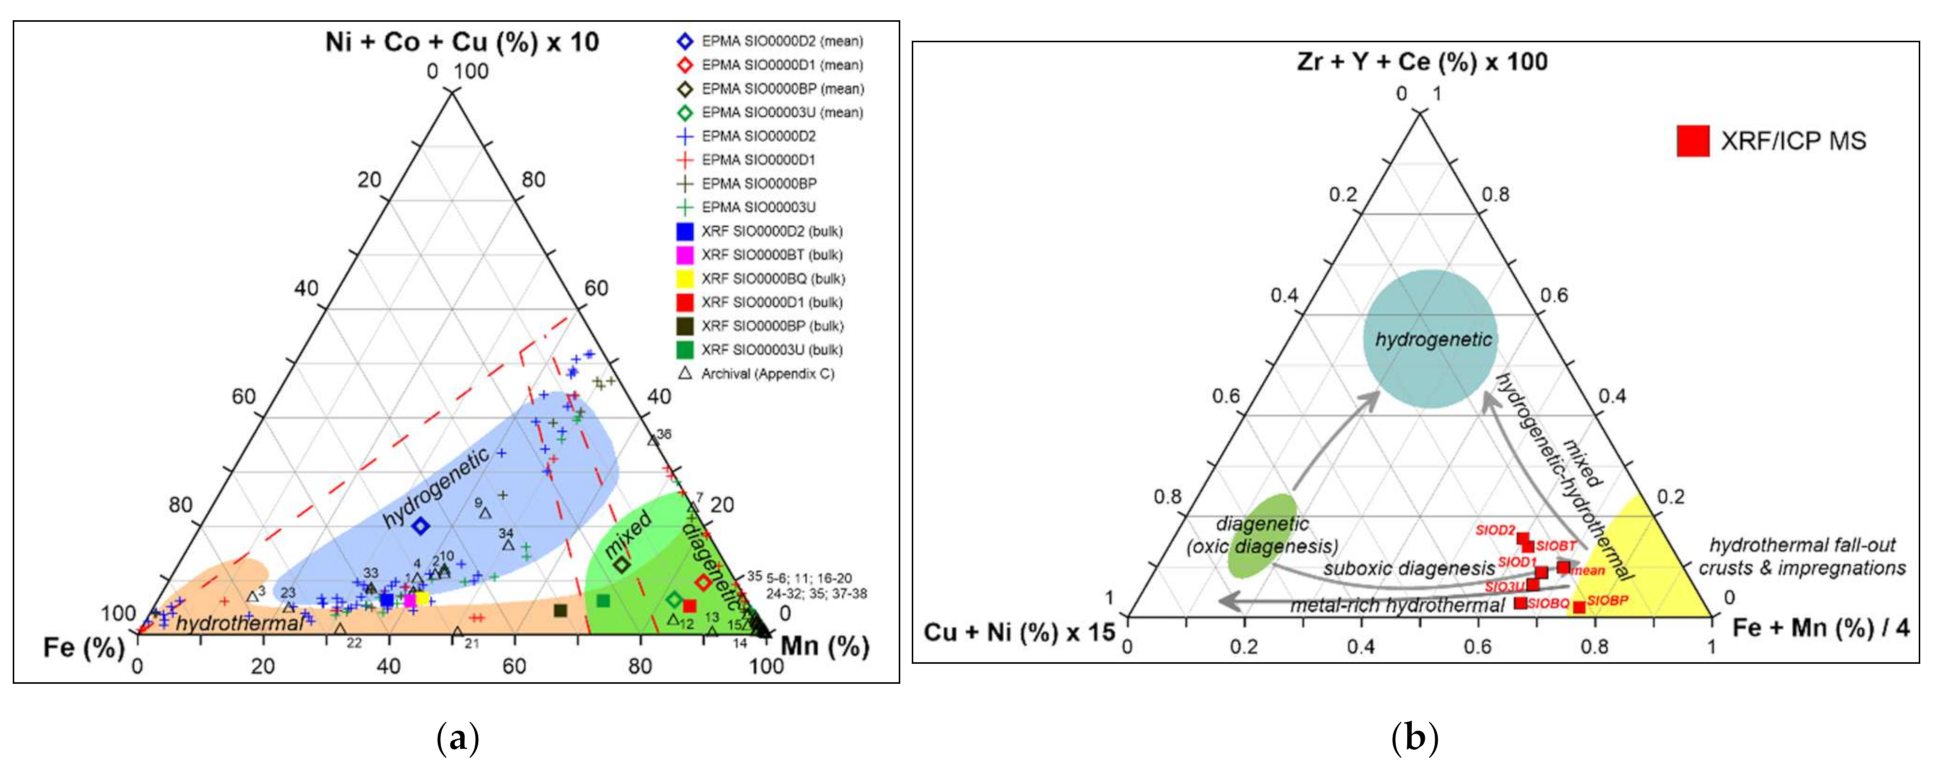
4.1. Classification and Forming Conditions

Formation of marine Fe-Mn deposits (including polymetallic nodules and cobalt-rich crusts) involves three main processes: hydrogenetic, diagenetic and hydrothermal [16,18,25]. Recently, some studies focused to further understand the impact of these three processes on formation of not only nodules and crusts as a whole but also individual layers and laminae. The main tools of this recent work include discrimination diagrams based on rare earth yttrium (REY) [64] and use of High-Field Strength Elements (HFSE) [75].
Hydrogenetic precipitation dominates in most cobalt-rich crusts, which promotes greater Co, HFSE and REY concentrations while the hydrothermal processes, due to rapid formation and high content of either Fe or Mn oxides, led to HFSE and REY depletion. Diagenetic precipitation which are connected mostly with polymetallic nodule formation in oxic or suboxic conditions characterized by different metal concentrations. The oxic conditions produce higher Mn, Cu, and Ni concentrations while suboxic promote greater Mn and Fe remobilization and incorporation of Cu and Ni ions in nodules [75]. Due to widely variable geological settings that include the plume temperature, hydrothermal Fe-Mn deposits vary considerably. Metalliferous sediments near hydrothermal fields along the mid-ocean ridges are related to high temperature venting (plume fall-out deposits). “Stratabound” crusts (cemented layered sediments) occur in locations that occur some distance from mid-ocean ridges and are more characteristic of hot spot seamounts, volcanic arcs and back-arc environments. These deposits show Mn/Fe ratios that range from 0.001 (nearly no Mn) to 4000 and low metal contents [75,78].
C-NSC Fe-Mn crust samples are studied in order to determine mineralogy, geochemistry and genetic processes. The geochemical and mineralogical results listed above show mixed conditions of formation. Traditional ternary Mn vs. Fe vs. (Cu + Ni + Co) × 10 diagram [16] shows that analyzed bulk samples represent complex features dominated by a various hydrogenetic-hydrothermal processes (samples SIO0000D2, SIO0000BT and SIO0000BQ), as well some diagenetic influences potentially related to transformation processes that occur between birnessite and todorokite (SIO0000D1 and SIO00003U). Sample SIO0000BP shows the strongest hydrothermal signatures among analyzed material (Figure 8a).
The comparison of major elements (Mn, Fe) and metals (Cu, Ni) with HFSE describe crusts that show prevalence of mild hydrothermal fall-out material typical of metal-depleted Fe-Mn crusts and encrustations. There is no evidence of intensive oxic diagenetic processes, however all samples (besides SIO0000BP) indicate low suboxic influences (Figure 8b). Studied crusts show strong depletion in Zr, Ti and REY which is typical for hydrothermal Fe-Mn deposits such as those studied by [75]. Mean Th and U concentrations as well as Th/U ratios are typical for post-Paleogene crusts [40] and are additionally indicative for hydrothermal influx [79].
According to bivariate diagram analysis [64], the C-NSC samples show diagenetic signatures, evidenced with a negative Ce anomaly, low YSN/HoSN ratio, and moderate Nd concentration (Figure 9a,b). The distinctive negative Ce anomaly itself suggests hydrothermal input [80,81], however, may also be related to seawater influences. The general HREE enrichment is visible in all samples and indicates low seawater influx [82], previously identified on samples from the Galapagos Spreading Center [40]. Additionally, the weak positive Eu anomaly suggests hydrothermal influx from the plume, however this anomaly may be influenced by strong basalt debris influx and processes related with seafloor alteration [83]. The SIO0000BQ sample shows a distinctive positive Tb anomaly which may evidence intensive diagenetic processes [84], increased Tb acquisition from seawater [74], or admixtures of detrital material such as zircon. Positive Tb anomaly have been also observed in ferromanganese coatings from an intertidal zone of the East China Sea; however, authors did not find acceptable explanations of finding anomaly in only one type of samples [85]. It shows that this subject needs further investigations. The strong fractionation of REE by Fe-rich oxides and oxyhydroxides suggests strong influences of hydrothermal precipitation and material scavenging from seawater [40].
Compounds such as Fe, Mn and Si enter the sea water in hydrothermal solution precipitates as colloidal SiO2 and hydrated Fe and Mn-oxides, being advected by bottom currents and deposited as crusts and metal-rich sediments. Trace-element contents in these deposits result from adsorption from sea water onto the Fe and Mn colloids during advection [86].
Comparison of bulk geochemical data for Ni, Co and Zn (e.g., Co/Zn <0.8; mean 0.34) shows analyzed samples to have distinctive hydrothermal signatures related to Si-Fe fractionation and partial adsorption of minor metal amounts from seawater, which can make these appear similar to metalliferous sediments (Figure 8a). The low mean Co/Zn ratio (0.34) may suggest increased Zn acquisition from hydrothermal sources, compared to Co scavenged mostly from seawater [86]. The mean contents of Ni + Cu + Co that exceed 2000 mg/kg are positively correlated with low Co/Zn ratios, and confirm hydrothermal influences (SIO0000BQ, SIO0000BP, SIO0000D1) as well as mixed hydrothermal-(hydrogenetic) signatures (SIO00003U, SIO0000BT, SIO0000D2), comparable with hydrothermal crusts from GEMINO (Geothermal Metallogenesis Indian Ocean) project, Rodriguez Triple Junction or metalliferous sediments from EPR [87]. The presence of well-formed and relatively pure porous Mn-oxyhydroxides (todorokite-buserite, traces of manganite) may suggest initial hydrothermal alteration rock on the seafloor. The Co/Zn is related to crust age estimated by use of Co-chronometer, which indicates lower hydrothermal input with increased age, and distance from the metal-enriched hydrothermal plume and/or greater hydrogenetic Co acquisition from seawater. This suggests that seawater impact, or influences of mixed hydrogenetic-diagenetic processes were not predominant and affected only single laminae or colloforms.
Comparison of Fe, Mn and Si contents indicate that samples SIO00003U and SIO0000D1 show distinctive geochemical signatures of Mn-rich (but metal-depleted) hydrothermal crusts [88]. The SIO0000BP sample shows geochemical similarities to polymetallic nodules (e.g., from the Clarion–Clipperton Fracture Zone [73]). The other three samples show mixed genesis between Fe-Mn hydrogenetic crusts, EPR metalliferous sediments and polymetallic nodules [40].
Detailed EPMA studies show that several layers and laminae indicate pure hydrogenetic, hydrothermal or even diagenetic origin. The distribution of ternary discrimination diagram mean EPMA results (Figure 8) show that individual analyzed spots occur throughout the diagram, which covers hydrogenetic, diagenetic and hydrothermal influences (Figure 8a). Most of the hydrogenetic layers are represented by Fe-(Mn) vernadite (Table 6). Mn contents in vernadite increases towards the diagenetic type. Diagenetic layers are represented mainly by a non-transformed birnessite and minor thin layers of Ni-(Cu) asbolane, todorokite-buserite or pure Mn-oxyhydroxides (potentially manganite). Manganite maps have formed during an initial stage and “mild” hydrothermal processes. The presence of Fe-dominated minerals that include traces of Fe-hydroxides and oxyhydroxides (ferrihydrite, feroxyhyte), as well as iddingsite demonstrates the influence of so-called “mild” hydrothermal input or seafloor alteration [89].
Higher ∑REY contents and elevated metal concentrations such as Ni, Cu and Co in crust samples SIO0000D2 and SIO0000BT represent textural type 1 and slow growth rates (<0.2 mm/kyr). These samples relate with hydrogenetic or hydrogenetic-hydrothermal signatures, dominated by Fe-(Mn) type of vernadite. These show presence of biomorphic features, such as filaments, bioclast pseudomorphs or microbial-like growth patterns. The geochemical signatures may express intensive alteration processes in a highly oxidized alkaline water environment related to initial decomposition of basaltic substrate and formation of Fe-enriched iddingsite-clay mixtures [68,90].
Low metal contents show higher growth rates for two samples (SIO0000BP and SIO0000BQ, textural type 2 and 1 respectively), usually over 1.14 mm/kyr. Samples with the lowest ∑Cu + Ni + Co contents show increased porosity and dominance of well developed todorokite and buserite aggregates. Sample SIO0000BP, which indicates the highest “mixed” forming conditions (diagenetic-hydrogenetic-hydrothermal), show the lowest metal contents and presence of several phyllosilicate intergrowths formed during potential hiatuses during crust growth (=dominance of sedimentation).
Increased K contents correlate with phyllosilicate presence formed by intensive alteration of substrate and later remobilization into clays, iddingsite or K-birnessite. Relative high Mg substitution in all major Mn-(Fe) minerals compared to Na and other alkali/alkaline metals suggest strong influence of seafloor alteration. Comparison of Ni + Co contents with hydrothermally associated elements ∑(As, Mo, V, Cu, Pb, Zn) show sedimentary-hydrothermal signatures typical of metalliferous sediments (hydrothermal fallouts), with very low influences of typical hydrothermal processes [91]. The presence of a significant and well developed iddingsite (=palagonite) layer, indicates strong hydrolysis alteration processes, associated with formation of initial Fe-oxyhydroxides mixed with phyllosilicates and debris, which work as a strong oxidizer to initiate further growth of Mn-(Fe) oxyhydroxides. Only samples SIO0000BQ and SIO0000BP showed typical signatures of potential low hydrothermal input or alteration. Sample SIO0000D1 indicates the strongest detrital-diagenetic pattern [86]. The elevated contents of other hydrothermally associated elements (e.g., Ba, Ag, As, Zn) and discussed REY signatures suggest a combination of hydrothermal and hydrogenetic processes [92].
Statistical analysis Factor 1 (33.71%) is related to increased Fe/Mn values and intensity of silicification and aluminization (Si and Al; clay minerals) (Table 4). Increased positive factor loadings for Ti, P, Co and Sr also occur and are interpreted to reflect alteration of basaltic substrate. Factor 2 (13.60%) is responsible mainly for Cu and Ni accumulation and less with Zn, probably related to metal scavenging during the hydrogenetic and diagenetic stages of crustal growth. Factor 3 (11.79%) may be attributed to an influence of seawater (Cl; diagenetic “trapping”), biogenic activity such as phosphatization (Ca) or biochemical bacterial processes (S). The potential bioprocesses may potentially include microbial oxidation processes in presence of sulfur bacterium [93,94]. Additionally, Co, P and Ti also influence intensity of Factor 3, to suggest similarities with Factor 1. Other factors are less influential and are related with non-specified remnants from EPMA (Factor 4), as well as with increase of K, Mg, As, anomalous Ba behavior coupled with Pb and Ti (Factor 5), or Tl incompatibility (Factor 6).

4.2. Potential Age

Rapid growth values are rather typical for hydrothermal Mn-oxide deposits precipitated directly from low temperature hydrothermal fluids [25]. These deposits are characterized by a laminated texture and described as stratabound (compare [97,98]).
As indicated by the EPMA profiling and Co-chronometer age of sample SIO0000D2, only first 50 to 100 µm from the bottom of crusts indicate hydrogenetic signatures (with potential low hydrothermal input) and slow growth rates up to ~8 ka. The prevailing crust formed relatively fast. The age of analyzed samples is comparable with data obtained from bulk chemical analysis of archival samples (see Table S3) and range (without hiatuses) to Late Pleistocene (69 to 61 ka). As shown by representative EPMA age profiling of sample SIO0000D2 (Figure 10), formation processes started slowly and accelerated, so that 95% of sample crustal mass formed during the last 8–9 ka.
The location of samples within the young oceanic crust of western C-NCS supports conclusion that these crusts are Late Quaternary. The Co-chronometer age estimates for the bulk samples combined with EPMA backstripping method produced comparable ages. Our data suggests crust development during MIS5 to MIS2, when the global mean sea level was part of a decreasing trend [99]. During this interval, changes of oxidative conditions occurred in the Equatorial Pacific, mainly due to lower levels of oxygen minimum zone (OMZ) and sub-bottom currents of different strength [100], as well as high bioproductivity [101].

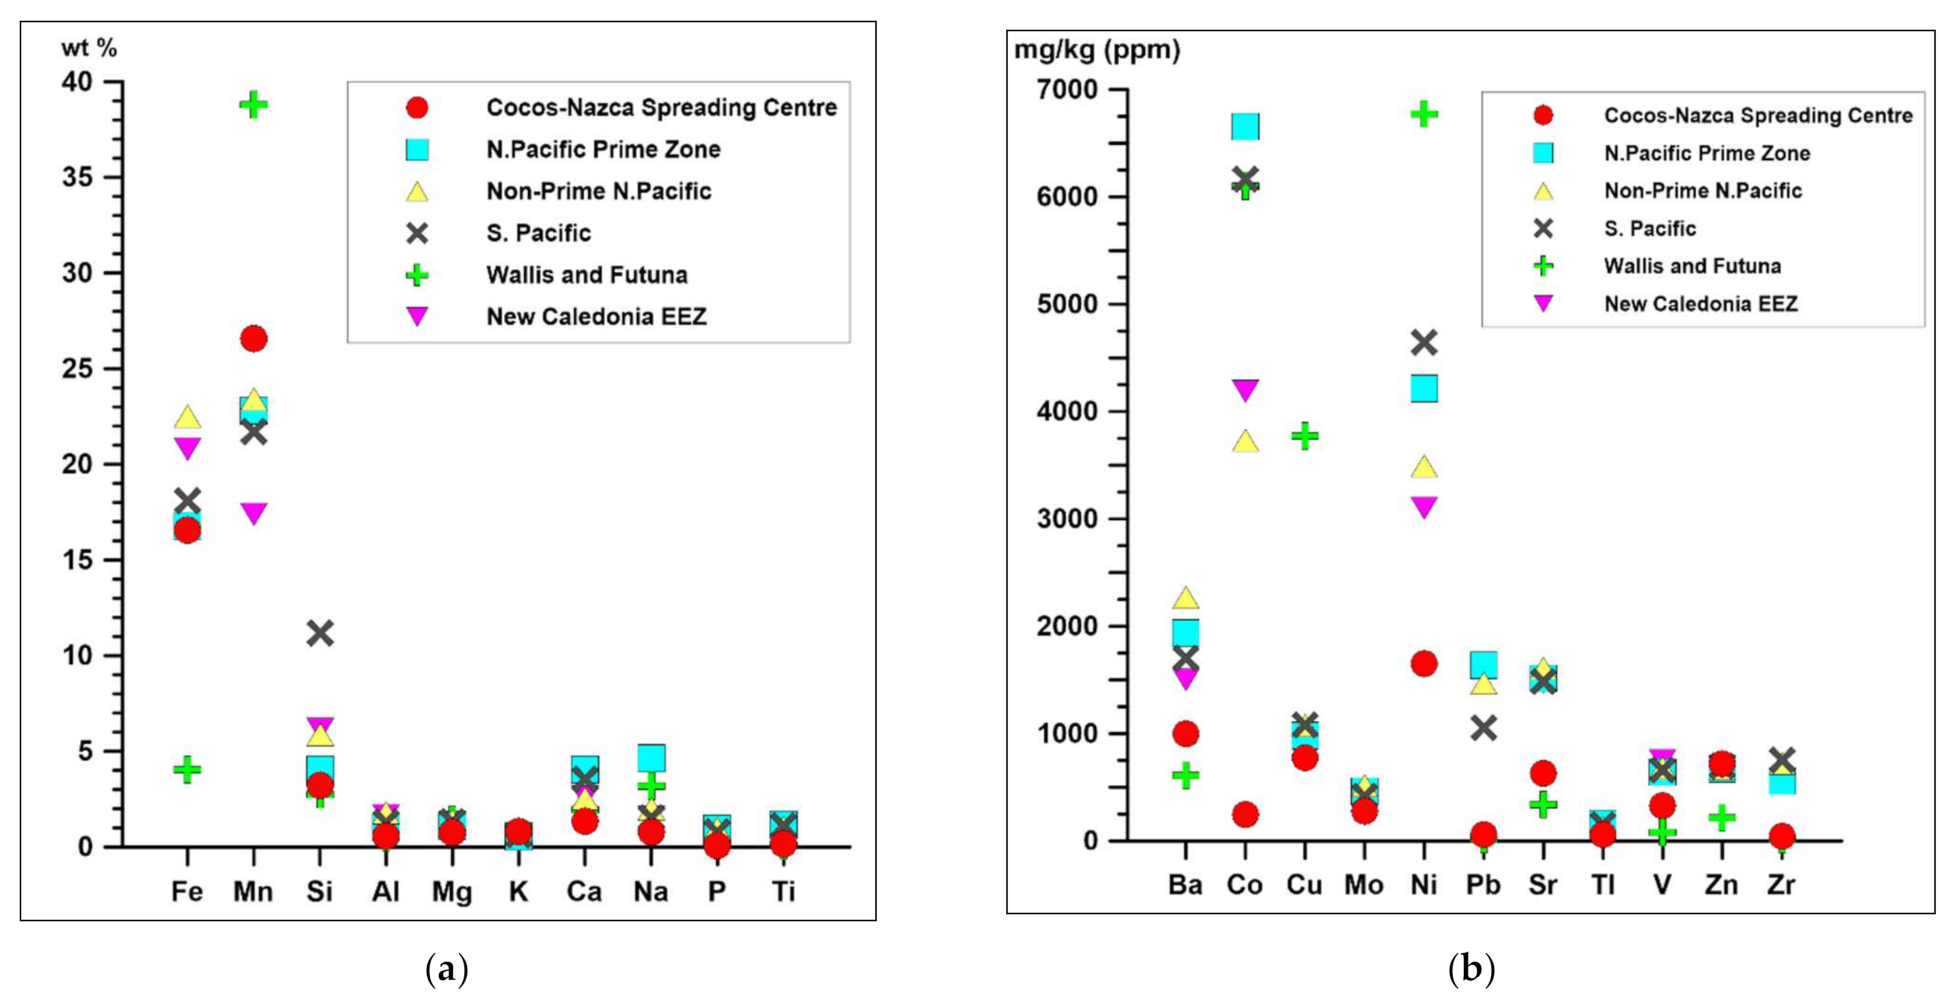
4.3. Economic Potential and Comparison with Other Crusts from Pacific

The geochemical data indicates low Ni, Cu and Co concentrations and thus, crusts cannot be classified as Co-rich [20]. The average Co concentration for this sample suite (245 mg/kg) is more than 25 times lower than average Co content in Fe-Mn crusts from of the richest area North Pacific Prime Zone (NPPZ) (seamount-rich region in the central and western equatorial Pacific, extending from equator to 20° N), South Pacific [18,21], as well as typical hydrothermal Fe-Mn deposits from Wallis and Futuna (WF) [75]. Non-Prime North Pacific and hydrogenetic crusts from New Caledonia Exclusive Economic Zone (NC EEZ) show lower Co concentration than above mentioned but still more than 15 times higher than studied crust from C-NSC (Figure 11) [102]. When compared to these regions, most of the strategic and critical metals in this study are depleted. Nickel concentrations (mean 1651 mg/kg) are depleted relative to other Pacific regions (6771, 4643, 4216, 3495, 3100 mg/kg; WF, S Pacific, NPPZ, Non-Prime N Pacific, NC EEZ, respectively) [21]. Manganese is the only element where greater concentration is observed in C-N crusts (Mn = 26.6 wt %) compared to NPPZ (Mn = 22.8 wt %), but Mn concentration in well-studied hydrothermal samples from WF is higher (Mn = 38.8 wt %) (Figure 11a). Analyzed samples indicate increased Zn (718 mg/kg) and decreased Pb content (61 mg/kg) (Figure 11b).
The Mo concentration of two samples (SIO00003U and SIO0000D1) is close to the mean for other Pacific crusts (516, 463, 418 mg/kg; Non-Prime N Pacific, NPPZ, S Pacific, respectively [21]), however the average for this study (276 mg/kg) is two times lower. REY depletions are apparent in total content (339 mg/kg is 7 times lower compared to North Pacific (2454 mg/kg) and 5 times lower than in South Pacific (1634 mg/kg) as well as in individual elements. This is most evident for La, Ce, Nd and Y. A significant observation is that Ce content (45 mg/kg) is 30 times lower than what is observed in North Pacific crusts (1322 mg/kg), 18 times lower than in South Pacific (818 mg/kg) (Figure 11c). The pattern of REY concentration is comparable to WF. The one exception is Sc concentration which is anomalously high in WF (Sc = 1199 mg/kg) compared to other regions.
Several trace element concentrations in studied samples are low and typical for hydrothermal crusts [75,87,103]. Tellurium concentration (mean 1.8 mg/kg) is much lower than the crustal average from other Pacific regions (60 mg/kg for N Pacific Prime Zone and 38 for S Pacific). Low Ga content (mean 9.1 mg/kg) is also characteristic for hydrothermal crust however hydrothermal crust from Sea of Japan show higher concentration of this metal (up to 300 ppm) [103], with origin interpretated as supply of the ash from volcanic Ga-rich rocks [104]. Additionally, elevated Li concentration in four crust samples (SIO0000BQ, SIO0000D1, SIO0000BP, SIO00003U) suggest strong incorporation of hydrothermal component [105].
Concentrations of selected metals in bulk Fe-Mn crust samples from several locations near the studied area are given in Table S3. As mentioned in the Introduction, most of the study focus is in eastern GSC where numerous hydrothermal mounds occur. Several samples contain 50 wt % and more (up to 63.74 wt %) Mn. Most of the crust from this region is depleted in Ni, compared to other Pacific crusts [18]. The exception is a sample which contains 2.3 wt % of Ni studied by [38]. The ∑REE concentration is extremely low and does not exceed 40 mg/kg in any sample; however, this data comes from the 1970–1990s and technical limitations did not then allow a full set of REE values for La to Lu.
The above metal concentration comparisons with crusts from other Pacific regions, as well as low crust thicknesses suggest that, at the time of writing, the C-NSC encrustations cannot be considered as economically valuable.

5. Summary

  • Six thin Fe-Mn crusts recovered during dredging from the Cocos-Nazca Spreading Centre in 2018 provide detailed geochemical and mineralogical data to determine their complex and various formation conditions.
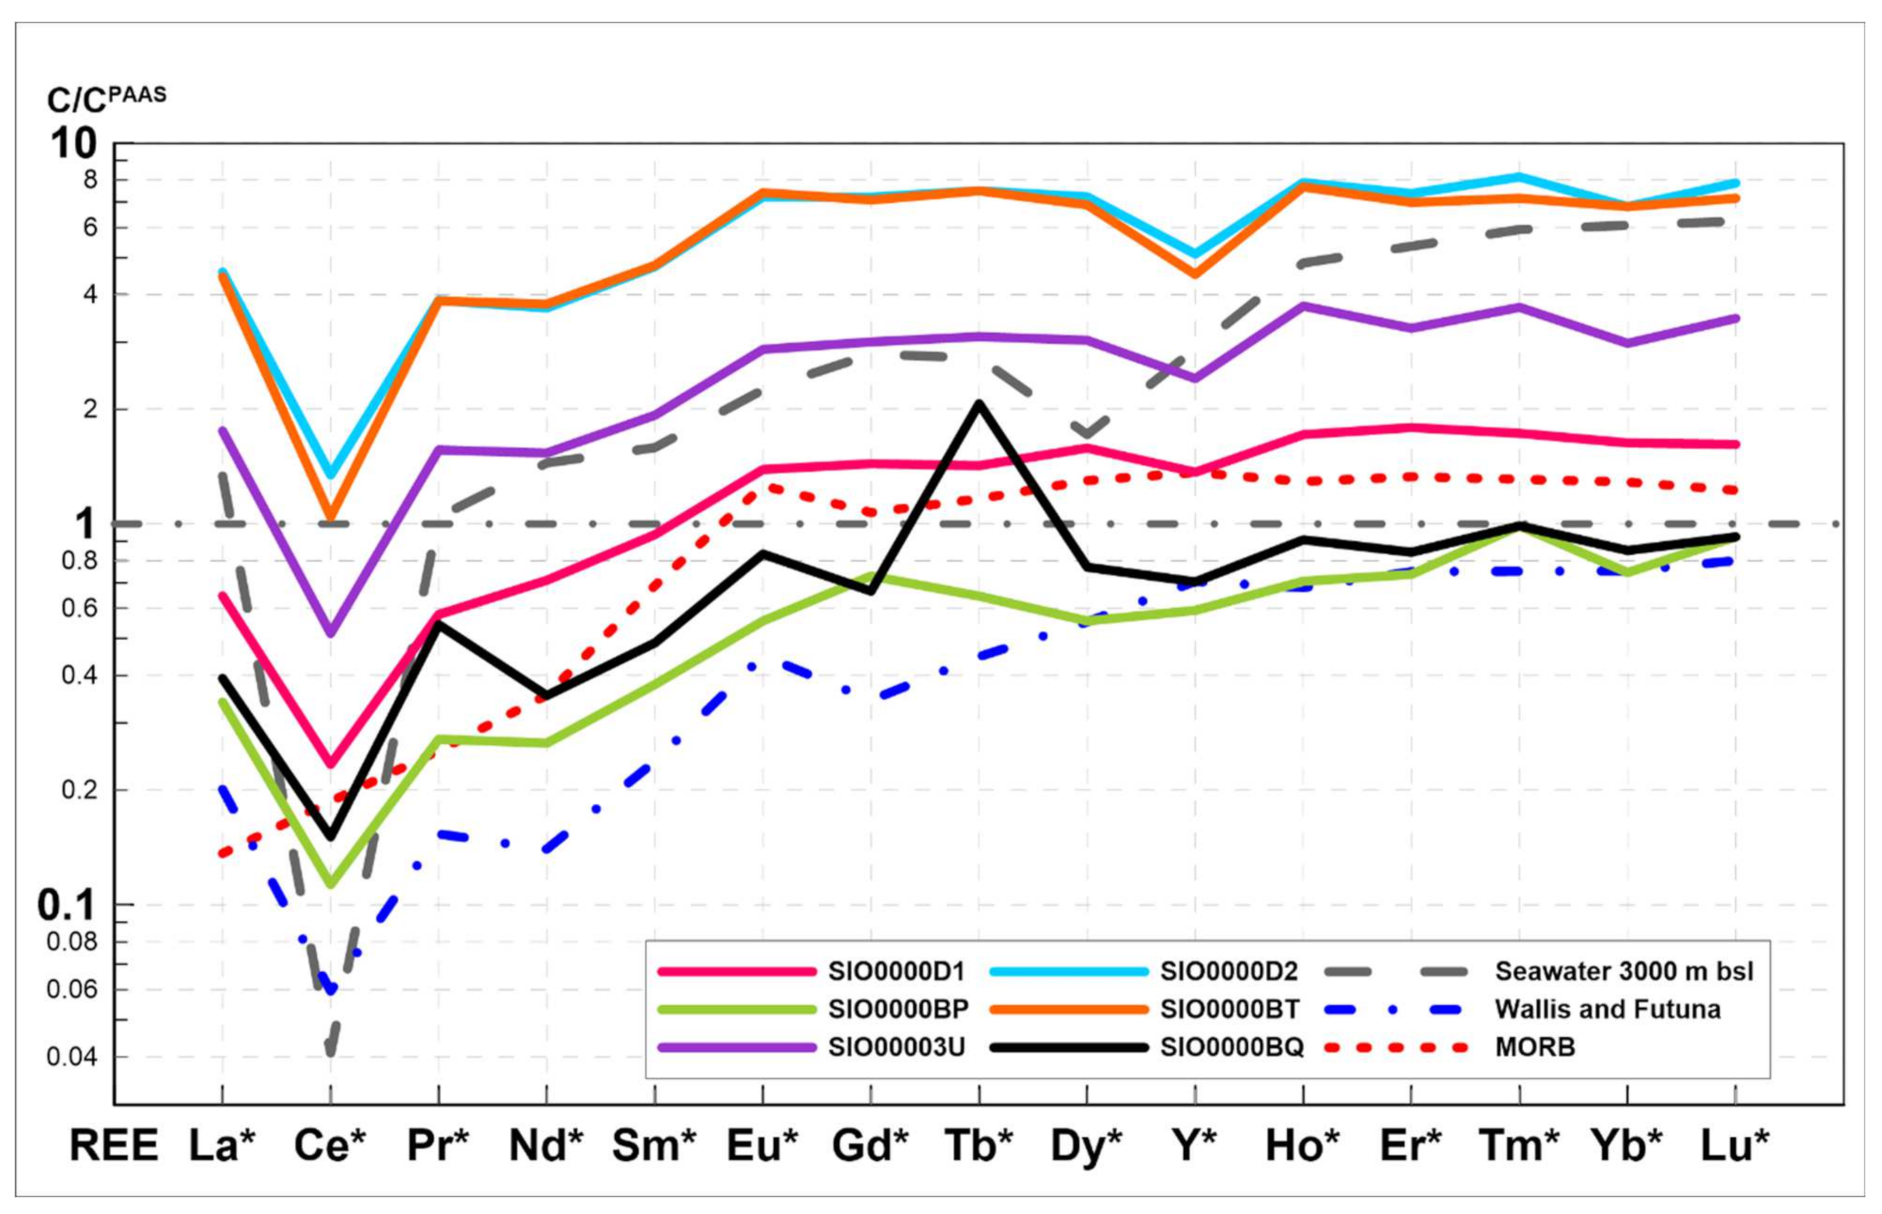
  • Based on bulk chemical composition, Mn (mean 26.6 ± 5.9%) and Fe (mean 16.5 ± 4.1%) dominate. The sum of mean concentrations for three prospective metals (∑Cu + Ni + Co) is low, at 0.27 wt %. The total content of ΣREY is also low, with a range from 81 to 741 mg/kg (mean 339 mg/kg). The studied crusts were characterized by visible negative Ce anomalies and positive Eu anomalies, which are typical for hydrothermal deposits, hydrothermally altered deposits or stratabound deposits. Analyzed samples also show strong depletion in Zr and Ti that indicate low influences of external components (e.g., terrestrial debris).
  • The dominant mineral phases in studied crusts consist mostly of birnessite, todorokite-buserite, and Mn-(Fe) vernadite. Traces of other minerals were found such as diagenetic manganates (asbolane), Fe-oxides and oxyhydroxides or hydrothermally associated and pure Mn-oxyhydroxides (manganite). The elevated concentrations of ∑Cu + Ni + Co (>1.5 wt %) are associated predominantly with birnessite. Todorokite-buserite and Fe-(Mn) vernadite are generally metal-depleted, with respect to Ni, Cu and Co (usually 0.2–0.6 wt % in total).
  • According to the geochemical and mineralogical data, analyzed crusts originated hydrothermally and transformed due to some interaction with seawater, acquiring mixed hydrogenetic and diagenetic signatures. The complicity of analyzed crusts is surprisingly high considering the short length of dredging. Analyzed petrological features show that relatively young seafloor areas forming conditions may provide a complicated image of ferromanganese crusts, potentially affected with strong local spatiotemporal variability of geologic and/or oceanographic features near spreading centers.
  • The growth rates of C-NSC crusts range from 0.10 to 1.94 mm/kyr, with mean 0.66 mm/kyr, which can be classified as rapid growth characteristics typical for hydrothermal Mn-oxide deposits. The calculated growth rates of crust thickness, assuming lack of any hiatuses, indicate maximum age of studied crusts at approximately 86 ka (Late Pleistocene).
  • Low crusts thickness and low strategic metals concentrations (e.g., Co, Ni, Cu, REY) suggest that, at the time of writing, the C-NSC encrustations need to be considered as poor and economically non-prospective.

Supplementary Materials

The following are available online at https://www.mdpi.com/article/10.3390/min12050538/s1, Table S1. Representative EPMA data of major Mn-Fe oxyhydroxides. All chemical data in wt.%. Table S2. Complete EPMA data of major and accessory minerals identified in crusts from C-NSC. All chemical data in wt.%. Table S3. Archival data of chemical composition of bulk Fe-Mn crust samples collected in the area of C-NSC [31,32,38,40,88,106].

Author Contributions

Conceptualization, D.Z., Ł.M. and F.J.G.; methodology, D.Z., Ł.M., F.J.G., E.M., G.A.K.-B., A.P. and R.J.W.; software, D.Z., Ł.M., I.B., G.A.K.-B. and E.M., formal analysis, D.Z., Ł.M., F.J.G., E.M., G.A.K.-B., A.P. and R.J.W.; investigation, D.Z., Ł.M., G.A.K.-B., F.J.G., E.M., A.P. and R.J.W.; writing—original draft preparation, D.Z., Ł.M., B.W., F.J.G., K.M.; writing—review and editing, D.Z., Ł.M., B.W., F.J.G., E.M. and K.M.; visualization, D.Z., Ł.M., I.B. and E.M.; supervision, D.Z.; funding acquisition, D.Z., Ł.M., F.J.G., E.M., G.A.K.-B., A.P. and K.M. All authors have read and agreed to the published version of the manuscript.

Funding

This research was funded by the National Science Foundation (EAR-OCE 1558592) (cruise and sampling). The cruise participation was funded by the EXPLOSEA project (CTM201675947-R) and InterRidge (InterRidge Cruise Bursary). The research (XRF, XRD, ICP-MS) was partly supported by the statutory funds of the Institute of Marine and Environmental Sciences, University of Szczecin (grant No. 503-1100-230342). The EPMA was possible thanks to funding obtained from the AGH-UST statutory grant No. 16.16.140.315/02. The SEM study was funded by the European Union’s Horizon 2020 research and innovation project GeoERA-MINDeSEA (grant agreement No. 731166, GeoE.171.001).

Data Availability Statement

Not applicable.

Acknowledgments

We would like to thank Emily Klein from Duke University and Chief Scientist of the cruise SR1804, who has shared samples of the crust, allowed to study them and contribute to the costs of this publication. We are also grateful for the extraordinary work of the Captain, crew of R/V Sally Ride as well as a whole science party of Cocos-Nazca cruise (R/V Sally Ride, Leg 1806), whose efficiency and hard work made the cruise such a success. Great thanks to Paweł Osóch for preparation of EPMA samples.

Conflicts of Interest

The authors declare no conflict of interest. The funders had no role in the design of the study; in the collection, analyses, or interpretation of data; in the writing of the manuscript, or in the decision to publish the results.

References

  1. Hein, J.R.; Spinardi, F.; Okamoto, N.; Mizell, K.; Thorburn, D.; Tawake, A. Critical metals in manganese nodules from the Cook Islands EEZ, abundances and distributions. Ore Geol. Rev. 2015, 68, 97–116. [Google Scholar] [CrossRef]
  2. Machida, S.; Fujinaga, K.; Ishii, T.; Nakamura, K.; Hirano, N.; Kato, Y. Geology and geochemistry of ferromanganese nodules in the Japanese Exclusive Economic Zone around Minamitorishima Island. Geochem. J. 2016, 50, 539–555. [Google Scholar] [CrossRef] [Green Version]
  3. González, F.J.; Somoza, L.; Hein, J.R.; Medialdea, T.; León, R.; Urgorri, V.; Reyes, J.; Martín-Rubí, J.A. Phosphorites, Co-rich Mn nodules, and Fe-Mn crusts from Galicia Bank, NE Atlantic: Reflections of Cenozoic tectonics and paleoceanography. Geochem. Geophys. Geosyst. 2016, 17, 346–374. [Google Scholar] [CrossRef] [Green Version]
  4. Conrad, T.A.; Hein, J.R.; Paytan, A.; Clague, D.A. Formation of Fe-Mn crusts within a continental margin environment. Ore Geol. Rev. 2017, 87, 25–40. [Google Scholar] [CrossRef]
  5. Konstantinova, N.; Hein, J.R.; Gartman, A.; Mizell, K.; Barrulas, P.; Cherkashov, G.; Mikhailik, P.; Khanchuk, A. Mineral Phase-Element Associations Based on Sequential Leaching of Ferromanganese Crusts, Amerasia Basin Arctic Ocean. Minerals 2018, 8, 460. [Google Scholar] [CrossRef] [Green Version]
  6. Zawadzki, D.; Maciąg, Ł.; Kotliński, R.A.; Kozub-Budzyń, G.A.; Piestrzyński, A.; Wróbel, A. Geochemistry of cobalt-rich ferromanganese crusts from the Perth Abyssal Plain (E Indian Ocean). Ore Geol. Rev. 2018, 101, 520–531. [Google Scholar] [CrossRef]
  7. Maciąg, Ł.; Zawadzki, D.; Kotliński, R.A.; Kozub-Budzyń, G.A.; Piestrzyński, A.; Wróbel, A. Mineralogy of Cobalt-Rich Ferromanganese Crusts from the Perth Abyssal Plain (E Indian Ocean). Minerals 2019, 9, 84. [Google Scholar] [CrossRef] [Green Version]
  8. Marino, E.; González, F.J.; Lunar, R.; Reyes, J.; Medialdea, T.; Castillo-Carrión, M.; Bellido, E.; Somoza, L. High-Resolution Analysis of Critical Minerals and Elements in Fe–Mn Crusts from the Canary Island Seamount Province (Atlantic Ocean). Minerals 2018, 8, 285. [Google Scholar] [CrossRef] [Green Version]
  9. Ren, Y.; Sun, X.; Guan, Y.; Xiao, Z.; Liu, Y.; Liao, J.; Guo, Z. Distribution of Rare Earth Elements plus Yttrium among Major Mineral Phases of Marine Fe–Mn Crusts from the South China Sea and Western Pacific Ocean: A Comparative Study. Minerals 2019, 9, 8. [Google Scholar] [CrossRef] [Green Version]
  10. Marino, E.; González, F.J.; Kuhn, T.; Madureira, P.; Wegorzewski, A.V.; Mirao, J.; Medialdea, T.; Oeser, M.; Miguel, C.; Reyes, J.; et al. Hydrogenetic, Diagenetic and Hydrothermal Processes Forming Ferromanganese Crusts in the Canary Island Seamounts and Their Influence in the Metal Recovery Rate with Hydrometallurgical Methods. Minerals 2019, 9, 439. [Google Scholar] [CrossRef] [Green Version]
  11. Koschinsky, A.; Hein, J.R.; Kraemer, D.; Foster, A.L.; Kuhn, T.; Halbach, P. Platinum enrichment and phase associations in marine ferromanganese crusts and nodules based on a multi-method approach. Chem. Geol. 2020, 539, 119426. [Google Scholar] [CrossRef]
  12. Nishi, K.; Usui, A.; Nakasato, Y.; Yasuda, H. Formation age of the dual structure and environmental change recorded in hydrogenetic ferromanganese crusts from Northwest and Central Pacific seamounts. Ore Geol. Rev. 2017, 87, 62–70. [Google Scholar] [CrossRef]
  13. Usui, A.; Nishi, K.; Sato, H.; Nakasato, Y.; Thornton, B.; Kashiwabara, T.; Tokumaru, A.; Sakaguchi, A.; Yamaoka, K.; Kato, S.; et al. Continuous growth of hydrogenetic ferromanganese crusts since 17 Myr ago on Takuyo-Daigo Seamount, NW Pacific, at water depths of 800–5500 m. Ore Geol. Rev. 2017, 87, 71–87. [Google Scholar] [CrossRef] [Green Version]
  14. Halbach, P.; Jahn, A.; Cherkashov, G. Marine Co-rich ferromanganese crust deposits: Description and formation, occurrences and distribution, estimated world-wide resources. In Deep-Sea Mining; Sharma, R., Ed.; Springer: Cham, Switzerland, 2017; pp. 65–141. [Google Scholar] [CrossRef]
  15. Yeo, I.; Dobson, K.; Josso, P.; Pearce, R.; Howarth, S.; Lusty, P.A.J.; Le Bas, T.; Murton, B. Assessment of the mineral resource potential of Atlantic ferromanganese crusts based on their growth history, microstructure, and texture. Minerals 2018, 8, 327. [Google Scholar] [CrossRef] [Green Version]
  16. Bonatti, E.; Kraemer, T.; Rydell, H. Classification and genesis of submarine iron-manganese deposits. In Ferromanganese Deposits on the Ocean Floor, 1st ed.; Horn, D.R., Ed.; IDOE Publ: Washington, DC, USA, 1972; pp. 149–161. [Google Scholar]
  17. Koschinsky, A.; Hein, J.R. Uptake of elements from seawater by ferromanganese crusts: Solid-phase associations and seawater speciation. Mar. Geol. 2003, 198, 331–351. [Google Scholar] [CrossRef]
  18. Hein, J.R.; Koschinsky, A. Deep-ocean ferromanganese crusts and nodules. In The Treatise on Geochemistry, 2nd ed.; Holland, H.D., Turekian, K.K., Eds.; Elsevier: Amsterdam, The Netherlands, 2014; Volume 12, pp. 273–291. [Google Scholar] [CrossRef]
  19. Hein, J.R.; Conrad, T.A.; Staudigel, H. Seamount mineral deposits. A source of rare metals for high-technology industries. Oceanography 2010, 23, 184–189. [Google Scholar] [CrossRef] [Green Version]
  20. Hein, J.R. Cobalt-Rich Ferromanganese Crusts: Global Distribution, Composition, Origin and research Activities. In: Polymetallic Massive Sulphides and Cobalt-Rich Ferromanganese Crusts: Status and Prospects. International Seabed Authority. Tech. Study 2000, 2, 37–77. [Google Scholar]
  21. Hein, J.R.; Mizell, K.; Koschinsky, A.; Conrad, T.A. Deep-ocean mineral deposits as a source of critical metals for high- and green-technology applications: Comparison with land-based resources. Ore Geol. Rev. 2013, 51, 1–14. [Google Scholar] [CrossRef]
  22. Johnson, K.S.; Coale, K.H.; Berelson, W.M.; Gordon, R.M. On the Formation of the Manganese Maximum in the Oxygen Minimum. Geochim. Cosmochim. Acta. 1996, 60, 1291–1299. [Google Scholar] [CrossRef]
  23. Dubinin, A.V. Geochemistry of Rare Earth Elements in the Ocean. Lithol. Miner. Resour. 2004, 39, 289–307. (In Russian) [Google Scholar] [CrossRef]
  24. Asavin, A.M.; Kubrakova, I.V.; Mel’nikov, M.E.; Tyutyunnik, O.A.; Chesalova, E.I. Geochemical Zoning in Ferromanganese Crusts of Ita-MaiTai Guyot. Geochemistry Int. 2010, 48, 423–445. [Google Scholar] [CrossRef]
  25. Fitzgerald, C.E.; Gillis, K.M. Hydrothermal manganese oxide deposits from Baby Bare seamount in the Northeast Pacific. Ocean. Mar. Geol. 2006, 225, 145–156. [Google Scholar] [CrossRef]
  26. Klitgord, K.D.; Mudie, J.D. The Galapagos spreading center: A near-bottom geophysical survey. Geophys. J. R. Astron. Soc. 1974, 38, 563–588. [Google Scholar] [CrossRef] [Green Version]
  27. Hekinian, R.; Rosendahl, B.R.; Cronan, D.S.; Dmitriev, Y.; Fodor, R.V.; Goll, R.M.; Hoffert, M.; Humphris, S.E.; Mattey, D.P.; Matland, J.; et al. Hydrothermal deposits and associated basement rocks from the Galapagos Spreading Center. Oceanolog. Acta 1978, 1, 473–482. [Google Scholar]
  28. Corliss, J.B.; Lyle, M.; Dymond, J.; Crane, K. The chemistry of hydrothermal mounds near the Galapagos Rift. Earth Planet. Sci. Lett. 1978, 40, 12–24. [Google Scholar] [CrossRef]
  29. Green, K.E.; Von Herzen, R.P.; Williams, D.L. The Galapagos Spreading Center at 86°W: A detailed geothermal field study. J. Geophys. Res. 1981, 86, 979–986. [Google Scholar] [CrossRef]
  30. Clague, D.A.; Frey, F.A.; Thompson, G.; Rindge, S. Minor and trace element geochemistry of volcanic rocks dredged from the Galapagos Spreading Center: Role of crystal fractionation and mantle heterogeneity. J. Geophys. Res. 1981, 86, 9469–9482. [Google Scholar] [CrossRef]
  31. Honnorez, J.; von Herzen, R.P.; Barrett, T.J.; Becker, K.; Bender, M.L.; Borella, P.E.; Hubberten, H.W.; Jones, S.C.; Karato, S.; Laverne, C.; et al. Hydrothermal mounds and young ocean crust of the Galapagos: Preliminary Deep Sea Drilling results, Leg 70. Geo. Soc. Am. Bull. 1981, 92, 457–472. [Google Scholar] [CrossRef]
  32. Barrett, T.J.; Friedrichsen, H.; Fleet, A.J. Elemental and Stable Isotopic Composition of Some Metalliferous and Pelagic Sediments from the Galapagos Mounds Area. Deep Sea Drilling Project Leg 1983, 70, 315–323. [Google Scholar] [CrossRef]
  33. Lonsdale, P. Deep-tow observations at the mounds abyssal hydrothermal field, Galapagos Rift. Earth Planet. Sci. Lett. 1977, 36, 92–110. [Google Scholar] [CrossRef]
  34. Borella, P.E. Sediment lithostratigraphy of the Galapagos hydrothermal mounds. DSDP Rep. Publ. 1983, LXX, 183–195. [Google Scholar] [CrossRef]
  35. Natland, J.; Rosendahl, B.; Hekinian, R.; Dmitriev, Y.; Fodor, R.; Goll, R.; Hoffert, M.; Humphris, S.; Mattey, D.; Petersen, N.; et al. Galapagos hydrothermal mounds: Stratigraphy and chemistry revealed by deep sea drilling. Science 1979, 204, 613–616. [Google Scholar] [CrossRef] [PubMed] [Green Version]
  36. Varentsov, I.M.; Sakharov, B.A.; Drits, V.A.; Tsipursky, S.I.; Choporov, D.Y.; Aleksandrova, V.A. Hydrothermal Deposits of the Galapagos Rift Zone, Leg 70: Mineralogy and Geochemistry of Major Components. Initial. Rep. Deep. Sea Drill. Proj. 1983, 70, 235–268. [Google Scholar] [CrossRef]
  37. Lalou, C.; Brichet, E.; Leclaire, H.; Duplessy, J.D. Uranium Series Disequilibrium and Isotope Stratigraphy in Hydrothermal Mound Samples from DSDP Sites 506-509, Leg 70, and Site 424, Leg 54: An Attempt at Chronology. In Initial Reports of the Deep Sea Drilling Project covering Leg 70 of the Cruises of the Drilling Vessel Glomar Challenger, Balboa, Panama to Callao, Peru, November–December; U.S. Govt. Printing Office: Washington, DC, USA, 1979; pp. 303–314. [Google Scholar] [CrossRef]
  38. Moore, W.S.; Vogt, P.R. Hydrothermal manganese crusts from two sites near the Galapagos spreading axis. Earth Planet. Sci. Lett. 1976, 29, 349–356. [Google Scholar] [CrossRef]
  39. Herzig, P.M.; Becker, K.P.; Stoffers, P.; Backer, H.; Blum, N. Hydrothermal silica chimney fields in the Galapagos spreading center at 86° W. Earth Planet. Sci. Lett. 1988, 89, 261–272. [Google Scholar] [CrossRef]
  40. Nagender Nath, B. Rare Earth Element Geochemistry of the Sediments, Ferromanganese Nodules and Crusts from the Indian Ocean. Ph.D. Thesis, GOA University, Goa, India, 1993. [Google Scholar]
  41. Smith, D.K.; Schouten, H.; Parnell-Turner, R.; Klein, E.M.; Cann, J.R.; Dunham, C.; Alodia, G.; Blasco, I.; Wernette, B.W.; Zawadzki, D.; et al. The Evolution of Seafloor Spreading Behind the Tip of the Westward Propagating Cocos-Nazca Spreading Center. Geochem. Geophys. Geosyst. 2020, 21, e2020GC008957. [Google Scholar] [CrossRef]
  42. Smith, D.K.; Schouten, H. Opening of Hess Deep Rift at the Galapagos Triple Junction. Geophys. Res. Lett. 2018, 45, 3942–3950. [Google Scholar] [CrossRef] [Green Version]
  43. DeMets, C.; Gordon, R.G.; Argus, D.F.; Stein, S. Effect of recent revisions to the geomagnetic reversal time scale on estimates of current plate motions. Geophys. Res. Lett. 1994, 21, 2191–2194. [Google Scholar] [CrossRef]
  44. Lonsdale, P. Regional shape and tectonics of the equatorial East Pacific Rise. Mar. Geophys. Res. 1977, 3, 295–315. [Google Scholar] [CrossRef]
  45. Smith, D.K.; Schouten, H.; Montési, L.; Zhu, W. The recent history of the Galapagos triple junction preserved on the Pacific plate. Earth Planet. Sci. Lett. 2013, 371–372, 6–15. [Google Scholar] [CrossRef] [Green Version]
  46. Smith, D.K.; Klein, E.M.; Schouten, H.; Parnell-Turner, R.; Cann, J.R.; Dunham, C.; Alodia, G.; Blasco, I.; Wernette, B.W.; Zawadzki, D.; et al. Transition from rifting to seafloor spreading behind the tip of the westward propagating Cocos-Nazca spreading center. In Proceedings of the American Geophysical Union Fall Abstracts, Washington, DC, USA, 10–14 December 2018. [Google Scholar]
  47. Schilling, J.G.; Kingsley, R.H.; Devine, J.D. Galapagos hot spot spreading center system 1. Spatial petrological and geochemical variations (83° W–101° W). J. Geophys. Res. 1982, 87, 5593–5610. [Google Scholar] [CrossRef]
  48. Puchelt, H.; Emmermann, R. Petrogenetic implications of tholeiitic basalt glasses from the East Pacific Rise and the Galápagos Spreading Center. Chem. Geol. 1983, 38, 39–56. [Google Scholar] [CrossRef]
  49. Hekinian, R.; Bideau, D.; Francheteau, J.; Cheminee, J.L.; Armijo, R.; Lonsdale, P.; Blum, N. Petrology of the East Pacific Rise crust and upper mantle exposed in Hess Deep (eastern equatorial Pacific). J. Geophys. Res. 1993, 98, 8069–8094. [Google Scholar] [CrossRef]
  50. Francheteau, J.; Armijo, R.; Cheminee, J.L.; Hekinian, R.; Lonsdale, P.; Blum, N. 1 Ma East Pacific Rise oceanic crust and uppermost mantle exposed by rifting in Hess Deep (equatorial Pacific Ocean). Earth Planet. Sci. Lett. 1990, 101, 281–295. [Google Scholar] [CrossRef]
  51. Mével, C.; Gillis, K.M. Introduction and principal results. In Proceedings of the Ocean Drilling Program, Initial Reports; Gillis, K., Mével, C., Allan, J., Eds.; Ocean Drilling Program: College Station, TX, USA, 1993; Volume 147. [Google Scholar] [CrossRef]
  52. Karson, J.A.; Klein, E.M.; Hurst, S.D.; Lee, C.D.; Rivizzigno, P.A.; Curewitz, D.; Morris, A.R.; Party, H.D.S. Structure of uppermost fast spreading oceanic crust exposed at the Hess Deep Rift: Implications for subaxial processes at the East Pacific Rise. Geochem. Geophys. Geosyst. 2002, 3. [Google Scholar] [CrossRef]
  53. Stewart, M.A.; Klein, E.M.; Karson, J.A. The geochemistry of dikes and lavas from the north wall of the Hess Deep Rift: Insights into the four-dimensional character of crustal construction at fast-spreading mid-ocean ridges. J. Geophys. Res. 2002, 107, EPM 4-1–EPM 4-24. [Google Scholar] [CrossRef]
  54. Hey, R. Tectonic evolution of the Cocos-Nazca spreading center. Geo. Soc. Am. Bull. 1977, 88, 1404–1420. [Google Scholar] [CrossRef]
  55. Lonsdale, P. Structural patterns of the Galapagos Microplate and evolution of the Galapagos triple junction. J. Geophys. Res. 1988, 93, 13551–13574. [Google Scholar] [CrossRef]
  56. Schouten, H.; Smith, D.K.; Montési, L.; Zhu, W.; Klein, E.M. Unstable Northern Rifts of the Galapagos Triple Junction. Geology 2008, 36, 330–342. [Google Scholar] [CrossRef]
  57. Lonsdale, P.; Blum, N.; Puchelt, H. The RRR triple junction at the southern end of the Pacific-Cocos East Pacific Rise. Earth Planet. Sci. Lett. 1992, 109, 73–85. [Google Scholar] [CrossRef]
  58. Beaulieu, S.E.; Baker, E.T.; German, C.R.; Maffei, A. An authoritative global database for active submarine hydrothermal vent fields. Geochem. Geophys. Geosys. 2013, 14, 4892–4905. [Google Scholar] [CrossRef] [Green Version]
  59. Baker, E.T.; Haymon, R.M.; Resing, J.A.; White, S.M.; Walker, S.L.; Macdonald, K.C.; Nakamura, K. High-resolution surveys along the hot spot–affected Galápagos Spreading Center: 1. Distribution of hydrothermal activity. Geochem. Geophys. Geosyst. 2008, 9, Q09003. [Google Scholar] [CrossRef]
  60. Klein, E.M.; Smith, D.K.; Cann, J.R.; Asfhar, S.; Alodia, G.; Blasco, I.; Curry, S.; Dunham, C.; Latypova, E.; Zawadzki, D. The Transition from Rifting to Seafloor Spreading at the Western Tip of the Cocos-Nazca Rift, R/V Sally Ride Leg 1806 Manzanillo, Mexico to San Diego, CA, USA, 20 April–26 May 2018; Cruise Report Investigation of the Cocos-Nazca Spreading Center; National Science Foundation: Alexandria, VA, USA, 2018. [Google Scholar]
  61. Brouwer, P. Theory of XRF: Getting Acquainted with the Principles; PANalytical: Almela, The Netherlands, 2010. [Google Scholar]
  62. Sindern, S. Analysis of Rare Earth Elements in Rock and Mineral Samples by ICP-MS and LA-ICP-MS. Phys. Sci. Rev. 2017, 2, 1–14. [Google Scholar] [CrossRef]
  63. Taylor, S.R.; McLennan, S.M. The Continental Crust: Its Composition and Evolution; Blackwell Scientific Publication: Carlton, Australia, 1985; p. 312. [Google Scholar]
  64. Bau, M.; Schmidt, K.; Koschinsky, A.; Hein, J.R.; Kuhn, T.; Usui, A. Discriminating between different genetic types of marine ferromanganese crusts and nodules based on rare earth elements and yttrium. Chem. Geol. 2014, 381, 1–9. [Google Scholar] [CrossRef]
  65. Dubinin, A.V.; Sval’nov, V.N. Geochemistry of Rare Earth Elements in Micro and Macronodules from the Pacific Bioproductive Zone. Lithol. Miner. Resour. 2000, 35, 25–39. [Google Scholar] [CrossRef]
  66. Grazulis, S.; Chateigner, D.; Downs, R.T.; Yokochi, A.T.; Quiros, M.; Lutterotti, L.; Manakova, E.; Butkus, J.; Moeck, P.; Le Bail, A. Crystallography Open Database—An open-access collection of crystal structures. J. Appl. Cryst. 2009, 42, 726–729. [Google Scholar] [CrossRef]
  67. Cui, H.; Qiu, G.; Feng, X.; Tan, W.; Liu, F. Birnessites with different average manganese oxidation states synthesized, characterized, and transformed to todorokite at atmospheric pressure. Clays Clay Miner. 2009, 57, 715–724. [Google Scholar] [CrossRef]
  68. Golden, D.C.; Chen, C.C.; Dixon, J.B. Transformation of Birnessite to Buserite, Todorokite, and Manganite under Mild Hydrothermal Treatment. Clays Clay Miner. 1987, 35, 271–280. [Google Scholar] [CrossRef]
  69. Wegorzewski, A.V.; Kuhn, T.; Dohrmann, R.; Wirth, R.; Grangeon, S. Mineralogical characterization of individual growth structures of Mn-nodules with different Ni+Cu content from the central Pacific Ocean. Am. Mineral. 2015, 100, 2497–2508. [Google Scholar] [CrossRef]
  70. Lee, S.; Xu, H. XRD and TEM Studies on Nanophase Manganese Oxides in Freshwater Ferromanganese Nodules from Green Bay, Lake Michigan. Clays Clay Miner. 2016, 64, 523–536. [Google Scholar] [CrossRef]
  71. The Mineralogy Database. Available online: Webmineral.com (accessed on 2 February 2022).
  72. Manheim, F.T.; Lane-Bostwick, C.M. Cobalt in ferromanganese crusts as a monitor of hydrothermal discharge on the Pacific sea floor. Nature 1988, 335, 59–62. [Google Scholar] [CrossRef]
  73. Skowronek, A.; Maciąg, Ł.; Zawadzki, D.; Strzelecka, A.; Baláž, P.; Mianowicz, K.; Abramowski, T.; Konečný, P.; Krawcewicz, A. Chemostratigraphic and Textural Indicators of Nucleation and Growth of Polymetallic Nodules from the Clarion–Clipperton Fracture Zone (IOM Claim Area). Minerals 2021, 11, 868. [Google Scholar] [CrossRef]
  74. De Baar, H.J.; Brewer, P.G.; Bacon, M.P. Anomalies in rare earth distributions in seawater: Gd and Tb. Geochim. Cosmochim. Acta 1985, 49, 1961–1969. [Google Scholar] [CrossRef]
  75. Josso, P.; Pelleter, E.; Pourret, O.; Fouquet, Y.; Etoubleau, J.; Cheron, S.; Bollinger, C. A new discrimination scheme for oceanic ferromanganese deposits using high field strength and rare earth elements. Ore Geol. Rev. 2017, 87, 3–15. [Google Scholar] [CrossRef] [Green Version]
  76. Gale, A.; Dalton, C.A.; Langmuir, C.H.; Su, Y.; Schilling, J.G. The mean composition of ocean ridge basalts. Geochem. Geophys. Geosyst. 2013, 14, 489–518. [Google Scholar] [CrossRef] [Green Version]
  77. Puteanus, D.; Halbach, P. Correlation of Co concentration and growth rate—A method for age determination of ferromanganese crusts. Chem. Geol. 1988, 69, 73–85. [Google Scholar] [CrossRef]
  78. German, C.R.; Colley, S.; Palmer, M.R.; Khripounoff, A.; Klinkhammer, G.P. Hydrothermal plume-particle fluxes at 13°N on the East Pacific Rise. Deep-Sea Res. I Oceanogr. Res. Pap. 2002, 49, 1921–1940. [Google Scholar] [CrossRef]
  79. Bonatti, E.; Zerbi, M.; Kay, R.; Rydell, H. Metalliferous deposits from the Apennine ophiolites: Mesozoic equivalent of modern deposits from oceanic spreading center. Geol. Soc. Am. Bull. 1976, 87, 83–94. [Google Scholar] [CrossRef]
  80. Bau, M. Rare-earth element mobility during hydrothermal and metamorphic fluid– rock interaction and the significance of the oxidation state of europium. Chem. Geol. 1991, 93, 219–230. [Google Scholar] [CrossRef]
  81. Dubinin, A.V.; Sval’nov, V.N. Geochemistry of the Manganese Ore Process in the Ocean: Evidence from Rare Earth Elements. Lithol. Miner. Resour. 2003, 38, 91–100. [Google Scholar] [CrossRef]
  82. Ohta, A.; Ishii, S.; Sakakibara, M.; Mizuno, A.; Kawabe, I. Systematic correlation of the Ce anomaly with the Co/(Ni + Cu) ratio and Y fractionation from Ho in distinct types of Pacific deep-sea nodules. Geochem. J. 1999, 33, 399–417. [Google Scholar] [CrossRef]
  83. Shatrov, V.A.; Sirotin, V.I.; Voitsekhovsky, G.V.; Belyavtseva, E.E. Rare earth elements as indicators of the tectonic activity of the basement. Dokl. Earth Sci. 2008, 423, 672–673. [Google Scholar] [CrossRef]
  84. Nagender Nath, B.; Balaram, V.; Sudhakar, M.; Plüger, W.L. Rare earth element geochemistry of ferromanganese deposits from the Indian Ocean. Mar. Chem. 1992, 38, 185–208. [Google Scholar] [CrossRef]
  85. Yuan, L.; Sun, L.; Fortin, D.; Wang, Y.; Yin, X. Microscale Characterization and Trace Element Distribution in Bacteriogenic Ferromanganese Coatings on Sand Grains from an Intertidal Zone of the East China Sea. PLoS ONE 2015, 10, e0119080. [Google Scholar] [CrossRef] [Green Version]
  86. Toth, J.R. Deposition of submarine crusts rich in manganese and iron. Geo. Soc. Am. Bull. 1980, 91, 44–54. [Google Scholar] [CrossRef]
  87. Nagender Nath, B.; Plüger, W.L.; Roelandts, I. Geochemical constraints on the hydrothermal origin of ferromanganese encrustations from the Rodriguez Triple Junction, Indian Ocean. Geol. Soc. Lond. Spec. Publ. 1997, 119, 199–211. [Google Scholar] [CrossRef]
  88. Corliss, J.B.; Dymond, J. Nazca plate metalliferous sediments. I. Elemental distribution patterns in surface sediments (abs). EOS 1975, 56, 445. [Google Scholar]
  89. Atkins, A.L.; Shaw, S.; Peacock, C.L. Nucleation and growth of todorokite from birnessite: Implications for trace-metal cycling in marine sediments. Geochim. Cosmochim. Acta 2014, 144, 109–125. [Google Scholar] [CrossRef] [Green Version]
  90. Nath, B.N.; Roelandts, I.; Sudhakar, M.; Plüger, W.; Balaram, V. Cerium anomaly variations in ferromanganese nodules and crusts from the Indian Ocean. Mar. Geol. 1994, 120, 385–400. [Google Scholar] [CrossRef]
  91. Choi, J.H.; Hariya, Y. Geochemistry and depositional environment of Mn oxide deposits in the Tokora Belt, Northeastern Hokkaido, Japan. Econ. Geol. 1992, 87, 12–24. [Google Scholar] [CrossRef]
  92. Prakash, S.L.; Ray, D.; Nagender Nath, B.; Satyanarayanan, M.; Kamesh Raju, K.A.; Kurian, J.P.; Kumar, D.; Srinivas Rao, A. Anomalous phase association of REE in ferromanganese crusts from Indian mid-oceanic ridges: Evidence for large scale dispersion of hydrothermal iron. Chem. Geol. 2020, 549, 119679. [Google Scholar] [CrossRef]
  93. Liao, L.; Xu, X.W.; Jiang, X.W.; Wang, C.S.; Zhang, D.S.; Ni, J.Y.; Wu, M. Microbial diversity in deep-sea sediment from the cobalt-rich crust deposit region in the Pacific Ocean. FEMS Microbiol. Ecol. 2011, 78, 565–585. [Google Scholar] [CrossRef] [PubMed] [Green Version]
  94. Kato, S.; Hirai, M.; Ohkuma, M.; Suzuki, K. Microbial metabolisms in an abyssal ferromanganese crust from the Takuyo-Daigo Seamount as revealed by metagenomics. PLoS ONE 2019, 14, e0224888. [Google Scholar] [CrossRef] [PubMed]
  95. Crerar, D.A.; Namson, J.; Chyi, M.S.; Williams, I.; Feigenson, M.D. Manganiferrous cherts of the Franciscian assemblage: General geology, ancient and modern analogues, and implications for hydrothermal convection at oceanic spreading centres. Econ. Geol. 1982, 77, 519–540. [Google Scholar] [CrossRef]
  96. Nicholson, K. Genetic types of manganese oxide deposits near Inverness, Scotland. A Devonian sublacustrine hot-spring deposit. Miner. Deposita 1992, 25, 126–131. [Google Scholar]
  97. Hein, J.R.; Koschinsky, A.; Halbach, P.; Manheim, F.T.; Bau, M.; Kang, J.K.; Lubick, N. Iron and manganese oxide mineralization in the Pacific. In Manganese Mineralization: Geochemistry and Mineralogy of Terrestrial and Marine Deposits; Nicholson, K., Hein, J.R., Bühn, B., Dasgupta, S., Eds.; Geological Society, Special Publications: London, UK, 1997; Volume 119, pp. 123–138. [Google Scholar]
  98. Hein, J.R.; Petersen, S. The Geology of Cobalt-rich Ferromanganese Crusts. In Deep Sea Minerals: Cobalt-Rich Ferromanganese Crusts, A Physical, Biological, Environmental, and Technical Review; Baker, E., Beaudoin, Y., Eds.; Secretariat of the Pacific Community; GRID-Arendal: Arendal, Norway, 2013; Volume 1. [Google Scholar]
  99. Benjamin, J.; Rovere, A.; Fontana, A.; Furlani, S.; Vacchi, M.; Inglis, R.H.; Galili, E.; Antonioli, F.; Sivan, D.; Miko, S.; et al. Late Quaternary sea-level changes and early human societies in the central and eastern Mediterranean Basin: An interdisciplinary review. Quat. Int. 2017, 449, 29–57. [Google Scholar] [CrossRef] [Green Version]
  100. Lea, D.W.; Pak, D.K.; Spero, H.J. Climate Impact of Late Quaternary Equatorial Pacific Sea Surface Temperature Variations. Science 2000, 289, 1719–1724. [Google Scholar] [CrossRef] [Green Version]
  101. Theyer, F.; Mayer, L.; Barron, J.; Thomas, E. The equatorial Pacific High-Productivity Belt: Elements for a Synthesis of Deep Sea Drilling Project Leg 85 Results. Initial Reports DSDP 1985, 85. [Google Scholar] [CrossRef]
  102. Staszak, P.; Collot, J.; Josso, P.; Pelleter, E.; Etienne, S.; Patriat, M.; Cheron, S.; Boissier, A.; Guyomard, Y. Origin and Composition of Ferromanganese Deposits of New Caledonia Exclusive Economic Zone. Minerals 2022, 12, 255. [Google Scholar] [CrossRef]
  103. Baturin, G.N. Geochemistry of Hydrothermal Ferromanganese Crusts of the Sea of Japan. In Doklady Earth Sciences; Springer Nature BV: Dordrecht, The Netherlands, 2012; Volume 445, pp. 862–867. [Google Scholar]
  104. Mikhailik, P.E.; Mikhailik, V.; Blokhin, M.G.; Zarubina, N.V. Sources of gallium in ferromanganese crusts from the Sea of Japan. Russ. Geol. Geophys. 2015, 56, 1148–1153. [Google Scholar] [CrossRef]
  105. Lui-Heung, C.; Hein, J.R. Lithium contents and isotopic compositions of ferromanganese deposits from the global ocean. Deep Sea Res. Part II Top. Stud. Oceanogr. 2007, 54, 1147–1162. [Google Scholar] [CrossRef]
  106. International Seabed Authority. Available online: http://www.isa.org.jm/ (accessed on 6 June 2021).
Figure 1. Location of the Fe-Mn crusts sampling site (D18) within the Cocos-Nazca Spreading Centre. Segments described in the text are marked from s1 to s9. Bathymetric data after [60].
Minerals 12 00538 g001
Figure 2. Textural types of Fe-Mn crusts from the C-NSC: Type 1: (a) A non-laminated botryoidal crust on a thick basalt substrate; (b) Thin non-laminated crust on a basalt substrate. Crust fractured during transport; (c) A non-laminated botryoidal crust on a basalt substrate. The crust fractured during transport. Type 2: (d) Layered crust collected without substrate. (e) The thickest studied crust sample, with slightly visible layering. Type 3: (f) Transitional crust formed on an intensely altered basalt substrate with a slightly visible layering.
Minerals 12 00538 g002
Figure 3. Selected SEM photomicrographs of Mn-(Fe)oxyhydroxides indicating distinctive textural features: (a) micro-botryoidal surface in the sample SIO0000BP; (b) pure Mn-oxyhydroxides forming radial and globular micro-aggregates (rosette-type) in the sample SIO00003U; (c) micro-crystals of with clay-like morphologies in the sample SIO0000BP; (d) Mn-(Fe) oxyhydroxides covering bioclasts and filamentous biofilms in the sample SIO0000BQ, including remnants of diatoms and coccoliths. Red star symbols indicate points of energy dispersive X-ray spectroscopy analysis.
Minerals 12 00538 g003aMinerals 12 00538 g003b
Figure 4. Bulk XRD data of dried (40 °C/24 h) and roasted (105 °C/24 h) crust samples from C-NSC: Bir—birnessite, Tod—todorokite, Bus—buserite, Ver—vernadite, Cl—clays, Man—manganite, Q—quartz. Peak positions (d-spacing) of identified minerals shown with different colors. Presence of a low number of collapsed manganates identified based on decrease of ~9.7 Å peak during roasting and simultaneous increase of ~7 Å peak. Traces of clay minerals are mostly characteristic of montmorillonite group. Traces of relatively pure Mn-oxyhydroxides (manganite) were observed in two samples (see Table 2).
Minerals 12 00538 g004
Figure 5. The PAAS-normalized REE distribution in Fe-Mn crusts from C-NSC (PAAS according to [63]). Seawater 3000 m bsl [74], Wallis and Futuna [75], MORB [76]. * normalized values of REE.
Minerals 12 00538 g005
Figure 6. Representative EPMA BSE images of analyzed Mn-Fe crust. Numbers indicate EPMA analytical spots: (a) Fine crystalline needles of Mn-oxides in type of todorokite forming highly porous texture (SIO00003U); (b) Two generations of thin colloforms of birnessite (1,2) surrounded by coarse generation of todorokite (SIO0000BP); (c) Thin lamina of Mn-(Fe) vernadite or asbolane (1) and thick layer of Fe-vernadite (2–3) with admixtures of debris; no. 4 is zoisite-type grain (SIO00003U); (d) massive birnessite (6–9) surrounded by patches of crushed Fe-(Mn) rich phyllosilicates in type of celadonite or nontronite (1–5); (SIO0000BP). Various mineral types were distinguished based on calculated stoichiometry, comparison with bulk XRD data and textural features (e.g., crystallinity).
Minerals 12 00538 g006
Figure 7. The representative EPMA mapping of thin SIO0000D1 crust sample (substrate-colloforms transition zone). Crust bottom and top indicated by BSE photography. Visible remnants of substrate and well developed alteration layer composed of Fe-dominated oxyhydroxides in ‘iddingsite’. Middle part of Mn image (white rectangle) shows rounded biogenic remnants covered by thin layer of Mn-oxyhydroxides: sub—substrate remnants, d—debris (mostly Fe-Ti oxides and silicates), b—biogenic and biomorphic features, tr—transitional zone/layer, gr—growth direction based on visible Ni dispersion.
Minerals 12 00538 g007
Figure 8. (a) Traditional ternary discrimination diagram ([16] with further modifications) of studied crusts. (b) Discriminative scheme of analyzed C-N crusts based on comparison of major elements (Mn, Fe), metals (Cu, Ni) and HFSE (after [75]).
Minerals 12 00538 g008
Figure 9. Discrimination diagrams of Mn-Fe crusts from C-NSC: (a) CeSN/CeSN* ratio vs. Nd concentration; (b) CeSN/CeSN* ratio vs. YSN/HoSN ratio [72]. SN = PAAS-normalized REE.
Minerals 12 00538 g009
Figure 10. Representative EPMA profile of sample SIO0000D2 (red line) dominated by vernadite. On the photo cross-section visible textural changes, from massive layer of metal rich Fe-(Mn) vernadite in the crust bottom part (1 and 1b), by laminated Fe-(Mn) vernadite (2) and intercalations of clay minerals (3), ending on laminated (4) and columnar vernadite (4a): d—debris, cl—clay minerals. As shown on the geochemical profiles, a slight Zn content increase occurs in the bottom part of crust sample.
Minerals 12 00538 g010
Figure 11. Mean concentrations of: (a) major, (b) trace and (c) rare earth elements in crusts from C-NSC against the mean values from the other Pacific regions [21]; Wallis and Futuna [75]; New Caledonia Exclusive Economic Zone [102]. There is no Mo, Tl, Tm concentration data for [75] and Tm, Sc for [102].
Minerals 12 00538 g011aMinerals 12 00538 g011b
Table 1. Description of samples and list of performed analyses.
IGSNID 1Crust Thickness (mm)Textural TypeEPMAICP-MSSEMXRFXRD 2
SIO0000D21–61xx-xx
SIO0000BT1–41-xxxx
SIO0000BQ3–101-xxxx
SIO0000D1202xx-xx
SIO0000BP302xxxxx
SIO00003U1–103xxxxx
1 International Geo Sample Number. 2 XRD, samples dried 40 °C/24 h and roasted 105 °C/24 h. “x”: stands for performed analysis.
Table 2. Simplified bulk XRD composition of analyzed ferromanganese crust samples from C-NSC.
MajorMinor
SIO0000D2Vernadite-
SIO0000BTVernaditeBuserite, Manganite
SIO0000BQBirnessite, VernaditeBuserite, Clays
SIO0000D1Birnessite, Vernadite-
SIO0000BPTodorokite, Buserite, VernaditeBirnessite, Fe-ox., Clays, Manganite
SIO00003UBirnessite, VernaditeTodorokite, Buserite
Table 3. Chemical composition of bulk Fe-Mn crust samples as determined by XRF and ICP-MS methods. The ICP-MS expanded uncertainty of the results: p = 95%, coverage factor k = 2. The XRF precision accuracy was determined after 24 experimental measurements (each measurement taking 8 min).
MDL *SIO0000D2SIO0000BTSIO0000BQSIO0000D1SIO0000BPSIO00003UMean
Fewt %0.0126.8623.8818.314.9613.4911.7516.54
Mn0.0117.1118.0115.0044.1328.7036.4826.57
Si0.012.722.916.301.304.391.703.22
Al0.010.680.650.680.680.200.590.58
Mg0.010.420.410.901.150.890.750.75
K0.010.320.361.320.971.200.640.80
Ca0.011.671.600.911.650.751.471.34
Na0.010.550.620.791.020.810.970.79
P0.0010.1440.1040.0150.0310.0090.0750.063
Ti0.010.260.230.090.110.030.140.14
Element MDL **SIO0000D2SIO0000BTSIO0000BQSIO0000D1SIO0000BPSIO00003UMean
Asmg/kg (ppm)0.2188.0125.018.037.021.078.078.0
Ba1116012223976451639920997
Be1431<1<1<12
Bi0.041.951.470.270.430.150.790.84
Cd0.022.803.807.4019.6027.1020.0013.45
Co0.2449.0373.078.0298.772.0202.0245.5
Cr11418435861426
Cs0.1<0.1<0.11.1<0.10.6<0.10.9
Cu0.1860.0902.0758.0644.4569.0899.0772.1
Ga0.023.744.3110.3610.0311.7914.099.05
Hf0.020.08<0.021.142.070.52<0.020.95
In0.010.160.190.060.090.010.080.10
Li0.16.022.0209.0738.0277.0514.0294.3
Mo0.05198.00145.00159.00432.50284.00436.00275.75
Nb0.040.921.941.643.160.975.502.36
Ni0.11683.01487.01563.01769.71288.02118.01651.5
Pb0.02147.00122.0016.0020.028.0052.0060.84
Rb0.13.03.043.05.332.05.015.2
Re0.002<0.0020.002<0.002<0.002<0.002<0.002-
Sb0.0221.0019.0038.0059.4369.0096.0050.41
Se0.32.21.60.50.30.31.31.0
Sn0.12.72.30.80.80.21.71.4
Sr111461055205445328599630
Ta0.1<0.1<0.1<0.1<0.1<0.1<0.1-
Te0.053.923.830.330.830.491.671.85
Th0.14.94.30.80.90.42.62.3
Tl0.0535.0019.0057.0071.8884.0094.0060.15
U0.18.96.61.73.63.45.75.0
W0.111.813.94.29.96.118.410.7
V1549532113261138375328
Zn0.2574.0512.0619.0960.5711.0933.0718.3
Zr0.25.98.282.0117.438.116.144.6
La0.1175.0170.015.024.713.067.077.5
Ce0.02107.0083.0012.0018.589.0041.0045.10
Pr0.134.134.04.85.12.413.815.7
Nd0.1125.0128.012.024.19.052.058.4
Sm0.126.326.52.75.22.110.712.3
Eu0.17.88.00.91.50.63.13.7
Gd0.133.633.03.16.73.414.015.6
Tb0.15.85.81.61.10.52.42.9
Dy0.133.832.23.67.42.614.215.6
Y0.1138.0122.019.036.916.065.066.2
Ho0.17.87.60.91.70.73.73.7
Er0.121.019.92.45.12.19.310.0
Tm0.13.32.90.40.70.41.51.5
Yb0.119.219.22.44.62.18.49.3
Lu0.13.43.10.40.70.41.51.6
Sc0.111.610.67.78.81.65.37.6
ΣREY-741.10695.2081.20144.0864.30307.60338.91
ΣLREE-475.20449.5047.4079.1836.10187.60212.50
ΣHREE-265.90245.7033.8064.9028.20120.00126.42
LREE/HREE-0.530.570.510.370.340.480.47
CeSN/CeSN *-0.320.250.320.380.370.310.33
LaSN/LuSN *-0.580.620.430.400.370.510.48
Euan-1.211.251.451.171.001.161.21
YSN/HoSN-0.650.590.770.800.840.640.72
∑(Ni,Cu,Co)mg/kg (ppm)-2992276223992713192932192669
Fe/Mn -1.571.331.220.110.470.320.84
Mn/Fe-0.640.750.818.902.133.102.72
Co/Zn-0.780.730.130.310.100.220.34
Si/Al-4.024.469.291.9122.412.887.49
Th/U-0.550.650.470.250.120.460.46
* MDL Minimum detection limit for major oxides; Panalytical Standardless Omnian XRF Software (Lakeland, FL, USA). ** MDL according to the MA250 Method and Certificate of analysis by Bureau Veritas Commodities Canada Ltd.
Table 4. Singular correlation coefficient matrix and Factor Analysis (FA) data of Mn-Fe oxyhydroxides from the C-NSC (based on EPMA). Bolded correlations are significant at α < 0.05, N = 203, case wise deletion of missing data. Factor loadings >0.7 are bolded and expressed by a normalized varimax rotation.
SiAlClBaCaFeMnTiPPbCuCoKSrZnTlNiSNaMgAsRest *Expl. var. (%)
Si
Al0.63
Cl0.110.05
Ba−0.14−0.13−0.06
Ca−0.25−0.160.520.10
Fe0.770.620.33−0.070.17
Mn−0.87−0.68−0.270.13−0.02−0.96
Ti0.460.460.420.190.450.77−0.70
P0.410.360.470.010.570.85−0.730.81
Pb0.250.110.050.080.120.34−0.320.270.31
Cu−0.130.29−0.19−0.040.12−0.060.04−0.010.05−0.01
Co0.320.290.470.000.350.54−0.490.590.570.15−0.04
K0.11−0.29−0.37−0.15−0.59−0.460.34−0.64−0.70−0.14−0.27−0.42
Sr0.220.240.080.090.070.30−0.270.400.310.160.120.20−0.23
Zn−0.24−0.04−0.21−0.120.15−0.200.21−0.13−0.04−0.110.53−0.11−0.070.13
Tl−0.14−0.12−0.15−0.02−0.12−0.180.19−0.16−0.16−0.120.03−0.220.17−0.030.25
Ni−0.170.24−0.17−0.050.13−0.110.09−0.040.02−0.020.94−0.05−0.260.130.550.02
S0.030.030.560.050.730.34−0.230.470.630.180.060.40−0.510.180.06−0.170.13
Na−0.53−0.47−0.32−0.15−0.18−0.720.72−0.62−0.66−0.31−0.09−0.480.35−0.290.090.10−0.07−0.33
Mg−0.50−0.34−0.34−0.05−0.28−0.770.73−0.67−0.70−0.250.26−0.450.54−0.170.180.210.32−0.330.40
As−0.31−0.13−0.29−0.01−0.16−0.490.46−0.41−0.45−0.090.26−0.300.34−0.120.130.100.31−0.250.220.69
Rest *−0.44−0.27−0.060.00−0.06−0.280.19−0.19−0.20−0.08−0.10−0.11−0.19−0.18−0.05−0.01−0.10−0.170.04−0.07−0.11
FA
Factor 10.860.770.15−0.13−0.090.93−0.970.670.660.280.030.46−0.310.34−0.13−0.13−0.030.12−0.68−0.68−0.46−0.2333.7
Factor 2−0.180.31−0.23−0.070.12−0.090.08−0.020.03−0.030.95−0.05−0.310.160.62−0.0020.950.07−0.080.300.35−0.0513.6
Factor 3−0.14−0.120.730.010.900.27−0.110.510.650.07−0.00040.51−0.600.110.06−0.150.040.85−0.23−0.33−0.26−0.1211.8
Factor 40.330.080.05−0.10−0.070.010.004−0.06−0.080.090.010.0080.500.13−0.020.060.050.08−0.0040.390.44−0.846.0
Factor 5−0.05−0.07−0.130.840.110.060.0010.310.140.460.0010.02−0.190.38−0.13−0.030.00040.08−0.30−0.050.08−0.035.6
Factor 60.050.130.130.004−0.020.02−0.07−0.01−0.030.14−0.00030.18−0.04−0.27−0.51−0.810.010.01−0.080.030.200.115.0
Other factors(below 5% of explained variance)Sum = 75.7%
* Rest calculated from the EPMA data (potentially H2O and non-measurable elements such as Li or B).
Table 5. Estimation of growth rates and crusts formation age using Co-chronometer method (after [72,77]).
Co-Chronometer Data
IdSIO0000D2SIO0000BTSIO0000BQSIO0000D1SIO0000BPSIO00003UMean
Co (mg/kg)4493737829972202246
Co (wt %)0.04490.03730.00780.029870.00720.02020.02455
Fe26.8623.8818.314.9613.4911.7416.54
Mn17.1118.0115.0044.1328.7036.4826.57
Fe + Mn43.9741.8933.3149.0942.1948.2343.11
Con0.050.040.010.030.010.020.03
GR (mm/kyr) *0.100.121.140.231.940.430.66
GR (mm/kyr) **0.11------
Maximum thickness (mm)641020301013
Maximal predicted age (ka) *61 (69 **)33986152338
Mean age (±ka)38.0 ± 25.3
* Bulk samples data. ** EPMA profiling (compare [73]).
Table 6. Comparison of the most distinctive petrogenetic features of analyzed crusts from C-NCS.
Sample IDClassificationDominating Mineralogy 1GeochemistryGR 2:
SIO0000D2
(textural type 1)
hydrogenetic > hydrothermal 3
hydrogenetic-detrital 4
hydrogenetic→ hydrothermal 5
Fe-(Mn) vernadite > Mn-(Fe) vernadite >> birnessite ≅ asbolane ≅ Fe-oxyhydroxides
columnar growth and biomorphic textures
Fe > Mn (Mn/Fe = 0.64)
Ca-Na-Mg-K
Si > Al
Ni-Cu-Co; Co/Zn = 0.78
∑REY ***,6
*
SIO0000BT
(textural type 1)
hydrogenetic ≅ hydrothermal 3
hydrogenetic-detrital 4
hydrogenetic → hydrothermal 5
Fe-(Mn) vernadite >> todorokite-buserite
filamentous structures of potential microbial growth; biomorphic textures
Fe > Mn (Mn/Fe = 0.75)
Ca-Na-Mg-K
Si > Al
Ni-Cu-(Co); Co/Zn = 0.73
∑REY ***,6
*
SIO0000BQ
(textural type 1)
hydrogenetic ≅ hydrothermal 3
hydrothermal 4
hydrothermal 5
todorokite-buserite > Fe-(Mn) vernadite ≅ Na-birnessite ≅ other Fe-(Mn)
bioclasts and filamentous biofilms mixed with Mn-Fe oxyhydroxides
potentially transformed todorokite to buserite and birnessite
Fe > Mn (Mn/Fe = 0.81)
K-Ca-Mg-Na
Si >> Al
Ni-Cu; Co/Zn = 0.13
∑REY *,6
***
SIO0000D1
(textural type 2)
diagenetic >> hydrogenetic ≅ hydrothermal 3
hydrogenetic-detrital → detrital-diagenetic 4
hydrothermal 5
birnessite >> Fe-(Mn) vernadite
radial and globular micro aggregates; biomorphic textures
non-transformed birnessite
Mn >> Fe (Mn/Fe = 8.9)
Ca-Mg-Na-K
Si > Al
Ni-Cu-(Co); Co/Zn = 0.31
∑REY **,6
**
SIO0000BP
(textural type 2)
mixed: diagenetic > hydrogenetic ≅ hydrothermal 3
hydrothermal 4
hydrothermal 5
todorokite-buserite >> Fe-(Mn) vernadite ≅ Ni-(Cu) asbolane > birnessite
micro-crystals of with clay-like tabular or rosette-type aggregates
intercalation and agglomerates of phyllosilicates
partially transformed todorokite to buserite and birnessite
Mn >> Fe (Mn/Fe = 2.13)
K-Mg-Na-Ca
Si >> Al
Ni-Cu; Co/Zn = 0.10
∑REY *,6
***
SIO00003U
(textural type 3)
diagenetic >> hydrogenetic > hydrothermal 3
hydrogenetic-detrital → detrital diagenetic 4
hydrothermal 5
birnessite >> Fe-(Mn) vernadite > todorokite/buserite
radial and globular micro aggregates
partially transformed todorokite to buserite and birnessite
Mn >> Fe (Mn/Fe = 3.1)
Ca-Na-Mg-K
Si > Al
Ni-Cu-(Co); Co/Zn = 0.22
∑REY **,6
**
1 >> significantly dominated; > slightly dominated; ≅ approximately equal. Buserite/todorokite relative content based on 105 °C/24 h of autoclaving. Buserite is officially disapproved by IMA. 2 Growth Rate (GR) estimated by Co-chronometer [72,77]: * 0–200 mm/Myr; ** 200–500 mm/My; >500 mm/Myr. 3 After [16] with further modifications. 4 After [86], modified by [95,96]. 5 Classification after [79] based on U/Th ratios. 6 ∑REY: * <100 mg/kg; ** 100–500 mg/kg; *** >500 mg/kg.
Publisher’s Note: MDPI stays neutral with regard to jurisdictional claims in published maps and institutional affiliations.

