Article

Chemical Diversity of Teeth and Bone Fragments from a Newly Discovered Upper Muschelkalk Bone Bed from Silesia, Poland

by
Tomasz Krzykawski
1,
Krzysztof Szopa
1,*,
Robert Niedźwiedzki
2,
Krzysztof Setkiewicz
3 and
Maria Czaja
1
1
Institute of Earth Sciences, University of Silesia in Katowice, Będzińska 60, 41-200 Sosnowiec, Poland
2
Institute of Geological Sciences, Univeristy of Wrocław, Pl. Maksa Borna 9, 50-204 Wrocław, Poland
3
Centrum Badań Jakości spółka z ograniczoną odpowiedzialnością (CBJ sp. z o.o.), M. Skłodowskiej-Curie 187a, 59-301 Lubin, Poland
*
Author to whom correspondence should be addressed.
Minerals 2022, 12(4), 469; https://doi.org/10.3390/min12040469
Submission received: 28 February 2022 / Revised: 30 March 2022 / Accepted: 8 April 2022 / Published: 12 April 2022

Abstract

:
The new exposure of the Upper Muschelkalk clays and dolomites located south of Kalety (Tarnogórski District, Silesia, Poland) provided numerous remains of vertebrates represented by teeth, scales, long bones, and coprolites. Despite the influence of hydrothermal processes leading to dolomitization and Zn-Pb deposit formation, the preservation of fossil remains is good. The taxonomic diversity and accumulation of vertebrate debris in the dolomite are similar to other “bone beds” from the Muschelkalk and the Lower Keuper units. The SEM-EDS, EMP-WDS, and XRD analyses confirm that the examined remains consist of hydroxylapatite containing carbonate ions. Most vertebrate teeth as well as some bone fragments show zoning in the BSE imaging. In tooth cross-sections, three or two zones are preserved: (I) the outermost zone, associated with diagenetic mineralization of enameloid apatite, (II) a intermediate zone (orthodentine), and (III) the most porous internal zone (osteodentine). Decreasing P, Ca, Sr in the composition of the apatite which forms successive zones, is visible from the most external to the central part. Selective diagenetic substitution and adsorption of some elements by apatite crystals can allow recognition of the genetic origin of highly damaged or transported fragments scattered in the sedimentary layers. The chemical behavior of bioapatite, from deposition to digenesis, shows its useful role for identification of the formation process and potential, younger changes (e.g., hydrothermal overprint). The X-ray diffraction data, particularly cell parameters “a” and “c”, can determine the degree of crystallinity and/or diagenesis. Moreover, correlation between some elements/ions (e.g., Sr, Ba, Ca, Mg, F, OH) can be helpful for the identification of the fossil type, especially if the bones are small and incomplete.

1. Introduction

The skeleton plays an important role in numerous organisms. In case of the vertebrates, the skeleton is internal and composed by bioapatite, giving structural and mechanical support as well as being a carrier for selected ions (e.g., [1,2]. Fossil bioapatite can provide information on the paleobiology of extinct vertebrates and reflect the changes that occurred to bioapatite during diagenesis (e.g., [3]). Complete skeletons are rarely found, while sediments commonly host single, separated bones. Bone beds are unusually rich accumulations of mostly apatitic bones, scales and teeth from more than one individual organism that occurs in the same geological stratum. They vary in age and are hosted by sediments with different lithologies (i.e., Devonian, Silurian, Permian, Cretaceous) (e.g., [4,5,6,7]).
The large accumulation of Triassic vertebrate debris bone beds in the region south of Kalety, Tarnogórski District, Upper Silesia, Poland was recently discovered. All vertebrate remnants are distributed in the yellow dolomitic conglomerates and dolomites. In the sediments, fish skeletal fragments dominate over other types, which are mostly represented by: actinopterygian fish skeletal parts (mainly Colobodus, Saurichthys, Gyrolepis), primarily ganoid scales, different teeth, and bone fragments. Numerous and well-preserved shark teeth were also found. Most of them represent hybodonts (Acrodus, Hybodus, Lissodus and Palaeobates). Three large, up to 4-cm-in-size fragments of vertebrae of reptiles (Sauropterygia) and single reptilian teeth were also found. While the remains of the vertebrata are large (30–40 remains in 1 cm2), the invertebrates found incidentally include a few poorly preserved steinkerns mussels, including Plagiostoma striatum and Entolium sp., for example. Occasionally marine coprolites were found [8]. The Triassic horizon with the “bone beds”, is part of the Germanic basin, where numerous fragments of vertebrate bones are found. They appear in the Lower Muschelkalk of Lower Silesia and near Opole [9], as well as in the Holy Cross Mountains [3], in the uppermost part of the Middle Muschelkalk and in the Upper Muschelkalk (e.g., [10]) and in the Lower Keuper (Miedary, see [11,12]). The taxonomic diversity of vertebrate from Kalety is typical and similar to other “bone beds” from the whole carbonate Muschelkalk and the Lower Keuper units.
However, the characteristic features of this new pit are a very good state of preservation of all the fossils and large diversity of species and the potential presence of Neoselachii [8]. This makes the locality valuable for new paleontological discoveries.
In this paper we geochemically characterize the vertebrate bone fragments and teeth. By using XRD and EMP analysis, a way to distinguish enamel, dentine and pulp cavities from other type of bones and scales is provided.

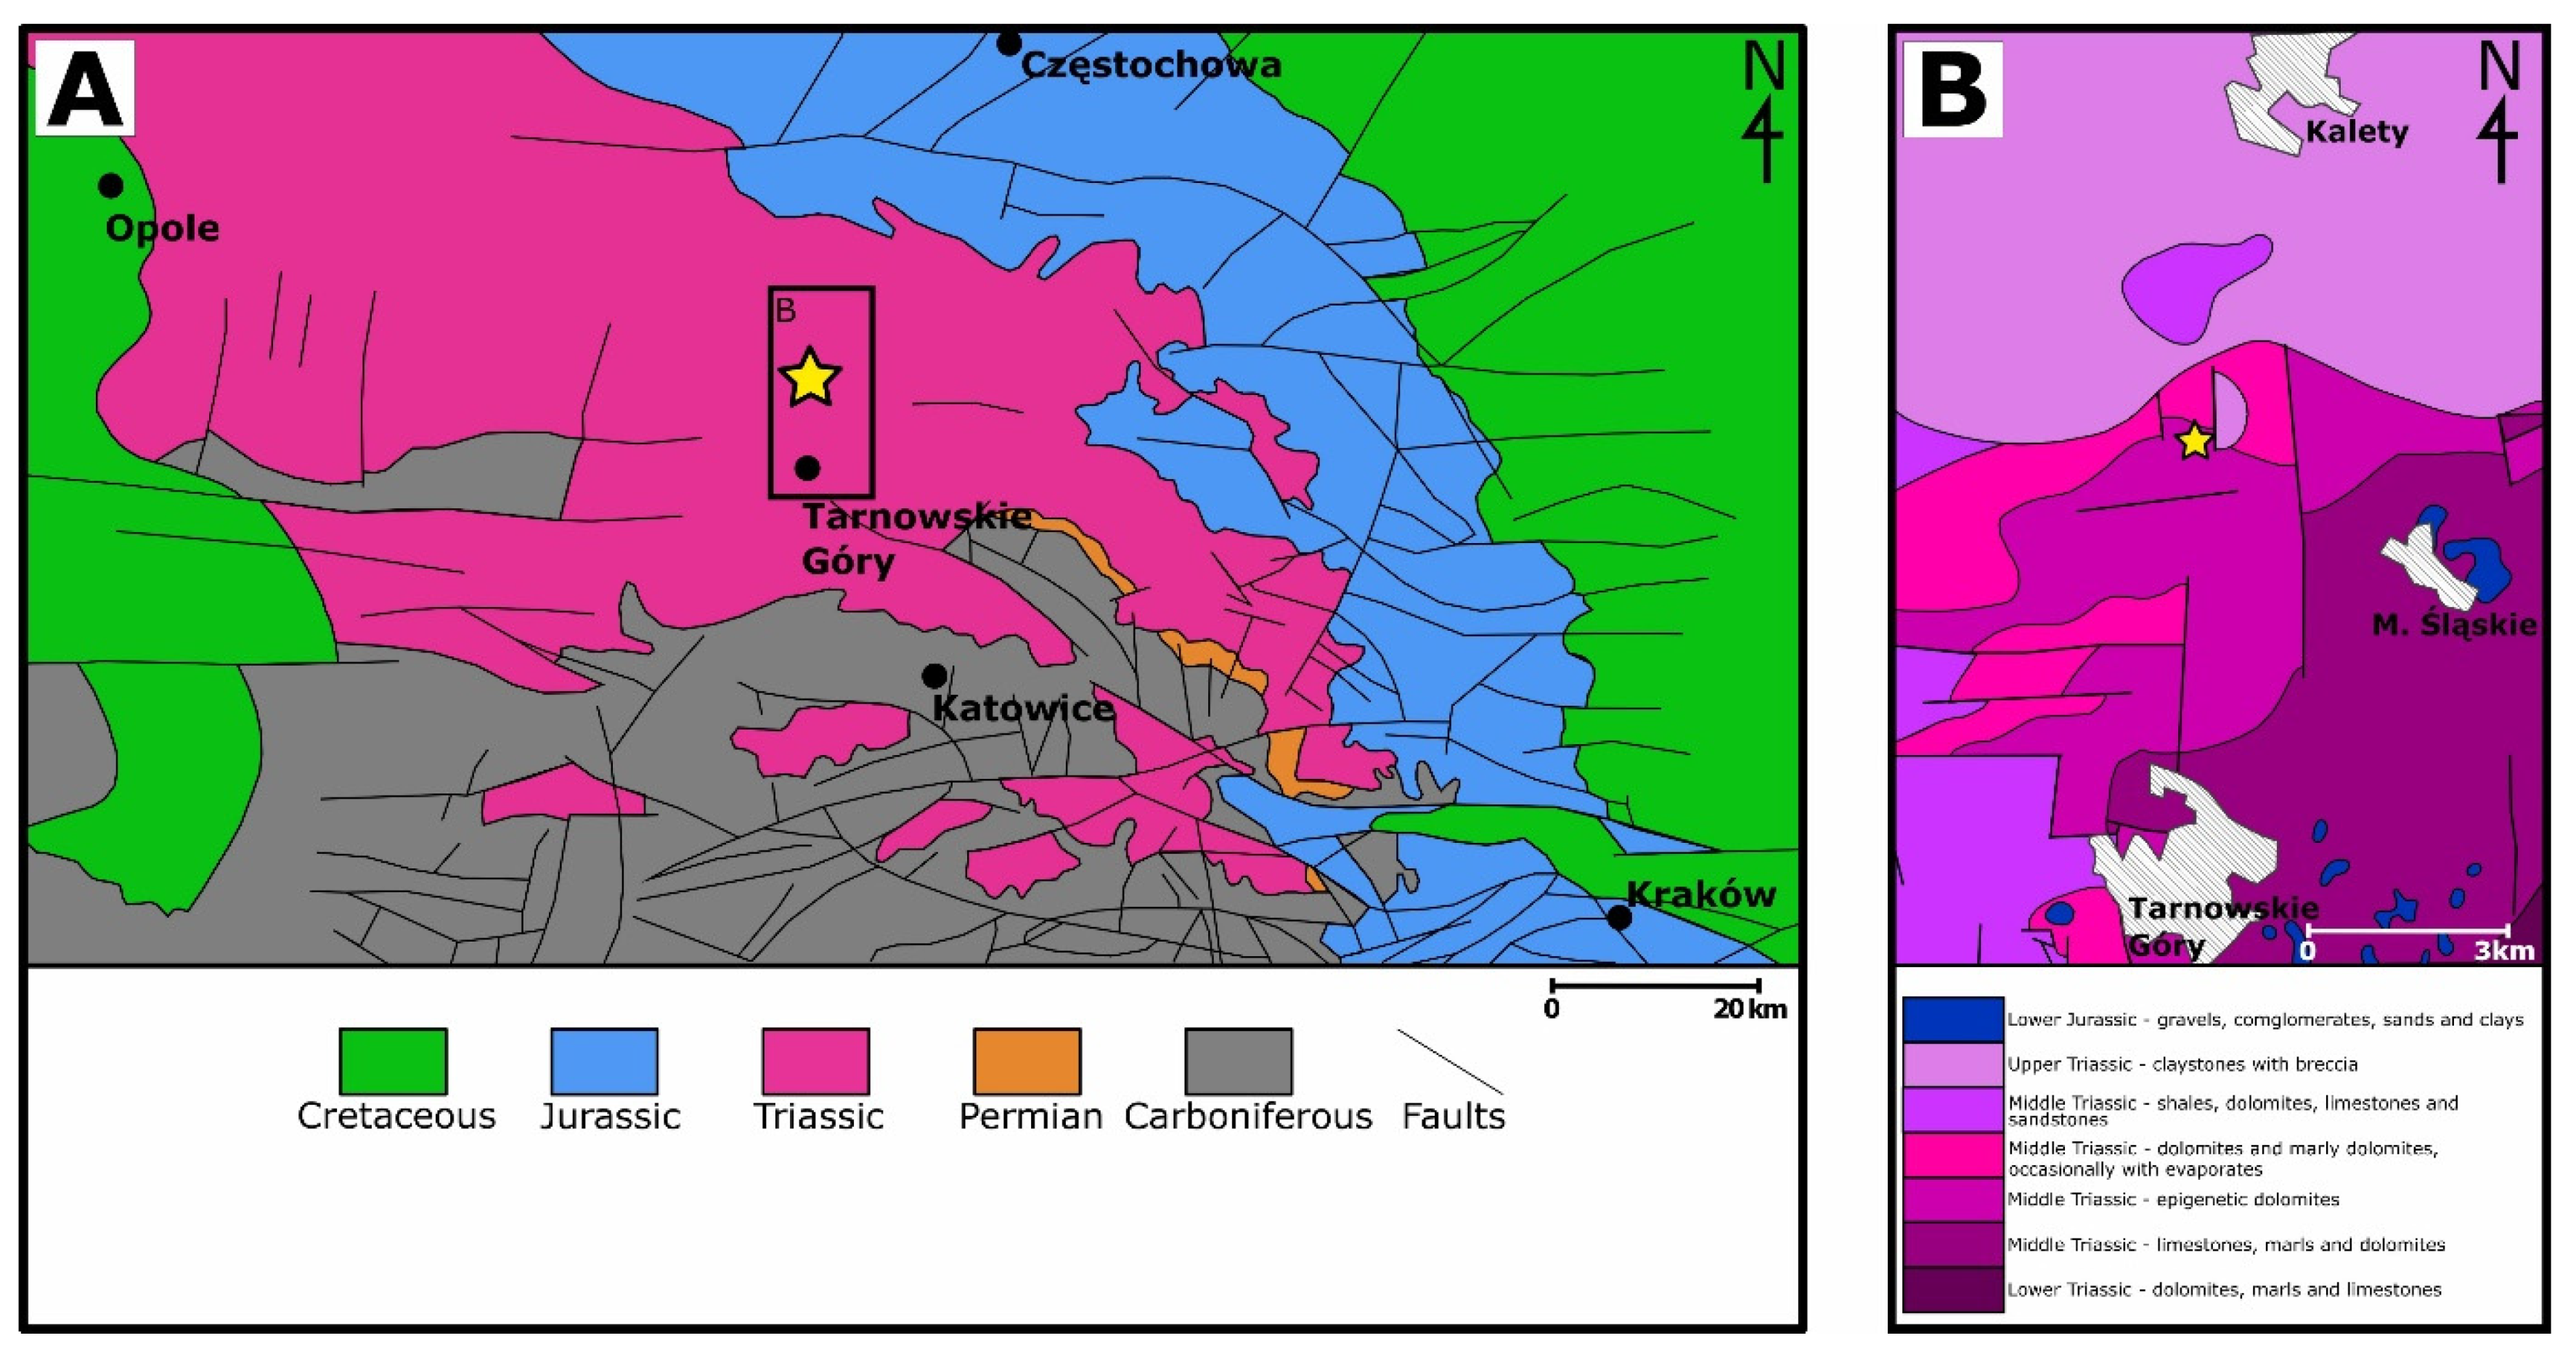
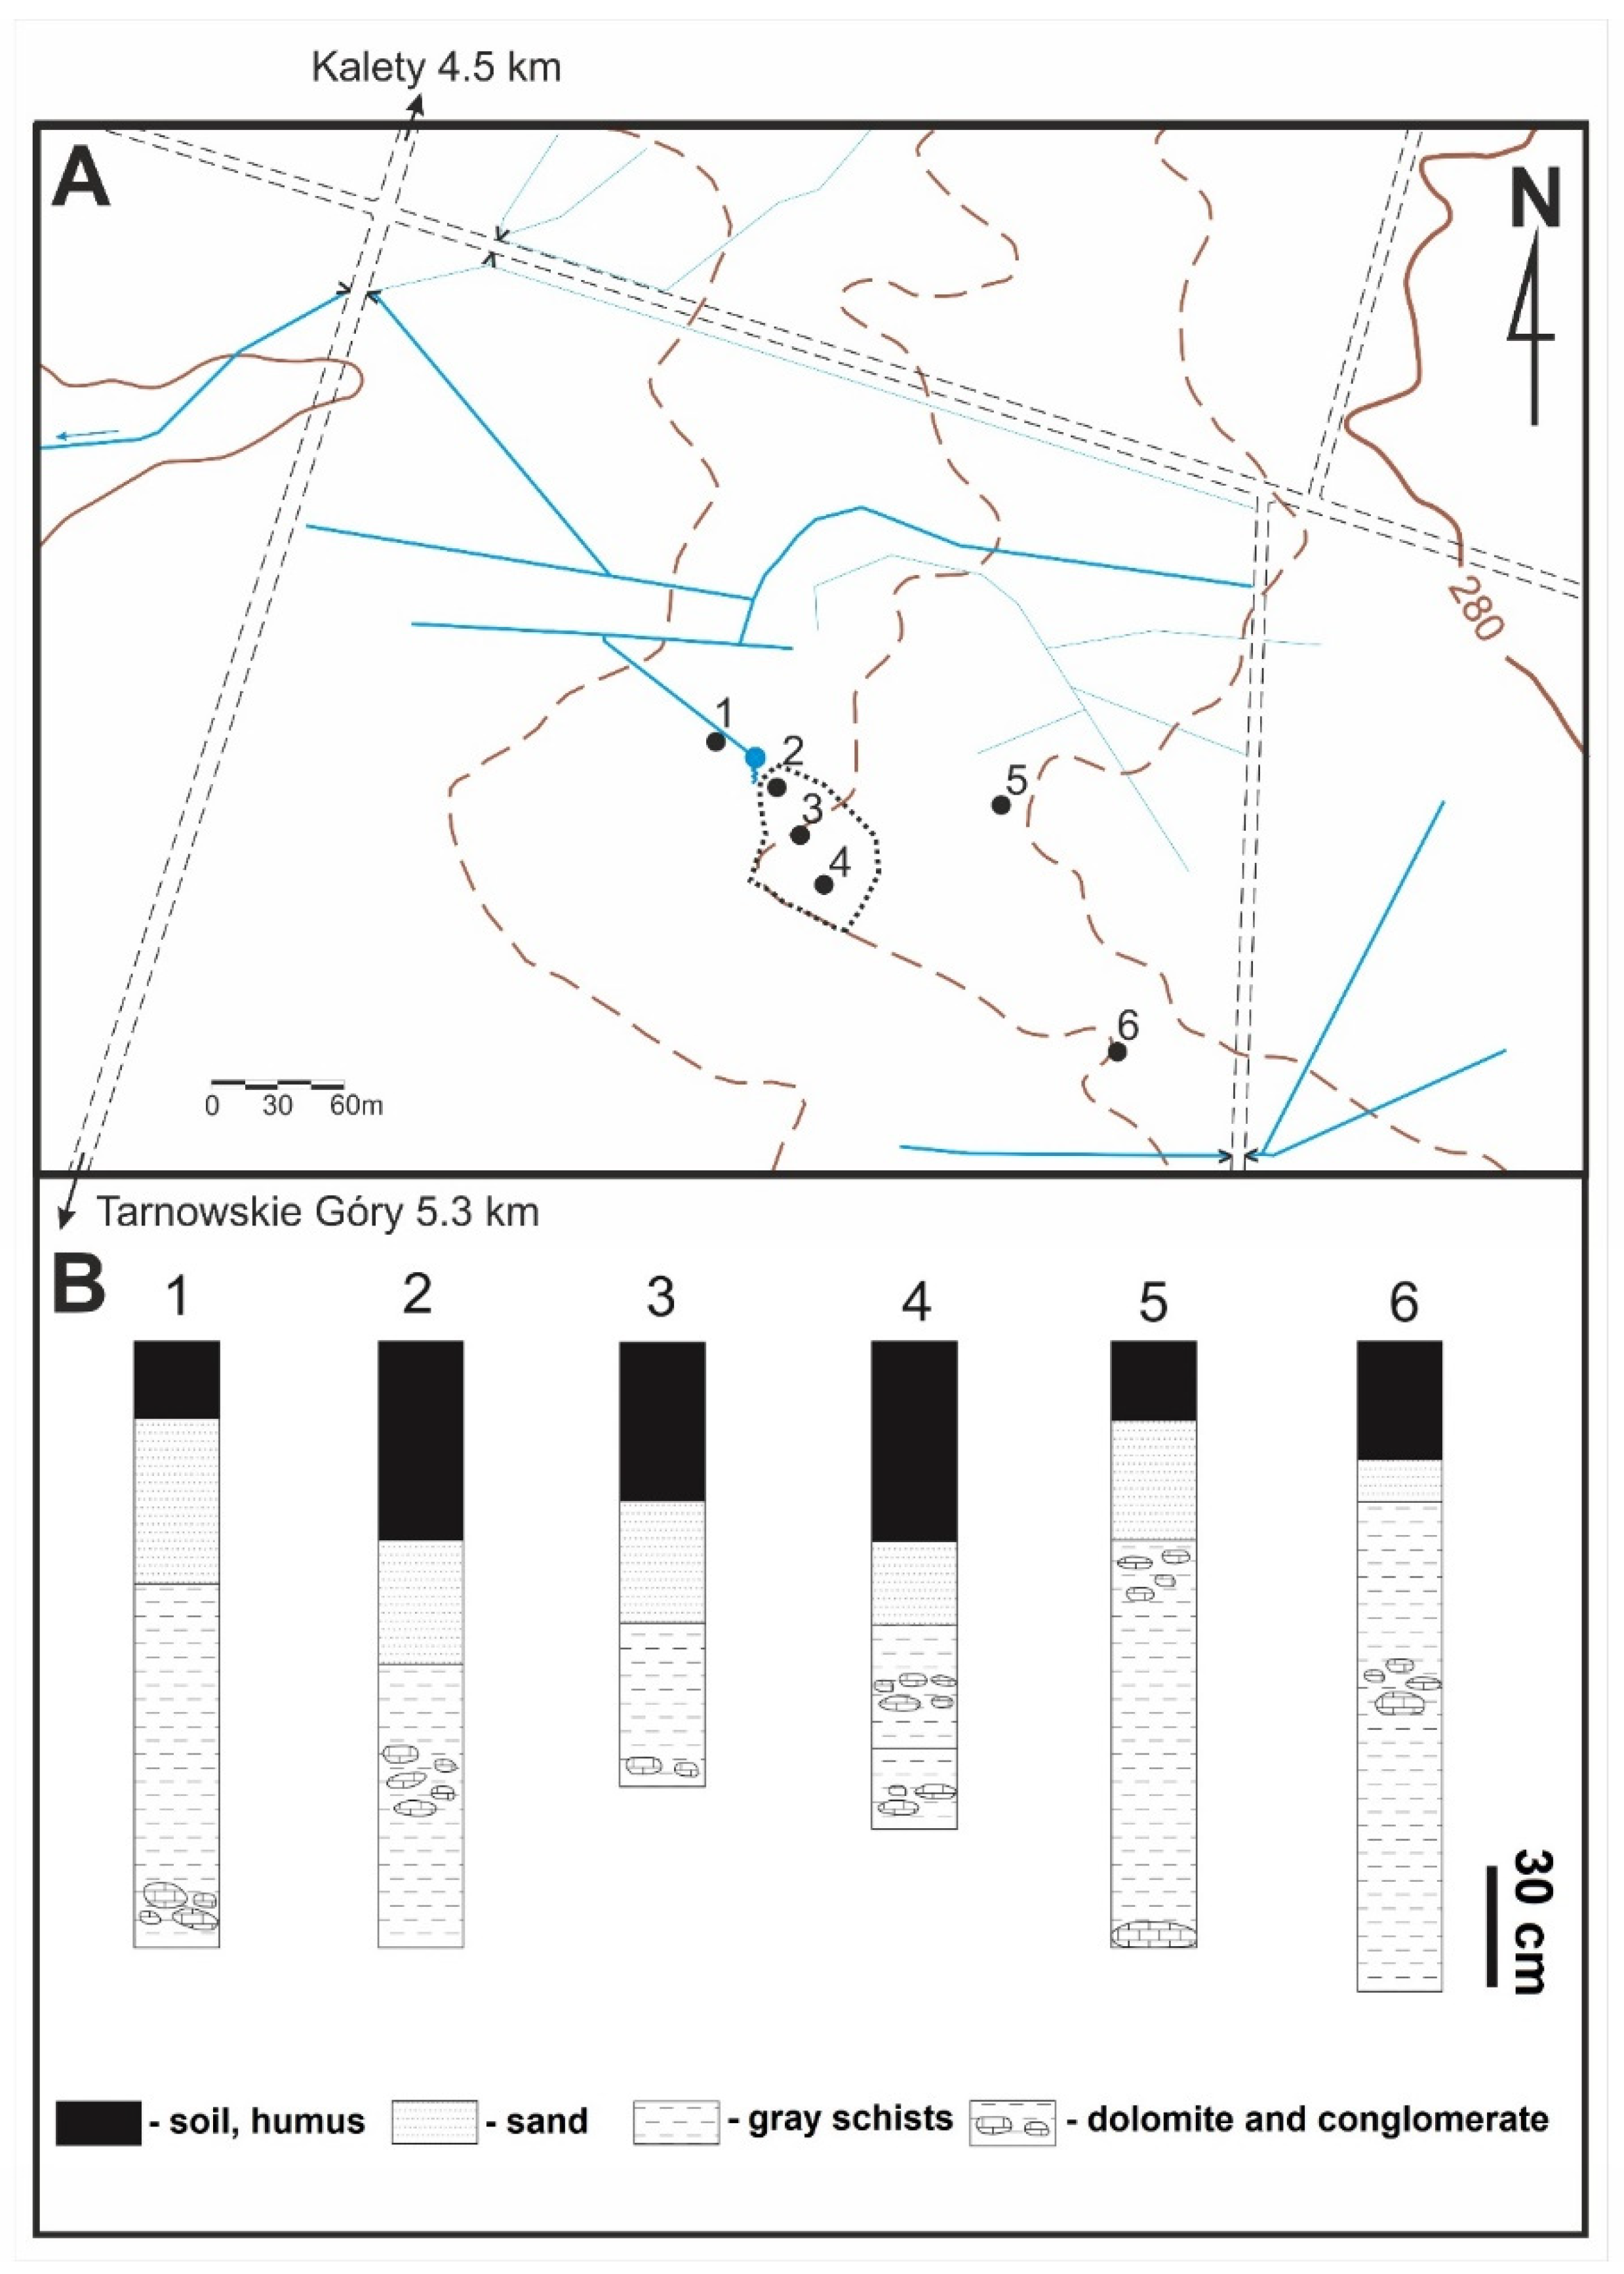
2. Geological Settings

The studied outcrop is located in the north part of Silesia, about 10 km south of town Kalety (Figure 1). In this area four lithostratigraphic units of the Triassic occur ([13], lithostratigraphy modified after [14,15]): (1) so-called ore-bearing dolomites (secondary metasomatically dolomitized limestones and marls of the middle and upper part of the Lower Muschelkalk); (2) dolomites of the Middle Muschelkalk (Diplopora Beds and higher lying Tarnowice Beds); (3) Upper Muschelkalk (organodetritic dolomites of the Wilkowice Beds, which are covered by the Boruszowice Beds, represented by dark gray claystones and mudstones with thin dolomites intercalations); (4) Rhaetian (uppermost Triassic) claystones. Diplopora Beds, Wilkowice Beds and Boruszowice Beds show a thickness of about 10 m, the Tarnowice Beds are approximately 25 m thick, and ore-bearing dolomites are about 50 m thick [14,15], while numerous drillings from the Kalety area shows that the thickness of the Wilkowice Beds does not exceed 5 m [16].
In the Triassic deposits of Kalety region, numerous fossils were found: multiple fish teeth and scales were mentioned by [18], conodonts were found in the Wilkowice Beds [19] and pyritized fauna such as undetermined bivalves, gastropods, small cephalopods, and fish remains were described from the Boruszowice Beds [20]. Senkiewiczowa [21] also described fossiliferous limestones of the Upper Muschelkalk in the area east of Kalety.
For this study, six manual drillings down to a depth of 1.8 m were made (Figure 2). In the geological profile, below Quaternary soil and sands (40–85 cm thick), dark grey clays with thin (2–3 cm) intercalations of yellow dolomites are present. The clays do not contain visible fossils, whereas dolomites (mostly on the upper bedding surface), show mass accumulations of fish remains and rare vertebrae, fragments of long bones, and teeth of marine reptiles (Sauropterygia). Invertebrate fossils are very rare in dolomites, among them, molds of bivalve Plagiostoma striata and Entolium sp. were found. Among the fish remains the most common are actinopterygian scales, bone fragments, and pieces of jaws and/or teeth of Saurichthys sp., Colobodus sp., and Gyrolepis sp. Relatively common are shark teeth: Acrodus sp., Hybodus sp., Lissodus sp., Palaeobates sp (Figure 3 and Figure 4).
In the fossil assemblage from the studied outcrop, stratigraphically important taxa were found. According to the geological map [6], the studied exposure is located in the ore-bearing dolomites unit (middle and upper part of the Lower Muschelkalk), however, rocks of this unit contain abundant and taxonomically diverse invertebrate fossil assemblages [15,22], and do not contain bone beds (except the karst fillings in the Stare Gliny quarry, see [23], shark teeth, for example, are extremely rare in this strata ([15,24], own observations). Moreover, a thick series of clays are absent in the unit. Bone beds with abundant actinopterygian and shark remains occur in the upper part of the Tarnowice Beds, in the Wilkowice Beds, and the Boruszowice Beds ([15,24], own observations) and in Lower Keuper [11,12]. Horizons with numerous remains of vertebrates also occur in the Upper Triassic of the Silesia region (e.g., Krasiejów, Lisowice, Poręba, Woźniki). However, Upper Triassic deposits were formed in freshwater or terrestrial environments and they do not contain marine fish (e.g., Saurichthys, Colobodus, Gyrolepis) or bivalves (Plagiostoma, Entolium) which occur in the studied exposure near Kalety (compare, e.g., [25,26,27]. The Tarnowice Beds and Wilkowice Beds are formed by limestones. The Wilkowice Beds also contain very abundant invertebrate fossils. The presence of thick-layered clay beds, a very rare and poor diversity invertebrate assemblage and occurrence of marine taxa both invertebrates and vertebrates in studied outcrop, suggests that these rocks represent the Boruszowice Beds (Upper Muschelkalk).

3. Materials and Methods

During the fieldwork carried out in 2014–2015, more than 80 rock fragments containing numerous vertebrate fauna were collected. To identify the occurrence of dolomites, six shallow drillings were made, the locations of which are shown in Figure 2. In several places, excavations were made to reveal the upper part of the profile. At a depth of 1.5 to 2 m, the groundwater level was reached, which made further geological work difficult.
The collected specimens were analysed using the Zeiss Stemi 508 stereoscopic microscope. Teeth, fragments of long bones, coprolites, and fish scales were prepared with a steel needle and tweezers. The material obtained for each of the separated groups was ground in an agate mortar in order to make a powder weighing approximately 100 to 200 mg in size. Three dolomite fragments containing the richest fossils were selected for thin section preparation.
The macroscopically recognized list of vertebrates in the “bone beds” from Kalety are as follow: Hybodus sp. (tooth), Acrodus sp. (tooth), Lissodus sp. (tooth), Palaeobates sp. (tooth), Saurichthys sp. (tooth), Colobodus sp. (tooth), Sauropterygia (vertebra), (Figure 3). Some of fossils are unrecognizable (cracked fragments of bones, fish scales; Figure 3 and Figure 4). The examined assemblage comprises ~30 fragments of hard tissues of vertebrate in three thin sections. Moreover, macroscopic observations reveal black- and grey-coloured vertebrata teeth and fish scales, orange-coloured vertebrata teeth and bones. The orange colour is the result of the abundant Fe-oxyhydroxides formed due to pyrite oxidation, which crystallised in the bone pore spaces and the marrow cavities, whereas the grey- and black-coloured teeth have probably spread organic compounds, which make them darker. In case of the hard bone fragments, the samples show various degrees of abrasion, fragmentation, etc. Most bones show minor evidence of abrasion, which is shown as rounded edges.

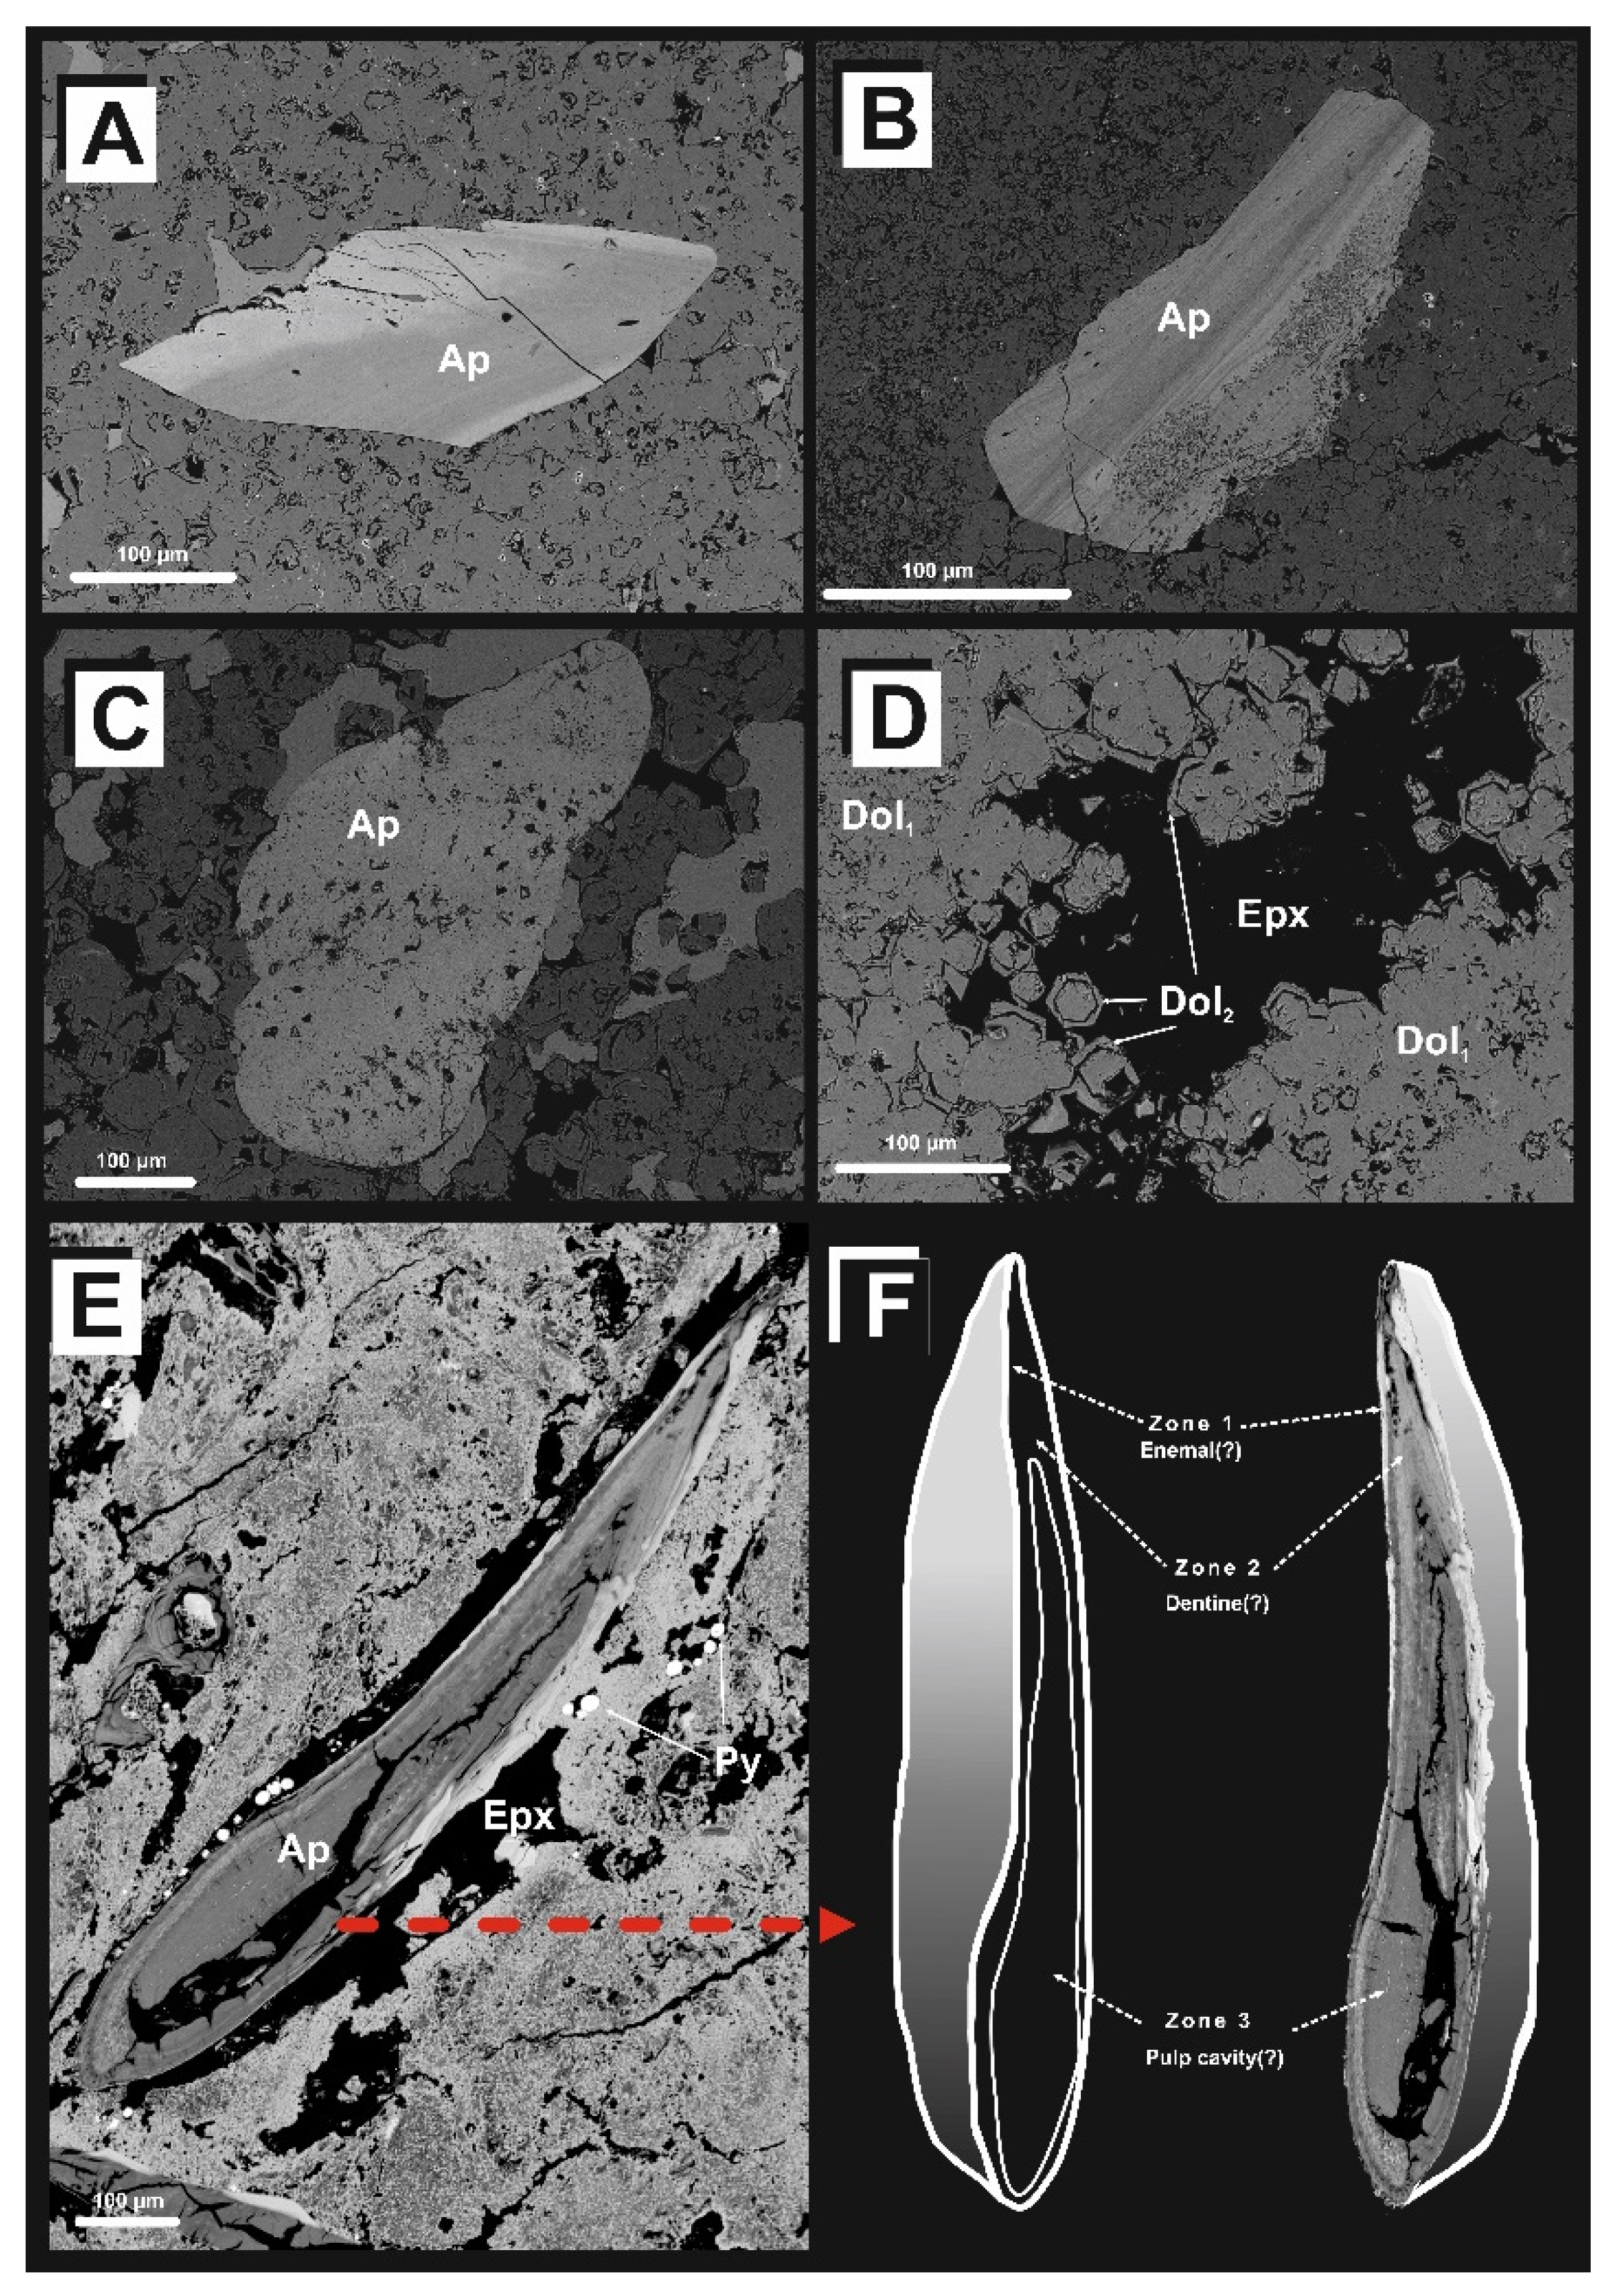
3.1. Microscope and Electron Probe Micro-Analyses (EPMA)

Optical microscope analyses, backscattered electron (BSE) and secondary electron (SE) imaging of the fossils and its host rock, were carried out on a Philips Xl 30 ESEM/TMP scanning electron microscope (SEM) equipped with an EDS (EDAX) detector. The analytical conditions were: 10 s counting time per element, 15 kV accelerating voltage, and a 20 nA beam current. Sets of natural and synthetic standards were used for calibration.
Microprobe analyses of apatite were carried out on a CAMECA SX-100 electron microprobe in the Inter-Institution Laboratory of Microanalysis of Minerals and Synthetic Substances, Warsaw. Analytical conditions were 10 s counting time per element, 15 kV accelerating voltage and 20 nA beam current. Sets of natural and synthetic standards were used for calibration.
The apatite analyses have been normalized to the sum of 50 negative charges including 24 oxygen ions and two monovalent anions (fluorine site), according to the ideal chemical formula of apatite-(CaF): A10(BO4)6(X)2 where site A is occupied by Ca, Fe, Mn, Mg, Th, REE, Y and Na, site B by P (substituted by S, Si) and site X by F, Cl and OH group.

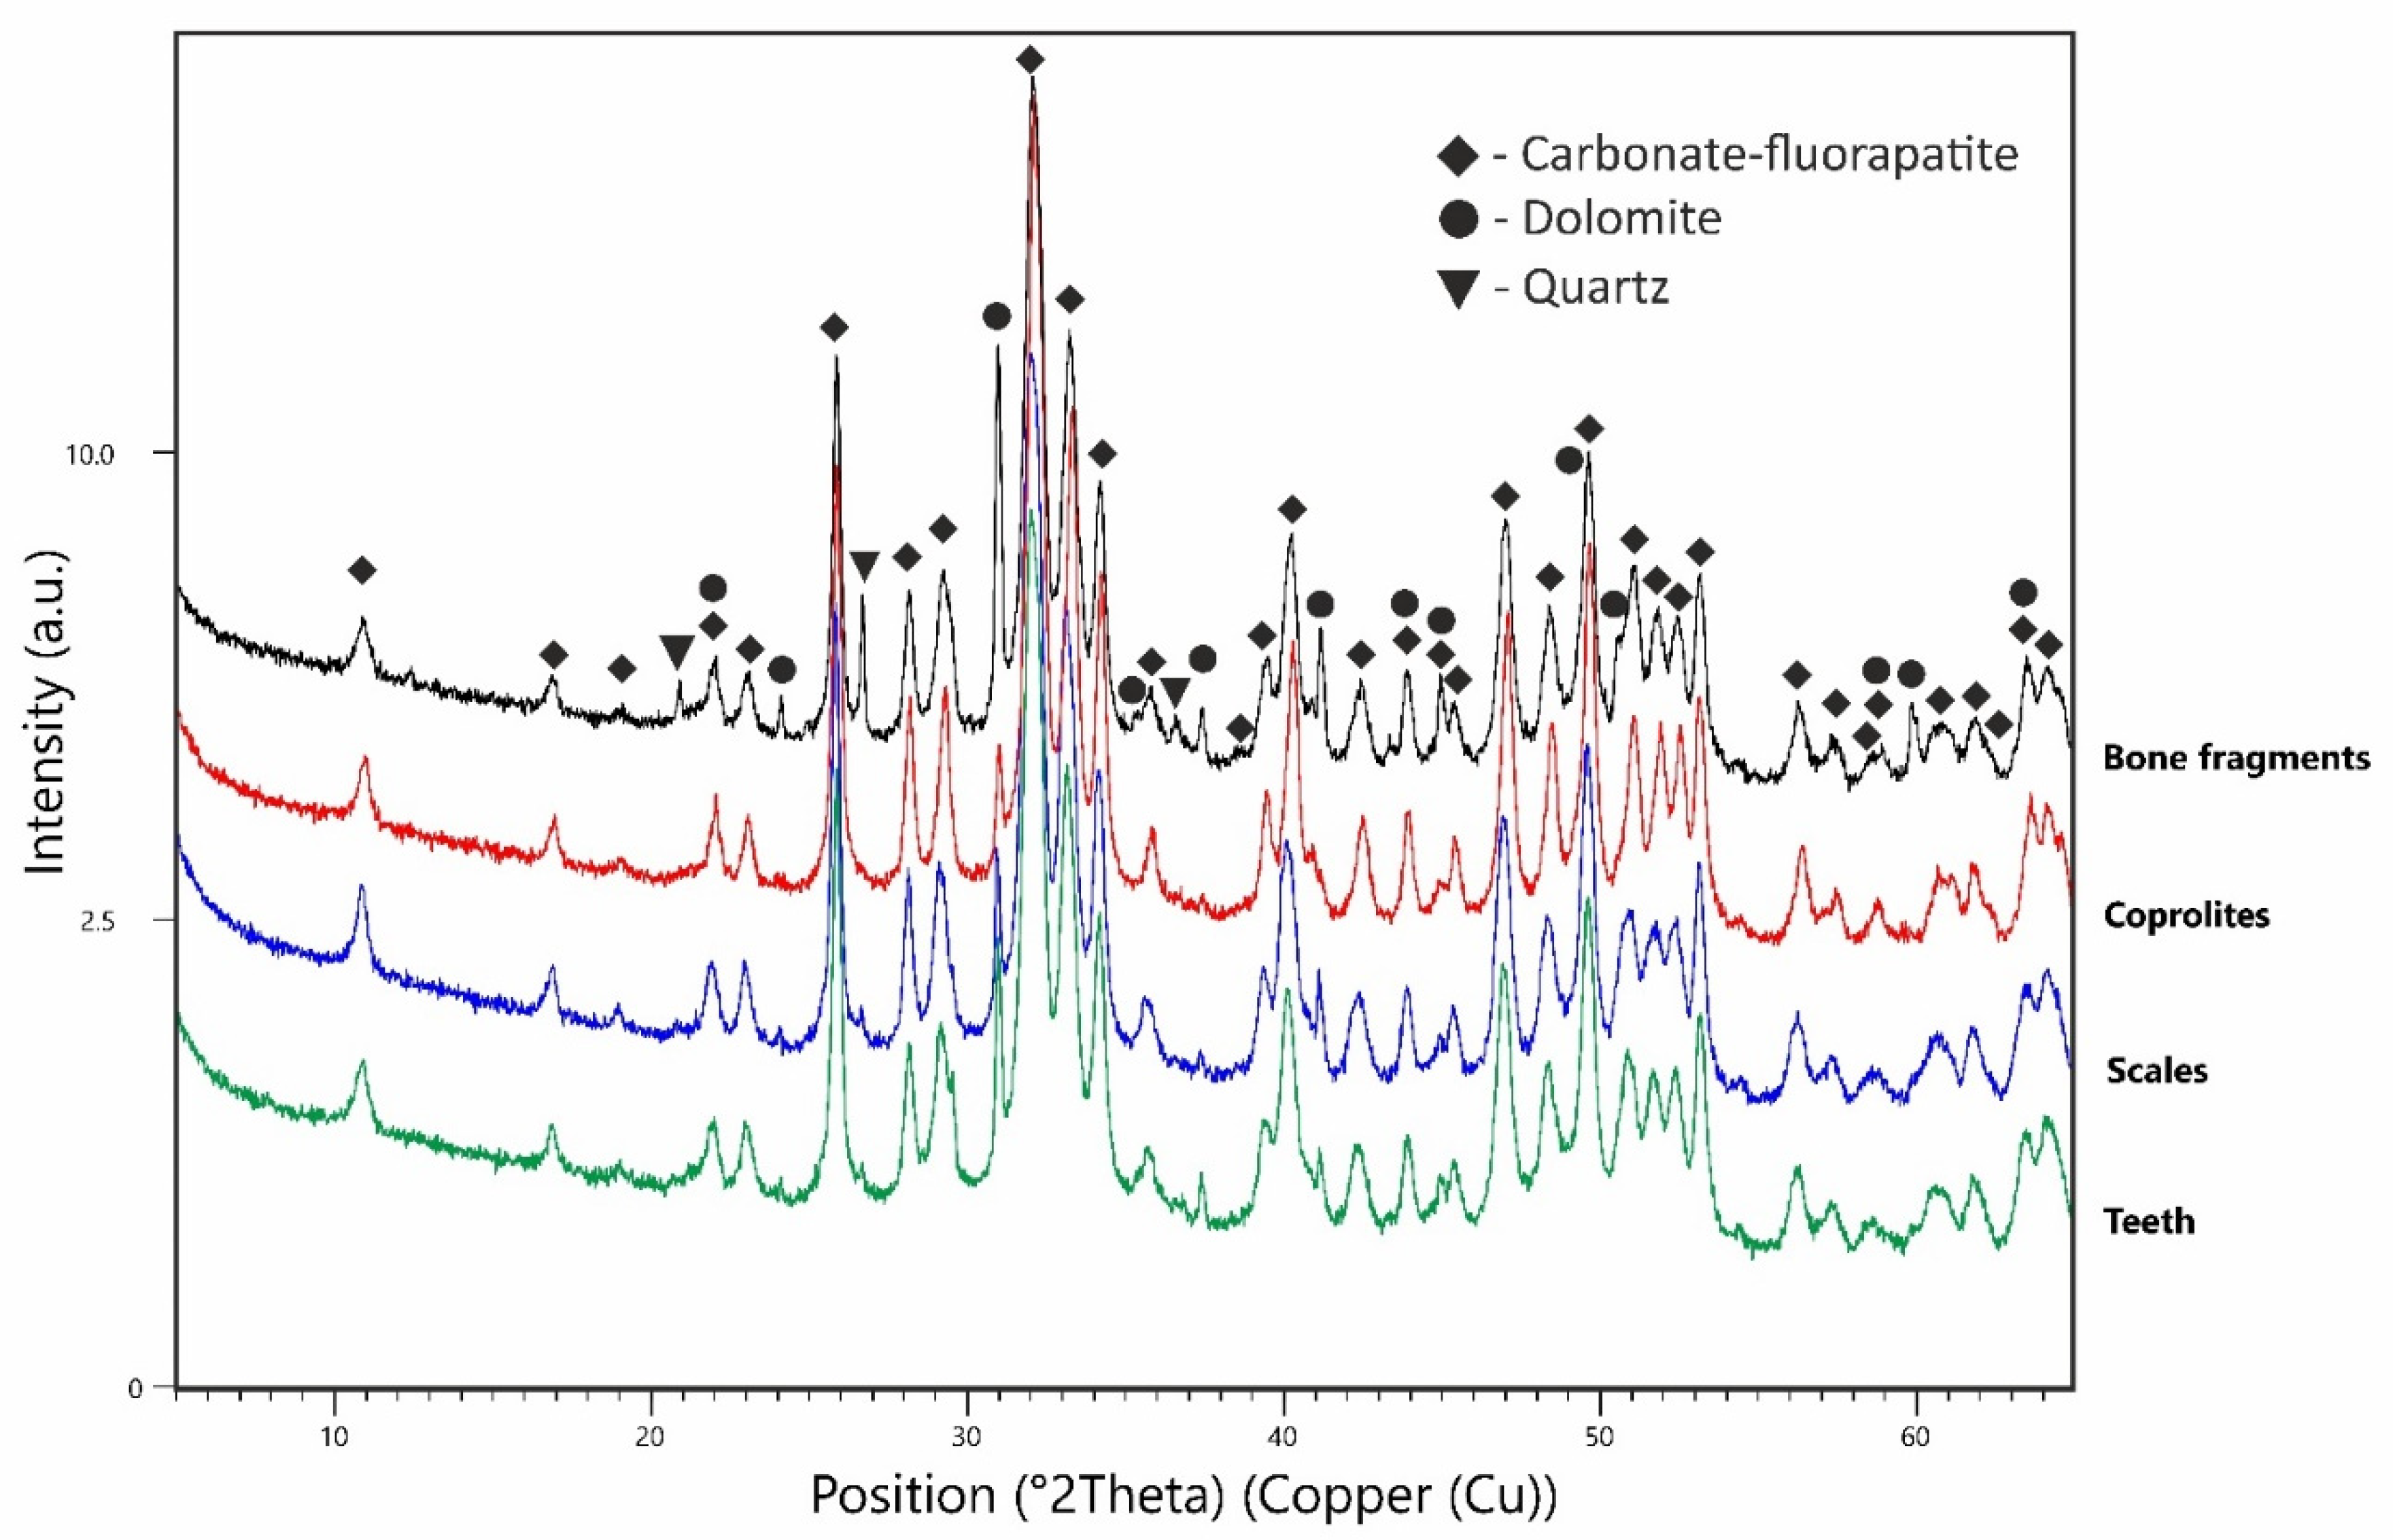
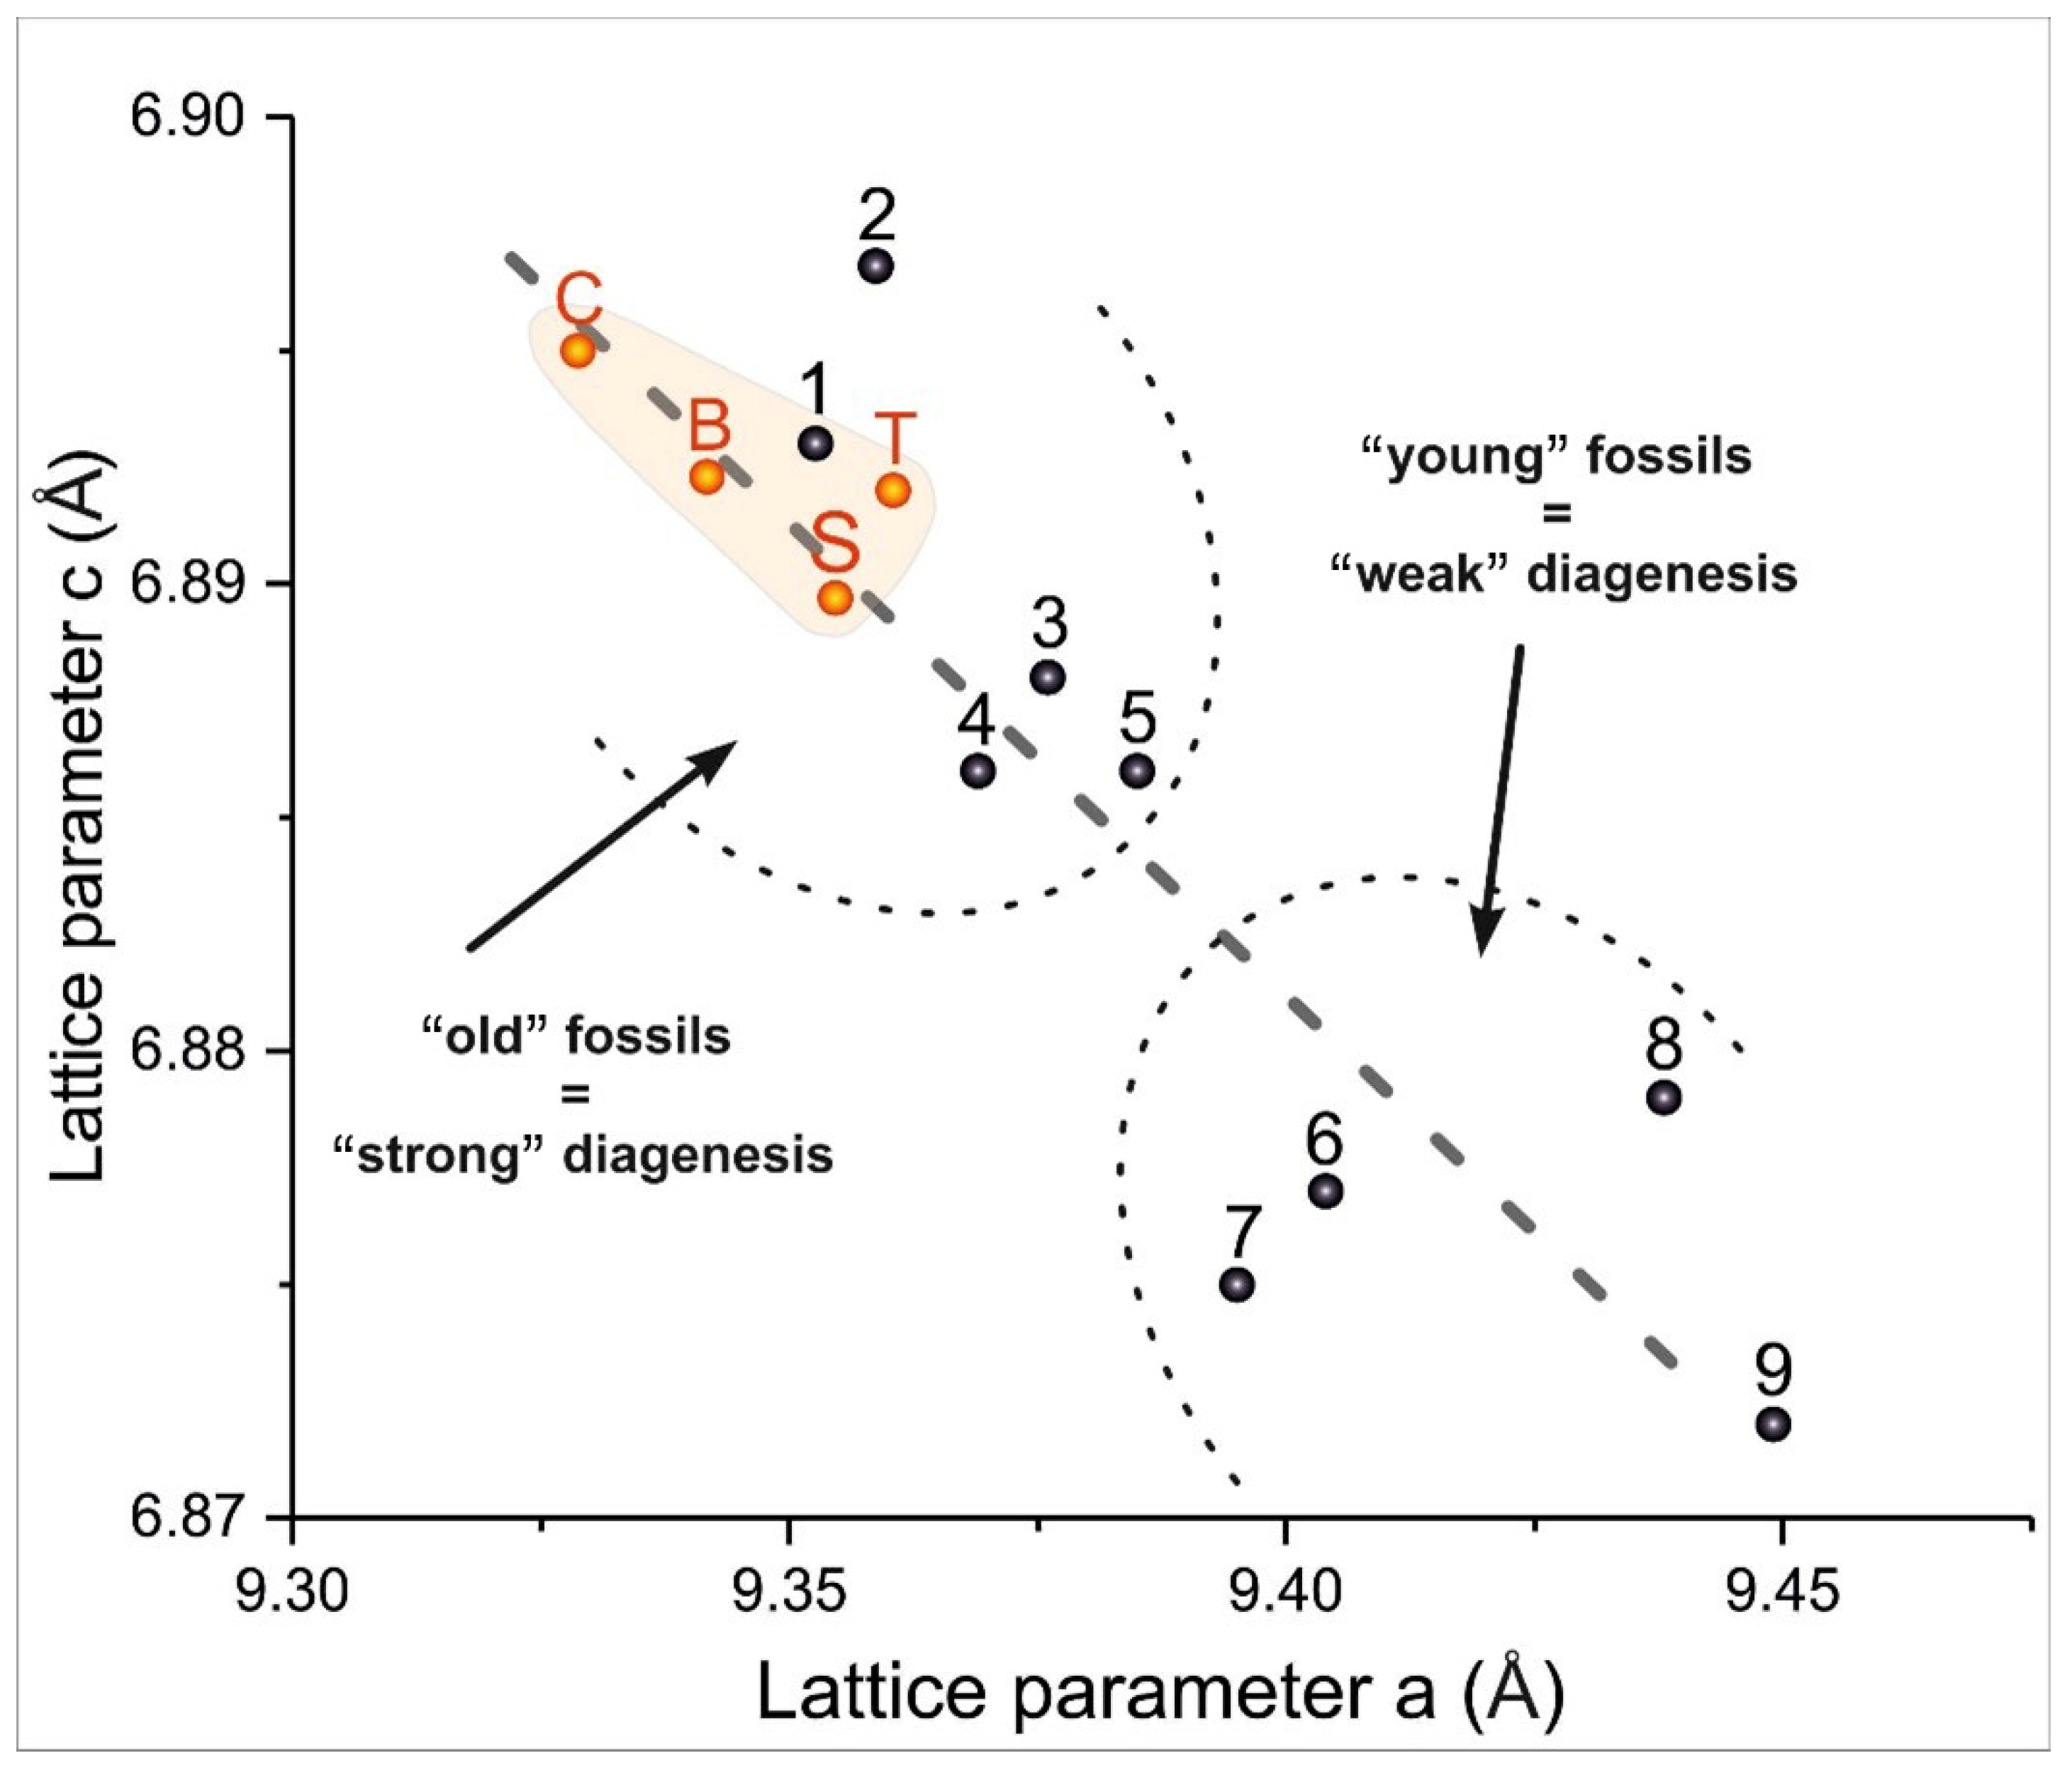
3.2. X-ray Diffraction (XRD)

Four powder samples, prepared by a combination of material from the preparation under the microscope, hereinafter referred to as scales, teeth, long bones, and coprolites were analysed using the X-ray diffraction (XRD) powder method. After careful grinding in an agate mortar, the samples were applied to a silicon zero background holder and mounted in steel rings provided by the system manufacturer. XRD data were collected using a Panalytical X’Pert PRO MPD PW 3040/60 diffractometer with a Theta-Theta geometry (Malvern Panalytical B.V., Almelo, The Netherlands). Measurements conditions were set to a 300-s time limit, 0.02° 2Θ step size, and 5–65° 2Θ range. The generator was set to 45 kV and 30 mA, the anode copper material with Ni-filter allowed to acquire pure Cu-Kα radiation (λ = 1.541874Å). The obtained diffractograms were processed in the HighScore+ program [28].
The calculation of the carbonate ion content in the structure of apatite was performed on the basis of the equation given by Schuffert et al. [29]. This equation takes the form:
y = 10.643x2 − 52.512x + 56.986,
where y = CO32− wt% and x = Δ2Θ(004) − (410).
The crystallite size analysis was performed by the phase fit method in the HighScore+ program, and is based on the change of the profile widths compared to a LiB6 standard sample (NIST, SRM, 660b).

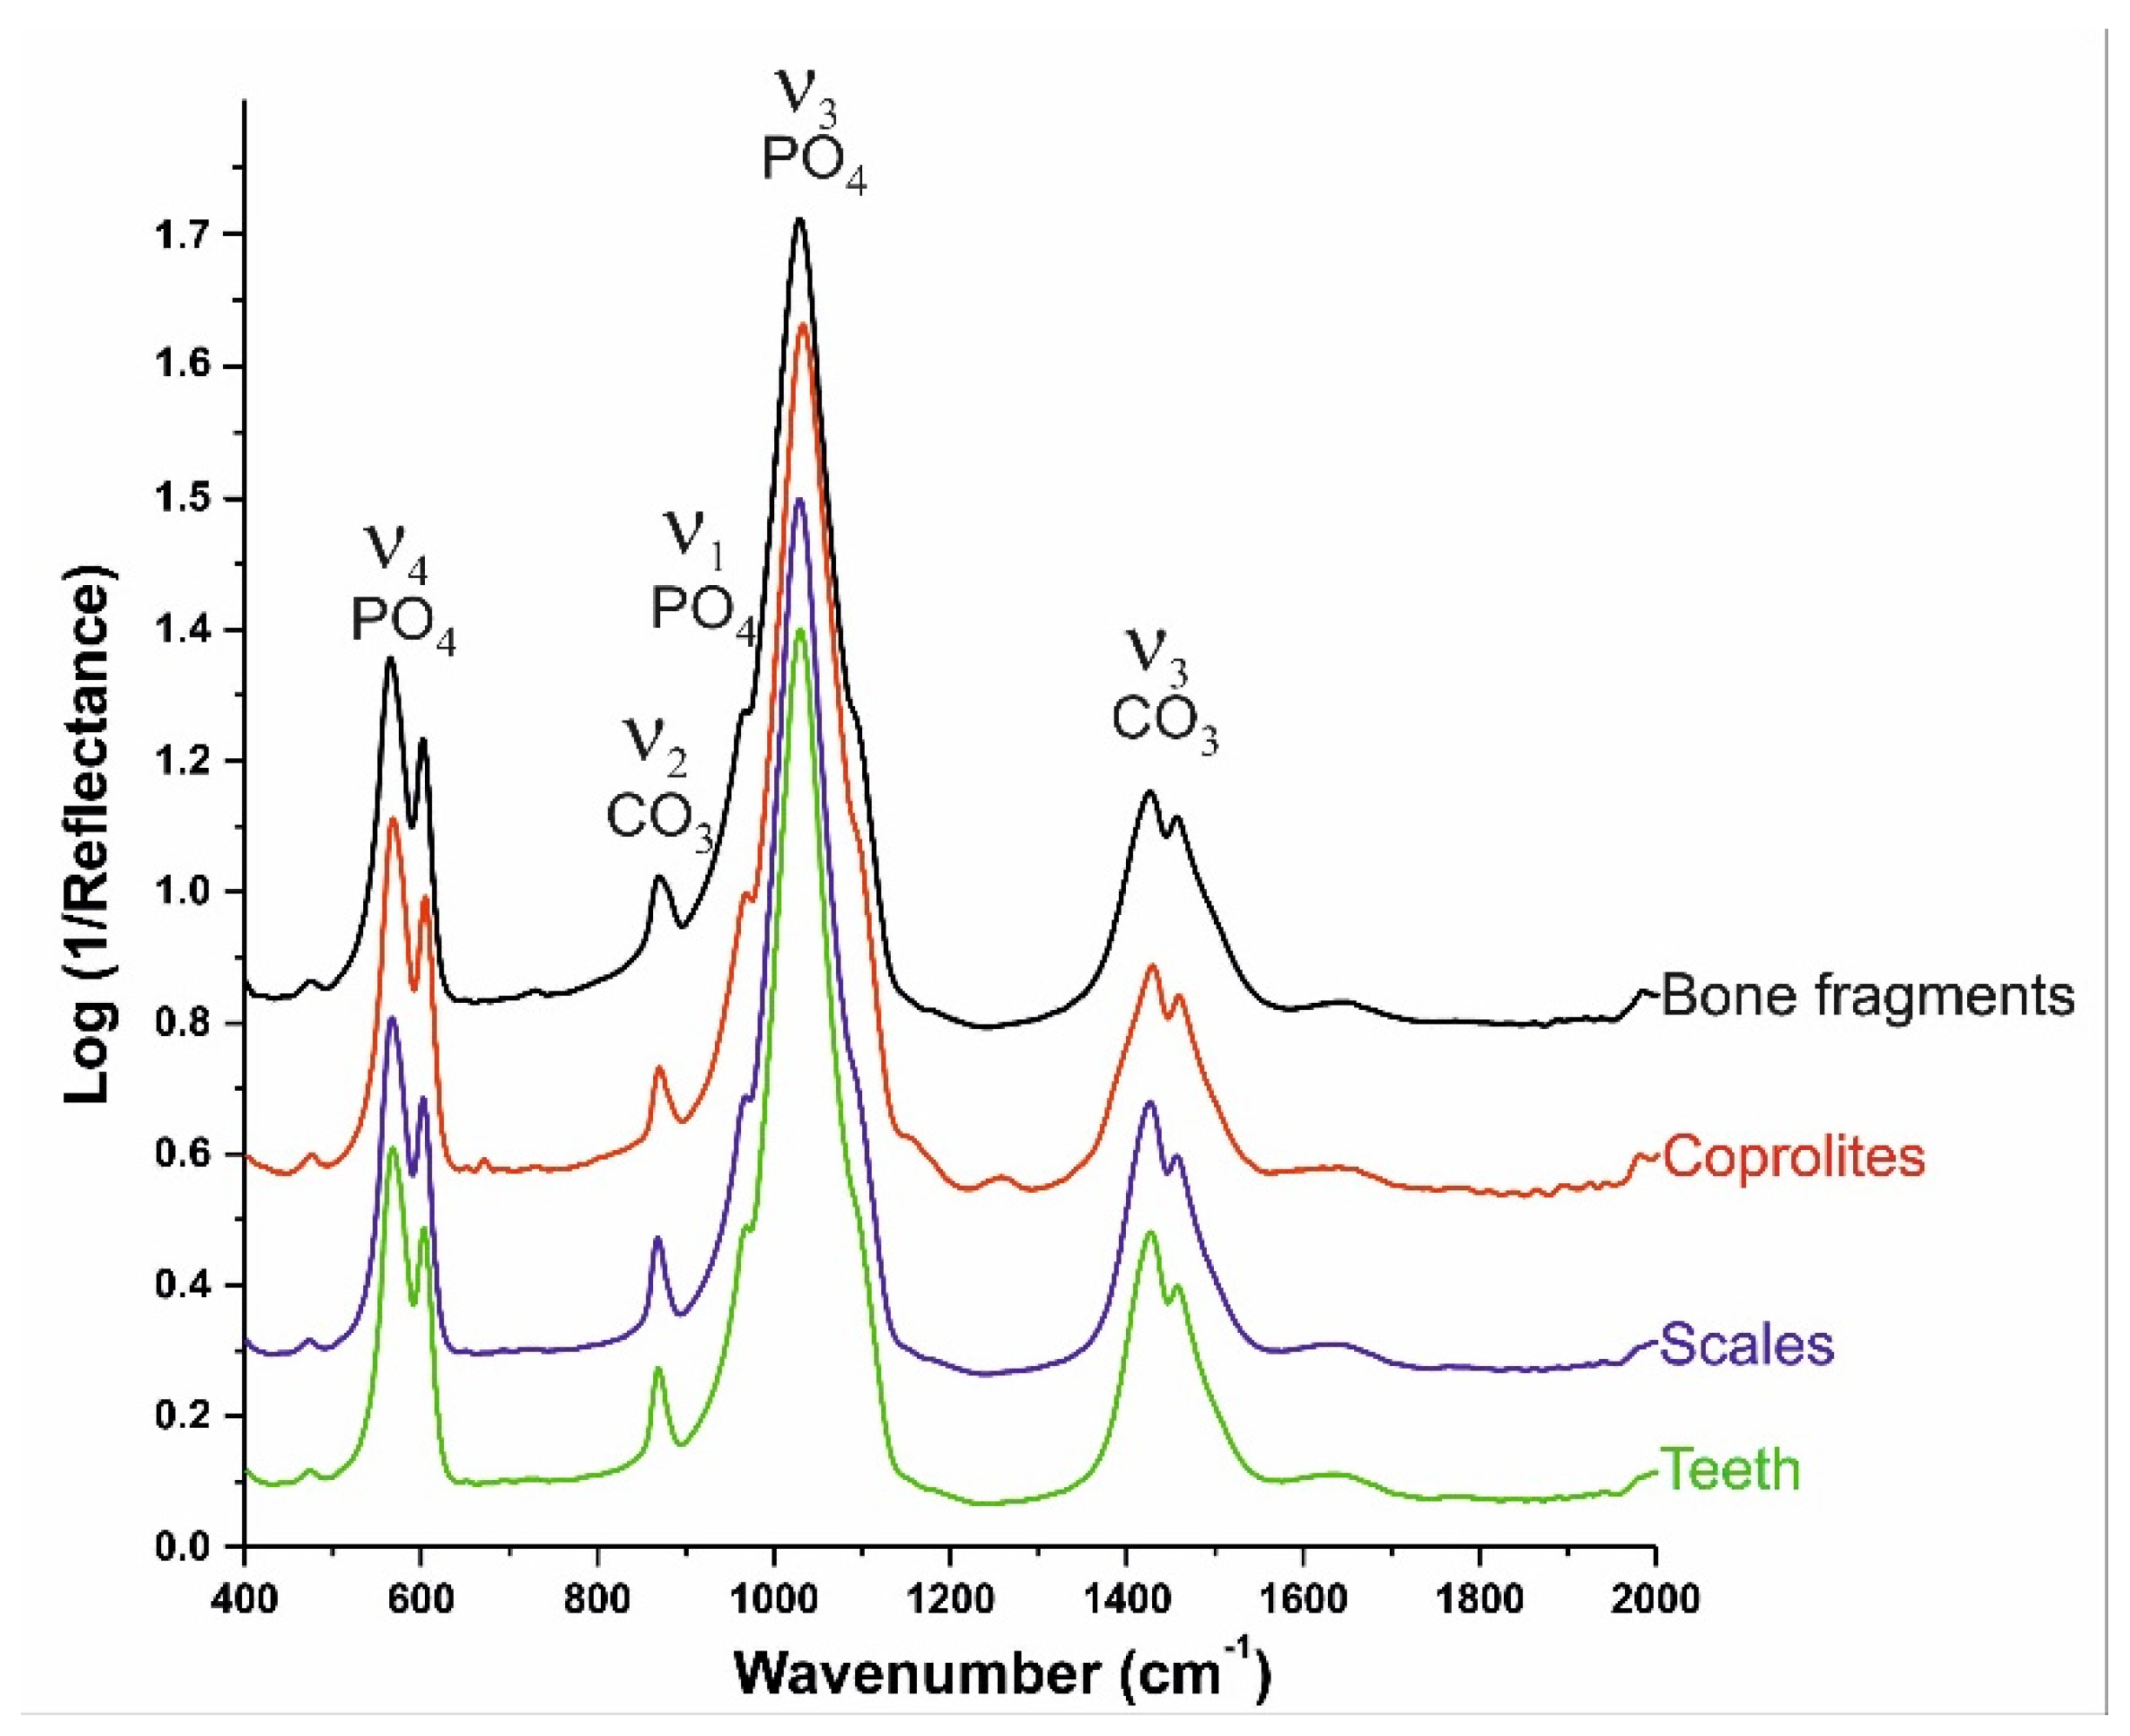
3.3. Infrared Spectroscopy (IR)
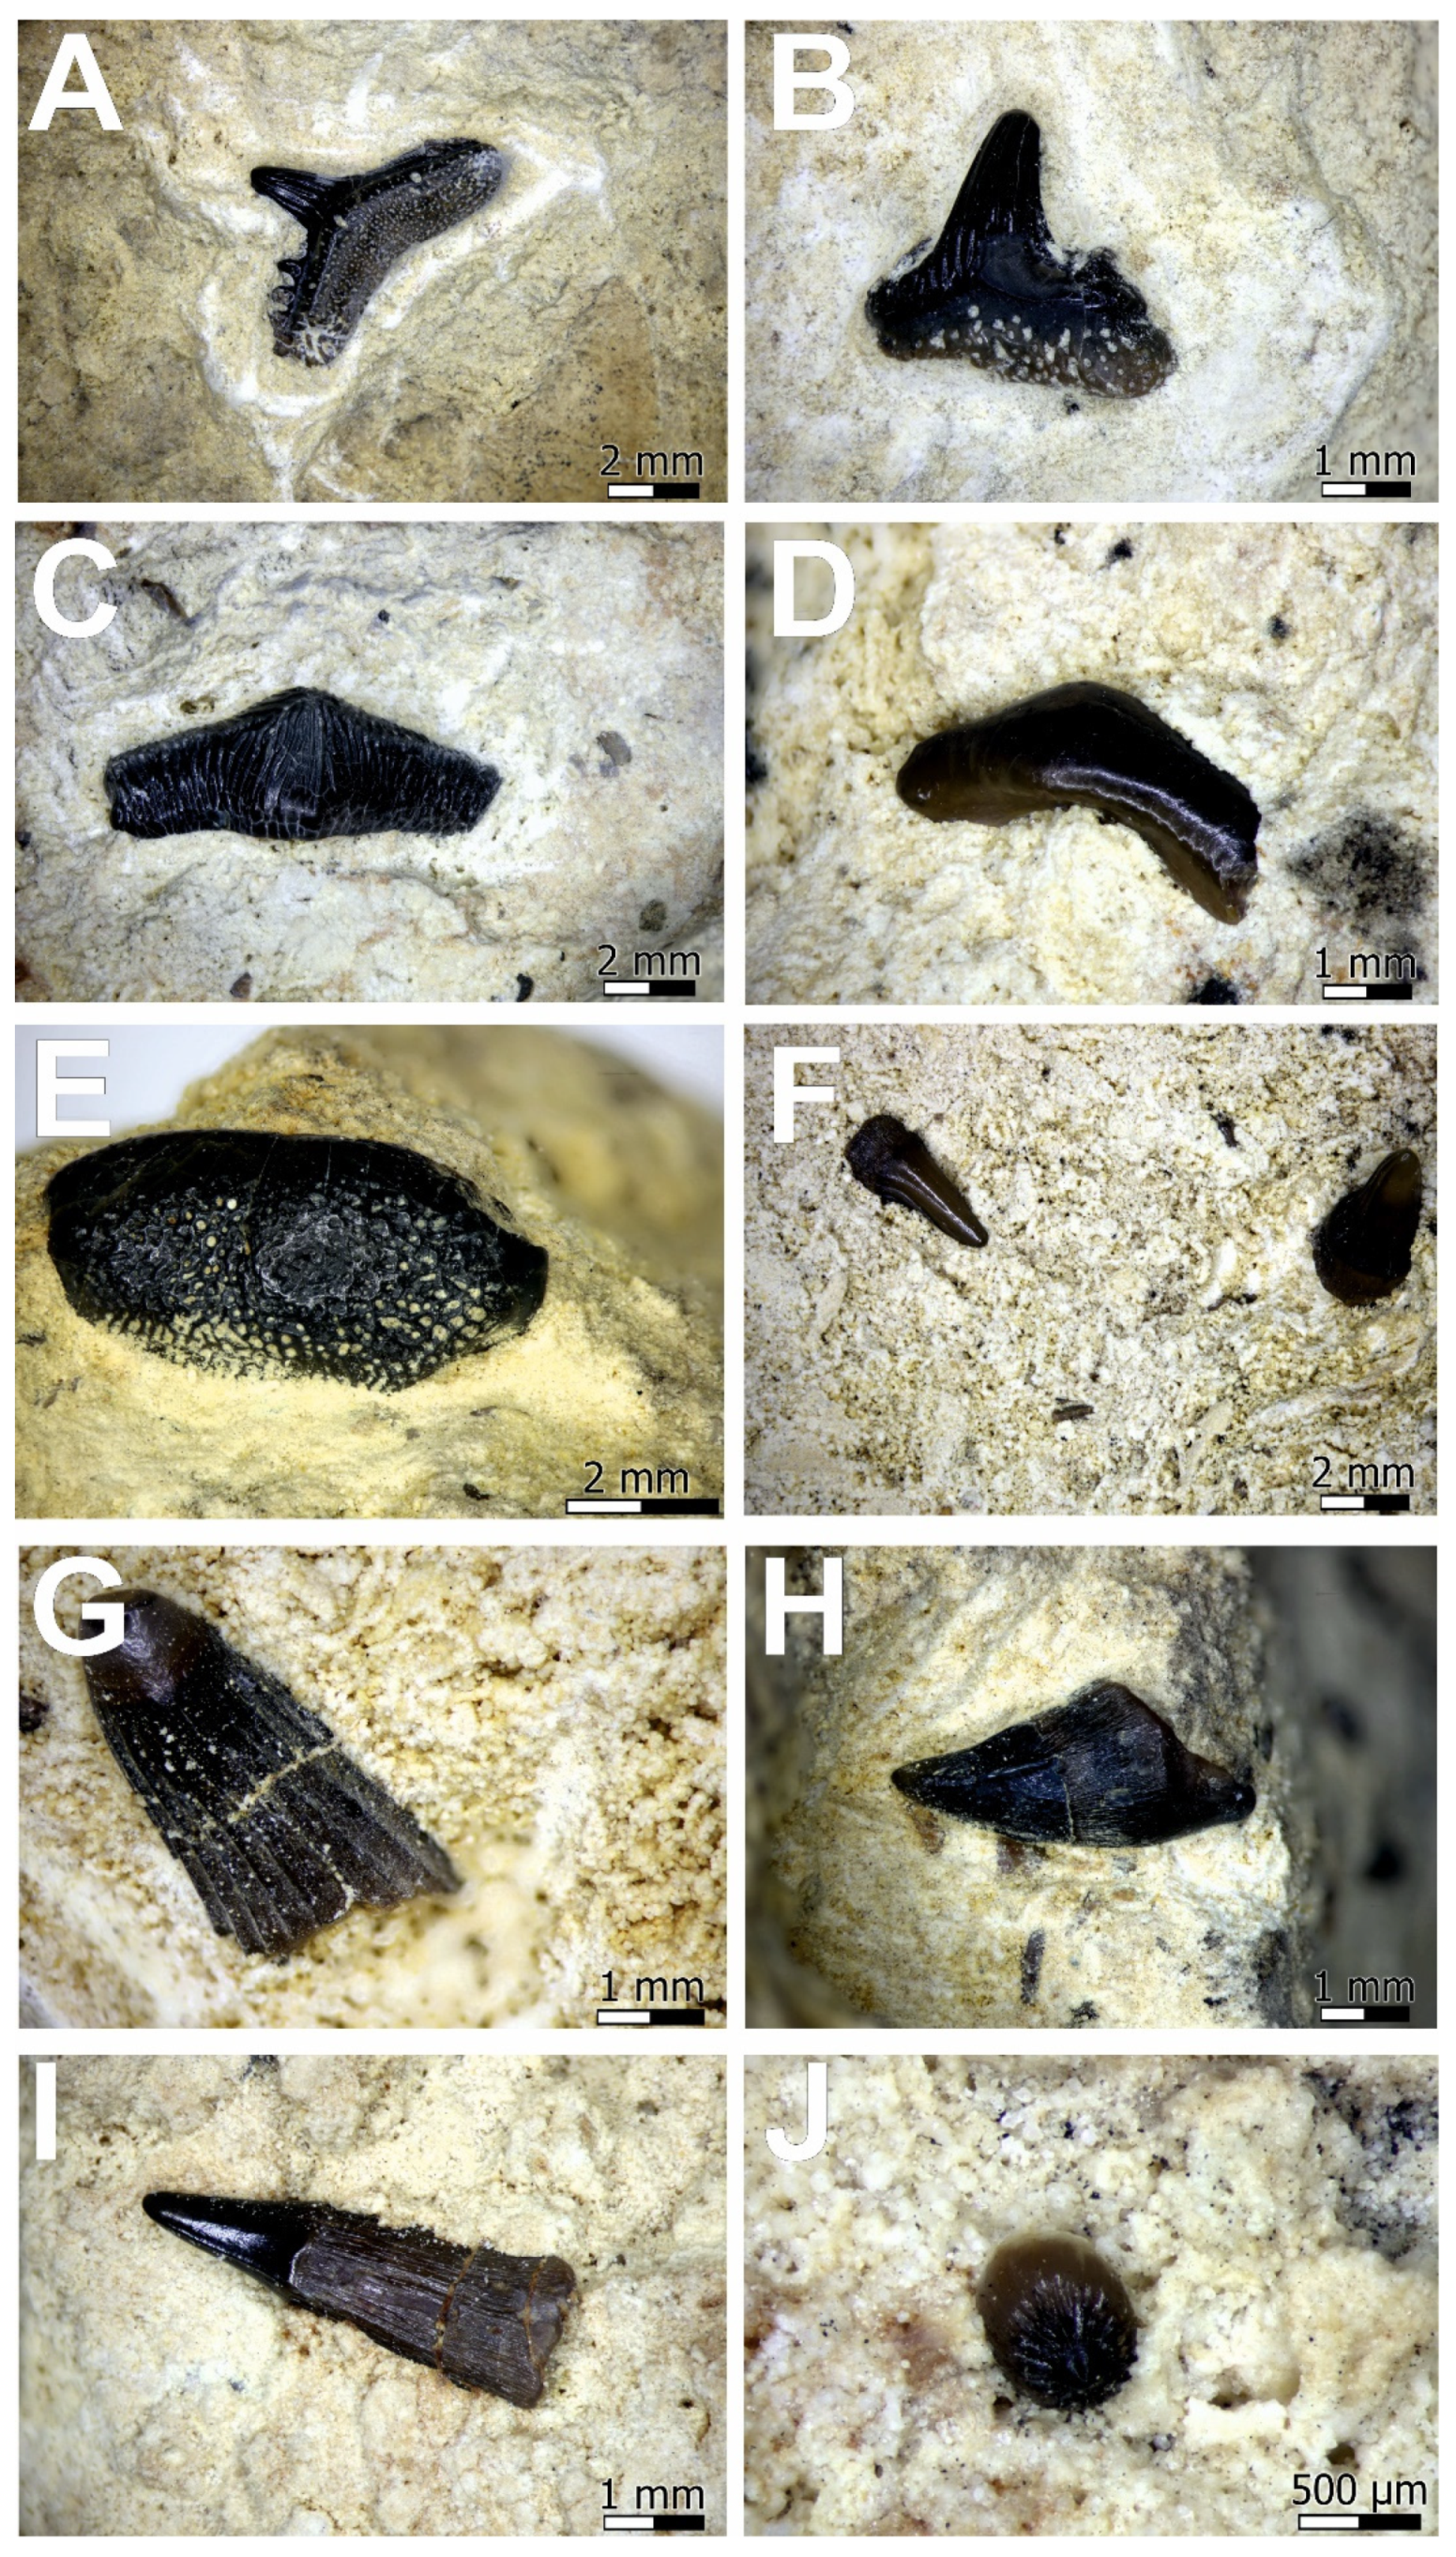
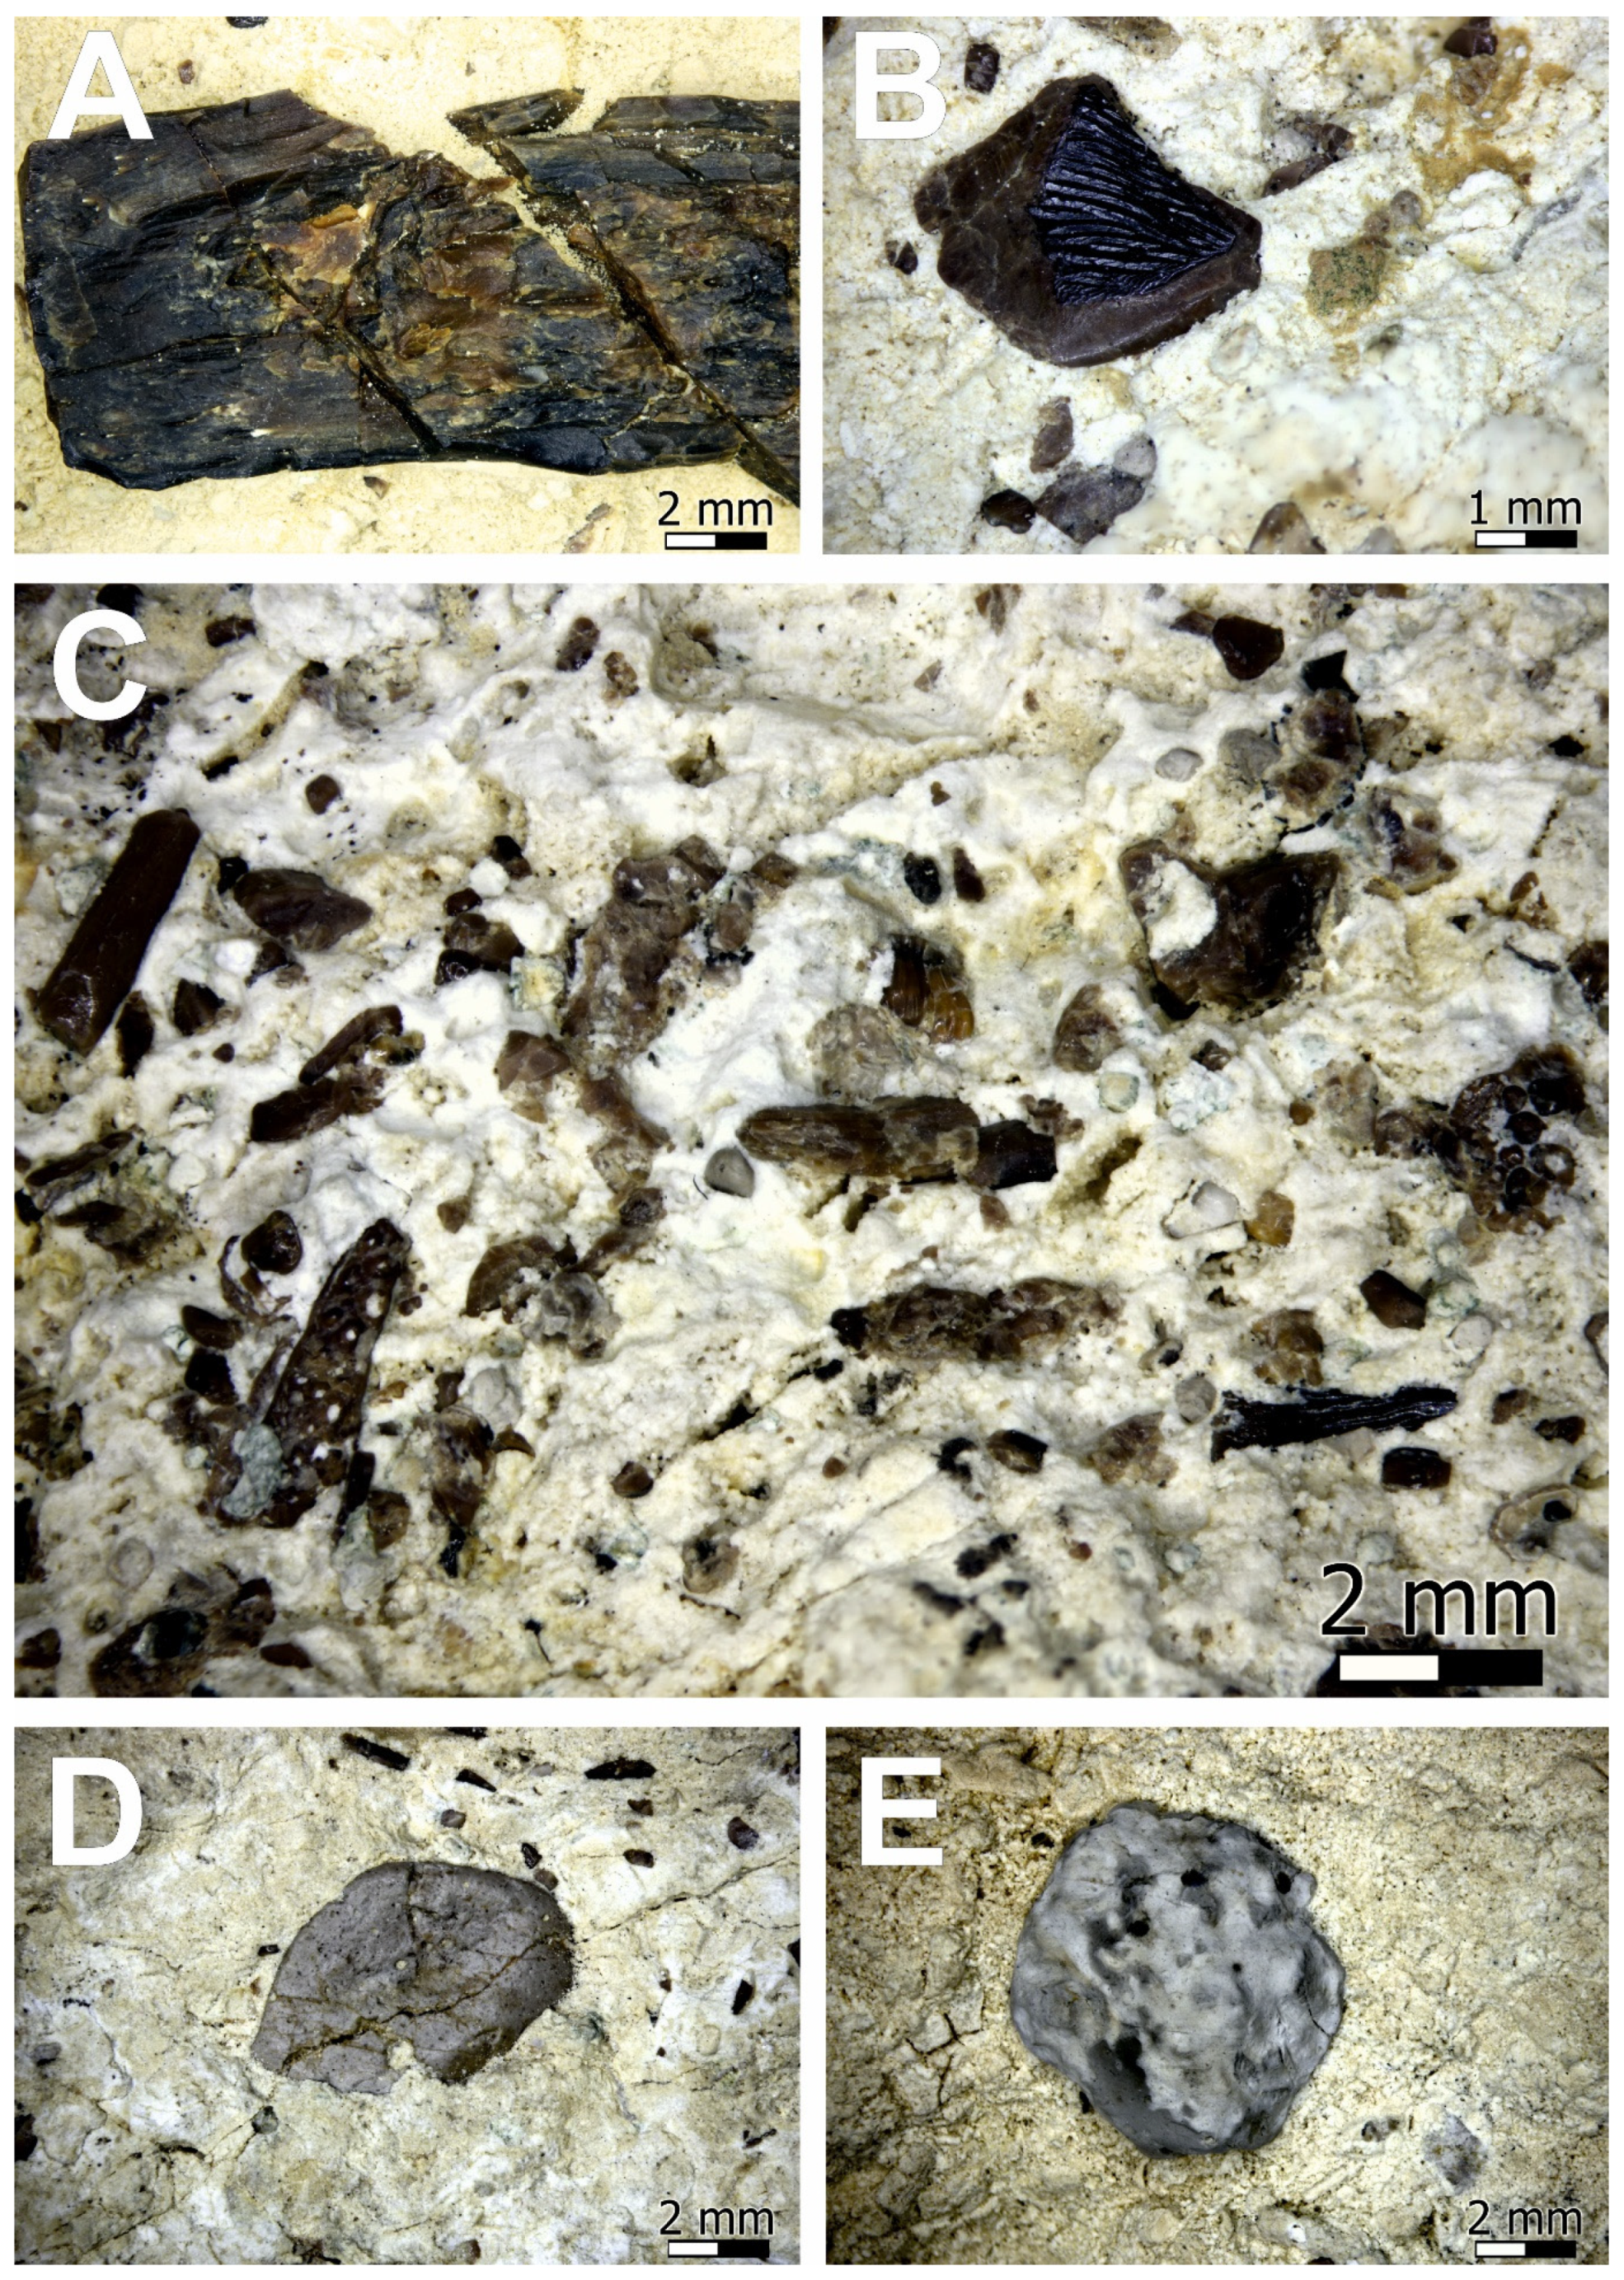
Measurements were made using an Agilent Cary 640 FTIR instrument (Agilent Technologies, Inc., Santa Clara, CA, USA) equipped with a standard excitation source and a DTGS detector with a Peltier cooling system at the Institute of Earth Sciences, the University of Silesia in Katowice, Poland. Measurements were made in reflection mode using a crystal for attenuated total reflectance (ATR). The spectra were collected during 16 summed scans, with a resolution of 4 cm−1, in the spectral range of 4000–400 cm−1.

4. Results

The quantitative phase composition of the tested samples analysed by means of XRD, obtained from the Rietveld method, is as follows: coprolite—98% apatite and 2% dolomite; scales—97% apatite and 3% dolomite; teeth—94% apatite, 5% dolomite and 1% calcite; long bones—89% apatite, 9% dolomite, 1% quartz, 0.5–1% calcite, there were also traces of kaolinite. For the apatite present in the samples, the best match (highest score index) was obtained for the reference material described by Perdikatsis [30] collected under no. 98-007-1854 (ICSD version from 2015). A comparison of the X-ray diffraction patterns of all samples is presented in Figure 5. The calculated structural parameters of apatite and the statistical parameters of the Rietveld refinement are presented in Table 1.
The most significant changes were observed for the unit cell parameter, which varies in the range from 9.3287(4) Å for coprolites, to 9.3604(5) Å for teeth samples. The unit cell parameter c changes only slightly, in the range from 6.8897(3) Å for scales to 6.8950(2) Å for coprolites. The amount of carbonate ions in the apatite structure calculated from the diffraction line positions 004 and 410, is as follows: coprolite—7.48 %, scales—2.77 %, teeth—2.46%, and long bones—5.07%. The average size of the apatite crystallites in the samples are: coprolite—30 nm, scales—24 nm, teeth—26 nm, and long bones—28 nm.
Thin section observations reveal the presence of numerous phosphate clasts inside the rock sample. The investigated phosphate remnants are generally sharp-shaped and differ in size. The most elongated fragments are up to 0.5 mm long and are characterized by the elongation ratio up 10:1. All found fragments can be classified as hydroxyl-apatite with 0.46–0.86 wt% of H2O [~0.7 atoms per 2 (OH, F, Cl)]. Substitution of carbon in P site as a CO32− was also confirmed by XRD (Table 1).
Most of the fragments are partially zoned, and are easily distinguishable in BSE images. Based on chemical composition and BSE images, up to three main regions (Figure 6) may be found in a single phosphate clast. The most external part (I), that is the lightest part in BSE images (Figure 6A,E), is where P2O5 and CaO contents rarely exceed 32 and 53 wt%, respectively (Table 2). The average P2O5/CaO ratio in this zone is 0.67, SrO ranges from 0.12 to 0.26 wt% with an average of 0.18 wt% (Table 2). The next, intermediate zone (II), is light grey in BSE images and seems to be slightly porous (Figure 6, e.g., B, C, middle zone on E). In this part, a decrease in calcium and phosphorus contents are noted (Table 2), ans P2O5/CaO ratio values are in a very narrow range of 0.69–0.71 (Table 2). In this part, SrO contents reach up to 0.2 wt% (average 0.12 wt%) (Table 2). The internal zone (III) is the most porous and darker than the previous zone (Figure 6E—core part). The analysed internal part shows that the content of P2O5 and CaO decreased to 27.98–32.38 wt% and 39.11–41.86 wt%, respectively (Table 2). Decreasing of P, Ca, Sr is visible, starting from the most external do the central part of some phosphate remnants in the studied material (Figure 6E, Table 2).
The phosphate clasts are generally porous inside, in the darker part observed in BSE. The phosphate remnants are mostly well chemically preserved (absence of non-formula elements such Al, Si or Fe), but analytical totals, in many cases vary mostly below 100%, This situation is caused by porosity of the investigated material. The porosity increases into the central part of some zoned phosphate remnants.

5. Discussion

Numerous isolated teeth, scales, bones of fish, and probably reptiles, belonging to the Boruszowice Beds (Upper Muschelkalk) south from Kalety, are characterized by an excellent state of preservation (Figure 3 and Figure 4). All listed remains within the dolomites and dolomitic conglomerates are preserved in the form of hydroxylapatite with an F admixture in the structure.
Apatite as a member of the apatite super-group is a common accessory mineral, especially in igneous and metamorphic rocks of different chemistry and provenance. Biological apatite in living organisms, such as teeth and bones, has a much less ordered structure. In biomaterials such as hard tissues of vertebrates, apatite may coexist with organic compounds such as collagen or proteins. Proportions and types of organic and inorganic (mineral) components vary widely between different tissues.
After death, the organic matrix of bone decomposes, and the mineral component either breaks down or recrystallizes. Recrystallization involves the addition of new apatite, most likely nucleating on to biogenic apatite crystals [30].
The most important factor is the change of apatite composition during deposition and subsequent diagenesis is geological time. The trend of decreasing of OH amounts and increasing of F amounts in the apatite lattice for most phosphatic fossils has been suggested by Kohn et al. [31]. Mcclellan and Kauwenbergh [32] have shown a systematic decrease in the CO32− contents and an increase in unit cell a-values (i.e., decarbonization of apatite) with increasing geological time. LeGeros, and Suga [33] also indicate that the fluoride incorporation results in a greater crystallite size, reduction in carbonate content, and systematic decrease in the a-axis lattice parameter. Moreover, the IR spectra of the four prepared samples (i.e., bone, teeth, scales and coprolites) confirm that all apatitic fossils are carbonate apatites. Characteristic carbonate vibration bands corresponding to the ν2(CO3) and ν3(CO3) can be shown around 850–900 and 1300–1550 cm−1, respectively. No bands were recorded either from dolomite, calcite or quartz. On the other hand, beyond the carbonate apatite bands, the reflection effect is visible in the ranges of 1200–1300 cm−1 and 1555–1720 cm−1, which is evidence of organic matter inclusions. The IR spectra are shown on Figure 7.
After the comparison of the XRD analysis and the unit-cell parameters, it was observed that apatite building in Triassic fossil remains is structurally different from the apatite found in modern fish. For the tested samples, it was shown that the unit-cell a-values decreased, while the value of the c parameter increased (Figure 8). The obtained unit cell values are similar to the bone fragments of Permian parareptile D. vjatkensis from the Kotelnich vertebrate fossil site [34]. A similar trend in the variability of a and c unit-cell parameters is shown by Devonian Glyptolepis sp., Devonian Sarcopterygii gen et sp., and Tertiary shark teeth [35,36]. However, it can be seen that the phosphate tissues of modern fish, including sharks, show much lower values of the parameter c, with a higher value of parameter a.
Dental enamel is almost entirely inorganic with >96% by weight inorganic component and <1% organic material and lack of porosity. Dentine has about a 75% mineral component and organic collagen of >17%. Bone, including pulp cavities, contains 65 to 70% of a mineral component and ~25% of an organic component. Porosity increases from 1% to 40% from enamel to dentine to bone (and pulp cavities) [37,38,39] and provides the pore space for diagenetic change.
An excellent example of the triple compositional structure is a vertebrate toot, which consists of three basic regions: enamel, dentine as well as pulp cavity. In all three parts, the main compound is apatite, mostly represented by hydroxylapatite. Enamel is the most external part, which is the most protective and hard layer. Usually it is built by enamelin (protein) and calcium phosphate (apatite) crystals. These two components are arranged in prisms perpendicular to the next element of the tooth-dentine. The dentine makes up the bulk of the tooth, which is represented by a matrix of collagen and hydroxyl-apatite crystals. The core of the tooth is a pulp cavity. This part contains only blood vessels and nerves that feed and innervate the tooth. Thus, the replacement of organic elements in the pulp cavity and dentine lead to the formation of pores. Their size and distribution differ in dentine and pulp cavity.
Formation of dentin and enamel tooth has been noted in conodonts. Analysis of the chemical composition of the reptile and mammal teeth show differences between the dentin and enamel, the dentine in both mammalian and reptilian teeth is enriched in Mg and S, and depleted of P, Ca, Cl, as well as Na. Moreover, there has not been shown a clear impact of diagenetic processes after the death of the animal, which is responsible for changes in the chemical composition of the dentin and enamel.

6. Summary and Conclusions

In our study, enamel is comparable to the crystalline hydroxylapatite and reveals an increscent in BaO + SrO (Figure 9A). The OH content (calculated manually) is also the highest from all three measured parts. This part does not show any pores on the micron scale and may be also correlated with the most external part of a bone. Moreover, CaO wt% content is the lowest, and in the most strong and weak crystalline part of the bones, while the medium crystalline ones are depleted in calcium content (Figure 9B).
The second part is characterized by lower content of Ba + Sr than the previous layer; Mg content is the highest in all studied cases (up to 0.12 wt% MgO), OH group substitution is slight.
Relatively good preservation of the remains in the examined bone bed is related to the quick burial of the redeposited remains and covering them with a layer of grey clay. During the early diagenesis, the decomposition of organic matter could lead to the formation of dysoxic conditions and the recrystallization of apatite. Although this area was later affected by the infiltration of hydrothermal waters, leading to the formation of Zn-Pb deposits and the dolomitization of limestone layers, it did not have a negative impact on the preservation of external and histological features.
XRD data collected from different studies on modern and fossil bones show a negative trend on the diagram based on the lattice parameter (Figure 8). The trend between the “a” and “c” lattice parameters indicates that old apatitic fossils are characterised by the high “c” lattice parameters, that is, in the range 6.885–6.895 Å. In contrast, the relatively young fossils (Paleogene-Neogene) or modern bones have higher “a” lattice parameters (from 9.355 to 9.450 Å). Doubtless, this situation is connected with the maturity of the rock and its fossils. Older bioapatite is less porous and more crystalline than the same, but modern analogues. The studied samples from the Upper Muschelkalk plot in the uppermost part of Figure 9. They are a Triassic, but the hydrothermal overprint connected with dolomitisation and Pb-Zn ore formation was responsible for partial recrystallisation of the bioapatite. The pore reduction and organic matter incorporation to the phosphate structure could occur simultaneously.
W present, a geochemical overview of the fossils from a newly discovered Upper Muschelkalk bone bed from the Upper Silesia, Poland, which contain numerous teeth and bone fragments from over 30 different vertebrate species. The geochemistry of apatite, from deposition to digenesis, shows its role during identification of the formation process and potentially younger changes (e.g., a hydrothermal overprint). We propose using X-ray diffraction data, particularly cell parameters “a” and “c”, to determine the degree of crystallinity and/or diagenesis. Moreover, the use of Sr, Ba, Ca, Mg, F, OH diagrams can be helpful for the identification of the fossil type, especially if the bones are small and incomplete.

Author Contributions

Conceptualization, T.K. and K.S. (Krzysztof Szopa); methodology, T.K.; formal analysis, K.S. (Krzysztof Setkiewicz) and M.C.; investigation, all authors.; writing—original draft preparation, all authors; writing—review and editing, all authors; visualization, T.K., K.S. (Krzysztof Szopa) and K.S. (Krzysztof Setkiewicz); field work, T.K. and R.N. All authors have read and agreed to the published version of the manuscript.

Funding

Open access for this publication was paid through funds from internal founding, at INoZ, WNP, UŚ, Poland.

Data Availability Statement

Not applicable.

Acknowledgments

Many thanks to Stanisław Kocot, Sławomir Kocot, and Przemysław Kocot for their help in fieldwork and for donating numerous specimens for research. W. Błaszczyk from the State Forests, Świerklaniec Forest District, for the geological fieldwork permission in the studied area. The authors thank Ashley Gumsley for his help in improving the English of the manuscript. Mateusz Dulski is thanked for the IR analyses. The manuscript benefited from the comments of two anonymous reviewers. Authors are very grateful for their work.

Conflicts of Interest

The authors declare no conflict of interest.

References

  1. Akkus, O.; Adar, F.; Schaffler, M.B. Age-related changes in physiochemical properties of mineral crystals are related to impaired mechanical function of cortical bone. Bone 2004, 34, 443–453. [Google Scholar] [CrossRef] [PubMed]
  2. Green, J.; Kleeman, C.R. Role of bone in regulation of systemic acid-base balance. Kidney Int. 1991, 39, 9–26. [Google Scholar] [CrossRef] [PubMed] [Green Version]
  3. Keenan, S.W. From bone to fossil: A review of the diagenesis of bioapatite. Am. Min. 2016, 101, 1943–1951. [Google Scholar] [CrossRef]
  4. Szrek, P.; Niedźwiedzki, G.; Dec, M. Storm origin of bone-bearing beds in the Lower Devonian placoderm sand stone from Podłazie Hill (Holy Cross Mountains, central Poland). Geol. Quat. 2014, 58, 795–806. [Google Scholar]
  5. Sander, P.M. Early permian depositional environments and pond bonebeds in central archer County, Texas. Palaeogeogr. Palaeoclimatol. Palaeoecol. 1989, 69, 1–21. [Google Scholar] [CrossRef]
  6. Suarez, C.A.; Morschhauser, E.M.; Suarez, M.B.; You, H.; Li, D.; Dodson, P. Rare earth element geochemistry of bone beds from the Lower Cretaceous Zhonggou Formation of Gansu Province, China. J. Vertebr. Paleontol. 2018, 38, 22–35. [Google Scholar] [CrossRef]
  7. Catlos, E.J.; Mark, D.F.; Suarez, S.; Brookfield, M.E.; Miller, C.G.; Schmitt, A.K.; Gallagher, V.; Kelly, A. Late Silurian zircon U–Pb ages from the Ludlow and Downtonbone beds, Welsh Basin, UK. J. Geol. Soc. London 2021, 178, jgs2020-107. [Google Scholar] [CrossRef]
  8. Niedźwiedzki, R.; Krzykawski, T.; Salamon, M. New position of “bone beds” from the Upper Silesian Triassic, preliminary results. In Proceedings of the Śląskie Dinozaury (nie tylko) z Krasiejowa, Kraków, Poland, 9 December 2015. [Google Scholar]
  9. Chrząstek, A.; Niedźwiedzki, R. Kręgowce retu i dolnego wapienia muszlowego na Śląsku. Pr. Geol. Mineral. U. Wr. 1998, 64, 69–81. [Google Scholar]
  10. Liszkowski, J. A bone bed from the “Wallen-Beds” of the lower Muschelkalk (Lowermost Anisian) at Wolica near Kielce (Holly Cross Mountains). Prz. Geol. 1973, 21, 644–648. [Google Scholar]
  11. Sulej, T.; Niedźwiedzki, G.; Niedźwiedzki, R.; Surmik, D.; Stachacz, M. New vertebrate assemblage from the marginal-marine and land Lower Keuper strata (Ladinian, Middle Triassic) of Miedary, Silesia, SW Poland. Prz. Geol. 2011, 59, 426–430. [Google Scholar]
  12. Pawlak, W.; Rozwalak, P.; Sulej, T. Triassic fish faunas from Miedary (Upper Silesia, Poland) and their implications for understanding paleosalinity. Palaeogeogr. Palaeoclimatol. Palaeoecol. 2022, 590, 110–860. [Google Scholar] [CrossRef]
  13. Kotlicki, S. Geological Map of Poland without Quaternary Deposits (1:200,000); Polish Geological Institute: Warsw, Poland, 1977. [Google Scholar]
  14. Szulc, J. Middle Triassic evolution of the northern Peri-Tethys area as influenced by early opening of the Tethys Ocean. Ann. Soc. Geol. Pol. 2000, 70, 1–48. [Google Scholar]
  15. Nawrocki, J.; Szulc, J. The Middle Triassic magnetostratigraphy from the Peri- Tethys basin in Poland. Earth Planet. Sci. Lett. 2000, 182, 77–92. [Google Scholar] [CrossRef]
  16. Wyczółkowski, J. Objaśnienia do Szczegółowej Mapy Geologicznej Polski; Arkusz Kalety (M34-50B); Wydawnictwa Geologiczne: Warsaw, Poland, 1968; p. 86. [Google Scholar]
  17. Dadlez, R.; Marek, S.; Pokorski, J. (Eds.) Geological Map of Poland without Cenozoic Deposits (1:1,000,000); Polish Geological Institute: Warsw, Poland, 2000. [Google Scholar]
  18. Roemer, F.; Geologie von Oberschlesien; Eine Erläuterung zu der im Auftrage des Königl. Preuss. In Handels-Ministeriums von dem Verfasser Bearbeiteten Geologischen Karte von Oberschlesien in 12 Sektionen; Nischkowsky: Breslau, Poland, 1870; 587p. [Google Scholar]
  19. Siewniak-Witruk, A. Konodonty wapienia muszlowego rejonu Kalet. Geologia 1978, 243, 119–133. [Google Scholar]
  20. Odrzywolska-Bieńkowa, E. Skamieniałości warstw boruszowickich rejonu Bibiela-Kalety. Przeg. Geol. 1962, 10, 217–218. [Google Scholar]
  21. Senkowiczowa, H. Trias północno-wschodniego obrzeżenia Górnośląskiego Zagłębia Węglowego. Biul. Państwowego Inst. Geol. 1998, 378, 5–66. [Google Scholar]
  22. Assmann, P. Revision der Fauna der Wirbellosen der oberschlesischen Trias. Abh. Königlich Preuss. Geol. Landesanst. 1937, 170, 1–134. [Google Scholar]
  23. Matysik, M.; Surmik, D. Depositional conditions of vertebrate remains within the Lower Muschelkalk (Anisian) peritidal carbonates of the “Stare Gliny” quarry near Olkusz (Kraków-Silesia region, southern Poland). Przeg. Geol. 2016, 64, 495–503. [Google Scholar]
  24. Liszkowski, J. Die Selachierfauna des Muschelkalks in Polen: Zusammensetzung, Stratigraphie und Paläoökologie. In Muschelkalk, Schöntaler Symposium; Hagdom, H., Seilacher, A., Eds.; Goldschneck Verlag: Stuttgart, Germany, 1993; pp. 175–185. [Google Scholar]
  25. Dzik, J.; Sulej, T.; Kaim, A.; Niedźwiedzki, R. Późnotriasowe cmentarzysko kręgowców lądowych w Krasiejowie na Śląsku Opolskim. Przeg. Geol. 2000, 3, 226–235. [Google Scholar]
  26. Dzik, J.; Sulej, T. An early late Triassic long-necked reptile with a bony pectoral shield and gracile appendages. Acta Palaeontol. Pol. 2016, 61, 805–823. [Google Scholar]
  27. Skawiński, T.; Ziegler, M.; Czepiński, Ł.; Szermański, M.; Tałanda, M.; Surmik, D.; Niedźwiedzki, G. A re-evaluation of the historical ‘dinosaur’ remains from the Middle-Upper Triassic of Poland. Hist. Biol. 2017, 29, 442–472. [Google Scholar] [CrossRef]
  28. Degen, T.; Sadki, M.; Bron, E.; König, U.; Nénert, G. The HighScore Suite. Powder Diffr. 2014, 29, S13–S18. [Google Scholar] [CrossRef] [Green Version]
  29. Schuffert, J.D.; Kastner, M.; Emanuele, G.; Jahnke, R.A. Carbonate-ion substitution in francolite: A new equation. Geochim. Cosmochim. Acta 1990, 54, 2323–2328. [Google Scholar] [CrossRef]
  30. Trueman, C.; Tuross, N. Trace Elements in Recent and Fossil Bone Apatite. Rev. Mineral. Geochem. 2002, 48, 489–521. [Google Scholar] [CrossRef]
  31. Kohn, M.J.; Schoeninger, M.J.; Barker, W.W. Altered states: Effects of diagenesis on fossil tooth chemistry. Geochim. Cosmochim. Acta 1999, 63, 2737–2747. [Google Scholar] [CrossRef]
  32. Perdikatsis, B. X-ray powder diffraction study of francolite by the Rietveld method. Mat. Sci. Forum 1991, 79, 809–814. [Google Scholar]
  33. LeGeros, R.Z.; Suga, S. Crystallographic nature of fluoride in enameloids of fish. Calcif. Tissue Int. 1980, 32, 169–174. [Google Scholar] [CrossRef]
  34. Ryanskaya, A.; Kiseleva, D.; Shilovsky, O.; Shagalov, E. XRD study of the Permian fossil bone tissue. Powder Diffr. 2019, 34, S14–S17. [Google Scholar] [CrossRef]
  35. Nemliher, J.G.; Baturin, G.N.; Kallaste, T.E.; Murdmaa, I.O. Transformation of Hydroxyapatite of Bone Phosphate from the Ocean Bottom during Fossilization. Lithol. Miner. Resour. 2004, 39, 468–479. [Google Scholar] [CrossRef]
  36. Kallaste, T.; Nemliher, J. Apatite varieties in extant and fossil vertebrate mineralized tissues. J. Appl. Cryst. 2005, 38, 587–594. [Google Scholar] [CrossRef]
  37. Brudevold, F.; Söremark, R. Chemistry of the mineral phase of enamel. In Structural and Chemical Organization of Teeth; Miles, A.E.W., Ed.; Academic Press: New York, NY, USA, 1967; Volume 2, pp. 247–277. [Google Scholar]
  38. Trautz, O.R. Crystalline Organization of Dental Mineral. In Structural and Chemical Organization of Teeth (I); Miles, A.E.W., Ed.; Academic Press: New York, NY, USA, 1967; pp. 165–200. [Google Scholar]
  39. Rowles, S.L. Chemistry of the mineral phase of dentine. In Structural and Chemical Organization of Teeth; Miles, A.E.W., Ed.; Academic Press: New York, NY, USA, 1967; Volume 2, pp. 201–246. [Google Scholar]
Figure 1. (A)—Geological map without the Cenozoic deposits of central-southern Poland, the research area is marked with an asterisk after [17]; (B)—Geological map of the studied area between Kalety and Tarnowskie Góry, without the Quaternary deposits, after [13]. Dolomite outcrops are marked with an asterisk.
Minerals 12 00469 g001
Figure 2. (A)—Schematic sketch of the study area with drilling points (marked with numbers from 1 to 6), the dashed line marks the area where the sampling was performed; (B)—Geological profiles of sedimentary layers based on drillings, performed during the fieldwork in the year 2014 and 2015.
Minerals 12 00469 g002
Figure 3. An example of Triassic vertebrate teeth from the investigated site. (A)—Hybodus sp. tooth, (B)—Hybodus sp. tooth, (C)—Acrodus sp. tooth, (D)—Lissodus sp. tooth, (E)—Palaeobates sp. tooth, (F)—fish tooth, (G)—fish tooth, (H)—Saurichthys sp. tooth, (I)—Saurichthys sp. tooth, (J)—Colobodus sp. tooth.
Minerals 12 00469 g003
Figure 4. An example of Triassic bones, scales and coprolites from the investigated site. (A)—fragment of fish bone, (B)—fragment of fish scale, (C)—bone bed with fish teeth, scales, fragments of jaws and with coprolites, (D,E)—coprolite.
Minerals 12 00469 g004
Figure 5. XRD patterns of the investigated fossils from the Upper Muschelkalk bone bed from Upper Silesia.
Minerals 12 00469 g005
Figure 6. BSE images of the investigated apatite (Ap) fossils (AC) and their host rock (D). One image represents a complex apatite fossil (E), which can be interpreted as a fragment of a tooth (F). In the host rock, two populations of dolomite are noted—an older (Dol1) and younger (Dol2), overgrowing the first. Occasionally, pyrite (Py) is noted. Dark areas are represented by epoxy (Epx).
Minerals 12 00469 g006
Figure 7. Infrared spectra of the studied samples from Upper Silesia, Poland.
Minerals 12 00469 g007
Figure 8. Relationship between lattice parameter a and lattice parameter c in the apatite unit cell (space group P63/m), resulting from XRD measurements, for B—bones (this study), C—coprolite (this study), S—scales (this study), T—teeth (this study), 1—Permian Pareiasaur rib fragments [34], 2—Permian Pareiasaur rib fragments [34], 3—Tooth of Devonian Glyptolepis sp. [36], 4—Tooth of Devonian Sarcopterygii gen et sp. [36], 5—Oligocene/Miocene shark teeth from Maikop clay [33], 6—Jurassic shark teeth [36], 7—Recent shark teeth [35], 8—Recent Latimeria chalumnae scale [35], 9—Pharyngeal tooth of recent Common bream (Abramis brama) [36].
Minerals 12 00469 g008
Figure 9. Diagram showing relation between (A) F + Cl + H2O vs. SrO + BaO and (B) CaO vs. MgO in the studied material. Selected populations (i.e., light, gray and dark) refer to the intensity in BSE and chemical composition shown on Figure 6.
Minerals 12 00469 g009
Table 1. Apatite lattice parameters and Rietveld fit agreement indices calculated from XRD analysis.
SampleLong BonesCoprolitesScalesTeeth
Lattice parameters
a/Å9.3417 (4)9.3287 (4)9.3546 (5)9.3604 (5)
c/Å6.8923 (3)6.8950 (2)6.8897 (3)6.8920 (3)
alpha/°90909090
beta/°90909090
gamma/°120120120120
V/106 pm3520.895519.643522.133522.958
V ESD/106 pm30.0290.0280.0380.037
Agreement Indices of Rietveld fit
R (expected)/%5.3015.2625.2895.139
R (profile)/%7.5836.6147.4026.496
R (weighted profile)/%10.0828.72310.2488.509
GOF1.9021.6581.9371.656
Table 2. Representative electron microprobe analyses (EMPA) of apatite, and the number of a.p.f.u. calculated on the basis of 12.5 O2− of the investigated sample from the Upper Muschelkalk bone bed from Upper Silesia, Poland.
Compound/Sample
lBSE#1lBSE#2lBSE#3lBSE#4lBSE#5gBSE#1gBSE#2gBSE#3dBSE#1dBSE#2dBSE#3dBSE#3
SO3 (wt%)1.070.960.970.920.680.871.351.121.171.211.361.19
P2O535.4335.1834.8234.5436.5332.3832.0132.3729.0828.6628.1427.98
CO2 *7.548.609.8210.087.6716.6818.2516.9825.5027.5028.7527.32
MgO0.080.060.040.070.120.120.120.110.050.080.070.07
CaO53.0452.5351.5151.6351.6946.4045.2146.1541.8639.8539.1140.72
MnO0.06b.d.l.b.d.l.0.040.060.04b.d.l.0.10b.d.l.0.070.04b.d.l.
FeO0.310.230.250.280.440.600.340.550.320.600.290.45
SrO0.150.170.120.120.260.200.120.18b.d.l.b.d.l.b.d.l.b.d.l.
BaO0.04b.d.l.0.060.090.020.100.13b.d.l.0.04b.d.l.0.06b.d.l.
Na2O0.420.420.620.420.680.760.650.700.330.470.500.55
H2O *0.640.710.720.600.860.750.630.600.560.540.460.50
F1.171.071.031.180.890.811.001.080.830.710.850.80
Cl0.050.050.060.050.100.300.210.200.250.320.360.39
F−0.85−0.78−0.75−0.86−0.65−0.66−0.57−0.60−0.59−0.64−0.62−0.58
Cl−0.01−0.01−0.02−0.01−0.03−0.07−0.09−0.11−0.13−0.14−0.11−0.11
TOTAL92.4691.4090.1889.9292.3383.3281.7583.0274.5072.5071.2572.68
S(apfu)0.140.130.130.120.680.130.200.130.190.200.230.20
P5.225.245.265.235.245.295.285.295.275.335.315.22
C0.780.760.740.770.760.710.720.710.730.670.690.78
Mg0.020.020.010.020.120.030.030.030.020.020.020.02
Ca9.899.909.849.9051.699.599.449.599.609.379.339.61
Mn 0.06
Fe0.050.030.040.040.440.100.060.100.060.110.050.08
Sr0.010.010.010.010.260.010.010.01
Ba 0.02
Na0.070.070.110.070.680.140.120.140.070.100.110.12
OH0.750.830.860.710.860.960.820.960.800.790.690.74
F0.650.600.580.670.890.490.610.490.560.490.600.56
Cl0.010.010.020.010.100.100.070.100.090.120.140.15
SrO + BaO0.180.170.180.200.280.300.250.180.040.000.060.00
F + Cl + H2O1.871.831.811.821.861.861.831.881.641.571.671.70
lBSE—light in BSE; gBSE—gray in BSE; dBSE—dark in BSE; b.d.l.—below detection limit; CO2 * and H2O *—calculated based on the full site occupancy.
Publisher’s Note: MDPI stays neutral with regard to jurisdictional claims in published maps and institutional affiliations.

