Article

Random Forest Slurry Pressure Loss Model Based on Loop Experiment

1
Backfilling Engineering Laboratory of Shandong Gold Group Co., Ltd., Laizhou 261441, China
2
School of Civil and Resource Engineering, University of Science and Technology Beijing, Beijing 100083, China
3
Qingdao Institute of Bioenergy and Bioprocess Technology, Chinese Academy of Sciences, Qingdao 266101, China
*
Authors to whom correspondence should be addressed.
Minerals 2022, 12(4), 447; https://doi.org/10.3390/min12040447
Submission received: 18 February 2022 / Revised: 22 March 2022 / Accepted: 31 March 2022 / Published: 6 April 2022
(This article belongs to the Topic Mining Safety and Sustainability)

Abstract

:
A reasonable arrangement of filling pipelines can solve the problems of low line magnification, a high flow rate, large pipe pressure, etc., in deep well filling slurry transportation. The transportation pressure loss value of filling slurry is the main parameter for the layout design of filling pipelines. At present, pressure loss data are mainly obtained through the loop pipe experiment, which has problems such as a large amount of labor, high cost, low efficiency, and a limited amount of experimental data. In this paper, combined with a new generation of artificial intelligence technology, the random forest machine learning algorithm is used to analyze and model the experimental data of a loop pipe to predict the pressure loss of slurry transportation. The degree of precision reaches 0.9747, which meets the design accuracy requirements, and it can replace the loop pipe experiment to assist with the filling design.

1. Introduction

The filling mining method is one of the most effective methods to ensure the safety of deep mining [1,2]. In the design of a deep well filling system, designing a reasonable arrangement of the underground filling pipeline is the main difficulty. The properties of tailings, the transportation conditions, and the pressure loss value of slurry transportation are different in different mines. At present, the theoretical calculation of the pressure loss of a high-concentration filling slurry is generally based on the Bingham rheological model, but there is a certain difference between the pressure loss value obtained when using slurry yield stress and plastic viscosity and the experimental value of the loop [3]. The main reasons for this are that the cross-sectional flow velocity is different during the transportation of high-concentration filling slurry, the flow velocity near the pipe wall is close to zero, the shear stress decreases with the increase in the shear rate, It is thixotropic and the flow curve is hysteretic [4,5]. For this reason, most designers need to master the pressure loss data of filling slurry while using the loop pipe experiment method. However, there are problems such as a large amount of labor and a long experimental period, and experimental variable parameters cannot fully simulate industrial filling pipelines.
In the filling and conveying theory, it is difficult to establish a transport model that can be used to calculate the pressure drop of the slurry by theoretical methods. With the development of artificial intelligence technology, methods to build predictive models based on existing data have gradually emerged. Abroad, Kumar et al. used the integral flow model to predict the pressure drop of multi-scale solid–liquid flow [4], but there is a problem in that the reverse analysis of the input limit parameters of numerical modeling and the generalization ability of curve fitting are poor. In China, Qi Chongchong of Central South University and others took the lead in proposing a “machine learning-assisted filling design” [6,7], And a variety of backfill system design prediction models have been established to promote the development of the traditional backfill field towards intelligence.
In this paper, the artificial intelligence random forest algorithm is used to analyze the experimental data of a loop pipe, establish the pressure loss prediction model of the filling slurry, and verify the feasibility of the proposed random forest model in the pressure loss prediction. This model can replace the traditional loop pipe experiment-aided filling piping system design.

2. Acquisition of Experimental Data of Loop Pipe

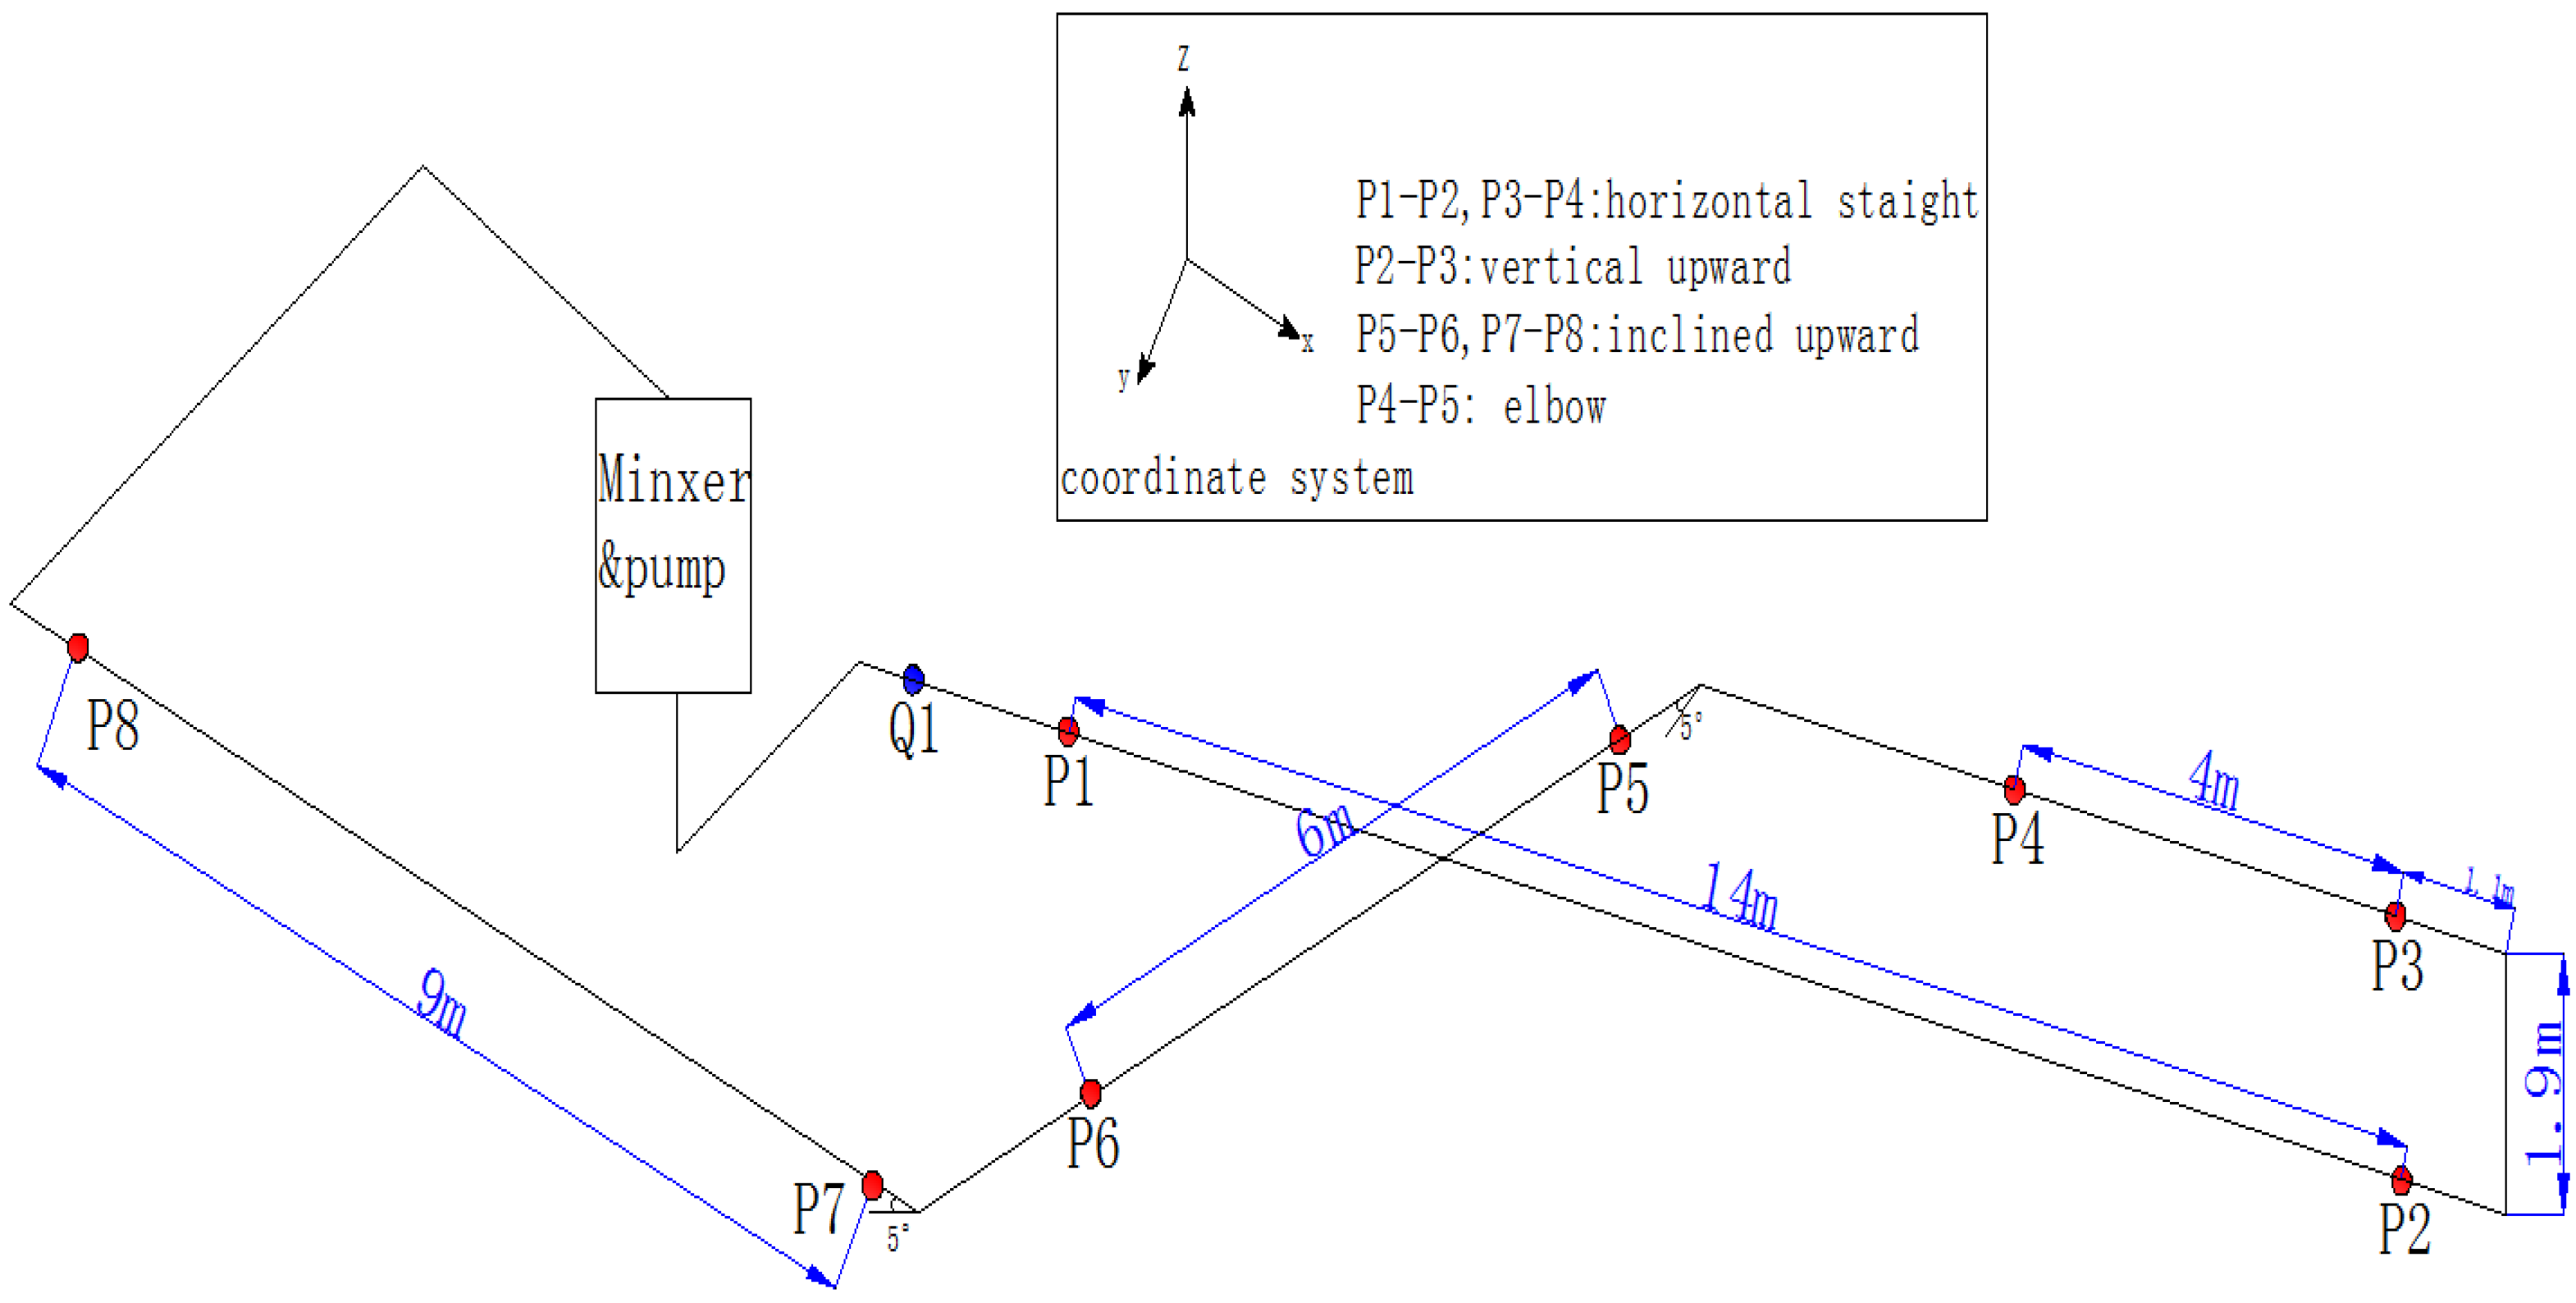
2.1. Construction of Loop Pipe Experiment System

The backfill engineering laboratory has an indoor loop test system. The test pipeline system is shown in Figure 1. P1–P2 is the pressure drop of the straight pipe section, P3–P4 is the pressure drop of the vertical section plus 90° elbow, and P5–P6 is the pipeline pressure drop of the inclined pipe section.
The displacement of the loop pipe experiment system was 76 m3/h, the outlet pressure was 1.5 Mpa, the inner diameter of the test pipe was 80 mm, and the pressure sensor adopted a flat model pressure transmitter with a range of 0–2 Mpa and an accuracy of ±0.25%. Pressure data were displayed and recorded using Wincc host computer software [8,9].

2.2. Relevant Parameter Experimental Data Acquisition

This loop pipe experiment was carried out with the tailings of Sanshandao Gold Mine; the mixing water was tap water, and the cementing material was the cementing material in use in the mine.
The particle size distribution of tailings was measured by a Malvern laser particle sizer, as shown in Table 1. When using XRD phase test analyzer, it was found that the main components of tailings were quartz and mica, non-toxic minerals, insoluble in water. The fluidity of the tailings backfill slurry and the strength of the backfill had little effect. The content of cementitious material + 80 microns was 9.5%, the initial setting time was 45 min, the final setting time was 8 h, and the specific surface area was 750 m2/kg; thus, the material met the GB175-2007 “General Portland Cement” standard and could be used as a cementing material [10].
The viscosity and yield stress of the slurry were tested with a BROOKFIELD RST rheometer in the United States. The test results are shown in Table 2. With an increase in slurry concentration, the plastic viscosity and yield stress also increase accordingly, so viscosity, yield stress, and slurry concentration are dependent variables and independent variables [11,12].
According to the above analysis, five independent variables, namely, tailings mass concentration, −400 mesh ratio, lime–sand ratio, flow rate, and pipeline structure, were selected for data modeling analysis. Under the premise of ensuring fluidity, the density test was configured with tailing concentrations of 68%, 70%, 72%, and 74%, with a lime–sand ratio of 1:4, 1:10, and 1:20, and the test trailer pump displacement was set to 7%, 13%, 18%, and 25% to record the pressure data of the horizontal section, the vertical section, and the slope section. This experiment obtained 144 sets of experimental data.
After the filling slurry was fully agitated, the loop conveying experiment was carried out. In this experiment, the filling pump is left in its preset speed and then enters the horizontal pipeline (P1–P2), passes through the vertical pipeline (P2–P3), passes through the horizontal pipeline (P3–P4), flows into the mixing tank through the inclined 5° slope pipeline (P5–P8), etc.
In order to eliminate the influence of the shear thinning of the slurry on the rheological behavior [13,14], each group of experiments lasted for half an hour. The stable pressure value was recorded when the conveying flow was stable, the pressure difference between the pressure monitoring points was calculated, and the pressure difference was divided by distance and converted to a pressure loss value over a distance of 1 km in Mpa/km. First, the loop transport experiment was carried out using the minimum concentration ratio; then, tailings and cementing materials were added to the stirring system; the ratio was changed; the concentration was increased; and the pump delivery flow was changed so as to change the independent variable parameters of the test slurry concentration, the ratio of tailings to cementitious material, the −400 mesh proportion, and the flow velocity [15]. The pressure loss values under different variable conditions were recorded.

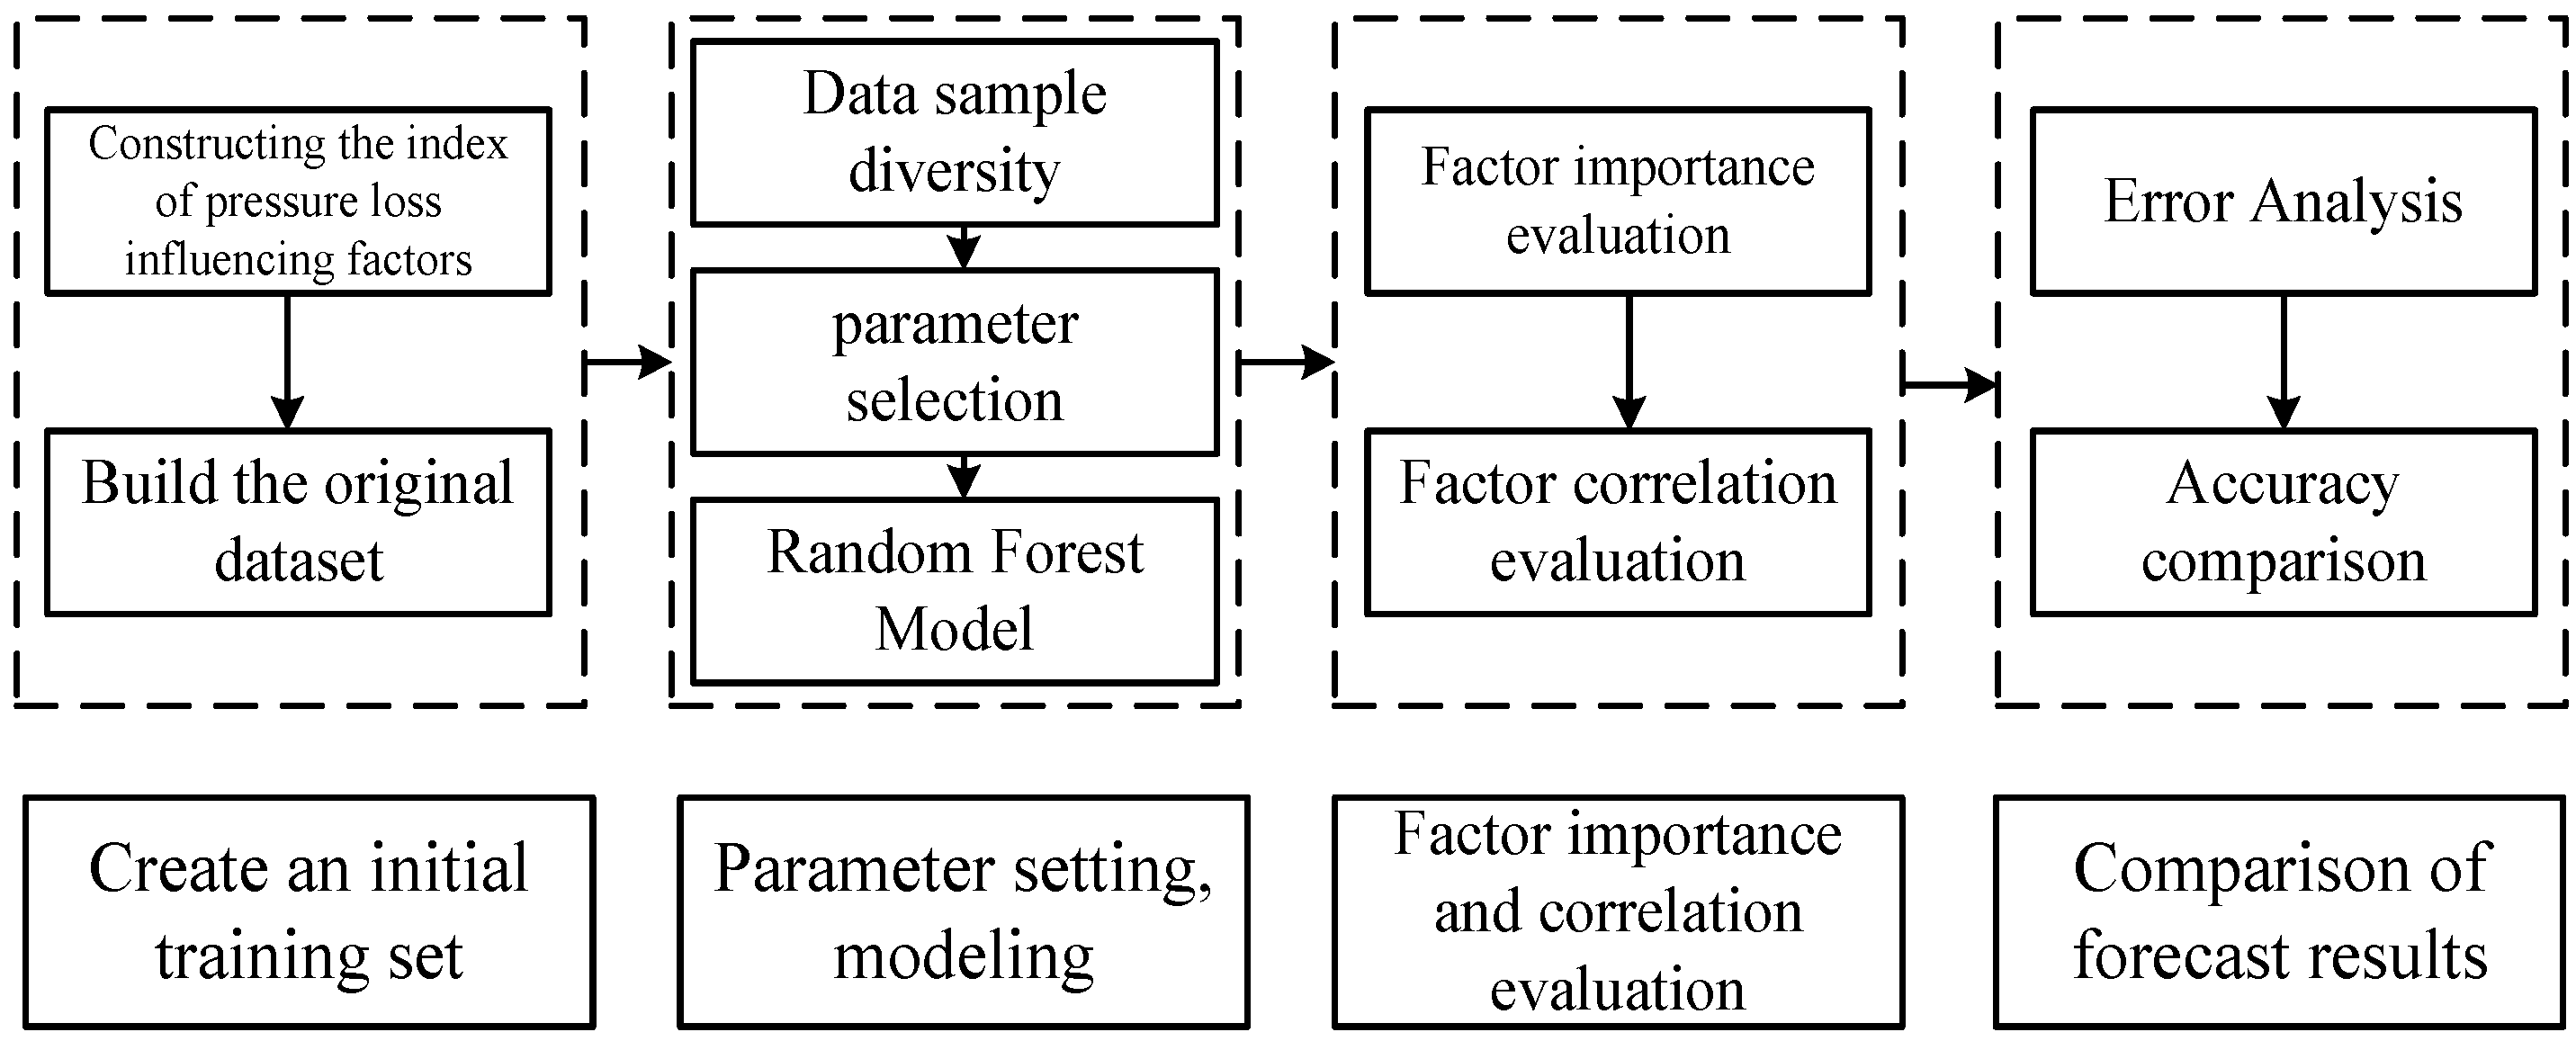
3. Establishment and Analysis of Pressure Drop Prediction Model

The random forest algorithm was used to establish the relationship between the pressure drop in the slurry pipeline and its related variables. Random forest is an extended variant of bagging [16]. Classification tree is the theoretical basis of random forest. Random forest adopts the Bootstrap resampling method to build a decision tree model for each sample set, which can be used to solve classification and regression problems. It has a strong generalization ability and good noise immunity, and it has been successfully applied in many fields [17,18].
The random forest algorithm is not sensitive to multicollinearity and can reduce the impact of missing data and unbalanced data on the prediction results. The random forest algorithm is currently considered to be one of the optimal algorithms for nonlinear model prediction [19].

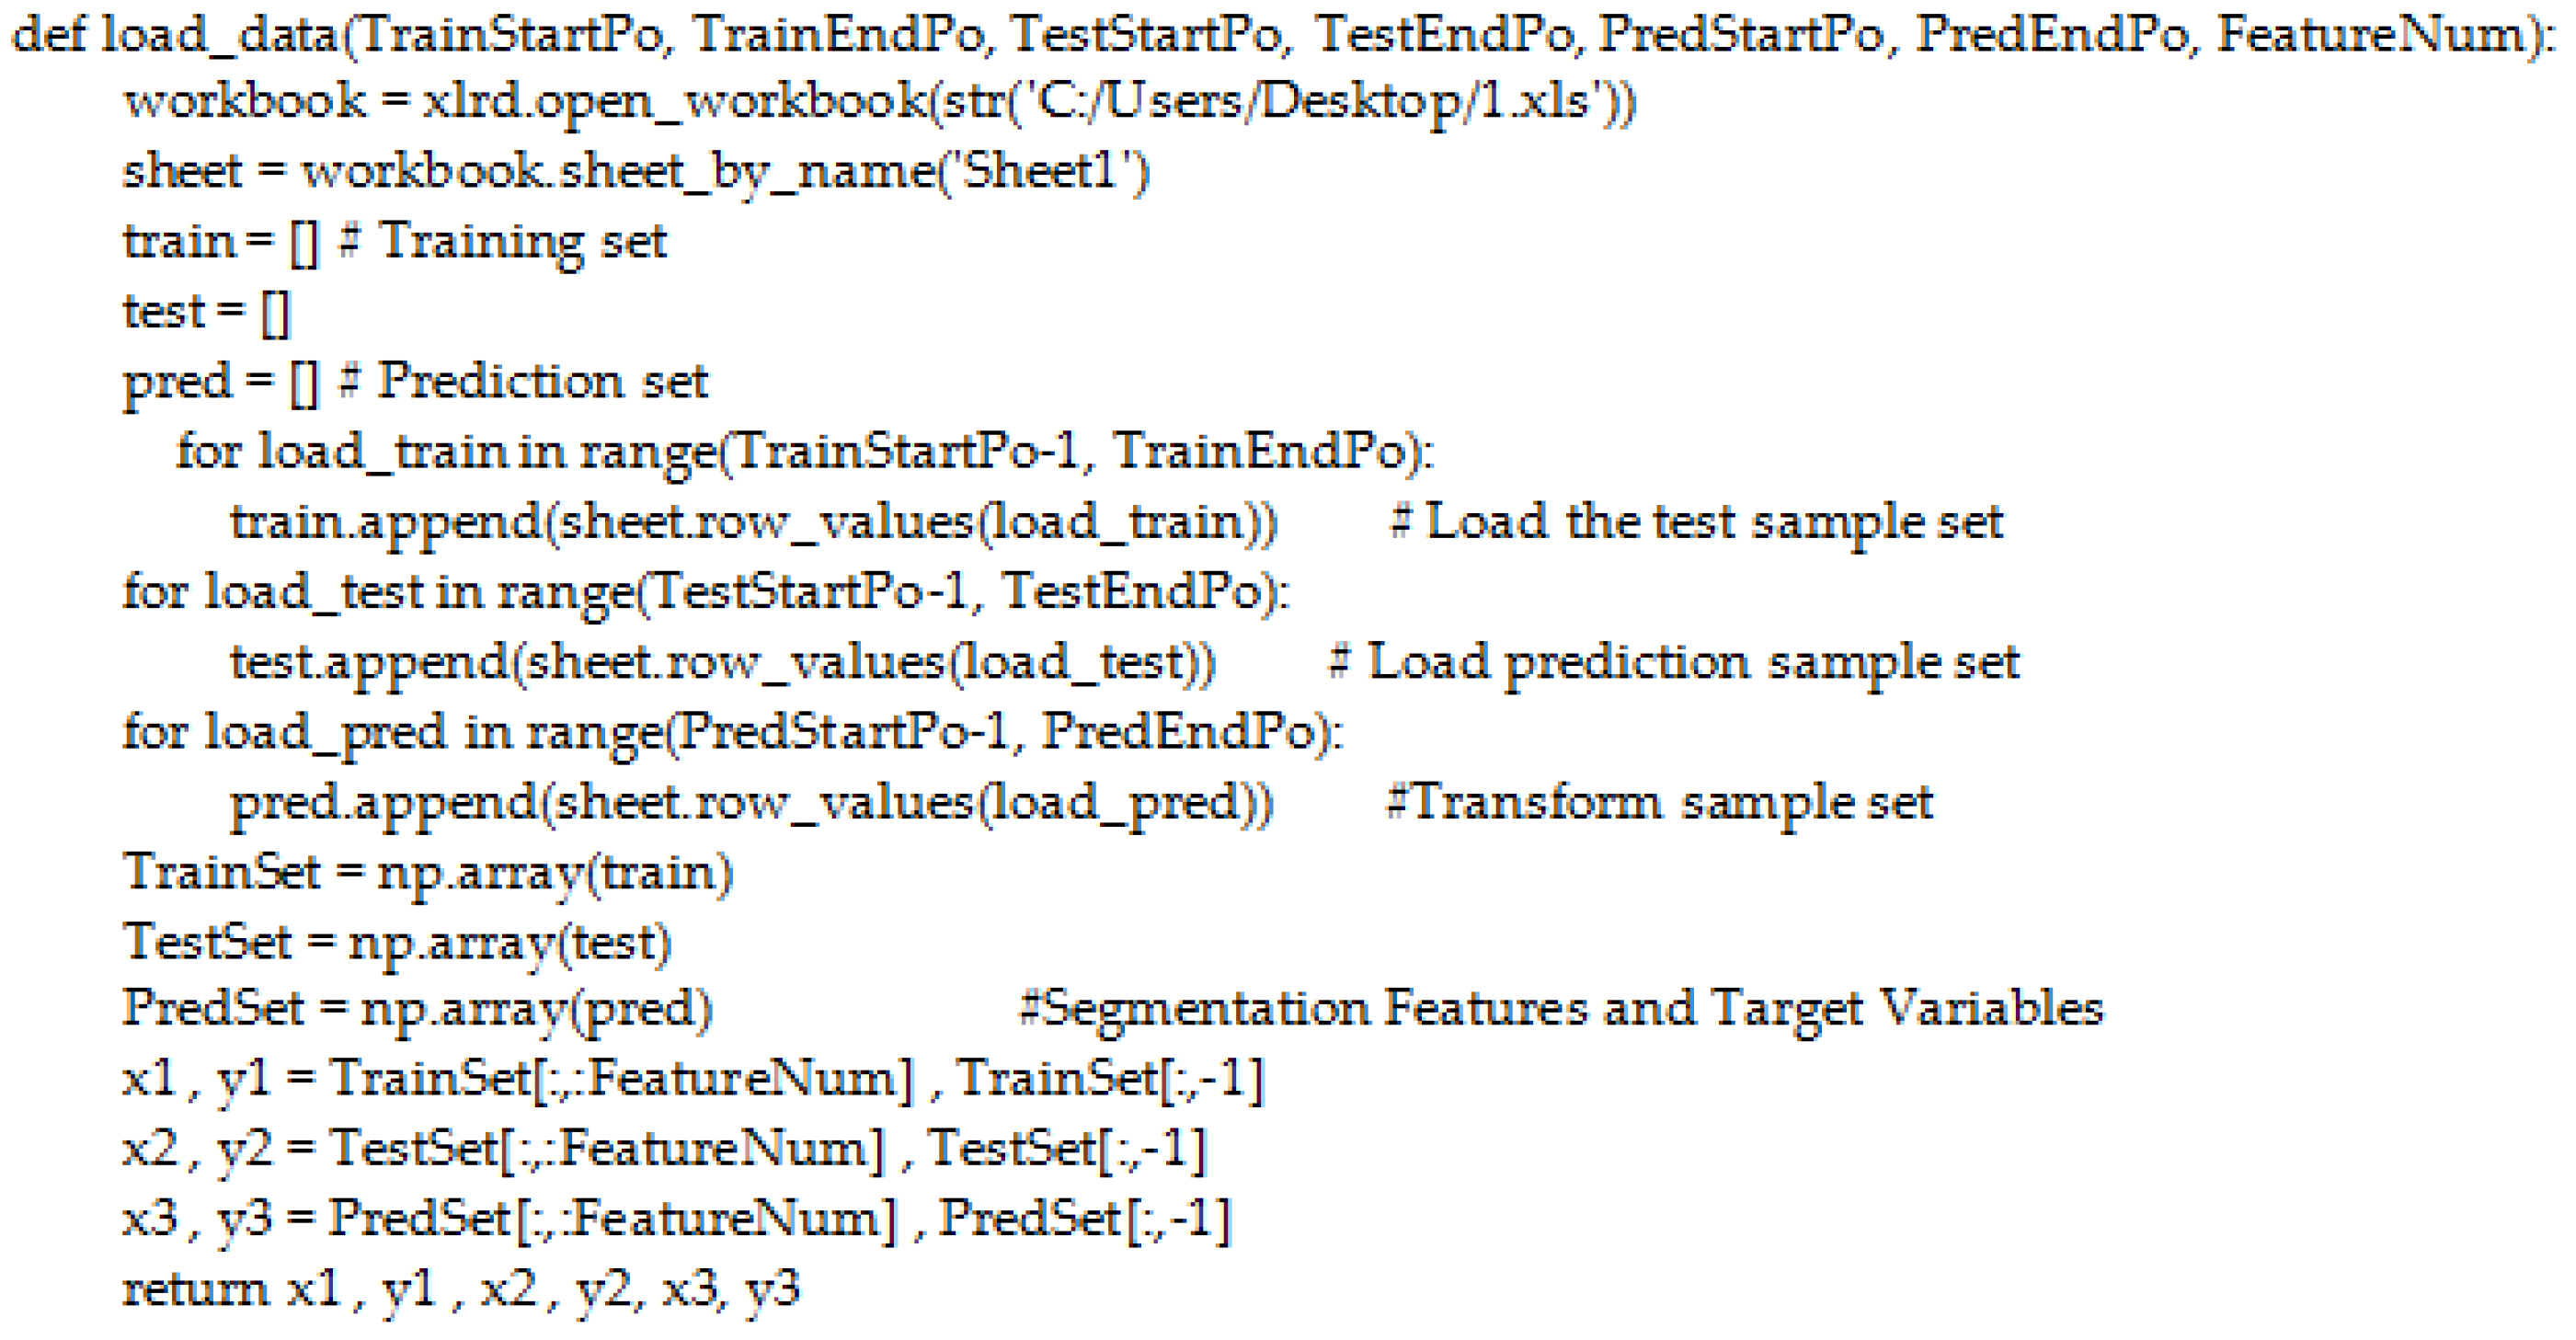
Building the Original Training Set

The random forest regression algorithm realizes the pressure loss prediction of the filling slurry pipeline. The random forest regression process is shown in Figure 2. The main steps are as follows:
(1)
Use the sigmoid function to normalize the original data, re-extract b training sets from the data samples with Bootstrap, build a regression decision tree, and use the remaining samples as the test sample set.
(2)
In the branching process, the variable smaller than the number of characteristic variables is randomly selected from all feature variables as an alternative branch, and the optimal branch is determined according to the principle of minimum node impurity.
(3)
The regression decision tree uses top-down recursive branches, and the number of decision trees is the ntree value [20,21,22] as the growth termination condition.
(4)
The decision trees produced by sampling are combined to form a regression model of random forest, and the mean of the predicted values of all decision trees is output as the prediction result.
The slurry pressure drop data were obtained through the loop pipe experiment, and some data are shown in Table 3.
For cross-validation, the main parameters of the random forest prediction model were the number of trees ntree = 400 and the number of variables of the random forest classification model mtry = 4. The program segment is shown in Figure 3.

4. Results and Discussion

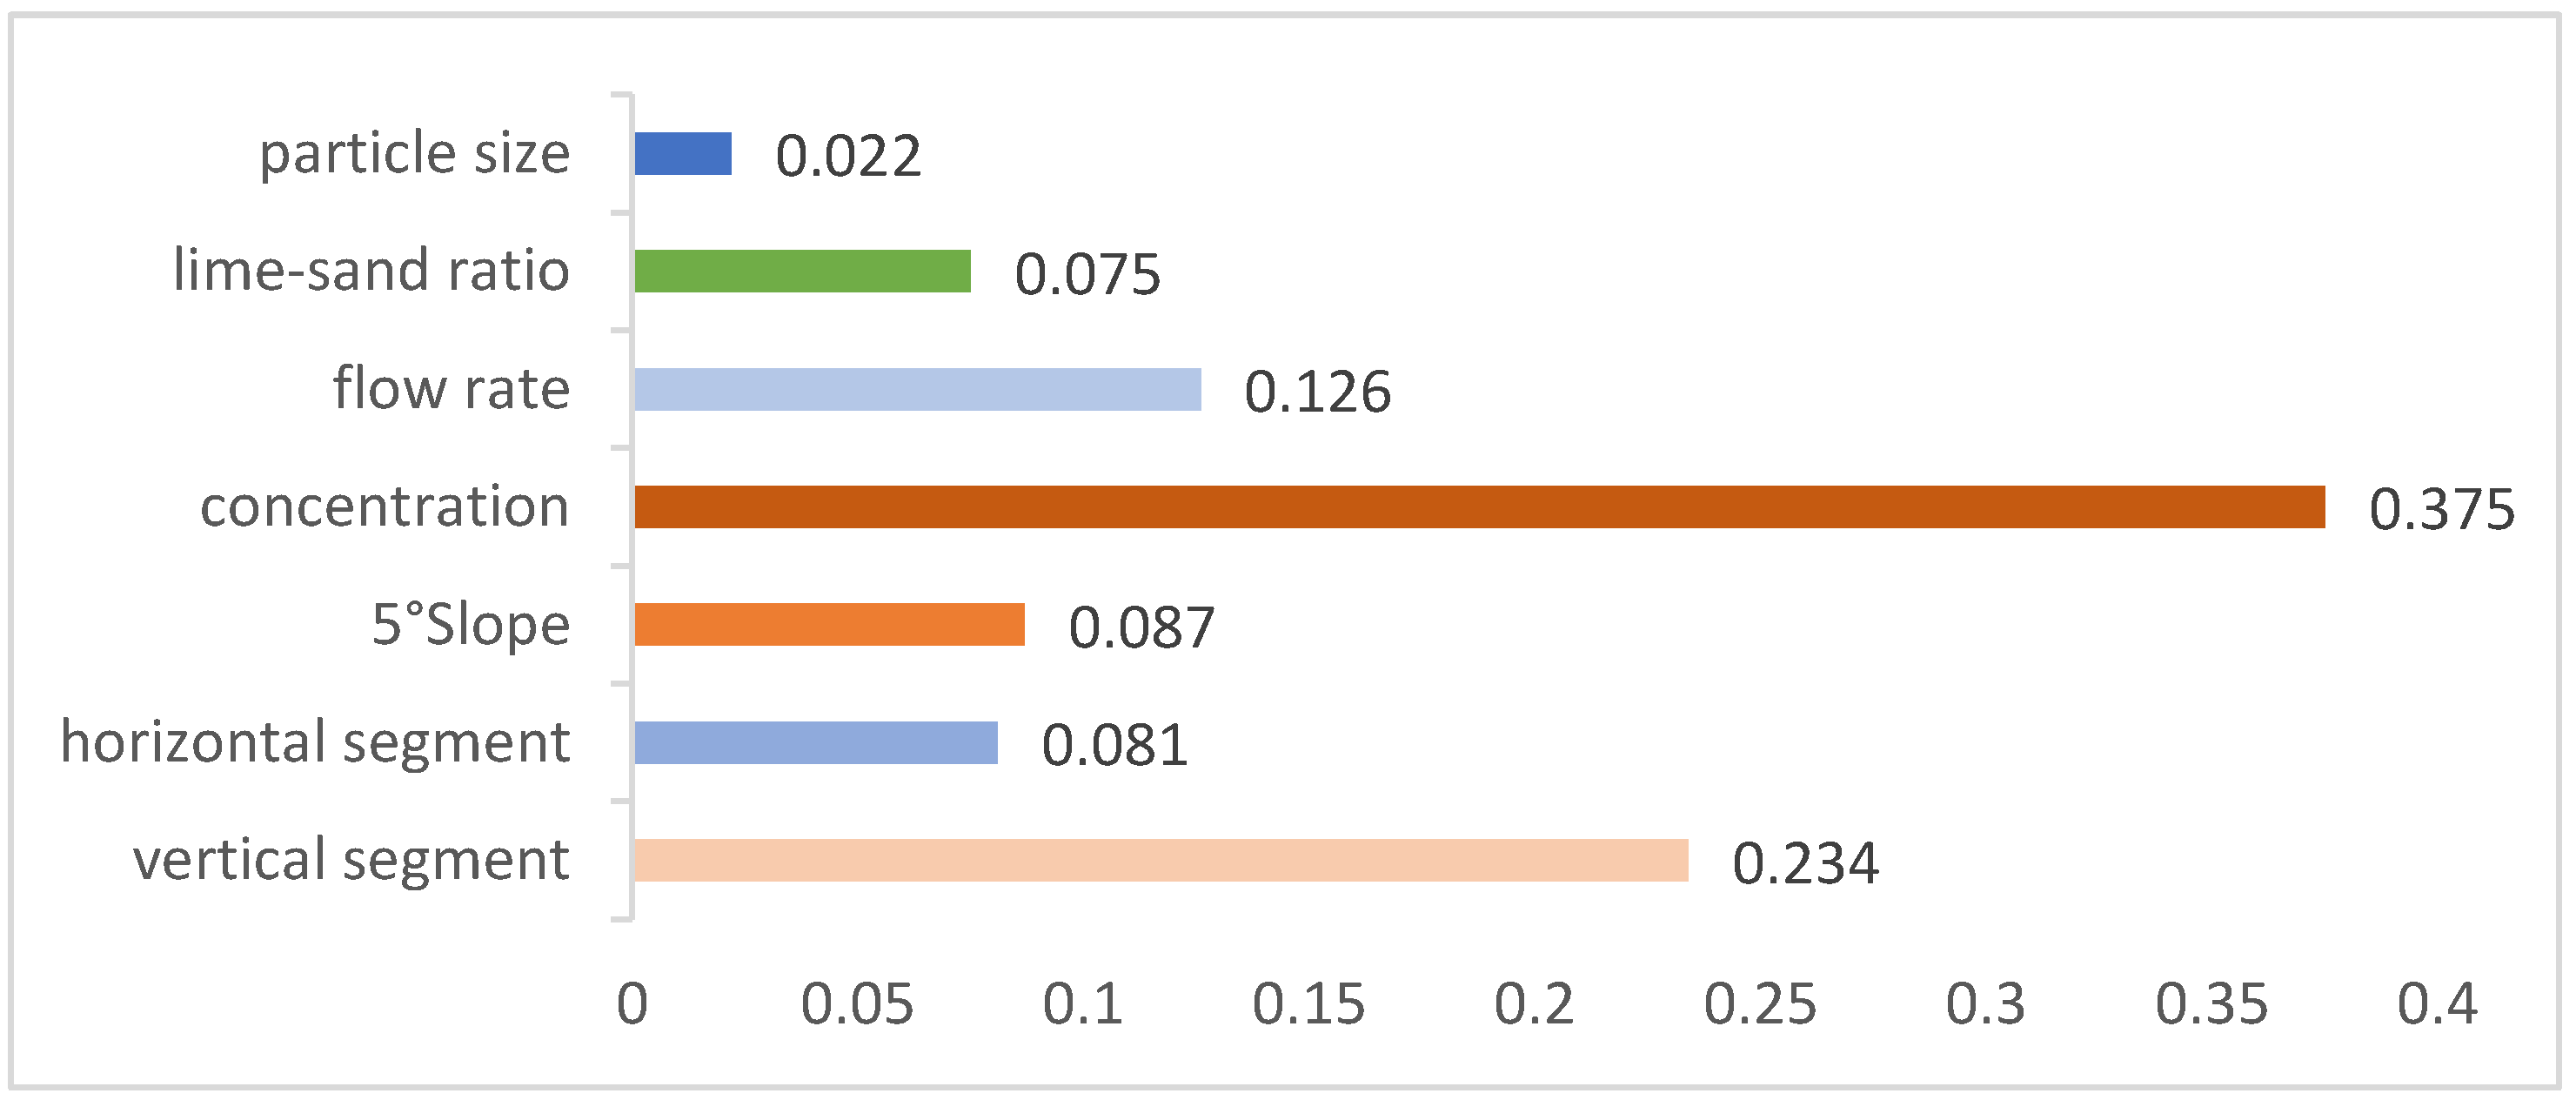
4.1. Importance and Relevance Calculations

Random forest can calculate the importance of a single variable [23,24]. The number of data classifications for the classifier is M, and the results were compared with the correct classification and the random forest classifier. The number of errors of the statistical classifier is N, and the size of the data error can be expressed by Equation (1):
erroOB = N M
According to the variable, x (importance score) can be expressed as:
score i = ( erroOB 2 erroOB 1 ) / ntree
where erroOB1 is the out-of-bag data error of the decision tree for each lesson; erroOB2 is the out-of-bag data error of feature x after adding noise interference [25,26,27]; and ntree is the number of decision trees. According to Formula (2), the importance of pressure drop influencing factors is scored; the sum of all importance scores is scaled to 1; and a stacked bar chart is drawn, which clearly reflects the importance scores of each factor as shown in Figure 4.
Through the analysis, it can be seen that the pipeline structure is the most important variable affecting the pressure drop, and the importance score was 0.402. The pressure drop predicted here is the total pressure drop, which includes the pressure loss pressure drop and the slurry static pressure drop. The importance scores of particle size, cementitious material-to-tailings mass ratio, flow rate, and concentration scores were 0.022, 0.075, 0.126, and 0.375, respectively. Slurry concentration is a secondary pressure drop factor to the pipeline structure, and relatively speaking, the proportion of −400 mesh particle size is the smallest factor.
Through the 5060 multi-function measuring instrument and the self-patented design of the filling pipeline pressure monitoring device, the long-term pressure data of the pipeline pressure during the full tailings filling of the Sanshandao Gold Mine were measured and analyzed. When calculating the pressure distribution of the filling pipeline, the pressure loss of the slurry in the complex area of the pipeline increased by 15% due to bending and joint wear, and the pressure loss of the vertical pipe section of the pipeline increased by 5%.
The correlation between two continuous variables was analyzed by the Pearson correlation coefficient [28,29], and the value range was [−1, 1]. The closer the absolute value of the sample correlation coefficient to 1, the higher the degree of correlation and the closer the relationship, and the correlation of the linear relationship between variables can be reflected by the correlation coefficient. The correlation function is presented as Formula (3):
ρ = δ X Y δ X δ Y
where δ X and δ Y are the standard deviation of random variables X and Y, respectively, and δ X Y is the covariance of X and Y.
The correlation table is used to express the correlation between different influencing factors and the pipeline pressure drop. The calculated correlation results are shown in Figure 5. Blue represents a positive correlation, red represents a negative correlation, and the area of the circle represents the strength of the correlation. It can be seen from the figure that the correlation between the concentration and the pipeline structure and pressure drop is the largest, and the importance score is the highest. The data come from the loop pipe experiment, and the test tailings are taken from the mine, which has guiding significance for the regulation of the mine filling slurry transportation. It is necessary to strengthen the management and control of these key factors during filling. When monitoring and regulating the abnormal state of the filling pipeline, strengthening the control weight of the factors provides a greater correlation [30].

4.2. Pressure Drop Prediction Results

First, the original data were de-statically processed; the measured data were subtracted from the pressure change in the slurry due to the action of gravity; and the pressure Pi of the new data set was obtained by Formula (4), where the density of the test slurry was obtained by Formula (5) [31,32,33]:
P i = Δ P ρ g h
ρ = ρ 0 × 1 / ( ρ 0 C w ( n γ s + γ c ) γ c γ s ( 1 + n ) + 1 C w )
where ΔP is the test pressure difference, Pa; ρ is the density of the test slurry, kg/m3; g is the acceleration of gravity, m/s2; is the vertical height difference, m; ρ 0 is the density of the water, and the industrial value is 1.02 × 10³ kg/m3; CW is the slurry mass concentration, %; n is the lime–sand ratio; and γ c is the true density of cementitious materials and the true density of tailings, kg/m3.
A new data set was constructed, 121 sets of data were extracted from it to construct training samples of the random forest model, and the remaining 23 sets of data were test samples. Five eigenvalues were selected, and the Anaconda3 development environment was used to complete the model establishment using Python language [34,35]. First, the model was run using the samples during training, and the trained random forest model was used to perform regression fitting on the test sample set. The prediction result of the regression fitting on the test sample set is shown in Figure 6.
It can be seen in Figure 6 that the prediction accuracy of the pressure drop prediction model based on the random forest algorithm is high. The goodness of fit between the prediction and the actual value in the test set is 0.9747, and the mean square error is 0.0011; the value goodness of fit is 0.983. The value range of goodness of fit is [0, 1]. The larger the value, the higher the degree of fit [36,37], and the closer the mean square error MSE is to 0, indicating that the error between the predicted data and the original data is smaller. The predicted value of the model is very close to the measured value, which verifies the feasibility of the random forest model to predict the slurry pressure drop in the loop experiment [38,39].

4.3. Comprehensive Evaluation of Forecast Results

In order to further verify the accuracy of the random forest model algorithm in the application of slurry pressure drop loss prediction [40,41,42], the BP artificial neural network and the polynomial linear fitting method were used for comparison [43], and the goodness of fit R2 and the mean square error MSE were used to determine the prediction accuracy of the model. The obtained error comparison results are shown in Table 4.

5. Results

The following conclusions can be drawn from the analysis of the experimental data of the tailings loop and the established random forest prediction model at this stage:
(1)
The biggest factor affecting the change in slurry pressure is the vertical pipeline structure, followed by the slurry concentration. The proportion of the tailings −400 mesh particle size has little effect on the slurry pressure drop.
(2)
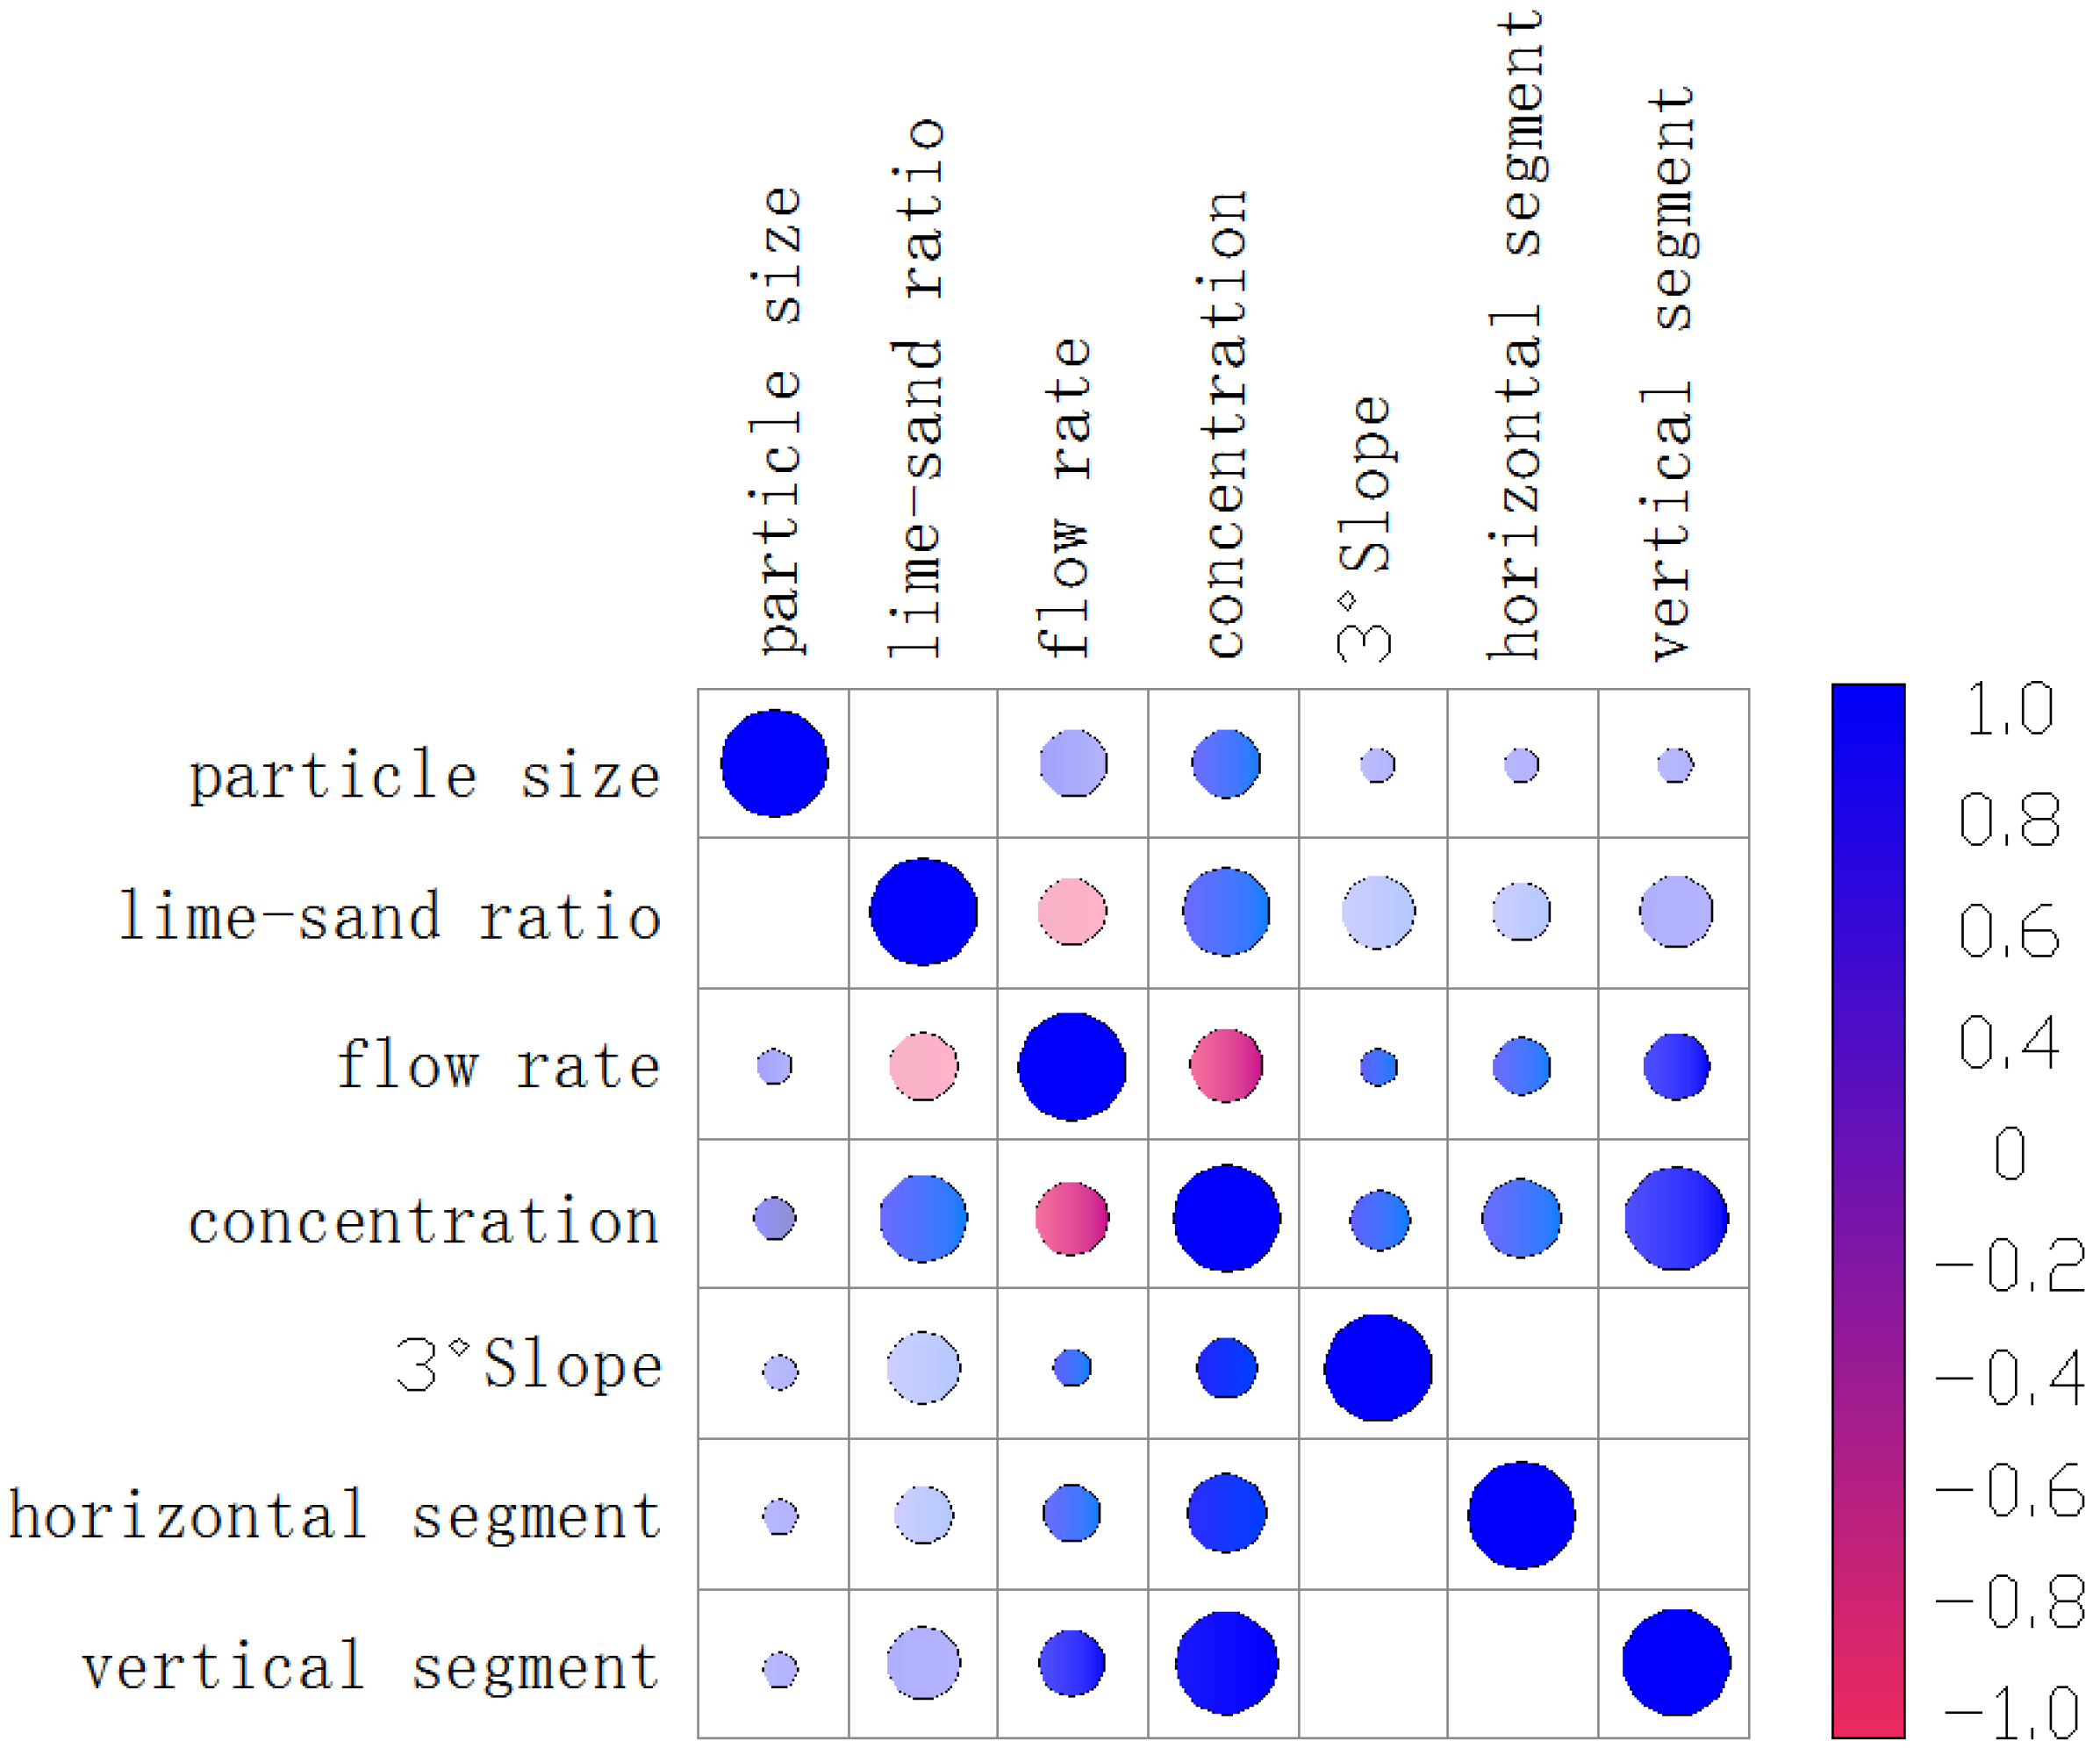
The correlation analysis of the data shows that the slurry pressure loss is positively correlated with the slurry concentration, ratio, and flow rate. The fluidity of the slurry is negatively correlated with the pressure drop, concentration, and the ratio of the slurry.
(3)
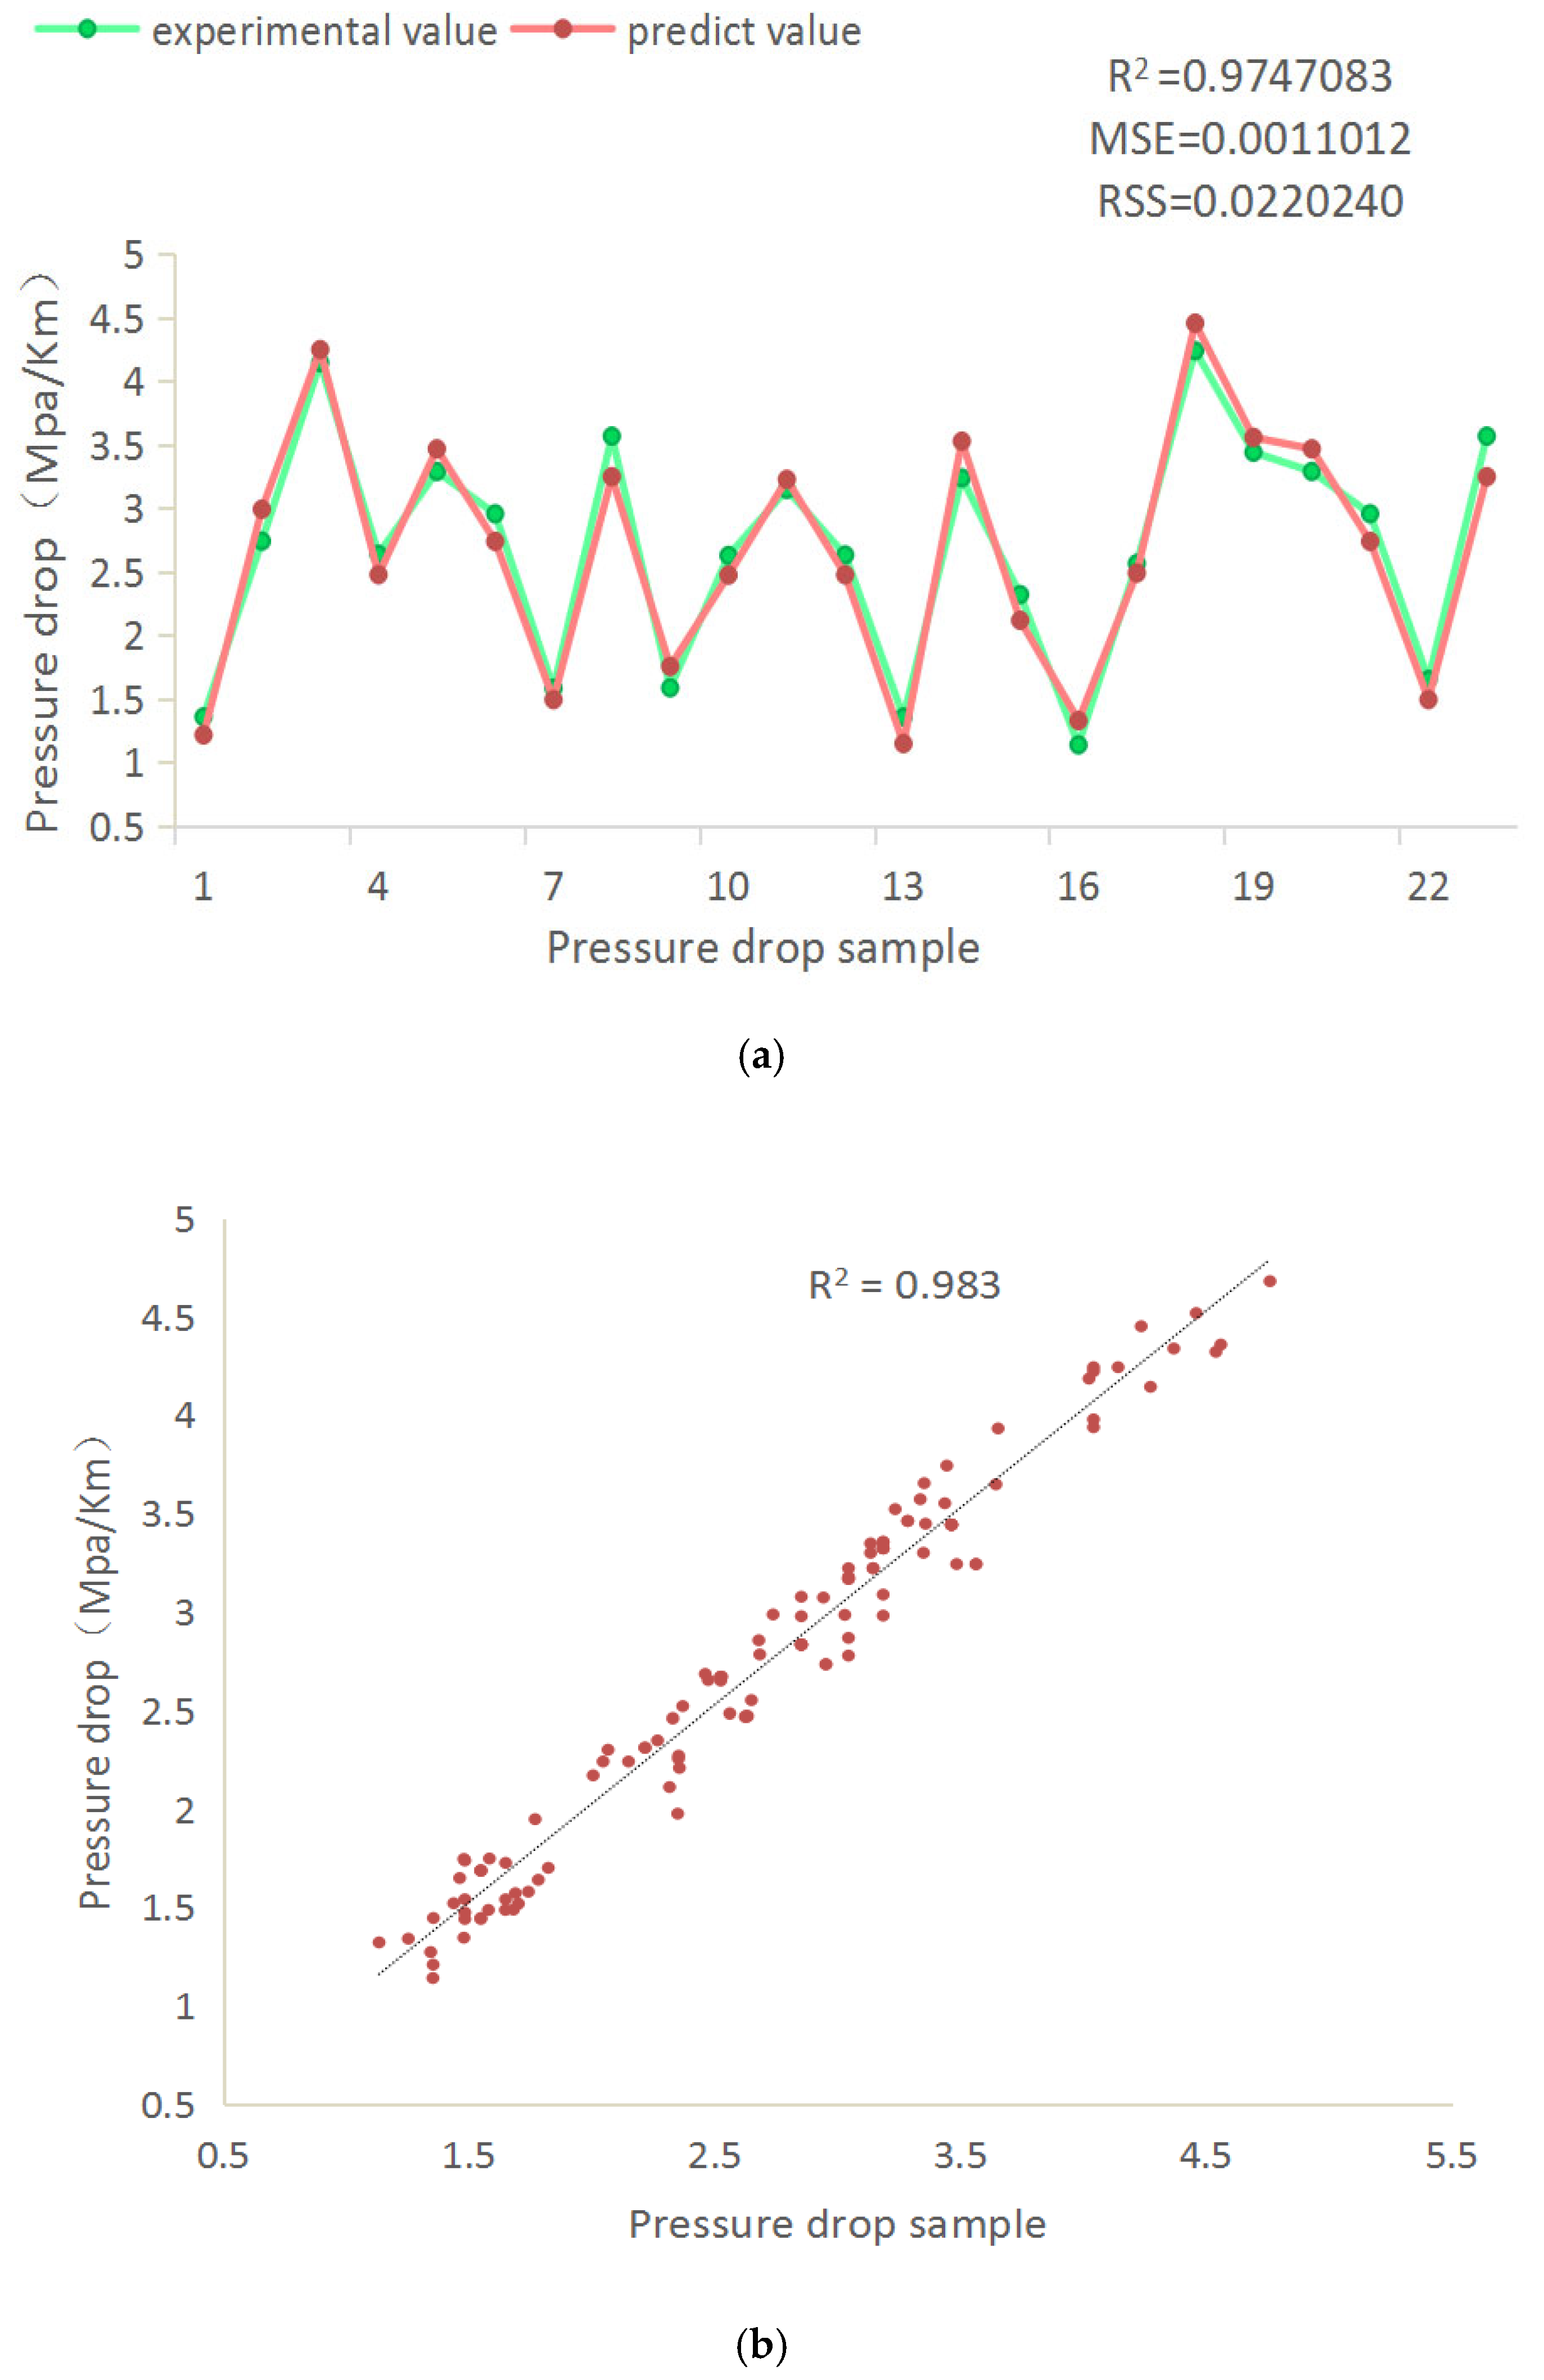
The random forest pressure loss model established based on the experimental data of the loop pipe has a high prediction accuracy. The goodness of fit between the experimental value and the predicted value on the test set and training set is 0.9747 and 0.983, The prediction accuracy is higher than BP neural network. Based on polynomial linear fitting, it can replace the complex loop experiment to carry out the intelligent aided design of filling systems.
(4)
The algorithm model can be used to predict the pressure of the filling pipeline by learning the pressure distribution data of the mine filling pipeline. To provide ideas for follow-up research, the algorithm can be used in combination with the automatic system to realize the judgment and early warning of the abnormal state of the filling pipeline by predicting the pipeline pressure, and the development of “smart back-filling” technology can be promoted.

Author Contributions

Conceptualization, Z.W. (Zengjia Wang) and Y.K.; methodology, Z.W. (Zengjia Wang) and Z.W. (Zengbin Wang); software, Z.W. (Zengjia Wang) and Z.W. (Zengbin Wang); validation, Z.W. (Zengbin Wang), Z.W. (Zaihai Wu) and J.G.; formal analysis, Y.K.; investigation, Z.W. (Zengjia Wang) and Z.W. (Zaihai Wu); resources, J.G.; data curation, Z.W. (Zengbin Wang); writing—original draft preparation, Z.W. (Zengbin Wang); Z.W. (Zengjia Wang) and Y.K. serve as directors of the program, and Obtained all necessary funds. All authors have read and agreed to the published version of the manuscript.

Funding

This research was supported by the National Key R&D Program of the 13th Five-Year Plan (2018YFC0604600) and the Shandong Provincial Major Science and Technology Innovation Project (2019SDZY05).

Conflicts of Interest

The authors declare no conflict of interest.

References

  1. Cai, M.; Xue, D.; Ren, F. Current status and development strategy of metal mines. J. Eng. Sci. 2019, 41, 417–426. [Google Scholar]
  2. Li, X.; Zhou, S.; Zhou, Y.; Min, C.; Cao, Z.; Du, J.; Luo, L.; Shi, Y. Durability Evaluation of Phosphogypsum-Based Cemented Backfill Through Drying-Wetting Cycles. Minerals 2019, 9, 321. [Google Scholar] [CrossRef] [Green Version]
  3. Wang, Z.; Qi, Z.; Kou, Y.; Yang, J.; Song, Z.; Jia, H. Smart filling system enables new development of mines? Min. Res. Dev. 2022, 1, 156–161. [Google Scholar]
  4. Kumar, U.; Mishra, R.; Singh, S.N.; Seshadri, V. Effect of particle gradation on flow characteristics of ash disposal pipelines. Powder Technol. 2003, 132, 39–51. [Google Scholar] [CrossRef]
  5. Qi, C.; Yang, X.; Li, G.; Xu, Y.; Kiu, X.; Cao, X.; Huang, C.; Liu, E.; Qian, S.; Liu, X.; et al. Research status and perspectives of the application of artificial intelligence in mine backbackfilling. J. China Coal Soc. 2021, 46, 688–700. [Google Scholar]
  6. Qi, C.; Fourie, A. Cemented paste backfill for mineral tailings management: Review and future perspectives. Miner. Eng. 2019, 144, 106025. [Google Scholar] [CrossRef]
  7. Dong, L.; Tong, X.; Ma, J. Quantitative Investigation of Tomographic Effects in Abnormal Regions of Complex Structures. Engineering 2021, 7, 1011–1022. [Google Scholar] [CrossRef]
  8. Wei, C.; Wang, X.; Zhang, Y.; Zhang, Q. Paste-like cemented backfilling technology and rheological characteristics analysis based on jigging sands. J. Central South Univ. 2017, 24, 155–167. [Google Scholar] [CrossRef]
  9. Ouattara, D.; Yahia, A.; Mbonimpa, M.; Tikou, B. Effects of superplasticizer on rheological properties of cemented paste backfills. Int. J. Miner. Process. 2017, 161, 28–40. [Google Scholar] [CrossRef]
  10. Zhou, Z. Machine Learning; Tsinghua University Press: Beijing, China, 2016; pp. 178–181. [Google Scholar]
  11. Russell, S.; Norvig, P. Artificial Intelligence: A Modern Approach, 3rd ed.; Pearson: London, UK, 2011; Volume 175, pp. 935–937. [Google Scholar]
  12. Zhang, J.; Guo, W.; Song, B.; Zhou, Y.; Zhang, Y. Performance Prediction of Asphalt Pavement Based on Random Forest. J. Beijing Univ. Technol. 2021, 47, 1256–1263. [Google Scholar]
  13. Ji, W.; Liu, Y.; Cai, J.; Wang, B. Mineral pressure prediction method based on random fores. Chin. J. Min. Rock Form. Control Eng. 2021, 3, 71–81. [Google Scholar]
  14. Yao, D.; Yang, J.; Zhan, X. Feature selection algorithm based on random forest. J. Jilin Univ. Eng. Sci. 2014, 44, 137–141. [Google Scholar]
  15. Pearson, K. Notes on the History of Correlation. Biometrika 1920, 13, 1–16. [Google Scholar] [CrossRef]
  16. Hu, Y.; Zhang, L.; Yuan, F.; Li, T.; Wu, X.; Deng, T. Research on concrete strength prediction based on random forest. Constr. Technol. 2020, 49, 89–94. [Google Scholar]
  17. Zhang, Q.; Liu, W.; Wang, X.; Chen, Q. Optimal prediction model of backfill paste rheological parameters. J. Cent. South Univ. Sci. Technol. 2018. [Google Scholar]
  18. Wang, Z.; Wu, A.; Wang, H. Prediction on the InterfaceShear Strength of Backfill and Surrounding Rock Based on PSO-BPNN Algorithm. Min. Res. Dev. 2020, 40, 130–134. [Google Scholar]
  19. Hojamberdiev, M.; Arifov, P.; Tadjiev, K. Processing of refractory materials using various magnesium sources derived from Zinelbulak talc-magnesite. J. Miner. Metall. Mater. Eng. Ed. 2011, 18, 10. [Google Scholar] [CrossRef]
  20. Qi, C.; Fourie, A.; Chen, Q. Neural network and particle swarm optimization for predicting the unconfined compressive strength of cemented paste backfill. Constr. Build. Mater. 2018, 159, 473–478. [Google Scholar] [CrossRef]
  21. Sun, W.; Wu, A.X.; Hou, K.P.; Yang, Y.; Liu, L.; Wen, Y.M. Experimental study on the microstructure evolution of mixed disposal paste in surface subsidence areas. Minerals 2016, 6, 43. [Google Scholar] [CrossRef]
  22. Dong, L.; Zhou, Y.; Deng, S.; Wang, M.; Sun, D. Evaluation methods of man-machine-environment system for clean and safe production in phosphorus mines: A case study. J. Central South Univ. 2021, 28, 3856–3870. [Google Scholar] [CrossRef]
  23. Wu, A.; Ruan, Z.; Bürger, R.; Yin, S.; Wang, J.; Wang, Y. Optimization of flocculation and settling parameters of tailings slurry by response surface methodology. Miner. Eng. 2020, 156, 106488. [Google Scholar] [CrossRef]
  24. Wu, J.; Yin, Q.; Gao, Y.; Meng, B.; Jing, H. Particle size distribution of aggregates effects on mesoscopic structural evolution of cemented waste rock backfill. Environ. Sci. Pollut. Res. 2021, 28, 16589–16601. [Google Scholar] [CrossRef] [PubMed]
  25. Cao, G.; Wei, Z.; Wang, W.; Zheng, B. Shearing resistance of tailing sand waste pollutants mixed with different contents of fly ash. Environ. Sci. Pollut. Res. 2020, 27, 8046–8057. [Google Scholar] [CrossRef] [PubMed]
  26. Qiu, J.; Guo, Z.; Yang, L.; Jiang, H.; Zhao, Y. Effect of tailings fineness on flow, strength, ultrasonic and microstructure characteris-tics of cemented paste backfill. Constr. Build. Mater. 2020, 263, 120645. [Google Scholar] [CrossRef]
  27. Gao, J.; Fourie, A. Spread is better: An investigation of the mini-slump test. Miner. Eng. 2015, 71, 120–132. [Google Scholar] [CrossRef]
  28. Li, H.; Wu, A.; Cheng, H. Analysis of conical slump shape reconstructed from stereovision images for yield stress prediction. Cem.Concr. Res. 2021, 150, 106601. [Google Scholar] [CrossRef]
  29. Qi, C.; Guo, L.; Wu, Y.; Zhang, Q.; Chen, Q. Stability Evaluation of Layered Backfill Considering Filling Interval, Backfill Strength and Creep Behavior. Minerals 2022, 12, 271. [Google Scholar] [CrossRef]
  30. Wu, S.Z.; Wang, M.N.; Yu, L.; Liu, D.-G.; Huang, Q.-W. Model test study on stress characteristics of backfill to segment in TBM tunnel. Rock Soil Mech. 2018, 39, 3976–4009. [Google Scholar]
  31. Benzaazoua, M.; Fall, M.; Belem, T. A contribution to understanding the hardening process of cemented pastefill. Miner. Eng. 2004, 17, 141–152. [Google Scholar] [CrossRef]
  32. Li, S.; Zhang, R.; Feng, R.; Hu, B.; Wang, G.; Yu, H. Feasibility of Recycling Bayer Process Red Mud for the Safety Backfill Miningof Layered Soft Bauxite under Coal Seams. Minerals 2021, 11, 722. [Google Scholar] [CrossRef]
  33. Qi, C.; Xu, X.; Chen, Q. Hydration reactivity difference between dicalcium silicate and tricalcium silicate revealed from tructural and Bader charge analysis. Int. J. Miner. Met. Mater. 2022, 29, 335–344. [Google Scholar] [CrossRef]
  34. Le, Z.-H.; Yu, Q.-L.; Pu, J.-Y.; Cao, Y.-S.; Liu, K. A Numerical Model for the Compressive Behavior of Granular Backfill Based on Experimental Data and Application in Surface Subsidence. Metals 2022, 12, 202. [Google Scholar] [CrossRef]
  35. Zhang, P.F.; Zhang, Y.B.; Zhao, T.B.; Tan, Y.L.; Yu, F.H. Experimental research on deformation characteristics of waste-rock materialin ynderground backfill mining. Minerals 2019, 9, 102. [Google Scholar] [CrossRef] [Green Version]
  36. Li, M.; Li, A.L.; Zhang, J.X.; Huang, Y.L.; Li, J.M. Effects of particle sizes on compressive deformation and particle breakage of gangue used for coal mine goaf backfill. Powder Technol. 2020, 360, 493–502. [Google Scholar] [CrossRef]
  37. Meng, G.H.; Zhang, J.X.; Li, M.; Zhu, C.L.; Zhang, Q. Prediction of compression and deformation behaviours of gangue backfill materials under multi-factor coupling effects for strata control and pollution reduction. Environ. Sci. Pollut. Res. Int. 2020, 27, 36528–36540. [Google Scholar] [CrossRef]
  38. Wang, X.; Xie, J.; Xu, J.; Zhu, W.; Wang, L. Effects of Coal Mining Height and Width on Overburden Subsidence in Longwall Pier-Column Backfilling. Appl. Sci. 2021, 11, 3105. [Google Scholar] [CrossRef]
  39. Wang, R.; Zeng, F.; Li, L. Applicability of Constitutive Models to Describing the Compressibility of Mining Backfill: A Comparative Study. Processes 2021, 9, 2139. [Google Scholar] [CrossRef]
  40. Keita, A.M.T.; Jahanbakhshzadeh, A.; Li, L. Numerical analysis of the stability of arched sill mats made of cemented backfill. Int. J. Rock Mech. Min. Sci. 2021, 140, 104667. [Google Scholar] [CrossRef]
  41. Cui, L.; Fall, M. A coupled thermo–hydro-mechanical–chemical model for underground cemented tailings backfill. Tunn. Undergr. Space Technol. 2015, 50, 396–414. [Google Scholar] [CrossRef]
  42. Huan, C.; Zhang, S.; Zhao, X.; Li, S.; Zhang, B.; Zhao, Y.; Tao, P. Thermal Performance of Cemented Paste Backfill Body Considering Its Slurry Sedimentary Characteristics in Underground Backfill Stopes. Energies 2021, 14, 7400. [Google Scholar] [CrossRef]
  43. Zhao, P.; Li, X.Z.; Zhang, Y.; Liu, K.; Lu, M.H. Stratified thermal response test measurement and analysis. Energy Build. 2020, 215, 109865. [Google Scholar] [CrossRef]
Figure 1. Schematic of the pipe transportation system.
Minerals 12 00447 g001
Figure 2. Random forest pressure drop prediction flowchart.
Minerals 12 00447 g002
Figure 3. Random forest program diagram (random classification of sample data).
Minerals 12 00447 g003
Figure 4. Test variable correlation score map. The abscissa is the weight, and the ordinate is the variable.
Minerals 12 00447 g004
Figure 5. Correlation graph.
Minerals 12 00447 g005
Figure 6. Model prediction: (a) results of fitting between the predicted values of the test set and the actual values; (b) results of fitting between the predicted values of the training set and the measured values.
Minerals 12 00447 g006
Table 1. Tailings grain composition.
Screen/Mesh+100−100~+200−200~+320−320~+400−400
Full tailings proportion/%30.0714.3612.061.0642.5
Table 2. Slurry rheological parameters.
ConcentrationLime–Sand RatioPlastic Viscosity (Pa·s)Initial Yield Stress (Pa)
68%0.250.15940.549
70%0.250.21659.865
72%0.250.32295.158
74%0.250.486135.684
Table 3. Test sample data.
Influencing FactorsEvaluation
Index
Serial NumberPipeline Angle°Quality Concentration%Lime–Sand RatioFlow Rate m/s400 Mesh%Pressure Loss Mpa/km
1068%0.251.32421.177
2070%0.251.68352.688
3072%0.252.2384.111
4074%0.251.28293.584
5068%0.11.36370.987
Table 4. Prediction model error comparison table.
ModelPerformance
R2MSE
Random forest algorithm0.97470.0011
BP artificial neural network0.95380.0512
Linear fit0.93260.1862
Publisher’s Note: MDPI stays neutral with regard to jurisdictional claims in published maps and institutional affiliations.

