Abstract
Sc-rich babingtonite from Heftetjern, Norway and Baveno, Italy were examined using electron microprobe analysis and X-ray single-crystal refinement in order to re-examine the behavior of Sc3+ and analyze its effect on the crystal structure of babingtonite. The Sc2O3 content is 13.78 wt.% in the Heftetjern specimen, and 8.44 wt.% in the Baveno one. In contrast, the latter has higher Fe content (11.13 wt.% as FeO) rather than the former one (8.63 wt.% as FeO). Characteristically, both specimens contain sodium. Although the oxidation state of octahedral cations in babingtonites is in general Me2+:Me3+ = 1:1, trivalent cations in the Heftetjern specimen attain 1.14 apfu. This excess of trivalent cations must be counterbalanced by monovalent Na substituted for Ca. The unit-cell parameters are a = 7.5272(1), b = 11.7175(1), c = 6.7613(1) Å, α = 91.710(1), β = 93.637(1), γ = 104.522(1)°, and V = 575.49(2) Å3 for the Heftetjern specimen, and a = 7.5199(2), b = 11.7145(3), c = 6.7408(2) Å, α = 91.756(2), β = 93.786(2), γ = 104.549(2)°, and V = 573.83(3) Å3 for the Baveno one. The structural formulae are A1Ca1.00A2(Ca0.879Na0.121)M1(Sc3+0.42Fe2+0.37Mn2+0.21)M2(Sc3+0.68Fe2+0.27Mg0.03Fe3+0.02)Si5O14(OH) for Heftetjern, and A1Ca1.00A2(Ca0.819Na0.181)M1(Sc3+0.43Mn2+0.36Fe2+0.21)M2(Fe3+0.36Fe2+0.30Sc3+0.26Sn4+0.05Al0.03)Si5O14(OH) for Baveno. Due to Sc3+ substitution, the <M2–O> distance, 2.09–2.11 Å, is longer than that of Sc-free babingtonite, 2.03–2.05 Å. The M2O6 expansion leads to the lengthened O4–O10 edge shared between the M1O6 and M2O6 octahedra, and causes the stronger angular distortion of M2O6. This can be explained by the increase of the O4–M1–O10 angle and decrease of the O4–M1–O8 angle with lengthening of the O4–O10 edge.
1. Introduction
Babingtonite, Ca2Fe2+Fe3+[Si5O14(OH)] (Z = 2), is one of the hydro-pyroxenoid group minerals. In general, it occurs in zeolitic veins and cavities of basic igneous rocks (e.g., Wise and Moller [1]), and skarn deposits (e.g., Burns and Dyar [2]). Babingtonite, manganbabingtonite, Ca2Mn2+Fe3+[Si5O14(OH)], and scandiobabingtonite, Ca2Fe2+Sc3+[Si5O14(OH)] are known as independent mineral species [3,4]. In particular, occurrences of scandiobabingtonite are scarce, and only two localities have been known until now; in granite at Baveno, Italy [4], and in the Heftetjern granite pegmatite, Norway [5].
The crystal structure of babingtonite-group minerals has two 8-coordinated Ca sites (A1 and A2), two crystallographically independent octahedra, M1 and M2. The M1O6-octahedra are larger than the M2O6. An undulating chain is built by five SiO4 tetrahedra [6]. Ferrous and ferric iron is separated onto M1 and M2, respectively, based on the results of 57Fe Mössbauer studies of babingtonite [1,7,8,9,10]. The divalent Mn2+ and Mg2+ ions occupy the larger M1O6 octahedra whereas the Al3+ ions locate at the smaller M2O6 octahedra [11]. Thus, it is considered that divalent and trivalent octahedral cations are ordered at M1 and M2, respectively. However, this rule might not be applied to the assignment of Sc3+ due to its large ionic radius, 0.745 Å [12]. Scandiobabingtonite from Baveno, Italy (type loc.) studied by Orlandi et al. [4] contained Fe2+ and Mn2+ as divalent cations and Sc3+ and Fe3+ as trivalent cations with additional small amounts of Sn4+. They suggested (Ca1.71Na0.25)Σ1.96(Fe2+0.65Mn0.32)Σ0.97(Sc0.91Sn0.04Fe3+0.03)Σ0.98Si5.09O14.00(OH)1.00 as the empirical formula of scandiobabingtonite. All Sc3+ ions were assigned to M2. Orlandi et al. [4] noticed that the crystal used for the structural study was not actually scandiobabingtonite, but Sc-rich babingtonite because the refinement converged to the occupancy of 73%Fe + 27%Sc at M2. They explained that any Fe2+ ↔ Sc3+ substitution at M1 is excluded since <M1–O> of 2.165 Å in Sc-rich babingtonite is similar to that of 2.169 Å in babingtonite obtained by Araki and Zoltai [6]. However, the site occupancy of M1 refined with Fe yielded 0.856(6) Fe in the structural study by Araki and Zoltai [6], implying the presence of non-negligible amount of Mg in their crystal. The shorter <M1–O> distance of Sc-rich babingtonite compared to that of babingtonite would rather imply partial Sc occupancy at M1 while the majority of Sc resides at M2. Thus, in this study, the Sc-rich babingtonite specimens from Heftetjern, Norway and Baveno, Italy were examined using electron microprobe analysis (EPMA), and X-ray single-crystal refinement in order to re-examine the behavior of Sc3+ in the babingtonite structure, and to investigate the structural flexibility due to chemical variations. In fact, the Sc content in our studied Heftetjern specimen is more than 1 apfu implying Sc ions occupy not only M2. Furthermore, laser-induced breakdown spectroscopy (LIBS) was applied to the specimen from Baveno because the unusual Sc distribution in this crystal motivated us to analyze the Li content although significant Li concentrations have been unknown for minerals from the Baveno locality.
2. Materials and Methods
Both specimens are derived from pegmatitic occurrences. Sc-rich babingtonite from the Heftetjern granite pegmatite, Norway, forms blueish grey tabular crystals associated with quartz, albite and cascandite (Figure 1a). Mineral assemblages of Sc-bearing minerals from this locality were summarized by Kristiansen [13]. The platy crystal of Sc-rich babingtonite from a miarolitic cavity of granite from Baveno is greyish black (Figure 1b) and is accompanied with albite, K-feldspar and kristiansenite. Baveno is the type locality of scandiobabingtonite [4]. Sc-bearing minerals from Baveno and their history were introduced by Gramaccioli et al. [14]. As shown in Figure 1a,b, the two specimens are characterized by different color. This difference is possibly derived from varying valence of iron. Based on chemical analysis mentioned below, the former contains almost only Fe3+ whereas the latter contains both Fe2+ and Fe3+. Perhaps charge transfer between Fe2+ and Fe3+ gives rise to greyish black color for Baveno specimen.
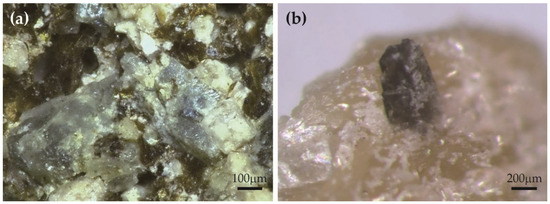
Figure 1.
Optical photograph of Sc-rich babingtonite from the Heftetjern pegmatite, Norway (a) and the Baveno pegmatite, Italy (b).
Chemical analyses were performed using an electron microprobe analyzer (EPMA, JEOL JXA-8230) installed at the Centre for Instrumental Analysis, Yamaguchi University, Yamaguchi, Japan. The Li2O concentration of Baveno specimen was analyzed using laser-induced breakdown spectroscopy (LIBS, Applied spectra J200-EC) at Gem Research Japan, Osaka, Japan. Operating conditions for EPMA were: accelerating voltage of 15 kV, a beam current of 20 nA and a beam diameter of 1–5 μm. Wavelength-dispersion spectra were collected using LiF, PET and TAP monochromator crystals to identify interfering elements and locate the best wave lengths for background measurements. The abundances of Si, Ti, Al, Cr, V, Fe, Sc, Mn, Mg, Ca, Sr, Ba, Na, K, Ni, Cu, Zn, Sn, Pb, P, F, and Cl were measured. The following standards were used: natural wollastonite (Si, Ca), synthetic KTiPO4 (P, K), synthetic Ca3(VO4)2 (V), synthetic rutile (Ti), synthetic corundum (Al), synthetic eskolaite (Cr), synthetic hematite (Fe), Sc metal (Sc), synthetic tephroite (Mn), synthetic periclase (Mg), synthetic bunsenite (Ni), SrBaNb4O12 (Sr, Ba), albite (Na), orthoclase (K), native copper (Cu), zinc oxide (Zn), cassiterite (Sn), PbVGe-oxide (Pb), synthetic fluorite (F), and synthetic halite (Cl). The Sr, Pb, Cu, P, K, Sn, F and Cl contents, which are not listed in Table 1, are below detection limit. The ZAF method was applied to all elements. Under this conditions, analytical errors are estimated as ±2% for major elements after the reproducibility observed in multiple measurements. Li concentration for separated scandiobabingtonite grain mounted on a glass slide by petropoxy resin were determined using LIBS. The LIBS employed a 266 nm Nd:YAG laser coupled with an optical emission spectrometer. The employed Li peak had a wavelength of 670.706 nm. All analyses were carried out under a He gas flow of 1.0 L min−1 with a laser pulse energy of 2.5 mJ at 10 Hz using a laser beam diameter of 35 μm. The gate delay and pre-ablation times were 0.3 μs and 0.3 s, respectively, and 10 shots were used for calculations. Emission spectra were collected in the 185.177–1050.782 nm spectral range covering the main emission lines of major elements (Na, Ca, Mn, Fe, Sc). NIST SRM 610 and 612 glasses were used as calibration standards covering the Li2O concentration range between 86.5 ppm (NIST 612) and 0.098 wt.% (NIST 610). Under this measurement condition, the analytical errors of Li2O in NIST SRM 610 and 612 were ±3.7% and ±6.5%, respectively, after the reproducibility observed in multiple measurements. Based on these results, the analytical error of Baveno specimen is estimated as ±6%. Cation ratios were normalized as total numbers of cations = 9. The oxidation state of iron was estimated from stoichiometry (total cations = 9 per 14.5 oxygen ions) and charge balance. The average chemical data of Sc-rich babingtonites listed in Table 1 were obtained from the crystals used for the structural analysis.

Table 1.
Chemical compositions of Sc-rich babingtonites.
Sc-rich babingtonite samples were observed by transmission electron-microscopy (TEM) using a JEOL JEM-2010F instrument operated at 200 kV at the Institute for Solid State Physics, University of Tokyo, Tokyo, Japan. Specimens for TEM observation were prepared by a JEOL Ion-Slicer. The holder which allows a specimen tilt angle of ±30° was used for TEM observation. Selected area electron diffraction (SAED) patterns were obtained using an aperture with 10 μm in diameter, being ca. 125 nm in real space. We used the objective aperture with 40 μm in diameter for high resolution TEM image produced by the interference between transmitted and diffracted waves in the 2θ region above 1.9 Å.
X-ray diffraction data for single-crystal of Heftetjern Sc-rich babingtonite (0.11 × 0.08 × 0.07 mm) were collected using a Bruker SMART APEX II CCD diffractometer installed at Shimane University, Shimane, Japan. The crystal was mounted on a glass fiber and intensity data were measured at room temperature using graphite-monochromatized MoKα radiation (λ = 0.71073 Å). Preliminary lattice parameters and an orientation matrix were obtained from twelve sets of frames and refined during the integration process of the intensity data. Diffraction data were collected with ω scans at different φ settings (φ–ω scan) [15]. Data were processed using SAINT [15]. An empirical absorption correction using SADABS [16] was applied. The diffraction data for a single-crystal of Baveno Sc-rich babingtonite (0.08 × 0.06 × 0.045 mm) was collected at room temperature with MoKα radiation using a Rigaku MM007 rotating anode generator equipped with VariMax optics, an AFC10 goniometer and HyPix-6000HE detector at Rigaku Corporation, Tokyo, Japan. Preliminary lattice parameters and an orientation matrix were obtained from six sets of frames and refined during the integration process of the intensity data. The diffraction data were processed using CrysAlisPro [17]. An empirical absorption correction using CrysAlisPro [17] was applied. The reflection statistics and systematic absences were consistent with space groups P1 and P. Subsequent attempts to solve the structure indicated that the observed average structure was centrosymmetric, and for this reason P was the correct space group. Structural refinement was performed using SHELXL-97 [18]. Scattering factors for neutral atoms were employed. Ca was assigned to A1 and A2 and Si to Si1–Si5. Fe was assigned to M1 and Sc to M2. To reduce the correlations among site occupancies, scale factor, and displacement parameters, some occupancies were fixed based on the EPMA data in final refinement. The site occupancies of Si at Si1–Si5 were fixed in both crystals. Because the site scattering factor of A2 in Sc-rich babingtonite was obviously smaller than that of A1, Ca and Na were, thus, assigned to A2 based on chemical data. The hydrogen position of the hydroxyl group was derived from difference-Fourier syntheses. Subsequently, the hydrogen position was refined with a fixed value of Uiso = 0.05 Å2, and with a bond distance restraint of O–H = 0.980(1) Å [19].
In order to validate the refined structures, the charge distribution (CD) analysis was applied following Nespolo et al. [20,21] and Nespolo [22]. The method exploits the experimental bond distances to compute a non–integer coordination number (effective coordination number, ECoN: Hoppe [23]), and distributes the formal oxidation number, q, of each atom among all its bonds as a function of ECoN. By labelling the computed charges with Q, the q/Q ratio for the cations is the internal criterion for such evaluation [20,21,22].
3. Results
3.1. Chemical Compositions of Sc-Rich Babingtonite
The average compositions of Sc-rich babingtonite are given in Table 1, in which the total number of cations, except H ion, was normalized to 9, and the Fe2+ and Fe3+ recalculated from stoichiometry. The Heftetjern scandiobabingtonite is rich in Sc2O3 (13.78 wt.%) and poor in FeO (8.63 wt.%) compared to that reported by Raade and Erambert [5] from the same locality (11.06 wt.% Sc2O3 and 9.78 wt.% FeO). Our studied crystal is characterized by small amount of sodium (~1.26 wt.% Na2O). The average formula of Heftetjern scandiobabingtonite is (Ca1.83Na0.14)Σ1.97(Sc3+1.12Fe2+0.65Mn2+0.21Mg0.03Fe3+0.02)Σ2.03Si5.00O14(OH). The oxidation state of iron is assumed to be mostly ferrous based on the charge-balance calculation. Although the oxidation state of octahedral cations in babingtonite-group minerals is in general Me2+:Me3+ = 1:1, trivalent cations in the studied scandiobabingtonite reached ca. 1.14 apfu. This excess of trivalent cations must be counterbalanced by monovalent Na substituted for Ca: Ca2+ + Fe2+ ↔ Na+ + Sc3+.
The chemical formula of Baveno Sc-rich babingtonite on a basis of its average composition. (Table 1) is (Ca1.81Na0.17)Σ1.98(Sc3+0.70Fe2+0.49Mn2+0.36Fe3+0.39Sn0.05Al0.03Mg0.01Li0.01)Σ2.04Si4.98O14(OH), which is characterized by significant Na and Sn contents. Similar chemical characteristics of scandiobabingtonite from Baveno were reported by Orlandi et al. [4], but our specimen has higher Fe (11.13 wt.% as FeO) and lower Sc contents (8.44 wt.% Sc2O3) rather than that studied by Orlandi et al. [4] (8.93 wt.% as FeO and 11.32 wt.% Sc2O3). The Li2O content in Baveno crystal is very low (0.03 wt.%). Iron in the Heftetjern specimen is expected to be almost pure Fe2+, while the Fe2+/(Fe2+ + Fe3+) ratio of the Baveno one is estimated as 0.56 based on the charge-balance calculation.
3.2. TEM Observation
Figure 2 shows HRTEM and SAED images of Sc-rich babingtonite from Heftetjern (Figure 2a,b) and Baveno (Figure 2c,d) specimens. Several fragments were observed in each specimen. The lattice fringes were clearly confirmed, and no stacking faults are found in both specimens (Figure 2a,c). Although the existence of stacking faults is not completely denied, the studied specimens are characterized as well-crystalline and single phase, and in general, they do not contain other pyroxenoids with different chain periodicity, which were often found in pyroxenoid group minerals. In fact, the intergrowth of scandiobabingtonite and cascandite was reported in the Heftetjern specimen by Raade and Erambert [5] though it was not observed in our specimen from the same locality. In electron diffraction images (Figure 2b,d), satellite reflections were not observed.
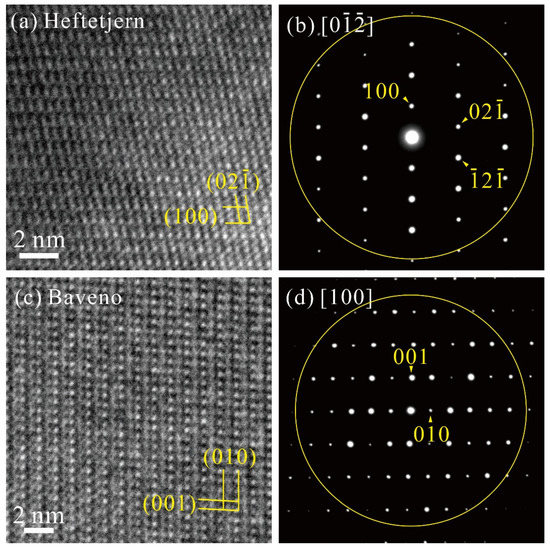
Figure 2.
Transmission electron microscopic (TEM) images of Sc-rich babingtonite for Heftetjern (a,b) and Baveno (c,d) specimens. HRTEM images (a,c) and SAED pattern (b,d) are presented for each specimen. The rings (d ≈ 1.9 Å) in SAED patterns show the objective lens aperture used for HRTEM.
3.3. Crystal Structure Solution and Refinements
Crystallographic data and refinement parameters are summarized in Table 2. Structural refinements converged to R1 = 3.29% for Heftetjern specimen and 3.65% for Baveno specimen. The refined atomic positions and anisotropic displacement parameters are listed in Table 3 and Table S1. The interatomic distances and distortions of octahedral sites are presented in Table 4, and the selected angles in Table S2. In Table 2, Table 3, Table 4 and Table 5, Tables S1 and S2, estimated standard deviations are represented in parentheses (1σ). The octahedral distortion shown in Table 4 was estimated using the functions defined by Baur [24] and Robinson et al. [25]. The crystal structure of Sc-rich babingtonite is shown in Figure 3 drawn with VESTA3 [26]. The site occupancies of the M1 and M2 sites are listed in Table 5. The procedure to determine the cation distributions are mentioned in the discussion section. Tables S3 and S4 show the results by the CD analysis using the CHARDI–2015 program [22]. The calculated ECoN(ij) for cation sites is listed in Table S3. The σ value of Heftetjern and Baveno specimens are 1.4 and 1.3% for PC (ij) and 3.7 and 3.3% for V(rs), respectively (Table S4), which ensured validity of the refined structures.
Table 2.
Data collection and details of structure refinements.
Table 3.
Refined site occupancies at A and M sites, atomic positions and isotropic displacement parameters (Å2).
Table 4.
Selected bond distances (Å), volumes of polyhedra (Å3) and deformation parameters for octahedra *1.
Table 5.
Cation distribution and estimated bond distances at the M1 and M2 sites.
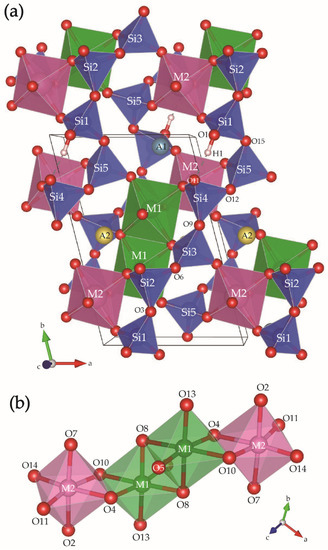
Figure 3.
The crystal structure of Sc-rich babingtonite (a) and the topology of octahedra (b) drawn with VESTA3 [26].
4. Discussion
4.1. Determination of Cation Distributions at the Octahedral Sites and the Large Polyhedra in the Heftetjern and Baveno Sc-Rich Babingtonite
Based on the published studies of babingtonite and manganbabingtonite [7,8,9,10], divalent cations, such as Mn2+ and Mg, are assigned to M1, and small Al3+ ions to M2, and the Fe ions are added until both M1 and M2 are full. Moreover, the previous 57Fe Mössbauer studies, cited above, repeatedly resulted in the exclusive occupancy of ferrous and ferric ions at M1 and M2, respectively. Thus, the cation assignment has been interpreted that the octahedral divalent and trivalent cations order at M1 and M2, respectively. However, the Sc content of the Heftetjern scandiobabingtonite is more than 1 apfu, indicating that Sc ions are present at both octahedral M1 and M2 sites. In addition, since the ionic radius of VISc3+, 0.745 Å [12], is smaller than that of Fe2+, 0.78 Å, but larger than Mg2+, 0.72 Å, the presence of Sc3+ ions at M1 and M2 implies that divalent cations not only occupy M1 but can also be present at M2. The assignment of octahedral cations, which used to be applied for babingtonite and manganbabingtonite is not valid for that of scandiobabingtonite. Based on above consideration, we calculated the site populations at M1 and M2 in the Heftetjern babingtonite as follows: (1) elements with <0.02 apfu in chemical analysis were omitted; (2) the sum of cations at the octahedral sites, such as Mn2+, Mg, Sc3+, Al3+ and Fe, was normalized to two based on the ideal formula; (3) based on the ionic radii, Mn2+ and Al3+ are assigned to M1 and M2, respectively; (4) the abundance of Fe and Sc at M1 and M2 was estimated based on the site-scattering values at each site; (5) the Fe2+:Fe3+ ratio was calculated based on the charge neutrality, and Fe2+ was assigned to M1 and both Fe2+ and Fe3+ to M2. Finally, the site populations at M1 and M2 are given as Sc3+0.42Fe2+0.37Mn2+0.21 and Sc3+0.68Fe2+0.27Mg0.03Fe3+0.02 in apfu, respectively (Table 5). The site-scattering values calculated from the resulting site populations are 23.70 and 22.18 epfu (number of electron), respectively, which are consistent with the observed site-scattering values at M1 and M2, 23.71(3) and 22.17(4) epfu, respectively (Table 5), derived from the refined site occupancies, 0.912 Fe at M1 and 1.056 Sc at M2 (Table 3).
The site populations of the Baveno Sc-rich babingtonite in the present study were also derived essentially in the same way as above. However, Sn4+ was assigned to M2, because of its rather small ionic radius, 0.69 Å after Shannon [12]. The resulting site populations at M1 and M2 are Sc3+0.43Mn2+0.36Fe2+0.21 and Fe3+0.36Fe2+0.30Sc3+0.26Sn4+0.05Al0.03 apfu, respectively. In contrast to the results of Baveno babingtonite by Orlandi et al. [4], the site-scattering values at M1 and M2 calculated from the chemically determined site populations, 23.49 and 25.51 epfu, respectively, are reasonably close to the observed site-scattering values at M1 and M2, 23.76(5) and 25.60(6) epfu, respectively (Table 5), derived from the refined site occupancies, 0.914 Fe at M1 and 1.219 Sc at M2 (Table 3). Although it is noted that the site-scattering value calculated from chemical analysis, 48.65 epfu, deviates somewhat from that derived from the refined occupancy, 49.36 epfu (Table 5), its reason may be attributed to the chemical heterogeneity and the presence of Sn4+ in this specimen.
The determined site occupancy at M1 and M2 in this study seems to be deviated from the definition of the babingtonite-group minerals including scandiobabingtonite, Ca2M1Fe2+M2Sc3+Si5O14(OH). The dominant-valency rule here should be applied instead of the dominant-end-member approach after the recommendation of the IMA-CNMNC [27]. In general, the divalent cations, Me2+ (=Fe2, Mn2+), predominantly occupy M1, and M2 are occupied by trivalent cations, Me3+ (= Fe3+, Sc3+) in the structures of the babingtonite-group minerals. In both specimens, the Me3+ ions preferentially occupy the smaller M2 octahedra in the both specimens (0.70 = 0.68Sc3+ + 0.02Fe3+ in the Heftetjern specimen, and 0.65 = 0.36Fe3+ + 0.26Sc3+ + 0.03 Al in the Baveno one). Furthermore, based on the cation occupancy at M1 (Table 5), Me2+ (0.58 = 0.37Fe2+ + 0.21Mn2+ in the Heftetjern specimen, and 0.57 = 0.36Mn2+ + 0.21Fe2+ in Baveno one) is still dominant compared to Me3+ in both specimens despite the dominant cations at each M1 and M2 are Sc3+ and Sc3+ in the Heftetjern specimen, and Sc3+ and Fe3+ in the Baveno one. The Heftetjern specimen having 0.37Fe2+ > 0.21Mn2+ at M1 and the dominant Sc3+ at M2 is defined as scandiobabingtonite. On the other hand, in the Baveno specimen, since the Me2+ ion predominant in M1 is Mn2+ (0.36Mn2+ > 0.21Fe2+) and M2 is preferentially occupied by Fe3+, it is thus classified as manganbabigntonite despite the Sc-enriched characteristics. If for our Baveno sample, 0.2 Fe2+ is shifted from M2 to M1, and correspondingly 0.2 Sc3+ from M1 to M2, manganbabingtonite would become scandiobabingtonite. However, the calculated site scattering leads to M1: 24.49 epfu and M2: 24.51 epfu, and these values are not in agreement with the observed scattering values (Table 5). Thus, we regard this hypothetical assignment as unfavorable for our specimen. The Fe2+/(Fe2++Fe3+) ratio of Baveno scandiobabingtonite studied by Orlandi et al. [4] was 0.96 [=0.65Fe2+/(0.65Fe2++0.03Fe3+) apfu based on their formula)] compared to 0.56 in this study. The high Sc and slight less Mn contents with Fe2+/(Fe2++Fe3+) ratio in their crystal compared to ours may also lead their sample to scandiobabingtonite. Based the data of Orlandi et al. [4] and our new data, it is possible the three minerals such as babingtonite, scandiobabingtonite and manganbabingtonite coexist in Baveno.
The validity of the determined site occupancy in this study was examined in terms of interatomic distances estimated from the determined occupancies using the bond valence parameters [28,29]. As shown in Table 5, since the estimated <M1–O> and <M2–O> distances for the Heftetjern specimen are 2.139 and 2.113 Å, respectively, the estimated <M2–O> distance is similar to the observed one, 2.109 Å, whereas the estimated <M1–O> distance is slightly shorter than the observed one, 2.161 Å. This small difference may be caused by the chemical variation due to Fe3+ ↔ Sc3+ substitution. In Baveno specimen, the estimated <M1–O> and <M2–O> distances are 2.146 Å and 2.074 Å, respectively (Table 5), and, thus, both are slightly shorter than those of observed ones (<M1–O> = 2.163 Å and <M2–O> = 2.092 Å). After all, in spite of slight differences between the estimated <M1–O> and <M2–O> distances and the calculated ones, the determined site populations are reasonably consistent with the observed interatomic distances.
The refined site-scattering value of A2 was obviously smaller than that of A1. A1 turned out to be fully occupied by Ca. Thus, additional Na ions were assigned to A2, and the refined site occupancies at A2 were determined as Ca0.879(5)Na0.121 for the Heftetjern specimen and Ca0.819(8)Na0.181 for the Baveno one (Table 3), which are consistent with the chemical composition (Table 1).
4.2. Cation Distribution and Structural Variation
The unit-cell parameters of babingtonite-group minerals are influenced by the cation distribution at both M1 and M2 [10]. In general, the unit-cell volume is 559–562 Å3 for babingtonite and 564 Å3 for manganbabingtonite (e.g., Armbruster [30]; Nagashima et al. [10]). The unit-cell volume of scandiobabingtonite and Sc-rich babingtonite ranging from 573 to 576 Å3 (Table 2 and Orlandi et al. [4]) is larger than that of babingtonite and manganbabingtonite, indicating that the effect of Sc3+ (r = 0.745 Å) substitution for Fe3+ (r = 0.645 Å) at M2 is significant.
The structural variation of babingtonite and manganbabingtonite is mainly due to the Me2+ substitution at M1 because M2 is mainly occupied by Fe3+. On the other hand, in Sc-rich babingtonite, the relationship between cation distribution and structural variation is more complicated because the cation substitution occurs at both M1 and M2. The <M2–O> distance of Sc-rich babingtonite (2.109 Å for Heftetjern and 2.092 Å for Baveno) is longer than that of babingtonite, 2.03–2.05 Å [6,10,11,30,31]. The M2–Oi distances almost isotropically expand, and such M2O6 expansion also leads to the lengthened O4–O10 edge shared between the M1O6 and M2O6 octahedra (Figure 3b). The O4–O10 edge is 2.89 Å for Heftetjern and 2.87 Å for Baveno whereas that in babingtonite and manganbabingtonite ranges 2.80–2.84 Å. It also leads to the increase of the M1–O4 distance of Sc-rich babingtonite showing out of trend in Figure 4 despite the other M1–Oi distances increase with increasing mean ionic radius of M1 as well as in babingtonite. Thus, the increase of M1–O4 is influenced by M2O6 expansion. The expansion of M2O6 also causes the stronger angular distortion of M2O6 (Figure 5 and Table 4). In contrast, the angular distortion of M1O6 of Sc-rich babingtonite is smaller than that of babingtonite (Figure 5). This can be explained by the increase of O4–M1–O10 angle and decrease of the O4–M1–O8 angle with the lengthened O4–O10 edge (Figure 3b). All oxygen atoms of both M1O6 and M2O6 octahedra are shared with SiO4-tetrahedra consisting of an undulated chain. The topology of the babingtonite-group minerals is restrained by the undulated chain. The structural variations observed in the crystal structure of Sc-rich babingtonite occur in order to compensate for structural strain caused by the expansion of M2O6 octahedra. Although the Na substitution for Ca at A2 was observed in this study, its effect cannot be evaluated because the cation variation at the octahedral sites is more pronounced.
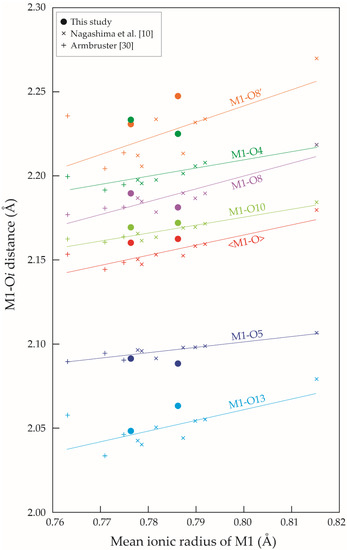
Figure 4.
Variation of M1–Oi distance (Å) as a function of mean ionic radii of M1 (Å). For the Heftetjern specimen, errors (1σ) are smaller than the symbols size. Errors (1σ) of Baveno specimen are almost same as size of symbols [10,30].
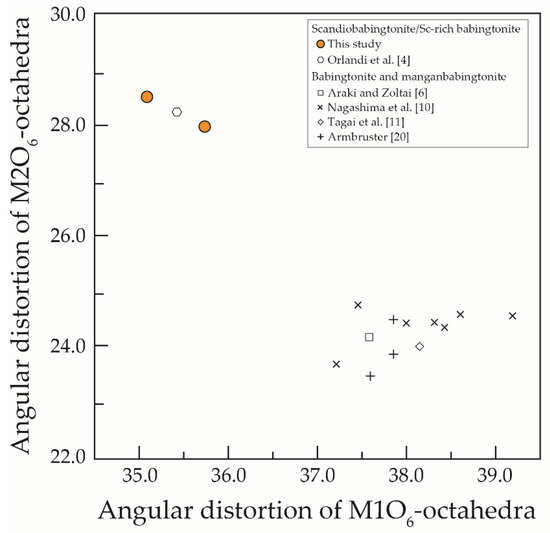
Figure 5.
Relationship between angular distortion [25] between M1O6 and M2O6. Definition of angular deformation was given in the footnote of Table 4. For our studied specimens, errors (3σ) are smaller than the symbol size [4,6,10,11,20].
The influence of cation distribution at M1 and M2 for the variation of Si–O–Si angles within the undulated silicate chain was reported by Nagashima et al. [10]. It is also confirmed in the present study. The Si–O–Si angles are listed in Table S2. The variation of the M1O6 octahedra leads to the change of connected angles among the Si2O4–Si3O4–Si4O4 tetrahedra (Figure 3a). On the other hand, the connected angles between Si1O4–Si2O4 tetrahedra and between Si4O4–Si5O4 tetrahedra are influenced by the variation of M2O6 [10]. Manganbabingtonite having significant Mn2+ at M1 showed the lager Si2–O6–Si3 and Si3–O9–Si4 angles than the others (see Table 6 in Nagashima et al. [10]). In case of Sc-rich babingtonite, the Si1–O3–Si2 and Si4–O12–Si5 angles (Si1–O3–Si2 = 139.1–139.8° and Si4–O12–Si5 = 133.2–132.4° in this study) are greater than those in babingtonite and manganbabingtonite, Si1–O3–Si2 = 136–137° and Si4–O12–Si5 = 131–132° [6,10,30,31], due to Sc3+ at M2.
The hydrogen bond connects the open side of the C-shaped triplet consisting of the Si1, Si5, and Si4 tetrahedral sites (Figure 3a). The O1–H1···O11 separation, 2.57–2.58 Å, in this study is supported by that reported by previous studies [4,6,10,11,30,31]. Although the cation distribution affects the nature of SiO4-chains as mentioned above, it has no influence on the distance of the very strong hydrogen-bond, which is typically observed in hydrous pyroxenoids with 3- and 5-periodic chains [32].
Supplementary Materials
The following supporting information can be downloaded at: https://www.mdpi.com/article/10.3390/min12030333/s1, Table S1: Anisotropic displacement parameters (Å2), Table S2: Selected bond angles (°), Table S3: Calculated effective coordination number, ECoN(ij), for cation sites, Table S4: Results of charge distribution analyses.
Author Contributions
M.N.: Conceptualization, Methodology, Investigation, Formal analysis (EPMA, SXRD), Writing-original draft. D.N.-H.: Formal analysis (TEM), Writing-review and editing. C.F.: Formal analysis (LIBS), Writing-review and editing. T.M.: Formal analysis (SXRD), Writing-review and editing. All authors have read and agreed to the published version of the manuscript.
Funding
This research was funded by Grand-in-Aid for Scientific Research from Japan Society for the Promotion of Science, grant number 18K03782.
Acknowledgments
Our thanks to M. Akasaka and T. Armbruster for their comments on this manuscript; to Y. Maki (Rigaku Corporation) for his arrangement to use RIGAKU HyPix-6000HE, to V. Malogajski for his technical assistance for optical photograph; and to Kristiansen for supplying us with the Heftetjern scandiobabingtonite specimen. The TEM session was performed at the facilities of the Institute for Solid State Physics, University of Tokyo (project No. BG19).
Conflicts of Interest
The authors declare no conflict of interest.
References
- Wise, W.S.; Moller, W.P. Occurrence of Ca-Fe silicate minerals with zeolites in basalt cavities at Bombay, India. Eur. J. Miner. 1990, 2, 875–883. [Google Scholar] [CrossRef]
- Burns, G.R.; Dyar, M.D. Crystal chemistry and Mössbauer spectra of babingtonite. Am. Miner. 1991, 76, 892–899. [Google Scholar]
- Vinogradova, R.A.; Sychkoba, V.A.; Kabalov, Y.K. Manganiferous babingtonite from the Rudnyi Kaskad deposit, Eastern Sayan. Dokl. Acad. Nauk. SSSR 1966, 169, 434–437. [Google Scholar]
- Orlandi, P.; Pasero, M.; Vezzalini, G. Scandiobabingtonite, a new mineral from the Baveno pegmatite, Piedmont, Italy. Am. Miner. 1998, 83, 1330–1334. [Google Scholar] [CrossRef]
- Raade, G.; Erambert, M. An intergrowth of scandiobabingtonite and cascandite from the Heftetjern granite pegmatite, Norway. N. Jb. Miner. Mh. 1999, 1999, 545–550. [Google Scholar]
- Araki, T.; Zoltai, T. Crystal structure of babingtonite. Z. Kristallogr. 1972, 135, 355–375. [Google Scholar] [CrossRef]
- Amthauer, G. 57Fe Mössbauer study of babingtonite. Am. Miner. 1980, 65, 157–162. [Google Scholar]
- Amthauer, G.; Rossman, G.R. Mixed valence of iron in minerals with cation clusters. Phys. Chem. Miner. 1984, 11, 37–51. [Google Scholar] [CrossRef]
- Akasaka, M.; Kimura, T.; Nagashima, M. Rietveld and 57Fe Mössbauer study of babingtonite from Shimane Peninsula, Japan. J. Miner. Pet. Sci. 2013, 108, 121–130. [Google Scholar] [CrossRef]
- Nagashima, M.; Mitani, K.; Akasaka, M. Structural variation of babingtonite depending on cation distribution at the octahedral sites. Miner. Pet. 2014, 108, 287–301. [Google Scholar] [CrossRef]
- Tagai, T.; Joswig, W.; Fuess, H. Neutron diffraction study of babingtonite at 80 K. Miner. J. 1990, 15, 8–18. [Google Scholar] [CrossRef][Green Version]
- Shannon, R.D. Revised effective ionic radii and systematic studies of interatomic distances in halides and chalcogenides. Acta Cryst. 1976, A32, 751–767. [Google Scholar] [CrossRef]
- Kristiansen, R. A unique assemblage of scandium-bearing minerals from the Heftetjern-pegmatite, Tørdal, south Norway. In Proceedings of the Kongsberg Mineral Symposium, Norsk Bergverksmuseum Skirift, Kongsberg, Norway, 23 May 2009; Volume 41, pp. 75–104. [Google Scholar]
- Gramaccioli, C.A.; Campostrini, I.; Orlandi, P. Scandium minerals in the miaroles of granite at Baveno, Italy. Eur. J. Miner. 2004, 16, 951–956. [Google Scholar] [CrossRef]
- Bruker SMART and SAINT-Plus; Versions 6.01; Bruker AXS Inc.: Madison, WI, USA, 1999.
- Sheldrick, G.M. SADABS, Program for Area Detector Adsorption Correction; University of Göttingen: Göttingen, Germany, 1996. [Google Scholar]
- Matsumoto, T.; Yamano, Y.; Sato, T.; Ferrara, J.D.; White, F.J.; Meyer, M. “What is this?” a structure analysis tool for rapid and automated solution of small molecule structures. J. Chem. Crystallogr. 2021, 51, 438–450. [Google Scholar] [CrossRef]
- Sheldrick, G.M. Crystal structure refinement with SHELXL. Acta Crystallogr. Sect. C Struct. Chem. 2015, C71, 3–8. [Google Scholar] [CrossRef]
- Franks, F. (Ed.) Water: A Comprehensive Treatise. Vol. 2, Water in Crystalline Hydrates Aqueous Solutions of Simple Nonelectrolytes; Plenum Press: New York, NY, USA, 1973; p. 648. [Google Scholar]
- Nespolo, M.; Ferraris, G.; Ohashi, H. Charge distribution as a tool to investigate structural details: Meaning and application to pyroxenes. Acta Crystallogr. Sect. B Struct. Sci. 1999, B55, 902–916. [Google Scholar] [CrossRef]
- Nespolo, M.; Ferraris, G.; Ivaldi, G.; Hoppe, R. Charge distribution as a tool to investigate structural details. II. Extension to hydrogen bonds, distorted and hetero–ligand polyhedra. Acta Crystallogr. Sect. B Struct. Sci. 2001, B57, 652–664. [Google Scholar] [CrossRef]
- Nespolo, M. Charge distribution as a tool to investigate structural details. IV. A new route to heteroligand polyhedra. Acta Crystallogr. Sect. B 2016, B72, 51–66. [Google Scholar] [CrossRef]
- Hoppe R, Effective coordination numbers (ECoN) and mean fictive ionic radii (MEFIR). Z. Kristallogr. 1979, 150, 23–52. [CrossRef]
- Baur, H. The geometry of polyhedral distortions. Predictive relationships for the phosphate group. Acta Crystallogr. Sect. B 1974, B30, 1195–1215. [Google Scholar] [CrossRef]
- Robinson, K.; Gibbs, G.V.; Ribbe, P.H. Quadratic elongation: A quantitative measure of distortion in coordination polyhedral. Science 1971, 172, 567–570. [Google Scholar] [CrossRef] [PubMed]
- Momma, K.; Izumi, F. VESTA 3 for three-dimensional visualization of crystal, volumetric and morphology data. J. Appl. Crystallogr. 2011, 44, 1272–1276. [Google Scholar] [CrossRef]
- Bosi, F.; Hatert, F.; Hålenius, U.; Pasero, M.; Miyawaki, R.; Mills, S. On the application of the IMA-CNMNC dominant-valency rule to complex mineral compositions. Miner. Mag. 2019, 83, 627–632. [Google Scholar] [CrossRef]
- Brown, I.D.; Altermatt, D. Bond-valence parameters obtained from a systematic analysis of the inorganic crystal structure database. Acta Crystallogr. Sect. B 1985, B41, 244–247. [Google Scholar] [CrossRef]
- Brese, N.E.; O’Keeffe, M. Bond-valence parameters for solids. Acta Crystallogr. Sect. B Struct. Sci. 1991, B47, 192–197. [Google Scholar] [CrossRef]
- Armbruster, T. Cation distribution in Mg, Mn-bearing babingtonite from Arvigo, Val Calanca Grisons, Switzerland. Schweiz. Miner. Petrog. Mitt. 2000, 80, 279–284. [Google Scholar]
- Kosoi, A.L. The structure of babingtonite. Sov. Phys. Crystallogr. 1976, 20, 446–451. [Google Scholar]
- Nagashima, M.; Armbruster, T. Saneroite: Chemical and structural variations of manganese pyroxenoids with hydrogen bonding in the silicate chain. Eur. J. Miner. 2010, 22, 393–402. [Google Scholar] [CrossRef]


Publisher’s Note: MDPI stays neutral with regard to jurisdictional claims in published maps and institutional affiliations. |
© 2022 by the authors. Licensee MDPI, Basel, Switzerland. This article is an open access article distributed under the terms and conditions of the Creative Commons Attribution (CC BY) license (https://creativecommons.org/licenses/by/4.0/).