Article

Method for Identifying and Forecasting Mining-Induced Earthquakes Based on Spatiotemporal Characteristics of Microseismic Activities in Fankou Lead/Zinc Mine

School of Resources and Safety Engineering, Central South University, Changsha 410083, China
*
Author to whom correspondence should be addressed.
Minerals 2022, 12(3), 318; https://doi.org/10.3390/min12030318
Submission received: 5 January 2022 / Revised: 24 February 2022 / Accepted: 1 March 2022 / Published: 3 March 2022

Abstract

:
The risks associated with underground mining at Fankou Lead/Zinc Mine in South China are growing due to the large-scale mining activities there. To recognize mining-induced earthquakes and assess the risk per mining level, a microseismic monitoring system, which is used to record microseismic events, is installed at multiple mining levels in Fankou Lead/Zinc Mine. The purpose of this study is to identify mining-induced earthquakes and to evaluate the risk per mining level by analyzing the spatiotemporal characteristics of microseismic activities in the Fankou Lead/Zinc Mine. In this study, the Gutenberg-Richter (G-R) relationship is applied to compute the b-value, which is used to obtain the maximum magnitude (M (max)) of microseismic event that probably occurs at each mining level. Then, the evaluation of the recurrence period for M (max) and the probability of the microseismic event with the magnitude M (max) is carried out and the M (max) at each mining level is determined based on the recording period of microseismic events. The results show that factors such as the maximum rock vibration velocity, source parameters, displacement, microseismic waveform and energy ratio (ES/EP) can be used to distinguish whether a recorded microseismic event is mining-induced earthquake. Additionally, we propose a method to assess the possibility of mining-induced earthquake at each mining level based on M (max) and predict the recurrence time of microseismic event with the magnitude M (max). The of two years results of microseismic events monitoring demonstrate that the current study is promising for identifying mining-induced earthquakes, assessing the risk of mining-induced earthquakes, predicting the potential maximum microseismic event in a region and estimating its recurrence period and its probability in the Fankou Lead/Zinc Mine.

1. Introduction

The rock integrity in underground mines will decrease seriously once the excavation of the ore body begins [1,2,3]. With the expansion of mining activities, rock failures occur more frequently and seriously influence the safety of underground engineering projects. Most of the rock failures in underground mines stem from the instability of the surrounding rock mass, which means the stability of the surrounding rock mass plays a crucial role in underground mining [4,5,6]. Because of this, the prediction and early warning of rock failures should refer to the stability of the rock mass. To ensure the safety of underground mining projects, it has become ever more necessary to monitor and assess the stability of the surrounding rock mass in recent years. If a potential rock failure can be found early, proper preventive measures can be taken in time. That is to say, the successful prediction of rock failures and implementation of control measures can not only ensure the safety of the mining project but also effectively reduce economic losses. A mining-induced earthquake is one of the most common rock failures in underground mines, which often causes the collapse of local surrounding rock and may result in considerable destruction. It is well known that the sources of mining-induced earthquakes are shallow and the resulting surface wave is complex [7,8]. A mining-induced earthquake is a small-magnitude earthquake caused by the instability of rock masses due to mining activities and other excavation activities [9]. Compared with the general microseismic events, mining-induced earthquakes are of larger magnitude in underground mines and often cause problems that are difficult to solve. Up to now, mining-induced earthquakes have been reported in hard coal mines, ore deposits and natural gas deposits [10,11,12,13]. However, though a lot of studies on rock failures in underground mines have been conducted, there has been a limited number of studies focusing on identifying and warning people of mining-induced earthquakes [14].
Deformation information is vital to the analysis of rock mass stability, which can be used to predict and warn about rock failures early on, such as mining-induced earthquakes. When microcracks in rock masses are developing, the rock will release elastic waves. Those elastic waves can be effectively monitored by microseismic monitoring systems. Therefore, these systems are widely used to monitor the stability of rock masses in underground engineering projects to ensure production and construction safety, such as in the fields of road and railway transportation, hydropower engineering, safety monitoring of energy storage, mining resource development and nuclear power [15,16,17,18,19].
Real-time monitoring is a major advantage of microseismic monitoring system, meaning large amounts of information concerning the whole process of rock mass development can be recorded. Accordingly, many mines have been equipped with microseismic monitoring systems in China [20,21,22,23,24,25,26]. In underground mines, microseismic events are caused by many factors, including blasting vibrations, the energy-release process of rock crack propagation, mechanical vibrations and other energy-release processes. Thus, an important challenge here is to identify mining-induced earthquakes from all microseismic events. The purpose of identifying mining-induced earthquakes is to prevent and control engineering accidents as much as possible. Compared with the other microseismic events, mining-induced earthquakes are more destructive. At present, more and more mines face a greater risk of mining-induced earthquakes. Although many works that concerning the identification and prediction of rock failures have had a considerable impact on underground mining accidents, only a few focused on mining-induced earthquakes and there is no general method has been developed for the identification and prediction of mining-induced earthquakes so far [21,23,27,28,29,30,31,32]. Therefore, more studies are required to solve this problem, which sets the scene for this work. In this article, a microseismic monitoring system is used to record microseismic events in the Fankou Lead/Zinc Mine. Based on two-year statistical results of microseismic events in the Fankou Lead/Zinc Mine, the current work studies how to identify mining-induced earthquakes and chart their characteristic performance for early warning purposes. To achieve that, we studied various characteristics of microseismic indexes and microseismic activity levels before tracking the occurrence of mining-induced earthquakes. The purpose of the study, focusing on the characteristic microseismic performance of mining-induced earthquakes, was to identify mining-induced earthquakes, predict their probability, assess the risk level of the target mining area and predict the recurrence period of maximum-magnitude microseismic events at each mining level in the Fankou Lead/Zinc Mine.

2. Engineering Background

2.1. Geological Structure

The Fankou Lead/Zinc Mine is located in Shaoguan City, Guangdong Province, China. Paleozoic Cambrian, Devonian, Carboniferous and Permian strata are exposed in the mining area [33]. The limestone (D2db) of the upper subformation of the Donggangling Formation in the Middle Devonian system and the impure carbonate (D3t) of the Tianziling Formation in the Upper Devonian system are the main ore-bearing strata, followed by the Carboniferous system [34].
The fault structure of the mining area is extremely developed, as shown in Figure 1 [35,36]. It can be seen from Figure 1 that fault F3 is the main fault controlling the mining area. The F3 fault is a major dislocation structure in this mining area; it is a reverse fault with right-lateral displacement. The fault strike of the F3 fault runs from the north-northwest to the north-northeast. The strike and dip of the F3 fault are 73~101° and 60~84°, respectively. The width of the fault fluctuates from 0.2 m to 3.0 m, and it is filled with a considerable amount of surrounding rock breccia and ore breccia [37].

2.2. Mining Situation

The ore bodies of the Fankou Lead/Zinc Mine are mainly distributed in two different gradients, with the F3 fault in the stratum forming the boundary [39]. The main ore body in the shallow mining area is located in the hanging wall of the main control fault F3, with a burial depth from 200 m to 550 m [40]. The main ore body in the deep mining area is located in the footwall of the F3 fault, with a burial depth from 580 m to 880 m. The ore body is massive, and the surrounding rock mass is limestone. Only a few of the shallow ore bodies have not been mined due to collapse. At present, the ore bodies in deep mine are the main mining target. At the same time, the mining environment changes greatly with the increasing mining depth and more complex problems arise, such as high stresses, high temperatures and high osmotic pressures. Because of that, the risks of mining-induced earthquakes have risen considerably in the Fankou Lead/Zinc Mine. In response to these problems, it is of great importance to assess the stability of the surrounding rock mass in this mine and propose a method to identify and predict potential mining-induced earthquake events in Fankou Lead/Zinc Mine by utilizing microseismic data recorded by the microseismic monitoring system.

2.3. Physical and Mechanical Properties of the Ore Body and Rock

The physical and mechanical properties of the rock are an important reference for the stability of the surrounding rock mass in underground mining engineering. Seven types of rock are closely related to the stability of mining engineering in Fankou Lead/Zinc Mine. Tests were conducted on intact rock samples with dimensions (length × diameter) of 100 × 50 mm2 and 50 × 50 mm2. The rock types and test results are listed in Table 1 (more details about the rock mass classification are shown in supplementary materials Table S1).

3. Microseismic Monitoring System

3.1. Microseismic Monitoring System Configuration

The research of Lynch [41] indicates that geophones are more sensitive than accelerometers to microseismic events of a lower frequency range, as well as more reliable. The microseismic monitoring system must follow certain installation principles, such as meeting the requirements of the mine monitoring range, costing a reasonable amount, creating low surrounding noise and requiring a relatively stable rock mass [
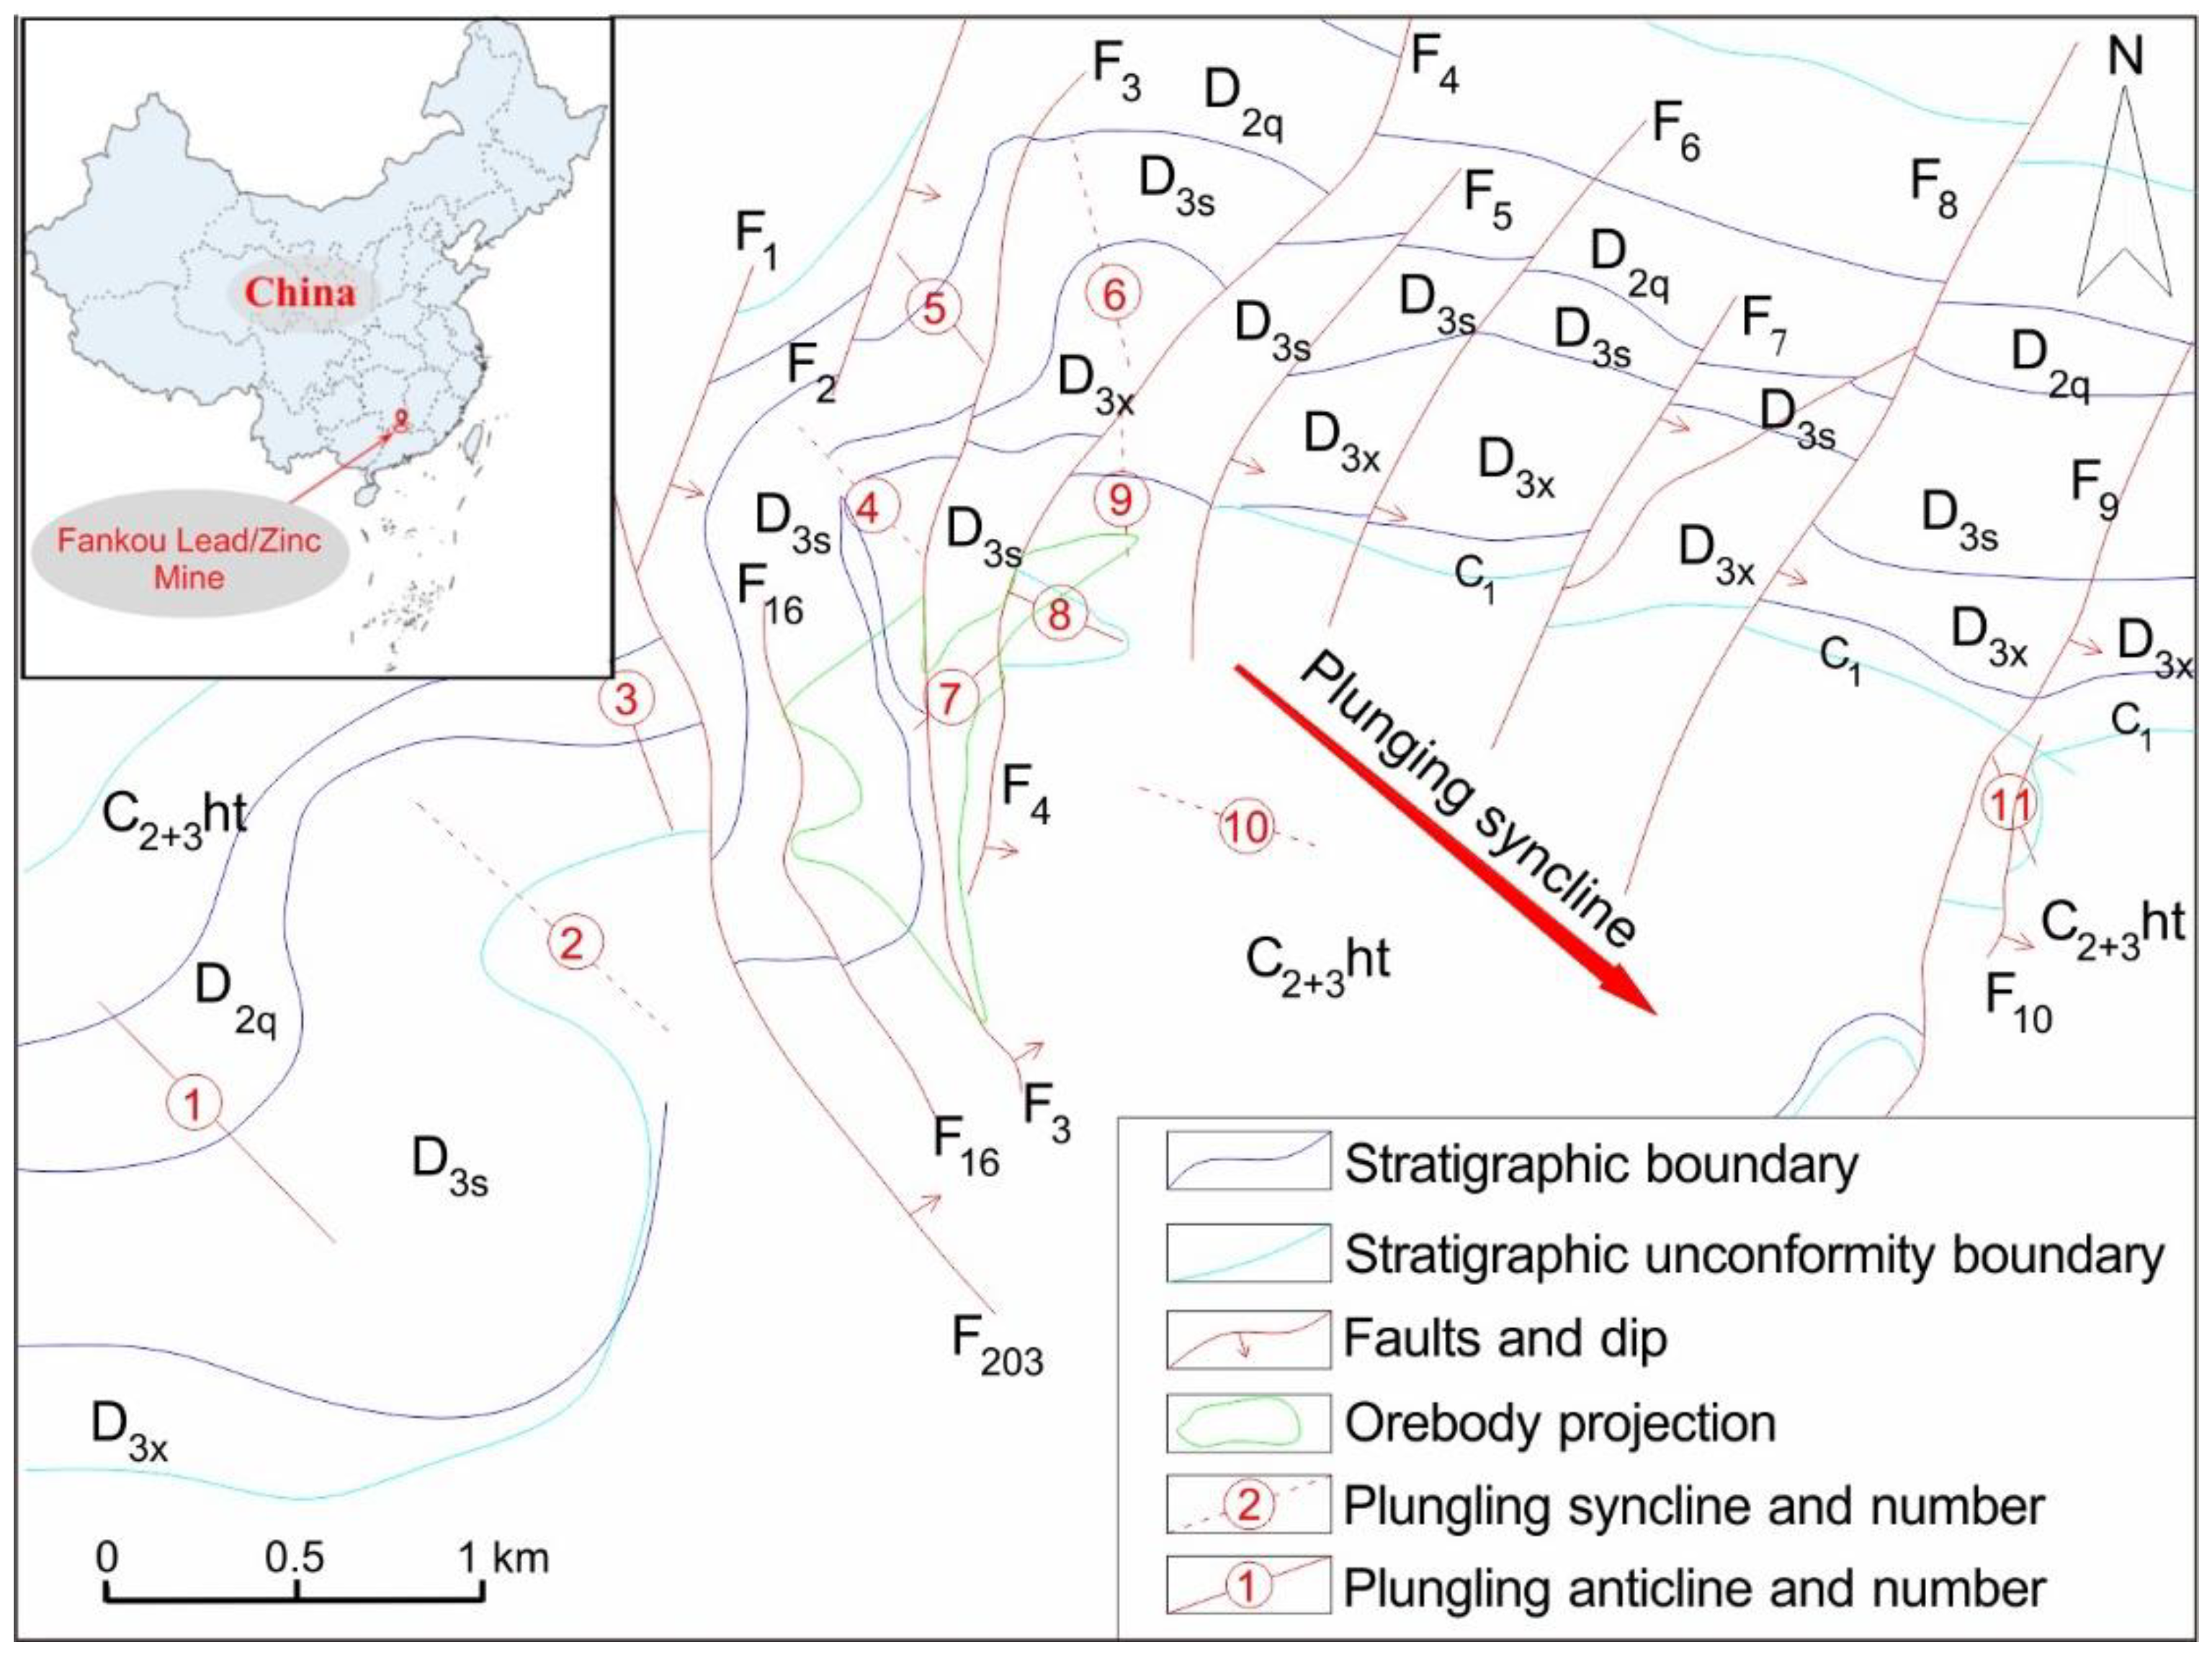
42]. According to the above principles and requirements, the developed microseismic monitoring system for the Fankou Lead/Zinc Mine consists of 32 microseismic sensors, which are spread over the five mining levels. The microseismic sensor array is composed of 32 geophones and five microseismic stations located at five different mining levels of this underground mine. The microseismic stations are separately set at the −280 m, −360 m, −455 m, −550 m and −650 m levels, named from no. 1 to no. 5. The microseismic workstation consists of a 32-bit high-precision eight-channel data collector (netADC8), waveform processor (net SP), intelligent UPS, single-port modulation communication MODEM and other auxiliary equipment. Two eight-channel data collectors are installed at the −455 m mining level workstation and the rest of the mining levels are equipped with only one collector on each (details are shown in supplementary materials Figures S1 and S2). All the geophones are connected to the eight-channel data collector so that the detected waveform signal can be sent to the waveform processor for processing after analog-to-digital conversion.
The Underground Data Communication Center (UDCC), which is installed at the −455 m level, comprises clock synchronization equipment, a four-port Digital Subscriber Line Access Multiplexer (DSLAM), serial port equipment and photoelectric conversion equipment. The main task of the UDCC is to distribute the control signal and clock synchronization signal from the server and collector and transfer the cache data in the underground data center. Finally, these data are transmitted to the microseismic server on the ground so that the microseismic data can be further processed by professional software. The system’s network of the microseismic monitoring system and the specifications of the instrument used are shown in supplementary materials Figure S2 and Tables S2 and S3.
In our research, the microseismic monitoring system utilized the average wave velocity determined in the test to infer the source distance. The calculation of the average wave velocity in the Fankou Lead/Zinc Mine was based on the assumption that the microseismic wave propagates in uniform media. Based on this assumption, seven groups of fixed-point blasting tests were carried out over the study period. According to the seven sets of data recorded by the 32 geophones, the weighted average velocity of the wave in the whole mine was obtained. The final calculation results showed that the average longitudinal wave velocity in the blasting tests was VP = 5645 ± 214 m/s and the average shear wave velocity in the blasting tests was VS = 3147 ± 106 m/s. Besides this, the simulation results for the positioning accuracy of microseismic events in the Fankou Lead/Zinc mine showed that the weighted average velocities of waves were reasonable. According to the data of more than three microseismic sensors and the average wave velocity, the microseismic source could be spatially located. The other parameters of the microseismic source could be obtained from spectral analysis of the microseismic waveform through the analysis software in the microseismic monitoring system.
The velocity geophone, data acquisition instrument and waveform processor in the microseismic monitoring system of the Fankou Mine are all from the Institute of Mine Seismology (IMS). The frequency range of microseismic waves monitored by the geophones in the microseismic monitoring system in the Fankou Mine is 8−2000 Hz. The microseismic waveform signals are picked up by the geophones and transmitted to the ground service station through a transmission cable. After a series of processing steps and analyses of the waveform signals in the software Trace, some source parameters such as the microseismic event time, location, intensity and radiation energy are obtained. Then, the parameters are stored in a database of the system and can be viewed in real-time through the software Ticker3D developed by IMS. In our work, the positioning accuracy of the microseismic monitoring system in the Fankou Lead-Zinc Mine reached 10 m according to the simulation analysis results. The sensitivity (magnitude of completeness, Mc) of the system reached the Richter magnitude −3, which met the actual needs of the mine.

3.2. Correlation between Rock Mass Stability and Microseismic Activity Parameters

Before a rock failure event, the rock mass might go through different development processes and its stability has corresponding changes, too. The microseismic sensor can record the elastic wave generated by the rock mass that is deforming, which is the basic correlation between the rock mass and the microseismic monitoring technique. The specific correlation of the two is shown below.
The stress-strain curve can show the basic situation of rock, from a complete one to a broken one [43,44,45,46,
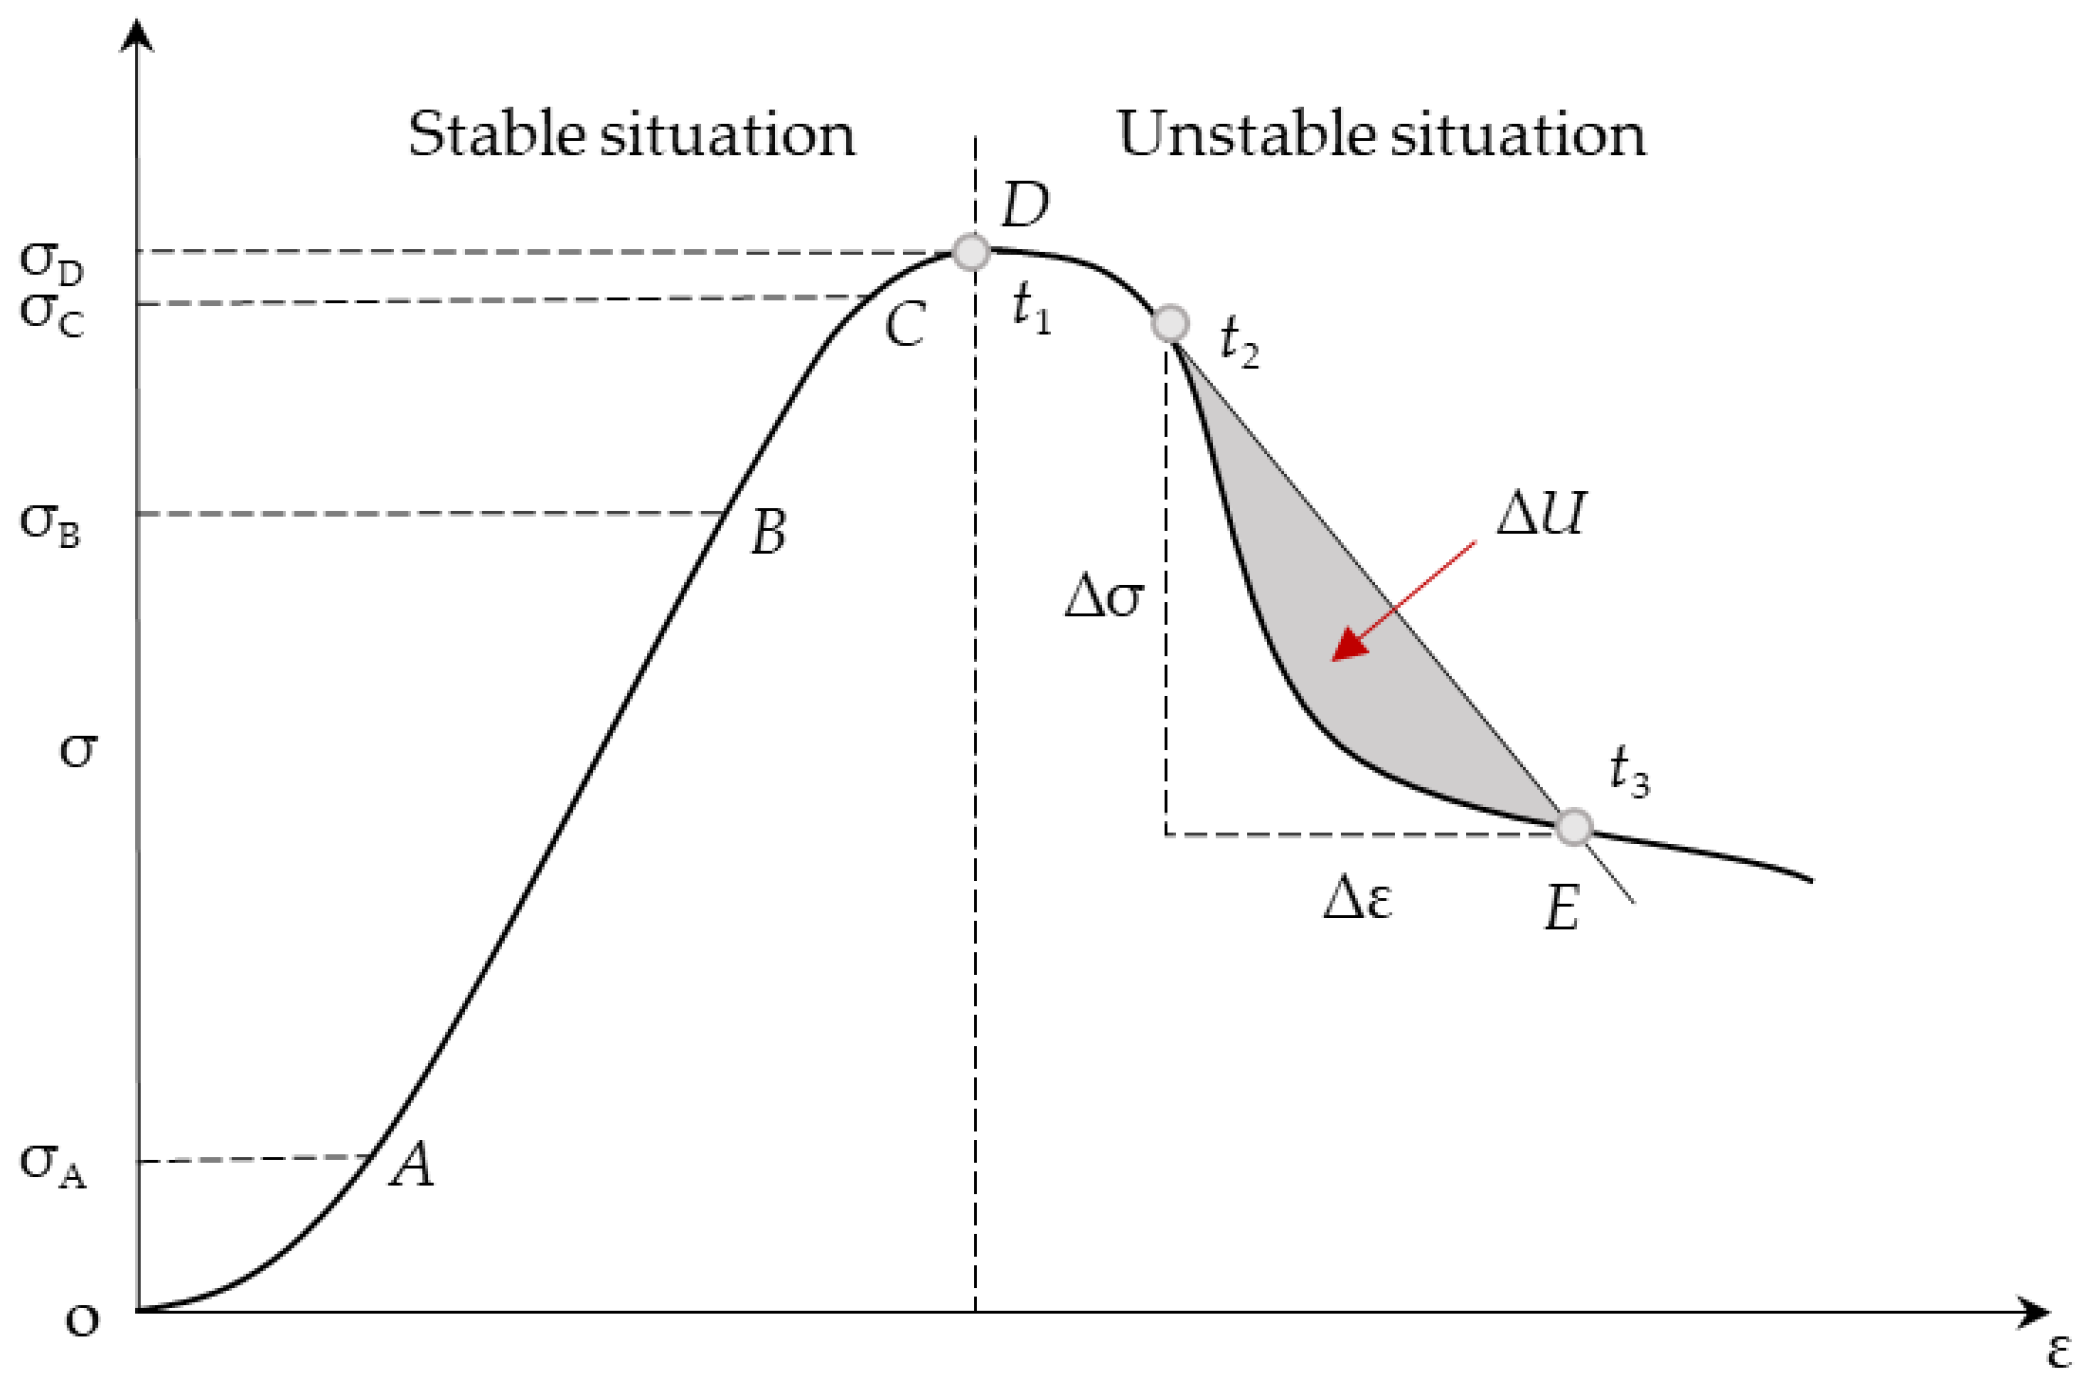
47]. A classic stress-strain curve of the rock uniaxial compression test is shown in Figure 2. The curve in Figure 2 consists of five sections namely OA, AB, BC, CD and DE, corresponding to the different periods in the process of rock failure.
The OA section is the micro-fracture compaction stage. In this stage, the rock specimen will be compacted, which reflects that the internal microfractures of the rock specimen are compressed to close at the initial stage of loading. During this period, there are few elastic waveform signals.
The AB section is the elastic deformation stage of the rock. At this stage, the stress-strain curve continues to vary linearly and obeys Hooke’s law [48]. The curve keeps a single linear variation until point B. The strength at point B is called the elastic limit of the rock, and the rock specimen terminates the single elastic deformation at point B. During this period, the elastic waveform signals increase at relatively low amplitudes.
After point B, new micro-cracks begin to generate inside the rock specimen in the BC section, which is called the generation and expansion stage of fracture. During this period, the growth of the micro-cracks is subjected to the loading and will stop once the loading is stopped. This characteristic ends at point C, the strength at which is called the yield limit of the rock. During this period, the increase of the elastic waveform signals obviously quickens.
After point C, the development of the cracks inside the rock specimen is no longer fully subjected to loading. Even if the loading is stopped, the micro-cracks will not immediately stop expanding, and the elastic waveform signals increase at high amplitudes. The rock specimen enters the unstable development stage of fracture. The internal micro-cracks will expand and join the sliding surface but the rock is not fully broken until point D. The corresponding stress at point D is called the peak strength.
After point D, in the DE section, the internal cracks inside the rock continue to develop and form macroscopic fracture surfaces. The rock specimen still possesses a certain strength even at point E. ∆U is the elastic energy released during rock failure. During this period, the elastic waveform signals will decrease quickly.
It can be seen from Figure 2 that the rock has strong deformation resistance before the peak strength. Before the external load reaches the peak strength, the development of microcracks in the rock mass does not reach the scale of macro-failure. After reaching the peak strength, the rock begins to take macroscopic damage until there is a break. Therefore, from the perspective of rock mass stability, the AD section is classed as the stable situation and the DE section is classed as the unstable situation.
Rock masses will release energy in the form of elastic waves when they are deformed or generate microcracks under loading, and those waves are generally of a low frequency from 50–1500 Hz. These elastic waves can radiate a certain amount of energy and often cause a vibration effect, so they are defined as microseismic events. Therefore, microseismic events can reflect the state of rock masses and thus indicate their degree of stability. In other words, the stable state of the rock mass can be inferred by analyzing the corresponding microseismic data. That is why microseismic monitoring technology is considered as a kind of means to understanding the stability of the rock mass in the target area by monitoring, collecting and storing the information on microseismic events.
Microseismic events can be detected by a geophone and then various parameters can be obtained with the analysis software in the microseismic monitoring system. The energy index, cumulative apparent volume and Schmidt number are three of those parameters that can effectively reflect the stability information of the rock mass to some degree; hence, they are often used as indicators to estimate the stability of surrounding rock.
The energy index EI [49] is the ratio of the energy E released by a microseismic event to the average energy E (M) released by an event with the same magnitude in a region.
E I = E E ( M ) = E 10 d l o g M + c
In Equation (1), M is the magnitude of a microseismic event, d is the rigidity of the system, c is the stress level and c and d are constants in the region. Therefore, the energy index can reflect the stress level of the rock mass in its region. The larger the energy index, the more energy there is, which means the driving stress of the source will be greater when an event occurs during this period. The apparent volume VA [50] is a parameter calculated by the seismic moment M0 and static stress drop σA.
V A = M 0 2 σ A
The cumulative apparent volume ∑VA is the cumulative value of the apparent volume. The slope of cumulative apparent volume can reflect the strain rate of the rock mass. When the change of cumulative apparent volume is accelerated, it indicates that the deformation rate of the rock mass is also accelerated.
The Schmidt number [51] Sc is defined as the ratio of the kinematic viscosity coefficient ν to the diffusion coefficient D. The Schmidt number can be used to measure the spatiotemporal complexity of rock rheology. Additionally, it is a unique parameter reflecting potential instability. The stability of rock mass deformation increases with a decreasing Schmidt number.
S c = ν D
It can be seen from Figure 2 that the growth of the strain accelerates slightly and the growth of the stress slows down obviously before reaching the peak strength. Correspondingly, the growth of cumulative apparent volume accelerates, the energy index increases slowly and the Schmidt number decreases slightly. After the peak strength, the rock deformation increases rapidly and the stress decreases rapidly. Accordingly, the cumulative apparent volume increases more rapidly and the energy index decreases more rapidly but the Schmidt number decreases rapidly. That is the reason why rock instability can be warned of early on by monitoring the cumulative apparent volume, energy index and Schmidt number with the microseismic monitoring system.
The calculations of EI, ∑VA and Sc were completed by the Trace software in the microseismic monitoring system, and the dynamics of EI, ∑VA, and Sc were recorded in the form of a curve, as shown in 
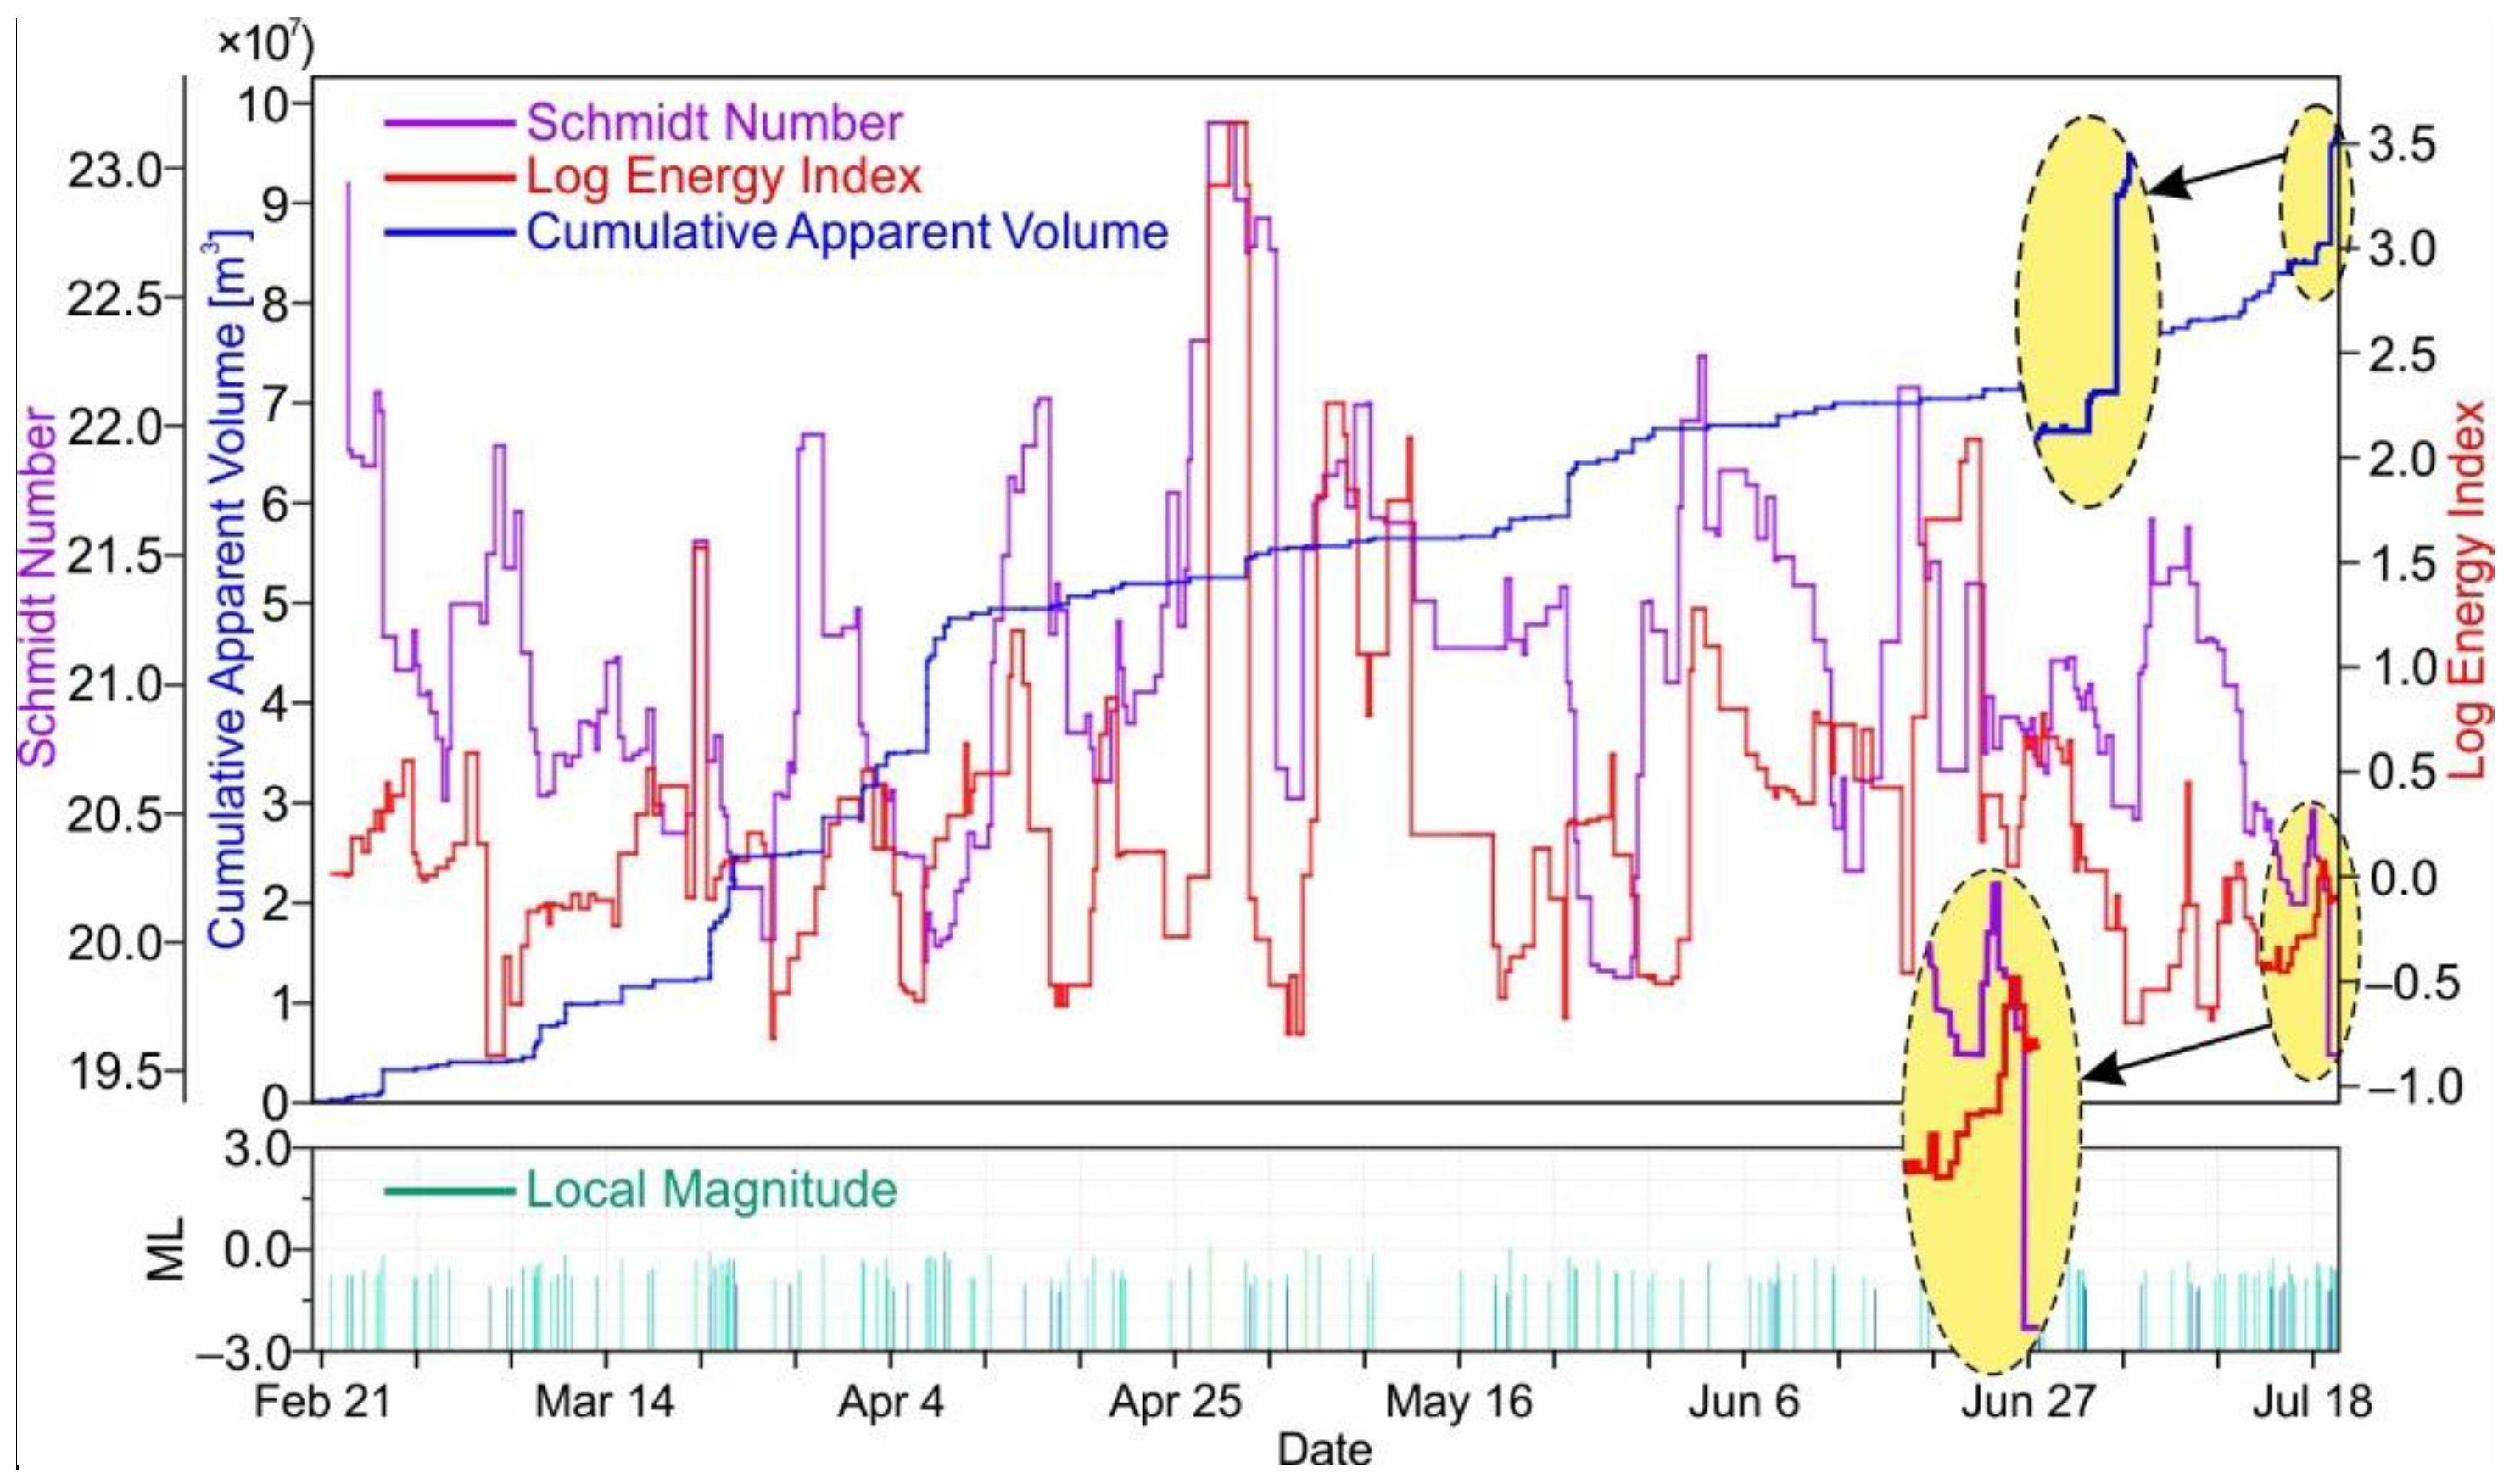
Figure 3. The evolution of the energy index, Schmidt number and cumulative apparent volume of the microseismic event accumulation area over time are shown in Figure 3. As can be seen in Figure 3, the red line represents the variation of the energy index with time, the purple line represents the variation of the Schmidt number with time and the blue line represents the development of the cumulative apparent volume with time.

4. Identification of the ‘7.26’ Mining-Induced Earthquake Events

Based on the above content, we will provide an actual case study for the identification of mining-induced earthquakes. The specific case is a microseismic event that occurred in the Fankou Lead/Zinc Mine on 26 July 2017, with a large magnitude, and that caused an obvious vibrating effect. The details of this case are given in the following paragraphs.
At 16:50 on 26 July 2017, the surface (+132 m) and underground workers of the Fankou Lead/Zinc Mine felt a strong vibration, which was transmitted from below ground to the ground. The staff immediately retrieved the microseismic database and identified a special microseismic event. The Richter magnitude of this microseismic reached 1.4. It occurred at 16:51:31 p.m. on 26 July 2017 at the −600 m mining level. The source location coordinates of this microseismic event were 8543.6, 2606.2 and −569.5 and further parameters of this event are shown in Figure 4. The magnitude of this event broke the previous record of the Fankou Lead/Zinc Mine that had been tracked since the microseismic monitoring system was brought into operation, triggering all the 29 well-running sensors on all the mining levels. It has since been termed the ‘7.26’ microseismic event. Although this event did not cause serious destruction, great importance has been attached to it. The ‘7.26’ microseismic event greatly threatened and harmed the production of the Fankou Lead/Zinc Mine. To identify and prevent similar incidents in the future and make the most of the performance of the microseismic monitoring system in the Fankou Lead/Zinc mine, it is important to analyze and study the accident type and reasons for the ‘7.26’ microseismic event. Besides this, it is also beneficial to propose a more effective and simple method for comprehensively assessing the rock mass stability of the Fankou Lead/Zinc Mine and achieving early warning ahead of similar events to come.
Figure 3 shows the changes of various parameters detected by the microseismic monitoring system before the ‘7.26’ microseismic event. In Figure 3, the cumulative apparent volume starts to rise slightly on 12 July 2017. Then, after 15 July 2017, it suddenly increases rapidly. At the same time, the energy index decreases and the Schmidt number decreases dramatically. The characteristic changes indicate that the rock mass is in an unstable state and at risk of greater instability. The ‘7.26’ microseismic event displays a typical precursory period, a quiet period and a shaking period. These characteristics are consistent with the general law of natural earthquake occurrence and the laws of fracture development and rock failure.
Using the Event Gridding function of the Ticker3D software, by setting seven days as the period and delineating the mining level, the displacement contour tracking results can be obtained. The displacement contour tracking result for microseismic activity at the −600 m level before the ‘7.26’ mining-induced earthquake event is shown in Figure 5. Over the week from 29 June 2017 to 5 July 2017, the relative deformation of the maximum deformation area (red nucleation area) is 4.098 mm. Then, over the week from 5 July 2017 to 12 July 2017, the relative deformation of the maximum deformation area (red nucleation area) is 4.133 mm. The deformations in the first two weeks are relatively small, which means that the ground pressure activity in this area is relatively quiet during this period. From 12 July 2017 to 19 July 2017, however, the maximum relative deformation suddenly increases to 33.069 mm. Malinowska and her colleagues [52] revealed that the maximum ground subsidence observed is close to 90 mm when a mining-induced earthquake reaches magnitude 4.5. Thus, the degree of displacement noted in this case indicates an abnormal activity level of ground pressure in the study area.
According to the daily monitoring report of the Fankou Lead/Zinc Mine, there was clear event aggregation in the adjacent area between the N4~N5 ore laneway at the −650 m mining level on 19 July 2017 and 20 July 2017. Then, a 1.4-magnitude microseismic event occurred one week later. The 1.4-magnitude microseismic event suggests that microfissure formation and energy accumulation occurred in the rock mass since 19 July 2017.
The statistical results for the rock vibration velocity monitored by sensors in the Fankou Lead/Zinc Mine are listed in Table 2. In general, the human body can feel vibration events when the vibration velocity is greater than 1 mm/s. When the ‘7.26’ microseismic event occurred, all the vibration velocities detected by the sensors were more than 1 mm/s, and the maximum vibration velocity exceeded 9 mm/s. Furthermore, as the ‘7.26’ microseismic event reached a magnitude of 1.4, this shows that the intensity of the event was very strong. However, the large-magnitude microseismic event caused little damage to the underground mine and its location was shallow. As we all know, natural earthquakes or structural mine earthquakes not only release enormous energy but also seriously damage structures and rocks once they occur [53]. The source location of a natural earthquake is much deeper than that in the ‘7.26’ event. Besides this, the source of the microseismic event in the case study was not in an area strictly controlled by large structural planes. So, the phenomena noted are not consistent with a natural earthquake or structural mine earthquake, but a mining-induced earthquake, and on the day that the event occurred, mining activity was indeed carried out near the source. Based on the above evidence, we identify this microseismic event as having been a mine earthquake event.
A waveform characteristic analysis method can also be used to identify mining-induced earthquakes. Existing research shows that the waveform characteristic analysis method is widely recognized and has been applied to identify many microseismic waveforms [54,55,56]. The waveform characteristics of the ‘7.26’ mining-induced earthquake event are shown in Figure 6.
Figure 6 shows different waveforms in the Fankou Lead/Zinc Mine. Figure 6a shows the microseismic waveform recorded by geophone of the ‘7.26’ event while Figure 6b shows other classic waveforms in the Fankou Lead/Zinc Mine. The latter depicts how mechanical waveforms have either a fixed or irregular frequency, electric signal waveforms have obvious periodicity and blasting waveforms have many wave peaks and obvious waveform superposition. The waveform in Figure 6a does not have a fixed frequency but is not totally irregular. Thus, the waveform in Figure 6a is not a mechanical or electric signal waveform. Besides this, the initial direction of the P-wave in Figure 6a is downward and it can be seen that it has an obvious vibration take-off point, which is different from the upward take-off point in a blasting waveform. The amplitude of the microseismic wave shows a continuous attenuation trend and there is no intermittent wavelet. When the amplitude of the microseismic wave decreases, the period of the wave is relatively stable. At last, the waveform in Figure 6a does not have many obvious wave peaks or the obvious waveform superposition. Thus, the possibility is ruled out of the event having been due to a large explosion.
Further to this, we analyzed a transparent surface of the ‘7.26’ event. Although the amplitude of the surface wave is large, it is still smaller than the S-wave amplitude. From the viewpoint of energy, as is exhibited in Figure 4, the energies of the P-wave and S-wave are 3.1 × 10⁵ J and 5.6 × 10⁴ J, respectively. The energy ratio of the S-wave to the P-wave is 5.5. According to the correlation rule of the seismic wave energy calculation formula [57], the energy ratio of S-waves to P-waves is generally greater than 10 for fault-slip or shear-type induced seismic events. In this event, the energy ratio of the P-wave to the S-wave is less than 10, which shows that this event is not a natural earthquake. For the reasons above, we conclude that the ‘7.26’ earthquake of the Fankou Lead/Zinc Mine was a mining-induced earthquake.

5. Precursor Analysis of Microseismic Activity Index

The above content in Section 3.2 outlines how information and rules before the occurrence of an underground pressure disaster can be obtained from changes to the cumulative apparent volume, Schmidt number and energy index over time. For mines that monitor these parameters, it is reasonable to use the change law as a criterion to judge the instability of the rock mass.
As we can see from Figure 3, after 19 July 2017, the cumulative apparent volume changed from a slow increase over a long period to a rapid increase. The rapid increase in this index indicates an increase in the deformation of the rock mass, and we found that the Schmidt number quickly decreased after 19 July 2017. Furthermore, an accelerating increase in the energy index indicates the continuous storage of energy. As shown in Figure 3, the energy index continued to accelerate, increasing until reaching the maximum value around 19 July 2017, and then it decreased to the minimum value around 25 July 2017. At the same time, the Schmidt number also reached its lowest value around 25 July 2017. Combined with the stress-strain curve presented in Section 3.2, the increase in the energy index corresponds to the elastic deformation before the peak strength. When the event occurs, the energy stored in the rock mass is released rapidly, and the energy index decreases, corresponding to the post-peak strain-softening stage. What is more, the rapid decrease of Schmidt number revealed the instability of the corresponding rock mass from 19 July 2017 to 25 July 2017. In summary, the cumulative apparent volume, Schmidt number and energy index were in a critical state around 19 July 2017. Then, the three microseismic monitoring indexes all underwent an abrupt change, and the trend of this change was consistent with the occurrence and evolution of the rock mass. On 25 July 2017, the monitoring characteristic index value reached the ultimate limit level, which meant that the energy had been stored to an ultimate state and the fracture had been fully developed. Therefore, we define the period from 19 July 2017 to 25 July 2017 as the precursory period of the mining-induced earthquake event.
After the occurrence of the mining-induced earthquake on 26 July 2017, the staff responsible for safety in the Fankou Lead/Zinc mine went to the N5 vein crossing and its adjacent area at the −650 m level, where the ‘7.26’ event originated from, to check the damage that the ‘7.26’ event had caused, on the morning of 27 July 2017. The situation of the accident scene shows that there were collapses in this area and new section cracks in the roof of the roadway (photos are shown in Supplementary materials Figure S3). However, regarding the collapse scale, the volume of unstable collapse was not large enough to fully reflect the impact of the energy level a microseismic event that reached magnitude 1.4 should have had. We can surmise that, luckily, the failure led only to small-scale destruction accompanied by mining-induced earthquake events.

6. Quantitative Analysis of the Mining-Induced Earthquake Tendency

Given the characteristics of the ‘7.26’ mining-induced earthquake and the local failure of the surrounding rock mass of the roadway, the event provides a valuable case study to base important research work on. To prevent the occurrence of similar events, it is necessary to forecast the risk at each mining level in the mining area. In that context, according to the existing microseismic monitoring data, we establish an evaluation system to determine the risk at each mining level in the mining area. To achieve this, the b-value is used to compute the maximum magnitude M (max) that may occur. Then, we predict the recurrence time and probability of microseisms with the maximum magnitude by counting the time between microseismic events, to enhance mining safety.

6.1. Data Statistics and Risk Assessment

6.1.1. Rating System

Risk assessment of mining-induced earthquakes is mainly based on statistical data of the microseismic events recorded in the Fankou Lead/Zinc Mine. As shown in Table 3, NL represents the number of microseismic events with a large magnitude greater than or equal to 0 and NS represents the number of microseismic events with a small magnitude less than 0. Thus, NL/NS represents the ratio of the number of microseismic events with a large magnitude to those with a small magnitude. Besides this, NT represents the total number of microseismic events. The above parameters are defined for risk classifying and ranking the potential mining-induced microseismic events in the corresponding area; the risk classification and ranking rule are shown in Table 3.

6.1.2. Microseismic Monitoring Data and Risk Assessment

We take a week as the time unit and count the microseismic events that occur in each mining level of the Fankou Lead/Zinc Mine from 23 December 2016 to 30 November 2018. Due to the varying degrees of excavation disturbance, there are significant differences in the numbers and magnitudes of microseismic events that occur at each mining level (the spatiotemporal distribution and detailed data of microseismic events are shown in supplementary materials Figure S4 and Table S4). According to the rating system established in Table 3, scores for the statistical results of the microseismic events that occur at each mining level are calculated, as shown in Table 4.
Further scores are determined according to the number of microseismic events with a large magnitude at each mining level, as shown in Table 5. Finally, the risk rankings of each level are determined by an overall, as listed in Table 6.
According to the results of the risk ranking of potential mining-induced earthquakes at each mining level in Table 6, the following conclusions can be drawn:
(1)
The highest risk of a potential mining-induced earthquake is at the −455 m mining level. Following that, the risk of a potential mining-induced earthquake at the −320 m, −500 m, −550 m and −600 m mining levels is high.
(2)
The lowest scores correspond to the −240 m and −710 m mining levels, indicating that the risk of a potential mining-induced earthquake is lowest there.
(3)
The scores for the −280 m, −360 m, −400 m and −650 m mining levels correspond to a moderate risk.

6.2. Mining-Induced Earthquake Tendency Based on G-R Relationship

The risk of a microseismic event with a large magnitude is defined as the occurrence probability of a microseismic event greater than the specified magnitude in a given period. The simplest way to determine the risk of a microseismic event with a large magnitude is to determine the maximum magnitude M (max) in the target area and its recurrence possibility and periodicity. The potential microseismic event with the maximum magnitude can be determined with the empirical formula describing the magnitude frequency:
lg N   ( M ) = a b · M
where N (M) is the cumulative number of microseismic events with magnitudes larger than the microseismic magnitude M. The b-value is the slope of the linear fit through the Gutenberg-Richter law (details are shown in Supplementary materials Figure S5).
Smith [58] claimed that the b-value could be used to predict a large-magnitude event. In addition, some researchers stated that the b-value can be used as an indicator to predict rock failure [58,59,60]. Urbancic [61] and Vallejos [62] proposed that the b-value of mining-induced seismicity should be employed to assess seismic hazards in underground mines. It is well-known that the calculation of the b-value mainly depends on the selection of the spatiotemporal range of microseismic events. Ma et al. [63] stated that the b-value varies with mining-induced seismicity sequences. Accordingly, the a-value and b-value can be used as different indicators. In this paper, the a-value represents the level of seismicity in the statistical region, and the b-value describes the ratio of the number of earthquakes with a small magnitude to the number of earthquakes with a large magnitude within a certain period and special area. Normally, in a given period, the microseismic activity maintains a relatively stable level in a region. If all the energy stored in this region is released by a microseismic event, then the magnitude of the microseismic event is the maximum potential magnitude that can be recorded in the region. The microseismic event with the maximum potential magnitude can occur only once. Therefore, after determining the values of a and b based on the G-R relationship in the corresponding region, we can ascertain the largest potential magnitude in the corresponding area by setting the value of N equal to 1. In other words, the maximum magnitude of the potential microseismic events in the region within a period is equal to the ratio of the a-value to the b-value. The maximum magnitude M (max) can be expressed as the ratio of the a-value to the b-value. The recurrence time Tr(≥ M (max)) of the predicted events with maximum magnitude M (max) can be expressed as:
T r ( M   ( max ) ) = Δ t / n ( M   ( max ) )
where ∆t is the period of statistically microseismic events, n(M (max)) is the number of events with the maximum magnitude M (max) that occurs in the statistical period. In this paper, the period of the statistically microseismic events is 667 days. The recurrence probability Pr(≥ M (max)) of the predicted microseismic event with maximum potential magnitude can be expressed as:
P r ( M   ( max ) ) = 1 / T r ( M   ( max ) )
Accordingly, the recurrence time Tr(≥ M (max)) of the predicted microseismic event with the maximum potential magnitude can be used as an indicator to evaluate the degree of risk of a mining-induced earthquake at a specific mining level.
In this research, microseismic events with a magnitude larger than 0 were used to determine the risk ranking for each mining level. Thus, we employed the cumulative number of events with a magnitude larger than 0 to obtain the a-value and b-value results using regression analysis.
According to the implication of the Gutenberg-Richter distribution law of seismicity, the fitted relationship between magnitude and frequency is shown in Figure 7. As we can see in Figure 7, the red solid line is the fitted line of all the datasets, and the black solid line is the fitted line of the dataset with magnitudes greater than 0. The general method of obtaining the a-value and b-value is to linearly fit all the obtained seismicity data. Yet, in linear fitting processing, we found that the events with a magnitude larger than 0 provided a better linear fit than the aggregated data.
Based on the results in Figure 7, the M (max) values of various mining levels are listed in Table 7. It should be noted that there are too few datasets in Figure 7i,j to accurately compute the M (max) value. The M (max) values of the −650 m and −710 m mining levels in Table 7 are for reference only. Therefore, the method mentioned above is not suitable for assessing the risk of mining-induced earthquakes at the −650 m and −710 m mining levels. The risk of mining-induced earthquakes of the −650 m and −710 m mining levels will be further studied in our future research. At present, the study region of this paper is mainly focused on the range from the −400 m level to the −650 m level, which is more important for the risk assessment of mining-induced earthquakes in the Fankou Lead/Zinc Mine.
Table 7 shows that the predicted maximum magnitude M (max) fluctuates between 0.167 and 1.647. All the microseismic events with the maximum magnitude M (max) predicted all occurred at each mining level during the investigated period. Since the M (max) values of microseismic events that occurred at the −455 m and −500 m mining levels were both greater than 1, the protection of these two mining levels should be specially strengthened. Furthermore, at the −600 m mining level, a 1.4-magnitude mining-induced earthquake event occurred, with obvious seismic characteristics and local failure. Additionally, the predicted M (max) of the −600 m mining level is 1.647, which indicates that the −600 m mining level may face a high recurrence risk of mining-induced earthquakes in the future. Therefore, it is necessary to adjust the mining arrangement in the future and strengthen the safety support measures at the −600 m mining level. In addition, although the microseismic activity at the −710 m mining level is relatively low, more attention should be paid to its mining safety support measures due to the complex geological conditions at this underground depth.
As shown in Figure 8, the M (max) decreases with an increasing b-value. We can better understand the risks of different mining levels by predicting the largest magnitude M (max) of potential mining-induced earthquake events at different mining levels. Based on the M (max), we can also better arrange the microseismic monitoring plan and prevention plan for mining-induced earthquakes at each mining level so that the security level of the whole mine will be improved to a certain degree. That is to say that studying the b-value and M (max) has real meaning, and accordingly, more research should be focused on determining the b-value and value of the M (max).

7. Discussion

Due to disturbance brought by excavation work, the original stress state of a rock mass changes, which is the main cause of massive microseismic events in underground mines. Usually, most microseismic events do not directly impact mining projects. Only a few microseismic events with large magnitudes may seriously impact the local scope in the underground mining project. Microseismic events that cause certain damage to the mining project and have some characteristics similar to earthquakes are called mining-induced earthquake events. The background information we presented validated the inherent similarities of mining-induced earthquakes and crustal earthquakes in terms of source mechanisms, although obvious differences exist between the triggering mechanisms and impact areas. In this paper, the characteristics of the rock vibration velocity and the energy ratio of the S-wave to P-wave both suggested that the ‘7.26’ microseismic event was a mining-induced earthquake event. According to the monitoring results of the microseismic system, sharp changes in the energy index, Schmidt index and cumulative apparent volume were observed in the week before the ‘7.26’ mining-induced earthquake event occurred. In the week before the occurrence of the mining-induced earthquake, the strata displacement in the corresponding area varied far greater than normal. Additionally, the number of microseismic events in this area increased significantly.
The b-value is used to calculate the maximum potential magnitude M (max) of a region over a period, and it can be seen from Figure 8 that the b-value plays an important role in predicting the M (max). The spatiotemporal location of microseismic events over a period directly affects the b-value. From a statistical point of view, the more data, the more accurate the prediction result. In our work, the spatial distribution displayed more importance than the temporal distribution in determining the b-value. This corresponds to the statement of Urbancic [61], who claimed that a spatial change in the b-value could indicate stress drops in the study area. Thus, each mining level can be regarded as an independent study area to calculate the b-value.
Additionally, the recurrence time and probability of mining-induced earthquakes with M (max) depend on the temporal distribution of the statistical features of microseismic data. In other words, the recurrence time and recurrence probability in Table 7 will vary with the statistical time of microseismic events.
Recently, considerable time has passed without there being any mining-induced earthquakes of a magnitude greater than M (max). This indicates that all mining levels might be accumulating energy, which needs to be monitored. To prevent similar mining-induced earthquake events, the staff responsible for the mining safety must assess and predict the risk of a mining-induced earthquake at each mining level as soon as possible. We suggest that the staff should also predict the recurrence time and probability of a microseismic event with a maximum magnitude as soon as possible, to ensure safety in the Fankou Lead/Zinc mine. If a short recurrence time and high probability of mining-induced earthquake change are identified for the underground mine, they can take measures now to improve the mining safety level as much as possible. In this regard, microseismic events in the future should be used to determine a reasonable b-value, making it more accurate and reliable to predict the M (max) value and the recurrence period, along with the probability of potential mining-induced earthquakes.

8. Conclusions

This paper took the ‘7.26’ microseismic event as the research object and performed analyses and research based on the related data. We found that factors such as the rock vibration velocity, source parameters, displacement of microseismic event clusters, microseismic waveform and energy ratio can be used to judge whether a microseismic event is a mining-induced earthquake. Additionally, we concluded that the microseismic activity parameters (energy index, Schmidt index and cumulative apparent volume) change dramatically before the occurrence of a mining-induced earthquake. That is, the energy index and cumulative apparent volume increase sharply while the Schmidt index decreases sharply.
Considering the destruction and influence of the ‘7.26’ mining-induced earthquake event, three indicators were proposed to determine the risk-ranking classification of microseismic activity at each mining level. According to statistical data of microseismic events over a period, statistical methods were used to determine the risk ranking of microseismic activity at each mining level.
By computing the b-value with the Gutenberg-Richter law, we found an index, the ratio of the a-value to the b-value, to predict the maximum magnitude M (max), which will decrease with an increase of b-value. This finding confirmed the fact that the b-value can be used to predict the potential of a microseismic event with a maximum magnitude M (max). According to the period of statistical microseismic event data and the largest microseismic events that occurred at different mining levels, the indexes of recurrence time and probability, for potential microseismic events with a maximum magnitude, were proposed to assess the risk of mining-induced earthquake at each level.
A method for identifying mining-induced earthquakes was put forward based on the microseismic waveform, radiation energy and source parameters, and was successfully applied to identify a mining-induced microseismic event of magnitude 1.4 in the Fankou Lead/Zinc Mine. In addition, this paper also proposed a method for assessing the activity of regional microseisms and predicting rock instability events, in which the activity assessment depends on the possible maximum magnitude and its recurrence time, calculated from the G-R curve, and the prediction of rock instability depends on the correlation between the stress-strain curve and the dynamics of microseismic source parameters such as the energy index, Schmidt number and cumulative apparent volume.
Although the above method we proposed works to some extent, it also needs verifying for different mines and over different periods to improve its effectiveness. For example, the validation of the method using longer-term data from mines will overcome the current disadvantage of having insufficient data. Micro-seismic stations’ responses and the stress redistribution after large-scale microseismic events are suggested for combined consideration when selecting data for future work. The excessive dependence of the method on the observation period should also be overcome by considering the stress redistribution after microseismic events. Looking ahead, various periods of microseismic event data for various mines will be used to perform further studies, in our future research, plan, to validate the reliability of our method and support the findings of this study.

Supplementary Materials

The following supporting information can be downloaded at: https://www.mdpi.com/article/10.3390/min12030318/s1, Figure S1: Details of microseismic monitoring system configuration, including microseismic sensors array arrangement, configuration and type of geophones installed. Figure S2: Network topology of microseismic monitoring system in Fankou Lead/Zinc Mine. Figure S3: Collapse site in the N5 vein crossing of −650 m mining level: (a) Caving pile; (b) Roof collapse trace. Figure S4: Spatial distribution of microseismic events in Fankou Lead/Zinc mine during the study period. Figure S5: The sketch map of Gutenberg-Richter relation. Table S1: Rock mass classification of the samples in Fankou Lead/Zinc Mine. Table S2: Specifications of the instruments in Fankou Lead/Zinc Mine. Table S3: Seismic station number, geophone number, and orientation in the microseismic monitoring system of Fankou Lead/Zinc Mine. Table S4: Microseismic data of each middle section of Fankou Lead/Zinc Mine from December 2016 to October 2018.

Author Contributions

Conceptualization, H.D. and Y.L.; methodology, L.W.; software, Y.Q.; validation, X.X.; formal analysis, L.W.; investigation, Y.L.; resources, H.D.; data curation, Y.Q.; writing—original draft preparation, Y.L.; writing—review and editing, L.W.; visualization, X.X.; supervision, H.D.; project administration, H.D.; funding acquisition, H.D. All authors have read and agreed to the published version of the manuscript.

Funding

This study was funded by the National Natural Science Foundation of China (51874352) and the Research and Innovation Project of Central South University (2021zzts0285).

Data Availability Statement

All data are contained within the article and the Supplementary materials.

Acknowledgments

The authors wish to thank the anonymous reviewers and academic editor for their kind comments and suggestions, which helped to improve this manuscript greatly.

Conflicts of Interest

The authors declare no conflict of interest.

Abbreviations

νkinematic viscosity coefficient
σAstatic stress drop
ρdensity
μPoisson’s ratio
φinternal friction angle
aintercept of the G-R relationship
bslope of the G-R relationship
BTStensile strength
cstress level
ccohesion
CUScompressive strength
drigidity of the system
Ddiffusion coefficient
D2dalower subformation of Donggangling Formation in Middle Devonian system
D2dbupper subformation of Donggangling Formation in Middle Devonian system
D3tTianziling Formation in Upper Devonian system
D3talower subformation of Tianziling Formation in Upper Devonian system
D3tbmiddle subformation of Tianziling Formation in Upper Devonian system
Eelastic modulus
Eenergy released by a microseismic event
EIenergy index
E(M) average energy released by a microseismic event with the magnitude of M
F3north-northeast-trending fault
Mmagnitude of a microseismic event
M (max)maximum magnitude
M0seismic moment
n(M (max))number of events with the maximum magnitude M (max) to occur in the statistical period
N4ore laneway numbered N4
N5ore laneway numbered N5
NLnumber of microseismic events with a large magnitude greater than or equal to 0
NSnumber of microseismic events with a small magnitude less than 0
NL/NSratio of the number of microseismic events with a large magnitude versus those with a small magnitude
NTtotal number of microseismic events
N(M)cumulative number of microseismic events with magnitudes larger than the micro-seismic magnitude M
Pr(≥ M (max))recurrence probability of the predicted microseismic event with the maximum potential magnitude
ScSchmidt number
tperiod of occurrence of statistically microseismic events
Tr(≥ M (max))recurrence time of the predicted event with the maximum magnitude M (max)
Uelastic energy released by the rock sample during rock failure
vplongitudinal wave velocity in rock
VPaverage longitudinal wave velocity in blasting tests
VSaverage shear wave velocity in blasting tests
VAapparent volume
VAcumulative apparent volume

References

  1. Qiao, C.; Guo, Y.H.; Li, C.H. Study on Rock Burst Prediction of Deep Buried Tunnel Based on Cusp Catastrophe Theory. Geotech. Geol. Eng. 2020, 39, 1101–1115. [Google Scholar] [CrossRef]
  2. Li, X.; Gong, F.; Tao, M.; Dong, L.; Du, K.; Ma, C.; Zhou, Z.; Yin, T. Failure mechanism and coupled static-dynamic loading theory in deep hard rock mining: A review. J. Rock Mech. Geotech. Eng. 2017, 9, 767–782. [Google Scholar] [CrossRef]
  3. Xiao, X.H.; Xiao, P.W.; Dai, F.; Li, H.B.; Zhang, X.-B.; Zhou, J.W. Large Deformation Characteristics and Reinforcement Measures for a Rock Pillar in the Houziyan Underground Powerhouse. Rock Mech. Rock Eng. 2018, 51, 561–578. [Google Scholar] [CrossRef]
  4. Xu, J.; Jiang, J.; Liu, Q.; Gao, Y. Stability Analysis and Failure Forecasting of Deep-Buried Underground Caverns Based on Microseismic Monitoring. Arab. J. Sci. Eng. 2017, 43, 1709–1719. [Google Scholar] [CrossRef]
  5. Xu, N.; Li, T.; Dai, F.; Li, B.; Zhu, Y.; Yang, D. Microseismic monitoring and stability evaluation for the large scale underground caverns at the Houziyan hydropower station in Southwest China. Eng. Geol. 2015, 188, 48–67. [Google Scholar] [CrossRef]
  6. Xiao, P.; Qian, B.; Jiang, P.; Xu, N.; Li, B. Deformation Forecasting of Surrounding Rock Mass Based on Correlation between Frequency and Fracture Scale of Microseismicity. Adv. Civ. Eng. 2018, 2018, 4037402. [Google Scholar] [CrossRef] [Green Version]
  7. Li, T.; Cai, M. A review of mining-induced seismicity in China. Int. J. Rock Mech. Min. Sci. 2007, 44, 1149–1171. [Google Scholar] [CrossRef]
  8. Yakovlev, D.V.; Lazarevich, T.I.; Tsirel’, S.V. Natural and Induced Seismic Activity in Kuzbass. J. Min. Sci. 2013, 49, 862–872. [Google Scholar] [CrossRef]
  9. Liu, J.P.; Xu, S.D.; Li, Y.H.; Gang, L. Analysis of Rock Mass Stability Based on Mining-Induced Seismicity: A Case Study at the Hongtoushan Copper Mine in China. Rock Mech. Rock Eng. 2019, 52, 265–276. [Google Scholar] [CrossRef]
  10. Hudyma, M.R. Mining-Induced Seismicity in Underground Hardrock Mines-Results of a World-Wide Survey; The University of Western Australia: Perth, Australia, 2004. [Google Scholar]
  11. Bischoff, M.; Cete, A.; Fritschen, R.; Meier, T. Coal Mining Induced Seismicity in the Ruhr Area, Germany. Pure Appl. Geophys. 2010, 167, 63–75. [Google Scholar] [CrossRef]
  12. Durrheim, R.J.; Anderson, R.L.; Cichowicz, A.; Ebrahimtrollope, R.; Hubert, G.; Kijko, A.; McGarr, P.; Ortlepp, W.D.; van der Merve, N. Risks Posed by Large Seismic Events in the Gold Mining Districts of South Africa. Natural Disasters; Daya Publishing House: Delhi, India, 2011. [Google Scholar]
  13. De Waal, J.A.; Muntendam-Boos, A.G.; Roest, J.P.A. From Checking Deterministic Predictions to Robabilities, Scenarios and Control Loops for Regulatory Supervision. Geol. Mijnbouw. 2017, 96, 17–25. [Google Scholar] [CrossRef] [Green Version]
  14. McGarr, A. Energy budgets of mining-induced earthquakes and their interactions with nearby stopes. Int. J. Rock Mech. Min. Sci. 2000, 37, 437–443. [Google Scholar] [CrossRef]
  15. Weber, E.; Iannaccone, G.; Zollo, A.; Bobbio, A.; Satriano, C. Development and Testing of an Advanced Monitoring Infra-Structure (Isnet) for Seismic Early-Warning Applications in the Campania Region of Southern Italy; Springer: Berlin/Heidelberg, Germany, 2007. [Google Scholar]
  16. Zhang, H.; Zeng, X.; Zhang, X.; Liu, Y.; Zhang, Y. Surface Microseismic Monitoring of Hydraulic Fracturing of a Shale-Gas Reservoir Using Low-Frequency Sensors. Seismol. Res. Lett. 2014, 8, 668–675. [Google Scholar] [CrossRef]
  17. Adinolfi, G.M.; Picozzi, M.; Cesca, S.; Heimann, S.; Zollo, A. An application of coherence-based method for earthquake detection and microseismic monitoring (Irpinia fault system, Southern Italy). J. Seism. 2020, 24, 979–989. [Google Scholar] [CrossRef]
  18. Fang, G.; Li, Y.E.; Zhao, Y.; Martin, E.R. Urban Near-Surface Seismic Monitoring Using Distributed Acoustic Sensing. Geophys. Res. Lett. 2020, 47, e2019GL086115. [Google Scholar] [CrossRef] [Green Version]
  19. Feng, G.; Lin, M.; Yu, Y.; Fu, Y. A Microseismicity-Based Method of Rockburst Intensity Warning in Deep Tunnels in the Initial Period of Microseismic Monitoring. Energies 2020, 13, 2698. [Google Scholar] [CrossRef]
  20. Song, W.Q.; Feng, C. Automatic Identification and Localization of Microseismic Effective Events. Oil. Geophys. Prosp. 2013, 48, 283–288. [Google Scholar]
  21. Kinscher, J.; Bernard, P.; Contrucci, I.; Mangeney, A.; Piguet, J.; Bigarre, P. Location of microseismic swarms induced by salt solution mining. Geophys. J. Int. 2014, 200, 337–362. [Google Scholar] [CrossRef] [Green Version]
  22. Belayouni, N.; Gesret, A.; Daniel, G.; Noble, M. Microseismic event location using the first and reflected arrivals. Geophysics 2015, 80, WC133–WC143. [Google Scholar] [CrossRef]
  23. Castellanos, F.; van der Baan, M. Dynamic triggering of microseismicity in a mine setting. Geophys. J. Int. 2015, 202, 728–737. [Google Scholar] [CrossRef] [Green Version]
  24. Salvoni, M.; Dight, P.M. Rock Damage Assessment in a Large Unstable Slope from Microseismic Monitoring-MMG Century Mine (Queensland, Australia) Case Study. Eng. Geol. 2016, 210, 45–56. [Google Scholar] [CrossRef]
  25. Chen, Y.; Zhang, H.; Miao, Y.; Zhang, Y.; Liu, Q. Back azimuth constrained double-difference seismic location and tomography for downhole microseismic monitoring. Phys. Earth Planet. Inter. 2017, 264, 35–46. [Google Scholar] [CrossRef] [Green Version]
  26. Luo, Z.Q.; Wang, W.; Qin, Y.G.; Xiang, J. Early warning of rock mass instability based on multi-field coupling analysis and mi-croseismic monitoring. Trans. Nonferrous Met. Soc. China 2019, 29, 1285–1293. [Google Scholar] [CrossRef]
  27. Kao, H.; Shan, S.-J. The Source-Scanning Algorithm: Mapping the distribution of seismic sources in time and space. Geophys. J. Int. 2004, 157, 589–594. [Google Scholar] [CrossRef]
  28. Dong, L.; Li, X.; Tang, L.; Gong, F.Q. Mathematical Functions and Parameters for Microseismic Source Location without Pre-Measuring Speed. Chin. J. Rock Mech. Eng. 2011, 30, 2057–2067. [Google Scholar]
  29. Castellanos, F.; van der Baan, M. Microseismic Event Locations Using the Double Difference Algorithm. CSEG. Rec. 2013, 38, 26–37. [Google Scholar]
  30. He, X. A Micro Source Inversion Method Based on Three Component Data. Oil. Geophys. Prosp. 2013, 48, 71–76. [Google Scholar]
  31. Poliannikov, O.V.; Prange, M.; Malcolm, A.E.; Djikpesse, H. Joint Microseismic Event Location with Uncertain Velocity. In Proceedings of the Society of Exploration Geophysicists Conference Exposition, Houston, TX, USA, 22–27 September 2013; pp. 2094–2098. [Google Scholar]
  32. Grechka, V.; Li, Z.; Howell, B. Relative location of microseismic events with multiple masters. Geophysics 2016, 81, KS149–KS158. [Google Scholar] [CrossRef]
  33. Yuan, S. Analysis of Geological Characteristics and Genetic Type of Tieshiling Lead-Zinc Deposit in the Periphery of Fankou mine. World. Nonferrous. Met. 2017, 4, 80–82. [Google Scholar]
  34. Song, X.X. Minor Elements and Ore Genesis of the Fankou Lead-Zinc Deposit, China. Miner. Deposita. 1984, 19, 95–104. [Google Scholar]
  35. Yuan, G.Q.; Jia, H.Y.; Song, Y.W.; Yu, X.Y. Geological characteristics of deep South Shiling orebodies in the Fankou lead-zinc deposit and the prospecting direction. J. Geol. 2019, 43, 1–7. [Google Scholar]
  36. Wang, L. The Study on Genesis and Minerogenetic Regulations of FanKou Lead- Zinc Deposit in Guangdong Province; Central South University: Changsha, China, 2000. [Google Scholar]
  37. Li, Y.S.; Yang, D.M.; He, D.Q.; Chen, J.J.; Zhang, Y.K.; Yang, C.L.; Cai, Y. Structural Systems of Fankou Lead-Zinc Orefield in Renhua County, Guangdong Province, China. Adv. Mater. Res. 2013, 807–809, 2267–2271. [Google Scholar] [CrossRef]
  38. Lin, S.B. Geological Characteristics of Fankou Super-Large Lead-Zinc Deposit. Nonferrous Met. 1998, 50, 3–12. [Google Scholar]
  39. Liu, S.B. The Ore-Controlling Factors of the Fankou Pb-Zn Deposit and Its Role in The Exploration of the ShiLing Section. Geo. Exp. Nonferrous. Met. 1999, 08, 450–453. [Google Scholar]
  40. Zhou, S.Q.; Dai, J.P. Research on Process Mineralogy of Fankou Lead-Zinc Mine Deep-Ore-Body. J. S. I. Metall. 1997, 18, 186–191. [Google Scholar]
  41. Lynch, R.A.; Wuite, R.; Smith, B.S.; Cichowicz, A. Microseismic Monitoring of Open Pit Slopes. In Proceedings of the 6th Symposium on Rockbursts and Seismicity in Mines, Nedlands, Australia, 9–11 March 2005; pp. 581–592. [Google Scholar]
  42. Zhang, C.X.; Li, X.B.; Dong, L.J.; Yao, J.R. Evaluation Model of Microseismic Monitoring Sensor Layout Scheme and Its Application. J. Northeast. Univ. 2016, 37, 594–599. [Google Scholar]
  43. Zhao, W.; Cao, P.; Zhang, G. Physical Properties of Rock. In Rock Mechanics, 1st ed.; Liu, H., Ed.; Central South University Press: Changsha, China, 2010; Volume 1, pp. 12–21. [Google Scholar]
  44. Eberhardt, E.; Stead, D.; Stimpson, B.; Read, R. Changes in acoustic event properties with progressive fracture damage. Int. J. Rock Mech. Min. Sci. 1997, 34, 71.e1–71.e12. [Google Scholar] [CrossRef]
  45. Kong, B.; Wang, E.; Li, Z.; Wang, X.; Niu, Y.; Kong, X. Acoustic emission signals frequency-amplitude characteristics of sandstone after thermal treated under uniaxial compression. J. Appl. Geophys. 2017, 136, 190–197. [Google Scholar] [CrossRef]
  46. Zhao, K.; Yang, D.; Gong, C.; Zhuo, Y.; Wang, X.; Zhong, W. Evaluation of internal microcrack evolution in red sandstone based on time–frequency domain characteristics of acoustic emission signals. Constr. Build. Mater. 2020, 260, 120435. [Google Scholar] [CrossRef]
  47. Moradian, Z.; Einstein, H.H.; Ballivy, G. Detection of Cracking Levels in Brittle Rocks by Parametric Analysis of the Acoustic Emission Signals. Rock Mech. Rock Eng. 2015, 49, 785–800. [Google Scholar] [CrossRef]
  48. Pan, Y.; Zhao, Z.; He, L.; Wu, G. A Nonlinear Statistical Damage Constitutive Model for Porous Rocks. Adv. Civ. Eng. 2020, 2020, 8851914. [Google Scholar] [CrossRef]
  49. Li, Y.; Yang, T.-H.; Liu, H.-L.; Wang, H.; Hou, X.-G.; Zhang, P.-H.; Wang, P.-T. Real-time microseismic monitoring and its characteristic analysis in working face with high-intensity mining. J. Appl. Geophys. 2016, 132, 152–163. [Google Scholar] [CrossRef]
  50. Liu, J.-P.; Feng, X.-T.; Li, Y.-H.; Xu, S.-D.; Sheng, Y. Studies on temporal and spatial variation of microseismic activities in a deep metal mine. Int. J. Rock Mech. Min. Sci. 2013, 60, 171–179. [Google Scholar] [CrossRef]
  51. Li, Y.; Yang, T.; Song, W.; Yu, L. Movement Law and Discriminant Method of Key Strata Breakage Based on Microseismic Monitoring. Shock Vib. 2019, 2019, 865284. [Google Scholar] [CrossRef] [Green Version]
  52. Malinowska, A.A.; Witkowski, W.; Guzy, A.; Hejmanowski, R. Mapping ground movements caused by mining-induced earthquakes applying satellite radar interferometry. Eng. Geol. 2018, 246, 402–411. [Google Scholar] [CrossRef]
  53. Gutenberg, B.; Richter, C.F. Magnitude and Energy of Earthquakes. Nature 1955, 4486, 795. [Google Scholar] [CrossRef] [Green Version]
  54. Abdelwahed, M.F. SGRAPH (SeismoGRAPHer): Seismic waveform analysis and integrated tools in seismology. Comput. Geosci. 2012, 40, 153–165. [Google Scholar] [CrossRef]
  55. Li, X.L.; Li, Z.H.; Wang, E.Y.; Jing, L.B.; Feng, J.J. Study of Mine Microcosmic Signals Interference Characteristic and Its De-Noising Method. J. China Inst. Min. Technol. 2015, 44, 788–792. [Google Scholar]
  56. Lin, B.; Wei, X.; Junjie, Z. Automatic recognition and classification of multi-channel microseismic waveform based on DCNN and SVM. Comput. Geosci. 2018, 123, 111–120. [Google Scholar] [CrossRef]
  57. Gibowicz, S.J. Seismicity Induced by Mining: Recent Research. Adv. Geophys. 2009, 51, 1–53. [Google Scholar] [CrossRef]
  58. Smith, W.D. The b-value as an earthquake precursor. Nature 1981, 289, 136–139. [Google Scholar] [CrossRef]
  59. Mogi, K. Magnitude-Frequency Relation for Elastic Shocks Accompanying Fractures of Various Materials and Some Related Problems in Earthquakes. Bull. Earthq. Res. Inst. 1962, 40, 831–853. [Google Scholar]
  60. Lockner, D. The role of acoustic emission in the study of rock fracture. Int. J. Rock Mech. Min. Sci. Géoméch. Abstr. 1993, 30, 883–899. [Google Scholar] [CrossRef]
  61. Urbancic, T.I.; Trifu, C.-I.; Long, J.M.; Young, R.P. Space-time Correlations of b Values with Stress Release. Appl. Geophys. 1992, 139, 449–462. [Google Scholar] [CrossRef]
  62. Vallejos, J.; McKinnon, S. Correlations between mining and seismicity for re-entry protocol development. Int. J. Rock Mech. Min. Sci. 2011, 48, 616–625. [Google Scholar] [CrossRef]
  63. Ma, X.; Westman, E.; Slaker, B.; Thibodeau, D.; Counter, D. The b-value evolution of mining-induced seismicity and mainshock occurrences at hard-rock mines. Int. J. Rock Mech. Min. Sci. 2018, 104, 64–70. [Google Scholar] [CrossRef]
Figure 1. Location of the Fankou Lead/Zinc Mine and faults’ distribution in the Fankou mining area [38].
Minerals 12 00318 g001
Figure 2. Failure process of stress-strain [43].
Minerals 12 00318 g002
Figure 3. The time evolution of the energy index, Schmidt number and cumulative apparent volume at the −600 m mining level.
Minerals 12 00318 g003
Figure 4. Source parameters of ‘7.26’ microseismic event.
Minerals 12 00318 g004
Figure 5. Displacement contours tracking result of microseismic activity at −600 m level from 29 June 2017 to 26 July 2017.
Minerals 12 00318 g005
Figure 6. Different waveforms in the Fankou Lead/Zinc Mine: (a) The waveform of the ‘7.26’ event recorded by geophone no. −550S21U in the Fankou Lead/Zinc Mine; (b) The other classic waveforms in the Fankou Lead/Zinc Mine.
Minerals 12 00318 g006
Figure 7. Magnitude frequency relationship of each mining level.
Minerals 12 00318 g007aMinerals 12 00318 g007b
Figure 8. Relationship between b-value and M (max).
Minerals 12 00318 g008
Table 1. Physical and mechanical parameters.
Rock Typeρ(g/cm3)vp(m/s)E(GPa)μCUS(MPa)BTS(MPa)c(MPa)φ(°)
D2da2.77567631.30.22129.0311.3713.6748.44
Lead zinc Ore3.46523054.460.25143.057.9--
Pyrite4.59405061.110.22163.796.7222.6545.28
D2db2.72591055.090.2390.756.9114.5446.64
D3ta2.7516620.890.2570.637.1712.8147.21
D3tb2.72541420.60.2565.714.73--
Filling body1.7222222.150.2110.820.911.8141.58
ρ, vp, E, μ, CUS, BTS, c and φ represent the density, longitudinal wave velocity, elastic modulus, Poisson’s ratio, compressive strength, tensile strength, cohesion and internal friction angle, respectively.
Table 2. Maximum vibration velocity of rock mass.
No.Geophone NumberMaximum Vibration Velocities (mm/s)No.Geophone NumberMaximum Vibration Velocities (mm/s)No.Geophone NumberMaximum Vibration Velocities (mm/s)
1−550S21U7.7911−650S31T9.4921−360S09U7.97
2−455S13U6.7212−360S08U1.9822−455S18T7.05
3−650S27U2.7613−455S19U9.423−550S23U3.75
4−650S28U5.9814−280S06U5.3524−550S24U7.29
5−650S32U3.4115−455S15U1.6325−455S16U7.63
6−360S07U2.4816−280S02U8.1426−360S11T9.12
7−455S14T3.9717−280S05U4.2827−360S10U5.24
8−455S20U3.3418−280S03T1.5128−360S12U1.08
9−550S22T2.2319−650S30U4.0229−455S17U3.94
10−650S29U1.5220−280S04U2.82
Table 3. Risk classification and ranking method based on value ranges of microseismic statistical parameters.
NL ValueScore(NS/NL) ValueScoreNT ValueScore
NL (ML ≥ 0) > 0 & NL (ML ≥ 0.4) = 0−1NS/NL ≥ 100−1NT ≤ 100−1
NL (ML > 0.4) > 0 & NL (ML ≥ 0.8) = 0050 ≤ NS/NL < 1000100 < NT ≤ 5000
NL (ML > 0.8) > 01NS/NL < 501NT > 5001
Table 4. Statistical results of microseismic events and scores for each mining level from December 2016 to November 2018.
Mining LevelNTNSNLNS/NLScore of NS/NLTotal
−240 m5756156.000−1
−280 m9787108.701−1
−320 m213189247.8810
−360 m3773562116.9510
−400 m6996801935.7911
−455 m9839612243.6811
−500 m8858701558.0001
−550 m5675541342.6211
−600 m101910021758.9401
−650 m200119974499.25−11
−710 m4114074101.75−10
Table 5. Statistics of events with ML > 0 at each mining level from December 2016 to November 2018.
Level00.10.20.30.40.50.60.70.91.11.4Score
−240 m----1------−1
−280 m-342---1---0
−320 m76423-111--1
−360 m6821111----0
−400 m65441------−1
−455 m258122-1-1-1
−500 m2441--1---11
−550 m1512-1-1---0
−600 m641221----21
−650 m12-1-------−1
−710 m3--1-------−1
Table 6. Risk classification of each mining level from December 2016 to November 2018.
LevelScore of NS/NLScore of NLScore of NtOverall ScoreRisk Rank
−240 m0−1−1−2Low
−280 m10−10Medium
−320 m1102High
−360 m1001Medium
−400 m1−111Medium
−455 m1113High
−500 m0112High
−550 m1012High
−600 m0112High
−650 m−1−11−1Medium
−710 m−1−10−2Low
Table 7. Maximum potential magnitude at each mining level and its recurrence time.
Levela-Valueb-ValueM (max)Number of Events Greater Than M (max) Recurrence Time (Day)Probability of Occurrence
−280 m1.11711.65090.6770>677<0.001477
−320 m1.39521.55320.89816770.001477
−360 m1.28952.10510.6132338.50.002954
−400 m1.42993.04920.4690>677<0.001477
−455 m1.3391.2231.09516770.001477
−500 m0.96790.78041.2416770.001477
−550 m1.06791.53560.69516770.001477
−600 m1.03440.62791.6470>677<0.001477
−650 m0.34552.0670.1670>677<0.001477
−710 m0.47711.59040.2999916770.0014771
Publisher’s Note: MDPI stays neutral with regard to jurisdictional claims in published maps and institutional affiliations.

