
Structural Setting of the Sixtymile Gold District, Yukon, Canada: Insights into Regional Deformation and Mineralization from Field Mapping and 3D Magnetic Inversion


Abstract
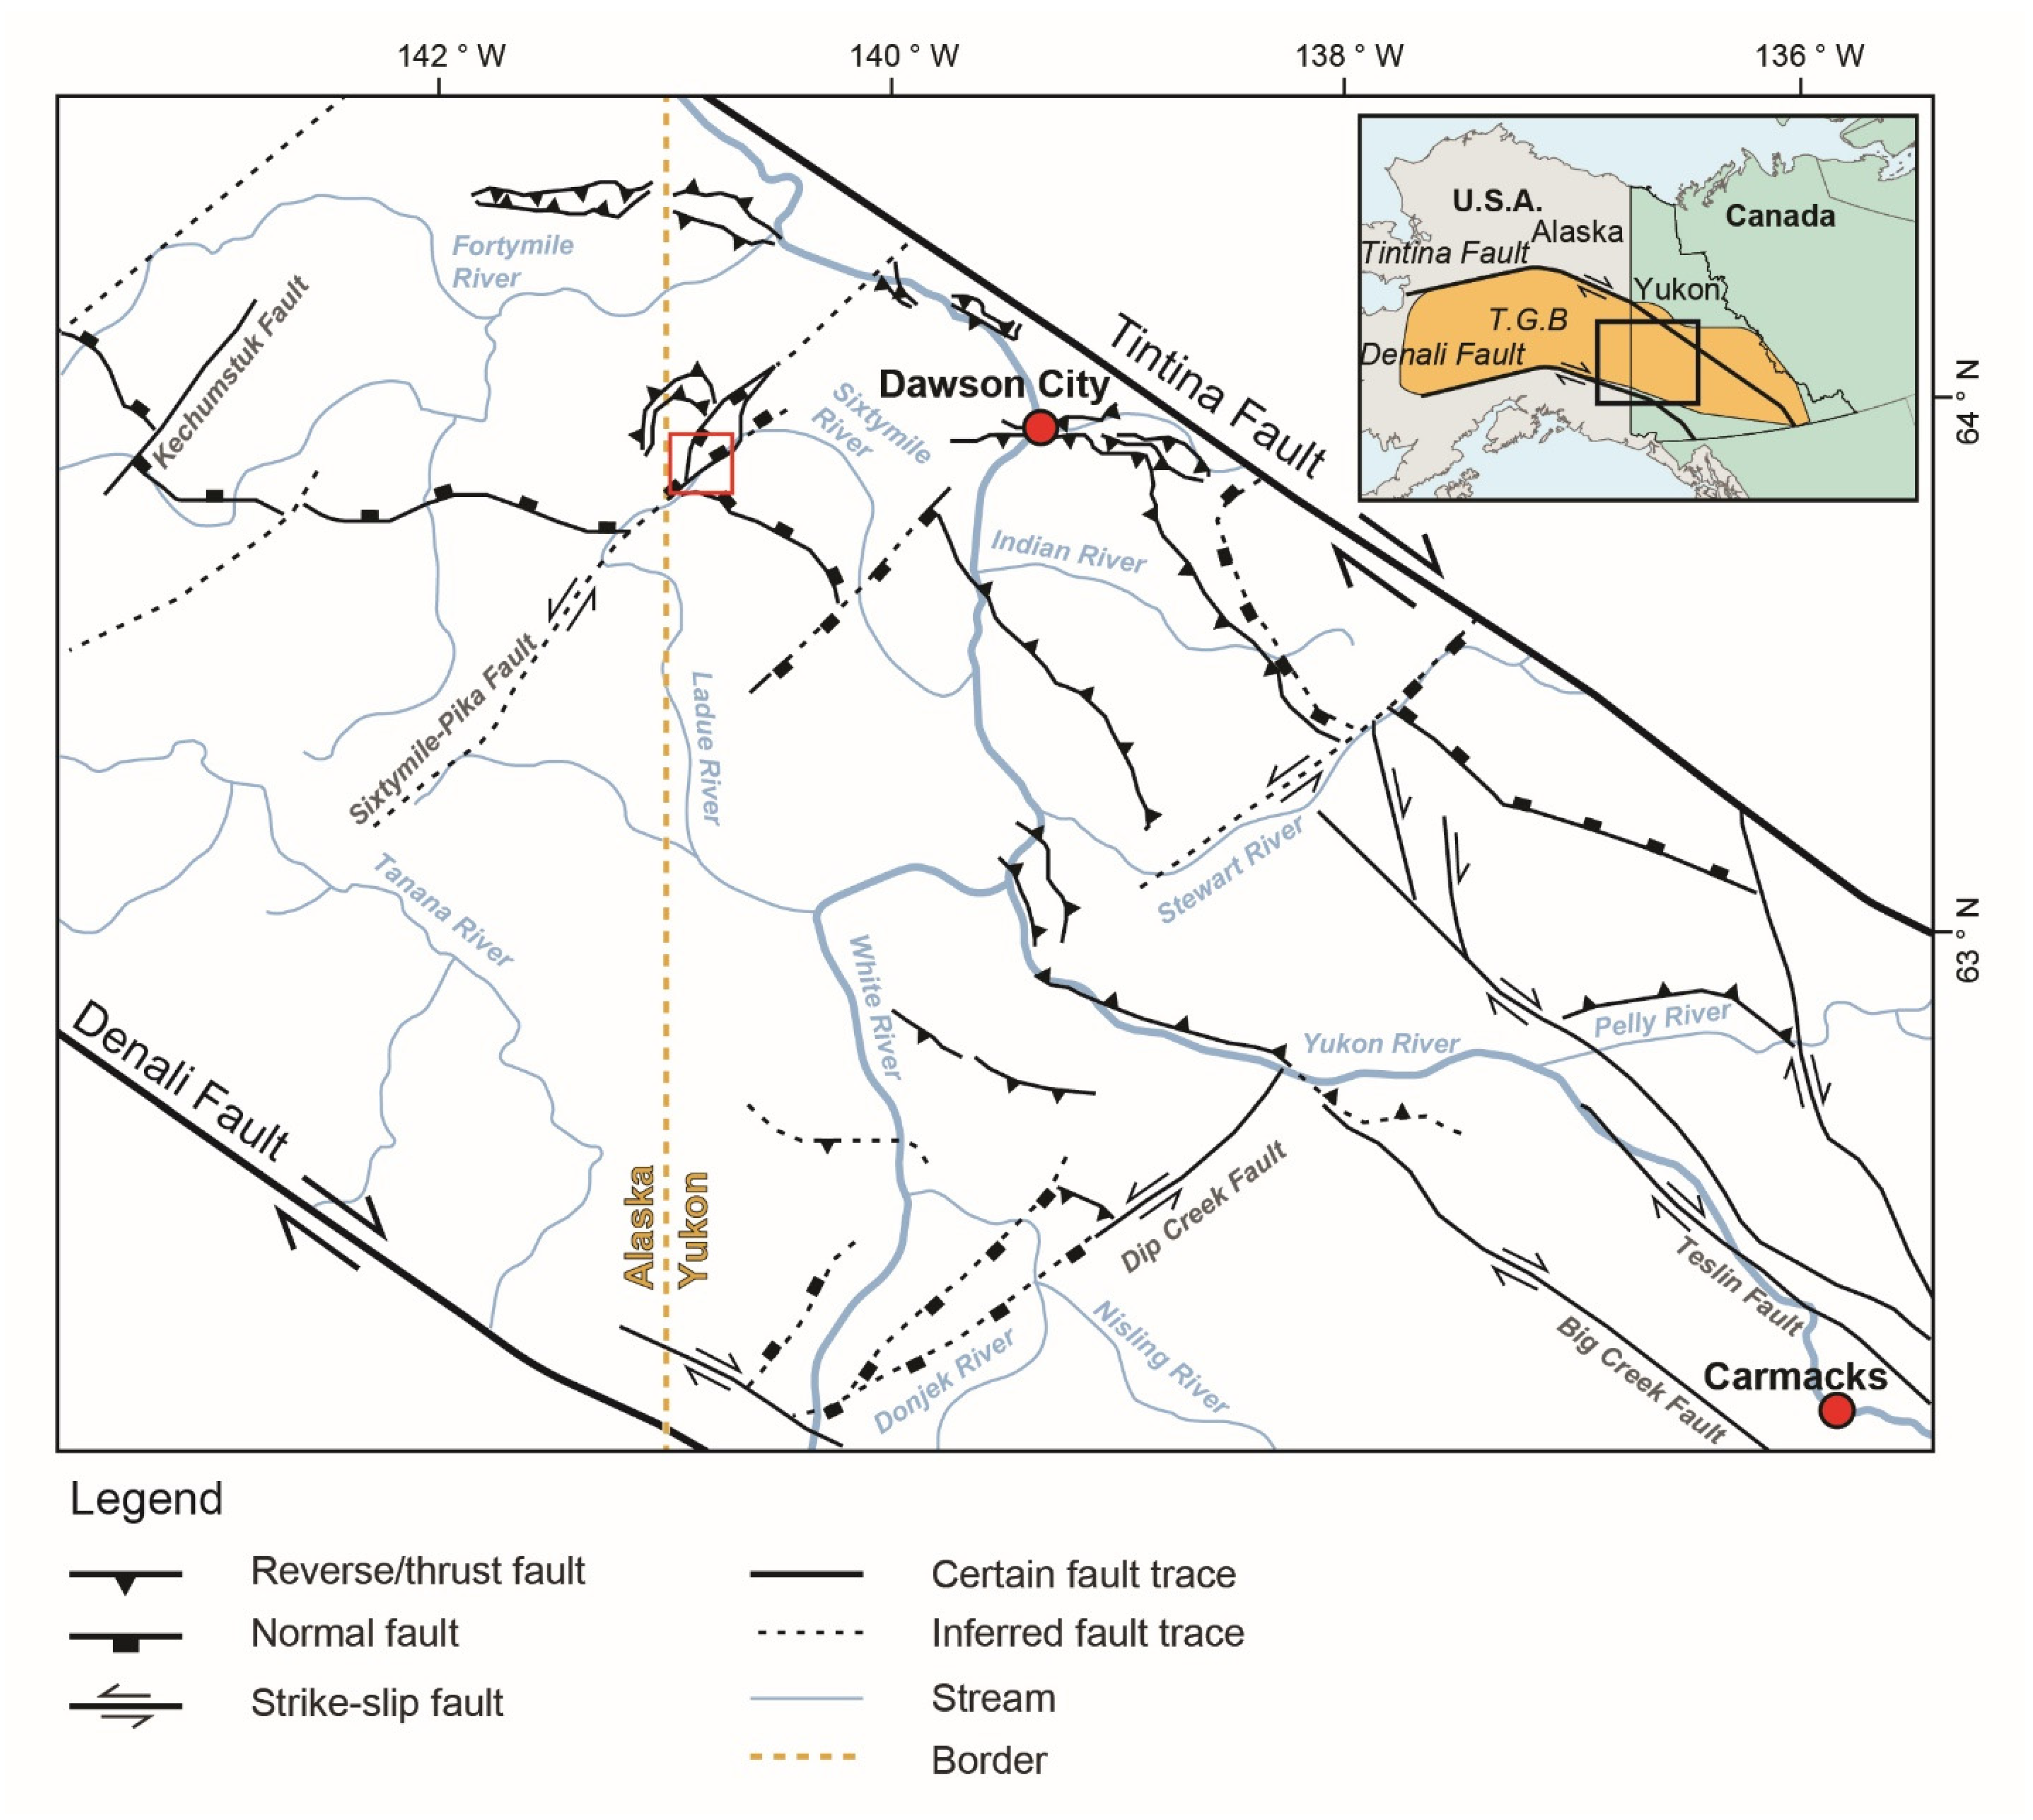
:1. Introduction
2. Geologic Background
3. Methods
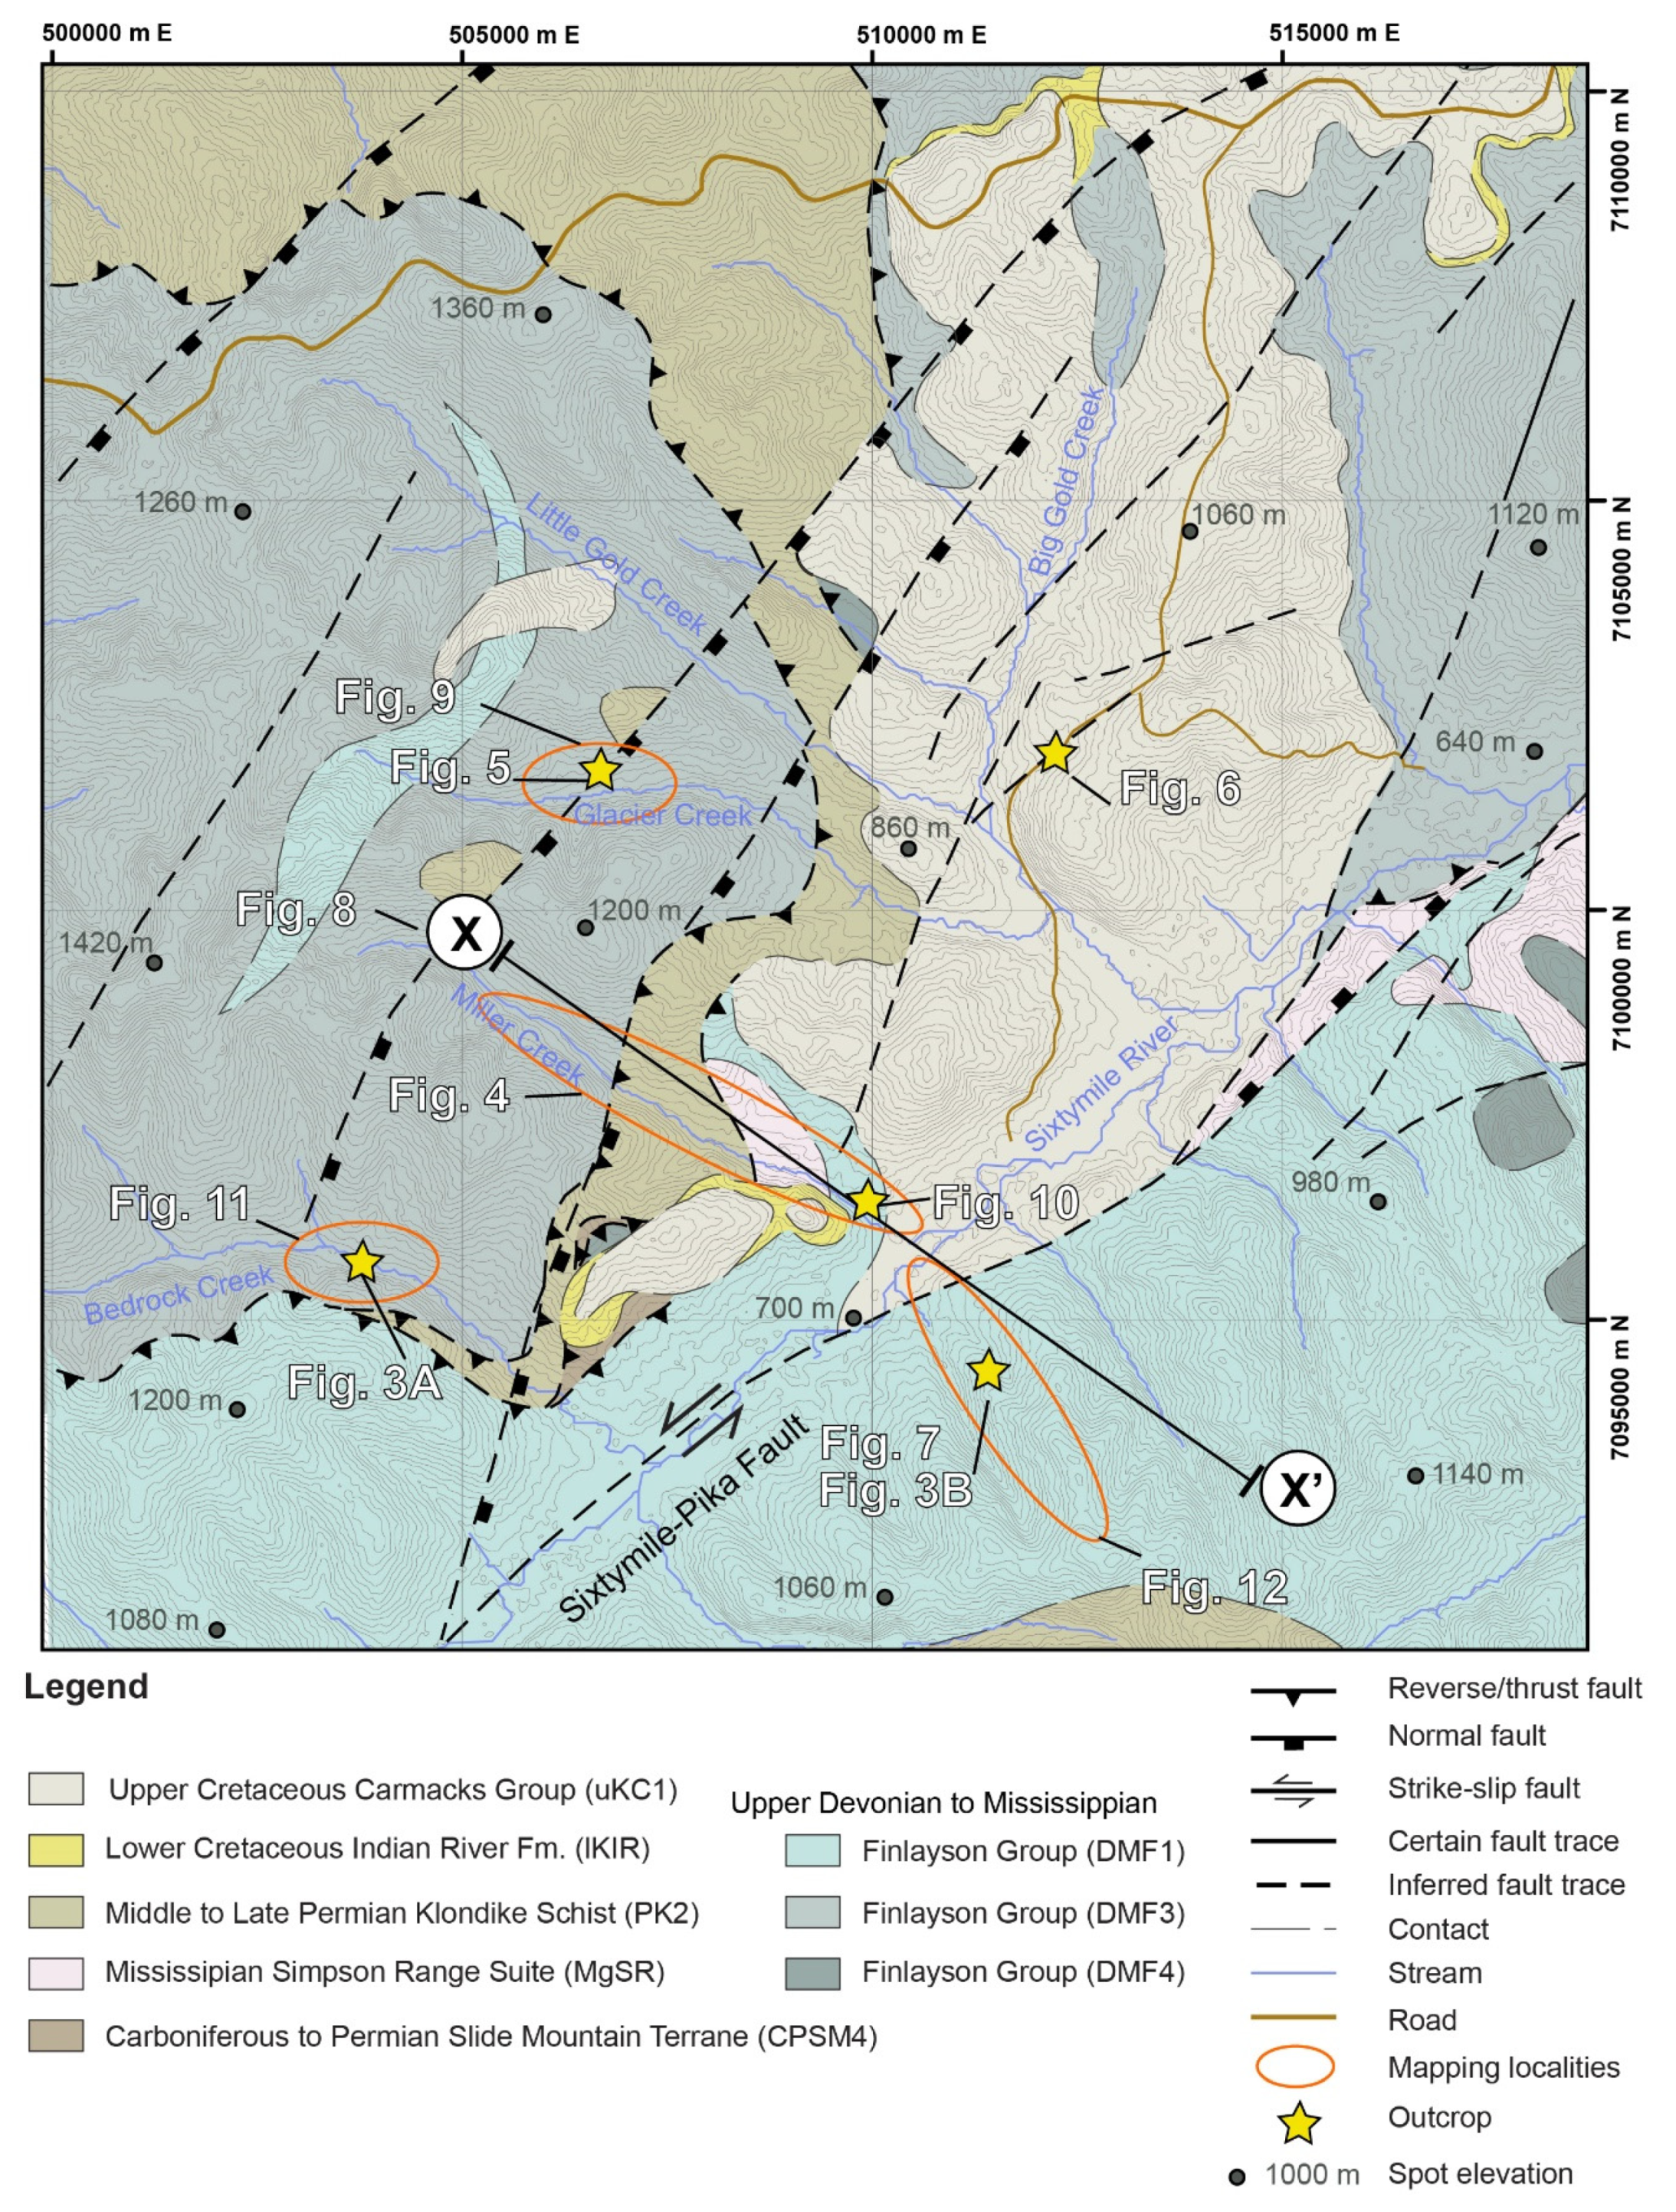
3.1. Geologic Mapping
3.2. 3D Inversion of Potential-Field Geophysical Data
4. Results
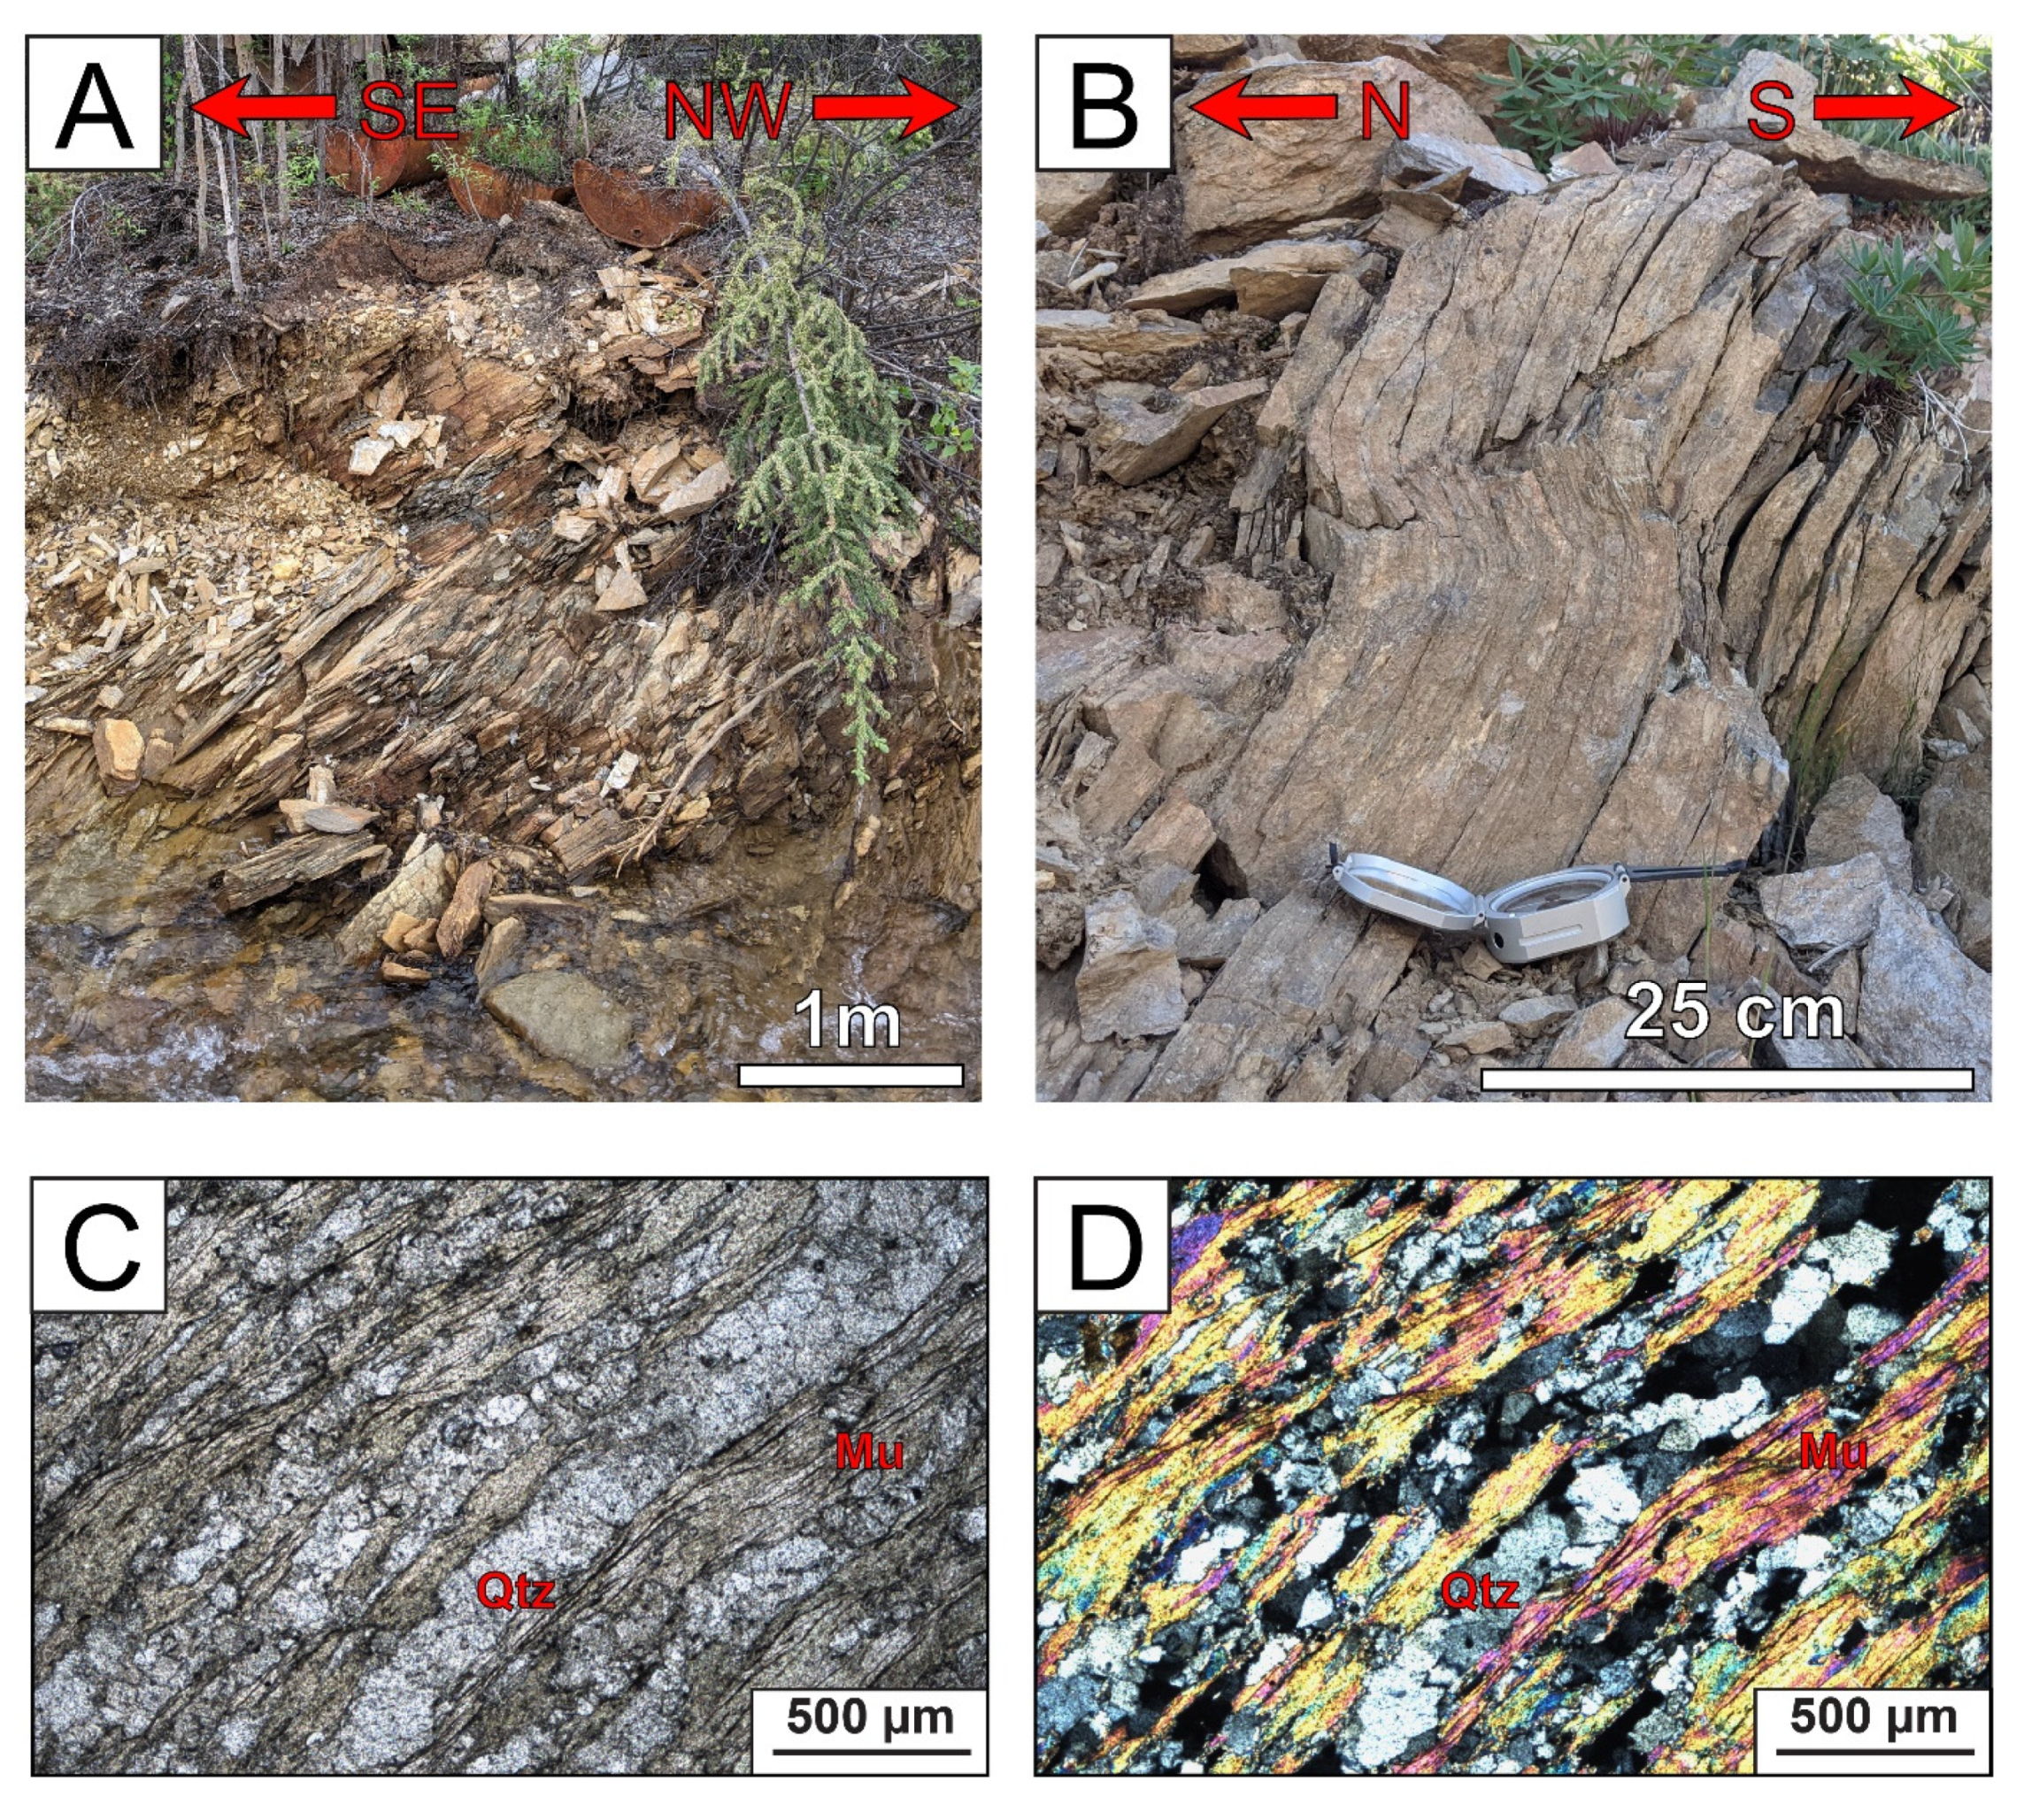
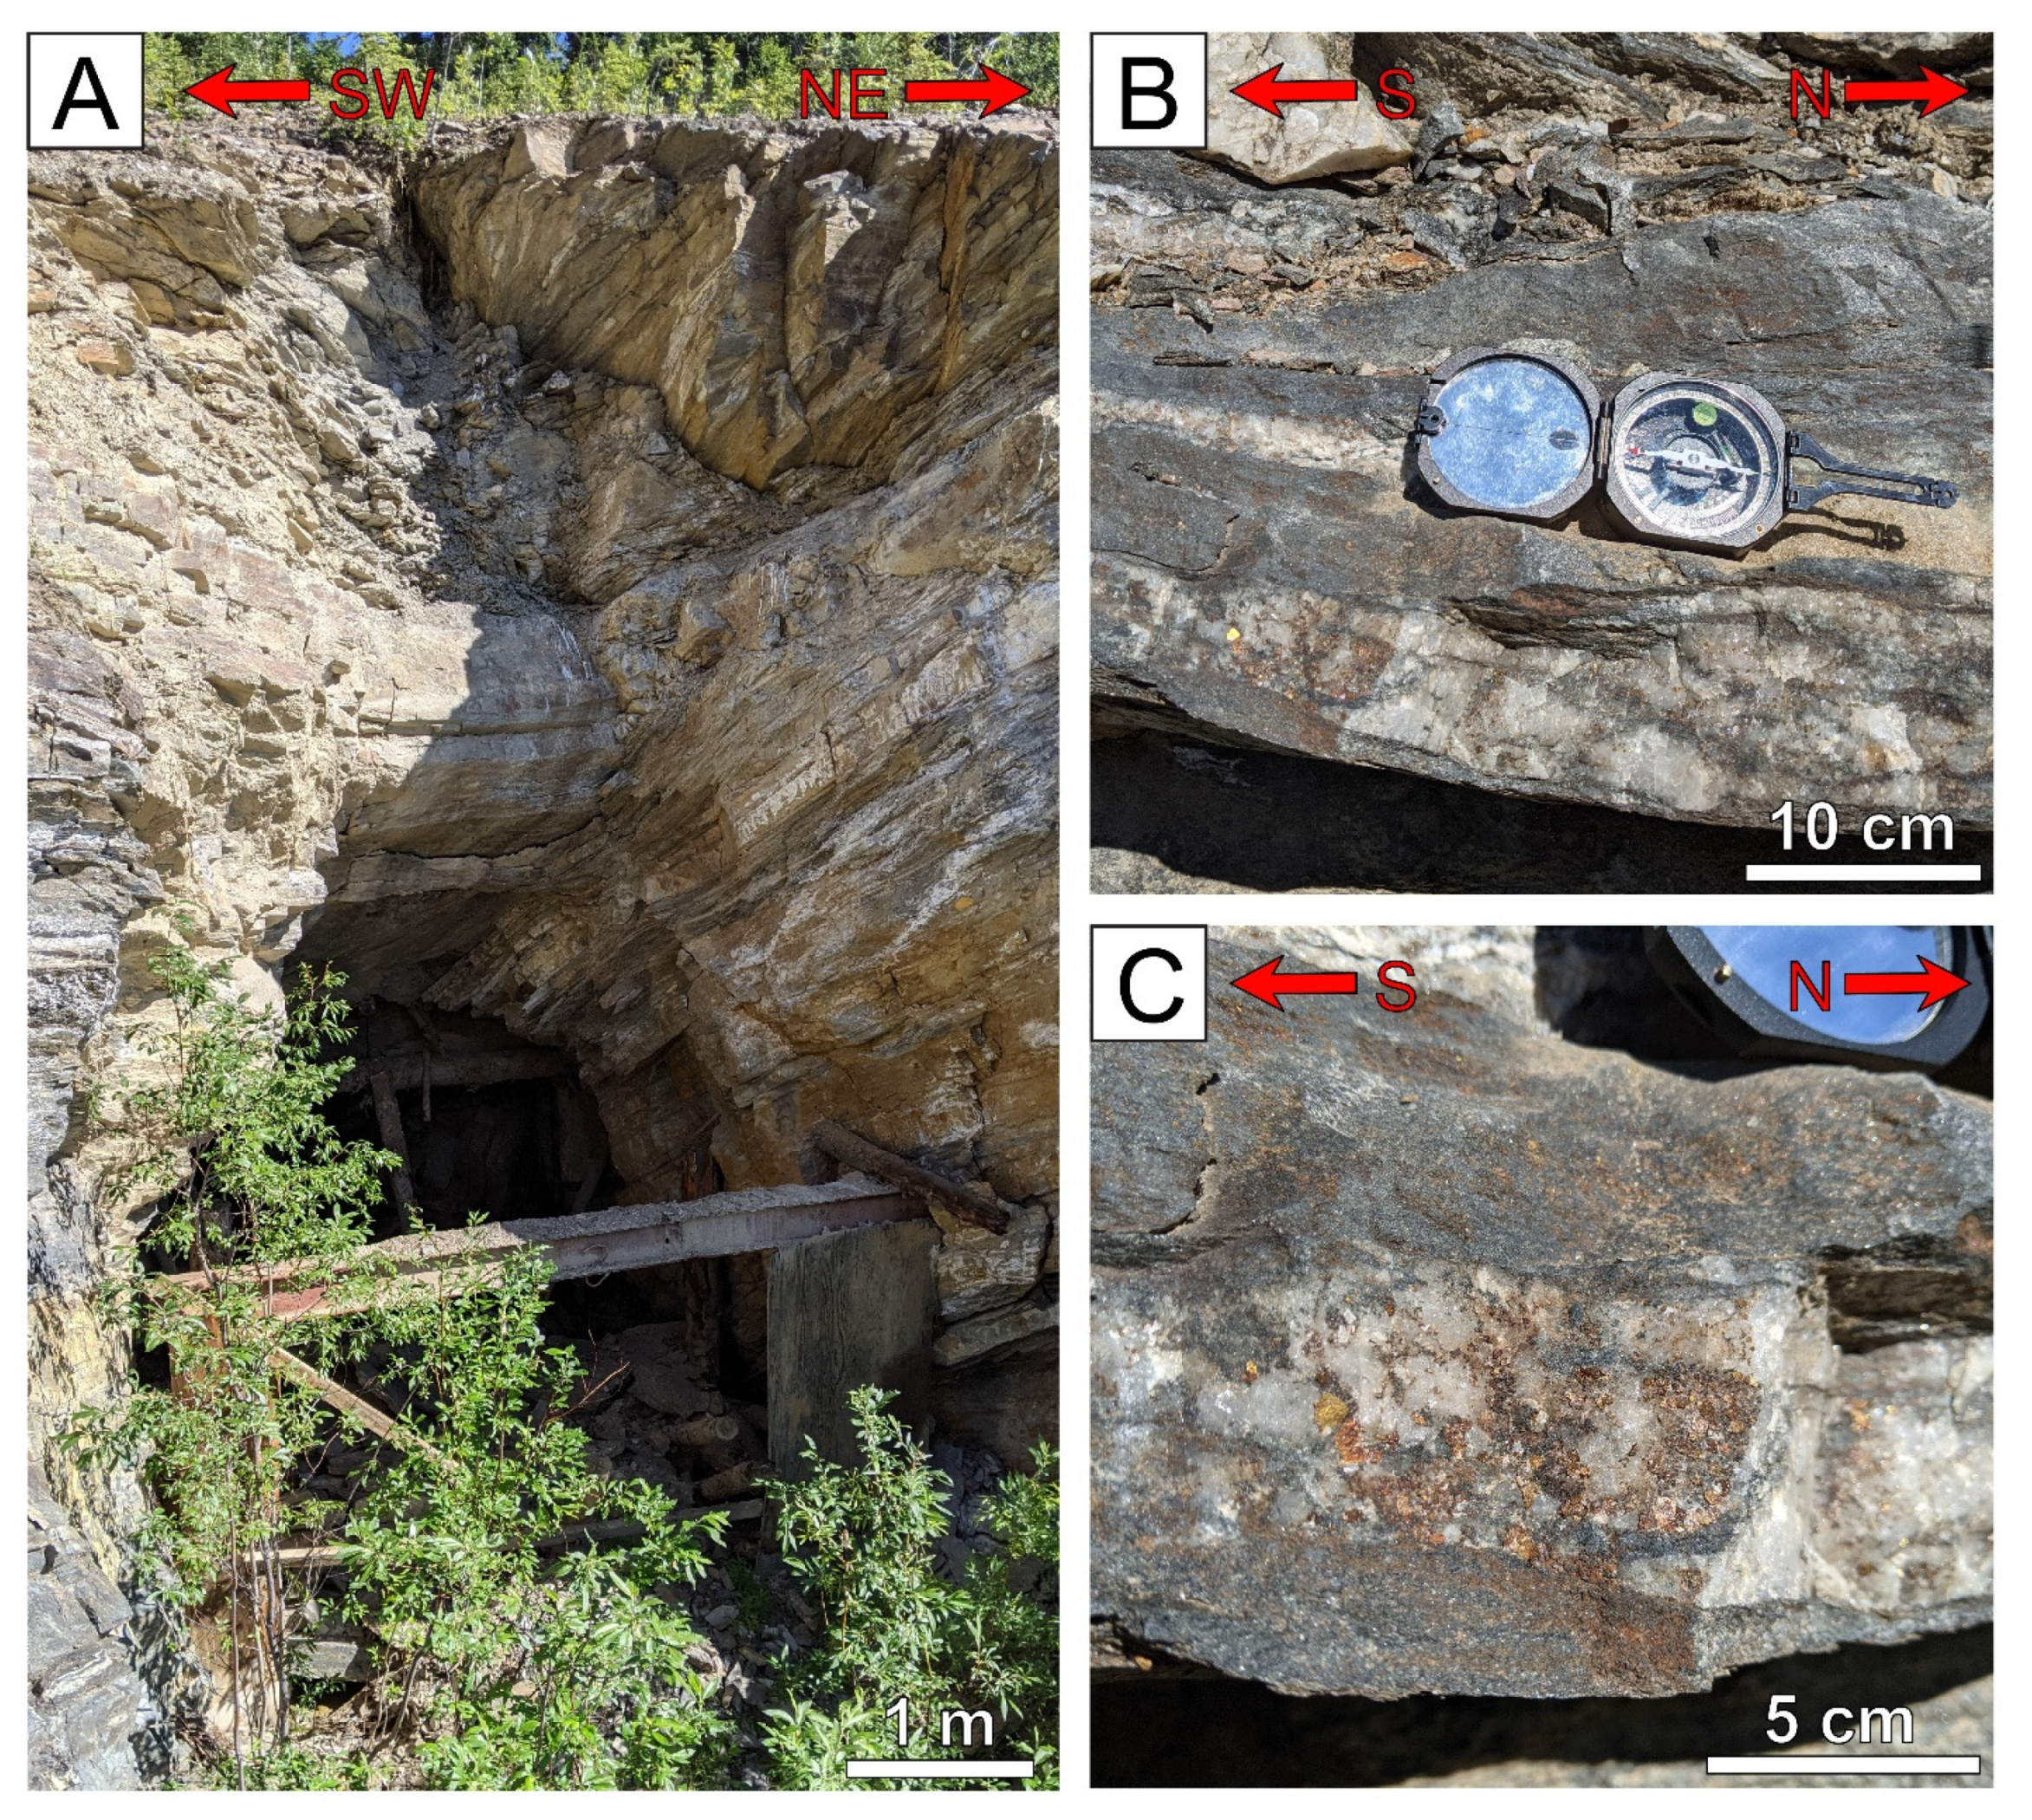
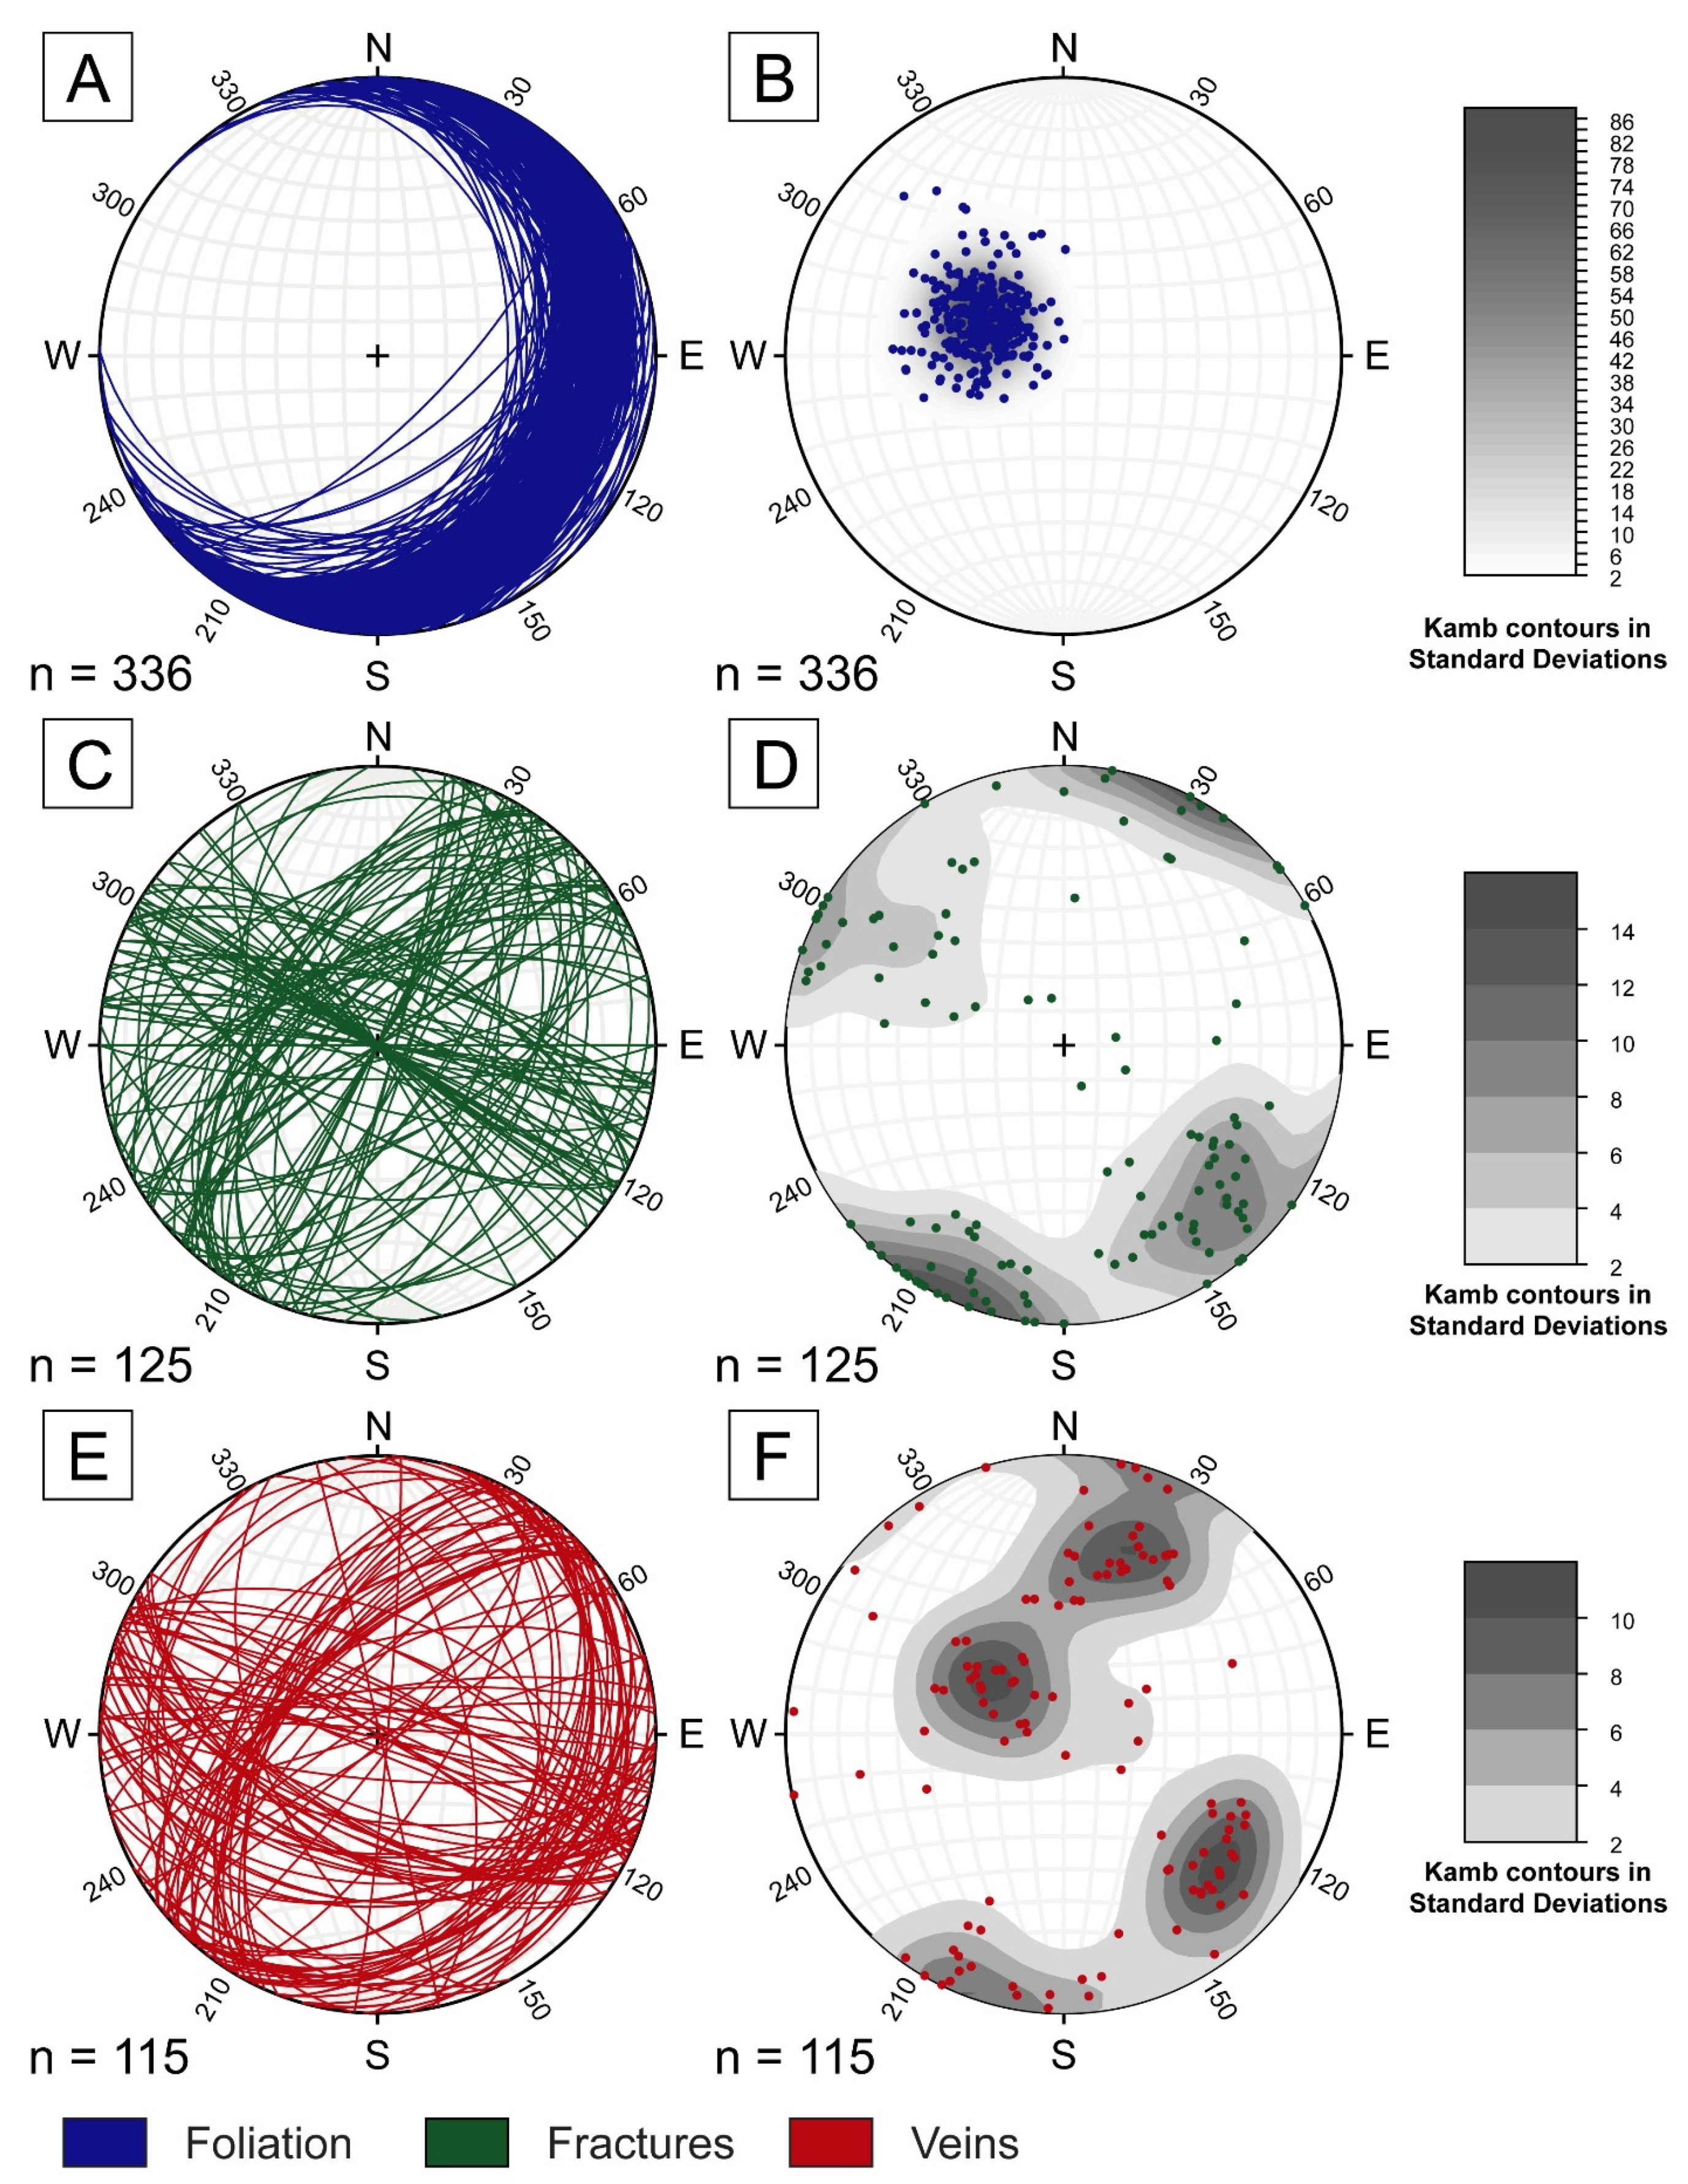
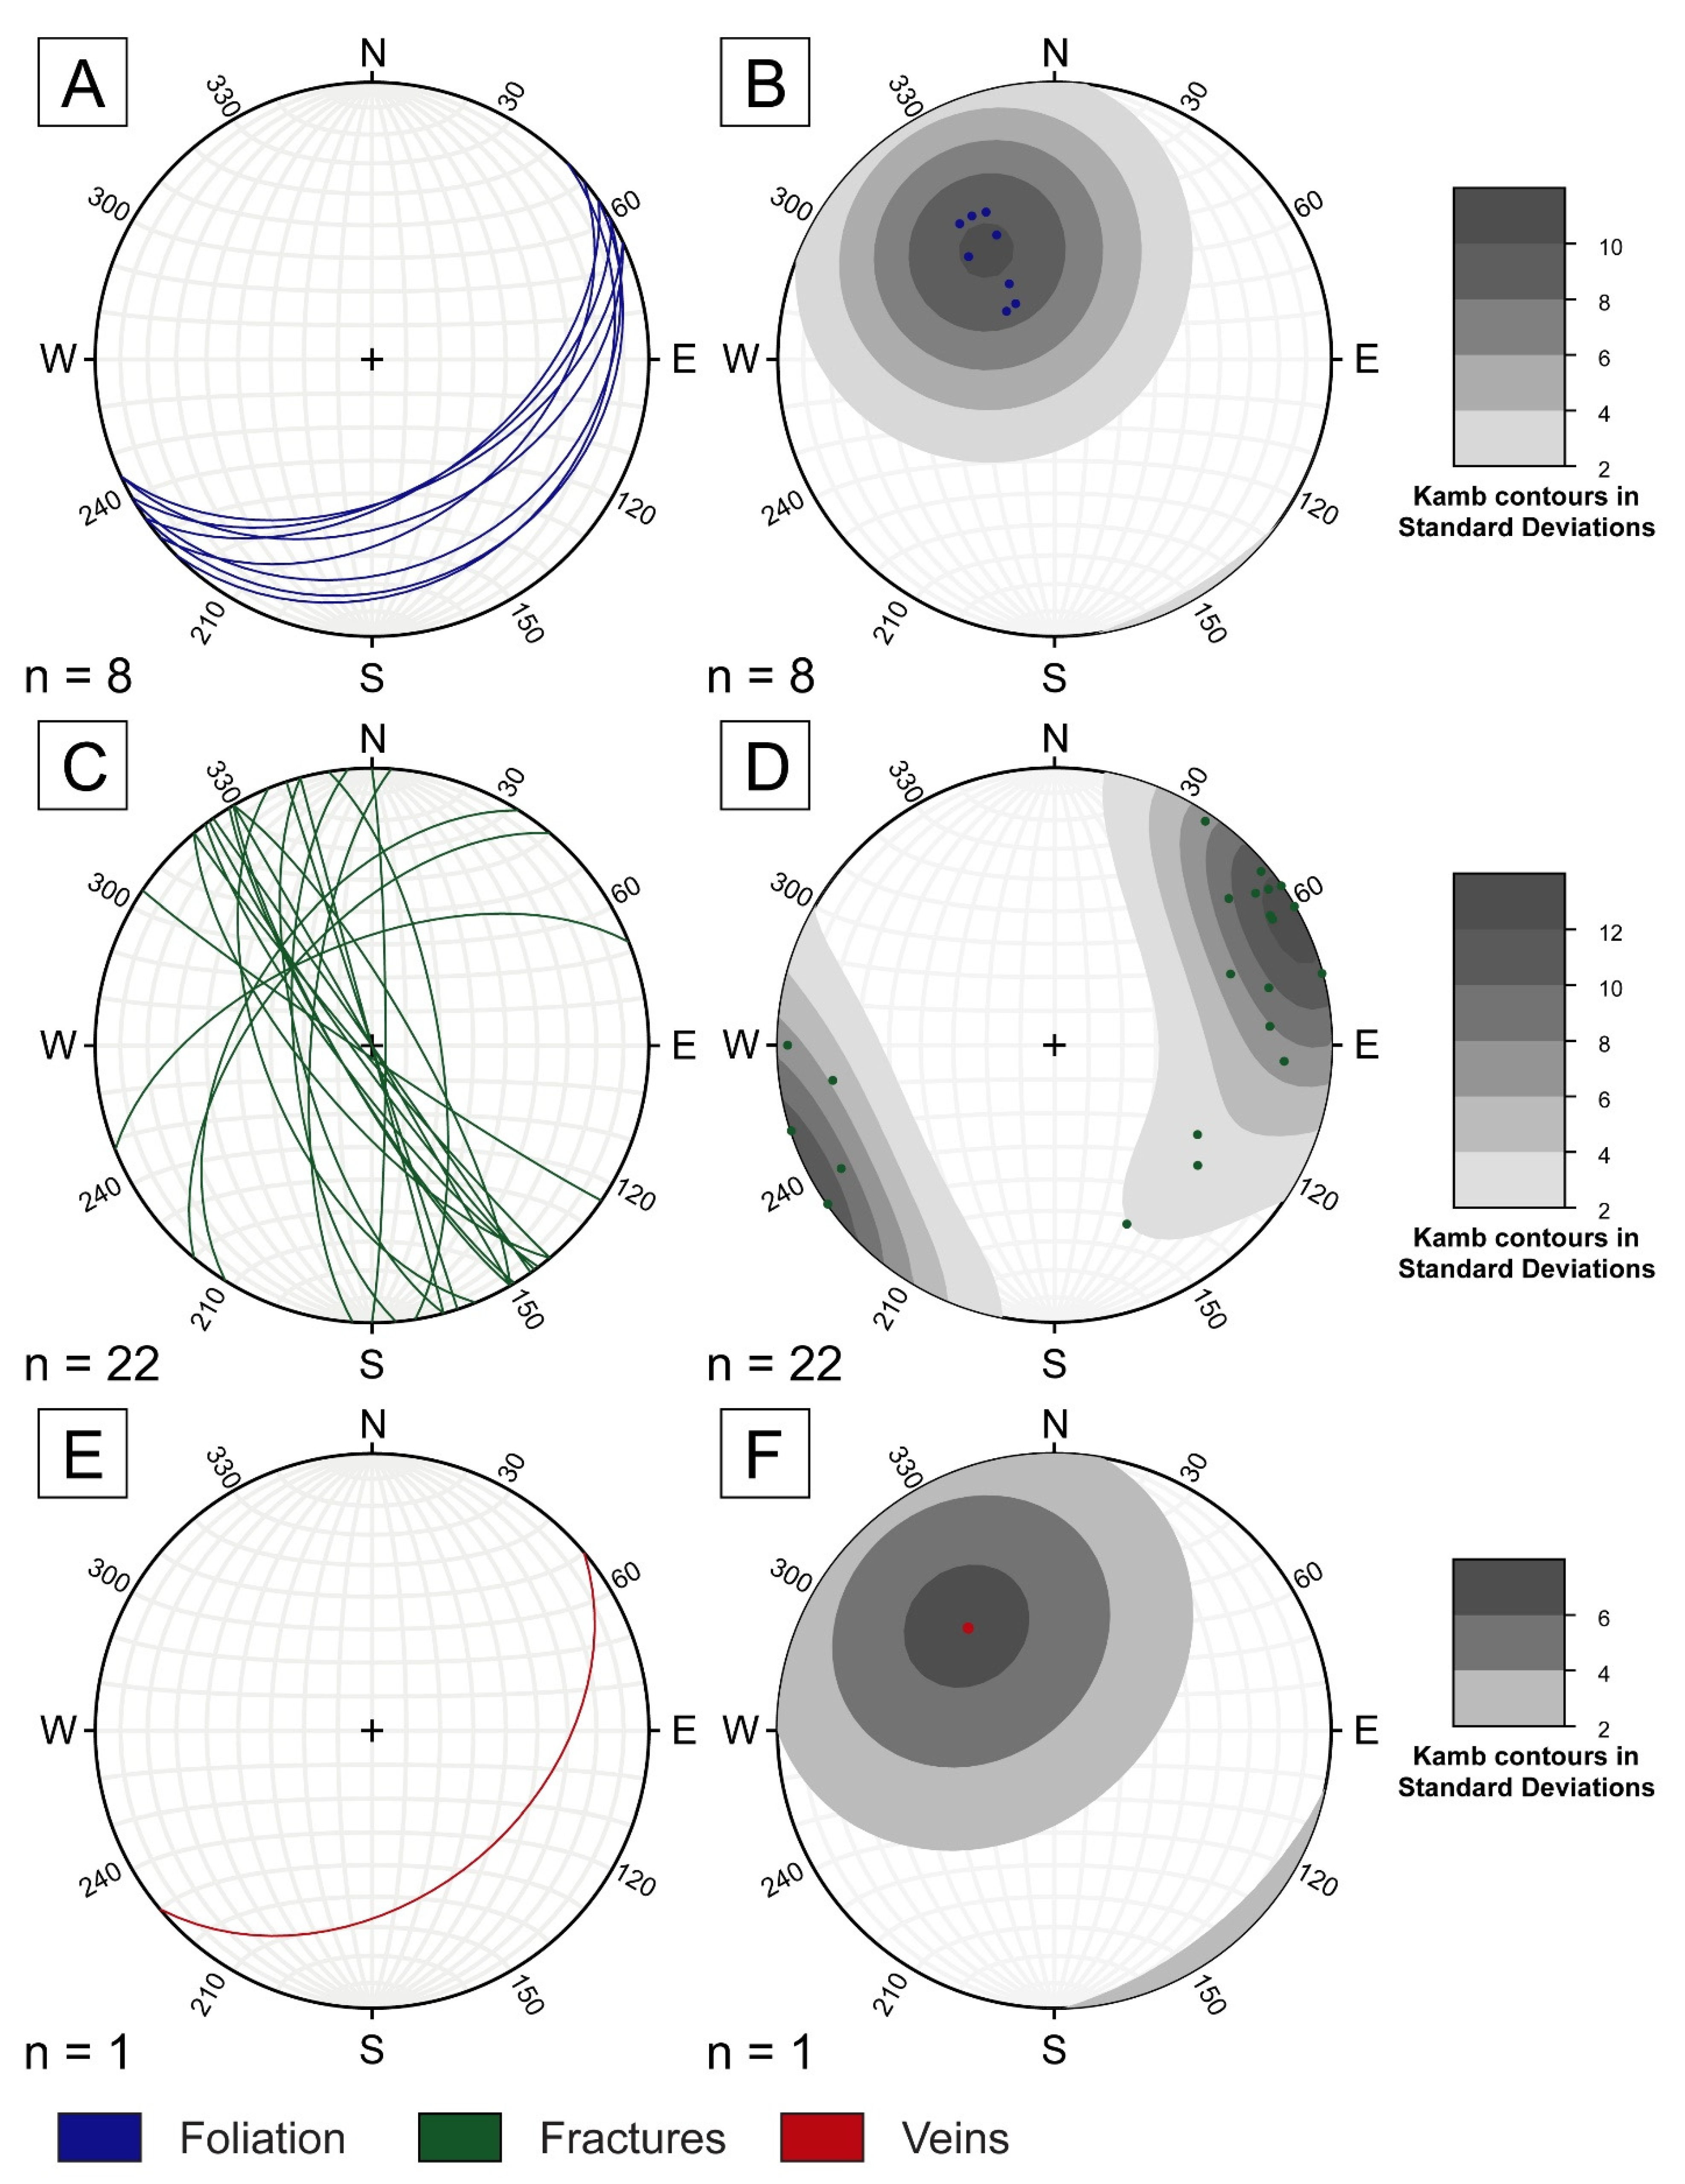
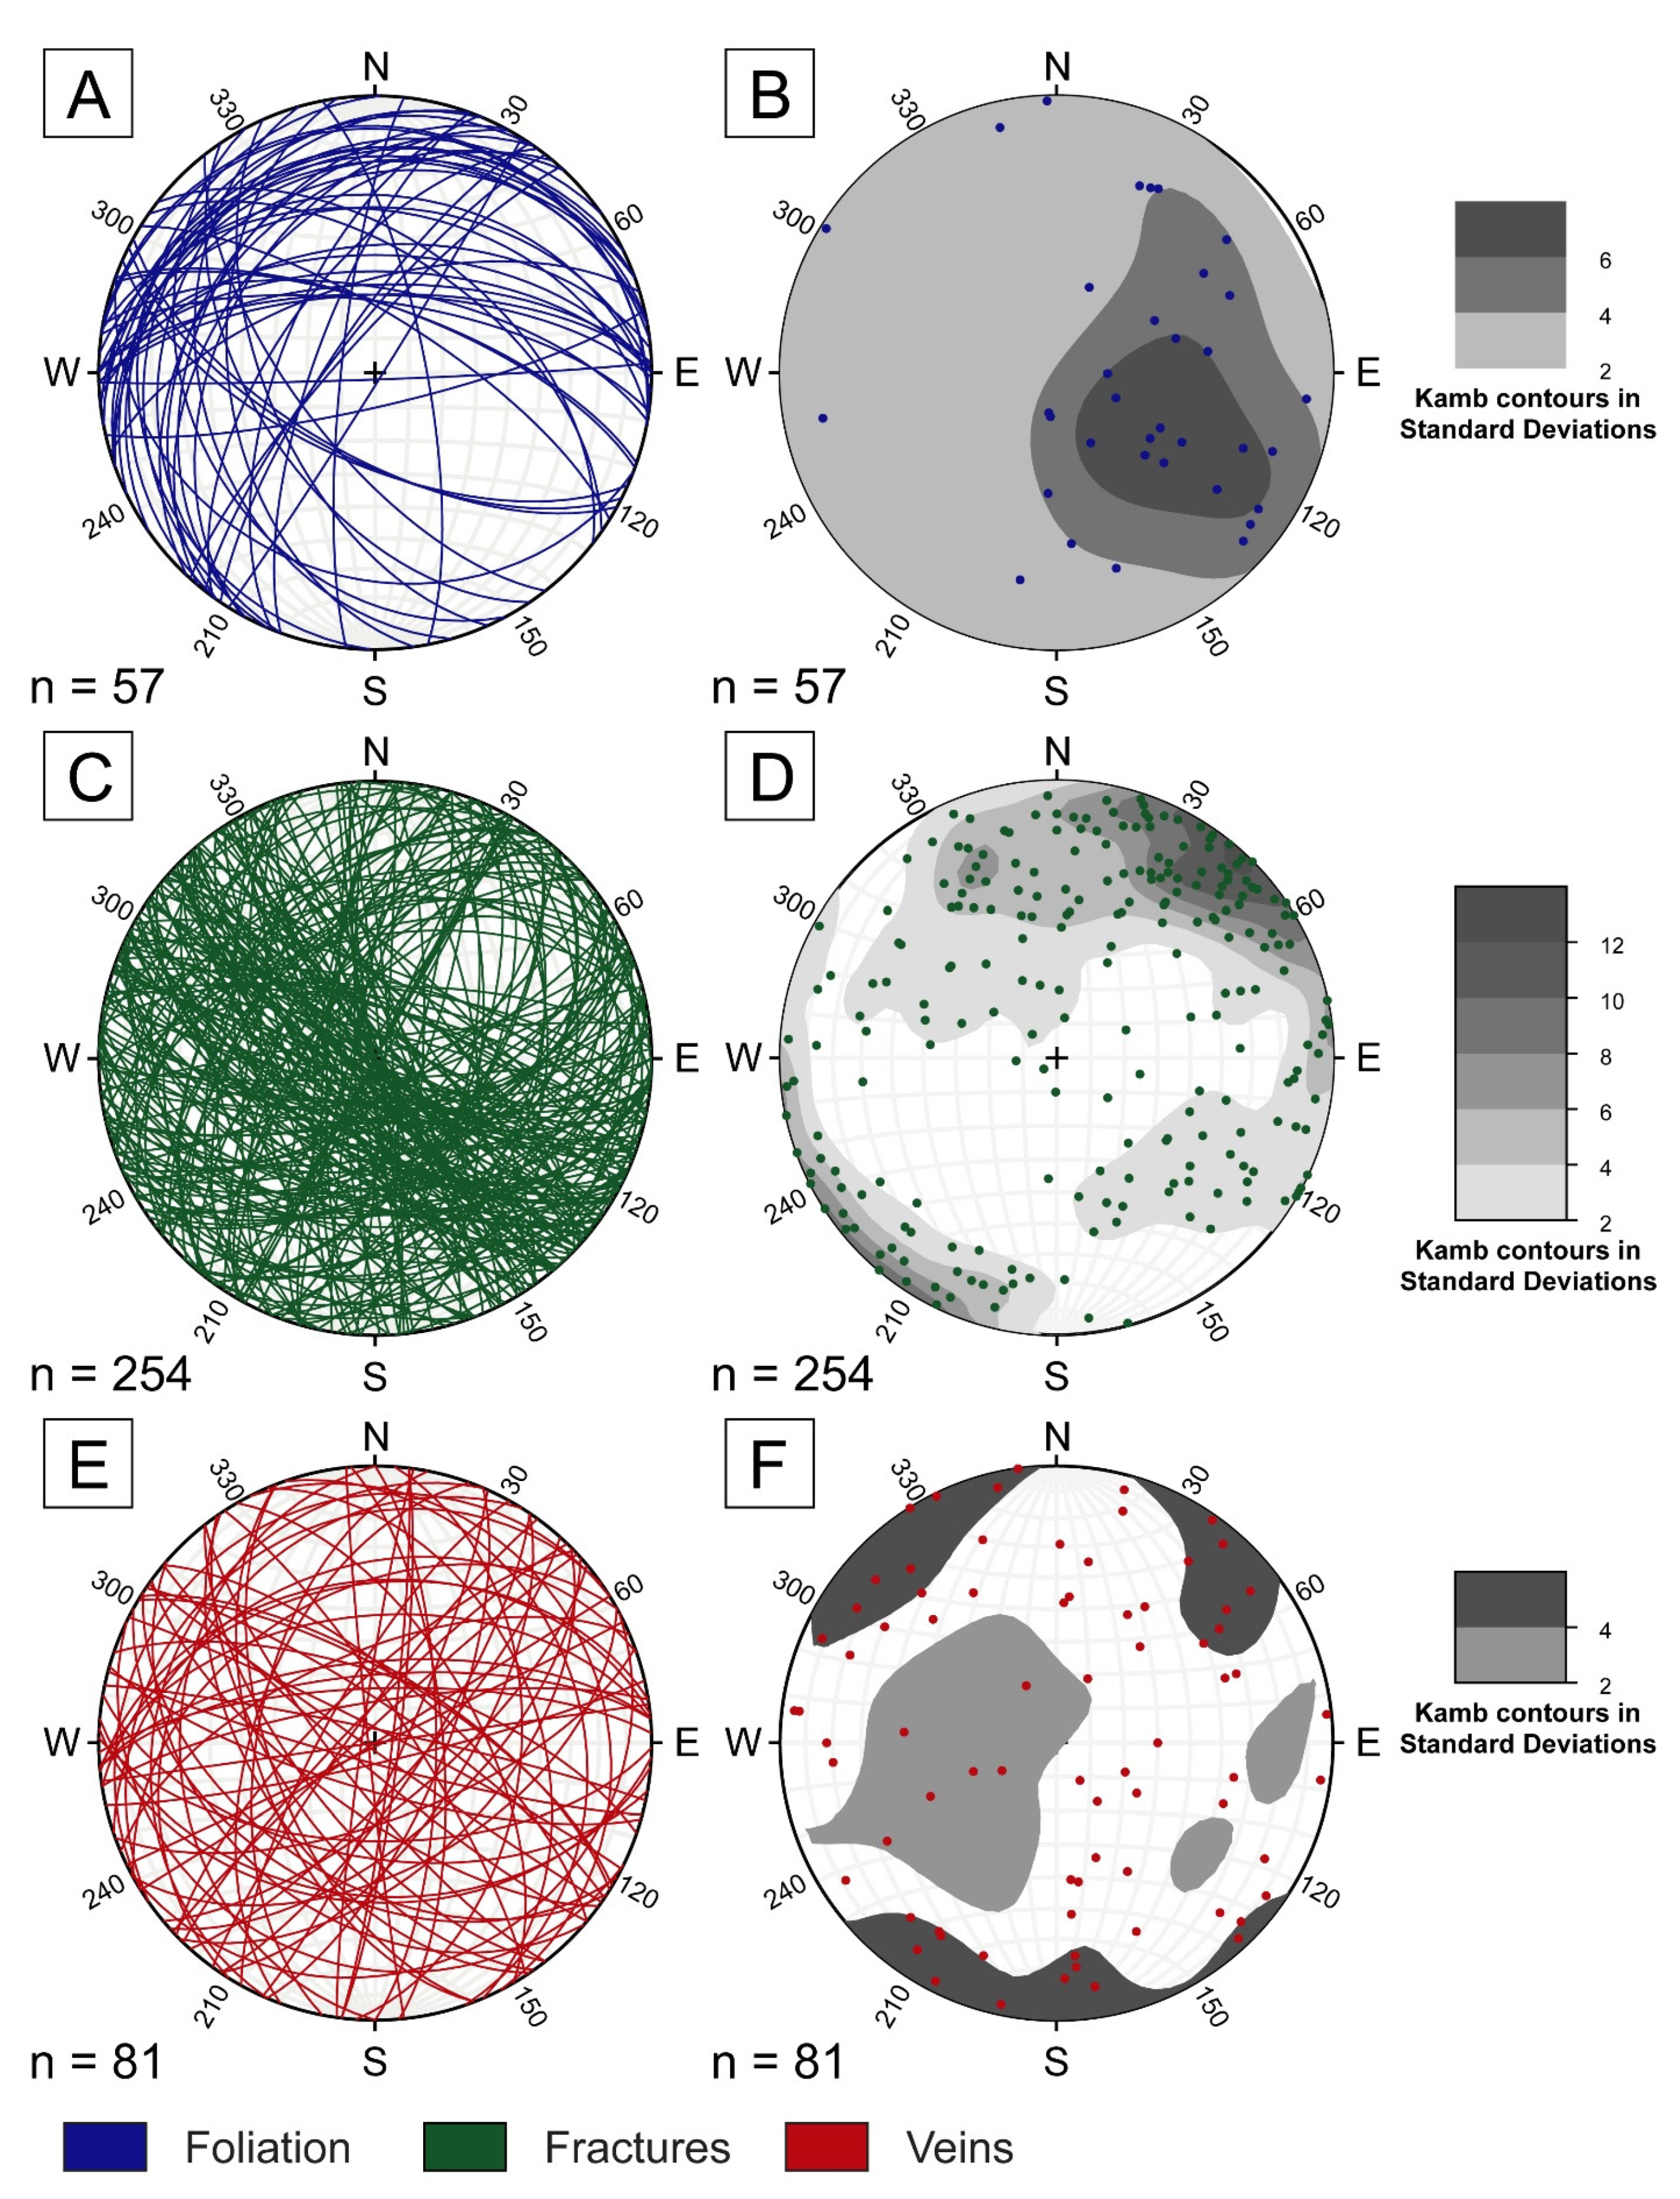
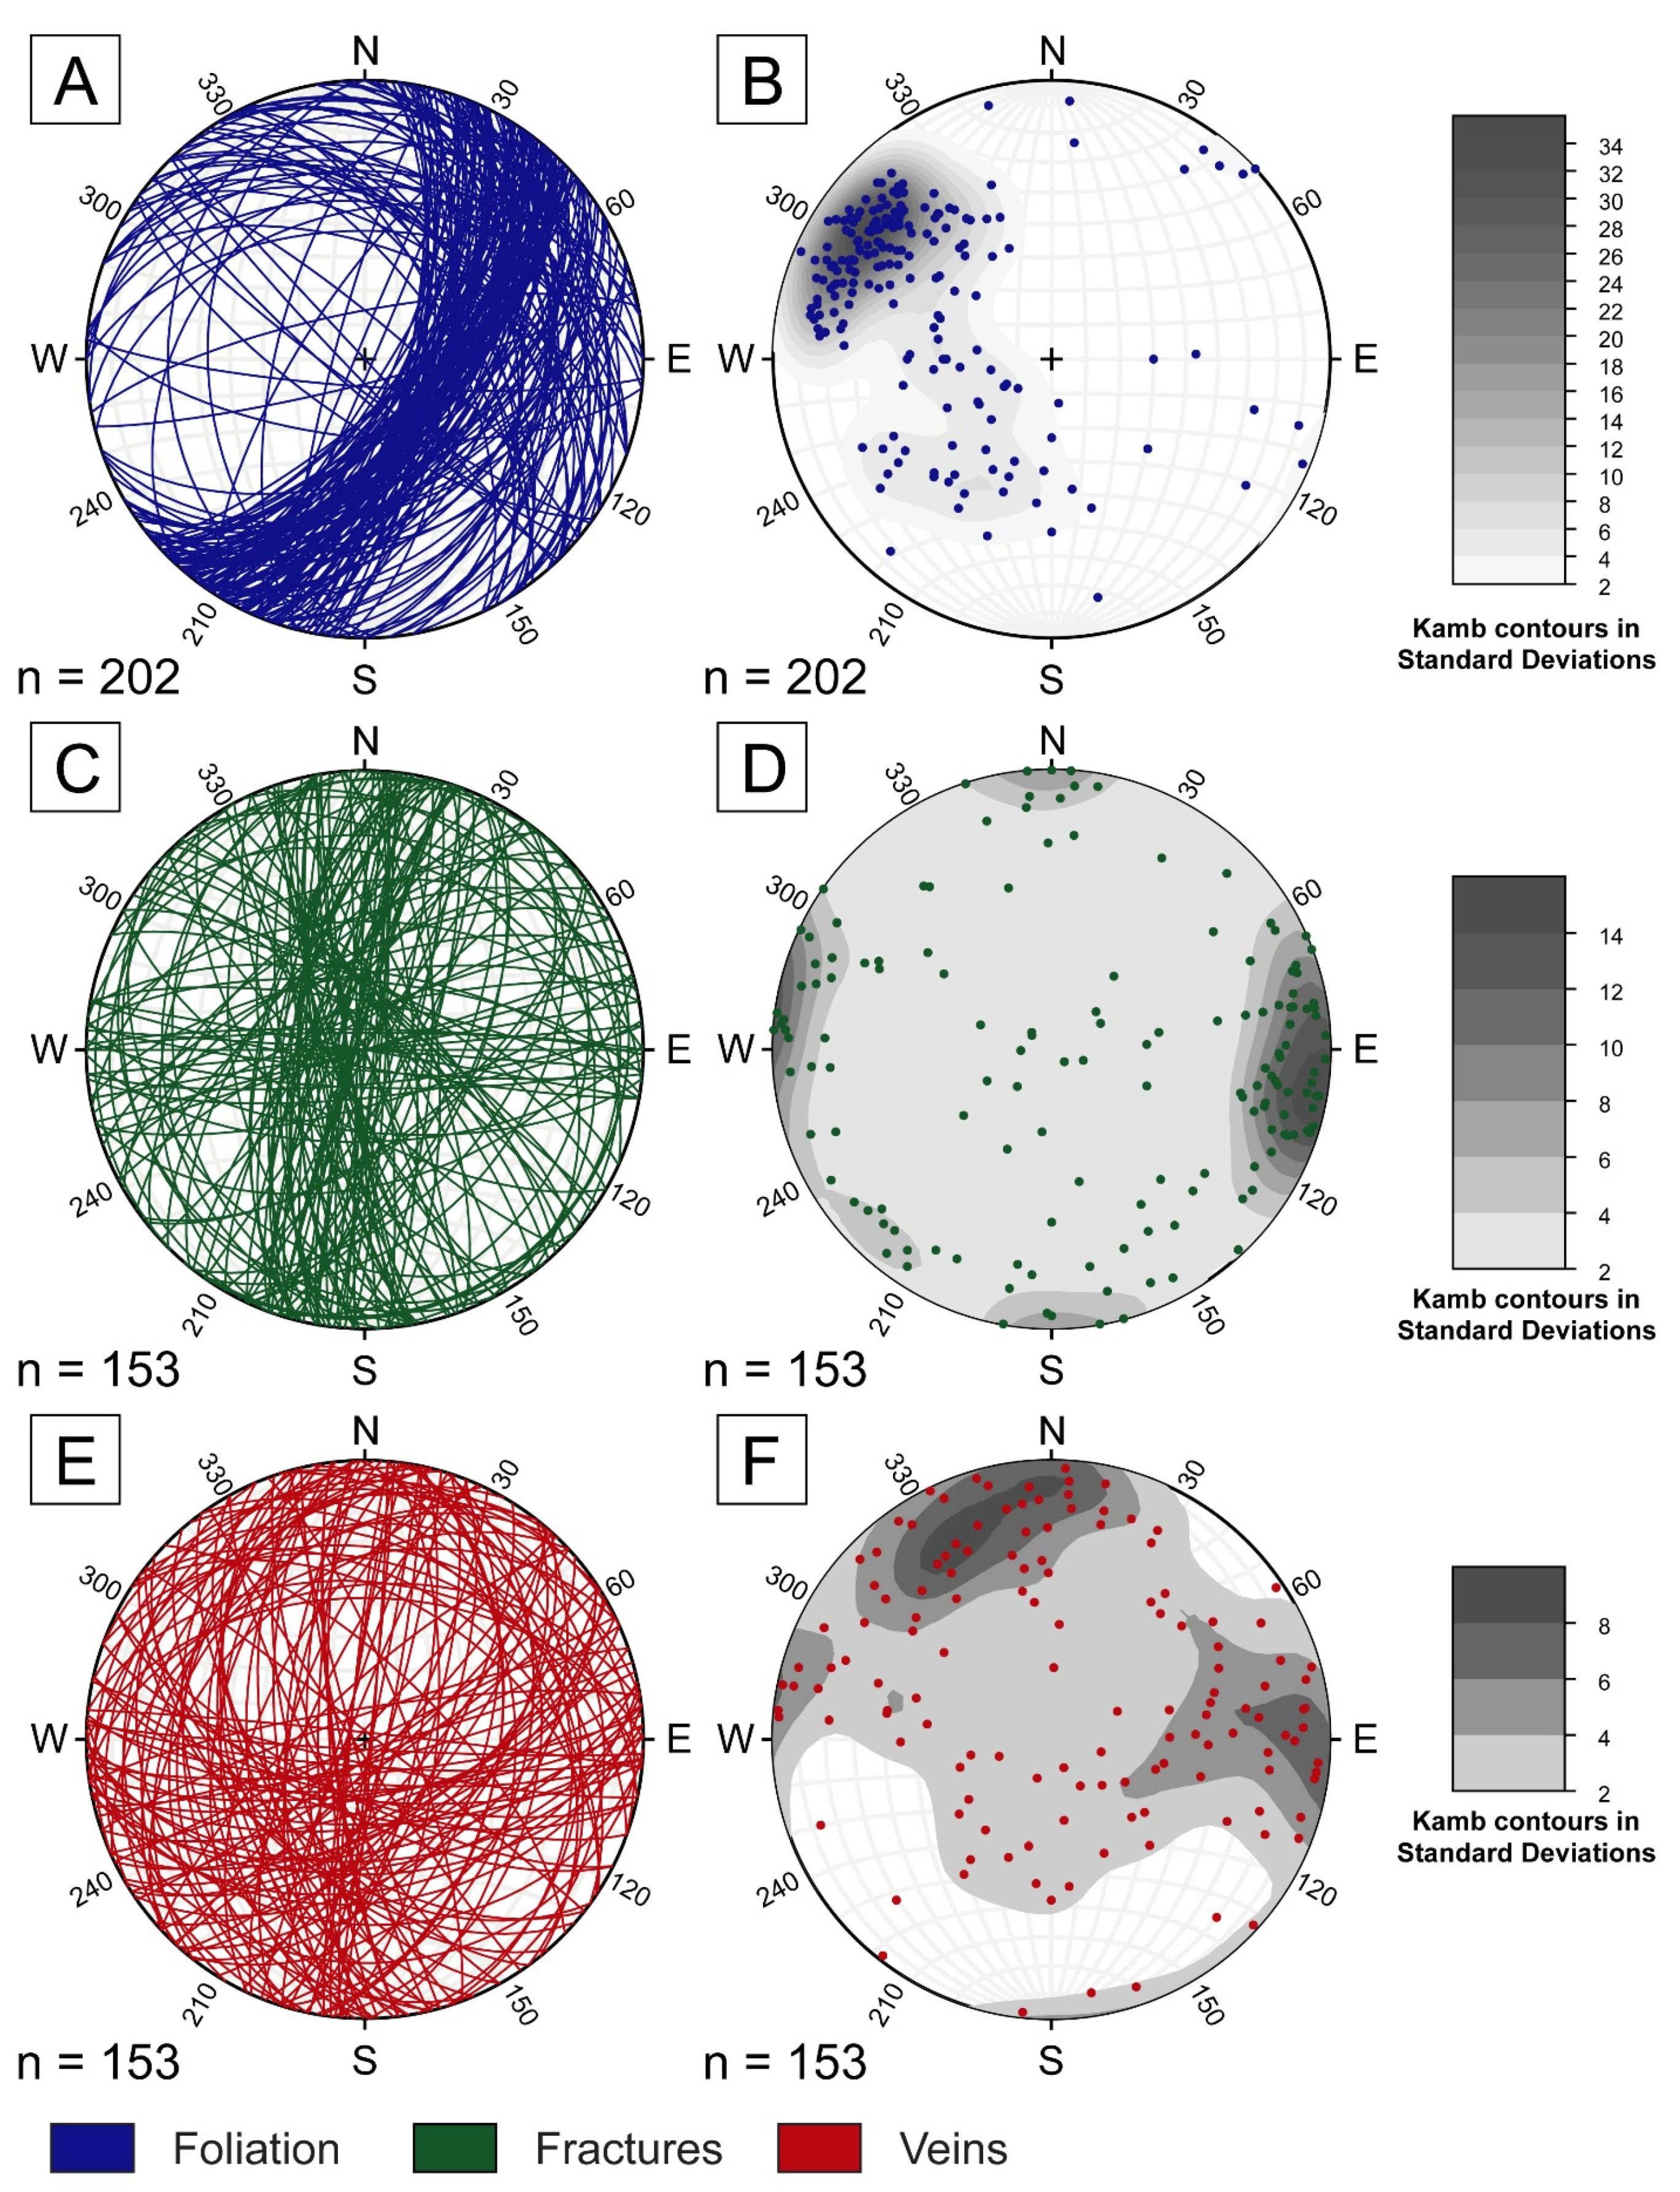
4.1. Structural Measurements and Observations
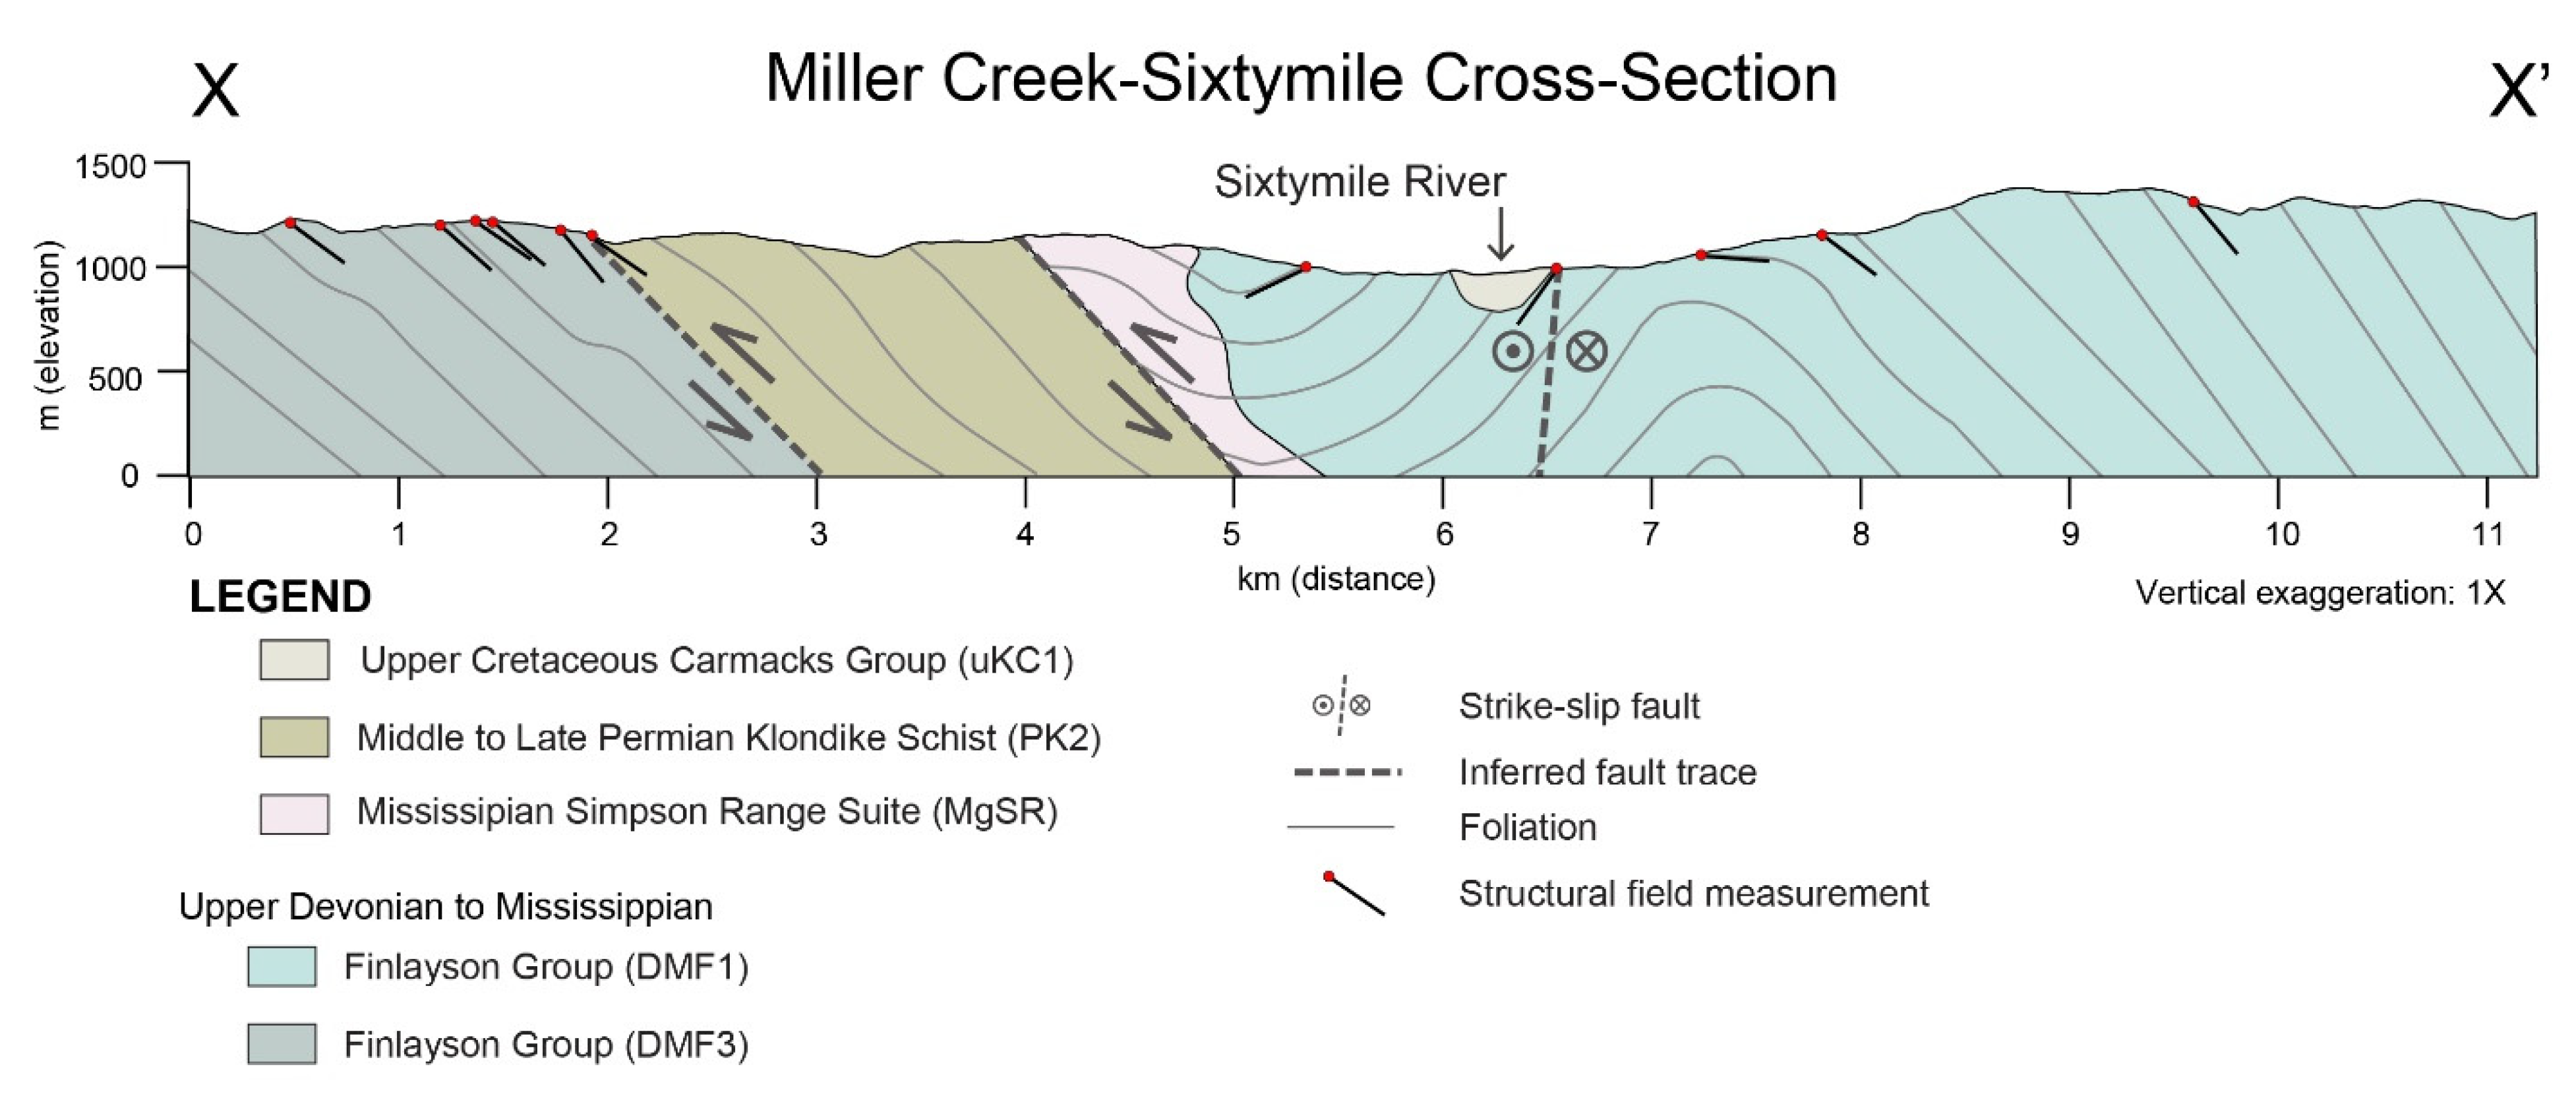
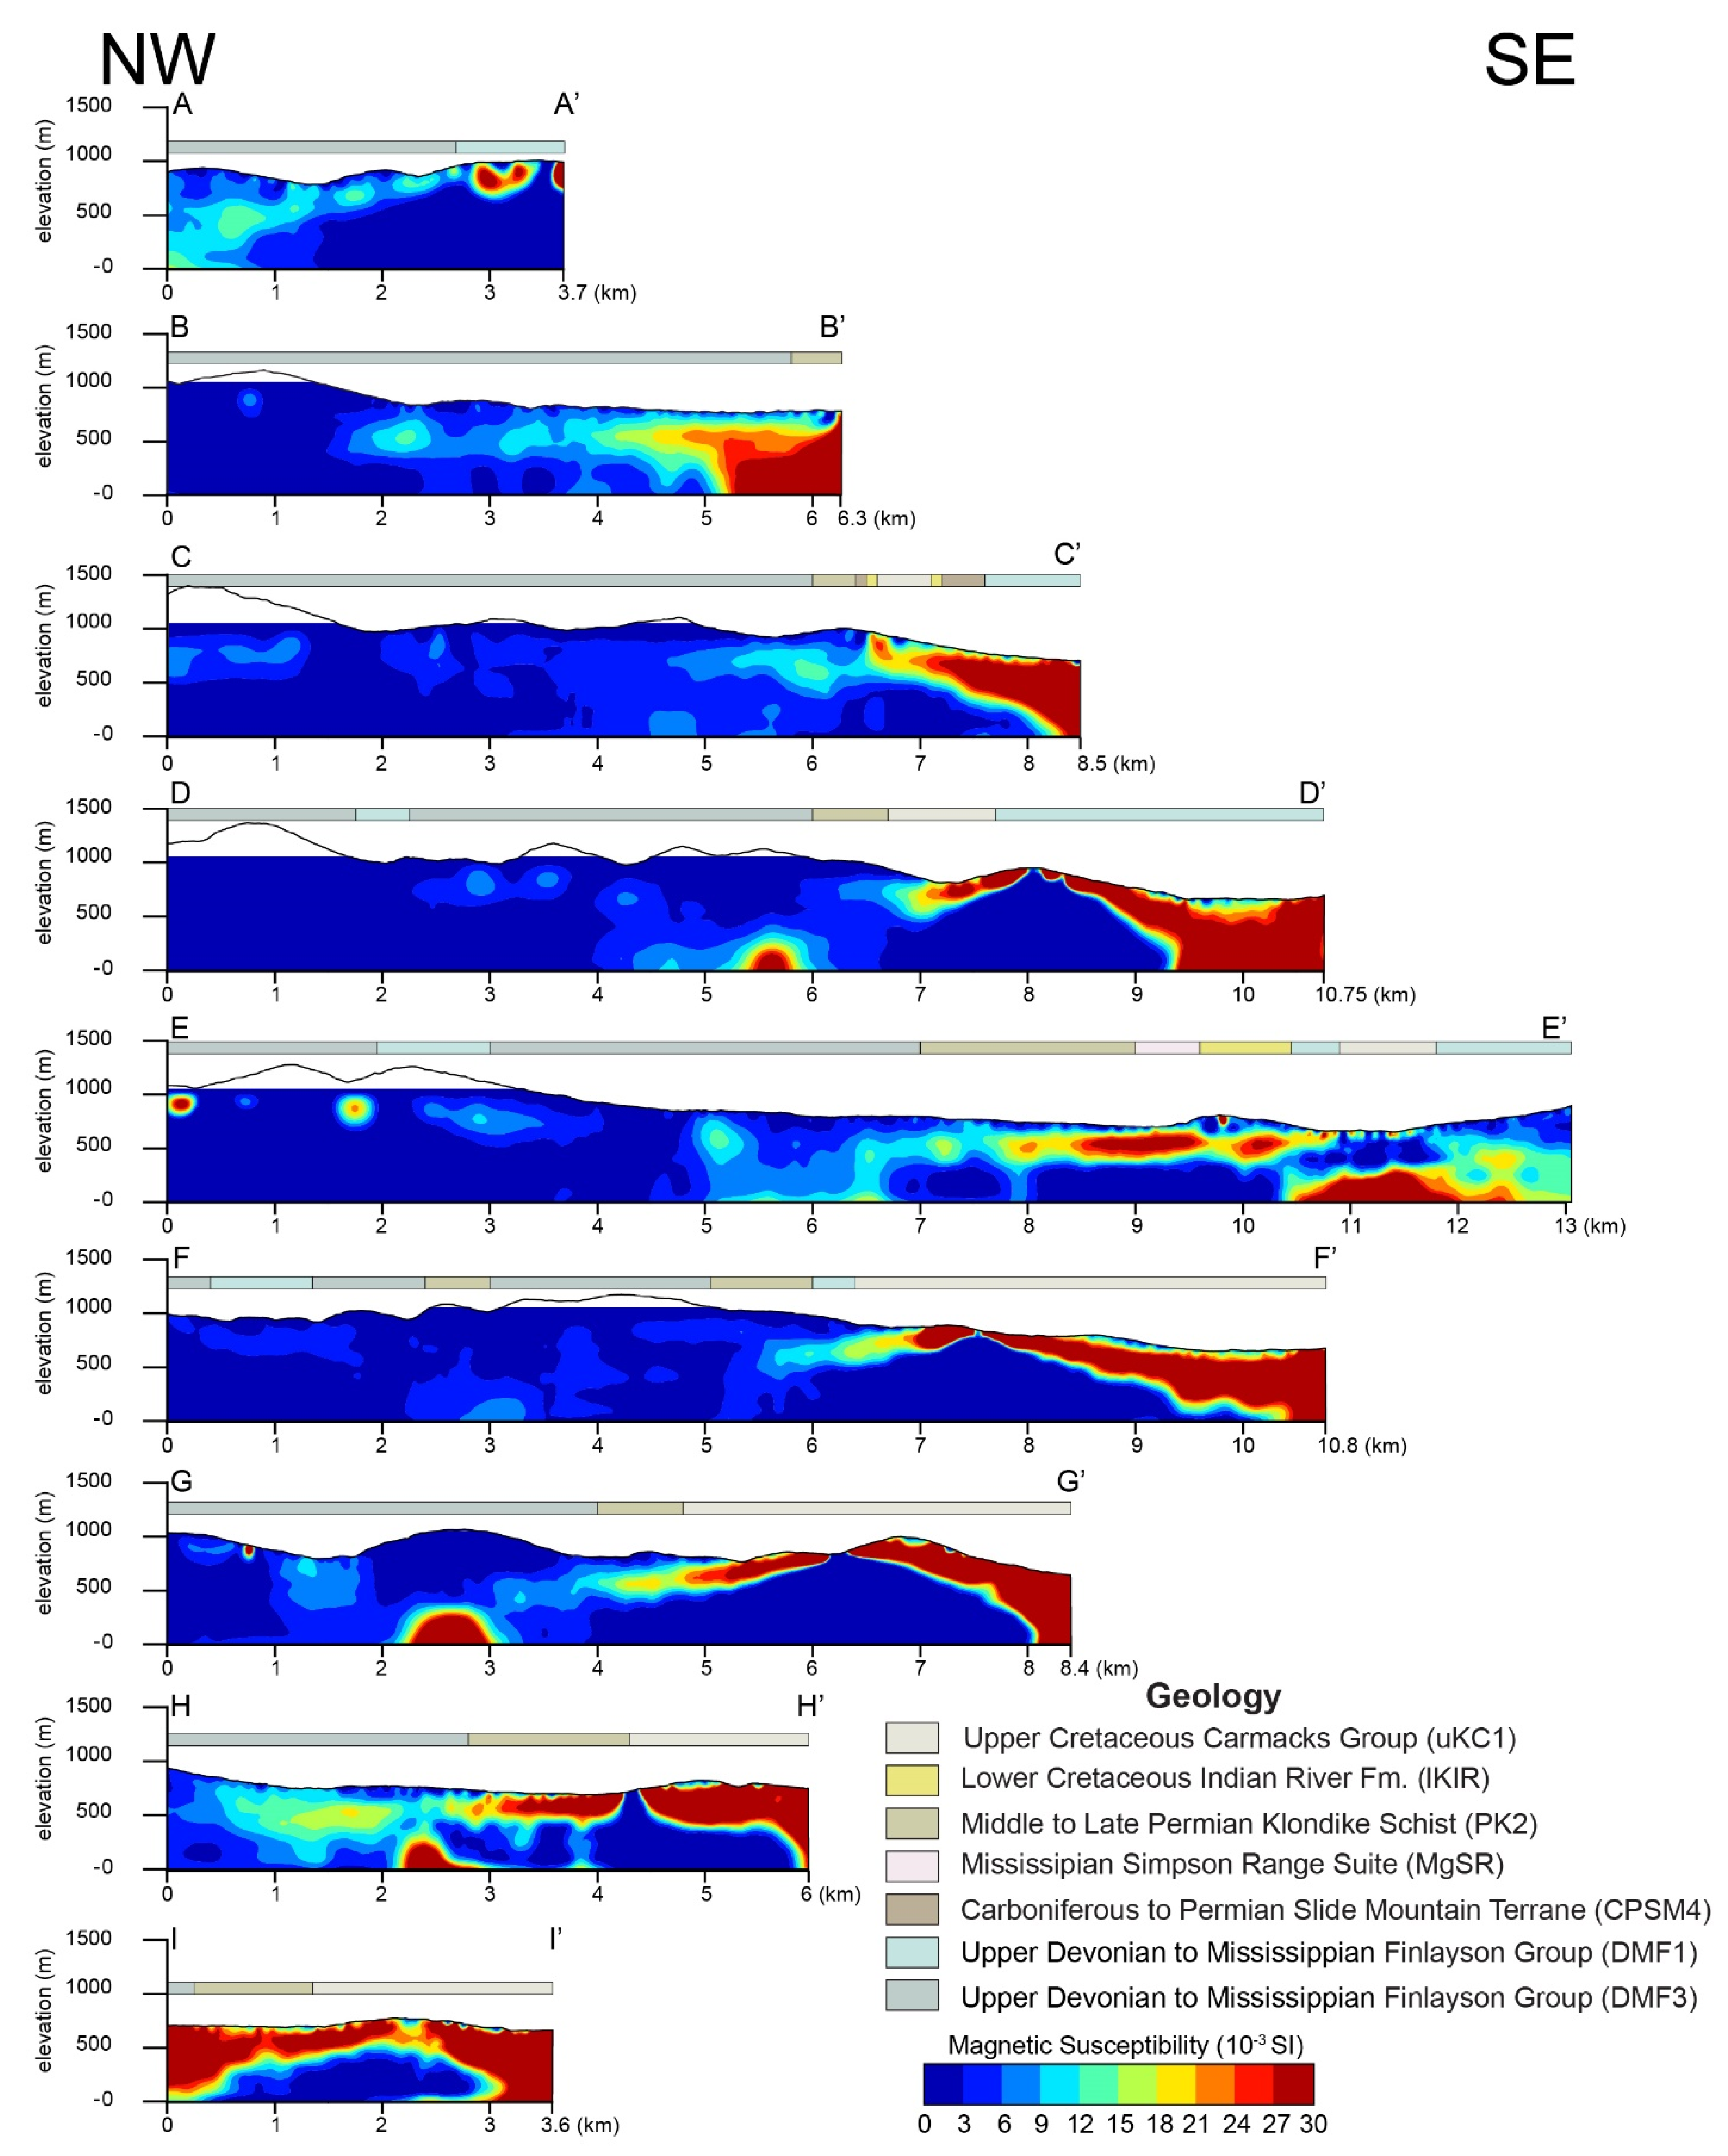
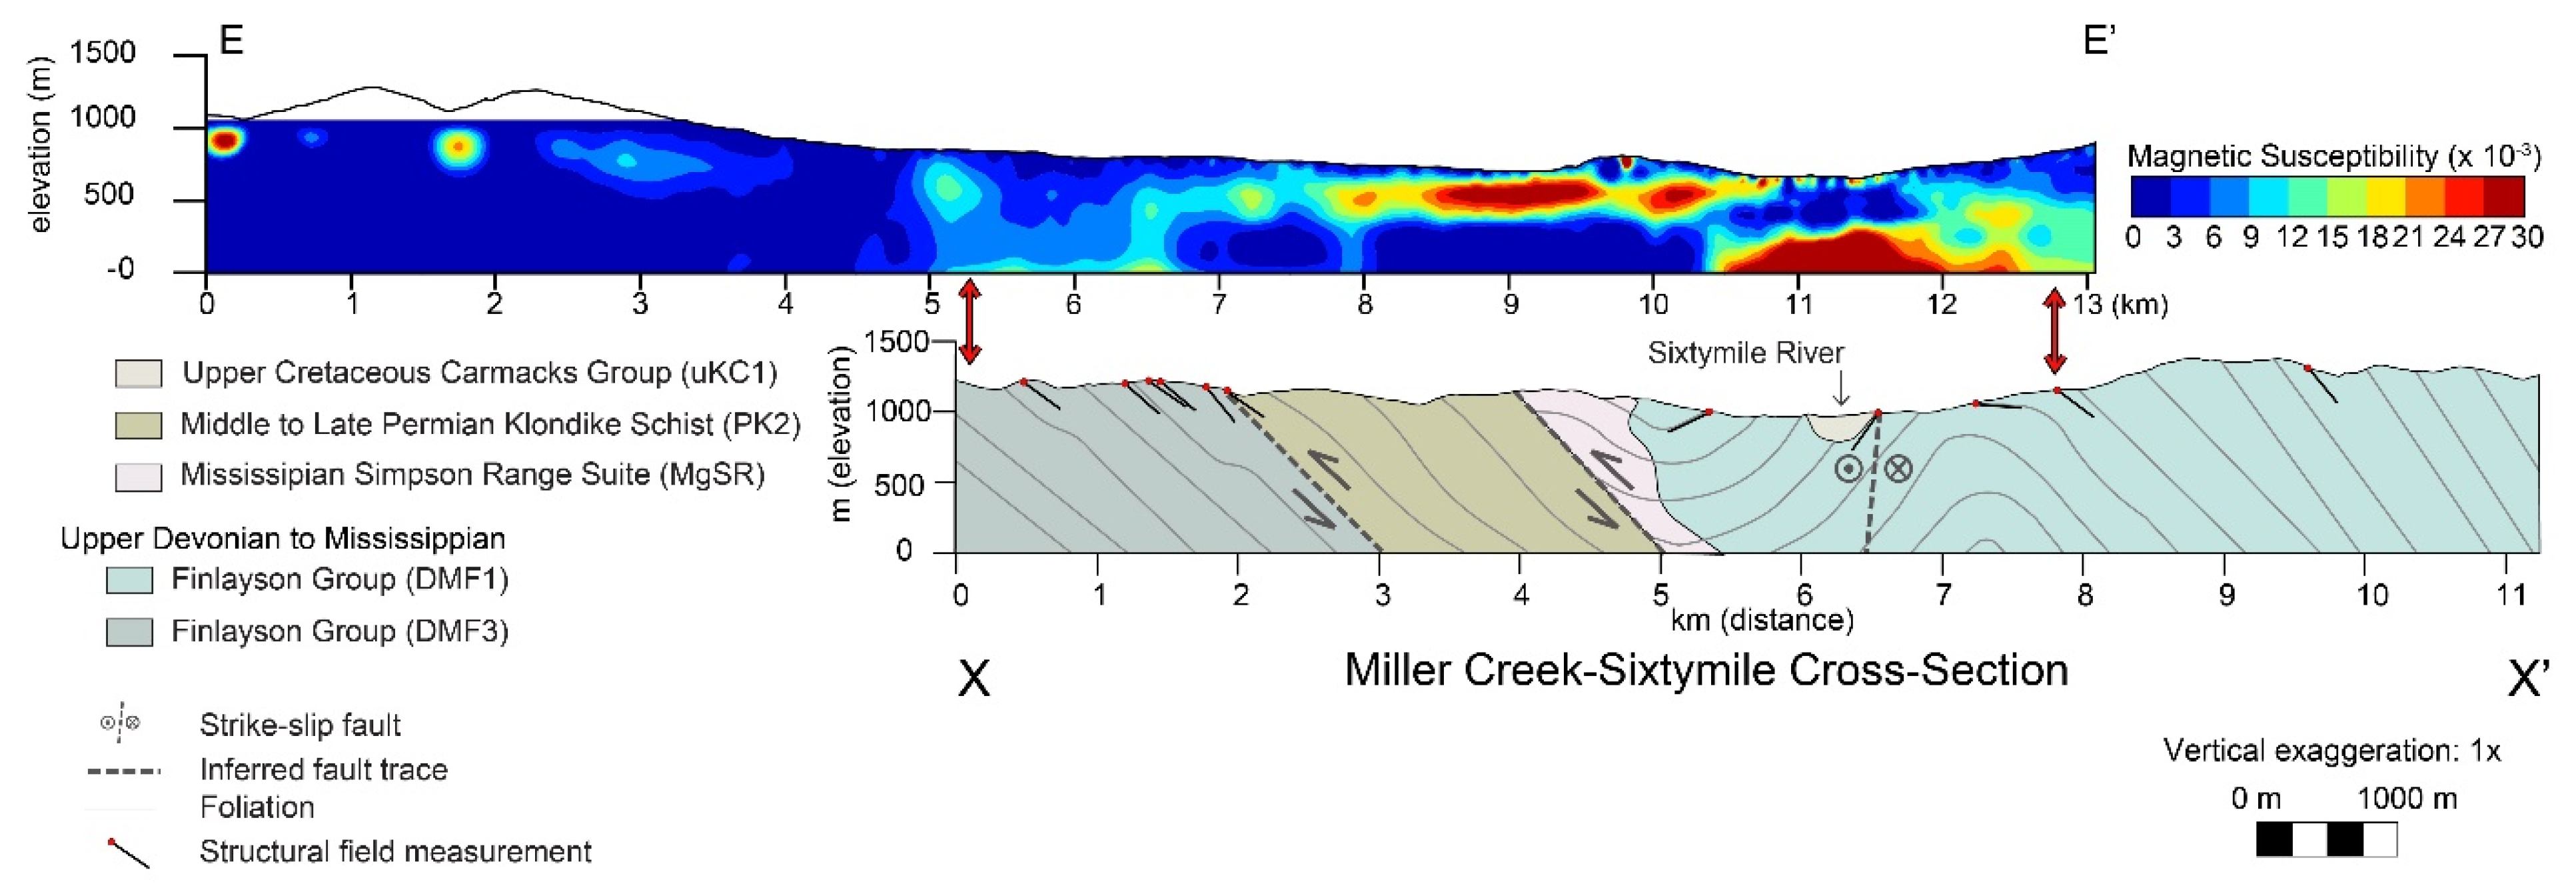
4.1.1. Geologic Cross-Section
4.1.2. Localities
Glacier Creek
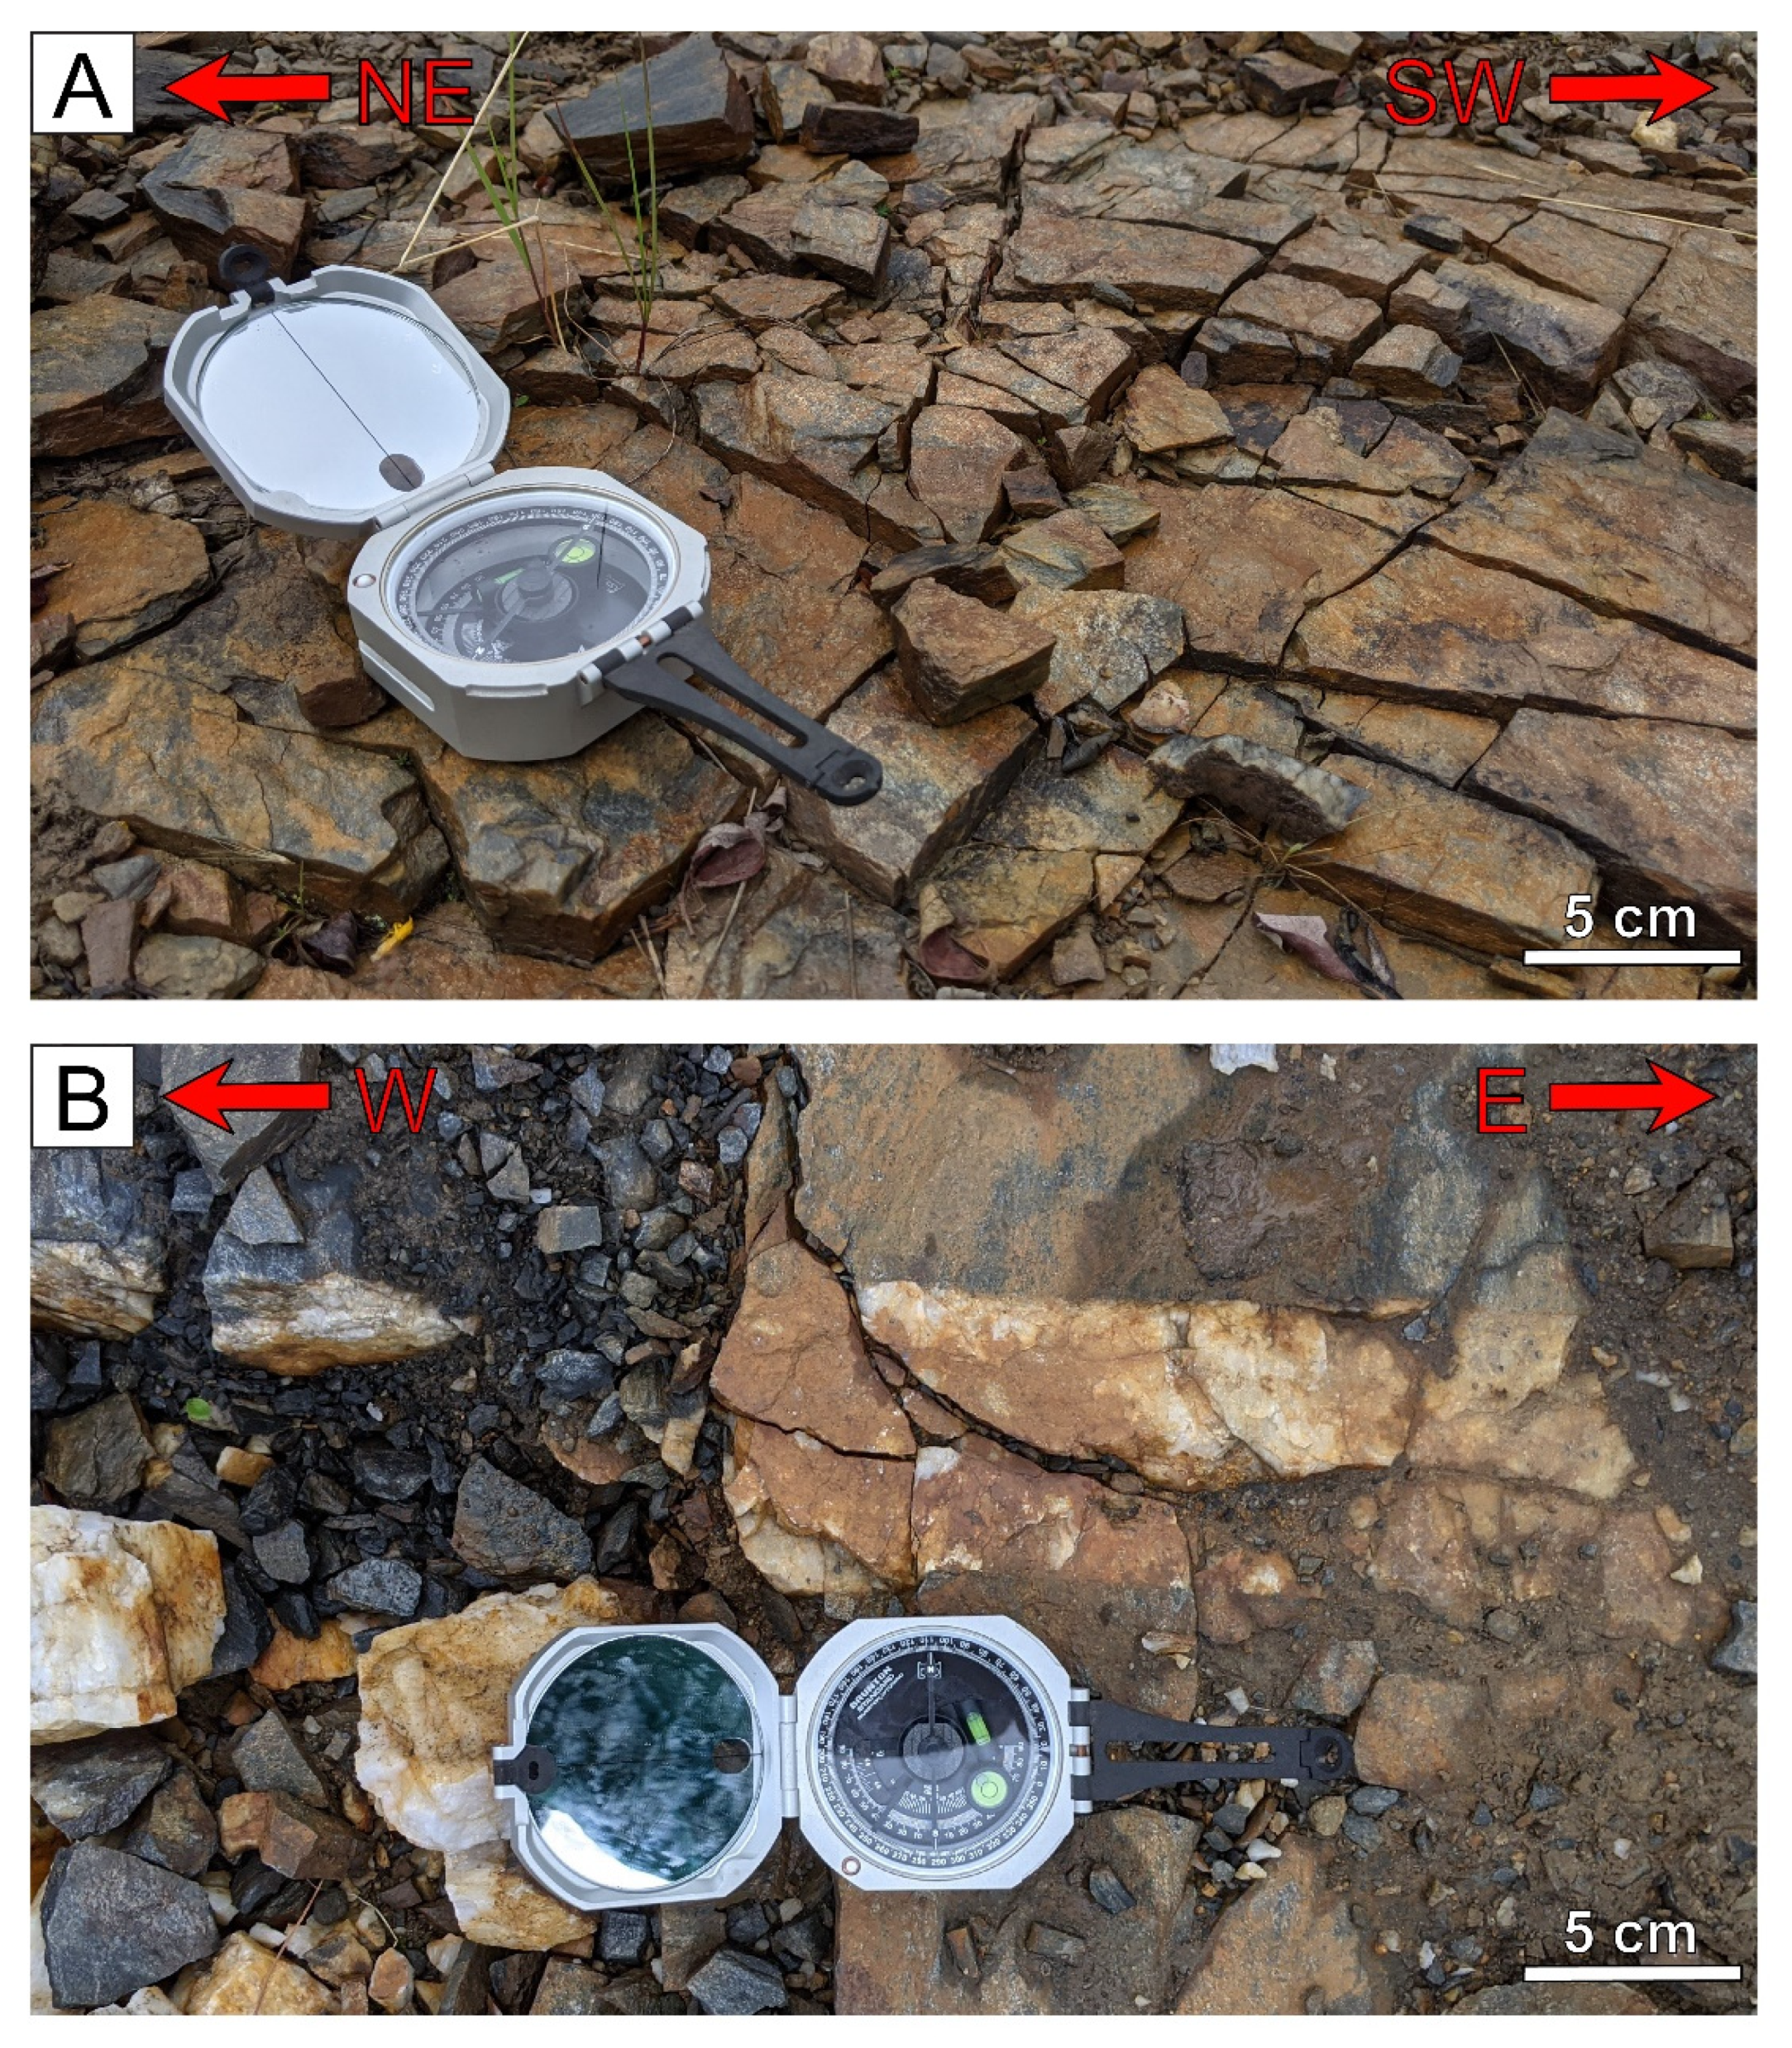
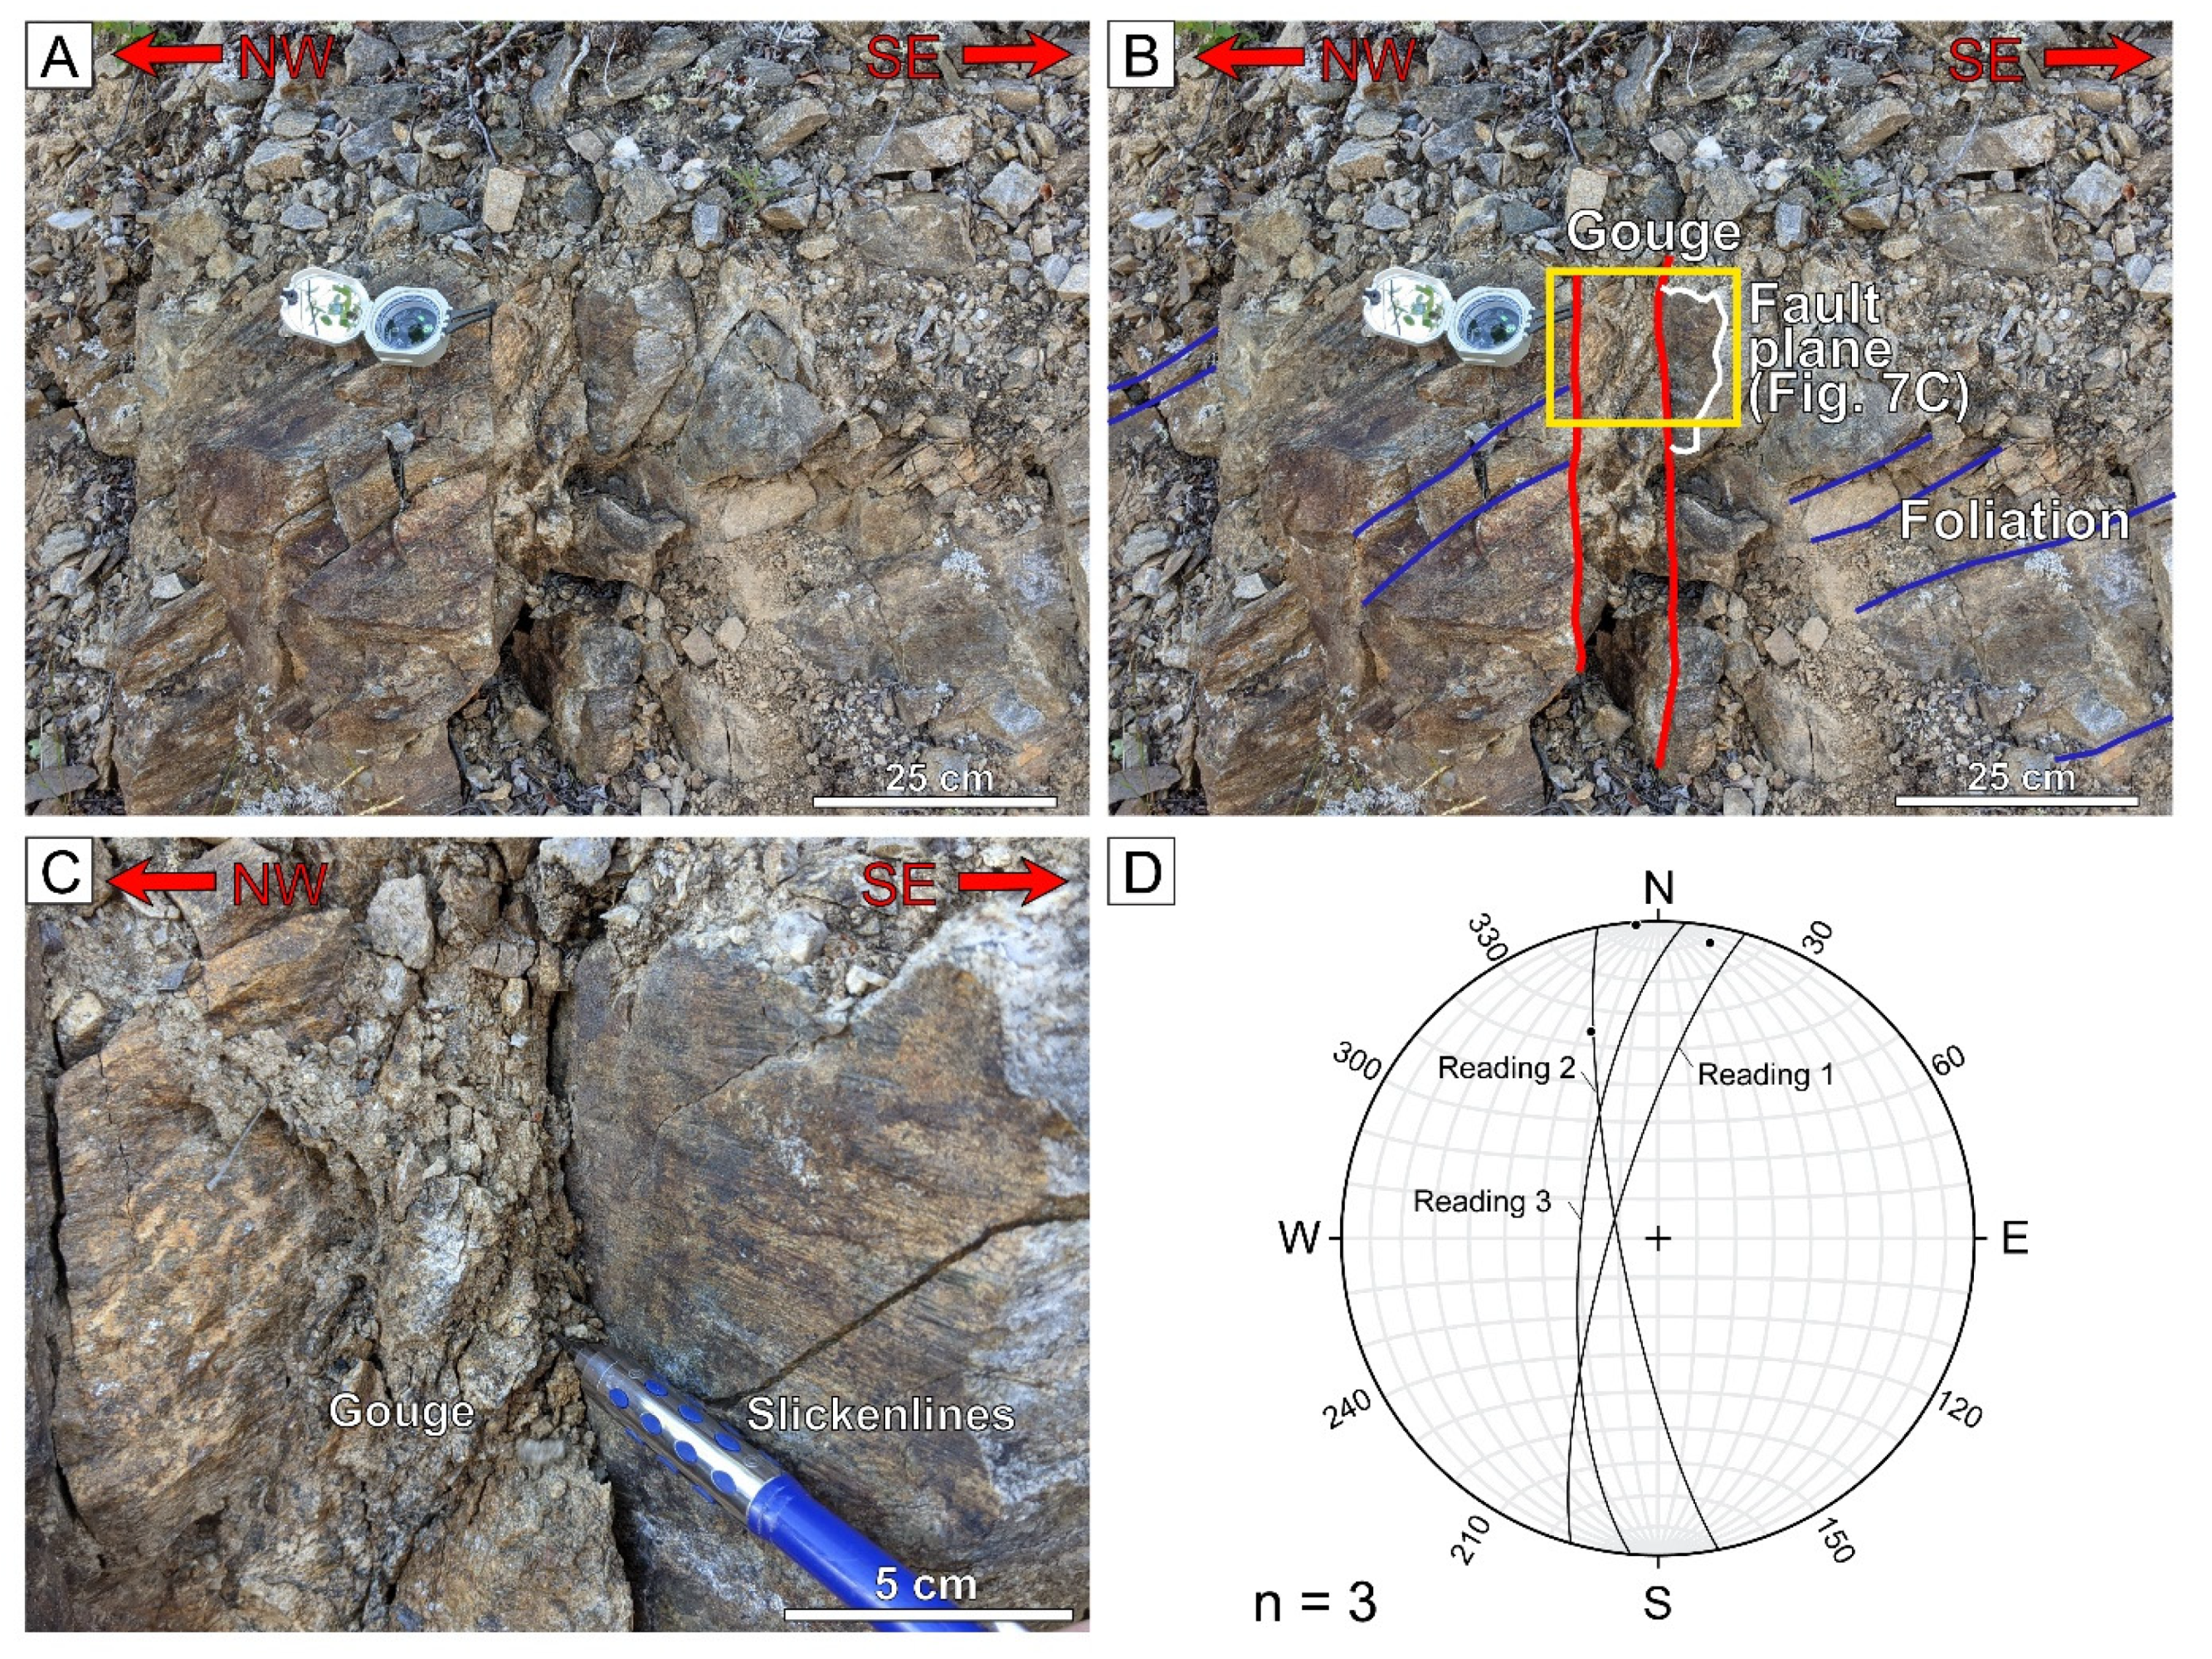
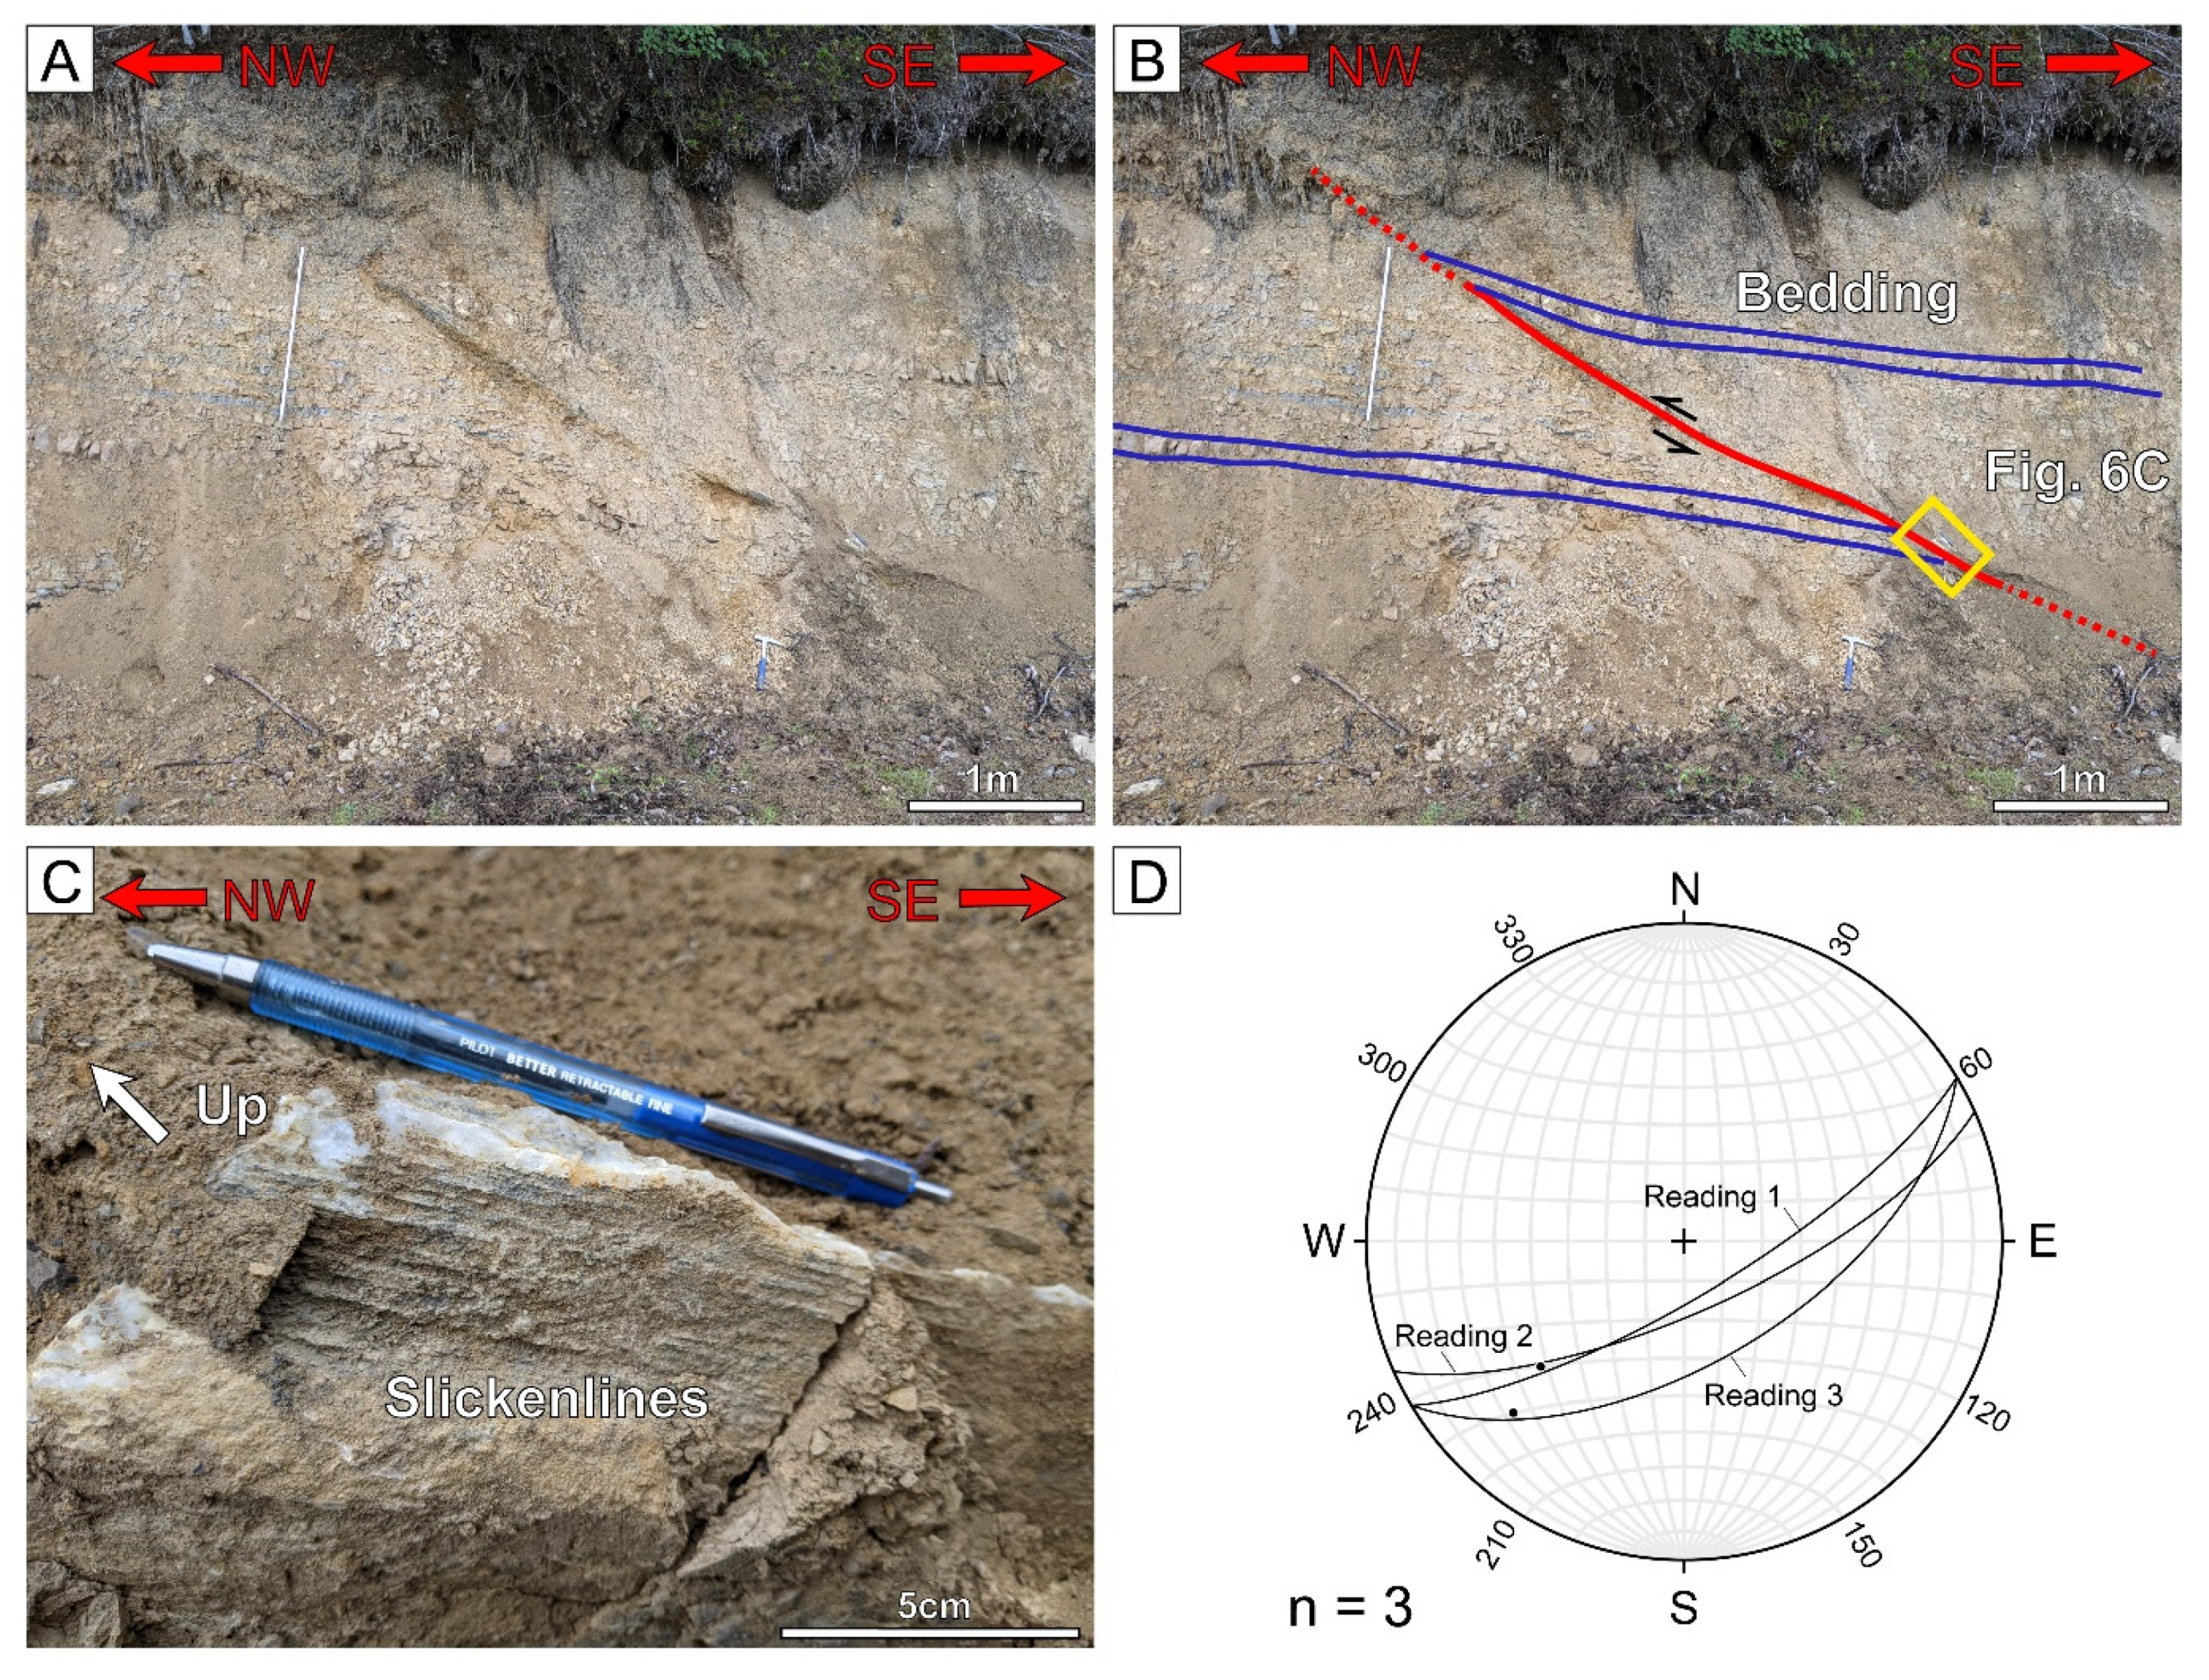
Miller Creek
Bedrock Creek
Sixtymile River
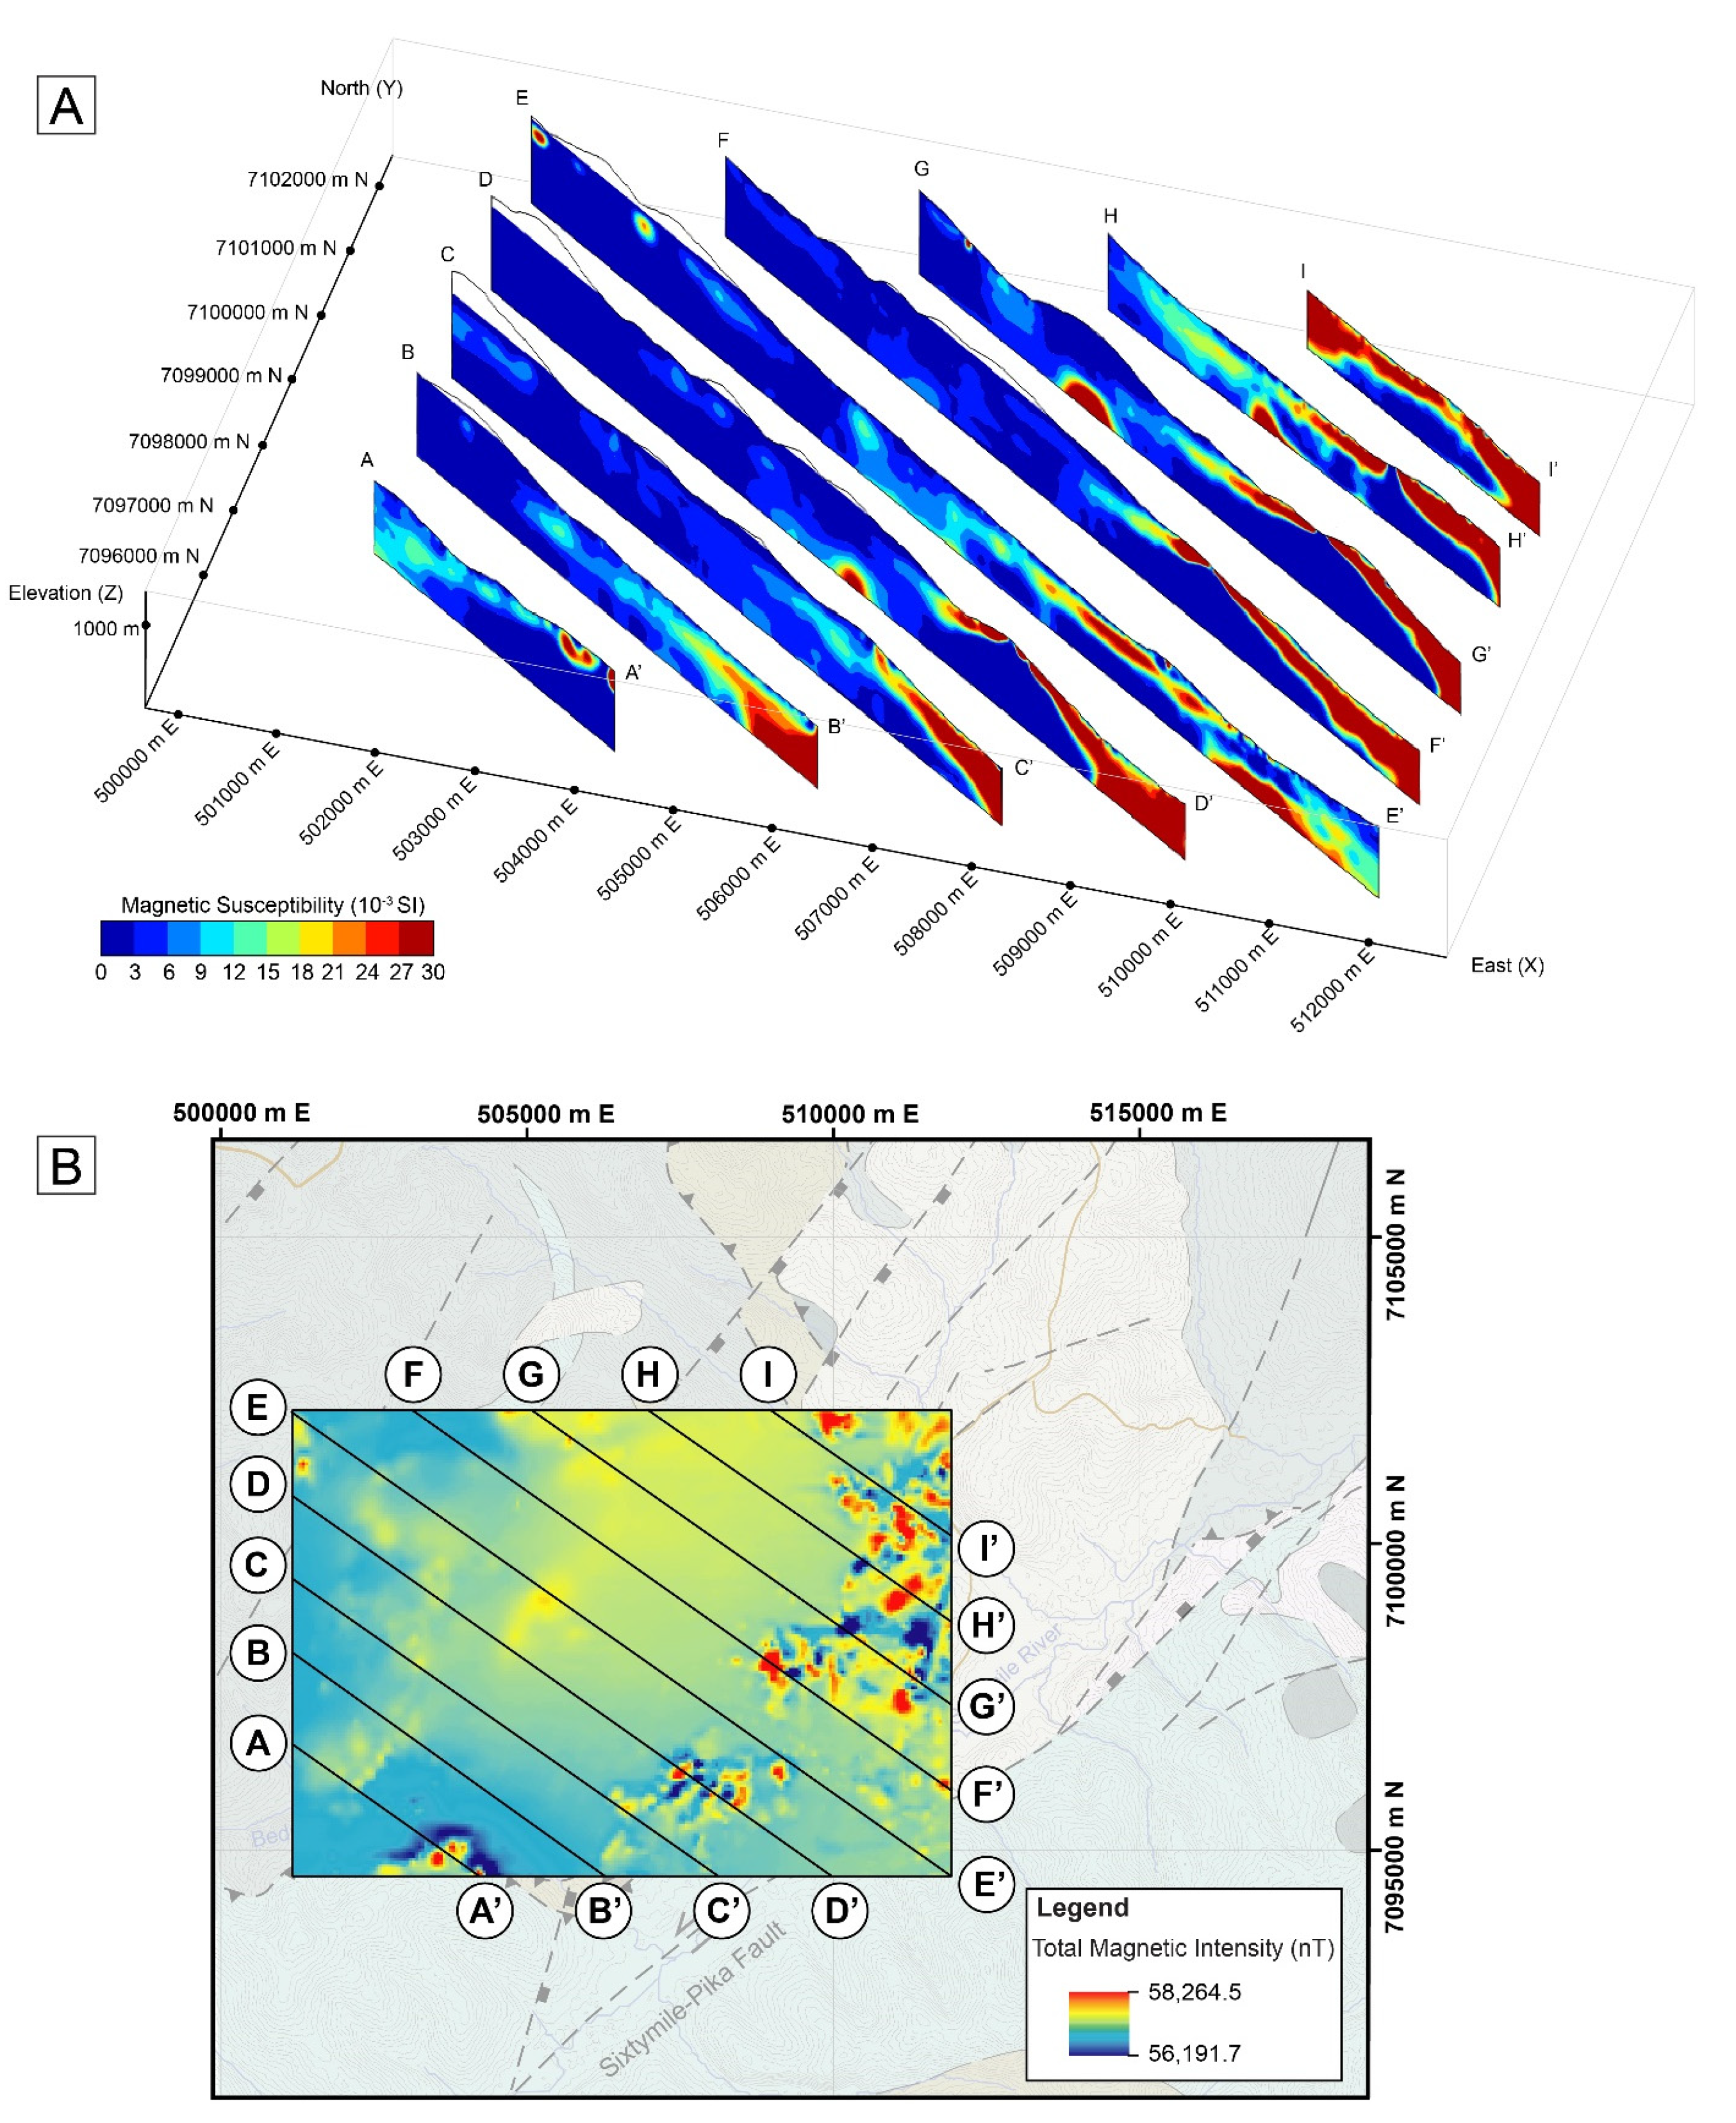
4.2. Magnetic Susceptibility
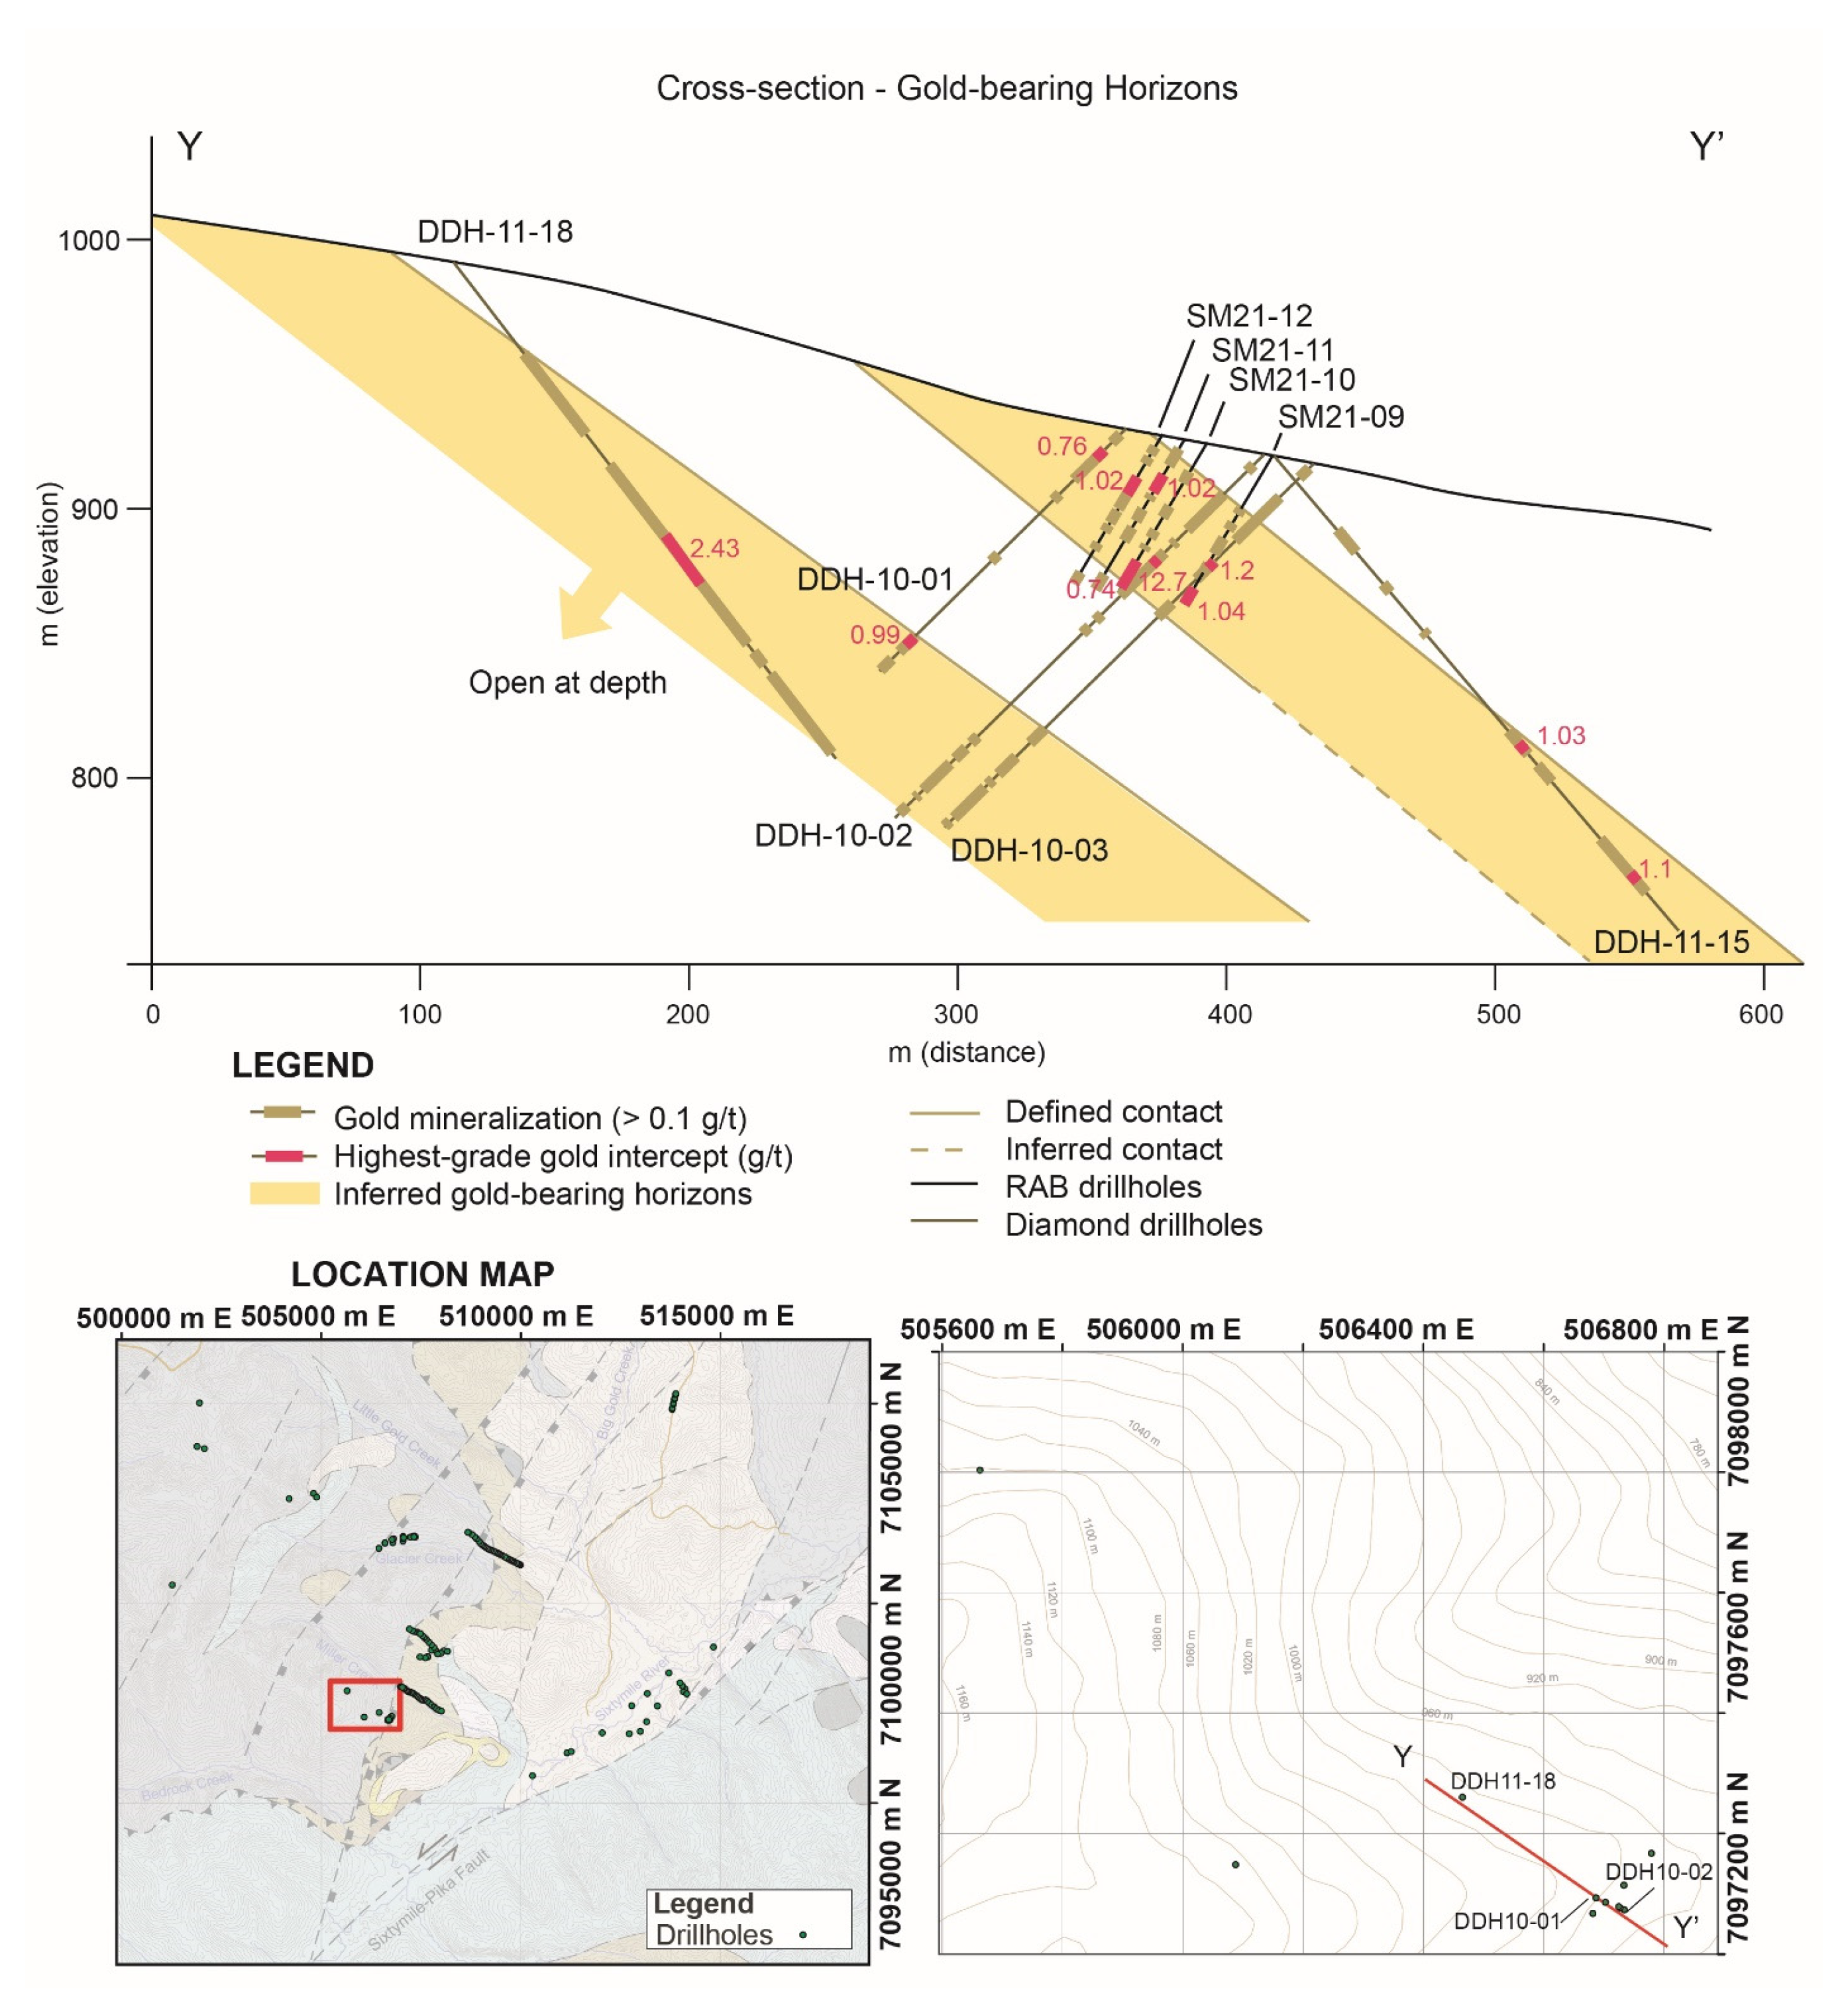
4.3. Gold Assay Data
5. Discussions
5.1. Structural Measurements
5.2. Magnetic Susceptibility
5.3. Gold-Bearing Horizons
6. Conclusions
Supplementary Materials
Author Contributions
Funding
Data Availability Statement
Acknowledgments
Conflicts of Interest
References
- Canada Department of the Interior. The Yukon Territory, Its History and Resources; Government Printing Bureau: Ottawa, ON, Canada, 1909. Available online: https://electriccanadian.com/history/yukon/yukonhistory.pdf (accessed on 16 February 2021).
- LeBarge, W.P. Yukon Placer Database 2007: Geology and Mining Activity of Placer Occurrences; Yukon Geological Survey: Whitehorse, YT, Canada, 2007.
- Hamilton, T.D. Late Cenozoic glaciation of Alaska. In The Geology of North America. The Geology of Alaska; Plafker, G., Berg, H.C., Eds.; Geological Society of America: Boulder, CO, USA, 1994; Volume G-I, pp. 813–844. [Google Scholar] [CrossRef]
- Lowey, G.W.; Emond, D.S.; Weston, L.H. Glaciation, gravel and gold in the Fifty Mile Creek area, west-central Yukon. In Yukon Exploration and Geology 1999; Emond, D.S., Weston, L.H., Eds.; Exploration and Geological Services Division, Yukon, Indian and Northern Affairs Canada: Whitehorse, YT, Canada, 2000; pp. 199–209. Available online: https://emrlibrary.gov.yk.ca/ygs/yeg/1999/1999_p199-210.pdf (accessed on 18 February 2021).
- MacKenzie, D.J.; Craw, D.; Mortensen, J. Structural controls on orogenic gold mineralisation in the Klondike goldfield, Canada. Mineralium Deposita 2008, 43, 435–448. [Google Scholar] [CrossRef]
- Boyle, R.W. The Geochemistry of gold and its deposits. In Bulletin, Geological Survey of Canada; Energy, Mines and Resources Canada: Ottawa, ON, Canada, 1979; Volume 280, p. 584. Available online: https://publications.gc.ca/site/eng/9.817728/publication.html (accessed on 17 February 2021).
- Henley, R.W.; Adams, J. On the evolution of giant gold placers. In Transactions of the Institution for Mining and Metallurgy; Institution of Mining and Metallurgy: London, UK, 1979; Volume 88, pp. B41–B51. [Google Scholar]
- Allan, M.M.; Mortensen, J.K.; Hart, C.J.R.; Bailey, L.A.; Sanchez, M.G.; Ciolkiewicz, W.; McKenzie, G.; Creaser, R. Magmatic and metallogenic framework of west-central Yukon and eastern Alaska. In Tectonics, Metallogeny, and Discovery: The North American Cordillera and Similar Accretionary Settings; Society of Economic Geologists Special Publication: Littleton, CO, USA, 2013; Volume 17, pp. 111–168. [Google Scholar] [CrossRef]
- MacLean, T.A. Lode Mining in Yukon: Investigation of Quartz Deposits in the Klondike Division (No. 222); Government Printing Bureau: Ottawa, ON, Canada, 1914. Available online: https://emrlibrary.gov.yk.ca/gsc/separate-reports/222-lode-mining-in-yukon-an-investigation-of-quartz-deposits-in-the-klondike-division-1914.pdf (accessed on 17 February 2021).
- Rushton, R.W.; Nesbitt, B.E.; Muehlenbachs, K.; Mortensen, J.K. A fluid inclusion and stable isotope study of Au quartz veins in the Klondike District, Yukon Territory, Canada; a section through a mesothermal vein system. Econ. Geol. 1993, 88, 647–678. [Google Scholar] [CrossRef]
- Freeman, S. In Search of the Motherlode: Why Yukon is Experiencing a 21st Century Gold Rush. Financial Post. Available online: https://financialpost.com/commodities/mining/in-search-of-the-motherlode-why-yukon-is-experiencing-a-new-gold-rush (accessed on 1 August 2021).
- Naumov, V.; Barge, W.; Kovin, O. A new insight into origin of the Yukon placer gold. In Proceedings of the 45th International October Conference on Mining and Metallurgy, Bor, Serbia, 16–19 October 2013; Volume 4, p. 4. [Google Scholar]
- Chapman, R.J.; Mortensen, J.K.; LeBarge, W.P. Styles of lode gold mineralization contributing to the placers of the Indian River and Black Hills Creek, Yukon Territory, Canada as deduced from microchemical characterization of placer gold grains. Mineralium Deposita 2011, 46, 881–903. [Google Scholar] [CrossRef]
- Knight, J.B.; Mortensen, J.K.; Morison, S.R. Lode and placer gold composition in the Klondike District, Yukon Territory, Canada; implications for the nature and genesis of Klondike placer and lode gold deposits. Econ. Geol. 1999, 94, 649–664. [Google Scholar] [CrossRef]
- Mortensen, J.K.; Chapman, R.; LeBarge, W.; Crawford, E. Compositional studies of placer and lode gold from western Yukon: Implications for lode sources. In Yukon Exploration and Geology 2005; Emond, D.S., Bradshaw, G.D., Lewis, L.L., Weston, L.S., Eds.; Yukon Geological Survey: Whitehorse, YT, Canada, 2005; pp. 247–255. Available online: https://emrlibrary.gov.yk.ca/ygs/yeg/2005/2005_p247-256.pdf (accessed on 1 September 2021).
- MacKenzie, D.J.; Craw, D.; Mortensen, J.K.; Liverton, T. Structure of schist in the vicinity of the Klondike goldfield, Yukon. In Yukon Exploration and Geology 2006; Emond, D.S., Lewis, L.L., Weston, L.H., Eds.; Yukon Geological Survey: Whitehorse, YT, Canada, 2007; pp. 197–212. Available online: https://emrlibrary.gov.yk.ca/ygs/yeg/2006/2006_p197-212.pdf (accessed on 17 February 2021).
- Bond, J.D.; Sanborn, P.T. Morphology and Geochemistry of Soils Formed on Colluviated Weathered Bedrock: Case Studies from Unglaciated Upland Slopes in West-Central Yukon; Yukon Geological Survey: Whitehorse, YT, Canada, 2006. Available online: https://ygsftp.gov.yk.ca/publications/openfile/2006/of2006_19.pdf (accessed on 17 February 2021).
- Mortensen, J.K.; Chapman, R.; LeBarge, W.; Jackson, L.; Edmund, D.S.; Lewis, L.L.; Bradshaw, G.D. Application of placer and lode gold geochemistry to gold exploration in western Yukon. In Yukon Exploration and Geology, 2004; Exploration and Geological Services Division, Yukon, Indian and Northern Affairs Canada: Whitehorse, YT, Canada, 2004; pp. 205–212. Available online: https://emrlibrary.gov.yk.ca/ygs/yeg/2004/2004_p205-212.pdf (accessed on 1 September 2021).
- Mira Geoscience. Geologically-Constrained Inversion of Magnetic and Gravity Data Over Parts of the Yukon-Tanana Terrane and Whitehorse Trough; Miscellaneous Report MR-10; Yukon Geological Survey: Whitehorse, YT, Canada, 2014; pp. 1–85. Available online: https://emrlibrary.gov.yk.ca/ygs/MR/MR-10/MR-10_WT-YTT_Modelling.pdf (accessed on 1 December 2021).
- Welford, J.K.; Clowes, R.M.; Ellis, R.M.; Spence, G.D.; Asudeh, I.; Hajnal, Z. Lithospheric structure across the craton-Cordilleran transition of northeastern British Columbia. Can. J. Earth Sci. 2001, 38, 1169–1189. [Google Scholar] [CrossRef]
- Hayward, N. Geophysical investigation and reconstruction of lithospheric structure and its control on geology, structure, and mineralization in the Cordillera of northern Canada and eastern Alaska. Tectonics 2015, 34, 2165–2189. [Google Scholar] [CrossRef]
- Sánchez, M.G.; Allan, M.M.; Hart, C.J.; Mortensen, J.K. Extracting ore-deposit-controlling structures from aeromagnetic, gravimetric, topographic, and regional geologic data in western Yukon and eastern Alaska. Interpretation 2014, 2, SJ75–SJ102. [Google Scholar] [CrossRef]
- Yukon Geological Survey. Yukon Digital Bedrock Geology. Available online: https://data.geology.gov.yk.ca/Compilation/3 (accessed on 12 September 2021).
- Goldfarb, R.J.; Hart, C.; Miller, M.; Miller, L.; Farmer, G.L.; Groves, D.I. The Tintina gold belt—A global perspective. In The Tintina Gold Belt: Concepts, Exploration, and Discoveries; British Columbia and Yukon Chamber of Mines: Vancouver, BC, Canada, 2000; Volume 2, pp. 5–34. [Google Scholar]
- Bailey, L.A. Late Jurassic Fault-Hosted Gold Mineralization at the Golden Saddle Deposit, White Gold District, Yukon Territory. Master’s Thesis, The University of British Columbia, Vancouver, BC, Canada, 2013. Available online: http://hdl.handle.net/2429/44517 (accessed on 17 February 2021).
- Naibert, T.J. Structural geology observations in the northeast Tanacross map area. In Northeast Tanacross Geologic Mapping Project, Alaska; Wypych, A., Ed.; Alaska Division of Geological & Geophysical Surveys: Fairbanks, AK, USA, 2020; pp. 43–52. [Google Scholar] [CrossRef]
- Sánchez, M.G.; Allan, M.M.; Hart, C.J.; Mortensen, J. Orogen-perpendicular magnetic segmentation of the western Yukon and eastern Alaska cordilleran hinterland: Implications for structural control of mineralization. In Yukon Exploration and Geology 2012; MacFarlane, K.E., Nordling, M.G., Sack, P.J., Eds.; Yukon Geological Survey: Whitehorse, YT, Canada, 2013; pp. 133–146. Available online: https://ygsftp.gov.yk.ca/publications/yeg/yeg12/YEG/9_Sanchez_etal.pdf (accessed on 17 February 2021).
- Allan, M.M.; Mortensen, J.K.; Sánchez, M.G.; Hart, C.J.R. Structural and geochronological controls on Late Cretaceous porphyry andepithermal mineralization of the orogen-normal Sixtymile-Pika fault system, Yukon and Alaska. In preparation.
- Mortensen, J.K. Geology and U–Pb geochronology of the Klondike District, west-central Yukon Territory. Can. J. Earth Sci. 1990, 27, 903–914. [Google Scholar] [CrossRef]
- Lowey, G.W.; Hills, L.V. Lithofacies, petrography and environments of deposition, Tantalus Formation (Lower Cretaceous) Indian River area, west-central Yukon. Bull. Can. Petrol. Geol. 1988, 36, 296–310. [Google Scholar] [CrossRef]
- Johnston, S.T.; Wynne, P.J.; Francis, D.; Hart, C.J.R.; Enkin, R.J.; Engebretson, D.C. Yellowstone in Yukon: The late Cretaceous Carmacks group. Geology 1996, 24, 997–1000. [Google Scholar] [CrossRef]
- Telford, W.M.; Geldart, L.P.; Sheriff, R.E. Applied Geophysics, 2nd ed.; Cambridge University Press: Cambridge, UK, 1990. [Google Scholar] [CrossRef]
- Clark, D.A.; Emerson, J.B. Notes on rock magnetization characteristics in applied geophysical studies. Explor. Geophys. 1991, 22, 547–555. [Google Scholar] [CrossRef]
- Nabighian, M.N.; Grauch, V.J.S.; Hansen, R.O.; LaFehr, T.R.; Li, Y.; Peirce, J.W.; Phillips, J.; Ruder, M.E. The historical development of the magnetic method in exploration. Geophysics 2005, 70, 33ND–61ND. [Google Scholar] [CrossRef]
- Geng, M.; Ali, M.Y.; Fairhead, J.D.; Bouzidi, Y.; Barkat, B. Morphology of the basement and Hormuz salt distribution in offshore Abu Dhabi from constrained 3-D inversion of gravity and magnetic data. Tectonophysics 2020, 791, 228563. [Google Scholar] [CrossRef]
- Geng, M.; Welford, J.K.; Farquharson, C.G.; Peace, A.L.; Hu, X. 3-D joint inversion of airborne gravity gradiometry and magnetic data using a probabilistic method. Geophys. J. Int. 2020, 223, 301–322. [Google Scholar] [CrossRef]
- Geng, M.; Welford, J.K.; Farquharson, C.G.; Hu, X. Gravity modeling for crustal-scale models of rifted continental margins using a constrained 3D inversion method. Geophysics 2019, 84, G25–G39. [Google Scholar] [CrossRef]
- Geng, M.; Welford, J.K.; Farquharson, C.G.; Peace, A.L. 3D inversion of airborne gravity gradiometry data for the Budgell Harbour Stock, Newfoundland: A case history using a probabilistic approach. Geophysics 2019, 84, B269–B284. [Google Scholar] [CrossRef]
- Peace, A.L.; Welford, J.K.; Geng, M.; Sandeman, H.; Gaetz, B.D.; Ryan, S.S. Rift-related magmatism on magma-poor margins: Structural and potential-field analyses of the Mesozoic Notre Dame Bay intrusions, Newfoundland, Canada and their link to North Atlantic Opening. Tectonophysics 2018, 745, 24–45. [Google Scholar] [CrossRef]
- Tarantola, A. Inverse Problem Theory and Methods for Model Parameter Estimation; Society for Industrial and Applied Mathematics (SIAM): Philadelphia, PA, USA, 2005. [Google Scholar] [CrossRef]
- Poon, J. Airborne Geophysical Survey Report, 60 Mile Property Block A, C, and D (Internal Radius Gold Inc. Report); Precision Geosurveys Inc.: Langley, BC, Canada, 2010. [Google Scholar]
- Li, Y.; Oldenburg, D.W. 3-D inversion of magnetic data. Geophysics 1996, 61, 394–408. [Google Scholar] [CrossRef]
- Mortensen, J.K. Geological Compilation Maps of the Northern Stewart River Map Area, Klondike and Sixtymile Districts:(115N/15, 16; 1150/13, 14 and Parts of 115O/15, 16), 1: 50000 Scale; Exploration and Geological Services, Indian and Northern Affairs Canada: Whitehorse, YT, Canada, 1996. Available online: https://ygsftp.gov.yk.ca/publications/openfile/1996/of1996_1(g).pdf (accessed on 17 February 2021).
- Hulstein, R. Report on the Sixty Mile Property 2011 Geophysical Survey & Diamond Drilling. Dawson Mining District, Yukon Territory; NTS: 116C/02 & 115N/15. Available online: https://yma.gov.yk.ca/096256/096256.pdf (accessed on 1 September 2021).
- Lonergan, L.; Wilkinson, J.; McCaffrey, K. Fractures, fluid flow and mineralization: An introduction. Geol. Soc. London, Spec. Publ. 1999, 155, 1–6. [Google Scholar] [CrossRef]
- Sekine, R.; Izawa, E.; Watanabe, K. Timing of fracture formation and duration of mineralization at the Hishikari deposit, Southern Kyushu, Japan. Resour. Geol. 2002, 52, 395–404. [Google Scholar] [CrossRef]
- Slade, H. Geological Report: Sixtymile Claim 2020. Flow Metals: Vancouver, BC, Canada, 2020; Unpublished Work. [Google Scholar]
- Sibson, R.H.; Robert, F.; Poulsen, K.H. High-angle reverse faults, fluid-pressure cycling, and mesothermal gold-quartz deposits. Geology 1988, 16, 551–555. [Google Scholar] [CrossRef]
- Szumigala, D.J.; Werdon, R.J.; Athey, M.B.; Stevens, J.E.; Flynn, D.S.P.; Clautice, R.L.; Craw, K.H. Geologic Map of the Eagle A-1 Quadrangle, Fortymile Mining District: Alaska Division of Geological & Geophysical Surveys Preliminary Interpretive Report 2002-1A, 1 Sheet, Scale 1:63,360. Available online: https://doi.org/10.14509/2863 (accessed on 1 September 2021).


| Reading | Strike | Dip | Lineation Azimuth | Plunge |
|---|---|---|---|---|
| R1 | 59 | 76 | 225 | 25 |
| R2 | 66 | 72 | 229 | 40 |
| R3 | 59 | 59 | - | - |
| SS1 | 196 | 78 | 10 | 6 |
| SS2 | 169 | 80 | 356 | 1 |
| SS3 | 185 | 70 | 342 | 32 |
Publisher’s Note: MDPI stays neutral with regard to jurisdictional claims in published maps and institutional affiliations. |
© 2022 by the authors. Licensee MDPI, Basel, Switzerland. This article is an open access article distributed under the terms and conditions of the Creative Commons Attribution (CC BY) license (https://creativecommons.org/licenses/by/4.0/).
Share and Cite
Rimando, J.; Peace, A.L.; Geng, M.; Verbaas, J.; Slade, H. Structural Setting of the Sixtymile Gold District, Yukon, Canada: Insights into Regional Deformation and Mineralization from Field Mapping and 3D Magnetic Inversion. Minerals 2022, 12, 291. https://doi.org/10.3390/min12030291
Rimando J, Peace AL, Geng M, Verbaas J, Slade H. Structural Setting of the Sixtymile Gold District, Yukon, Canada: Insights into Regional Deformation and Mineralization from Field Mapping and 3D Magnetic Inversion. Minerals. 2022; 12(3):291. https://doi.org/10.3390/min12030291
Chicago/Turabian StyleRimando, Jeremy, Alexander L. Peace, Meixia Geng, Jacob Verbaas, and Harley Slade. 2022. "Structural Setting of the Sixtymile Gold District, Yukon, Canada: Insights into Regional Deformation and Mineralization from Field Mapping and 3D Magnetic Inversion" Minerals 12, no. 3: 291. https://doi.org/10.3390/min12030291
APA StyleRimando, J., Peace, A. L., Geng, M., Verbaas, J., & Slade, H. (2022). Structural Setting of the Sixtymile Gold District, Yukon, Canada: Insights into Regional Deformation and Mineralization from Field Mapping and 3D Magnetic Inversion. Minerals, 12(3), 291. https://doi.org/10.3390/min12030291