Article

Quantitative Investigation of MgO, Al2O3 and SiO2 Effects on Solid-State Formation of Secondary Hematite in Sintering Process of Iron Ore Fines

State Key Laboratory of Advanced Metallurgy, School of Metallurgical and Ecological Engineering, University of Science and Technology Beijing, Beijing 100083, China
*
Authors to whom correspondence should be addressed.
Minerals 2022, 12(3), 282; https://doi.org/10.3390/min12030282
Submission received: 6 January 2022 / Revised: 14 February 2022 / Accepted: 18 February 2022 / Published: 24 February 2022
(This article belongs to the Special Issue Mineralogy of Iron Ore Sinters, Volume II)

Abstract

:
Secondary hematite (SH) is a serious factor resulting in reduction degradation of iron ore sinter in a blast furnace; however, until now, a quantitative study for SH formation had not been reported. In this work, the effects of gangue composition, including MgO, Al2O3 and SiO2, on the solid-state formation in the sintering process of iron ore fines were investigated quantitatively. It shows that the SH formation decreased from 67.84% to 46.11%, 35.44% and 22.37% after adding 1.0%, 3.0% and 5.0% MgO, respectively, while for Al2O3, the amount increased to 69.38%, 69.98% and 70.56%, respectively. For SiO2, the amount changed to 68.14%, 61.59% and 47.96%, respectively. Simultaneously, the magnetite (magnesioferrite) formation increased from 8.24% to 34.79%, 50.26% and 70.45% after adding 1.0%, 3.0% and 5.0% MgO, respectively. For Al2O3 and SiO2, the amount changed to 8.95%, 8.37%, 7.62% and 7.62%, 11.10%, 18.77%, respectively, compared with no gangue. This indicates that the SH formation increased with decrease in magnesioferrite. It was found that the decrease in SH formation relates to the diffusion of Mg2+ in magnesioferrite, which inhibits the solid-state formation of SH kinetically. A supposition was suggested that a maghemite existed at a high temperature, and decreased with an increase in MgO addition. This would be another reason to improve the degradation performance of iron ore sinter.

1. Introduction

For energy saving and emission reduction in the iron and steel industry, the metallurgical performance of iron ore sinter, including reduction degradation index (RDI), reduction index (RI), and softening–melting properties, has attracted increasing amounts of attention [1,2,3]. In a blast furnace (BF), reduction degradation at a low temperature is usually caused by the volume expansion and lattice distortion of minerals from hematite to magnetite [4,5,6], resulting in increases in gas flow resistance in shaft of BF [7,8]. In previous studies, this has been related to with gangue components such as MgO, Al2O3 and SiO2 in iron ore sinter or pellet.
Shen et al., Zhang et al., and other researchers [9,10,11,12,13,14,15,16,17,18] reported that increasing the MgO content in iron ore sinter could improve the reduction degradation performance. As for the mechanism, It has been some conflicting. Zhang et al. [10] and Yi et al. [16] considered that Mg2+ could enter in magnetite lattice promoting the formation of magnetite or magniferous magnetite (magnesioferrite), simultaneously inhibiting the phase transition from magnetite to hematite in the cooling process. Pan et al. [17] considered that Mg2+ diffuses into magnetite, which forms pores and active sites, promoting the reaction of hematite to magnetite kinetically. Our previous work [18] confirmed that MgO improves the formation of magnesioferrite as a spinel phase, including magnetite, magnesium ferrite and magniferous magnetite in the sintering process, and found that MgO reacts with hematite to form magnesium ferrite at the initial stage, which results in decrease in the crystal nucleation energy of magnetite, promoting the formation of magnetite. After that, Mg2+ replaces Fe2+ in magnetite to form the magnesioferrite, whilst simultaneously stabilizing the crystal structure as a spinel. Due to the increase in the amount of magnesium ferrite, magnetite, or magnesioferrite in iron ore sinter, the transformation of hematite to magnetite would be reduced and, thus, the RDI for the iron ore sinter is improved.
Shigaki and Sawada, Pimenta and Seshadri, and other researchers reported that increasing the Al2O3 content in iron ore sinter or pellet would deteriorate the reduction degradation performance [7,19,20,21,22,23,24]. As for the mechanism, Shigaki and Sawada, Pimenta and Seshadri and other researchers [7,19,20,21] considered that Al3+ could enter in hematite lattice by substituting Fe3+, resulting in a faster reduction rate of hematite; furthermore, Shigaki and Sawada [19] observed that Al3+ existed in the magnetite lattice after the reduction of Al3+-containing hematite, which resulted in serious lattice distortion, promoting a transformation of magnetite to hematite in the cooling stage of the sintering process, whilst simultaneously promoting the formation of the columnar calcium ferrite [7] and Al3+-containing glass phase [21,22,23] after increasing the Al2O3 content. However, there is no report regarding the effect of alumina on SH formation due to the complexity of the sintering process of iron ore fines.
Matsuno, Kawaguchi et al. and our previous work [24,25,26,27] reported that increasing the SiO2 content in iron ore sinter could improve the formation of the binding phase, simultaneously changing the microstructure of the sinter and the morphology of minerals [28,29,30]. However, there is no report directly regarding the effect of SiO2 on reduction degradation performance.
Many studies reported that the increase in a secondary hematite (SH) in iron ore sinter obviously deteriorated the reduction degradation at low temperature [28,29,31]. The SH is a reproductive product in the cooling stage of sintering process. At a high temperature, the hematite decomposes to form a solid-state magnetite, and then it is re-oxidized to form the SH in cooling stage of sintering process. In addition, the crystallization induced from the melting phase of Fe-containing minerals would also cause the formation of SH [6,32].
However, any quantitative effects of the gangue component on the formation of the secondary hematite in the sintering process have not been reported until now due to the following two difficulties: First, the secondary hematite and primary hematite are difficult to distinguish. Second, the secondary hematite is formed complicatedly in a multi-phase environment with the melting phase and solid phase in the sintering process. In this work, we simplify the problem to quantify the transformation between hematite and magnetite for investigating the effect of the gangue component on the solid-state formation of the secondary hematite by changing the temperature and atmosphere, simultaneously following the oxygen-mass change in samples. In spite of this, we ignored some factors such as the interaction of various gangue [3], the rate of temperature change and the formation of the melting phase [32] in the sintering process of iron ore fines, but could reveal the quantitative effects of MgO, Al2O3 or SiO2 on the solid-state formation of a secondary hematite in the sintering process of iron ore fines; undoubtedly, this will be an advance in this field.

2. Materials and Methods

2.1. Raw Materials

As raw materials, analytical-grade agents, including hematite (Fe2O3), magnesia (MgO), alumina (Al2O3) and silicon oxide (SiO2), were supplied by Sinopharm Chemical Reagent Co. Ltd., Shanghai, China; theywere preheated at 1200 °C for 2 h to remove volatiles, and ground to a size less than 74 μm.
Fe2O3 was mixed with different gangue components (1.0%, 3.0% and 5.0%), ensuring thorough homogenization. Then, a 5.0 g sample was taken to press tablets with 15 mm in diameter by using a briquetting machine at 5 MPa for 2 min, and dried at 100 °C for 12 h in a loft drier as raw samples.

2.2. Selections of Atmosphere and Temperature

The SH was formed in solid state as follows:
Primary hematite (PH) → Magnetite (M) → Secondary hematite (SH)
The reactions take place by ferric reduction or ferrous oxidation; simultaneously the content of oxygen in the samples changes, as shown in Equation (1) [33].
3 Fe2O3 = 2Fe3O4 + 0.5 O2 ∆Gθ = 250,205 − 140.39T (J)
The relationship between the temperature (T/K) and oxygen partial pressure (pO2/Pa) was obtained using Equation (1) thermodynamically, as shown in Equation (2).
ln (pO2/pθ) = 33.77 − 60,189/T
where, pθ is equal to 1.013 × 10⁵ Pa. In this work, two levels of oxygen partial pressure, 2.13 × 10⁴ Pa and 1.07 × 10⁴ Pa, were selected for promoting the transformation between hematite and magnetite, respectively, corresponding to that in air and a lower-oxygen-potential atmosphere. Therefore, the transformation temperatures between hematite and magnetite were calculated as 1704 K (1430 °C) and 1671 K (1398 °C), respectively, according to Equation (2).
The oxygen partial pressure is controlled by mixing oxygen and nitrogen gases (purity 99.99%) under a total pressure of 1.013 × 10⁵ Pa in mass flow controllers. The temperature and atmosphere were changed to investigate the effects of the gangue component on the formation of secondary hematite, as follows.
Figure 1 shows the changes in temperature and atmosphere in the sintering process. For the synthesis of iron ores containing different gangue components, raw samples were heated from room temperature (RT, Stage 1) to 1220 °C (Stage 2) with 3.0 °C/min in a vertical electric furnace with a reaction tube of 70 mm in diameter, and kept at 1220 °C for 240 min (Stage 3), then cooled down to RT (Stage 4) with 5 °C/min in air (pO2 = 2.13 × 10⁴ Pa), which were preheated samples.
To investigate SH formation, the preheated samples were heated with 3.8 °C/min from room temperature (Stage 4) to 460 °C (Stage 5), kept at 460 °C for 60 min (Stage 6) to obtain a linear temperature-heating process after 460 °C, raised by 3.8 °C/min to 1400 °C (Stage 7), and then kept at 1400 °C for 120 min (Stage 8) in pO2 = 1.07 × 10⁴ Pa for the transformation of hematite to magnetite. For the transformation of magnetite to hematite, these samples were cooled down to 1200 °C (Stage 9) by 4 °C/min in air, in which the rate of temperature change and temperature were selected to promote the transformation between hematite and magnetite only. The total gas flow was controlled at 2 L/min throughout the experimental process.
The 1220 °C and 1400 °C, respectively, corresponded to one lower than 1430 °C in air for the stabilization of hematite, and other one higher than 1398 °C in pO2 = 1.07 × 10⁴ Pa for the stabilization of magnetite thermodynamically.

2.3. Thermogravimetric Method

The mass changes in oxygen of the samples were measured by using an electronic balance (precision, ±0.0001 g) and computer system throughout the whole process, where the sample is set in a basket with platinum wires, put into a constant temperature zone in the vertical electric furnace, and suspended under the balance.
The ferrous content [w(Fe2+), %] and the secondary hematite content [w(SH), %] of the samples were calculated according to Equation (1), as follows:
w ( Fe 2 + ) = a ( m 0     m ) m 0   ×   100 %
w ( SH ) = ( b a ) [ w ( Fe 2 + ,   Stage   8 )     w ( Fe 2 + ,   Stage   9 ) ]
where m0 and m are the mass of a sample, respectively, at an initial time (t = 0) and a certain time (t = t), g; w(Fe2+, Stage 8) and w(Fe2+, Stage 9) are the ferrous content, respectively, at Stages 8 and 9; a and b are the mass ratios of ferrous and SH formations, respectively, to changes of oxygen in the processes of hematite decomposition and magnetite oxidation, i.e., 7:1 and 30:1 calculated according to Equation (1).
For determinations of the mineral composition and the microstructure of samples, the sample was taken out at different stages and quenched in liquid nitrogen.

2.4. Minerals Characterization

The samples were ground to powders less than 50 μm with agate mortar and pestle for XRD. XRD determination was carried out using a Rigaku UItima IV X-ray diffractometer (Rigaku Corporation, Tokyo, Japan). The patterns were run with CuKα at 40 kV and 40 mA with a scanning speed of 10 deg. in 2θ per minute. Because they have the same XRD patterns and the magnetite (Fe3O4), magnesium ferrite (MgFe2O4) and magniferous magnetite ([Mg1−x, Fex]O·Fe2O3, 1 > x > 0) were expressed together as magnesioferrite ([Mg1−x,Fex]O·Fe2O3, 1 ≥ x ≥ 0), it can be considered as a solid solution between the magnetite and the magnesium ferrite, corresponding to x = 1 and x = 0, respectively. Further, the content of magnesioferrite [w(M), %] was calculated according to the Mg2+ and Fe2+ content in samples, as follows:
w ( M ) = c   w ( Fe 2 + ) + d   w ( Mg 2 + )
where w(Mg2+) is the mass percentage of Mg2+ in iron oxide; c and d are the mass ratios of magnetite (Fe3O4) to ferrous in the magnetite and magnesium ferrite (MgFe2O4) to magnesium in the magnesium ferrite, respectively, i.e., 29:7 and 25:3.
The sample was mounted in an ethylenediamine-doping epoxy resin, ground and polished by a machine for observations of the mineral phase and microstructure. SEM-EDS was performed using a scanning electron microscope (MLA250, FEI Hong Kong Co. Ltd., Hillsboro, OR, USA), and the accelerating voltage was 15 kV to confirm the element concentration in minerals.

3. Results and Discussion

3.1. Existence State of Gangue Component in Preheated Samples (Stage 4)

The XRD pattern of the preheated samples with a 5.0% gangue content are shown in Figure 2. It was obvious that the diffraction peak of a sample with 5.0% Al2O3 and the pure hematite sample corresponded to hematite (PDF 33-664), having a single mineral, whereas that of samples with 5.0% MgO and 5.0% SiO2, respectively, corresponded to hematite and magnetite or magnesioferrite (PDF 36-398), and hematite and quartz (PDF 46-1045). The Al2O3 and MgO disappeared in the preheated sample. It was considered that Al2O3 reacted with hematite to form an Al-containing hematite solid solution [(Fe1−xAlx)2O3] by a solid solution of Al2O3 into hematite; MgO reacted with hematite to form a Mg-containing magnetite called as magnesioferrite (Fe1−xMgxO⋅Fe2O3) by a solid solution of MgO into magnetite. However, the SiO2 is still existed in the sample, which means that SiO2 did not react with hematite. The micrographs of the preheated samples with different gangue component are shown in Figure 3. It corresponds with the XRD result, further confirming that the dark grey phase is SiO2 in the preheated sample with 5.0% SiO2, while the grey phase is Fe1−xMgxO⋅Fe2O3 in the preheated sample with 5.0% MgO [18].
Compared the above results in the preheated samples, as shown in Figure 2 and Figure 3, there were transformations of hematite to magnesioferrite only in the sample with 5.0% MgO. Moreover, the effects of MgO on ferrous content, mineral composition and microstructure in the preheated samples with different contents of MgO were investigated in detail, as shown in Figure 4. Figure 4a shows that the ferrous content increased with increase of MgO content in the preheated samples with 1.0% MgO, 3.0% MgO and 5.0% MgO, respectively, to 0.56%, 1.45% and 2.80% at Stage 4, simultaneously increasing with the increase of temperature. Figure 4b shows the XRD pattern of the preheated samples in which magnesioferrite increased with the increase in MgO content, whereas hematite decreased. Figure 4c shows the optical microstructures of the preheated samples in which the dark-grey-color magnesioferrite increased with the increase in MgO content. The results of the XRD and the optical microstructure are consistent with the change in ferrous content, which indicates that the increases in MgO and temperature could promote the transformation of hematite to magnesioferrite. In addition, the MgO was not observed in the samples, indicating that MgO had entered completely into the magnesioferrite.
According to transformation of hematite to magnetite in Equations (1) and (3) corresponding with Fe2+ + 2Fe3+ + 4O2− = Fe3O4, the amount of magnetite in the preheated samples with 1.0%, 3.0% and 5.0% MgO was calculated, respectively, by the ferrous content to 2.32%, 6.01% and 11.60% at Stage 4. Furthermore, the MgO was considered as being in the magnesioferrite as magnesium ferrite using the following equation:
MgO + Fe2O3 = MgFe2O4
where the content of magnesium ferrite in the preheated samples with 1.0%, 3.0% and 5.0% MgO can be calculated, respectively, as 5.0%, 15.0% and 25.0% at Stage 4. So, the total contents of magnesioferrite were 7.32%, 21.01% and 36.60%.

3.2. Effects of Gangue Component on Transformation between Hematite and Magnetite or Magnesioferrite

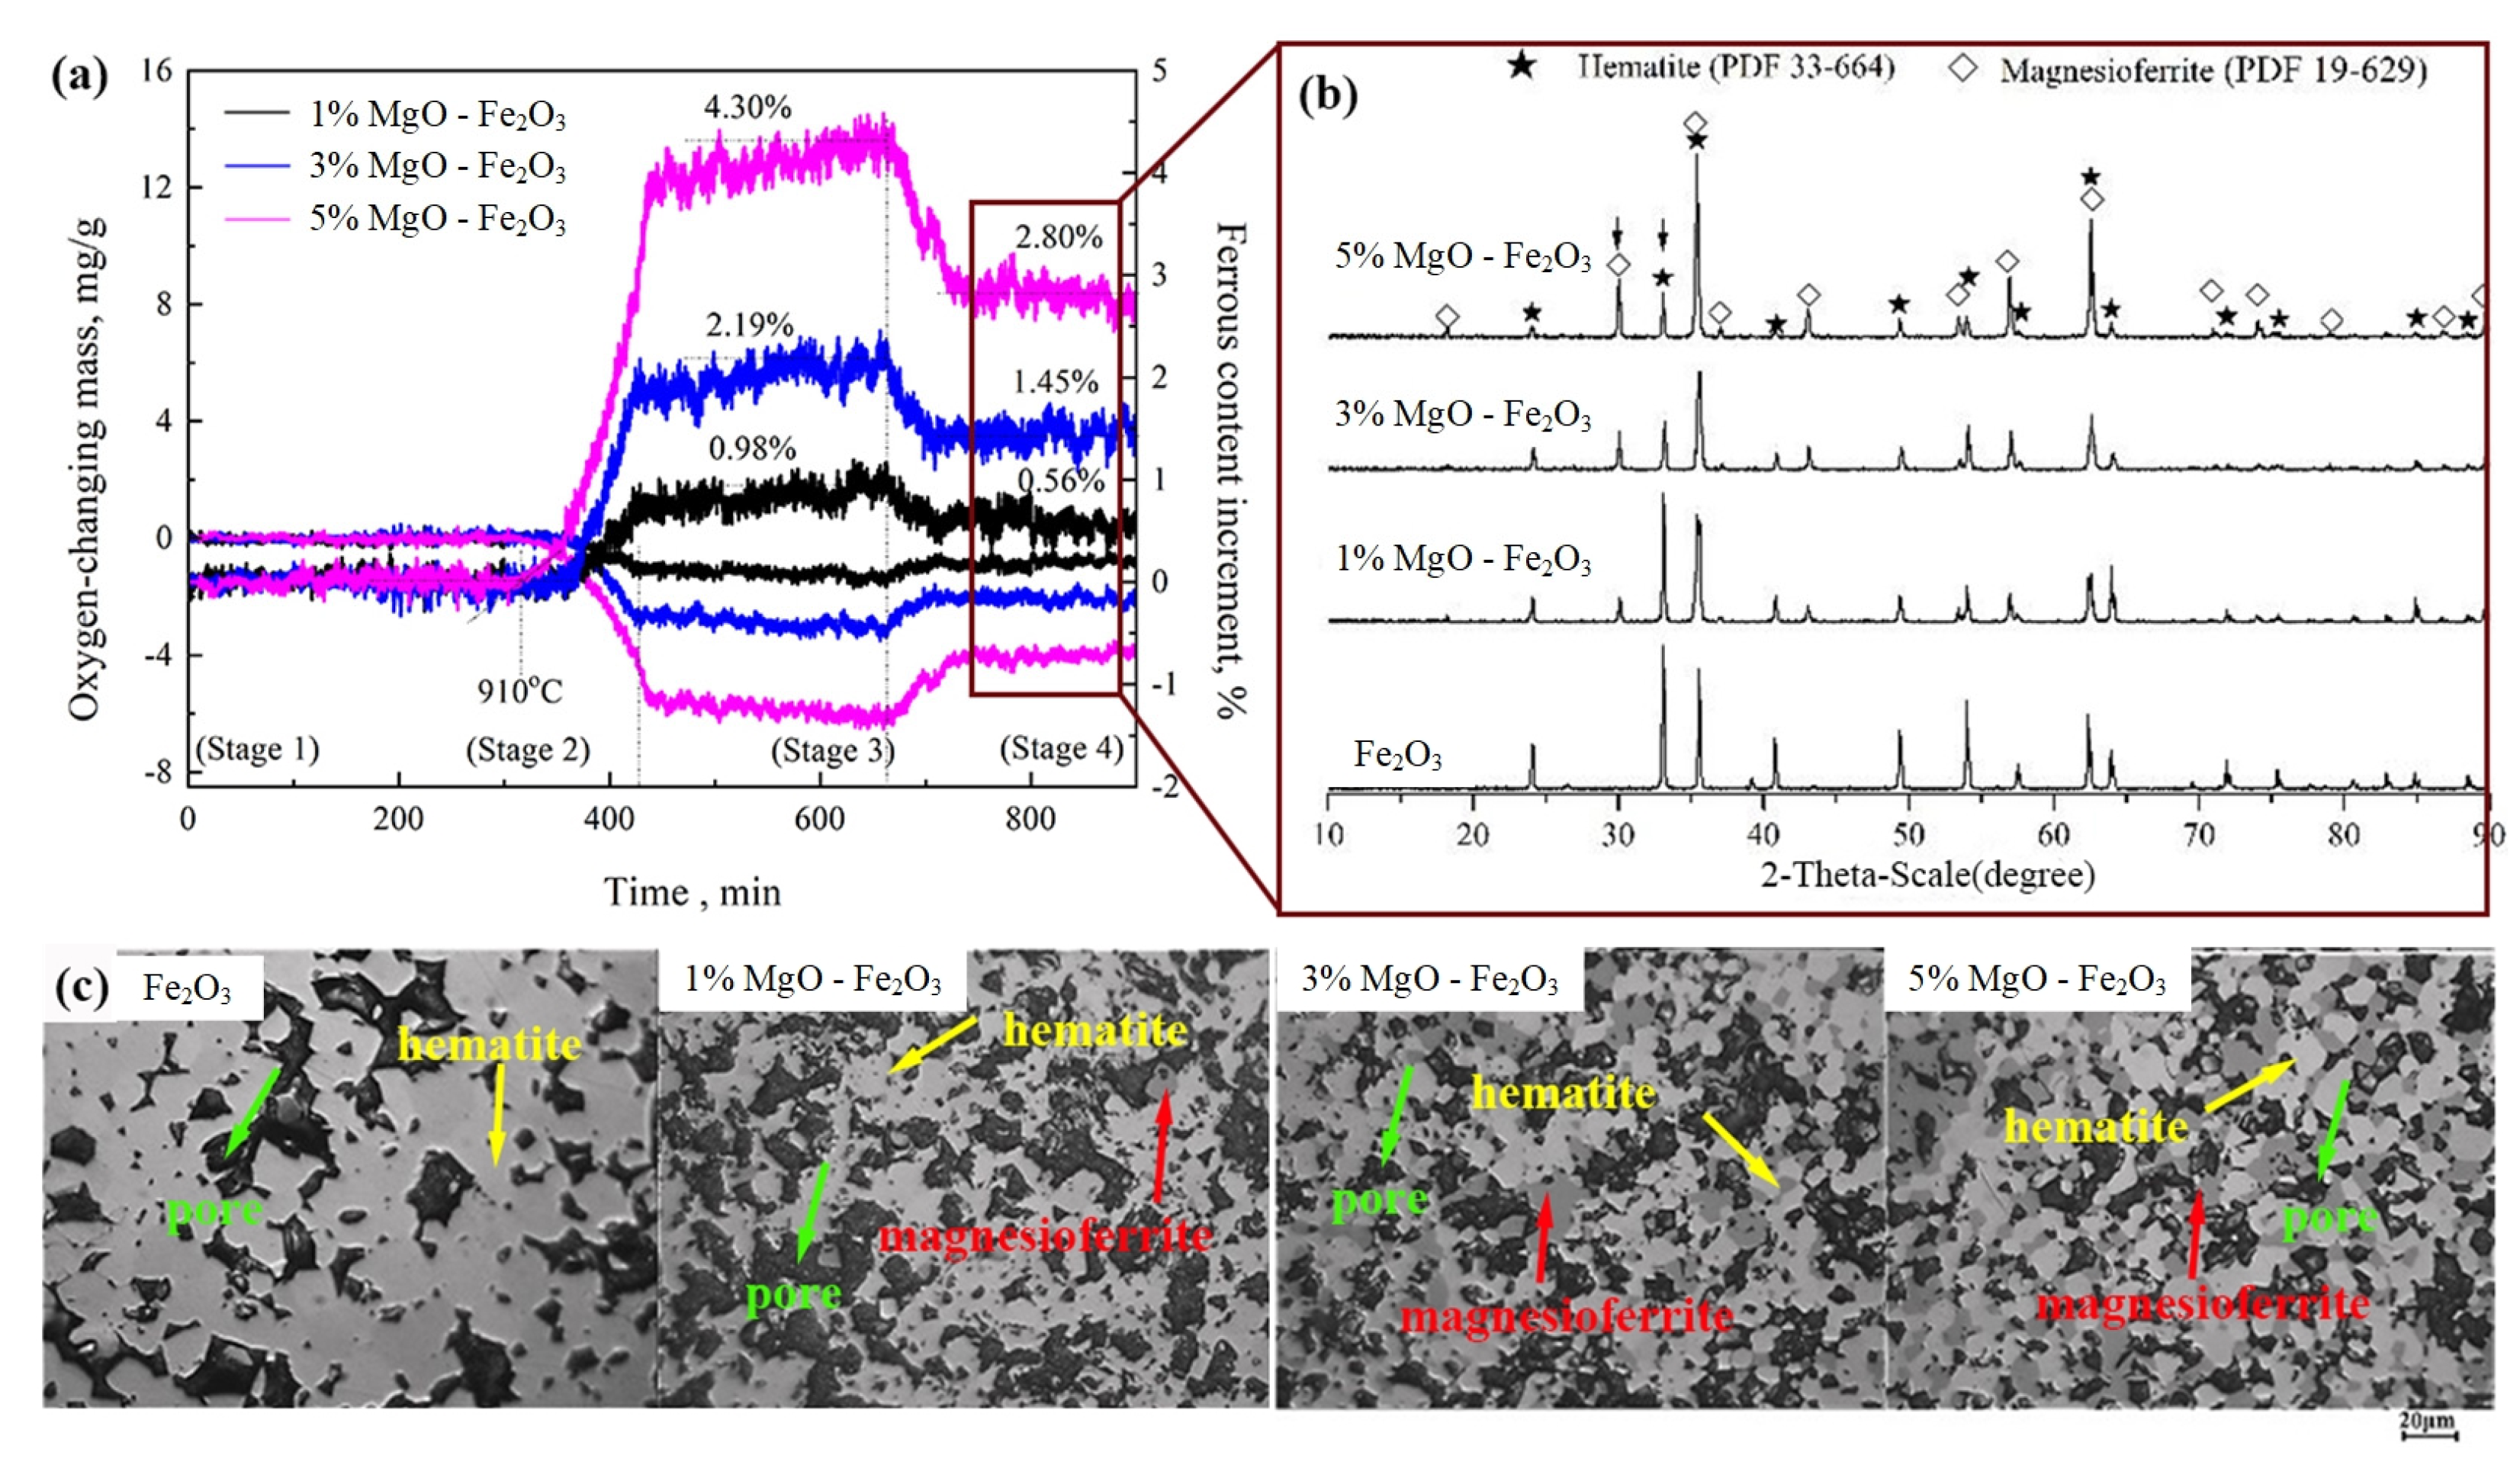
3.2.1. Magnesia (MgO)

The effect of MgO on the ferrous content of samples in the temperature-increasing (Stage 6 to Stage 7), temperature-keeping (Stage 7 to Stage 8) and temperature-decreasing (Stage 8 to Stage 9) processes and the corresponding XRD patterns, respectively, at Stage 7 to Stage 9 are shown in Figure 5, in which the samples at Stage 6 were considered the same as the samples at Stage 4 due to the absence of mass changes at low temperatures.
Figure 5a shows variations in the ferrous content. The transformation temperature of ferric to ferrous ions decreased with the increase in MgO content in samples, but was higher than that in the preheating process. For example, in the sample with 5.0% MgO, the ferrous ions began to form at 1068 °C, whereas when they appeared at 910 °C in the preheating process, both temperatures were lower than that of the pure hematite. The difference can be considered due to the lower activity of MgO than in the preheating process. According to the mass loss of oxygen amount from Stage 4 to Stage 8 as shown in Figure 5a, the increments of ferrous content in samples with MgO-free, 1.0% MgO, 3.0% MgO and 5.0% MgO were 17.82%, 17.09%, 15.33% and 13.39%, respectively; the ferrous content can be calculated as 17.82%, 17.65%, 16.78% and 16.19%, respectively, at Stage 8, after adding 0, 0.56%, 1.45% and 2.80%, respectively, at Stage 4. So, the content of magnesioferrite in samples should be 73.83%, 78.12%, 84.52% and 92.07%, respectively, at Stage 8, whereas they are 8.24%, 34.78%, 50.26% and 70.45%, respectively, at Stage 9. It also indicates that the content of magnesioferrite increased with the increased MgO content in the samples.
Figure 5b–d show the XRD patterns of samples with MgO-free, 1.0% MgO, 3.0% MgO and 5.0% MgO at Stage 7 to Stage 9, respectively. The magnesioferrite at Stage 7, as shown in Figure 5b, increased with the increase in MgO content, corresponding to the result in Figure 4b, which also indicates that the amount of magnesioferrite increased with the increase in temperature. The result in Figure 5c shows that all of the phase is magnesioferrite with low amounts of hematite at Stage 8. However, the content of hematite or secondary hematite, as shown in Figure 5d, increased obviously with the decrease in MgO content in the samples at Stage 9.
There is an obvious difference in magnesioferrite content between the result by XRD intensity, in Figure 5c, and the calculation according to the ferrous content in Figure 5a. To confirm this reason, the optical microstructure was observed, as shown in Figure 6. It can be seen that the morphology of the light-color hematite phase transformed from a small-size lath type to a large-size lumpy shape after the re-oxidation process, which is consistent with the results reported by Simmonds and Hayes [34]. Furthermore, the amount of hematite decreased with the increase in MgO adding, which is consistent with the result from the XRD patterns. Therefore, a supposition can be suggested that there is an existence of maghemite (γ-Fe2O3) caused by having the same crystal structure and the same optical reflection color as magnesioferrite, while having the same chemical composition as hematite (α-Fe2O3)—hence why there is almost magnesioferrite at Stage 8 according to the XRD result and the optical result, while there was only 73.83%, 78.12%, 84.52% and 92.07% calculated, respectively, by the ferrous content in Figure 5a. It can be considered that the content of maghemite decreased with the increase in MgO content in samples, in which the maghemite is an unstable mesophase between α-hematite and magnetite, transforming easily to hematite or magnetite. Therefore, the existence of maghemite is a hidden danger to the degradation of iron ore sinter; it may also accelerate the transformation in SH formation.
The dependences of ferrous content at Stage 8 and Stage 9, and the SH content at Stage 9 with increase in MgO content, are shown in Figure 7. The formation of SH obviously decreased from 67.84% to 46.11%, 35.44% and 22.37% with the increase in MgO content; simultaneously, the ferrous content increased at Stage 9. In addition, it can also be seen that all of MgO entered completely into the magnesioferrite, according to the results of the XRD patterns and optical microstructure shown in Figure 4b, due to the absence of a MgO phase. This indicates that Mg2+ in magnesioferrite has an important role to stabilize the crystal structure of the spinel and restrain the formation of SH.

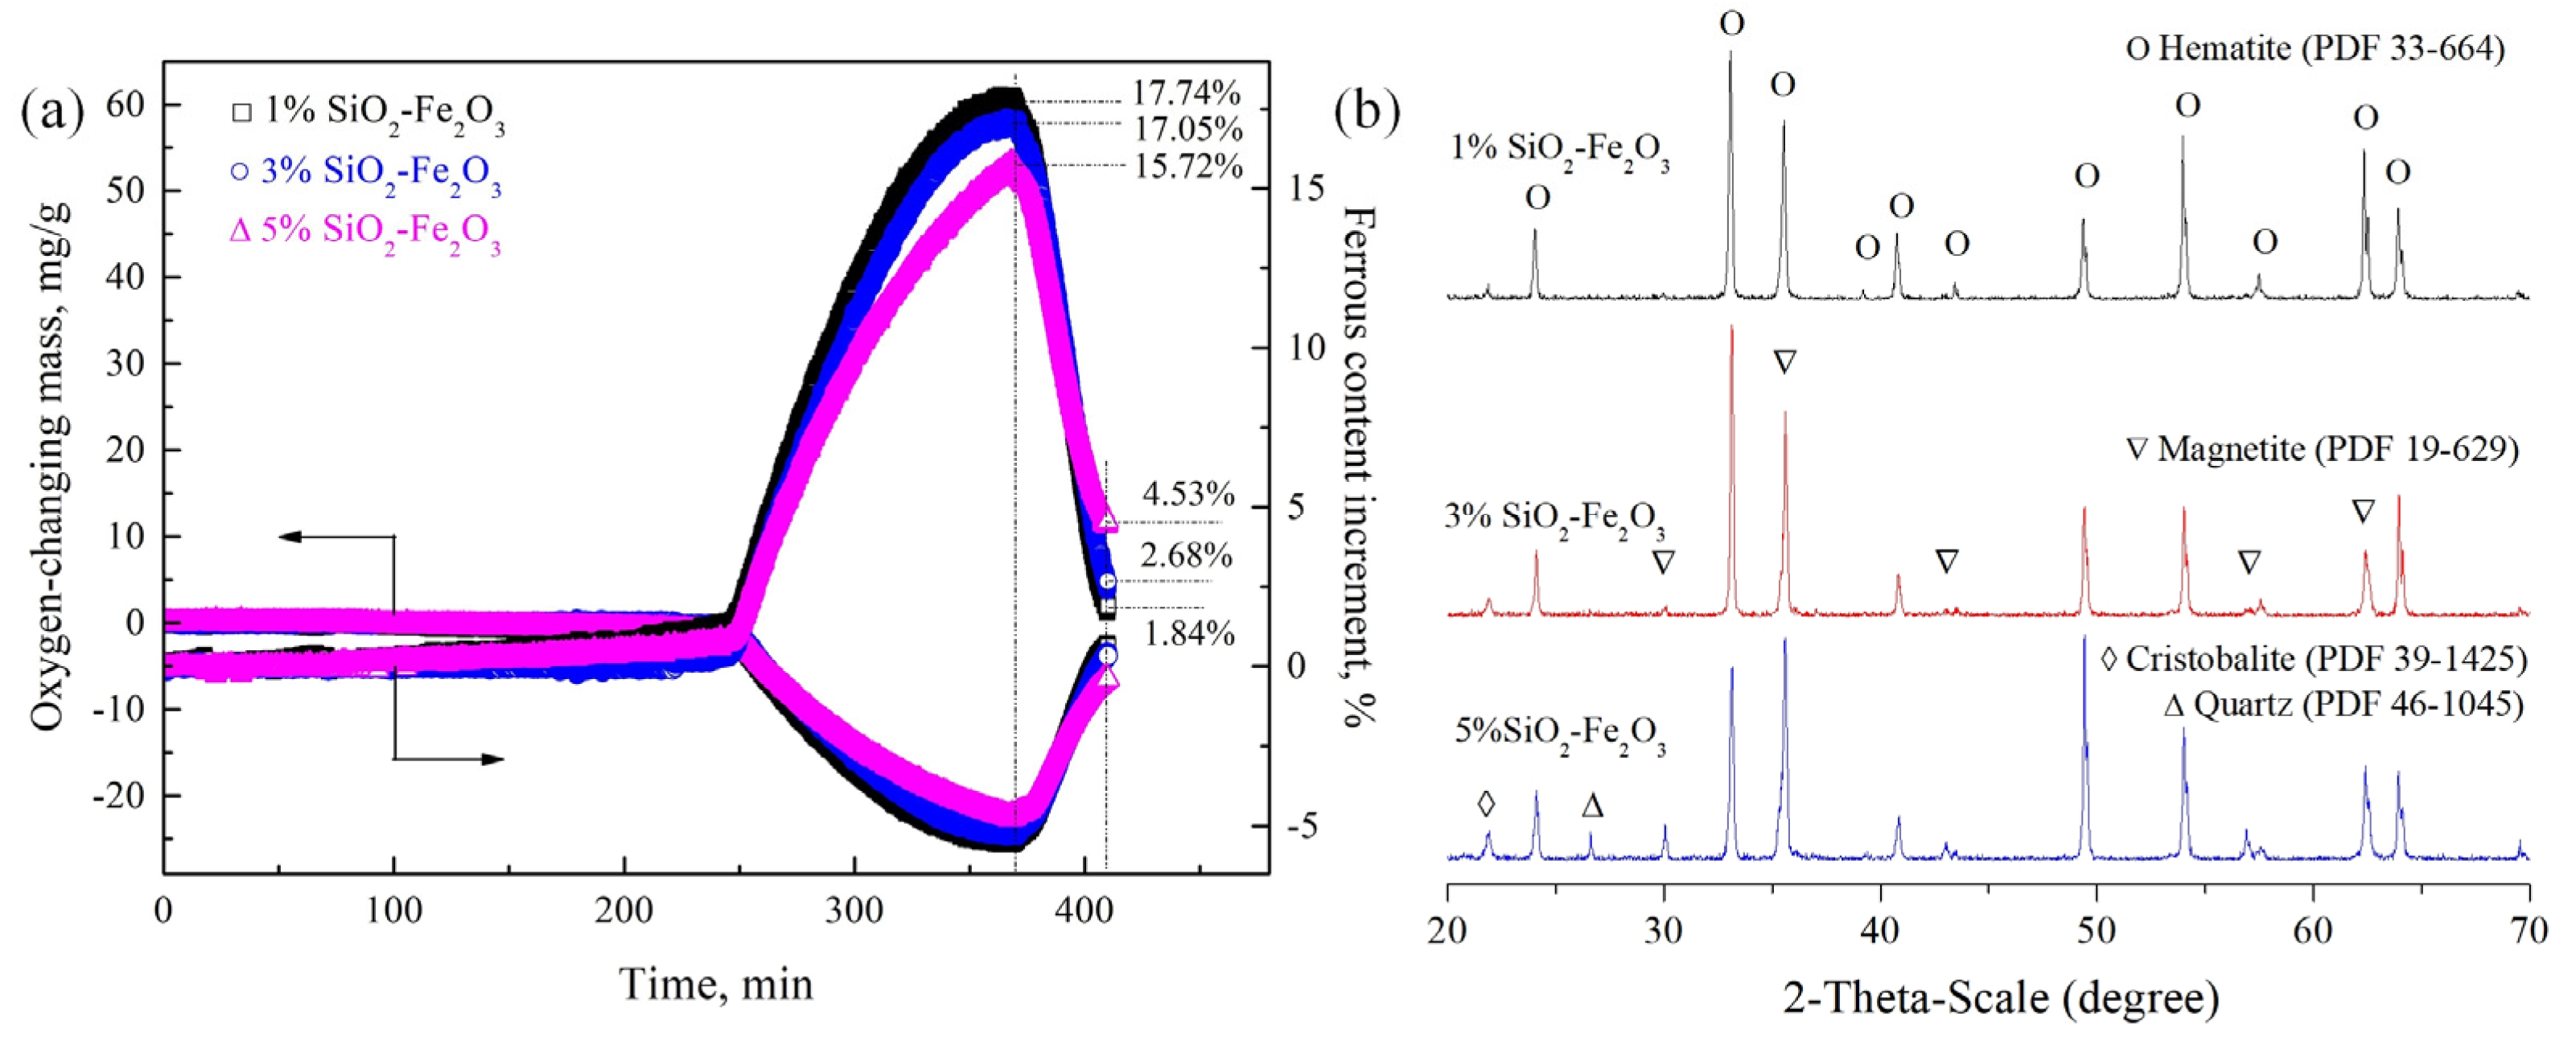
3.2.2. Alumina (Al2O3) and Quartz (SiO2)

Figure 8 and Figure 9 show variations in the ferrous content of samples with different Al2O3 and SiO2 contents, respectively. The variations in ferrous content and changes in oxygen mass with different levels of Al2O3 addition are shown in Figure 8a. The transformation rate became significantly faster with the increase in Al2O3 addition. From the XRD patterns of the samples with different Al2O3 addition at Stage 9, as shown in Figure 8b, the diffraction peak intensity of magnetite was reduced, but the converse was the case for hematite, which indicates that adding Al2O3 can promote the formation of secondary hematite in a temperature-changing process. Figure 9a presents the variations in ferrous content and changes in oxygen mass with different levels of SiO2 addition. It can be seen that the formation of magnetite and secondary hematite was inhibited. Furthermore, from the XRD patterns of the samples at Stage 9, as shown in Figure 9b, it can be seen that the diffraction peak of SiO2 was there, which indicates that the addition of SiO2 did not result in a reaction with hematite or magnetite during the sintering process compared with the result in Figure 2. It shows that the Al2O3 and SiO2 played a different role in the transformation between hematite and magnetite, where it was promoted by an increase in Al2O3 content in the samples, due to the stress produced by the solid solution of Al2O3 in hematite and magnetite. However, this process was hindered with the increase in SiO2 content in samples due to the SiO2, as a wall obstructing the transmission of oxygen gas produced, as shown in Equation (1).
The contents of magnetite at Stage 4, Stage 8 and Stage 9 and the SH at Stage 9 calculated by the ferrous content are listed in Table 1. The contents of SH decreased from 68.14% to 61.59% and 47.96%, respectively, with the increase in SiO2 content from 1.0%, 3.0% to 5.0%, respectively; while they increased from 70.08% to 72.14% and 74.27%, respectively, with the increase in Al2O3 content from 1.0%, 3.0% to 5.0%, respectively, where it is supposed that Al2O3 was uniformly distributed into iron oxides.

3.3. Mechanism to Hinder the SH Formation by Increase in MgO in Samples

Comparing the effect of the gangue component on the formation of SH, the MgO plays a more important role than the SiO2 and Al2O3; therefore, we will investigate the mechanism that the SH formation was hindered with increase of MgO.
In the cooling process from Stage 8 to Stage 9, the ferrous ions in magnesioferrite are oxidized to form the SH, as follows:
2([Mg1−x,Fex]O⋅Fe2O3) + 0.5xO2 → 2(1 − x)(MgO⋅Fe2O3) + 3xFe2O3
or
2Fe3O4 + 0.5O2 → 3Fe2O3
Figure 10 and Table 2 show the SEM image and EDS results of samples with 5.0% MgO at different stages. Comparing the chemical composition of elements and electronic scattering color of mineral phases at Stage 4 (Stage 6) to Stage 9—as shown in Figure 10a–d, with the corresponding XRD patterns shown in Figure 4 and Figure 5, and the optical microstructure shown in Figure 6d—it can be seen that only two phases existed in the sintering process, where the grey phase is hematite without an Mg element, while the dark-grey phase is magnesioferrite with an Mg element, which also confirmed that MgO completely entered into the magnesioferrite. An interesting phenomenon was found, namely, that the Mg content in the magnesioferrite decreased with the increase in temperature. Based on the phase diagram of Fe-Mg-O [35], iron oxide tends to form the spinel state magnetite at a higher temperature, while the phase region for the spinel magnetite became larger; simultaneously, the transformation temperature from hematite to magnetite became lower with the increasing Mg content in the Fe-Mg-O system. This indicates that, at a lower temperature, the stabilization of magnesioferrite declined, which means the magnesioferrite at a lower temperature requires a higher Mg concentration than that at a higher temperature for stabilization, which is identical to our experiment’s result. Furthermore, it can be seen in Figure 10 and Table 2 that there are only two phases, including the no-MgO phase and Mg-bearing phase, which corresponds to the hematite and magnesioferrite, respectively; thus, the concentration variation of Mg in the magnesioferrite at different stages can be attributed to the tracking of Mg2+ diffusion in the magnesioferrite in temperature-changing process, which is related to the transformation between hematite and magnesioferrite. Due to the slow rate of Mg2+ diffusion in a solid state, mineral transformation was restricted. Therefore, it can be considered that the diffusion of Mg2+ ions in the magnesioferrite is a key factor to hinder the formation of the SH kinetically, helping to improve degradation of the iron ore sinter.

4. Conclusions

Thermogravimetry, X-ray diffraction, and SEM-EDS methods were used to follow the transformations between hematite and magnetite or magnesioferrite to investigate the effects of gangue components (MgO, Al2O3 and SiO2 whose contents are no more than 5.0 wt%) on the solid-state formation of a secondary hematite in the sintering process of iron ore fines. The following conclusions have been obtained:
(1)
Even though the temperature was lower than the thermodynamic transformation temperature of hematite to magnetite, MgO and Al2O3 can react with hematite to form solid solutions as magnesioferrite and Al-containing hematite, respectively, at 1220 °C, while SiO2 did not react.
(2)
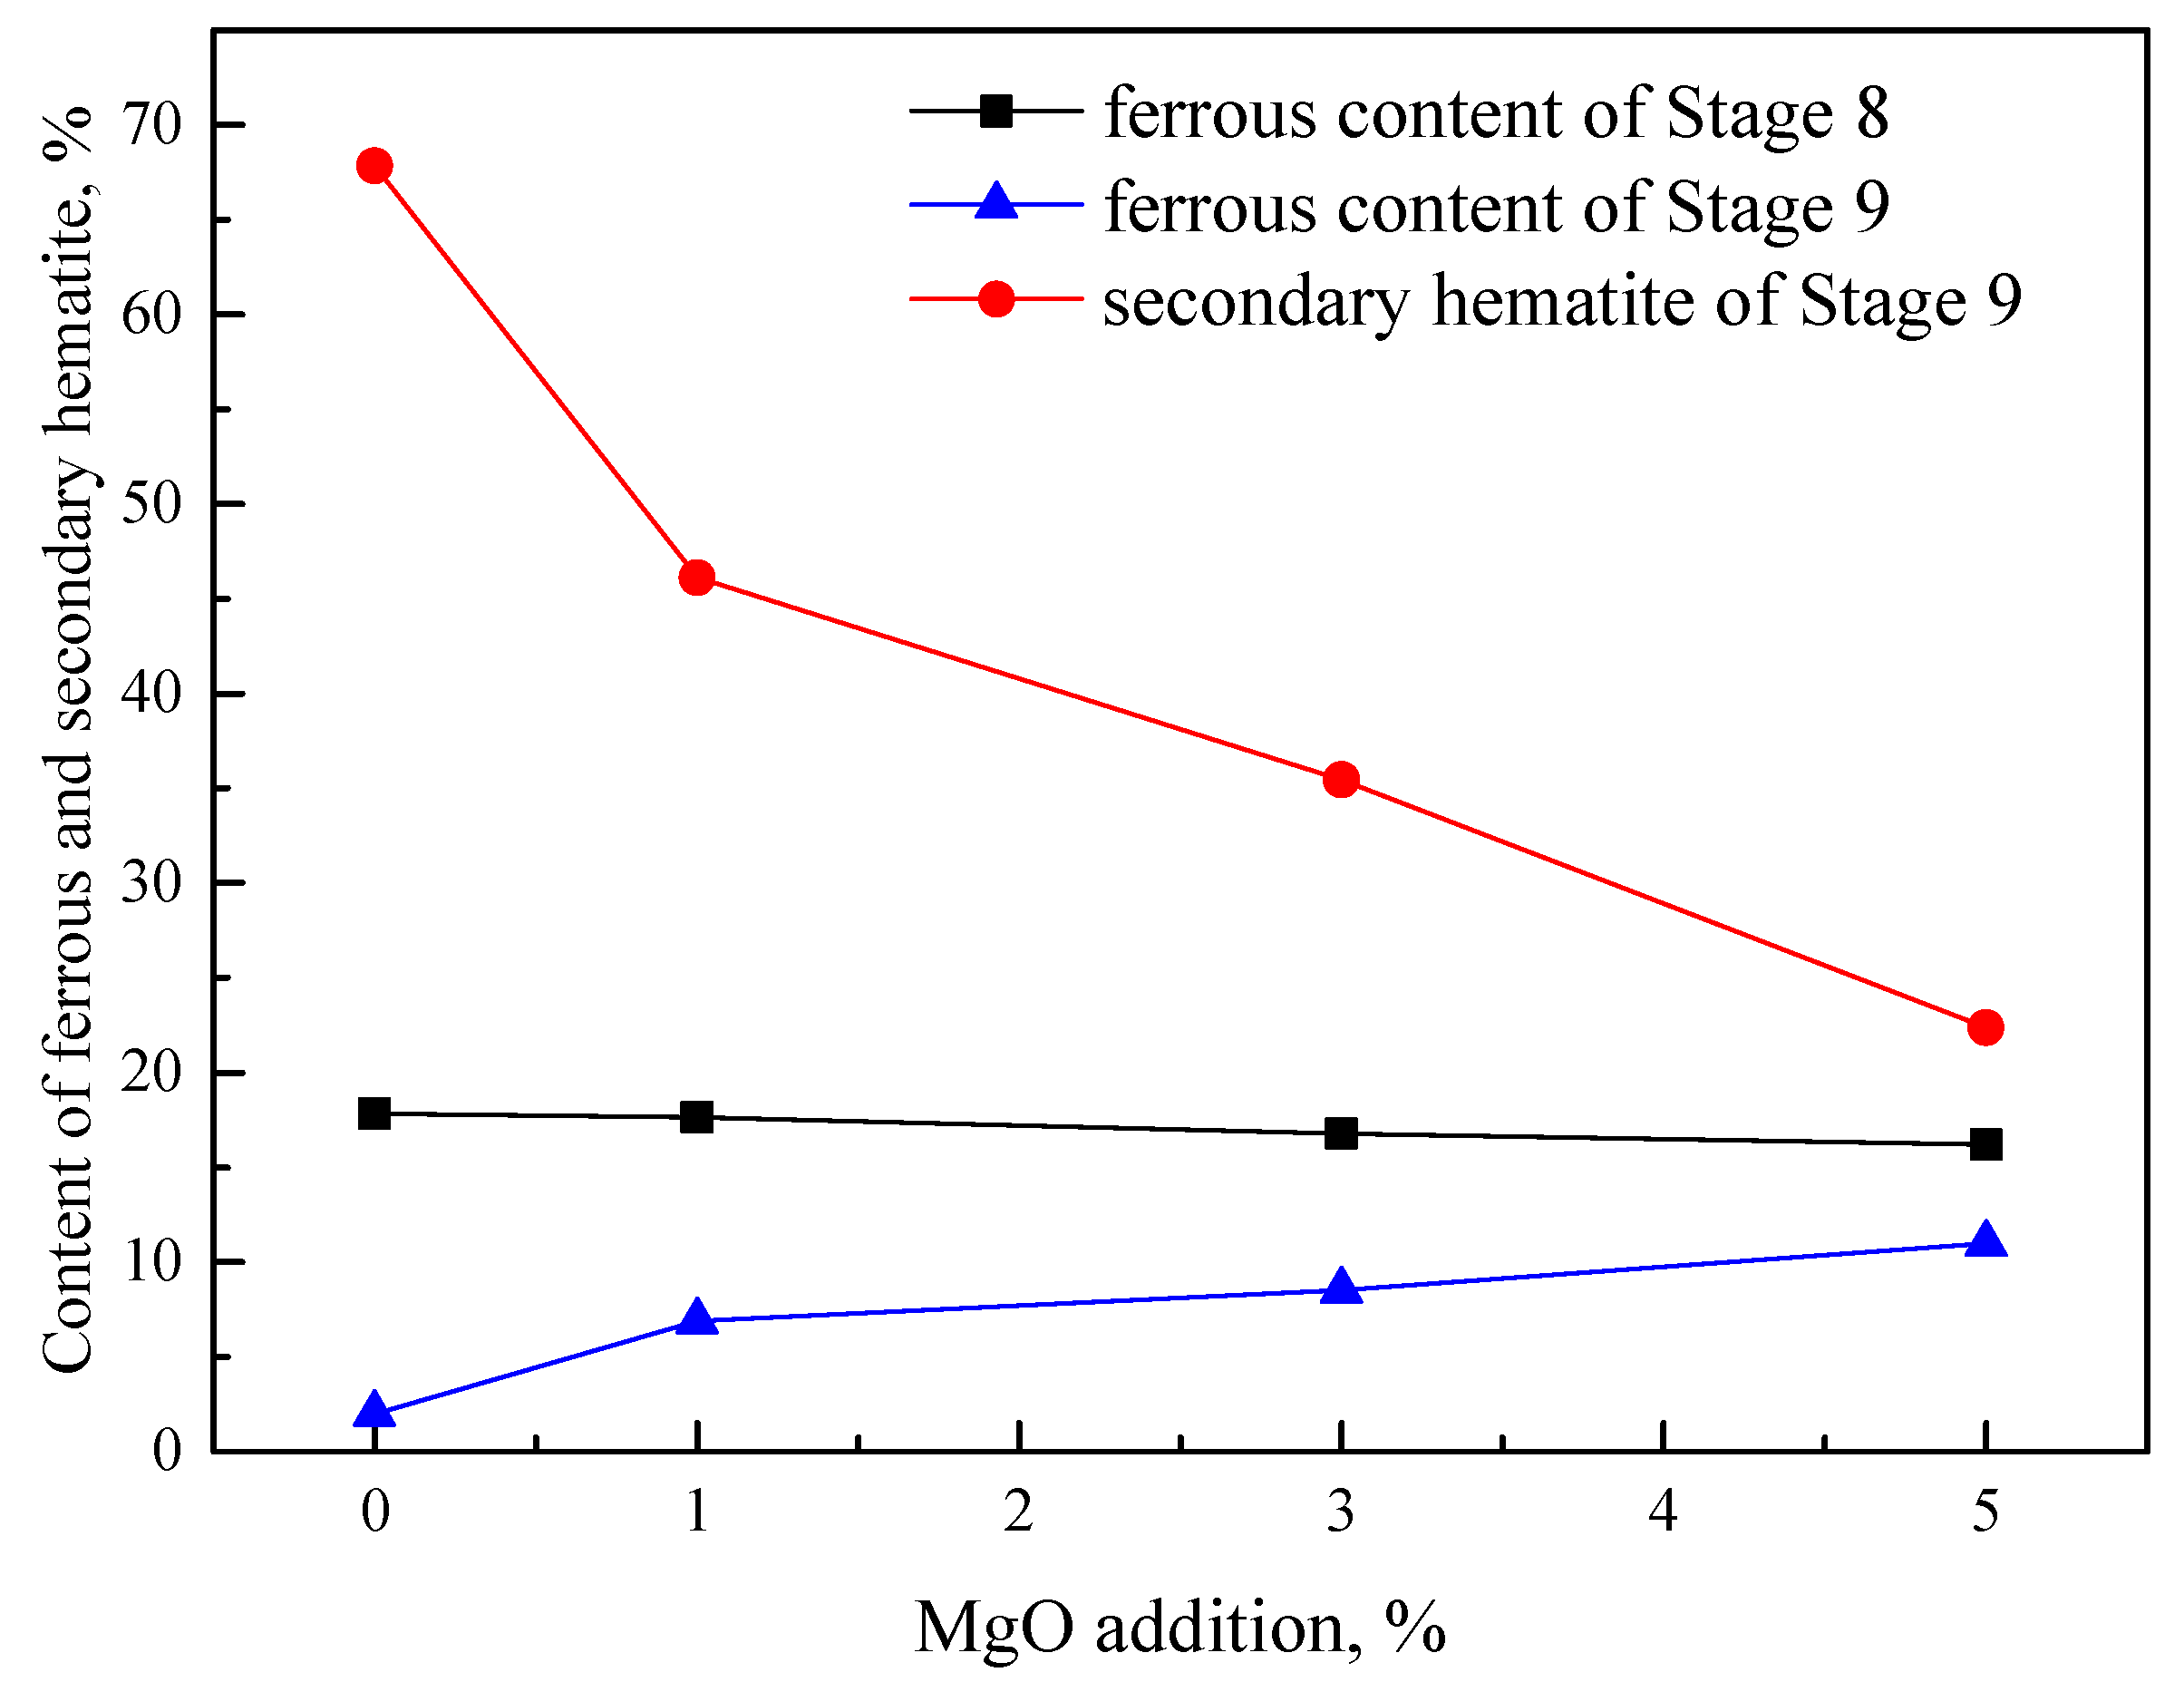
Adding MgO and SiO2 into the hematite contributes to the inhibition of the formation of secondary hematite, which decreased to 46.11%, 35.44% and 22.37% from 67.84% after adding 1.0%, 3.0% to 5.0% MgO, while changing to 68.14%, 61.59% and 47.96% for SiO2. The reasons are different that attributingto an increase in crystal structure stability of magnetite and an increase in oxygen diffusion resistance, respectively. However, adding Al2O3 into hematite has a promotive effect for the formation of secondary hematite, which increases to 70.08%, 72.14% and 74.27% due to the increase in crystal lattice distortion in magnetite.
(3)
In the temperature-changing process, the mineral in samples with MgO has only two phases, including hematite and magnesioferrite (magnetite), where Mg2+ was only present in the magnesioferrite. It was found that Mg concentration in magnesioferrite changes with temperature, which reveals the formation rate of secondary hematite related to the Mg2+ diffusion, hindering the transformation between hematite and magnesioferrite.
In addition, a supposition is suggested according to the experimental result: when higher than the transformation temperature of hematite to magnetite, the maghemite exists in the process of the solid-state formation of SH, and the amount decreased with the increase of MgO content in samples.

Author Contributions

Conceptualization, methodology, investigation, and writing—original draft was by Y.-B.C.; methodology, validation, supervision, and writing—review and editing were by Y.D.; data curation, visualization, software, formal analysis were by Y.-F.G.; resources, supervision, writing—review and editing were by X.-M.G. All authors have read and agreed to the published version of the manuscript.

Funding

This research was funded by the National Natural Science Foundation of China (No.51774029 and U1460201) for financial support of this research.

Conflicts of Interest

The authors declare no conflict of interest. The funders had no role in the design of the study; in the collection, analyses, or interpretation of data; in the writing of the manuscript, or in the decision to publish the results.

References

  1. Zhou, M.; Yu, Z.; Wang, P.; Xie, H.; Wen, Y.; Li, J. Thermodynamic Analysis of Iron Ore Sintering Process Based on Biomass Carbon. Energies 2020, 13, 5988. [Google Scholar] [CrossRef]
  2. Lu, L.; Manuel, J. Sintering Characteristics of Iron Ore Blends Containing High Proportions of Goethitic Ores. JOM 2020, 73, 306–315. [Google Scholar] [CrossRef]
  3. Li, H.; Pinson, D.J.; Zulli, P.; Lu, L.; Longbottom, R.J.; Chew, S.J.; Monaghan, B.J.; Zhang, G. Interaction between Mineral Phases in a Hematite Iron Ore and Fluxing Materials During Sintering. Met. Mater. Trans. A 2020, 52, 267–281. [Google Scholar] [CrossRef]
  4. Ponomar, V.; Bagmut, M.; Kalinichenko, E.; Brik, A. Experimental Study on Oxidation of Synthetic and Natural Magnetites Monitored by Magnetic Measurements. J. Alloy. Compd. 2020, 848, 156374. [Google Scholar] [CrossRef]
  5. Ünal, A.; Bradshaw, A.V. Rate Processes and Structural Changes in Gaseous Reduction of Hematite Particles to Magnetite. Met. Mater. Trans. A 1983, 14, 743–752. [Google Scholar] [CrossRef]
  6. Pimenta, H.P.; Sheshadri, V. Influence of Al2O3 and TiO2 on Reduction Degradation Behaviour of Sinter and Hematite at Low Temperatures. Ironmak Steelmak. 2002, 29, 175–179. [Google Scholar] [CrossRef]
  7. Shigaki, I.; Sawada, M.; Gennai, N. Increase in Low-Temperature Reduction of Iron Ore Sinter due to Hematite-Alumina Solid Solution and Columnar Calcium Ferite. Trans. Iron Steel Inst. Jpn. 1986, 26, 503–511. [Google Scholar] [CrossRef]
  8. Dwarapudi, S.; Ghosh, T.K.; Shankar, A.; Tathavadkar, V.; Bhattacharjee, D.; Venugopal, R. Effect of Pyroxenite Flux on the Quality and Microstructure of Hematite Pellets. Int. J. Miner. Process. 2010, 96, 45–53. [Google Scholar] [CrossRef]
  9. Shen, F.; Jiang, X.; Wu, G.; Wei, G.; Li, X.; Shen, Y. Proper MgO Addition in Blast Furnace Operation. ISIJ Int. 2006, 46, 65–69. [Google Scholar] [CrossRef] [Green Version]
  10. Zhang, L.; Yang, S.; Tang, W.; Xue, X. Investigations of MgO on Sintering Performance and Metallurgical Property of High-Chromium Vanadium-Titanium Magnetite. Minerals 2019, 9, 324. [Google Scholar] [CrossRef] [Green Version]
  11. Friel, J.J.; Erickson, E.S. Chemistry, Microstructure, and Reduction Characteristics of Dolomite-Fluxed Magnetite Pellets. Met. Mater. Trans. A 1980, 11, 233–243. [Google Scholar] [CrossRef]
  12. Panigrahy, S.C.; Jena, B.C.; Rigaud, M. Characterization of Bonding and Crystalline Phases in Fluxed Pellets Using Peat Moss and Bentonite as Binders. Met. Mater. Trans. A 1990, 21, 463–474. [Google Scholar] [CrossRef]
  13. Yadav, U.S.; Pandey, B.D.; Das, B.K.; Jena, D.N. Influence of Magnesia on Sintering Characteristics of Iron Ore. Ironmak. Steelmak. 2002, 29, 91–95. [Google Scholar] [CrossRef]
  14. Dwarapudi, S.; Banerjee, P.; Chaudhary, P.; Sinha, S.; Chakraborty, U.; Sekhar, C.; Venugopalan, T.; Venugopal, R. Effect of Fluxing Agents on the Swelling Behavior of Hematite Pellets. Int. J. Miner. Process. 2014, 126, 76–89. [Google Scholar] [CrossRef]
  15. Zhu, D.; Chun, T.; Pan, J.; Zhang, J. Influence of Basicity and MgO Content on Metallurgical Performances of Brazilian Specu-larite Pellets. Int. J. Min. Process 2013, 125, 51–60. [Google Scholar] [CrossRef]
  16. Yi, Z.; Liu, Q.; Shao, H. Effect of MgO on Highly Basic Sinters with High Al2O. Min. Met. Explor. 2021, 38, 2175–2183. [Google Scholar] [CrossRef]
  17. Pan, F.; Zhu, Q.; Du, Z.; Sun, H. Migration Behavior of the MgO and Its Influence on the Reduction of Fe3O4-MgO Sinter. ISIJ Int. 2018, 58, 652–659. [Google Scholar] [CrossRef] [Green Version]
  18. Guo, Y.F.; Guo, X.M. Formation of [Mg1−x, Fex]O·Fe2O3 in Solid-State Reactions between MgO and Fe2O3 in the Fe2O3-Rich System. ISIJ Int. 2017, 57, 228–235. [Google Scholar] [CrossRef] [Green Version]
  19. Shigaki, I.; Sawada, M.; Maekawa, M.; Narita, K. Fundamental Study of Size Degradation Mechanism of Agglomerates during Reduction. Trans. Iron Steel Inst. Jpn. 1982, 22, 838–847. [Google Scholar] [CrossRef]
  20. Pimenta, H.P.; Seshadri, V. Characterisation of Structure of Iron Ore Sinter and Its Behavior during Reduction at Low Temper-atures. Ironmak Steelmak. 2002, 29, 169–174. [Google Scholar] [CrossRef]
  21. Park, H.; Sahajwalla, V. Reduction Behaviour of Carbon Composite Pellets Including Alumina and Silica at 1273K and 1373K. ISIJ Inter. 2014, 54, 1256. [Google Scholar] [CrossRef] [Green Version]
  22. Matsuno, F.; Nishikida, S.-I.; Ikesaki, H. Strength Deterioration of Samples of Iron Ore-5–10%CaO Systems during the Reduction at 550.DEG.C in 30%CO-N2 Gas. Trans. Iron Steel Inst. Jpn. 1984, 24, 275–283. [Google Scholar] [CrossRef]
  23. Matsuno, F.; Nishikida, S.-I.; Ikesaki, H. Disintegration of Synthesized Iron Oxides by Reduction at 550.DEG.C in 30%CO-N2 Gas Stream. Trans. Iron Steel Inst. Jpn. 1984, 24, 1040–1049. [Google Scholar] [CrossRef]
  24. Matsuno, F. Changes of Mineral Phases during the Sintering of Fe2O3-CaO-SiO2 System. Trans. ISIJ 1979, 19, 595–604. [Google Scholar] [CrossRef] [Green Version]
  25. Matsuno, F.; Harada, T. Changes of Mineral Phases during the Sintering of Iron Ore-Lime Stone Systems. Trans. Iron Steel Inst. Jpn. 1981, 21, 318–325. [Google Scholar] [CrossRef]
  26. Kawaguchi, T.; Kasama, S.; Inazumi, T. Effect of Al2O3 Content on Sinter Cake Structure. Tetsu-to-Hagane 1992, 78, 1053–1060. [Google Scholar] [CrossRef] [Green Version]
  27. Ding, X.; Guo, X.M. The Characteristics of Mixing SiO2 with Calcium Ferrite at 1473K (1200 °C). Metall. Mater. Trans. B 2015, 46, 1742–1750. [Google Scholar] [CrossRef]
  28. Debrincat, D.; Loo, C.E. Effect of Iron Ore Particle Assimilation on Sinter Structure. ISIJ Int. 2004, 44, 1308–1317. [Google Scholar] [CrossRef]
  29. Umadevi, T.; Brahmacharyulu, A.; Sah, R.; Mahapatra, P.C.; Prabhu, M. Optimization of MgO Addition in Low and High Silica Iron Ore Sinter to Improve Sinter Reducibility at JSW Steel Limited. Ironmak Steelmak. 2014, 41, 270–278. [Google Scholar] [CrossRef]
  30. Maeda, T.; Nishioka, K.; Nakashima, K.; Shimizu, M. Formation Rate of Calcium Ferrite Melt Focusing on SiO2 and Al2O3 Component. ISIJ Int. 2004, 44, 2046–2051. [Google Scholar] [CrossRef]
  31. Panigrahy, S.C.; Verstraeten, P.; Dilewijns, J. Influence of MgO Addition on Mineralogy of Iron Ore Sinter. Met. Mater. Trans. A 1984, 15, 23–32. [Google Scholar] [CrossRef]
  32. Xing, X.; Pang, Z.; Mo, C.; Wang, S.; Ju, J. Effect of MgO and BaO on Viscosity and Structure of Blast Furnace Slag. J. Non-Cryst. Solids 2019, 530, 119801. [Google Scholar] [CrossRef]
  33. Zhang, J.Y.; Xing, X.R.; Song, B.; Guo, X.M.; Xiang, C.X. Physical Chemistry of Metallurgy, 4th ed.; Metallurgical Industry Press: Beijing, China, 2007; p. 313. [Google Scholar]
  34. Simmonds, T.; Hayes, P.C. Isothermal Oxidation of Magnetite to Hematite in Air and Cyclic Reduction/Oxidation under Carbon Looping Combustion Conditions. Metall. Mater. Trans. E 2017, 4, 114–122. [Google Scholar] [CrossRef]
  35. Raghavan, V. Fe-Mg-O (Iron-Magnesium-Oxygen). J. Phase Equilibria Diffus. 2010, 31, 368. [Google Scholar] [CrossRef] [Green Version]
Figure 1. Changes in temperature and atmosphere in sintering process.
Minerals 12 00282 g001
Figure 2. XRD pattern of the preheated samples with different gangue component.
Minerals 12 00282 g002
Figure 3. Micrographs of the preheated samples with different gangue component.
Minerals 12 00282 g003
Figure 4. Effects of MgO content on transformation of hematite to magnesioferrite in the preheated samples. (a) Variations in ferrous content from Stage 1 to Stage 4; (b) XRD patterns at Stage 4; (c) micrographs at Stage 4.
Minerals 12 00282 g004
Figure 5. Effect of MgO addition on hematite in the temperature increasing and decreasing process (Stage 6 to Stage 9): (a) quantitative variations in oxygen and ferrous; (b) XRD patterns of Stage 7; (c) XRD patterns of Stage 8; (d) XRD patterns of Stage 9.
Minerals 12 00282 g005
Figure 6. Optical microstructure of samples with different content of MgO (a) MgO-free; (b) 1.0% MgO; (c) 3.0% MgO; (d) 5.0% MgO. Reflection colors: Grey—hematite; Dark grey—magnesioferrite; Black—pores.
Minerals 12 00282 g006
Figure 7. Effect of MgO addition on formation of secondary hematite.
Minerals 12 00282 g007
Figure 8. Effect of Al2O3 content on the ferrous content in temperature-changing process from Stage 4 to Stage 9 (a) and XRD patterns of samples at Stage 9 (b).
Minerals 12 00282 g008
Figure 9. Effect of SiO2 content on the ferrous content in the temperature-changing process from Stage 4 to Stage 9 (a) and XRD patterns of samples at Stage 9 (b).
Minerals 12 00282 g009
Figure 10. SEM image and EDS point of samples with 5.0 wt% MgO at different stages: (a) Stage 4, (b) Stage 7, (c) Stage 8, and (d) Stage 9 (grey—hematite; dark grey—magnesioferrite).
Minerals 12 00282 g010
Table 1. Contents of magnetite at Stage 4, Stages 8 and 9 and SH at Stage 9.
MineralsStage No.SiO2 ContentAl2O3 Content
1.0%3.0%5.0%1.0%3.0%5.0%
Magnetite4000000
873.4970.6465.1376.7978.3780.02
97.6211.1018.779.048.638.02
SH968.1461.5947.9670.0872.1474.27
Table 2. Element composition at every point from A to H from Stage 4 to Stage 9 (at%).
Stage No.PointFeMgOPhaseStage No.PointFeMgOPhase
4(6)A35.679.9954.34M8E41.335.2353.43M
B42.83057.17HF43.20056.80H
7C37.728.5253.76M9G38.797.2353.98M
D43.55056.45HH43.40056.60H
M—magnesioferrite; H—hematite.
Publisher’s Note: MDPI stays neutral with regard to jurisdictional claims in published maps and institutional affiliations.

