Article

The Role of Foam in Improving the Workability of Sand: Insights from DEM

1
School of Civil Engineering, Central South University, Changsha 410075, China
2
Zienkiewicz Centre for Computational Engineering, College of Engineering, Swansea University, Swansea SA1 8EP, UK
3
School of Engineering, The University of Warwick, Coventry CV4 7AL, UK
*
Author to whom correspondence should be addressed.
Minerals 2022, 12(2), 186; https://doi.org/10.3390/min12020186
Submission received: 14 December 2021 / Revised: 22 January 2022 / Accepted: 28 January 2022 / Published: 30 January 2022

Abstract

:
Foam as a soil conditioner can transform the mechanical properties of the excavated natural muck and lubricate the interface between the cutting tools and muck, thus reducing the tools’ wear and promoting the efficiency of earth pressure balance (EPB) shield tunneling. This paper aims to explore the meso-mechanism of foam in improving the workability of sand by combining discrete element modeling (DEM) with experimental investigations of slump tests. A “sand-foam” mixture DEM model was generated by simplifying the sand grains and foam as individual particles with different properties. The particle-scale simulated parameters were calibrated based on a series of experimental observations. The effects of foam on the inter-particle contact distribution and the evolution of contact forces during the slumping process were investigated in detail through numerical modeling. It was found that injecting foam into sand specimens could increase the coordination number and the contact number around sand grains. Although the force transmission pattern changes from “sand-sand” into the coexistence of “sand-foam”, “sand-sand” and “foam-foam” contacts, the magnitude of contact forces transferred by foam particles is significantly lower than that by sand particles. The presence of foam reduces contact-scale frictional strength and thus reduces the stability of the microstructures of sand. In addition, the normal direction of inter-particle contact force deflects from the vertical to the horizontal and the magnitude of contact force decreases significantly with the influence of foam.

1. Introduction

Earth pressure balance (EPB) shield machines mainly cut the stratum by cutterhead to realize the full section excavation of tunnels, but the cutting tools are prone to wear when the shield tunneling through the hard stratum, leading to a decrease in cutting efficiency and even the severe damage of the cutterhead. The cutting tools need to be replaced when the wear of cutterhead is too serious. The replacing cutting tools is necessary to be carried out under the condition of hyperbaric intervention in order to ensure the stability of the excavation face and avoid the large deformation of ground, but the operation has a huge safety risk and a high cost. In addition, replacing cutting tools takes a lot of time, easily resulting in a delay of construction. The cutterhead wear and the EPB shield tunneling process are significantly influenced by the workability of soil, which refers to the overall state, in which the muck has suitable fluidity and plastic properties and is helpful for smooth EPB shield tunneling. The muck with poor fluidity is likely to cause extra mechanical wear and inefficient muck discharging [1,2], while the excessive fluidity muck may lead to muck spewing and instability of the excavation face [3,4]. The “low plastic flow” state of muck is required to ensure the effective generation of chamber pressure and smooth discharging of muck [5,6,7]. In addition, it makes the muck easier to be cut, reduces the strength of the interface between cutting tools and the muck, and achieves the purpose of reducing the cutting tools wear. To transform the muck into a “low plastic flow” state, foam is one of the most common conditioning agents to promote the workability of muck before cutterhead, in the pressure chamber and screw conveyor, resulting in an enhancement of the muck plasticity and fluidity [8,9]. During tunneling process, the foam generated by the foam-generator of the shield is injected to the stratum through foam nozzles set in front of the cutterhead and on the bulkhead and screw conveyor. Then, the foam is mixed with the muck as the cutterhead rotates, and the workability of the muck becomes a kind of plastic flow state.
Foam is one type of metastable material [10] with smaller stiffness and particles size compared to soil particles. However, it can largely influence the mechanical properties of muck by improving the workability of muck and therefore benefiting the tunneling process of the EPB shield [11]. Houlsby et al. [12] analysed field data and proposed that the foam-conditioned muck could be helpful to build stable pressure in the chamber and to stabilise the excavation face. Through model tests, Peila et al. [13] found that muck with suitable workability could reduce the torque of the screw conveyor significantly. Xu et al. [14] pointed out that a suitably conditioned muck is beneficial to reduce the torque of cutterhead. Wang et al. [15,16] proposed that foam can be used to improve the muck workability and decrease muck permeability.
The slump test is the most convenient method to estimate the workability state of muck and the soil conditioning effect [17,18]. The slump value of conditioned muck would have an obvious promotion with an increase in foam injection ratio (FIR) [19,20]. In particular, foam plays an important role in improving the workability of sandy soil [21,22]. Peron et al. [23] pointed out that the slump of muck would increase from 0 to 2 cm or even to 15 cm with the FIR rising to about 80% for EBP shield tunneling in sand strata. Jancsecz et al. [24] found that the slump of muck increased from 15 cm to 25 cm by injecting the foam to muck. Raffaele et al. [25] proposed that the foam promoted the slump of muck from 14.6 cm to 23.1 cm when FIR increased from 20% to 60% with a water content of 10% in the sand strata.
The mechanism of foam in improving the workability of foam-conditioned muck has also received much attention. According to Bezuijen et al. [26], the soil workability can be improved under a decreased effective stress, which can be achieved by the soil skeleton lifted by the foam. On the other hand, Amir [27] concluded the foam mainly improved the workability of sand by decreasing the yield strength. Huang et al. [20] proposed that the foam can decrease the shear strength by reducing the friction angle, which can also effectively improve the soil workability. However, their research mainly explained the improvement of muck workability from macroscopic perspectives, such as internal friction angle, effective stress and yield strength.
At present, although much effort has been applied in studying sand conditioning with foam, the existing research is mainly restricted to macroscopic analysis on the effect of foam on the workability of muck [28,29,30] which is unable to explain the sand conditioning mechanism by foam. Unlike the existing perspectives, this research attempts to explore the particle-scale foam-conditioned mechanism on sand via DEM. The influences of foam on the number of inter-particle contacts, the magnitude of normal contact force, the directional distribution of normal contact force, and the evolution of force chains in foam-conditioned sand are investigated in detail. The research may offer alternative insights in revealing the mechanical mechanism that foam can effectively improve the workability of sand.

2. Slump Test

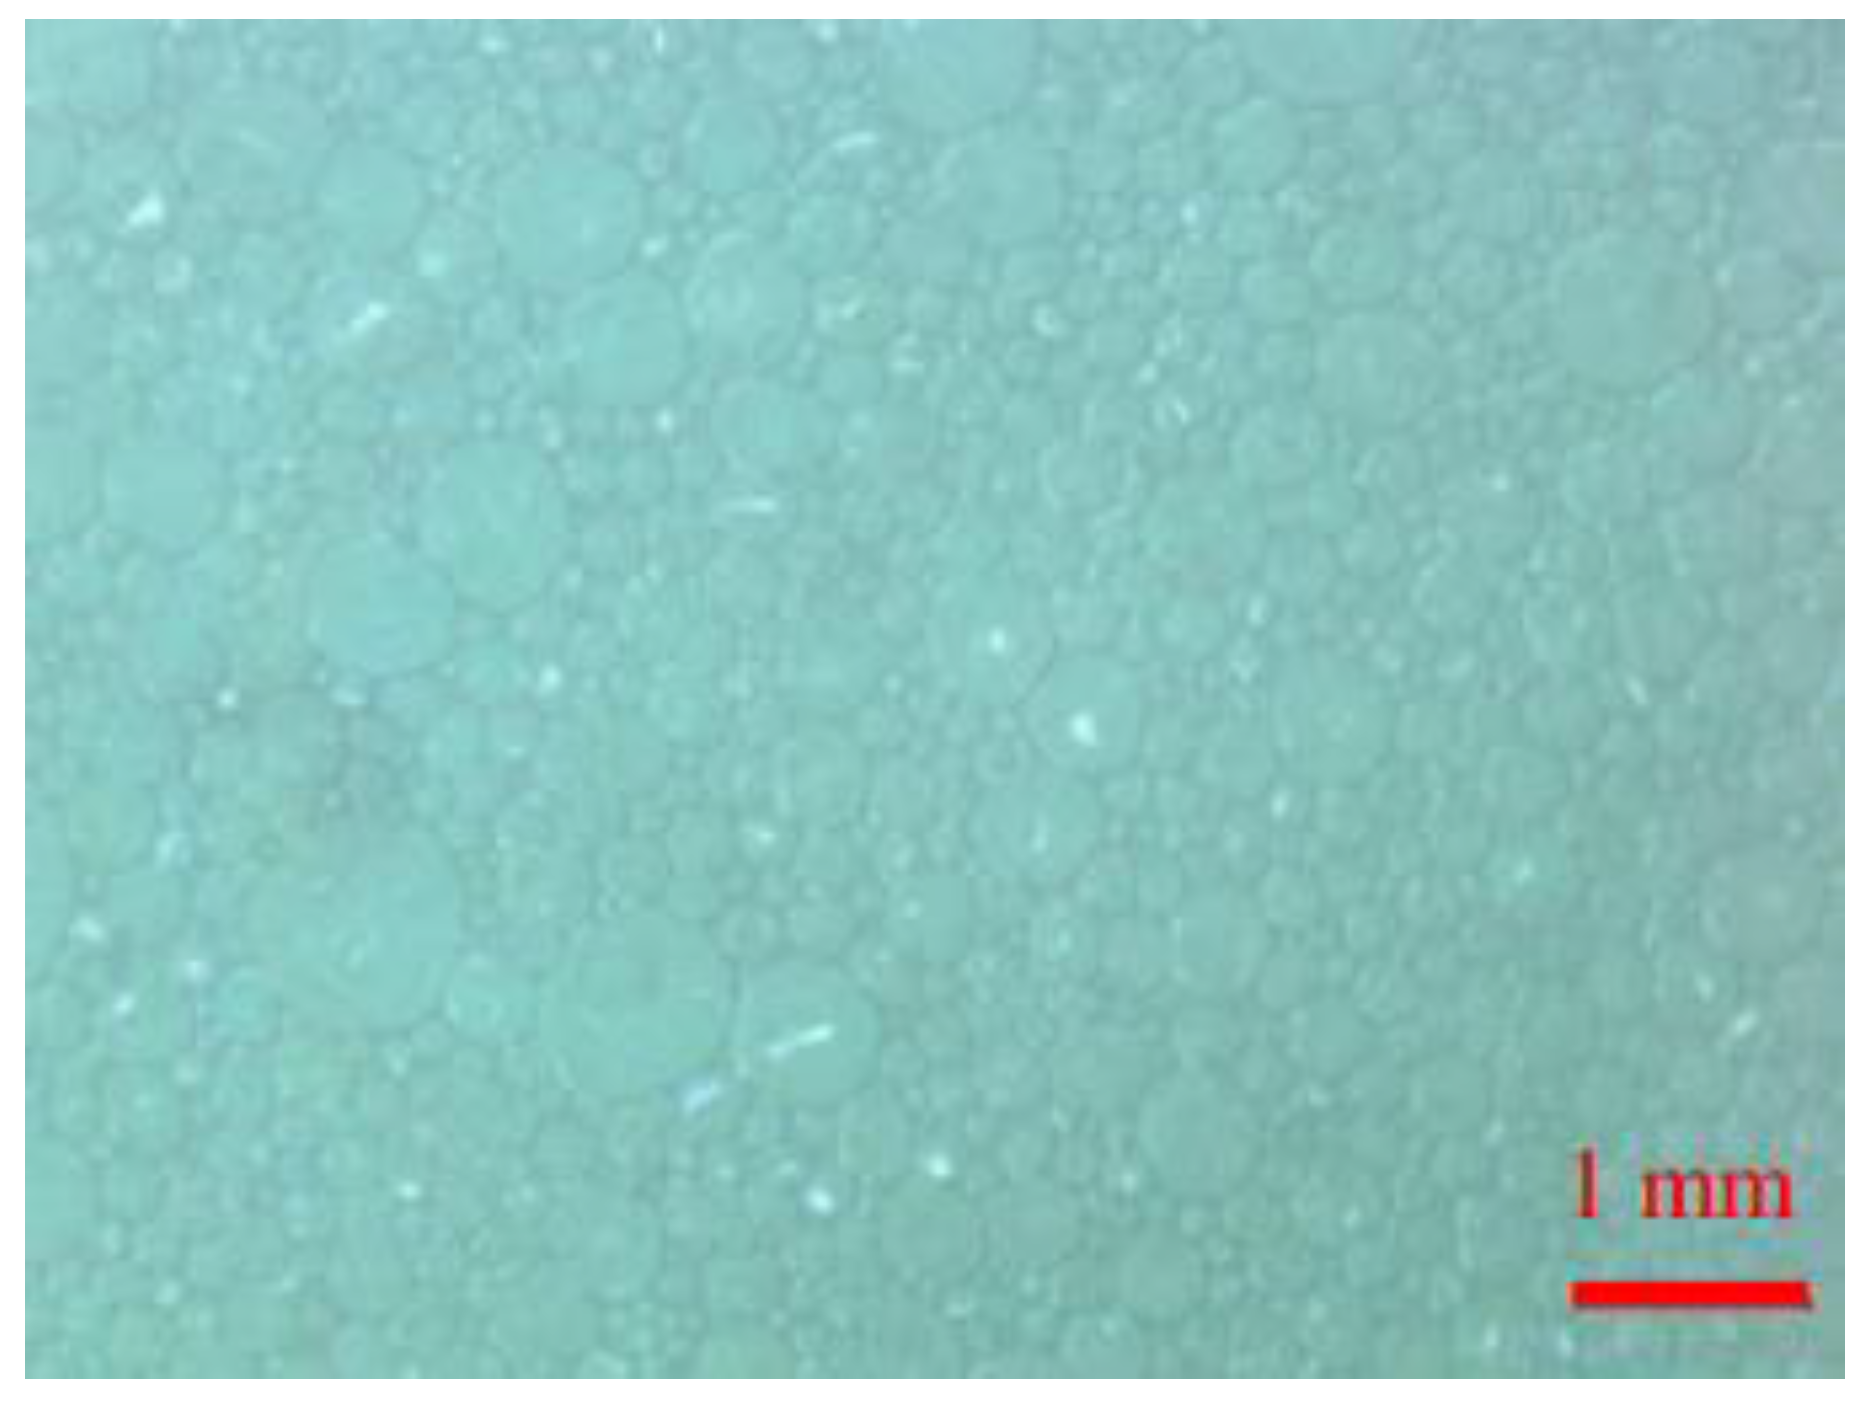
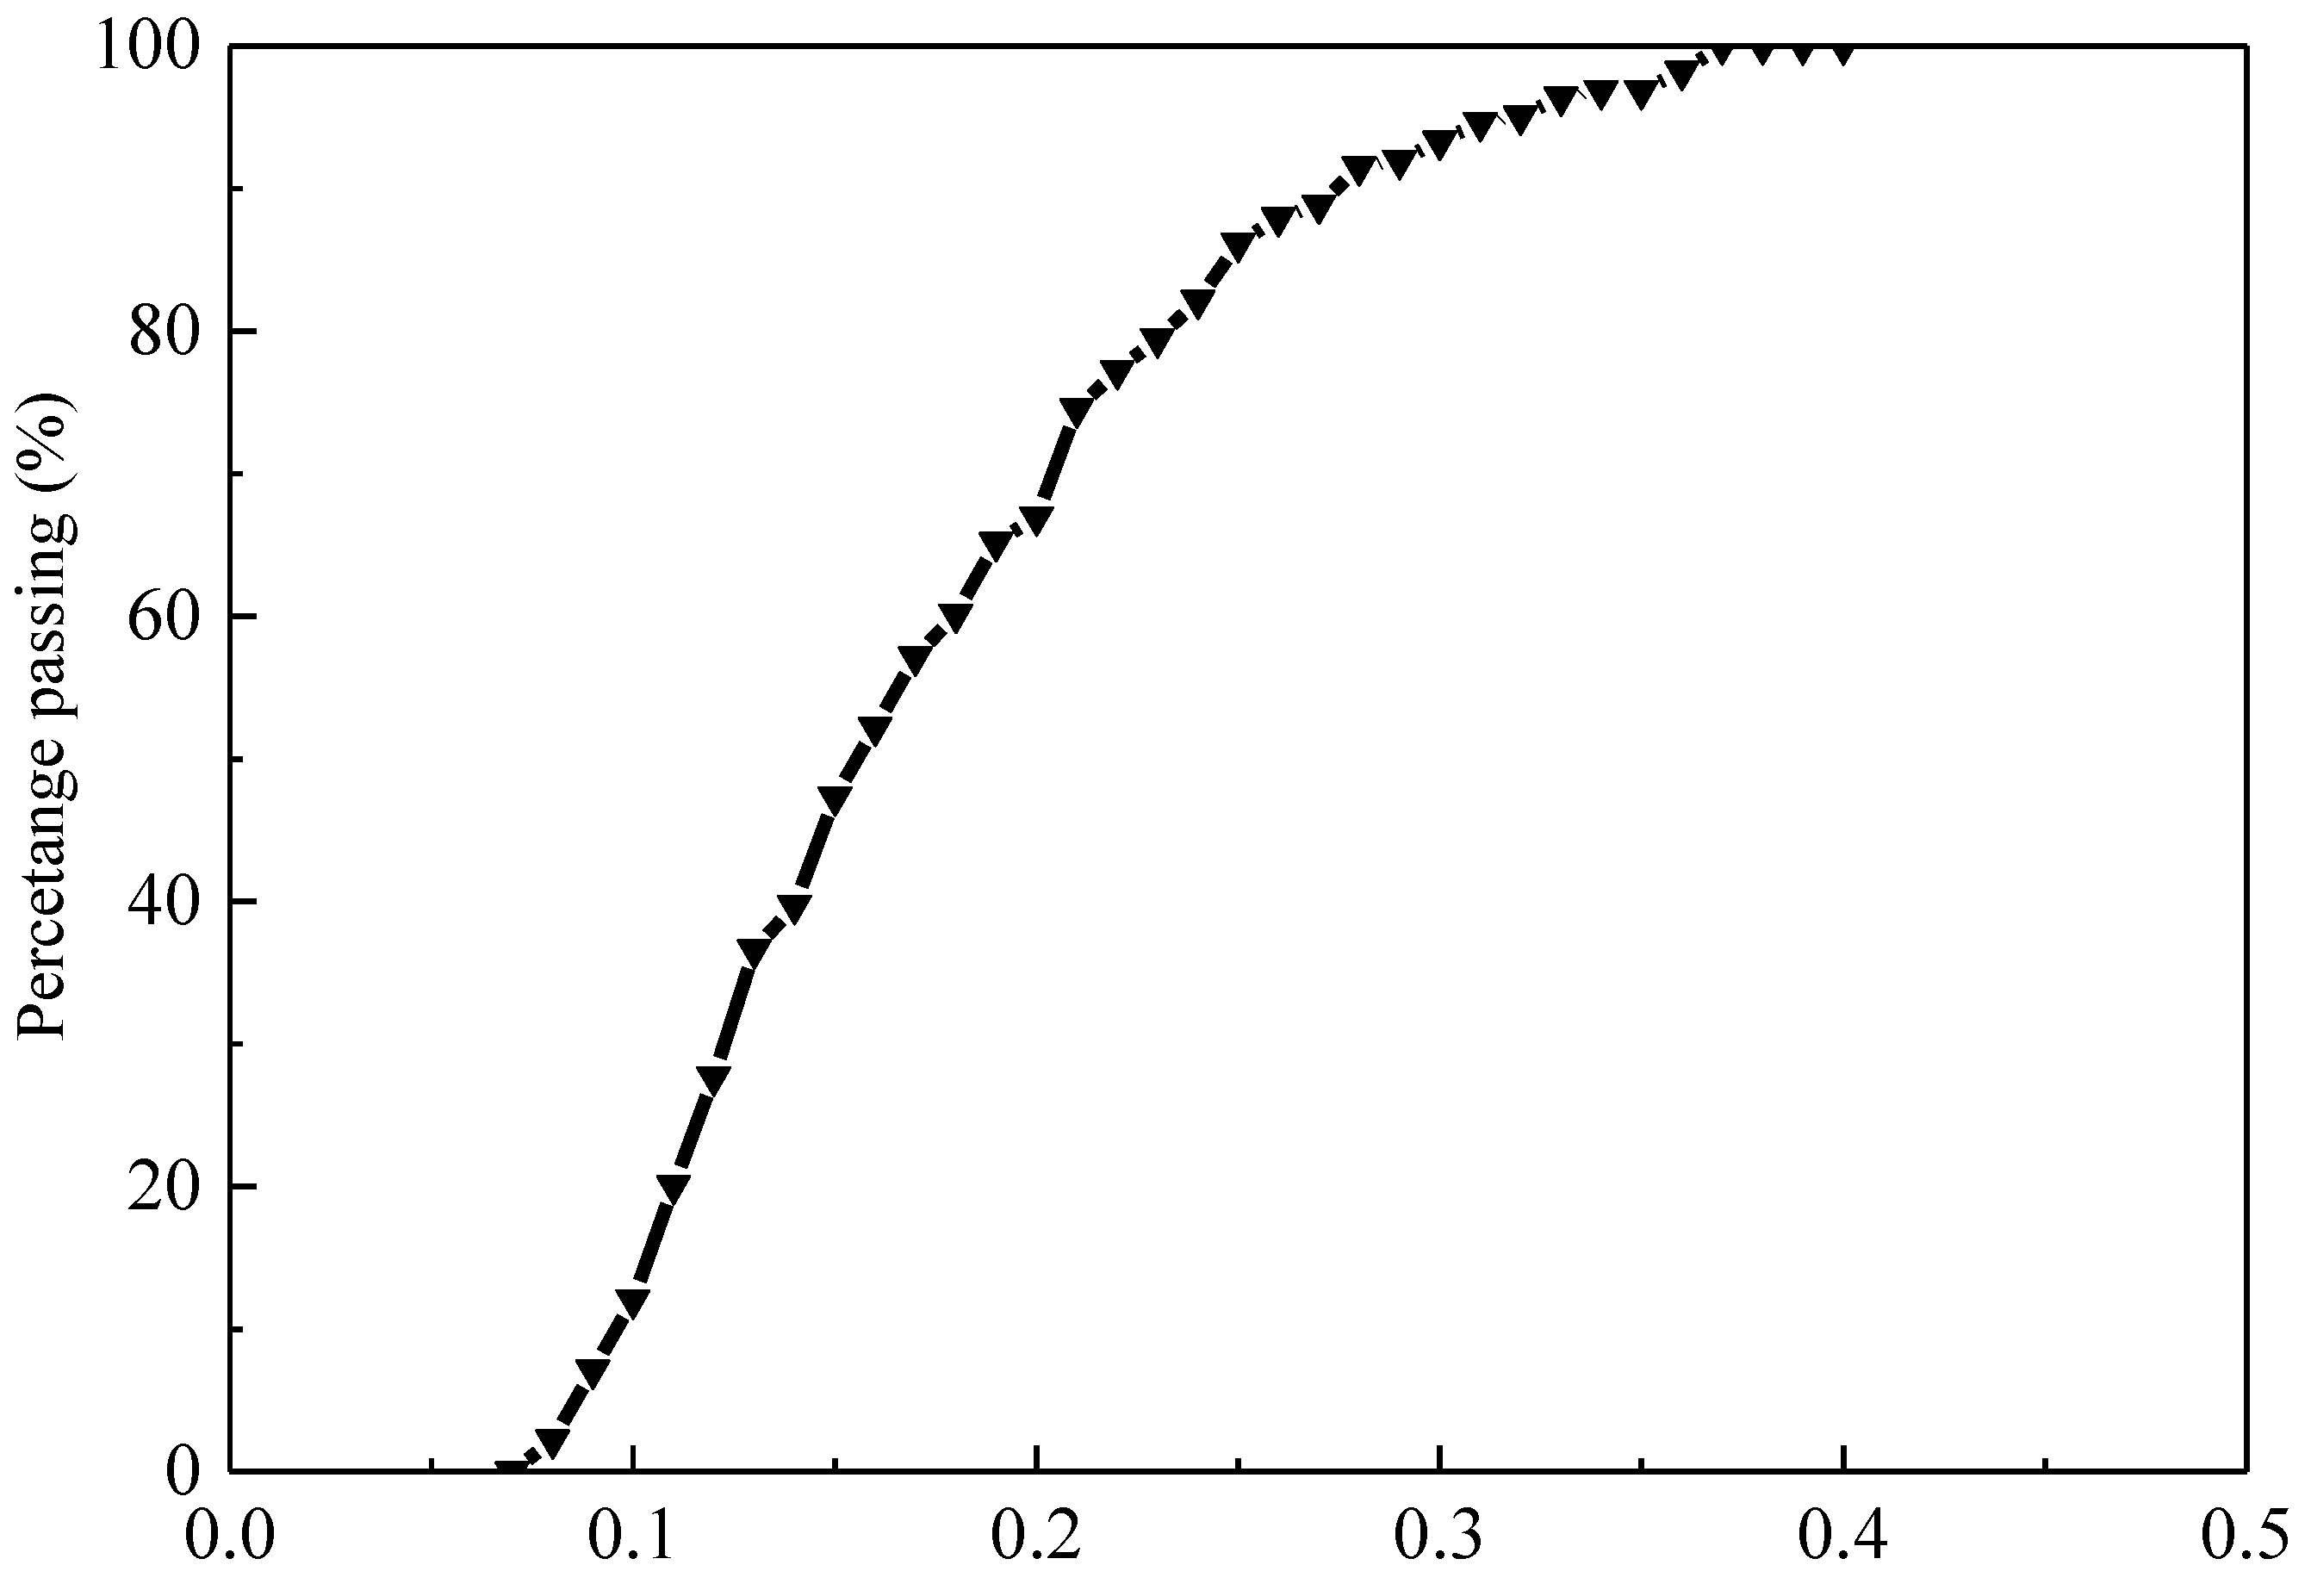
2.1. Testing Material

The coarse sand from the Xiangjiang River, China, was selected as the testing material. This type of sand is very common in many cities in China and around the world [31,32]. According to the test method provided by ASTM [33], the grain size distribution curve of the sand was shown in Figure 1. The average particle size (d50), the coefficient of uniformity (Cu) and the coefficient of curvature (Cc) of the tested sand are 2.18 mm, 7.16 and 1.10, respectively. Foam is a commonly used conditioning agent for improving sand behavior for EPB shield tunneling. The mechanical properties of foam-conditioned sand are significantly affected by the properties of foam, which depend on some factors, including the type of foam agent, the concentration of the foam solution(Cf), the foaming method, the foam expansion ratio (FER), the half-life time, and so on [9,34]. The foam expansion ratio is defined as the volumetric ratio between foam and liquid used to generate it, and the half-life time is defined as the time required for the mass loss of a given quality foam to reach 50%. The general foam agent was chosen as the modifier, which mainly consists of cationic surfactants dodecyl timothy ammonium chloride, anionic surfactants dodecyl sulfate sodium, and non-ionic surfactants chlorinated dodecane. The foam agent belongs to the compound type of anion and cationic foam agent.
To generate high-quality foam, the foaming system (as shown in Figure 2a) was used and the foaming procedures were as follow: the foam agent was diluted to the foam solution with a concentration (Cf) of 3% to satisfy the conditioning requirements [15]. Then, the solution was poured into the liquid reservoir and the solution was conveyed to the foam generator from the liquid reservoir. After that, the air from the air compressor was also conveyed to the foam generator under a pressure of 3 bar. The foam solution was pumped with air to generate foam (shown in Figure 2b) by the foam generator. According to the test, when the Cf of foam solution is 3%, the half-life and foam expansion ratio of the foam used in the test was 9.6 min and 10, respectively.

2.2. Testing Equipment

In the study of geotechnical engineering, a scale test is often used to overcome the problem that available test conditions cannot meet the requirements of the original scale test. There are many scaled tests including mini-slump and scaled shield machine test performed on soil [35,36]. Although the dimension of the standard slump barrel is 10 cm × 20 cm × 30 cm [37], a scaled slump barrel with a ratio of 1:2 was used to evaluate the workability of foam-conditioned sand in this study in order to create a physical entity for which DEM can be used for simulation. It is very time consuming to simulate a model involving millions of particles by DEM. The standard slump tests were also performed to obtain the testing conditions of sand specimens with different workability, and the scaled slump tests were carried out according to the testing conditions to ensure the consistency of muck workability. Since the workability is a physical property of the conditioned sand and cannot be affected by the test equipment [27]. The scaled slump barrel is shown in Figure 3 with the actual dimension of 5 cm (top diameter) × 10 cm (bottom diameter) × 15 cm (height).

2.3. Testing Procedures and Conditions
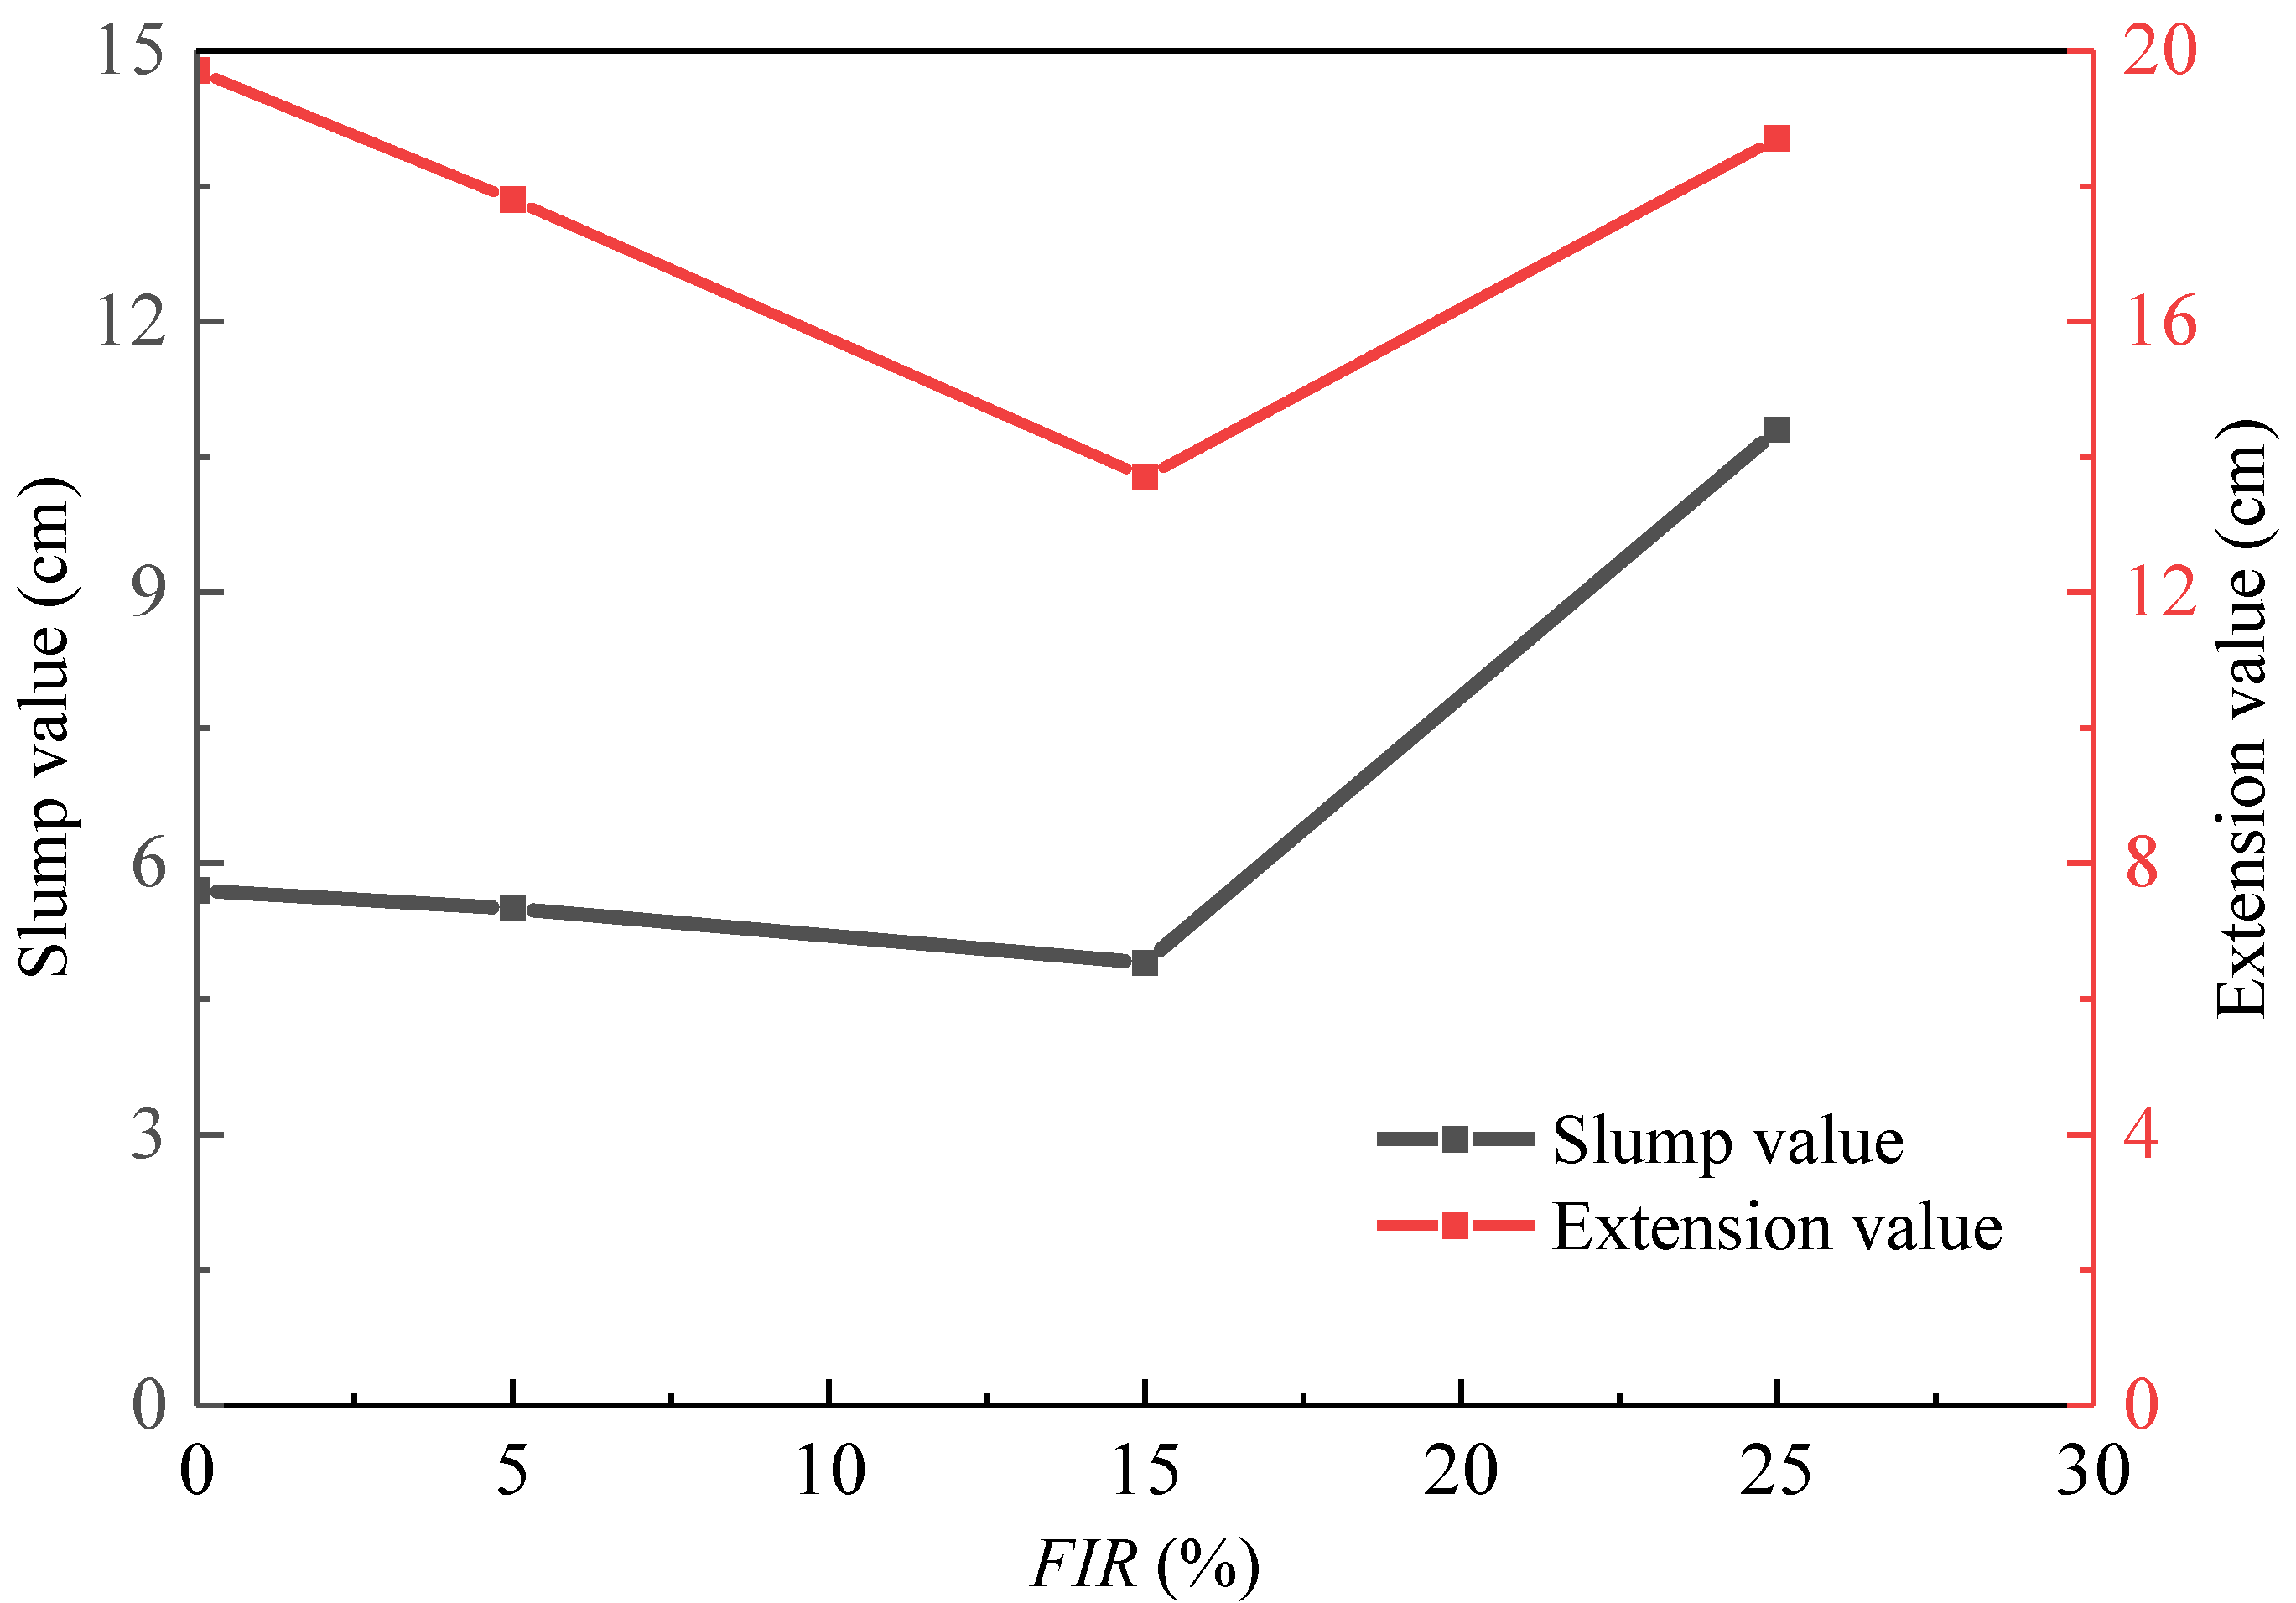
(1) Testing procedure (refer to [37])
The scaled slump barrel was used to evaluate the workability of foam-conditioned sand and the detailed testing procedures are as follows:
(a) The non-conditioned sand sample was prepared by weighing a certain mass of dried sand and mixed with water according to a specific water content.
(b) The target volume of foam was added to the non-conditioned sand in the mixer according to a specific FIR. Then, the mixer was stirred clockwise and counterclockwise for 45 s respectively to make the foam-conditioned sand.
(c) The foam-conditioned sand was poured into the scaled slump barrel in three layers. Then a tamping rod was used to tamp the foam-conditioned sand after each layer was filled. Then, the slump barrel was vertically lifted at a constant speed within 3~5 s and the foam-conditioned sand slumped freely. In addition, the entire experimental time (from adding foam to sand to the end of the test) should be controlled within 180 s.
(d) After the slump was completed, the slump value and extension value of the slump were measured and recorded quickly, and photos were taken to record the final slump state.
The water content of the sand has a considerable influence on the capability of foam to improve the workability of the sand. The dry sand particles can attract the free water in the sand, and so the liquid of foam film is easy to go away, leading to the thinning of the liquid film which will cause the foam to collapse in the end. The pores of the sand are filled with water when the sand with a high water content. Because the density of the foam (FER = 10) is much smaller than water, the foam will float up spontaneously after being injected into the sand, resulting in foam bleeding. Therefore, as a basic test condition, a suitable water content that foam can exist stably in the sand is required to be selected. Then, the FIR was changed to obtain the foam-conditioned sand with various workability. A series of tests were preliminarily carried out by injecting 0% to 30% foam into the sand with 0 to 20% water content. The results show that a water content of 10% could make the foam work well in the sand. Thus, the water content (Wt) of 10% is chosen as the constant testing condition. The FIR was changed in the range of 0 to 25%. Table 1 summarizes the testing conditions for the slump tests.

2.4. Test Results

Figure 4 shows the variation of slump and extension values of the foam-conditioned sand with FIR. It was found that the slump value of foam-conditioned sand decreased from 5.7 cm to 4.9 cm and then increased to 10.8 cm with increasing FIR, and the turning point appeared at the FIR of 15%. In addition, a similar tendency in the variation of extension value of the foam-conditioned sand was observed. The extension value dropped from 19.7 cm to 13.7 cm and rose to 18.7 cm with an increasing FIR. Figure 5 shows the photos of the specimens after slumping for the non-conditioning state, insufficient conditioning state, suitable conditioning state, and excessive conditioning state. The sand specimens in the non-conditioning and insufficient conditioning state were loose and their plasticity were also poor as shown in Figure 5a,b. With an increase in FIR until reaching 15%, the conditioned sand had perfect plasticity and fluidity, as shown in Figure 5c, and it was in an ideal state for muck discharging and shield tunneling. However, when FIR reached 25%, the fluidity of conditioned sand became too strong, as shown in Figure 5d.

3. Numerical Simulation

DEM is a widely accepted tool to analyse the deformation and failure process of granular materials [38,39,40]. To explore the effect of foam on the workability of foam-conditioned sand, it is necessary to analyse the influence of foam on the mesoscopic parameters such as the direction and magnitude of the contact force between particles and the evolution of force chains in foam-conditioned sands. In this study, both foam bubbles and soil grains are simplified as spherical particles in DEM and coexist in a foam-conditioned sand model. Their microscopic parameters are carefully calibrated based on experimental results via a gradient-based automatic calibration method proposed in [41].

3.1. Numerical Modeling

The discrete element software PFC3D is used in this research to analyse micro-mechanics [42,43] and the simulated object is the scaled slump test of foam-conditioned sand. The model is composed of a scaled slump barrel, sand particles and foam bubbles.

3.1.1. Slump Barrel

The slump barrel model was generated according to the scaled slump barrel. The dimension of the slump barrel model is 5 cm (top diameter) × 10 cm (bottom diameter) × 15 (height). A truncated cone-shaped slump hollow barrel model was established, and the bottom surface was open. A plane was generated at the bottom of the barrel to support the slump barrel and particles.

3.1.2. Sand Particles

It is expected that the particle sizes of the sand would be determined according to the grain size distribution in Figure 1. However, considering that the fine particles with particles size smaller than 0.5 mm only accounts for less than 10%, if this part of the soil was generated in the model, the model would include a large number of particles and the computational cost will be unaffordable. Therefore, similarly to the method proposed by Maeda and Kushiyama [44] and Chen [45], by ignoring the fine particles, the distribution curve of grain size of the sand used in the numerical model is shown in Figure 6. The grain size distribution of the simulated sand is shown in Table 2.

3.1.3. Foam Particles

The electron microscope was used to observe the micro-image of foam (see Figure 7) and the actual size of foam particles (see Figure 8) could be obtained from the image through the image processing of the micro-image of foam. Given that the foam particle size distribution range is small, modeling the real size distribution of foam would cause the model calculation too large, resulting in a low calculation efficiency. Thus, the foam particles were characterized by spherical particles with the average diameter (d50) of the actual foam particles and thus a diameter of 0.15 mm was used in the model.

3.1.4. Numerical Modeling Procedures

The numerical modeling of the scaled slump test was carried out by reproducing the process of experimental models with the testing conditions listed in Table 1. The specific modeling procedures are as follows:
(1) The slump barrel model was established according to the scaled slump barrel. A plane was generated at the bottom of the barrel to support the slump barrel and particles, and a temporary sealing surface was generated at the top plane of the barrel to avoid particles spilling out the barrel range during the equilibrium process.
(2) The foam-conditioned sand with a specific FIR was generated according to the required soil conditioning states. In the model, a specific volume of foam with bubbles of 0.15 mm in diameter and a series of sand particles with the distribution curve shown in Figure 6 were generated and mixed randomly according to the predetermined FIR.
(3) When the model was computed to a maximum unbalance force ratio of less than 1 × 10⁻⁴, the model was assumed to reach an acceptable equilibrium state.
(4) The slump barrel was lifted vertically at a velocity of 0.03 m/s to make the soil slump freely.
(5) The simulated physical time of the model was 10 s after the slump barrel was lifted with a vertical speed in consistent with the physical scale slump test. A series of parameters including the slump value, extension value, the number of contacts, the direction and magnitude of the contact forces between particles and the images of force chains were recorded during the slumping process.

3.2. Parameter Calibration

The contact types change from single “sand-sand” to the coexistence state of “sand-sand”, “foam-sand” and “foam-foam” when adding the foam to the sand. Linear contact model was used to simulate the “sand-sand” contact [46]. In contrast, the contact behaviours of “foam-sand” and “foam-foam” particles are complex, and there is a significant bonding effect between particles in tension. As suggested in Mak et al. [47], the parallel bond model is chosen as the contact model for “foam-sand” and “foam-foam” contacts in the foam-conditioned sand. The main parameters of the model include normal stiffness (kn), shear stiffness (ks), friction coefficient (μ) and normal bond strength (σc).
Wang et al. [48] thought that the model parameter ks has little influence on the soil characteristics, so the ks could be taken as the same value with kn to simplify the parameter calibration process. The sand is a kind of loose material, thus the bond strength (σc) of “sand-sand” particle is not considered [49]. In addition, the foam film can only transmit the normal force rather than the tangential force, so the tangential shear strength of foam particles is not considered [50]. To calibrate the particle-scale parameters efficiently, an automated parameter calibration method proposed in Qu et al. [41] was applied in this study. In this method, by transforming the parameter calibration problem into an optimization process, the meso-parameters are updated by obtaining the targeted macro-parameter through an improved gradient descent algorithm. Then, the updated meso-parameters are used to run DEM models again until gaining a meso-parameter combination whose error between experiments and numerical models is within an allowable range. The contact parameters of each conditioning state are shown in Table 3.

3.3. Verification of the DEM Model

The macroscopic deformation of the sand in experimental slump tests was compared with numerical modeling to verify whether the foam-conditioned sand model could accurately reflect the workability of sand specimens with different FIRs. The slump value and extension value are the key parameters to evaluate the workability of the foam-conditioned sand. Thus the reliability of the numerical model was evaluated quantitatively by comparing the differences between numerical modeling and physical testing as shown in Table 4. For the slump value, the maximum simulation error is 7.2% and occurs in the insufficient conditioned state, and the errors of other conditioning states are less than 6%. For the extension value, the maximum simulation error is only 5.6% and occurs in the non-conditioned state.
In addition, the specimen shapes are compared between numerical modeling and physical testing in Figure 9. The slump states in numerical models with different FIRs are highly similar to those of the corresponding physical tests. The numerical model with the calibrated parameters can satisfactorily simulate the slump tests with different workability and reflect the plastic flow characteristics of foam-conditioned sand with different FIRs. It also demonstrates that the proposed discrete element modeling scheme is suitable to analyse the meso-mechanical mechanism of sand conditioning with foam.

4. Numerical Modeling Results and Analysis

4.1. Effect of Foam on Particle Contacts

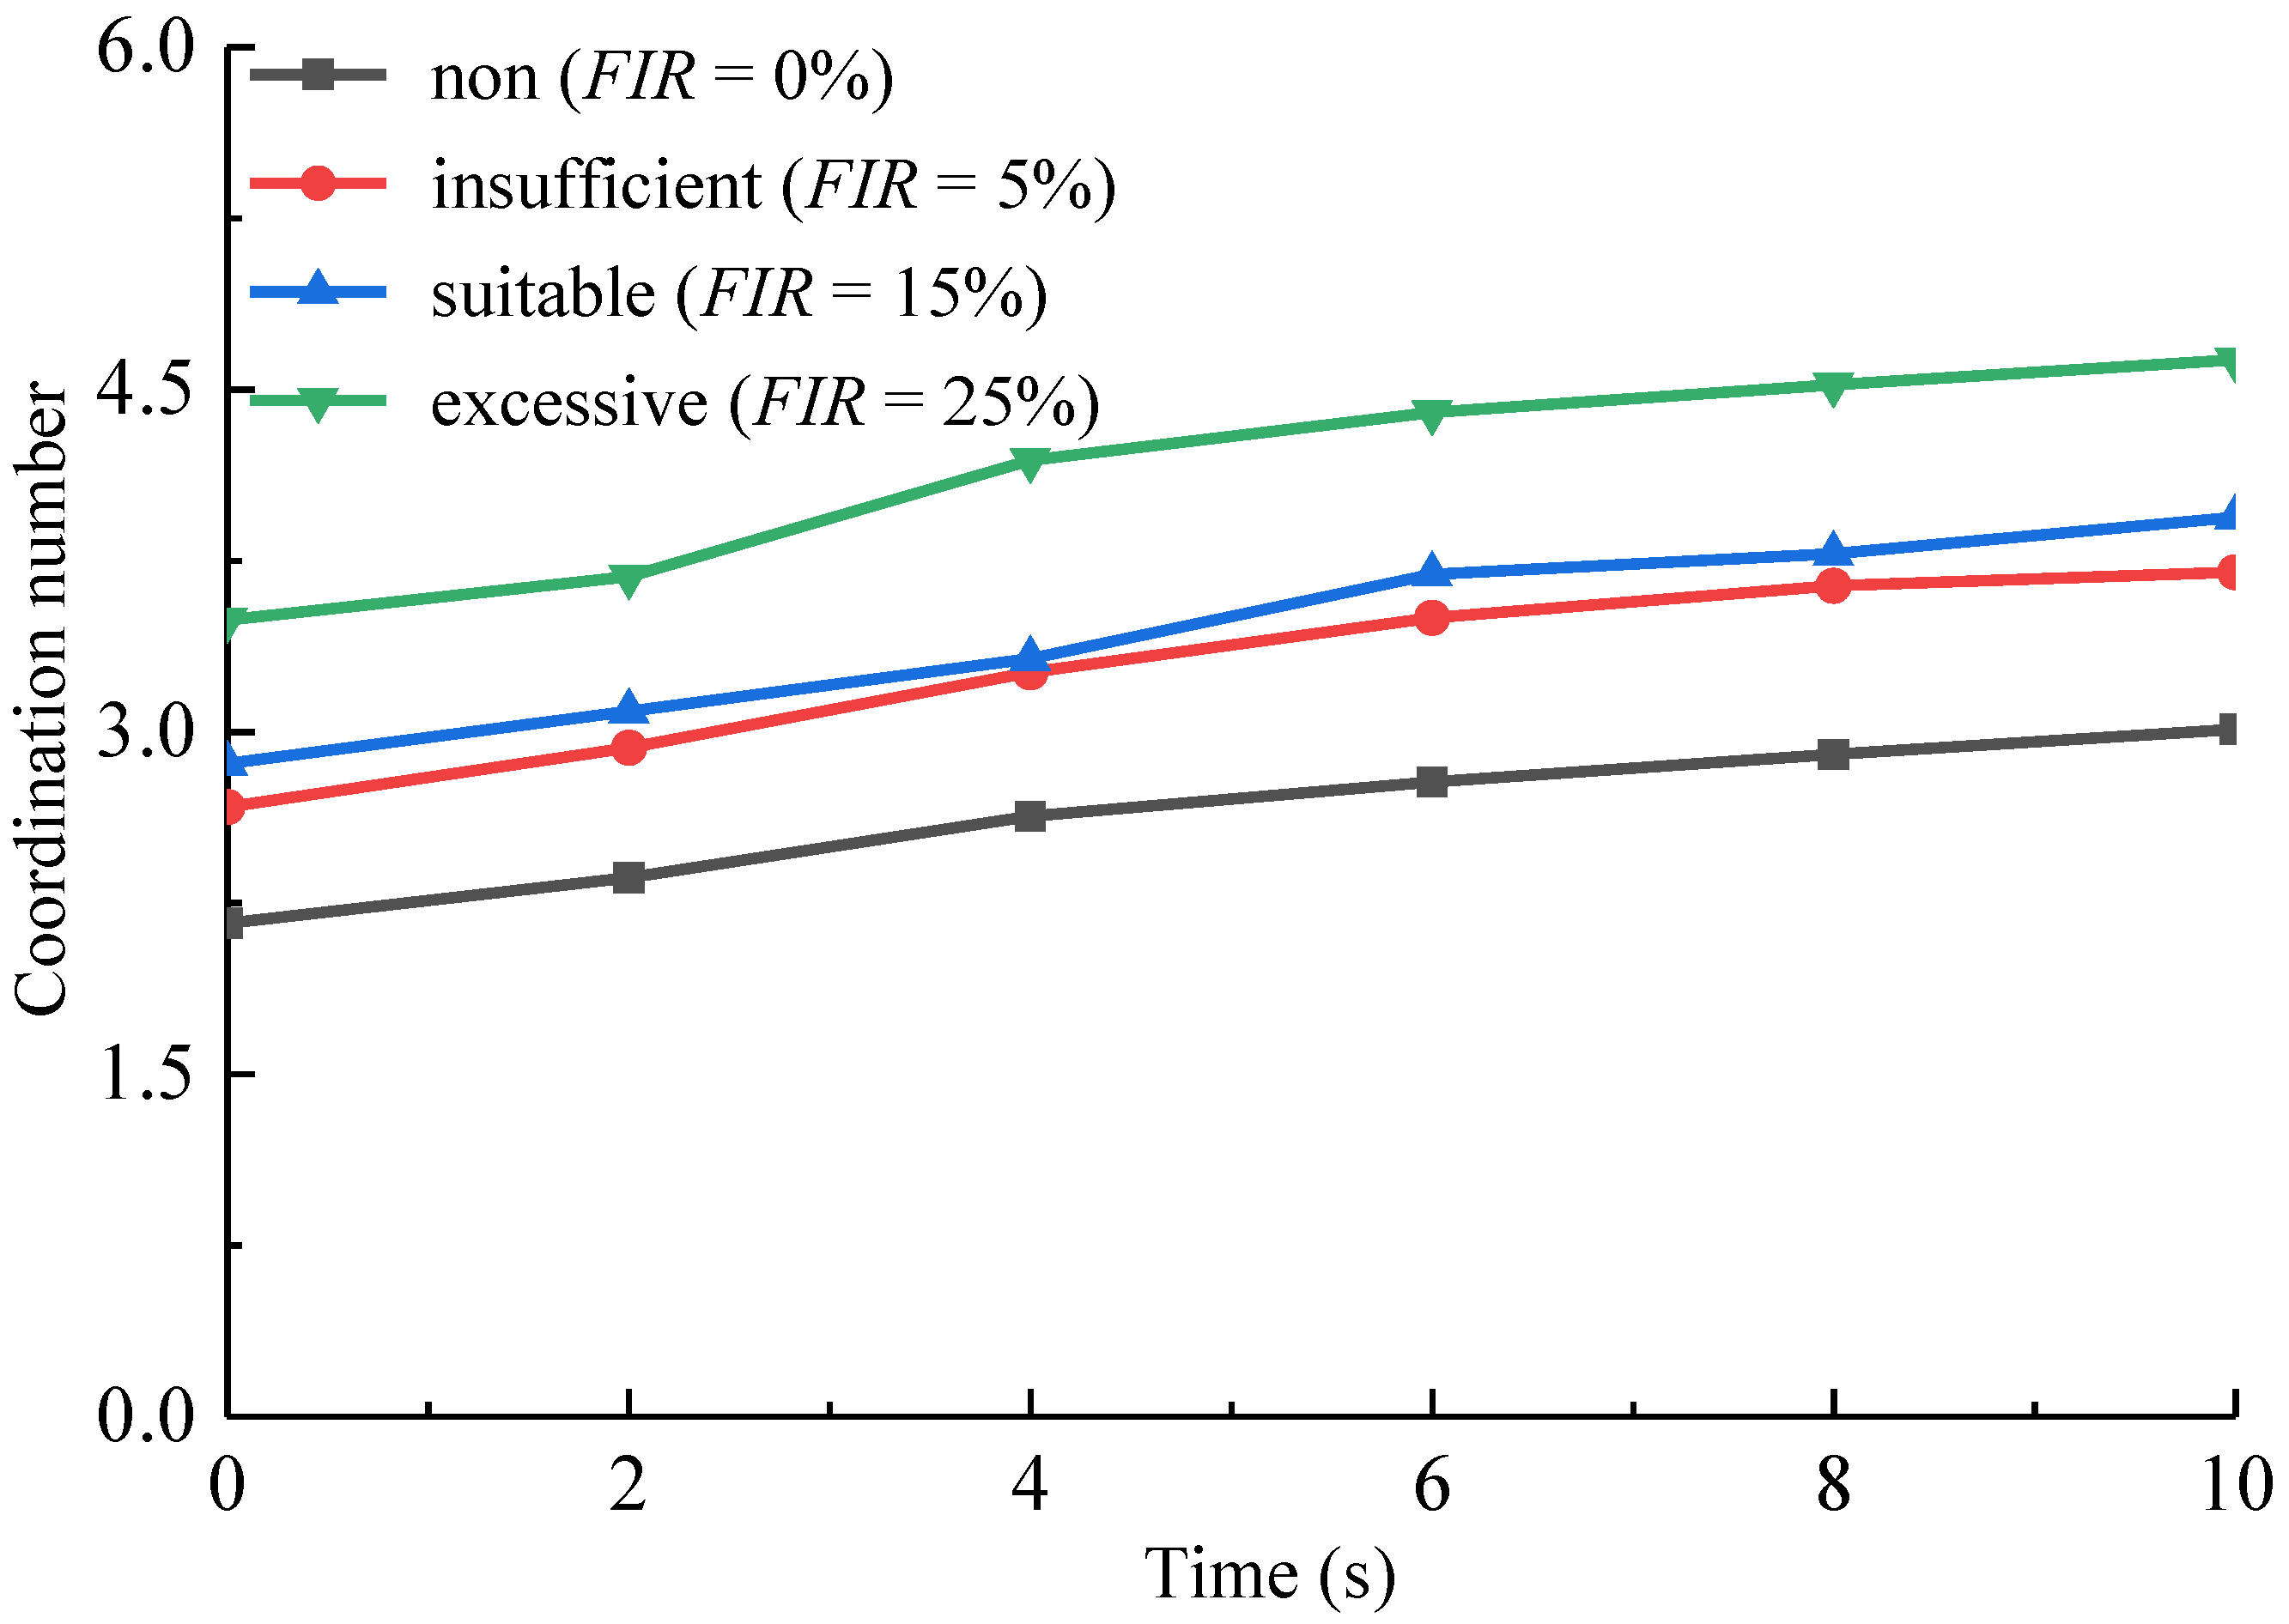
4.1.1. Effect of Foam on the Coordination Number

Figure 10 shows the variation of the coordination number against slumping time for different conditioning states. The coordination number refers to the average number of contacts around particles, and it is generally used to describe the contact characteristics of granular materials. It can be seen that the coordination number of conditioned sand has an apparent increasing trend with slumping time as a whole for each conditioning state. The number rises significantly in the initial phase after which the increasing speed of the coordination number slows down gradually. Meanwhile, the coordination number of the conditioned sand specimen enhances with the increasing FIR. The coordination number for the unconditioned sand specimen is about 2.1–3.0, and that for the conditioned specimen with a FIR of 15% reaches 2.8–3.9, which is significantly higher than that of the unconditioned specimen. With the FIR increasing to 25%, the coordination number reaches 3.5–4.6. Thus, the foam can make the particle arrangement of the conditioned sand denser, and the pore volume of conditioned sand decreases significantly due to the filling of foam particles. This phenomenon is because the pores in the sand specimen can be filled with smaller foam particles.

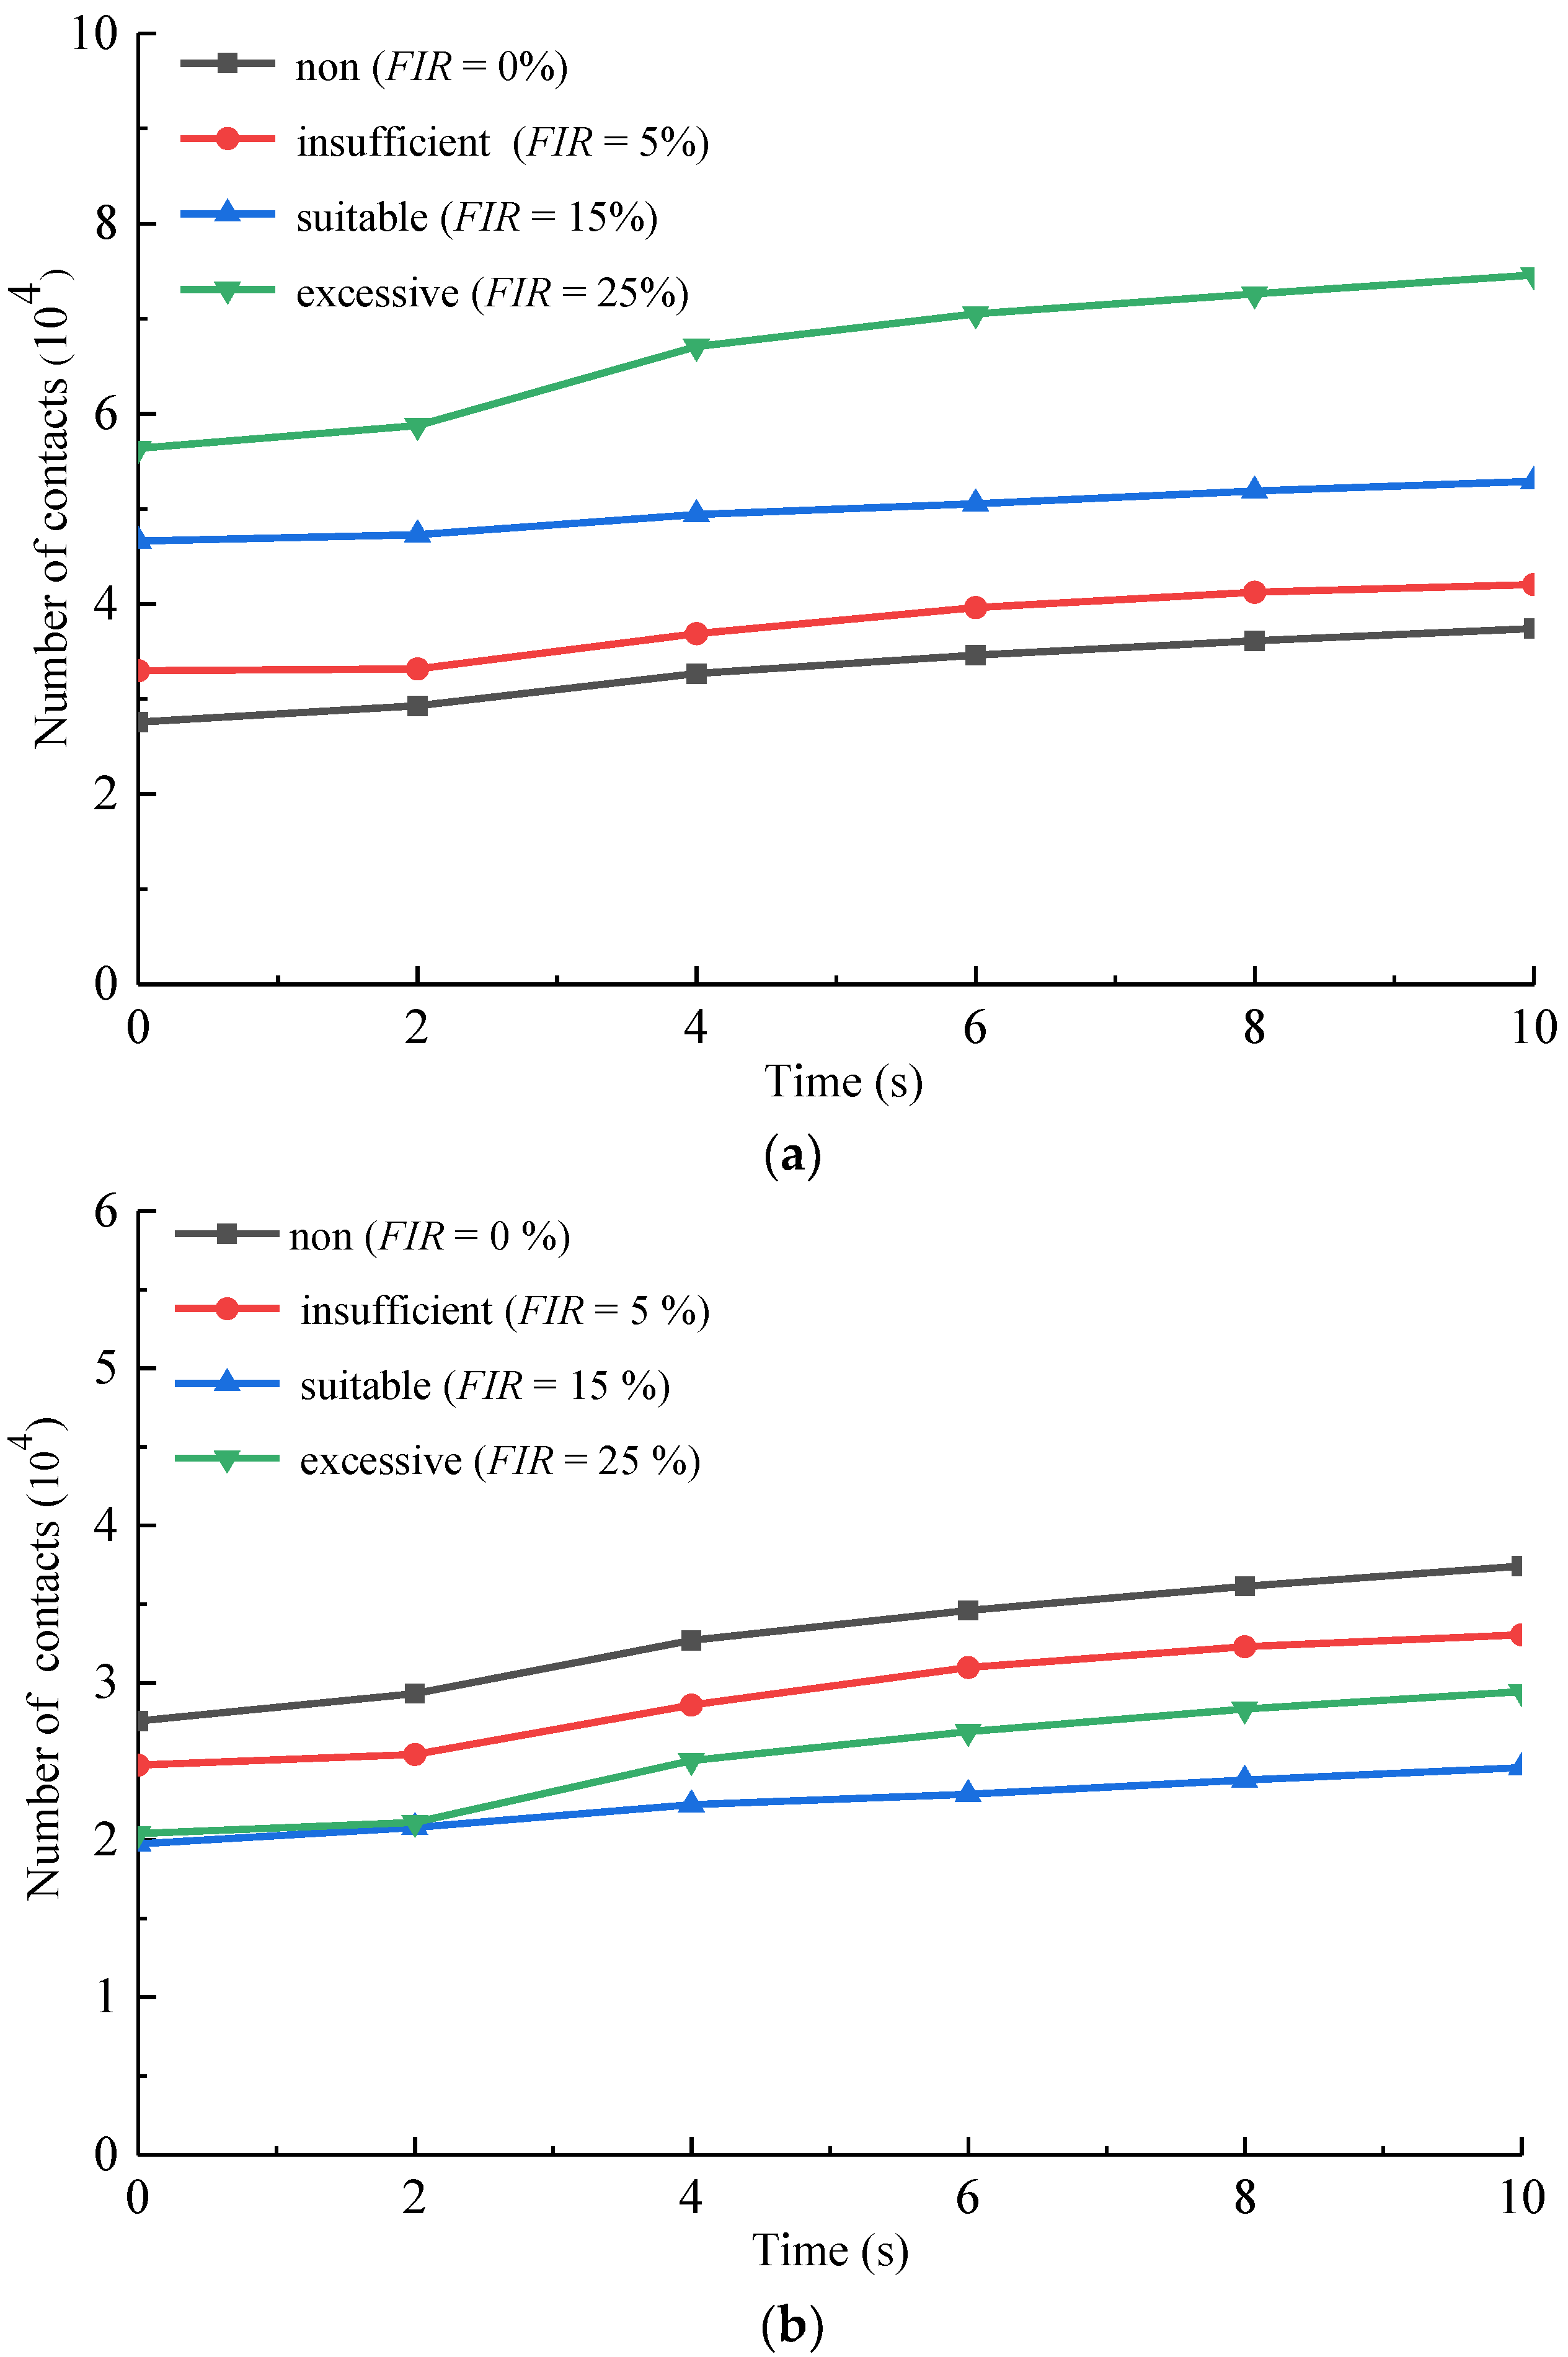
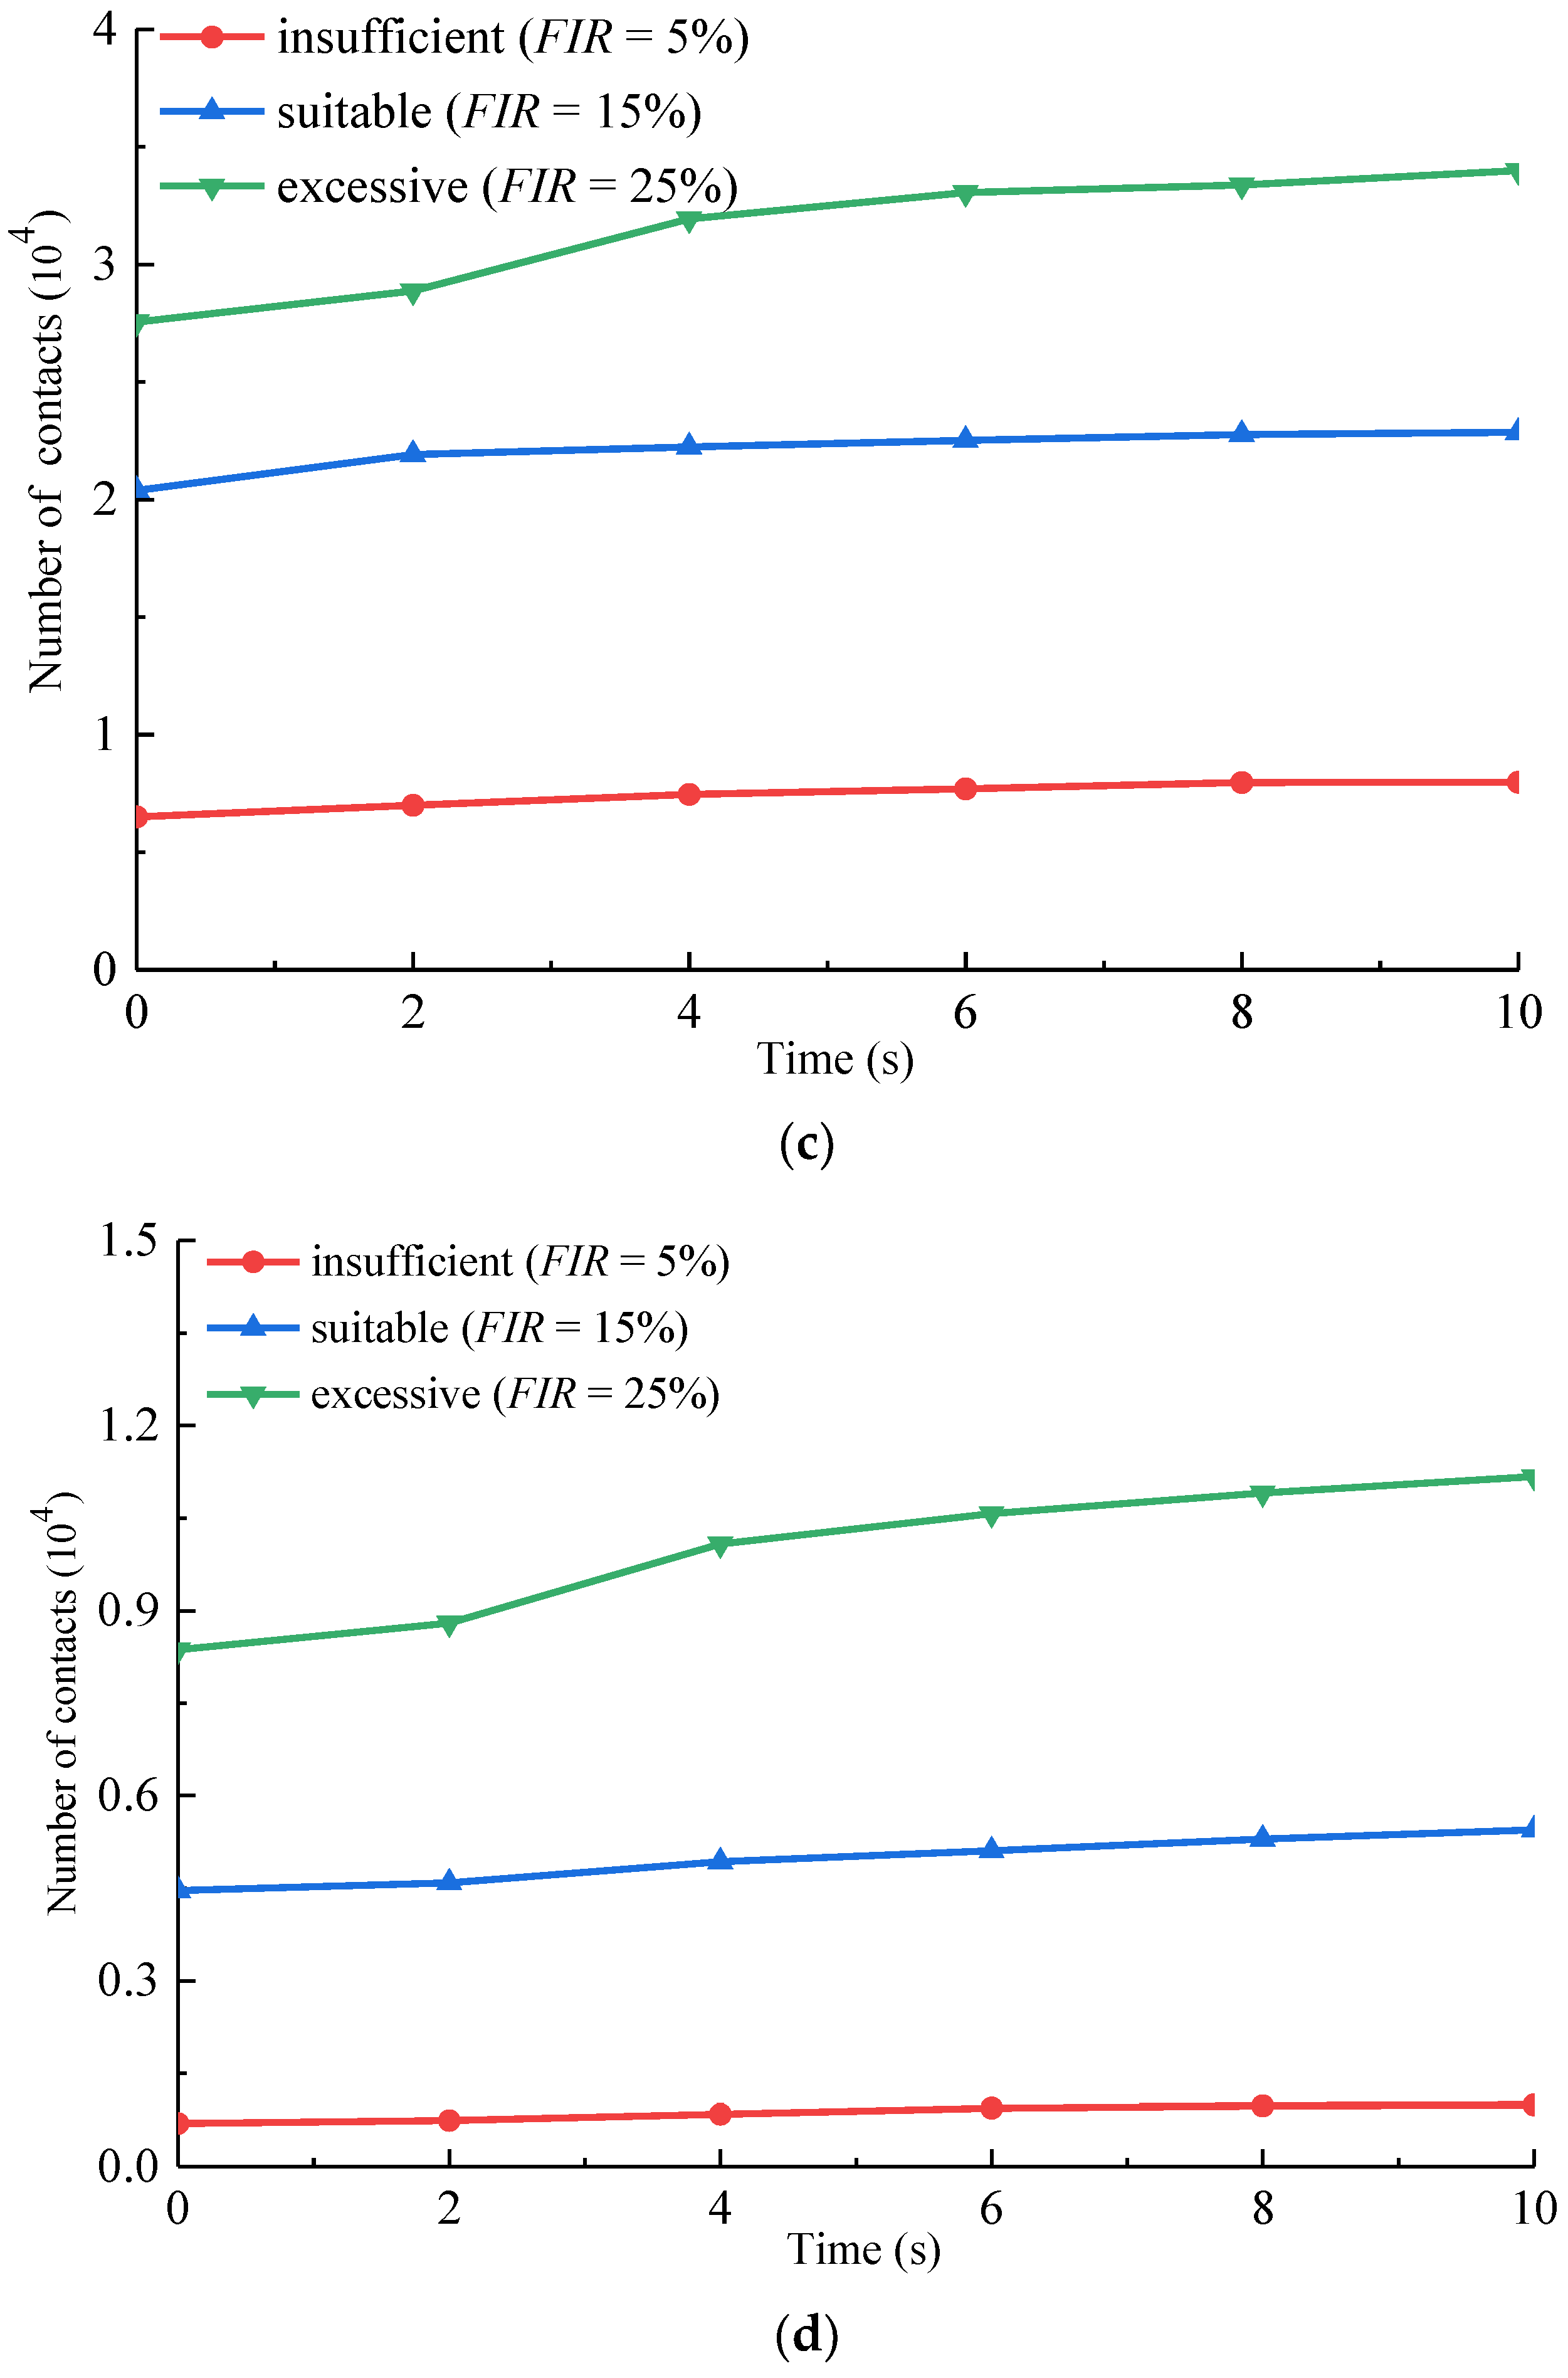
4.1.2. Effect of Foam on the Number of Particle Contacts

Figure 11 show the variations of the numbers of different contact against the slumping time for different conditioning states in the numerical slump tests. As shown in Figure 11a, a slight increase in the number of total contact of sand was observed for all the models. The number of total contacts rises in the initial stage, and then the rate of increase slows down gradually with slumping time in each conditioning state. Similar changes in the number of the inter-particle contacts of “sand-sand”, “foam-sand”, and “foam-foam” are observed in the conditioned sands with different FIRs as shown in Figure 11b–d. The phenomenon happens mainly because the unbalanced force appears after losing the lateral constraints of the slump barrel. According to the second law of thermodynamics, the system tends to keep the least ordered energy. Thus, the system can exist stably in the state with the lowest energy [51]. Two particles in contact with each other are regarded as an independent system in the sand. If the inter-particle contact force was smaller, the potential energy of the system is smaller and the system state is more stable. Therefore, there is a tendency that the contact force between particles decreases spontaneously during the equilibrium process of the slump test. However, the dead weight of the sand specimen is similar, so the inter-particle contact forces are mainly reduced by increasing the number of particle contacts.
Figure 11b shows the variation of the number of “sand-sand” contacts with different FIRs. The number of “sand-sand” contact decreases firstly and then increases with FIR, and the increase in the number of “sand-sand” contacts appears at the FIR of 15%. The initial decrease is mainly induced by the lifting effect of foam bubbles on sand particles with the increasing FIR [25]. More and more sand particles are separated by the foam particles, and the number of “sand-sand” contacts decreases with the increasing FIR of less than that for a suitable conditioning state. However, the number of “sand-sand” contacts at the FIR of 25% is close to that at the FIR of 15% in the initial phase of specimen slumping. The phenomenon suggests that the lifting effect of foam achieves the peak when the FIR is 15%, and the increasing FIR has little influence on the number of “sand-sand” contact. However, after slumping more than 2 s, the number of “sand-sand” contacts at the FIR of 25% is more than that at the FIR of 15%. Since the FIR of more than 15% tends to build more “foam-sand” and “foam-foam” contacts (see Figure 11c,d), which transfer smaller forces than other contacts, the foam bubbles easily flow out. This was why the foam bleeding happened for the excessive conditioning state in the physical tests. As a result, the number of “sand-sand” contacts increases with time after slumping more than 2 s when the FIR is more than 15% and makes the sand conditioned excessively.

4.1.3. Effect of Foam on the Evolution of Force Chains

Figure 12 shows the evolution of force chains during the slumping process of the sand specimens with different conditioning states. The width of a force chain is positively proportional to the magnitude of the contact force. The force chains in the central bottom of specimens are thicker than those in the boundaries of specimens under the self-weight of particles.
In addition, the distribution and evolution of force chains during the slumping process are greatly affected by the workability of soil specimens. Figure 12a shows that a large number of thick force chains are in the interior of the unconditioned specimen. With a FIR of 5%, the force chains in insufficient conditioned sand (see Figure 12b) is slightly thinner than those of the unconditioned sand specimen (see Figure 12a). When the FIR rises to 15%, only a few thick force chains are found inside the specimen in the initial stage and these thick force chains become thinner during the slumping process, as shown in Figure 12c. When the FIR reaches 25%, almost no thick force chains are observed in the excessive conditioned sand specimen, especially in the slumping time of 2 s, as shown in Figure 12d. This phenomenon is mainly caused by the lifting effect of foam bubbles, which can result in the decrease of contact force for the excessive conditioned specimen.
The injected foam particles fill the pores of the sand specimen, thus significantly increasing the number of inter-particle contacts and reducing the number of strong force chains in the specimen. The pattern of force transfer changes from simply “sand-sand” into the “sand-foam” type, but the magnitude of contact force transferred by foam particles is less than that by sand particles significantly. The foam is able to weaken the internal force chain structure in the conditioned sand, reducing the shear strength of sand. Thus, the fluidity of foam-conditioned sand can be significantly improved.

4.2. Effect of Foam on Contact Force Distribution

The deformation of soil is the macroscopic expression of the movement of the basic constituent particles, and the movement of the particles is mainly controlled by the direction and magnitude of the contact forces. The tangential contact force of foam-conditioned sand is limited due to relatively low shear strength of foam film. Therefore, only the evolution laws of direction and magnitude of normal contact force are compared with different conditioning states and analyzed to explore the influence mechanism of foam on the workability of sand.

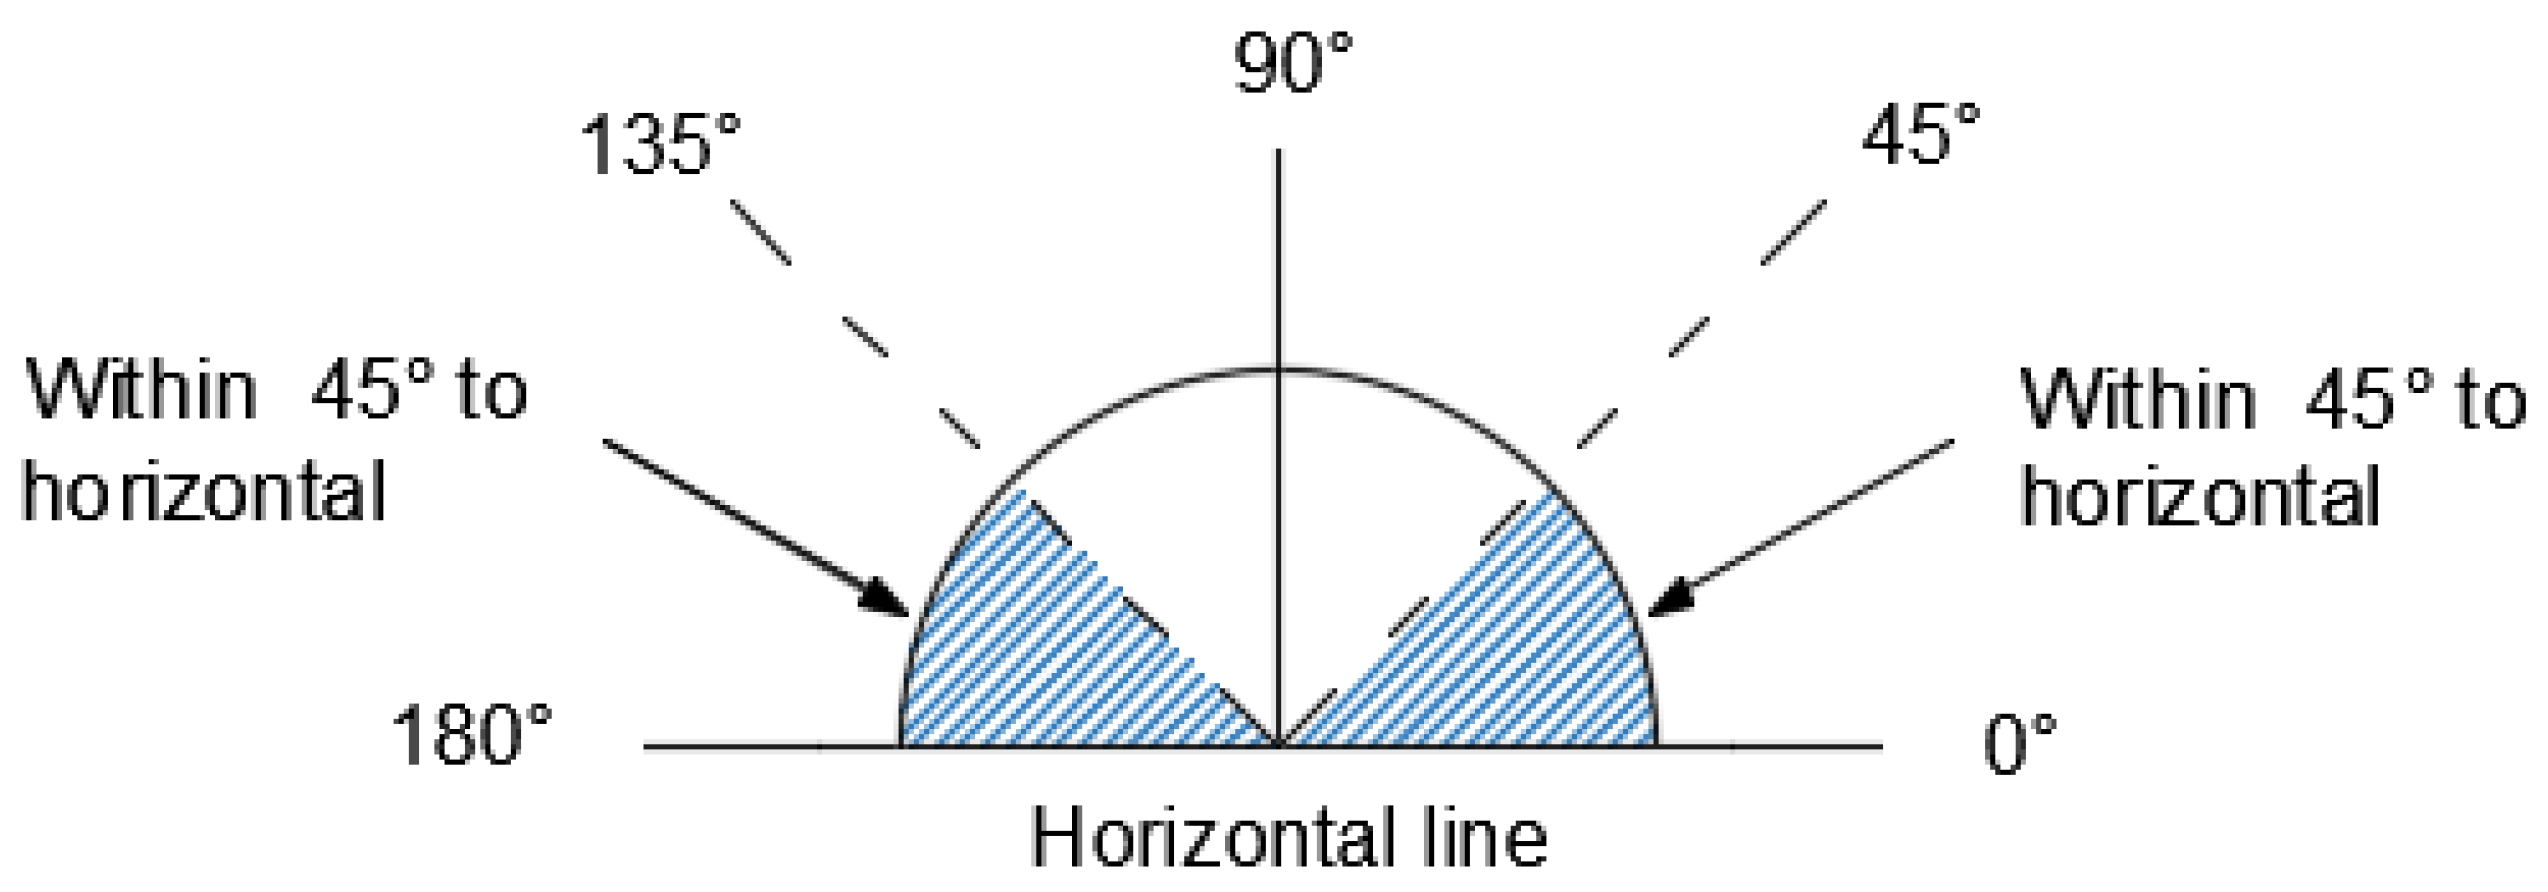
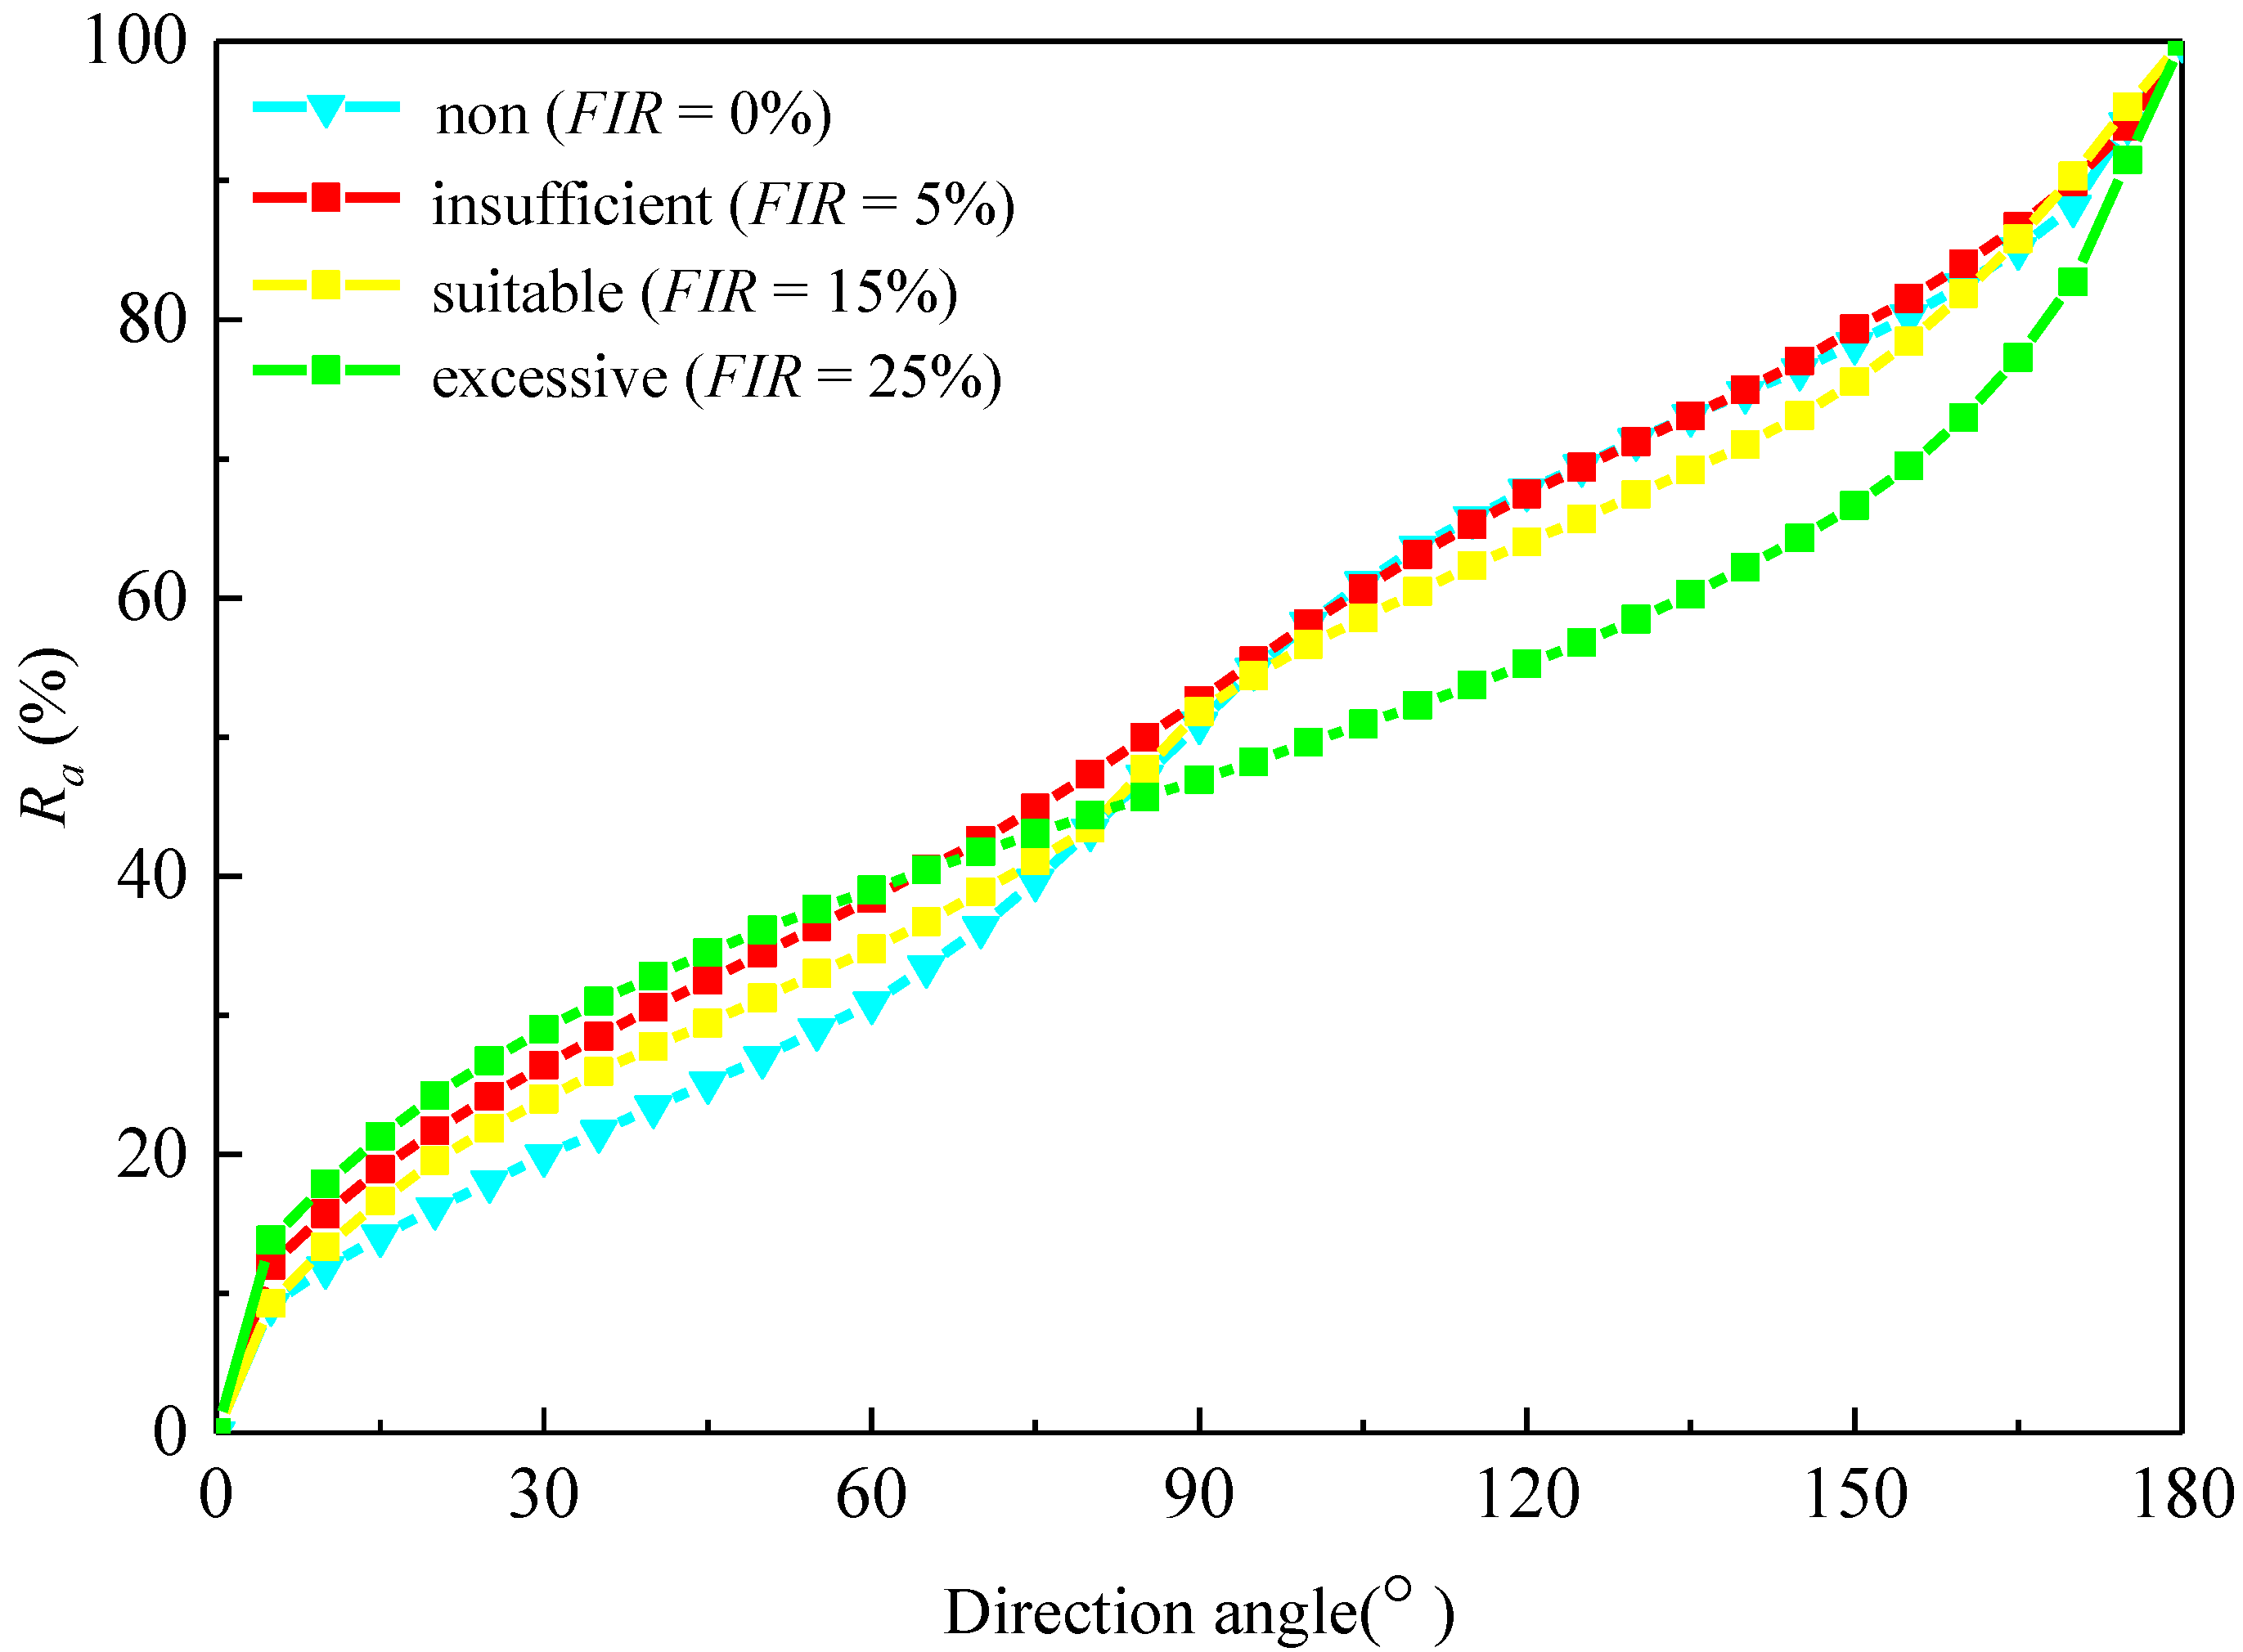
4.2.1. Effect of Foam on the Directional Distribution of Contact Forces

Figure 13 shows the direction distribution of normal contact force between particles in the conditioned sand with different FIRs. The normal contact force drives the movement of particles, whose direction directly depends on the direction of the normal contact force. When the direction of the normal contact force varies from 0 to 45° from the horizontal line, the particle has the trend of horizontal movement. The angle range between normal contact force and the horizontal line is shown in Figure 14. The direction of the most normal contacts are distributed in the range of 0–45° (including the clockwise and anticlockwise) to the vertical direction in the non-conditioning sand (see Figure 13a). With an increase in FIR, the number of contacts whose direction of normal force distributes in the range of 0–45° to the vertical direction decreases obviously, as shown in Figure 13a–d, there are a growing number of particle contacts whose direction of normal force distributes in the range of 0–45° to the horizontal direction. Figure 15 shows the variation of the proportion (Ra) of the inter-particle contacts whose direction angles are less than a certain one against the direction angle. The direction angle is defined as the angle of the direction of normal force of inter-particle contact to the right horizontal direction. The proportion is about 51% for the direction angle in the range of 45–135° in the non-conditioning sand, indicating that there are about 51% inter-particle contacts whose normal direction is in the range of 0–45° to the vertical direction (including the clockwise and anticlockwise). With a FIR of 5%, the proportion is about 42% in the range of 0–45° to the vertical direction, which is lower than that of non-conditioning sand. With continuous increases in FIR, fewer inter-particle contacts whose normal direction is in the range of 0–45° to the vertical direction are found.
This phenomenon means that the normal direction of the contact force is deflected from the vertical to the horizontal when adding foam to the sand. The sand particles need to overcome the friction resistance to move. It is known that when the angle between the direction of the resultant contact force of one particle and the vertical direction is smaller than the angle of friction between the sand particles, the soil would be in a self-locking state and unable to move [52]. The resultant contact force can be disintegrated into a horizontal component (Fh) and a vertical component (Fv). When Fh is smaller than the friction resistance force, which is the friction coefficient times the sum of Fv and particle gravity, the sand particles cannot move horizontally. The foam would make the normal direction of inter-particle contacts transfer from the vertical to the horizontal, and so the magnitude of Fh would increase and the magnitude of Fv decrease, resulting in that the driving force rises and the friction resistance drops, and sand particles are easier to move under the influence of external forces. This is one of the reasons why the workability of sand is improved with an increase in FIR. Thus, foam can effectively deflect the contact force between particles horizontally, indicating that foam can increase the value of the coefficient of lateral earth pressure of soil to a certain extent. The ability of the foam-conditioned sand to transmit a stabilization pressure to the excavation front-face is improved compared with the unconditioned soil.

4.2.2. Effect of Foam on the Magnitude of Inter-Particle Contact Forces

Figure 16 shows the variation of the proportion (Rf) of the number of inter-particle contacts whose magnitudes are less than a certain magnitude of contact force against the magnitude of contact force. The distribution curves of contact force move to the left with an increase in FIR, indicating that the normal contact force decreases gradually with an increasing FIR. The average normal contact force (F50) drops from 1.2 × 10⁻³ N (non-conditioning state) to 5.5 × 10⁻⁴ N (excessive conditioning state) with an increasing FIR. The minimum average normal contact force is 0.46 times the maximum value, meaning that the average normal contact force can be reduced by more than 50% when adding sufficient foam. The reason is that the foam particles filling in the pores of the sand specimen can support the sand particle and bear the force transferring between particles. However, the force transferring ability of foam particles is inferior to the sand particles, thus the maximum normal contact force decreases with an increasing FIR.
In addition, the sand particles need to overcome the frictional resistance, and the frictional force is affected by the normal contact between particles and the frictional coefficient. The foam can lubricate the sand particles to decrease the frictional coefficient and reduce the normal contact forces between particles. Therefore, the external force required for driving the sand to move decreases by the influence of foam.

5. Conclusions

This study performs a series of laboratory experiments and discrete element models of scaled slump tests on foam-conditioned sand. Two-phase particles, i.e., sand grains and foam bubbles, are simulated to represent foam-conditioned sand specimens. The numerical parameters are calibrated and the simulations are also verified with laboratory experiments. The results of the numerical modeling revealed the meso-mechanical mechanism of sand conditioned by foam. The main conclusions are as follows:
(1) The foam bubbles fill the pores of sand, resulting in an increase in the coordination number of foam-conditioned sand. The number of particle contacts increases greatly with the addition of foam because some “foam-sand” and “foam-foam” contacts would appear in the pores of sand.
(2) Since the introduction of foam bubbles significantly increases the number of particle contacts, the force transmission paths are increased in the sand specimen. The force transmission pattern changes from simply “sand-sand” into the coexistence of “sand-foam”, “sand-sand” and “foam-foam” contacts. However, the magnitude of contact force transferred by foam bubbles is much less than the forces transferred by sand particles. The foam bubbles can weaken the internal force chain structure in the conditioned sand.
(3) The main direction of normal contact force transfers to the horizontal direction more significantly when adding foam into the sand, and the sand particles tend to move horizontally. The presence of the “foam-sand” contact provides additional cohesive force to restrict the movement of sand grains but the influence would reduce when “foam-foam” contact increases. Therefore, the horizontal movement of conditioned sand first weakens and then increases with an increase in FIR.
(4) The average normal contact force drops from 1.2 × 10⁻³ N (non-conditioning state) to 5.5 × 10⁻⁴ N (excessive conditioning state) with an increasing FIR. The minimum average normal contact force is 0.46 times of the maximum value, which means the average normal contact force can be reduced by more than 50% when adding sufficient foam.
(5) The sand particles need to overcome the frictional strength to move, and the frictional force is affected by the normal contact force between particles and the frictional coefficient. The foam can lubricate the sand particles to decrease the frictional coefficient, and then reduce the normal contact force between particles, resulting in a decrease in friction resistance.

Author Contributions

Software, Z.L.; Writing—original draft, Z.L., S.W., T.Q. and X.G.; Writing—review & editing, S.W., T.Q. and X.G. All authors have read and agreed to the published version of the manuscript.

Funding

The financial support from the National Natural Science Foundation of China (No. 52022112, 51778637), the Fundamental Research Funds for the Central Universities of Central South University (No. 2020zzts627) and the National Key R&D Program of China, China (No. 2017YFB1201204) are acknowledged and appreciated.

Conflicts of Interest

The authors declare no conflict of interest.

References

  1. Song, K.; Wang, B.; Kong, H.; Yuan, D.; Wang, M. Study of foam technology during shield excavation in sandy cobble bed without water. Chin. J. Rock Mech. Eng. 2005, 24, 2327–2332. (In Chinese) [Google Scholar]
  2. Guglielmetti, V.; Grasso, P.; Mahtab, A.; Xu, S. Mechanized Tunnelling in Urban Areas: Design Methodology and Construction Control; Taylor & Francis: London, UK, 2008. [Google Scholar]
  3. Psomas, S. Properties of Foam/Sand Mixtures for Tunneling Applications. Master’s Thesis, University of Oxford, London, UK, 2001. [Google Scholar]
  4. Huang, S.; Wang, S.; Xu, C.; Shi, Y.; Ye, F. Effect of grain gradation on the permeability characteristics of coarse-grained soil conditioned with foam for EPB shield tunneling. KSCE J. Civ. Eng. 2019, 23, 4662–4674. [Google Scholar] [CrossRef]
  5. Salazar, C.; Todaro, C.; Bosio, F.; Bassini, E.; Ugues, D.; Peila, D. A new test device for the study of metal wear in conditioned granular soil used in EPB shield tunneling. Tunn. Undergr. Space Technol. 2018, 73, 212–221. [Google Scholar] [CrossRef] [Green Version]
  6. Mori, L.; Mooney, M.; Cha, M. Characterizing the influence of stress on foam conditioned sand for EPB tunneling. Tunn. Undergr. Space Technol. 2018, 71, 454–465. [Google Scholar] [CrossRef]
  7. Pourmand, S.; Chakeri, H.; Sharghi, M.; Ozcelik, Y. Investigation of soil conditioning tests with three-dimensional numerical modeling. Geotech. Geol. Eng. 2018, 36, 2869–2879. [Google Scholar] [CrossRef]
  8. Zumsteg, R.; Langmaack, L. Mechanized tunneling in soft soils: Choice of excavation mode and application of soil-conditioning additives in glacial deposits. Engineering 2017, 3, 863–870. [Google Scholar] [CrossRef]
  9. Wu, Y.; Nazem, A.; Meng, F.; Mooney, M. Experimental study on the stability of foam-conditioned sand under pressure in the EPBM chamber. Tunn. Undergr. Space Technol. 2020, 106, 103590. [Google Scholar] [CrossRef]
  10. Weaire, D.; Phelan, R. The physics of foam. J. Phys. Condens. Matter 1999, 8, 9519–9524. [Google Scholar] [CrossRef]
  11. Budach, C.; Thewes, M. Application ranges of EPB shields in coarse ground based on laboratory research. Tunn. Undergr. Space Technol. 2015, 50, 296–304. [Google Scholar] [CrossRef]
  12. Houlsby, G.; Mair, R.; Borghi, X.; Merritt, A.; Pena, M. Easing the way: Soil conditioning. Tunn. Tunn. Int. 2003, 35, 48–50. [Google Scholar]
  13. Peila, D.; Oggeri, C.; Vinai, R. Screw conveyor device for laboratory tests on conditioned soil for EPB tunneling operations. J. Geotech. Geoenviron. Eng. 2007, 133, 1622–1625. [Google Scholar] [CrossRef]
  14. Xu, Q.; Zhang, L.; Zhu, H.; Gong, Z.; Liu, J.; Zhu, Y. Laboratory tests on conditioning the sandy cobble soil for EPB shield tunnelling and its field application. Tunn. Undergr. Space Technol. 2020, 105, 103512. [Google Scholar] [CrossRef]
  15. Wang, S.; Hu, Q.; Wang, H.; Thewes, M.; Ge, L.; Yang, J.; Liu, P. Permeability characteristics of poorly graded sand conditioned with foam in different conditioning states. J. Test. Eval. 2020, 49, 20190539. [Google Scholar] [CrossRef]
  16. Hu, Q.; Wang, S.; Qu, T.; Xu, T.; Huang, S.; Wang, H. Effect of hydraulic gradient on the permeability characteristics of foam-conditioned sand for mechanized tunnelling. Tunn. Undergr. Space Technol. 2020, 99, 103377. [Google Scholar] [CrossRef]
  17. Peila, D.; Oggeri, C.; Borio, L. Using the slump test to assess the behavior of conditioned soil for EPB tunneling. Environ. Eng. Geosci. 2009, 15, 167–174. [Google Scholar] [CrossRef]
  18. Malusis, M.; Barben, E.; Evans, J. Hydraulic conductivity and compressibility of soil-bentonite backfill amended with activated carbon. J. Geotech. Geoenviron. Eng. 2009, 135, 664–672. [Google Scholar] [CrossRef]
  19. Boone, S.; Artigiani, E.; Shirlaw, J.; Ginanneschi, R.; Leinala, T.; Kochmanova, N. Use of ground conditioning agents for Earth Pressure Balance machine tunnelling. In Proceedings of the French Tunnelling and Underground Space Association, Chambéry, France, 10–12 October 2005; pp. 313–319. [Google Scholar]
  20. Huang, Z.; Wang, C.; Dong, J.; Zhou, J.; Yang, J.; Li, Y. Conditioning experiment on sand and cobble soil for shield tunneling. Tunn. Undergr. Space Technol. 2019, 87, 187–194. [Google Scholar] [CrossRef]
  21. Williamson, G.; Traylor, M.; Higuchi, M. Soil conditioning for EPB shield tunneling on the South Bay Ocean Outfall. In Proceedings of the Rapid Excavation and Tunneling Conference, Orlando, FA, USA, 21–23 June 1999; pp. 897–926. [Google Scholar]
  22. Martinelli, D.; Peila, D.; Campa, E. Feasibility study of tar sands conditioning for earth pressure balance tunnelling. J. Rock Mech. Geotech. Eng. 2015, 7, 684–690. [Google Scholar] [CrossRef] [Green Version]
  23. Peron, J.; Marcheselli, P. Construction of the ‘Passante Ferroviario’link in Milan, Italy, lots 3P, 5P and 6P: Excavation by large earth pressure balanced shield with chemical foam injection. Tunnelling 1994, 94, 679–707. [Google Scholar]
  24. Jancsecz, S.; Krause, R.; Langmaack, L. Advantages of soil conditioning in shield tunnelling: Experiences of LRTS Izmir; Alten, T., Broch, E., Eds.; Balkema: Rotterdam, The Netherlands, 1999; pp. 865–875. [Google Scholar]
  25. Vinai, R.; Oggeri, C.; Peila, D. Soil conditioning of sand for EPB applications: A laboratory research. Tunn. Undergr. Space Technol. 2008, 23, 308–317. [Google Scholar] [CrossRef]
  26. Bezuijen, A.; Schaminee, P.; Kleinjan, J. Additive testing for earth pressure balance shields. In Twelfth European Conference on Soil Mechanics and Geotechnical Engineering (Proceedings) The Netherlands Society of Soil Mechanics and Geotechnical Engineering; Ministry of Transport, Public Works and Water Management; van den Berg Machinefabriek, A.P., Fugro, N.V., Delft, G., Eds.; Holland Railconsult: Utrecht, The Netherlands, 1999; Volume 3. [Google Scholar]
  27. Azimi, A. Analysis of slump test for sand–foam mixtures. J. Mater. Civ. Eng. 2017, 29, 04017109. [Google Scholar] [CrossRef]
  28. Martinelli, D.; Winderholler, R.; Peila, D. Undrained behaviour of granular soils conditioned for EPB tunneling—A new experimental procedure. Geomech. Tunn. 2017, 10, 81–89. [Google Scholar] [CrossRef]
  29. Zhao, B.; Liu, D.; Jiang, B. Soil conditioning of waterless sand–pebble stratum in EPB tunnel construction. Geotech. Geol. Eng. 2018, 36, 2495–2504. [Google Scholar] [CrossRef]
  30. Freimann, S.; Schröer, M.; Thewes, M. Experimental investigation of the flow behaviour of conditioned soils for EPB tunnelling in closed mode. In Tunnels and Underground Cities: Engineering and Innovation Meet Archaeology, Architecture and Art; Freimann, S., Schröer, M., Thewes, M., Eds.; Taylor & Francis: London, UK, 2019; pp. 2109–2118. [Google Scholar]
  31. Wang, H.; Wang, S.; Zhong, J.; Qu, T.; Liu, Z.; Xu, T.; Liu, P. Undrained compressibility characteristics and pore pressure calculation model of foam-conditioned sand. Tunn. Undergr. Space Technol. 2021, 118, 104161. [Google Scholar] [CrossRef]
  32. Wang, S.; Liu, P.; Gong, Z.; Yang, P. Auxiliary air pressure balance mode for EPB shield tunneling in water-rich gravelly sand strata: Feasibility and soil conditioning. Case Stud. Constr. Mater. 2022, 16, e00799. [Google Scholar] [CrossRef]
  33. ASTM. ASTM D2434-68; ASTM (American Society for Testing and Materials): West Conshohocken, PA, USA, 2006. [Google Scholar]
  34. Sebastiani, D.; Vilardi, G.; Bavasso, I.; Di, P.L.; Miliziano, S. Classification of foam and foaming products for EPB mechanized tunnelling based on half-life time. Tunn. Undergr. Space Technol. 2019, 92, 103044. [Google Scholar] [CrossRef]
  35. Avunduk, E.; Copur, H.; Tolouei, S.; Tumac, D.; Balci, C.; Bilgin, N.; Shaterpour–Mamaghani, A. Possibility of using torvane shear testing device for soil conditioning optimization. Tunn. Undergr. SpaceTechnol. 2021, 107, 103665. [Google Scholar] [CrossRef]
  36. Galli, M.; Thewes, M. Rheological characterisation of foam-conditioned sands in EPB tunneling. Int. J. Civ. Eng. 2019, 17, 145–160. [Google Scholar] [CrossRef]
  37. ASTM. ASTM C 143/C 143Ma-2005; ASTM (American Society for Testing and Materials): West Conshohocken, PA, USA, 2005. [Google Scholar]
  38. Svanberg, A.; Larsson, S.; Mki, R.; Jonsén, P. Full-scale simulation and validation of wear for a mining rope shovel bucket. Minerals 2021, 11, 623. [Google Scholar] [CrossRef]
  39. Yu, C.; Geng, R.; Wang, X. A numerical study of separation performance of vibrating flip-flow screens for cohesive particles. Minerals 2021, 11, 631. [Google Scholar] [CrossRef]
  40. Zhang, F.; Wang, C.; Chang, J.; Feng, H. DEM analysis of cyclic liquefaction behaviour of cemented sand. Comput. Geotech. 2022, 142, 104572. [Google Scholar] [CrossRef]
  41. Qu, T.; Feng, Y.T.; Zhao, T.; Wang, M. Calibration of linear contact stiffnesses in discrete element models using a hybrid analytical-computational framework. Powder Technol. 2019, 356, 795–807. [Google Scholar] [CrossRef]
  42. Zheng, D.; Song, W.; Cao, S.; Li, J.; Sun, L. Investigation on dynamical mechanics energy dissipation, and microstructural characteristics of cemented tailings backfill under shpb tests. Minerals 2021, 11, 542. [Google Scholar] [CrossRef]
  43. Bisserik, A.; Kim, J.; Satyanaga, A.; Moon, S.W. Characterization of CSA cemented-treated sands via discrete element method. In AIP Conference Proceedings; AIP Publishing LLC: Melville, NY, USA, 2021; Volume 2441, p. 030001. [Google Scholar]
  44. Maeda, M.; Kushiyama, K. Use of compact shield tunneling method in urban underground construction. Tunn. Undergr. Space Technol. 2005, 20, 159–166. [Google Scholar] [CrossRef]
  45. Chen, R.; Tang, L.; Ling, D.; Chen, Y. Face stability analysis of shallow shield tunnels in dry sandy ground using the discrete element method. Comput. Geotech. 2011, 38, 187–195. [Google Scholar] [CrossRef]
  46. Qu, T.; Wang, S.; Fu, J.; Hu, Q.; Zhang, X. Numerical examination of EPB shield tunneling–induced responses at various discharge ratios. J. Perform. Constr. Facil. 2019, 33, 04019035. [Google Scholar] [CrossRef]
  47. Mak, J.; Chen, Y.; Sadek, M. Determining parameters of a discrete element model for soil–tool interaction. Soil Tillage Res. 2012, 118, 117–122. [Google Scholar] [CrossRef]
  48. Wang, J.; He, C.; Wang, C.; Chen, Z.Q.; Tang, R. Face stability analysis of EPB shield tunnel in sand. Chin. J. Geotech. Eng. 2018, 40, 177–185. (In Chinese) [Google Scholar]
  49. Hu, G. Analysis and Simulation of Particle System with Discrete Element Method; Wuhan University of Technology Press: Wuhan, China, 2010. (In Chinese) [Google Scholar]
  50. Sun, Q.; Huang, J. Structure and stability of liquid foam. Physics 2006, 35, 1050–1054. (In Chinese) [Google Scholar]
  51. Clausius, R. On the moving force of heat, and the laws regarding the nature of heat itself which are dudecible therefrom. Philos. Mag. 1851, 2, 1–21. [Google Scholar] [CrossRef]
  52. Xiao, Q.; Xiao, Y.; Xiao, Z.; Wei, W.; Lianghai, L. Detailed design of an SMA-actuated self-locking device for rotary feed structure. Smart Mater. Struct. 2016, 25, 035032. [Google Scholar] [CrossRef]
Figure 1. The grain size distribution curve of the sand.
Minerals 12 00186 g001
Figure 2. Images of foaming system and foam. (a). foaming system (b). foam.
Minerals 12 00186 g002
Figure 3. The scaled slump barrel.
Minerals 12 00186 g003
Figure 4. The variations of slump and extension values of foam conditioned sand with FIR.
Minerals 12 00186 g004
Figure 5. The slumped specimens in the different conditioning states: (a) non, (b) insufficient, (c) suitable, (d) excessive.
Minerals 12 00186 g005
Figure 6. Grain size distribution curve of the sand for slump tests.
Minerals 12 00186 g006
Figure 7. The microscope image of foam.
Minerals 12 00186 g007
Figure 8. Foam particle grading curve.
Minerals 12 00186 g008
Figure 9. The slumped specimens in numerical and experimental models with the different conditioning states: (a) non, (b) insufficient, (c) suitable, (d) excessive.
Minerals 12 00186 g009
Figure 10. Variation of coordination number of foam-conditioned sand with different conditioning states during the slumping process.
Minerals 12 00186 g010
Figure 11. Variation of the number of contacts with the slump time for different contact types: (a) all, (b) sand-sand, (c) foam-sand, (d) foam-foam.
Minerals 12 00186 g011aMinerals 12 00186 g011b
Figure 12. The evolution of force chains for foam-conditioned sand during the slumping process with different conditioning states: (a) non, (b) insufficient, (c) suitable, (d) excessive.
Minerals 12 00186 g012
Figure 13. Statistical diagram of contact number distribution of the conditioned sand with different conditioning states: (a) non, (b) insufficient, (c) suitable, (d) excessive.
Minerals 12 00186 g013
Figure 14. Diagram of contact force distribution range.
Minerals 12 00186 g014
Figure 15. Variation of the proportion of inter-particle contacts whose direction angles are less than a certain value against the direction angle.
Minerals 12 00186 g015
Figure 16. Distribution curves of normal contact forces of conditioned sand with different workability during the slumping process.
Minerals 12 00186 g016
Table 1. Testing conditions of the scaled slump tests.
No.Wt (%)FIR (%)Slump Value (cm)Extension Value (cm)
11005.719.7
21055.517.8
310154.913.7
4102510.818.7
Table 2. Model particle size proportion.
Particle size (mm)0.25–0.50.5–1.01–2.52.5–5.0
Proportion (%)16.7%23.6%44.4%15.3%
Table 3. The used particle-scaled parameters.
No.Conditioning StateContactkn (N/m)ks (N/m)fricσc (kN/m2)
1Nonsand-sand3.67 × 1053.67 × 1050.860
2Insufficientsand-sand3.67 × 1053.67 × 1050.730
foam-foam3.21 × 10−23.21 × 10−20.0135.4
foam-sand3.21 × 10−23.21 × 10−20.3121.6
3Suitablesand-sand3.67 × 1053.67 × 1050.530
foam-foam3.21 × 10−23.21 × 10−20.0135.4
foam-sand3.21 × 10−23.21 × 10−20.2821.6
4Excessivesand-sand3.67 × 1053.67 × 1050.320
foam-foam3.21 × 10−23.21 × 10−20.0135.4
foam-sand3.21 × 10−23.21 × 10−20.2321.6
Table 4. Results of the scaled slump tests in numerical and experimental models.
No.Conditioning StatePhysical Slump Value (cm)Numerical Slump Value (cm)Error (%)Physical Extension Value (cm)Numerical Extension Value (cm)Error (%)
1Non5.75.53.519.718.65.6
2Insufficient5.55.17.217.817.42.2
3Suitable4.94.74.113.714.12.9
4Excessive10.810.34.618.719.64.8
Publisher’s Note: MDPI stays neutral with regard to jurisdictional claims in published maps and institutional affiliations.

