Article

Multi-Technique Analytical Approach to Quantitative Analysis of Spodumene

1
X-ray Mineral Services Ltd., 1 Claughton Rd, Colwyn Bay LL29 7EF, UK
2
X-ray Mineral Services Finland Oy, Tekniikantie 12, 02150 Espoo, Finland
3
Hanson Aggregates, Criggion, Shrewsbury SY5 9BA, UK
*
Author to whom correspondence should be addressed.
Minerals 2022, 12(2), 175; https://doi.org/10.3390/min12020175
Submission received: 23 December 2021 / Revised: 20 January 2022 / Accepted: 25 January 2022 / Published: 29 January 2022
(This article belongs to the Special Issue Advances in the Geometallurgy of Battery Minerals)

Abstract

:
The aim of this study was to establish the capability of X-ray diffraction (XRD) and Fourier transform infrared spectroscopy (FTIR) methods to determine different spodumene forms (α-, β- and γ-spodumene) occurring during heat treatment of lithium spodumene. It is essential to correctly identify and quantify the presence of different forms of spodumene after heat treatment to ensure optimum lithium extraction. A sample from the Haapaluoma lithium-pegmatite (western Finland) was used for this study. An experimental programme was initiated to model the progression of the mineral transformation at different stages through heat treatment. The specimen was broken down and split into five portions. One of the splits was analysed unheated with XRD, FTIR, XRF and ICP; the other four splits were analysed with XRD and FTIR after heat treatment at different temperatures from 850 to 1100 °C. In this study, we show that both laboratory-based XRD and portable FTIR methods are effective in identifying and quantifying α-, β- and γ-spodumene as well as impurities. The accuracy of the quantification of the minerals with XRD was established by using a mass balance calculation and was compared with the actual chemistry of the sample measured with ICP analysis. Fully quantitative XRD analysis of heat-treated spodumene is considered a challenge due to peak overlaps between the β-, and γ-spodumene forms, particularly when gangue minerals and amorphous content are present. The novelty of this study consists of the use of the XRD technique complemented by the Rietveld method to fully quantify the different forms of spodumene from one another: α-, β- and γ-spodumene, along with the gangue minerals and the amorphous content. It is also shown that reproducible systematic changes occur in the FTIR spectra that track the spodumene transformation during heat treatment. With more samples and cross-validation between the XRD results, the FTIR methodology could be developed further to provide semi-quantitative information on the different spodumene forms in the future. This would permit the use of a fast, cost-effective and portable technique for quality control of the spodumene forms, which would open opportunities across the Li value chain.

1. Introduction

In recent years lithium (Li) has been established as one of the cornerstone resources for the transition towards a carbon-free economy. Road-based transportation is now being developed towards lithium-ion battery (LIB) powered electric vehicles (EVs) and lithium-ion batteries are increasingly utilised in grid storage applications. As lithium end-use is becoming more focused on batteries (71% in 2020 [1]), it is expected that by 2030 lithium demand will reach ca. 1.8 M metric tons of lithium carbonate equivalent (up from ca. 0.3 M metric tons in 2019 [2]). Commonly exploited lithium-containing hard rock minerals include spodumene, lepidolite, petalite, eucryptite, and bikitaite among others. Lithium brine is also commonly exploited for Li production. Of the Li-bearing minerals, spodumene has higher grades of Li, less impurities and a simpler composition. Currently, ca. half of the world’s lithium production is based on mineral sources (mainly spodumene) in Australia, while Chile and Argentina produce ca. 30% from brines [1]. Li is now considered a strategic resource due to its relevance for the energy transition and as its price increases, previously uneconomical Li-bearing deposits are now becoming viable sources for extraction [1,3].
Among the many different types of lithium minerals, spodumene, an aluminosilicate of lithium is the most common and studied. The stoichiometric chemical composition of naturally abundant spodumene LiAlSi2O6 contains 8.03 wt.% Li2O, while most other raw minerals typically contain ca. 1–3% Li2O. The mined natural spodumene, referred to as α-spodumene, is monoclinic and has a low reactivity towards extraction. After high-temperature treatment at ca. 800–1200 °C α-spodumene is converted to a more reactive form, β-spodumene, with a tetragonal crystal structure. β-spodumene exhibits a much higher surface area and reactivity due to its zeolite-like channels in its structure, which allow the lithium cations to move freely [4]. This conversion by heat treatment is the basis of almost all industrial lithium extraction processes, while some novel methods have also been developed to extract lithium directly from α-spodumene [3]. However, a third intermediate phase with a hexagonal crystal structure can also form during heat treatment, known as γ-spodumene. Lithium recovery efficiency during acid leaching of β-spodumene has been shown to decrease when γ-spodumene is present and, therefore, its amount should be carefully controlled [5], however, this topic has not been studied in full detail to date. Distinguishing between β-spodumene and γ-spodumene is known to be difficult, and full quantification of the different forms after heat treatment even more so [5,6]. This is due to the fact that the main XRD reflections of β-spodumene and γ-spodumene overlap, which makes differentiation between the two difficult, especially at low concentrations. This is likely one of the reasons why γ-spodumene has not been a major focus in examining lithium extraction processes thus far [7]. Furthermore, accurate identification of amorphous content as well as the gangue minerals is of utmost importance when obtaining full quantification with XRD coupled with the Rietveld method, and previous work on this topic is typically only semi-quantitative. Previously, different methods have been investigated to identify and quantify the different lithium phases from one another with XRD [5,6,8,9,10], while FTIR is sometimes used as a complementary technique to identify spodumene [11,12,13].
The present work is motivated by the need for accurate characterisation and quantification of different lithium phases occurring during heat treatment of spodumene concentrates, as these phases have a direct impact on the production efficiency of battery-grade lithium precursors. In this work, spodumene samples were heat-treated at varying temperatures to transform spodumene between the α-β-γ phases and then characterised by two distinct methods: laboratory-based XRD and portable FTIR in order to assess the capability of these two techniques in identifying and quantifying the different spodumene phases.

2. Materials and Methods

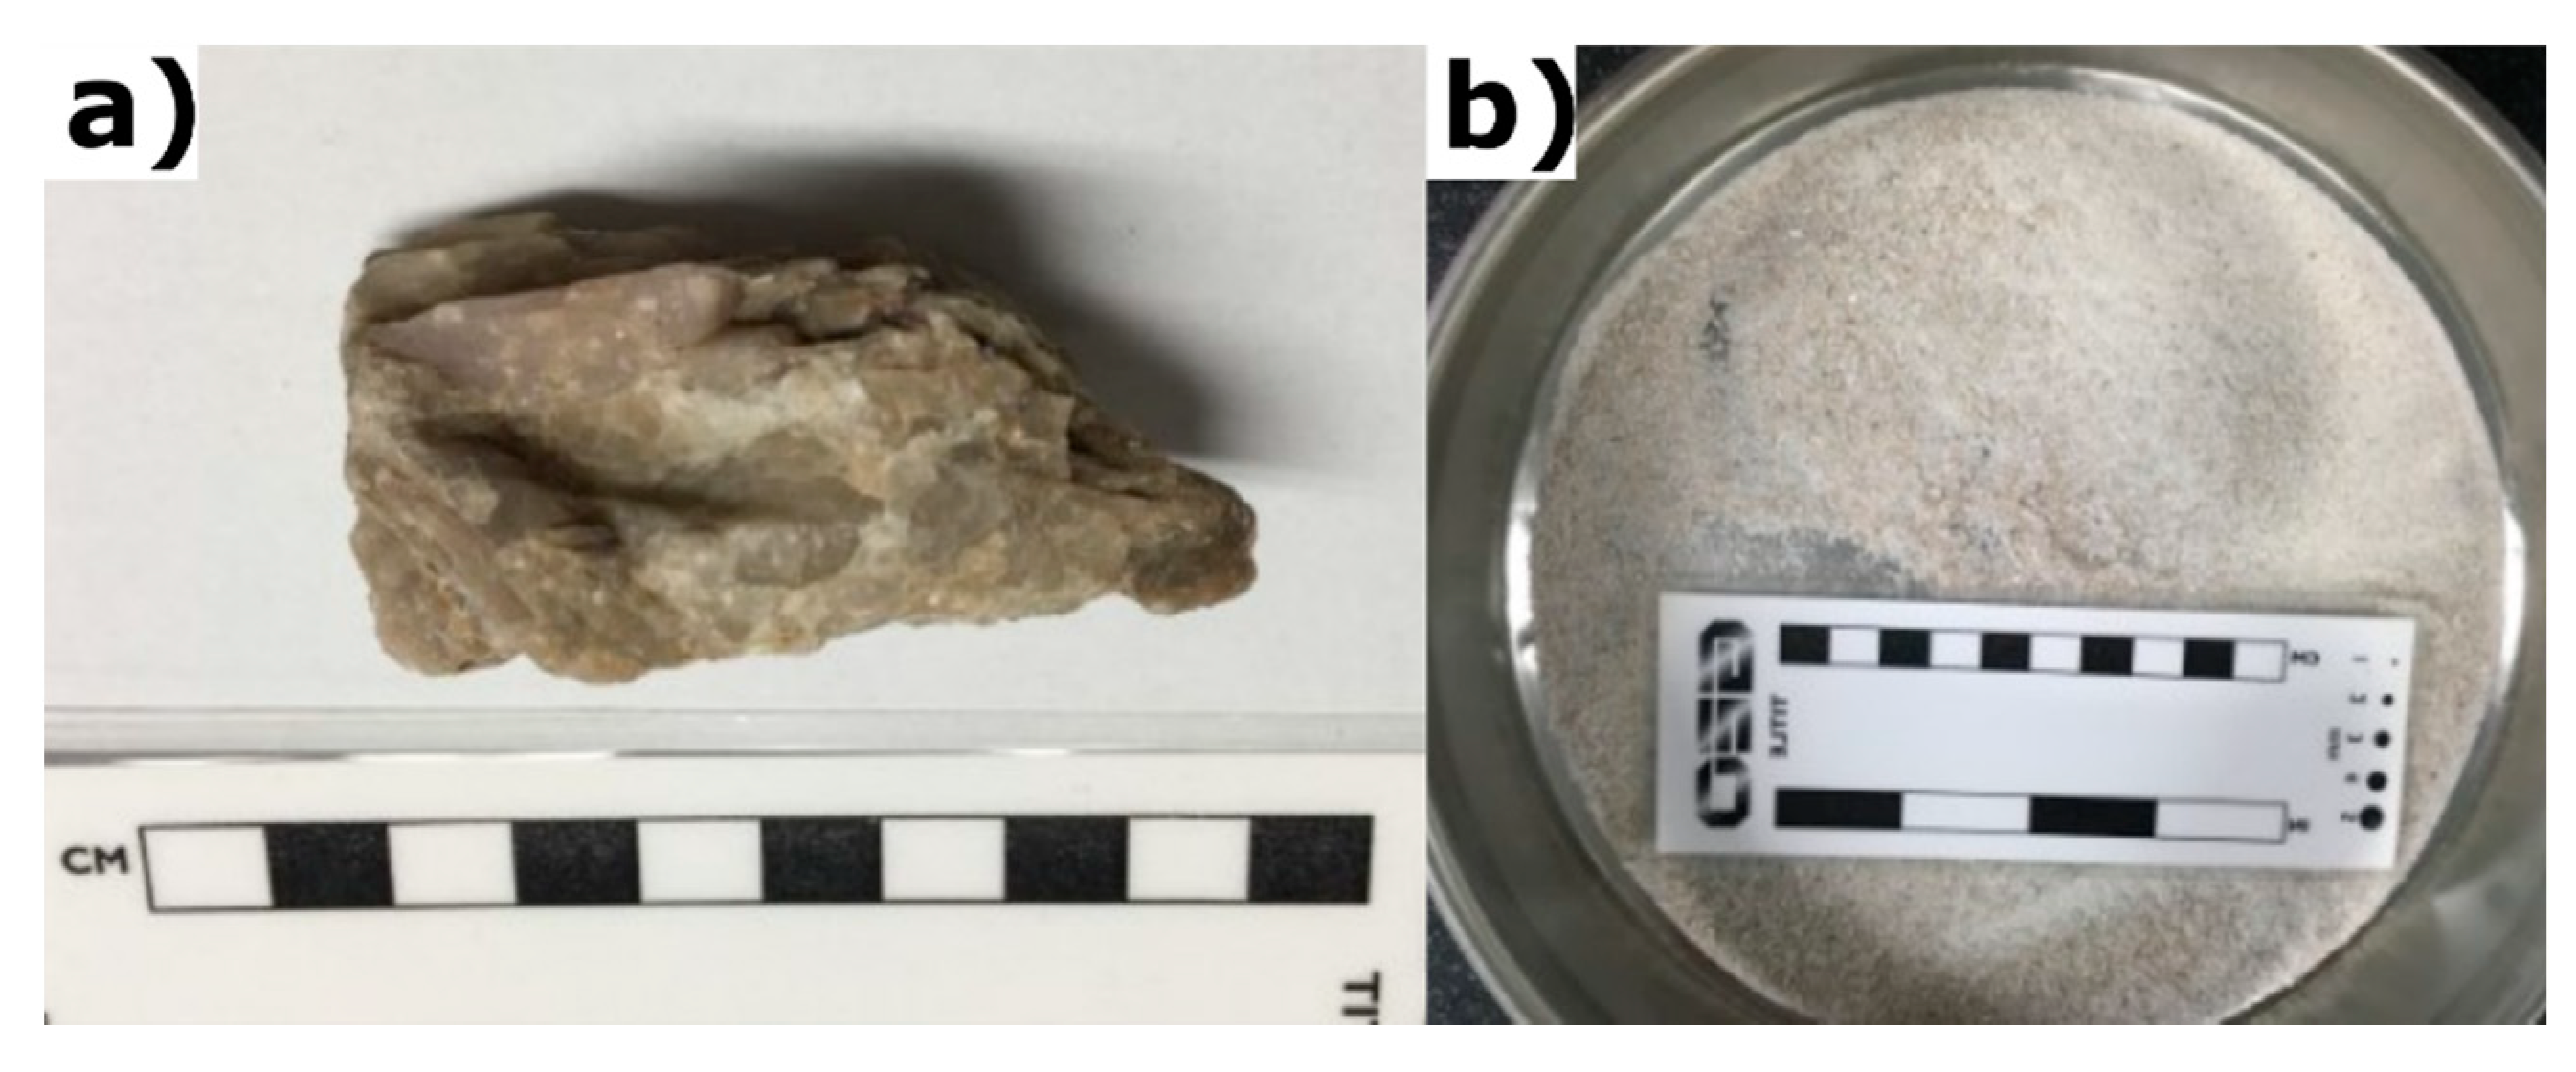
2.1. Sample Preparation

A lithium spodumene sample originating from Haapaluoma, Finland, was acquired from a commercial source. The sample was ground with a pestle and mortar and passed through a 1 mm sieve, as previous studies have shown this to be a preferred particle size range for a high conversion rate from α-spodumene to the other forms [6] (Figure 1). No separation of the gangue minerals was attempted. The sample was carefully quartered and five representative aliquots were obtained, weighing approximately 5 g each. One of these aliquots was then subject to analysis as a reference sample, while the four remaining aliquots were heat treated. After heat treatment, these samples were then cooled down in ambient conditions and analysed.
The composition of the lithium spodumene ore is shown in Table 1 and Table 2, as determined by inductively coupled plasma mass spectrometry (ICP-MS) with a Thermo ICAB RQICPMS and by inductively coupled plasma optical emission spectrometry (ICP-OES) with a Thermo ICAB 7200 at Origin Analytical Ltd., Welshpool, UK. For cross-validation of the ICP-MS and OES data, the sample was also analysed using X-ray fluorescence (XRF) with a Rigaku Supermini200 WD-XRF Spectrometer at X-ray Mineral Services Ltd., Colwyn Bay, UK. Li composition was determined with ICP-OES using the HF/HClO4 acid digestion method [14] at the University of Greenwich, UK.

2.2. Heat Treatment

The heat treatment process was performed in a Nabertherm LT15/12/B170 furnace at X-ray Mineral Services Ltd., Colwyn Bay, UK. Each split of the sample was heated at different temperatures (at 850 °C, 950 °C, 1050 °C and 1100 °C) for 30 min then cooled in ambient air before being analysed. These temperatures and holding time were selected as they were expected to give a wide range of different concentrations of α-β-γ spodumene for later analysis with XRD and FTIR; full conversion into β- spodumene or γ-spodumene was not in the focus of this work.

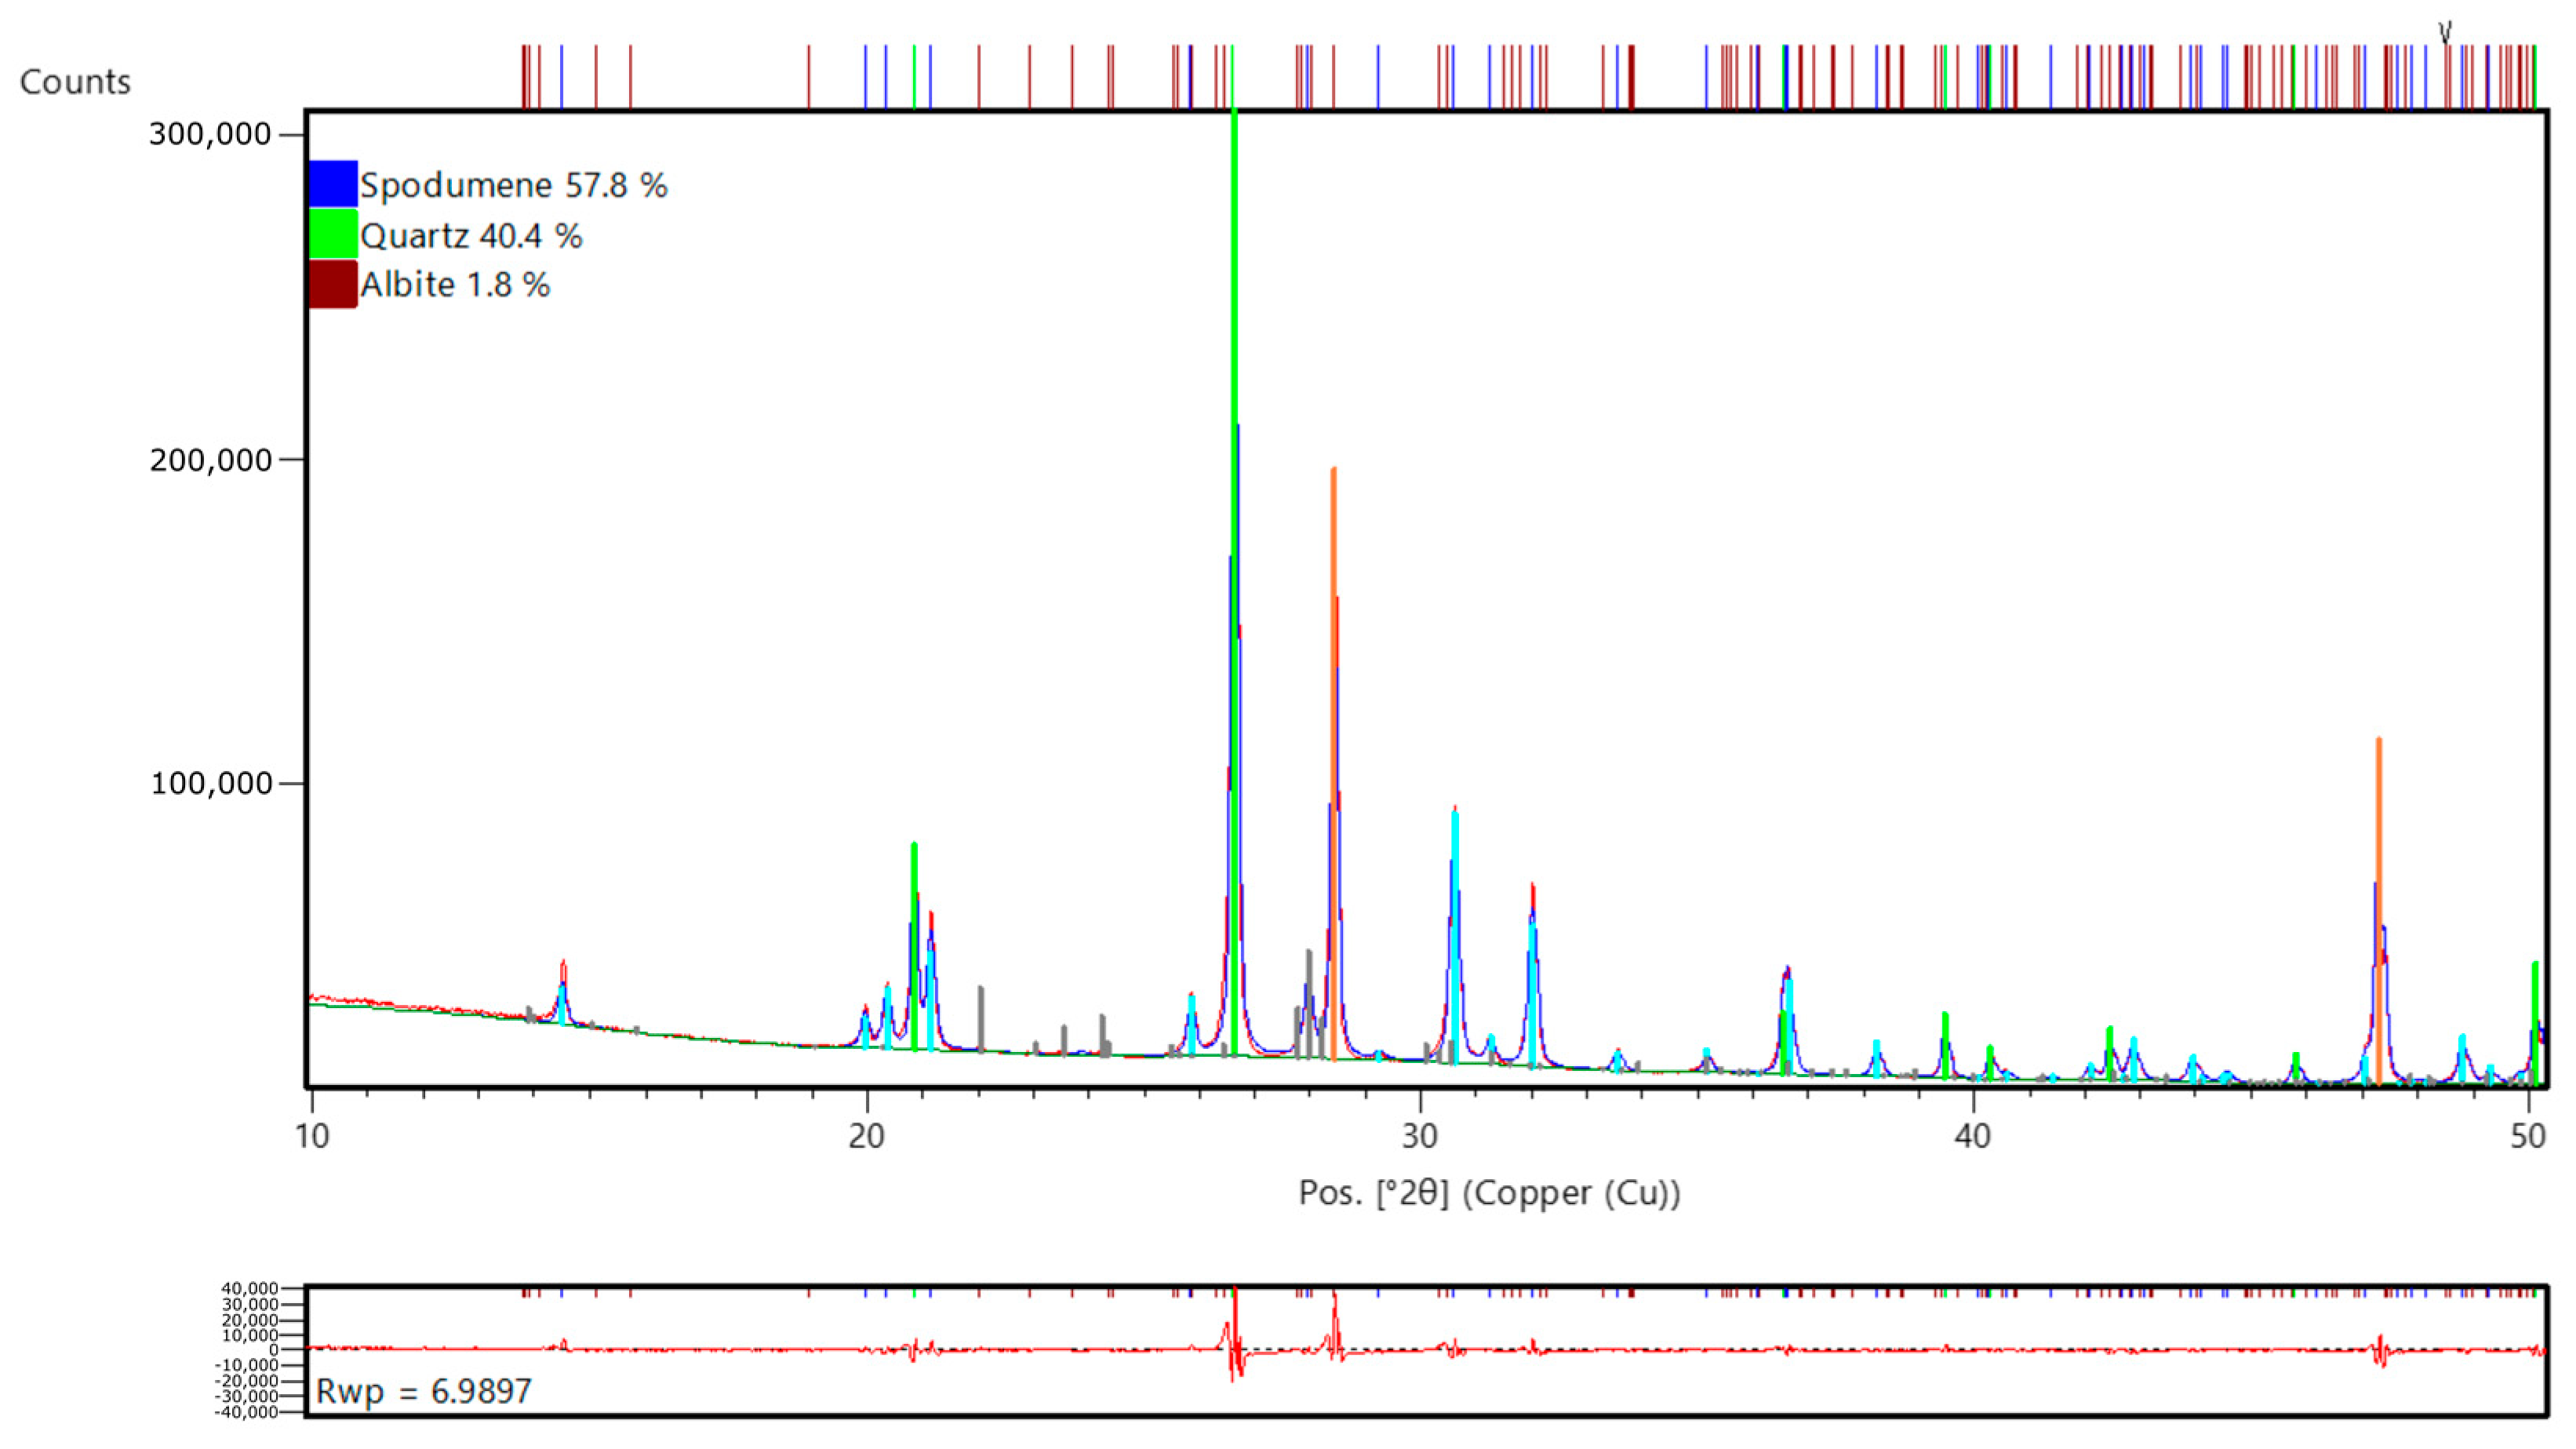
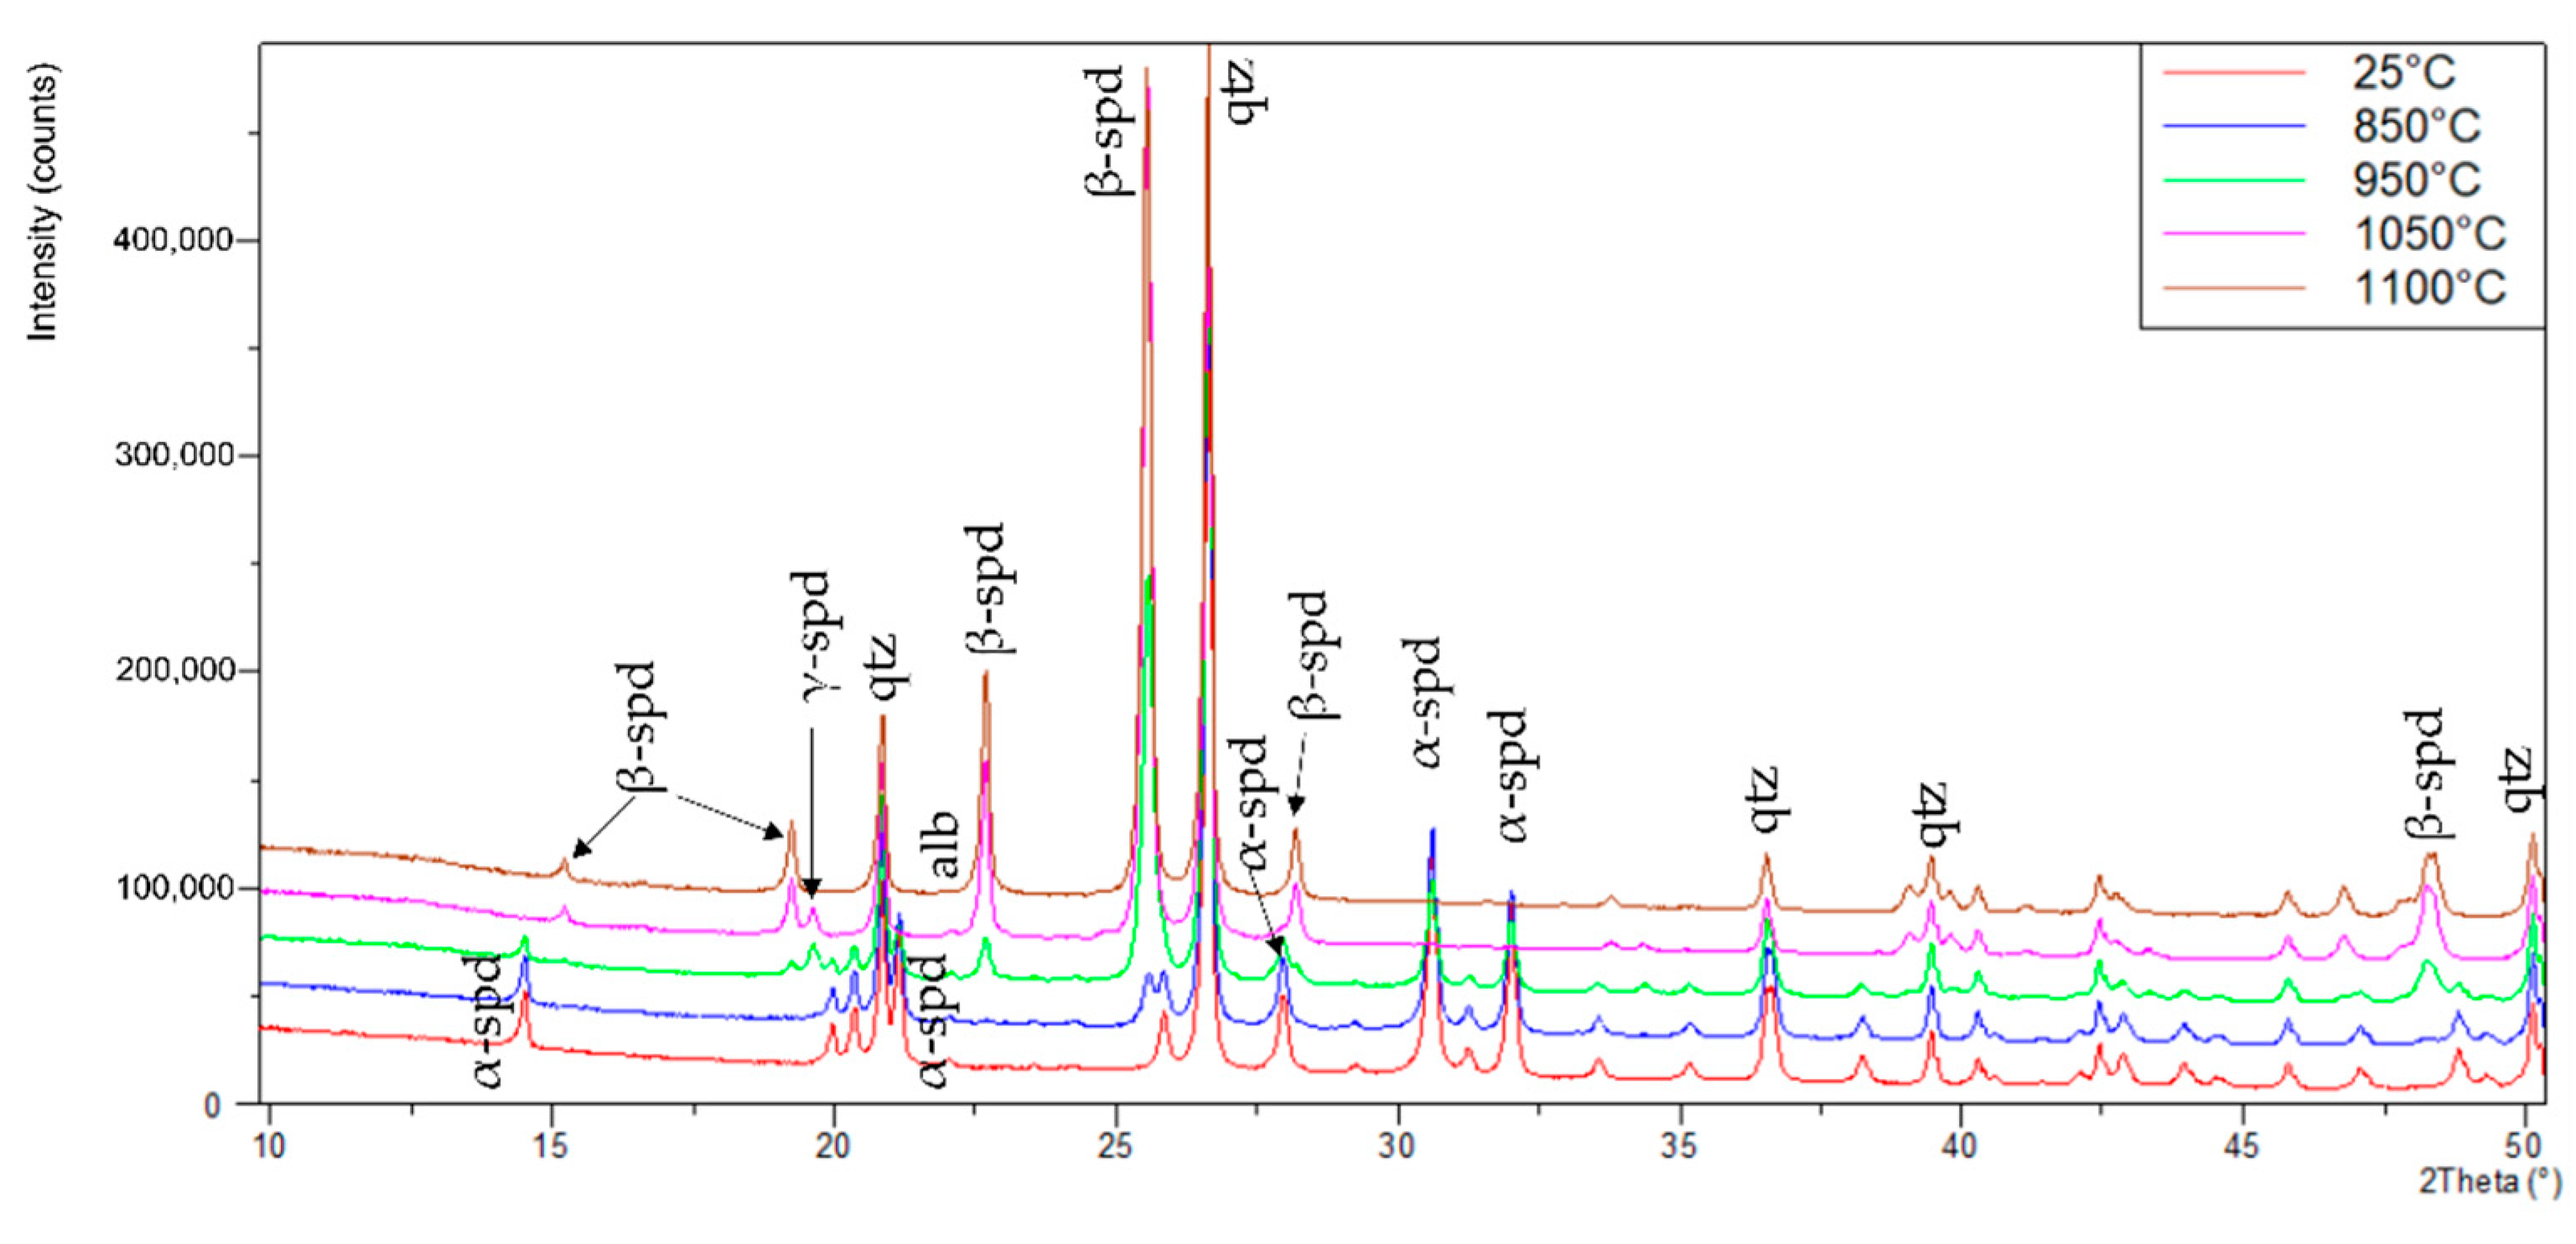
2.3. X-ray Diffraction (XRD)

Samples for XRD analysis were prepared and analysed at X-ray Mineral Services Ltd., Colwyn Bay, UK. Before XRD analysis, the samples were micronised in water, using a McCrone micronising mill, to obtain a powder with an average particle size of 5–10 µm. The slurry was dried overnight at 80 °C, re-crushed to a fine powder and back-packed into a steel sample holder, producing a randomly orientated sample for presentation to the X-ray beam. The samples were analysed before and after being spiked with a silicon crystalline powder, used as internal standard, for the determination of the amorphous content. If the samples have amorphous phases, the standard phase fraction would be overestimated and the crystalline phases recalculated to account for the amorphous content [X].
XRD analysis was then conducted with a Malvern Panalytical X’Pert3 diffractometer from 4.5 to 75° 2θ using a CuKα radiation at 40 kV and 40 mA. The samples were analysed for 60 min at a step size of 0.013.
Phase identification and quantification, using the Rietveld method, was carried out using HighScore Plus (v.4.9 by Malvern Panalytical) equipped with ICSD database and PDF-4 Minerals 2021 database at X-ray Mineral Services Ltd., Colwyn Bay, UK. The Rietveld method is based upon a full-pattern analysis where a computer model allows a theoretical diffractogram to be calculated for any phase mixture [14].

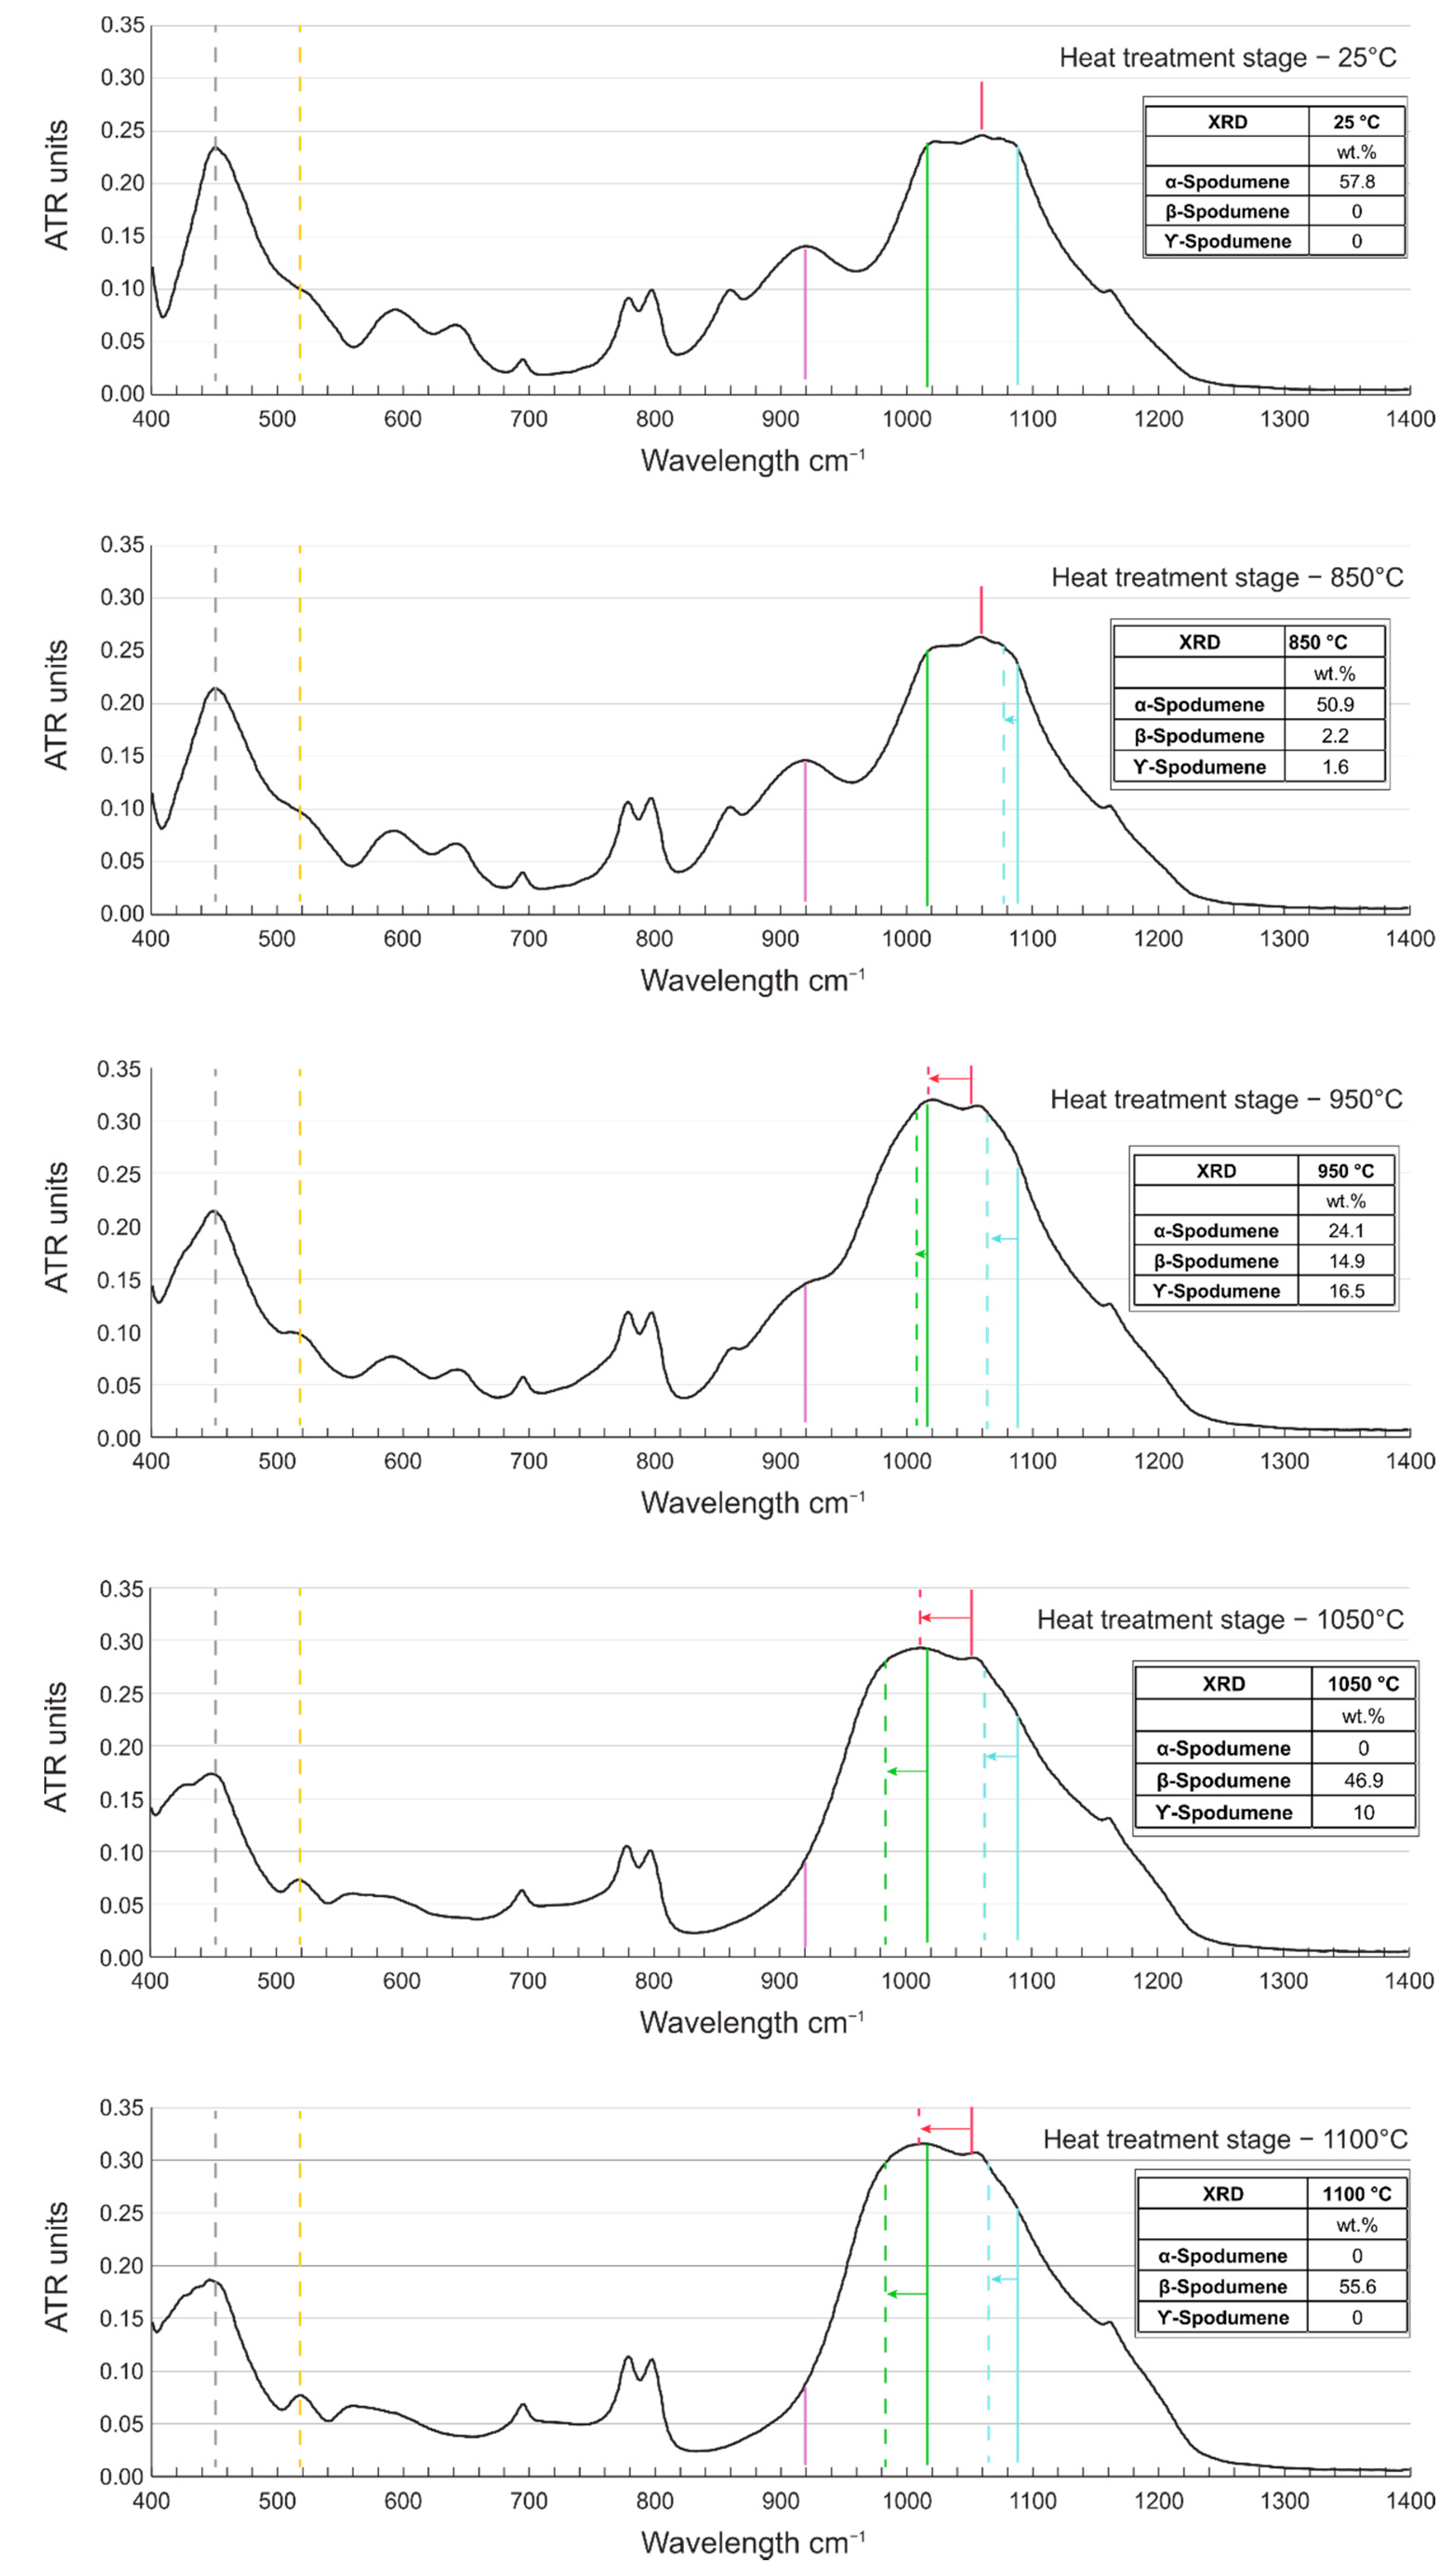
2.4. Fourier-Transform Infrared Spectroscopy (FTIR)

The sample powders analysed by XRD were also analysed by FTIR. The instrument used was a Bruker Alpha spectrometer with an attenuated total reflectance (ATR) module (FTIR-ATR), which simultaneously collects spectral data from a spectral range 4000 to 400 cm−1. The analysis and spectral output was typically completed within 1 min. The technique can be applied to very small samples c.0.1 g homogenised powder, while in this work, 0.5 g of powder was used for each sample and spectra were acquired in triplicate and averaged. The device is portable, weighing at ca. 7 kg with dimensions of 22 × 33 × 26 cm3 and can be deployed in the laboratory or in remote locations. Qualitative mineralogical data can be gathered from the raw spectra, or quantitative mineralogical data can be produced given enough complementary data, produced, e.g., with XRD, to produce a mineralogical model [15].

3. Results and Discussion

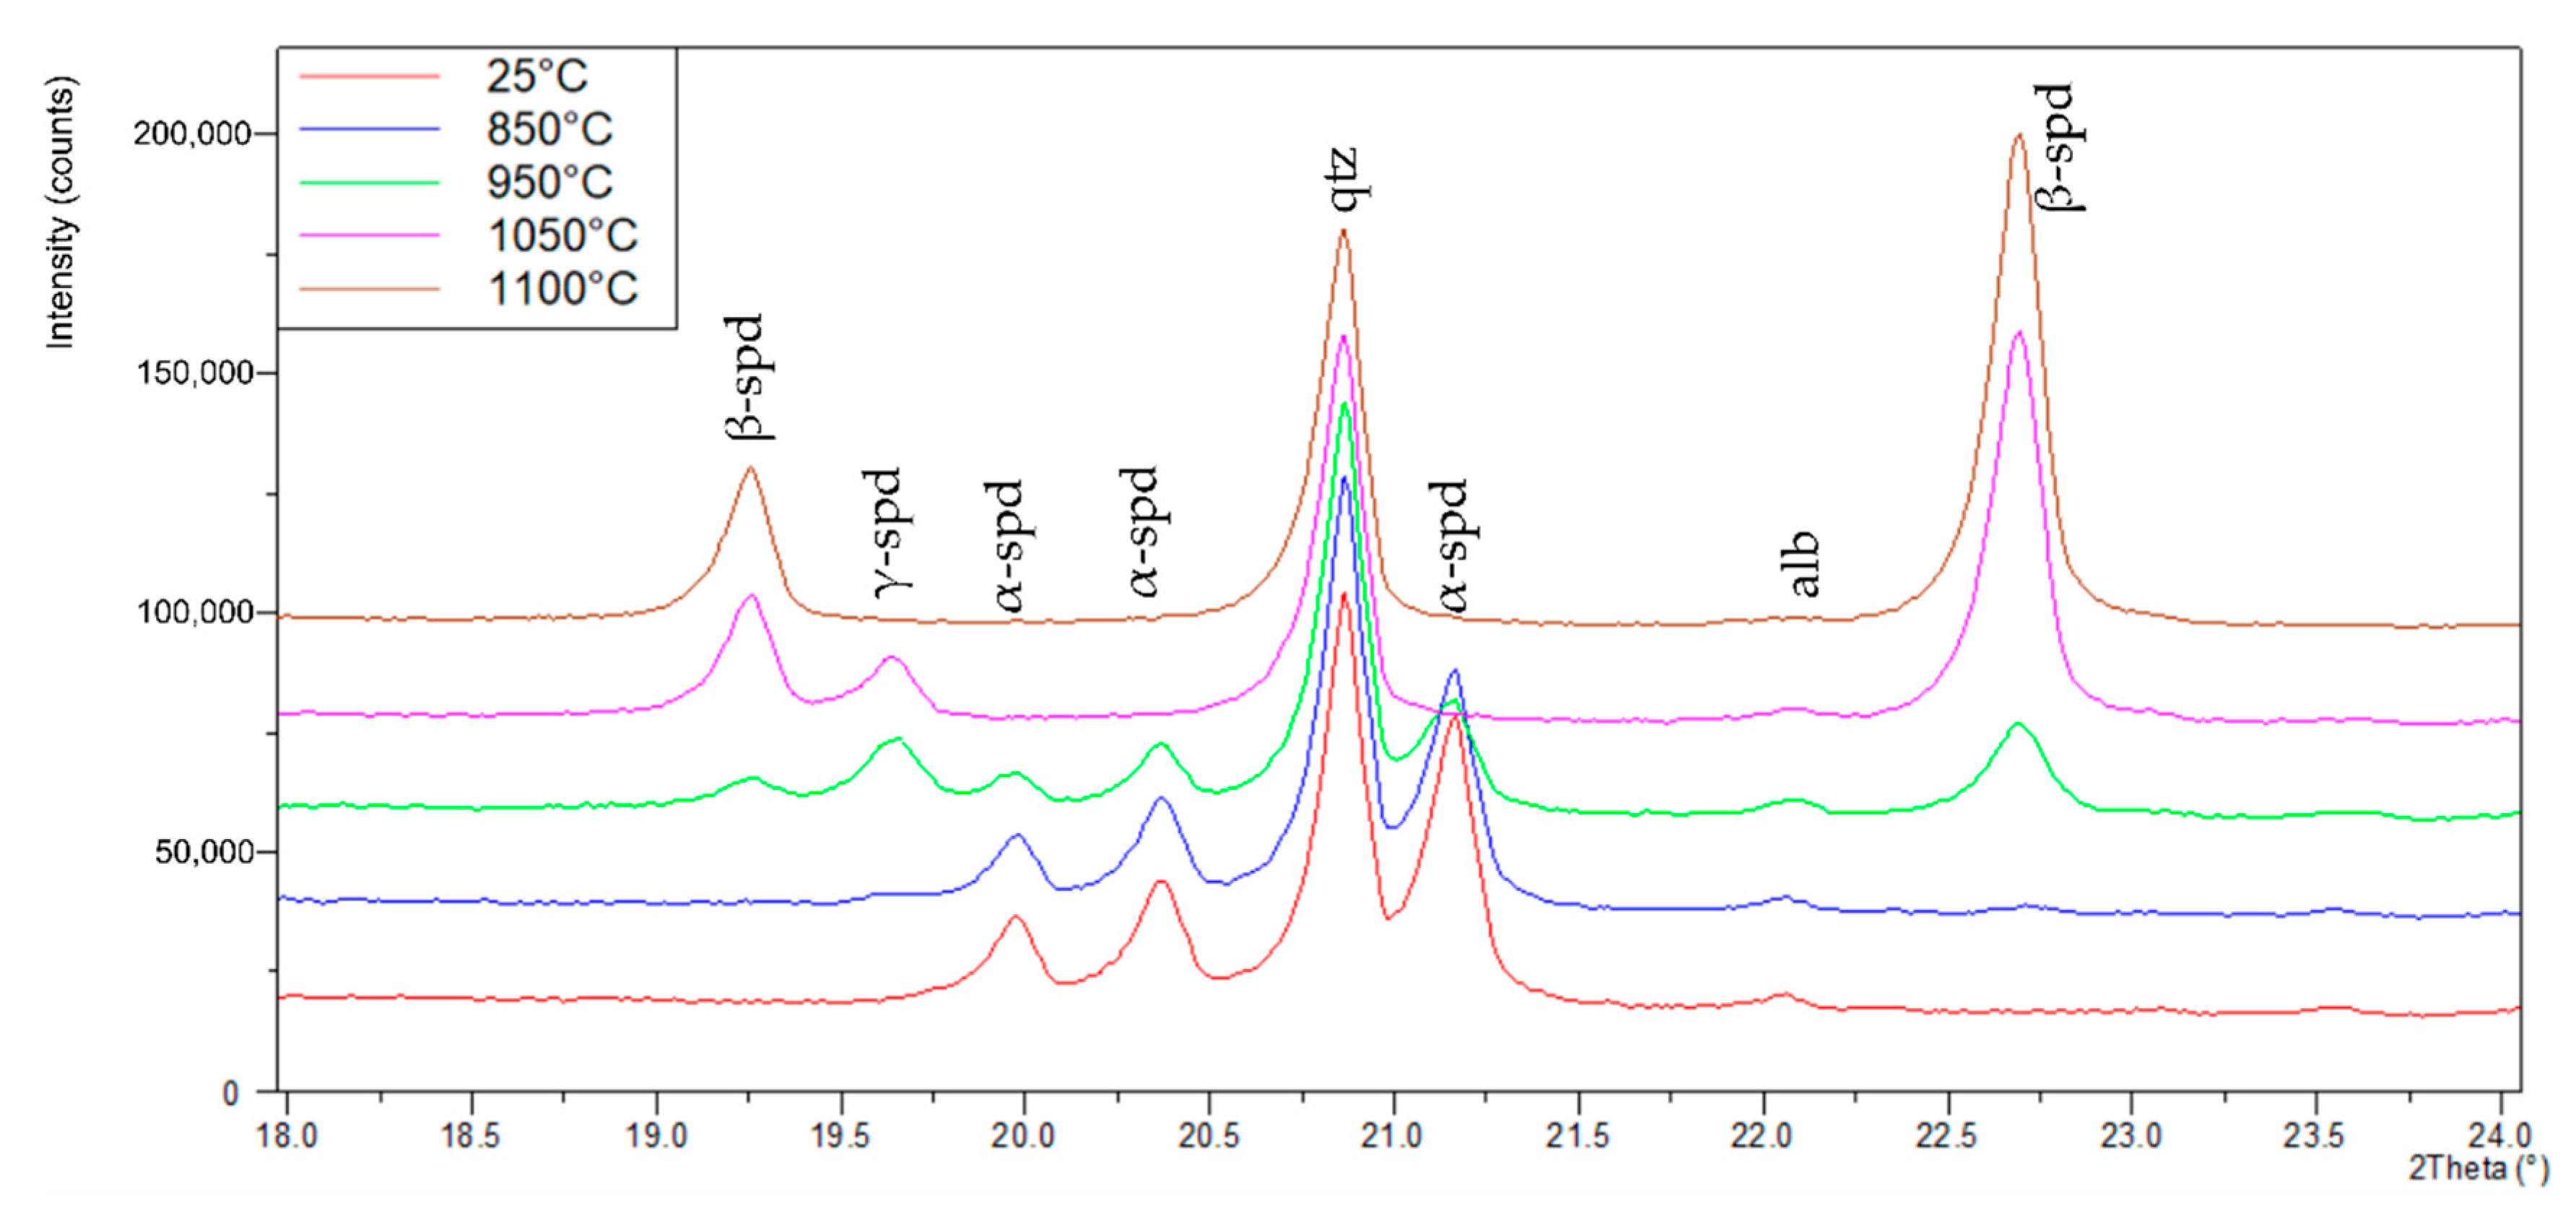
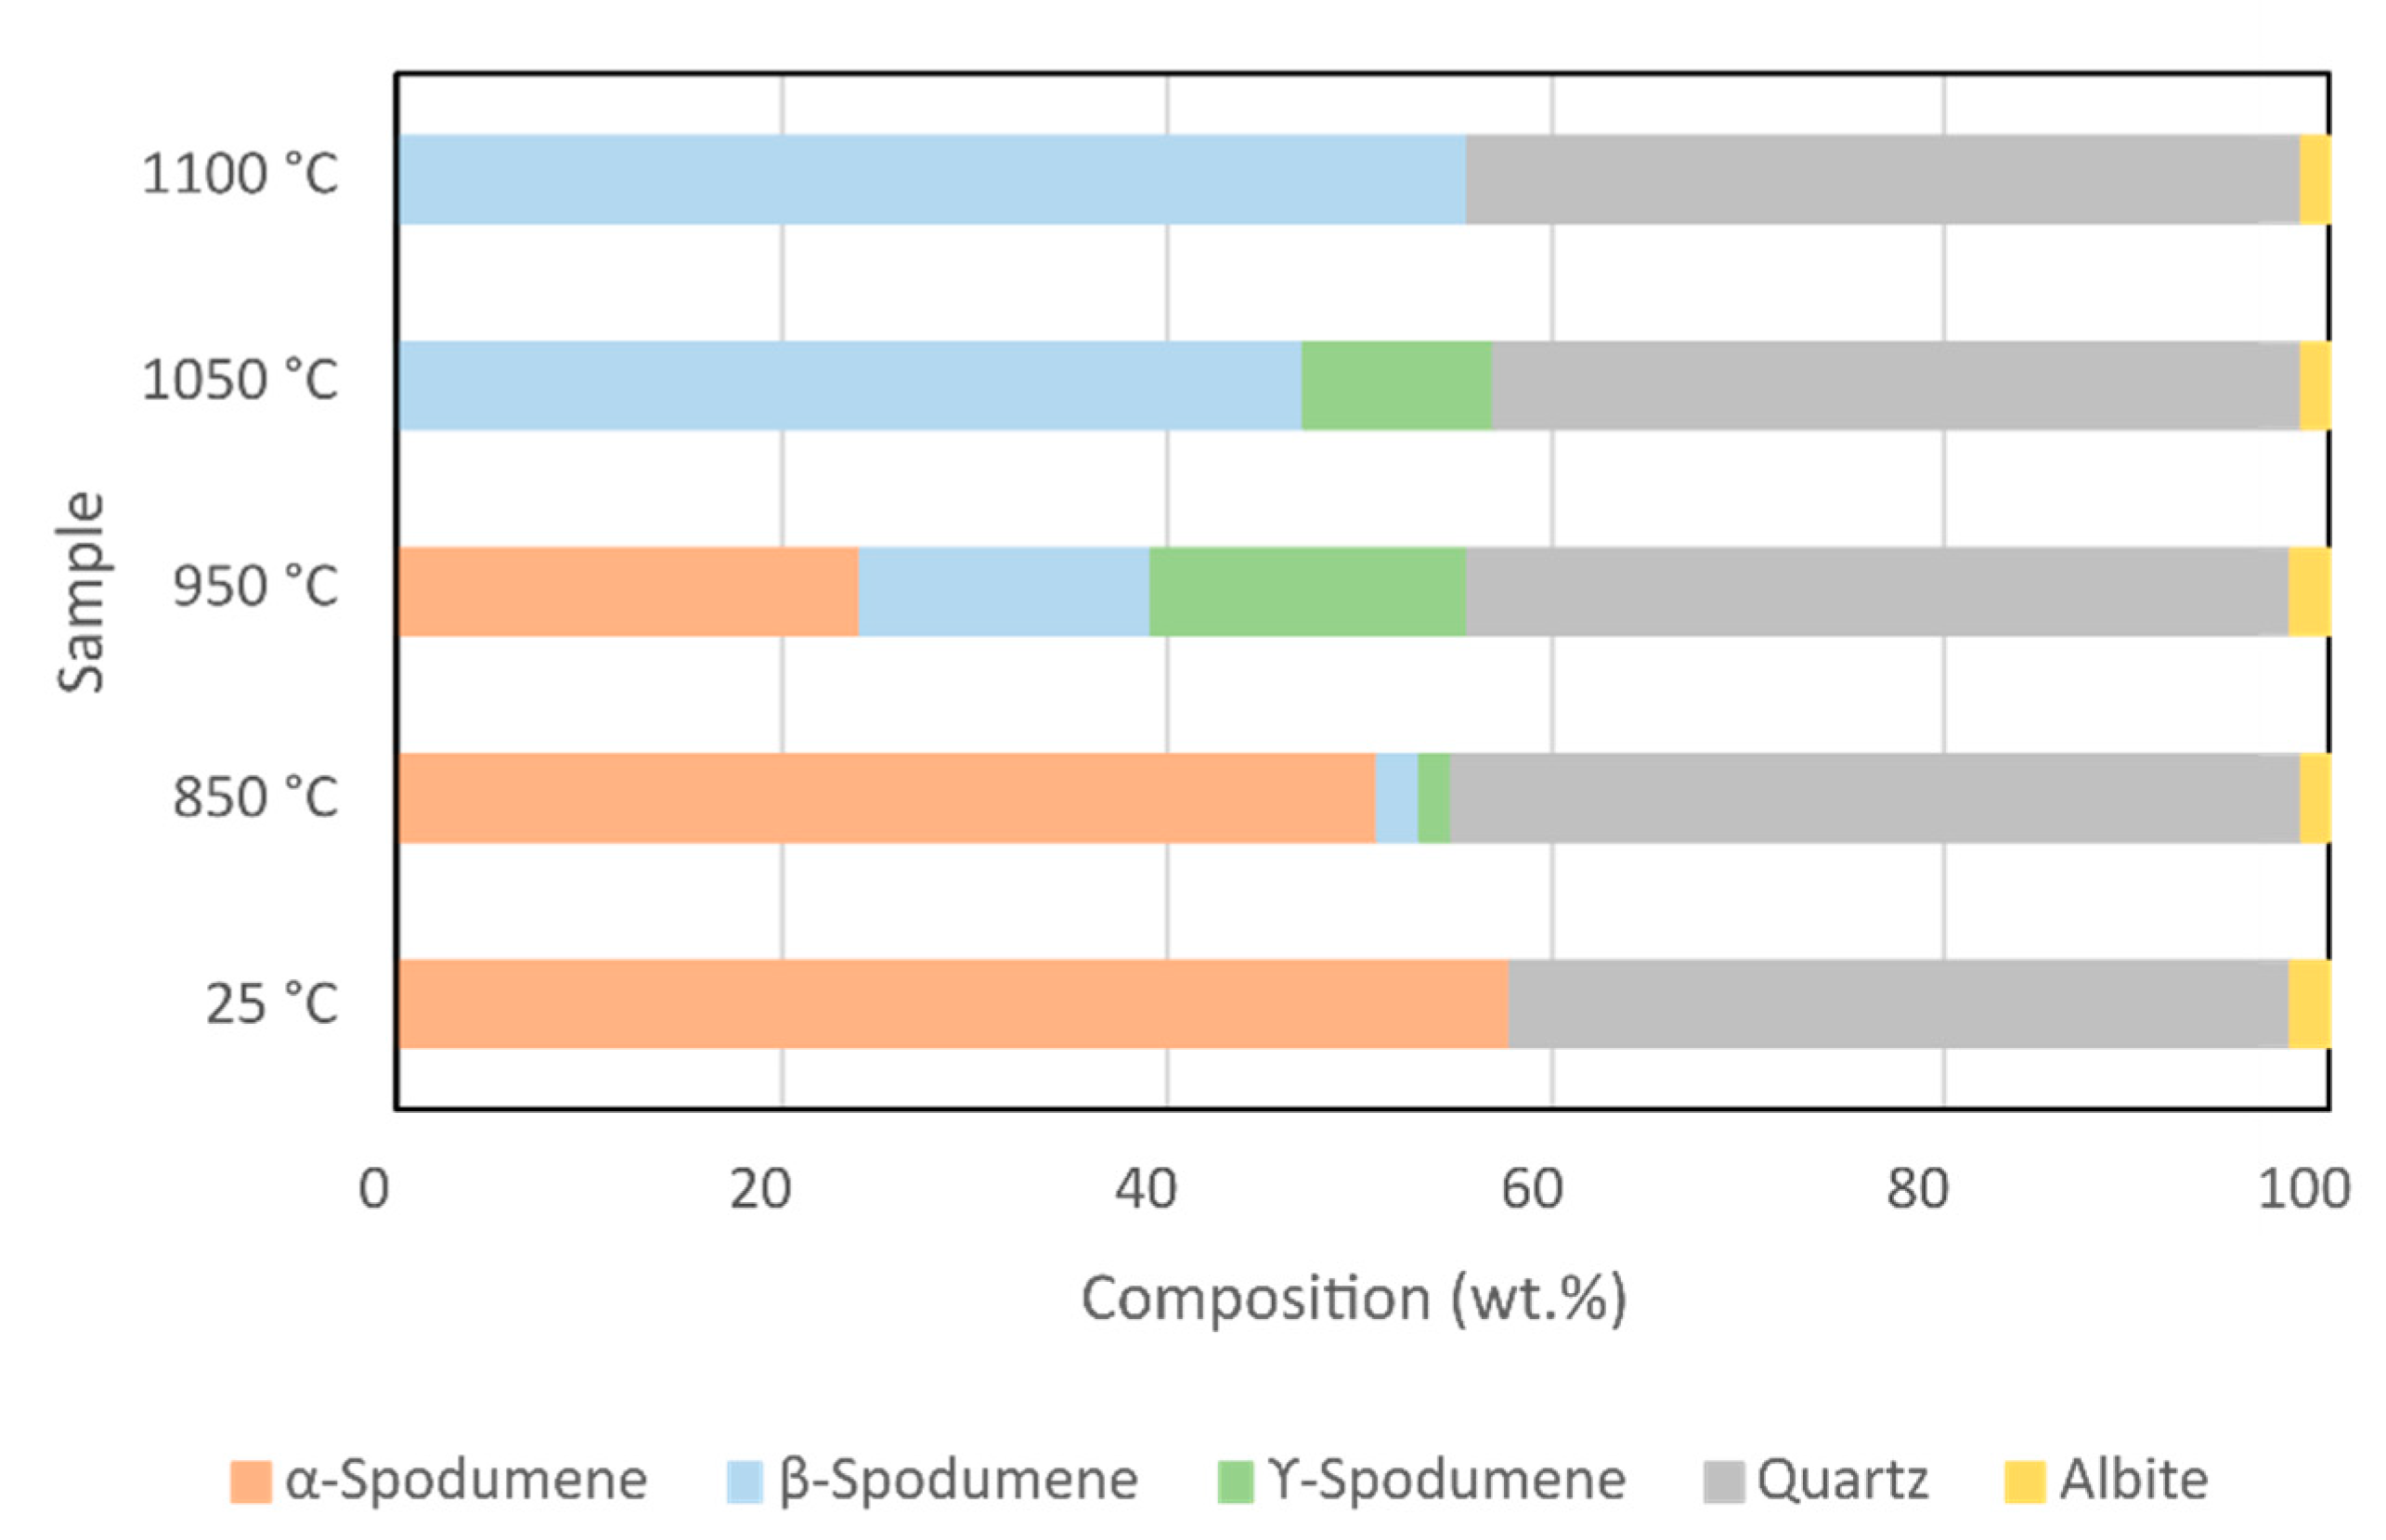
3.1. XRD Analysis of Spodumene

The reference sample (also referred to as sample 25 °C hereafter) consisted of α-spodumene, and quartz and albite as gangue minerals, Figure 2. Quantification of the spectra indicates that the sample consisted of 57.8% of α-spodumene, 40.4% quartz and 1.8% albite. Based on the literature, it is known that during heat treatment in a conventional furnace at 1 atm, conversion from the α-form to both γ- and β- forms begins to take place simultaneously at around 800 °C, albeit slowly. The γ-spodumene form is metastable and will transition to β- spodumene at higher temperatures with all the transitions occurring in the spodumene system being irreversible [7]. Higher conversion rates are observed at increasing temperatures [8] and full conversion into β-spodumene takes place around 1000–1100 °C at long enough heating times [5,6,10] from ca. 30 min to 2 h. The differences in phase transformations observed in different studies are likely related to differences in grain sizes, impurities, amount of amorphous material and different heat treatment techniques [16]. Under industrial heat treatment conditions, both γ- and β-spodumene appear simultaneously [5]. Conversion in the temperature range of 850–1100 °C for a holding time of 30 min was thus chosen for this study to provide a range of different compositions for identification and quantification with the XRD and FTIR techniques.
The X-ray diffraction patterns from the heat treatment compared with the reference sample are shown in Figure 3. As noted earlier, due to extensive peak overlap in the overall spectra, peak identification between different forms of spodumene is problematic and, especially small concentrations (in the range of few wt.%), β- and γ-spodumene are often indistinguishable [5]. For this reason, a specific smaller range between 18–24° 2θ is shown with annotated peaks for clarity in Figure 4.
The conversion from α-spodumene is clearly noticeable on the 850 °C sample. Phase transformation towards γ- and β-spodumene is apparent as the intensity of the α-form peaks begin to decrease, while the γ-peak begins to appear at ca. 19.66° 2θ (4.51Å) and β-peak at ca. 19.26° and 22.70° 2θ (4.60Å and 3.91Å respectively). The conversion at 850 °C occurs slowly as the amount of α-spodumene here is ca. 7 wt.% lower than in the reference sample with near equal amounts of β-and γ-polymorphs (1.6–2.2 wt.%). A significantly faster conversion rate can be observed on the sample treated at 950 °C as here the amount of α-spodumene has decreased to 24.1%, while the amount of β-and γ-polymorphs has increased to 14.9–16.5 wt.% during 30 min of heat treatment. At 1050 °C all the α-spodumene has been converted, mostly to β-spodumene at 46.9 wt.% with 10.0 wt.% γ-spodumene present. At 1100 °C full conversion has been achieved and only β-spodumene can be seen together with the gangue minerals. These results are well in line with previous reports on the conversion process [5,6,8] while also successfully quantifying the gangue minerals, which are often not reported. Figure 5 and Table 3 summarise these key findings of quantification with the Rietveld method. The possible amorphous content was also studied by using the internal standard method and no amorphous content was detected. The verification of amorphous content in the material is highly important as the XRD technique can only identify crystalline material and, thus, the amorphous content will directly influence the accuracy of quantification results.
The accuracy of the phase quantification with the Rietveld method has been verified using a mass balance calculation. Simplified mineral formulas were used to calculate bulk chemical composition from modal mineral abundances obtained by XRD. This data was compared with the chemical composition of the same sample acquired by ICP-OES analysis (Table 1). There is a good correlation between the calculated chemical composition from XRD and the effective chemical composition by ICP-OES, highlighting the quality of the XRD results. For example, the spodumene content obtained with Rietveld of the reference sample is 57.8%, while the normative amount of spodumene calculated from ICP analysis is 59.7%. This suggests that the error in the quantification of total spodumene should be within 2% absolute error. Results within 3% absolute error are generally considered accurate for typical natural rock samples [17]. Another way to estimate the quality of the XRD results is by checking the Rwp parameter obtained with the Rietveld method to detect any fit errors. Rwp is the weighted profile residual for the reference sample Rwp was 6.99%, while for the heat treatment samples it varies from 6.82% to 7.13%. Typical values of Rwp range from a few percent to 20–30% for a good refinement, depending on the count times, the degree of preferred orientation and the number of variable parameters [18]. Based on the observed Rwp values of the XRD spectra fitting, the visual convergence between the observed pattern and calculated pattern, as well as the observed 2% absolute error in quantification it can be concluded that the analytical procedure employed was accurate for the scope of this work.

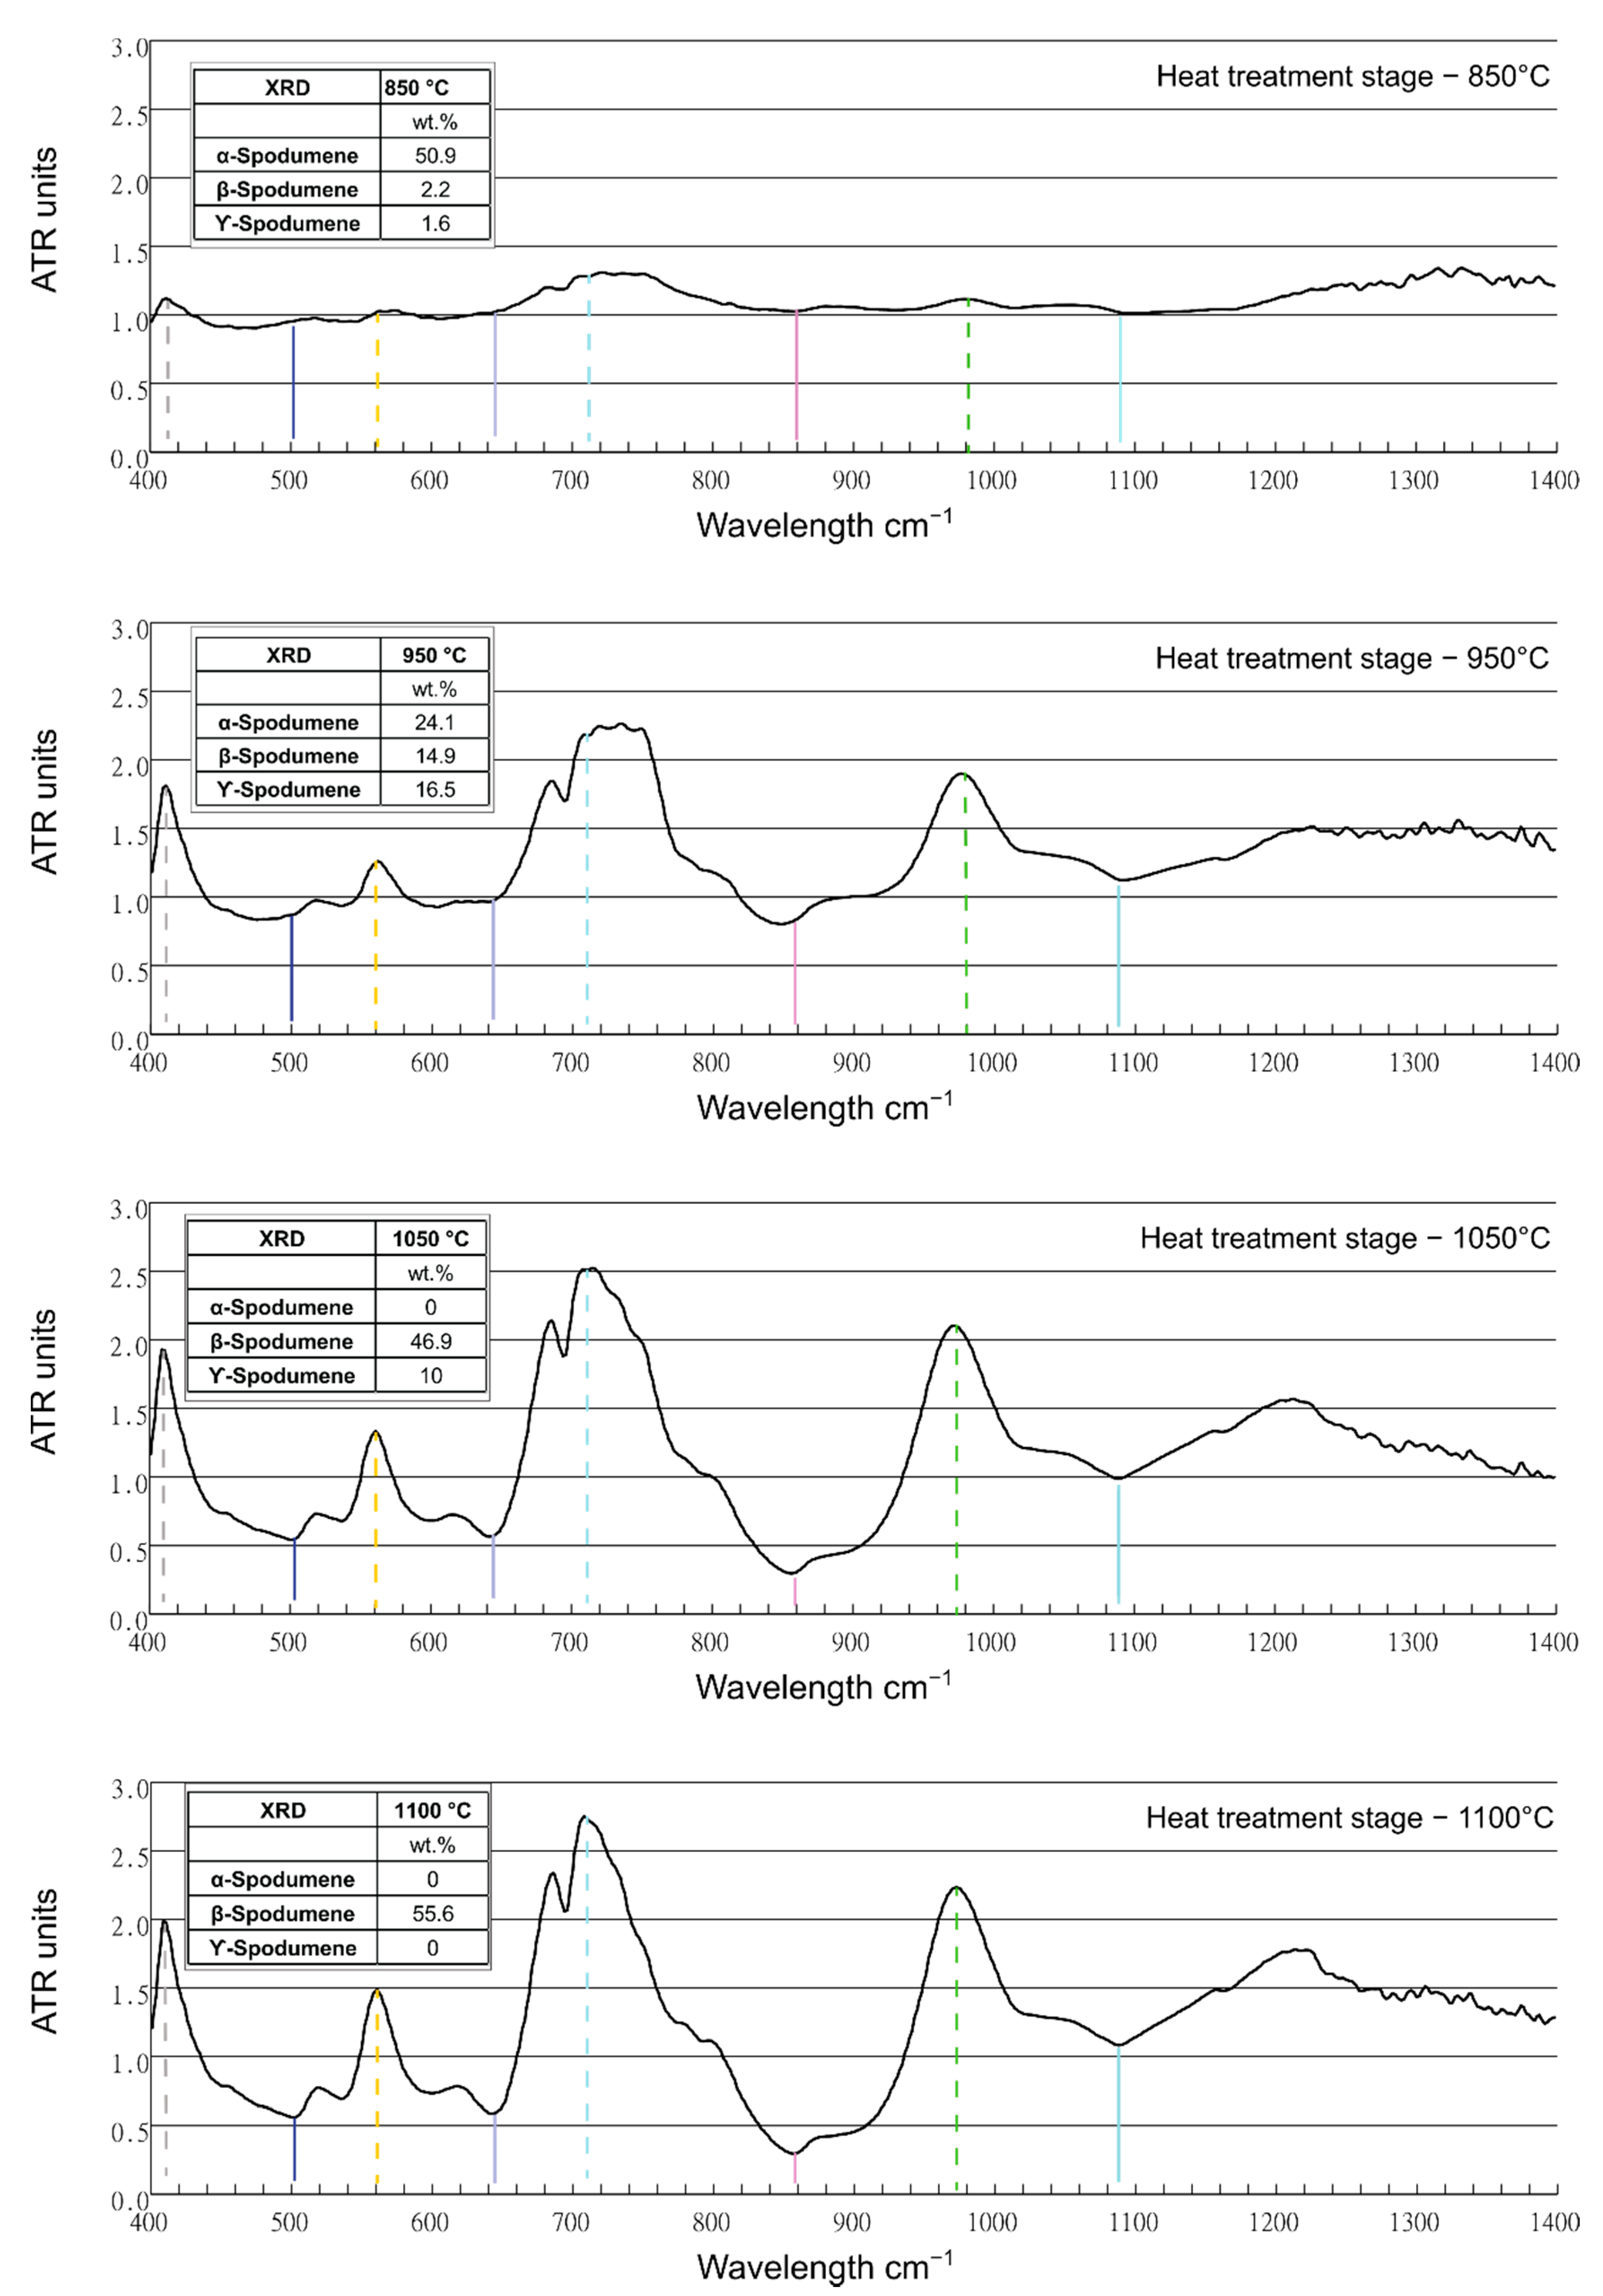
3.2. FTIR Analysis of Spodumene

Although accurate mineralogical data can be acquired using XRD, this work also investigates the potential of using Fourier transform infrared spectroscopy (FTIR) as an alternative tool for the characterisation of spodumene mineralogy. While the XRD technique is a state-of-the-art laboratory technique capable of highly accurate detection of different spodumene phases and providing data for quantification, in geological applications the FTIR technique is a portable method commonly used in the laboratory or in field work to provide an understanding of sample mineralogy in significantly faster timescales and minimal sample preparation [19,20]. Typical FTIR analysis is completed within 1 min, while accurate XRD spectra in this work required 1 h of scan time. For quantification of the complex spectra produced by FTIR other complementary methods are required to build accurate mineralogical models, such as quantitative XRD or automated mineralogy [15,19,21,22].
To date, the literature on FTIR analysis on heat-treated forms of lithium spodumene is lacking and the method is typically utilised complementary to other techniques [11,12,13]. The interpretation of results in this work partly relies on the mineralogical analysis from Section 3.1. Untreated FTIR spectra from all the samples in the region of 400–1200 cm−1 are shown in Figure 6, with highlights on the main relevant peak positions. Higher wavelengths were left out from the presented spectra as they do not include information on the mineralogy of spodumene samples. In Table 4, all vibrating bands were tabulated, with ATR units given, when possible, along with a mineral phase assignment together with the quantitative XRD results.
From the XRD analysis, it is known that the mineralogy of the reference sample (25 °C) is characterised by α-spodumene, quartz and albite. The FTIR spectra of the reference sample displays a prominent peak at 1054 cm−1 with notable peaks appearing around 919, 786 and 450 cm−1. The spectral fingerprint of the samples in the ranges of ca. 1000–1200 cm−1 and 760–790 cm−1 is expected to relate to the asymmetric and symmetric stretching of the Si-O-Si bands, while the peak around 450 cm−1 corresponds to bending vibrations of the same bands [11,12,23,24,25,26].
At 850 °C, minor changes in mineralogy are manifested in the FTIR spectra (Figure 6). The XRD data (Table 4) confirmed that the spodumene conversion begins at 850 °C with a few % of both β-spodumene and γ-spodumene appearing. The size of the peak around 1060 cm−1 increases slightly to 0.263 ATR Units, but the broad peak position narrows slightly with the peak shoulder moving from 1090 to 1078 cm−1. Meanwhile, the peak at 919 cm−1 remains unchanged. At 25 °C, the peak at 450 cm−1 is well defined with ATR units of 0.234 (Table 4), but the peak decreases slightly to 0.215 ATR units at 850 °C. No peak is seen at 518 cm−1 as this is overlapped by the shoulder of the 450 cm−1 peak.
The 950 °C sample is marked by a sharp reduction in α-spodumene (24%) and the proportion of β-spodumene and γ-spodumene have increased (14.9 and 16.5%, respectively). At this temperature, the FTIR spectra begins to show more distinct differences and the broad Si-O peak increases to 0.320 ATR Units and the peak maxima shifts to 1020 cm−1. In addition, the shoulders of the peak also shift to shorter wavelengths, moving 1010 to 1064 cm−1 (Figure 6). The peak at 919 cm−1 is reduced and overlapped by the shoulder of the Si-O bond peak and is completely removed from samples treated at higher temperatures (1050 °C and 1100 °C). Notably, at 950 °C, the peak at 450 cm−1 remains at a similar height (0.214 ATR Units as developed at 850 °C). A minor peak is seen at 518 cm−1, although it appears as a shoulder of the 450 cm−1 peak.
At 1050 °C α-spodumene is absent and β-spodumene is the dominant form at 46.9% with a subordinate amount of γ-spodumene left (10%). However, at 1050 °C, the peak at 450 cm−1 displays a significant decline, dropping from 0.214 ATR Units at 950 °C to 0.173 at 1050 °C (Table 4). Notably, the broad Si-O peak is diminished slightly to 0.293 ATR Units, but the peak maxima have shifted further and now lies at 1011 cm−1. A minor peak is resolved at 518 cm−1 with 0.173 ATR Units (Figure 6).
At 1100 °C α-spodumene and γ-spodumene are absent and only β-spodumene remains (55.6%). Overall, the spectrum is similar to that at 1050°C with a peak maxima to 1011, with slightly higher 0.316 ATR Units. The peaks at 450 and 518 cm−1 are resolved with values of 0.185 and 0.077 ATR Units, respectively.
To summarise, modifications in the FTIR spectrum clearly correlate with the mineralogical changes detected by XRD for each heat treatment stage (Table 4). Notably, the 450 cm−1 peak decreases in magnitude with heating, particularly above 1050 °C at the point where the proportion of β-spodumene increases dramatically. In addition, the peak at 518 cm−1 also becomes resolved above 1050 °C. At 950 °C, the main Si-O peak shifts significantly with the emergence of small amounts of β-spodumene and γ-spodumene. In addition, the 919 cm−1 peak is overlapped by the Si-O shifted peak. This peak shifts further (1020 cm−1), corresponding to the sharp increase in β-spodumene at 1050 °C. Significantly, at 1100 °C, γ-spodumene is lost and the 1020 cm−1 peak increases in magnitude.
The FTIR data was also interpreted in a more qualitative way, so that a more fundamental understanding is acquired regarding the structural changes (α-) spodumene underwent during the heating experiments. For that purpose, in Figure S1 (Supplementary Material), a series of spectra were plotted for the appropriate comparisons made. As the XRD analysis above showed an assemblage of spodumene, quartz, and albite, nominal spectra of these phases were taken from the RRUF database. Along with these, spodumene (LiAlSi2O6) and leucite (KAlSi2O6) are also shown, which belong to the same mineral group, too. Regarding the spodumene spectra of this study, the spectra of α-spodumene (25 °C sample), the sample with most γ-spodumene (950 °C sample) and β-spodumene (1100 °C sample) were also plotted with an offset. Further to the above analysis already given, bands of interest were the 518 and 555 cm−1. While 518 cm−1 for α- and γ-spodumene seem to be a shoulder, for the β-spodumene, this appears more distinctively. At the same time, a shoulder at 555 cm−1 appears when the β-spodumene is in abundance in the heated samples (1050 and 1100 °C). The 593 cm−1 remains also as a shoulder for the β-spodumene rich sample while the peak at 645 cm−1 seems to disappear at 1050 °C. The two peaks around 800 cm−1 were strongly associated with the high % of quartz present in the sample with no significant changes in intensity and wavenumber position. Probably, the most distinctive changes of the α-spodumene to β-spodumene in this work were taking place at the wavenumbers of 860 and 919 cm−1. Previous calculations have suggested this wavenumber area as distinctive for α- to γ- to β-spodumene transformation [28]. As the Al octahedra in the α-spodumene changes coordination to tetrahedra in β-spodumene, the interaction length of Al-tetrahedra and Si-tetrahedra, in the fashion of Al-O-Si, increases significantly, being the most energetically stable [28]. That being the case, Al-tetrahedra will vibrate in higher wavenumbers (970–1020 cm−1, Table 4). The 1072 cm−1 can be associated with Si-O-Si stretching structures in the different phases of spodumene, with slight changes at the high temperature samples, while the 1060 and 1163 cm−1 can be attributed to quartz vibration. There are minor changes for the band 1085 cm−1 which is shouldering for the β-spodumene phase. The reason that leucite was selected for comparison in Figure S1, apart from being very similar to spodumene, in structure and chemical composition, is also previous work [29] where a Li-recovery mechanism was suggested at a temperature range of 850–890 °C. The rationale of this comparison is that in order the spodumene to be able to accommodate potassium instead of lithium, it has to acquire a leucite structure, the product of the reaction associated to an alternative Li-recovery mechanism suggested previously [29]. Three wavenumber regions, depicted here, could potentially be linked to spodumene structural changes towards a leucite-like structure; 420–450 cm−1, 518 cm−1 and 970–1020 cm−1. While the two first regions are more difficult to directly associate with the leucite, the third is more prominent, coinciding with the previous density functional theory work [28]. These structural changes demonstrated so far, are further discussed below.
To further investigate the differences in FTIR spectra and clarify differences between the different samples, the FTIR spectra from heat-treated samples were also plotted in an innovative way, being normalised to the sample at 25 °C, shown in Figure 7. In this way, the changes occurring on the spectra from the conversion of α-spodumene to β-spodumene and γ-spodumene can be highlighted more easily. This approach clearly demonstrates that the sample heat-treated at 850 °C displays only minor spectral modification compared with the reference sample. However, further heat-treatment reveals a distinctive new spectral fingerprint emerging based a series of distinctive peaks at 410, 560, 705, 975 cm−1 and troughs (505, 645, 858, 1090 cm−1) in the spectral fingerprint for 1100 °C. Interestingly, all above peaks, annotated in Figure 7, coincide well with the main leucite features discussed in the previous Section and shown in Figure S1. Especially, the peak at 705 cm−1 does not appear on Figure 6 and Figure S1, while on the normalised spectra in Figure 7, it is well represented.
This initial modelling on FTIR data suggests that these spectral changes could also be used in the future to develop a semi-quantitative mineral model to determine overall spodumene content and to differentiate the proportions of α-spodumene, β-spodumene and γ-spodumene and gangue minerals (chiefly quartz and feldspar) by cross-validation with XRD results. Further work on this topic should focus on the development of a robust quantification model of different spodumene forms with a significantly larger number of samples to provide statistical relevance to the model. It is envisioned that this type of analytical tool would find use in the lithium extraction industry, e.g., in the grading of spodumene ore and quality control of heat-treated lithium concentrates.

4. Conclusions

The α- spodumene to β- spodumene conversion process by heat treatment is highly important for the lithium extraction industry as it forms the basis for lithium processing from spodumene. Reliable identification and quantification between different lithium forms occurring during heat treatment is thus of major importance to decrease losses during processing. This work highlights the use of laboratory-based X-ray diffraction and portable Fourier transformation infrared spectroscopy techniques in the characterisation and quantification of different lithium spodumene forms and gangue minerals. The applicability of X-ray diffraction coupled with the Rietveld method in accurate characterisation and quantification of different lithium spodumene polymorphs at suitable analytical conditions are presented. The complete crystalline status of the starting material was verified with the Rietveld method using the internal standard method. The quantification of the minerals in the reference sample was verified using a mass balance calculation and it is estimated that the absolute error in the quantification of the minerals is within 2%.
The lithium spodumene specimen was ground into five aliquots of which four were heat-treated at temperatures between 850 and 1100 °C in a furnace at 1 atm to induce phase conversion from α-spodumene to the γ- and β-spodumene varieties. Our study confirmed that during the conversion of spodumene from α- to the β-polymorph, γ- spodumene begins to form as an intermediate phase. The conversion begins at 850 °C with a few % of β- and γ-spodumene forming during 30 min of heat treatment. After 30 min at 1050 °C all spodumene has converted to β- and γ-polymorphs. Finally, full conversion into β-spodumene was confirmed on the sample heat-treated at 1100 °C for 30 min. Furthermore, it is also shown that the portable FTIR method is capable of rapid identification of the different spodumene forms and the most relevant wavenumber regions were reported, with 860 and 919 cm−1 peaks being the most notable. It is envisioned that with enough data collected, the FTIR characterisation methodology could be further extended for rapid quantification of different lithium forms and related gangue minerals suitable for mine and processing site deployment.

Supplementary Materials

The following supporting information can be downloaded at: www.mdpi.com/article/10.3390/min12020175/s1, Figure S1: α-, γ-, and β-Spodumene FTIR spectra comparison with nominal FTIR spectra of spodumene, quartz, albite and leucite taken from RRUF database. Follow legend for spectra identification. Major vibration bands are annotated and discussed in the text.

Author Contributions

Conceptualisation, T.J.P. and L.S.; methodology, T.J.P., L.S. and L.M.; software, L.S.; validation, L.S., T.J.P. and L.M.; formal analysis, L.S. and L.M.; investigation, L.S., L.M. and T.J.P.; resources, T.J.P.; data curation, P.-M.H. and L.S.; writing—original draft preparation, P.-M.H., L.S., L.M. and T.J.P.; writing—review and editing, P.-M.H., L.S., T.J.P.; visualisation, L.S., P.-M.H. and T.J.P.; supervision, T.J.P.; project administration, T.J.P.; funding acquisition, T.J.P. All authors have read and agreed to the published version of the manuscript.

Funding

This research received no external funding.

Acknowledgments

David Wray at the University of Greenwich is acknowledged for the Li ICP analysis. Nikolaos Apeiranthitis of Origin Analytical Ltd. (part of Hafren Scientific Group) is greatly acknowledged for assisting in interpretation of the FTIR spectra.

Conflicts of Interest

The authors declare no conflict of interest.

References

  1. Summaries, M.C. Mineral Commodity Summaries; U.S. Geological Survey: Reston, VA, USA, 2021; p. 200. [Google Scholar]
  2. Projection Total Lithium Demand Globally 2030. Available online: https://www.statista.com/statistics/452025/projected-total-demand-for-lithium-globally (accessed on 15 December 2021).
  3. Li, H.; Eksteen, J.; Kuang, G. Recovery of Lithium from Mineral Resources: State-of-the-Art and Perspectives—A Review. Hydrometallurgy 2019, 189, 105129. [Google Scholar] [CrossRef]
  4. Li, C.-T.; Peacor, D.R. The Crystal Structure of LiAlSi206-II (“P Spodumene”). Z. Für Krist. 1968, 126, 46–65. [Google Scholar] [CrossRef]
  5. Dessemond, C.; Soucy, G.; Harvey, J.-P.; Ouzilleau, P. Phase Transitions in the α–γ–β Spodumene Thermodynamic System and Impact of γ-Spodumene on the Efficiency of Lithium Extraction by Acid Leaching. Minerals 2020, 10, 519. [Google Scholar] [CrossRef]
  6. Peltosaari, O.; Tanskanen, P.; Heikkinen, E.-P.; Fabritius, T. Aγβ-Phase Transformation of Spodumene with Hybrid Microwave and Conventional Furnaces. Miner. Eng. 2015, 82, 54–60. [Google Scholar] [CrossRef]
  7. Dessemond, C.; Lajoie-Leroux, F.; Soucy, G.; Laroche, N.; Magnan, J.-F. Spodumene: The Lithium Market, Resources and Processes. Minerals 2019, 9, 334. [Google Scholar] [CrossRef] [Green Version]
  8. Moore, R.L.; Mann, J.P.; Montoya, A.; Haynes, B.S. In Situ Synchrotron XRD Analysis of the Kinetics of Spodumene Phase Transitions. Phys. Chem. Chem. Phys. 2018, 20, 10753–10761. [Google Scholar] [CrossRef]
  9. Barbosa, L.I.; Valente, G.; Orosco, R.P.; González, J.A. Lithium Extraction from β-Spodumene through Chlorination with Chlorine Gas. Miner. Eng. 2014, 56, 29–34. [Google Scholar] [CrossRef]
  10. Fosu, A.Y.; Kanari, N.; Bartier, D.; Hodge, H.; Vaughan, J.; Chagnes, A. Physico-Chemical Characteristics of Spodumene Concentrate and Its Thermal Transformations. Materials 2021, 14, 7423. [Google Scholar] [CrossRef]
  11. Kuang, G.; Chen, Z.B.; Guo, H.; Li, M.H. Lithium Extraction Mechanism from α-Spodumene by Fluorine Chemical Method. AMR 2012, 524–527, 2011–2016. [Google Scholar] [CrossRef]
  12. Xia, L.; Wen, G.; Song, L.; Wang, X. Sol–Gel Synthesis and Crystallization Behaviour of β-Spodumene. J. Sol-Gel Sci. Technol. 2009, 52, 134–139. [Google Scholar] [CrossRef]
  13. Shu, K.; Xu, L.; Wu, H.; Tang, Z.; Luo, L.; Yang, J.; Xu, Y.; Feng, B. Selective Flotation Separation of Spodumene from Feldspar Using Sodium Alginate as an Organic Depressant. Sep. Purif. Technol. 2020, 248, 117122. [Google Scholar] [CrossRef]
  14. Jarvis, I.; Jarvis, K.E. Inductively Coupled Plasma-Atomic Emission Spectrometry in Exploration Geochemistry. J. Geochem. Explor. 1992, 44, 139–200. [Google Scholar] [CrossRef]
  15. Post, J.E.; Bish, D.L. Rietveld Refinement of Crystal Structures Using Powder X-Ray Diffraction Data. Mineral. Soc. Am. 1989, 20, 277–308. [Google Scholar]
  16. Kaufhold, S.; Hein, M.; Dohrmann, R.; Ufer, K. Quantification of the Mineralogical Composition of Clays Using FTIR Spectroscopy. Vib. Spectrosc. 2012, 59, 29–39. [Google Scholar] [CrossRef]
  17. Abdullah, A.A.; Oskierski, H.C.; Altarawneh, M.; Senanayake, G.; Lumpkin, G.; Dlugogorski, B.Z. Phase Transformation Mechanism of Spodumene during Its Calcination. Miner. Eng. 2019, 140, 105883. [Google Scholar] [CrossRef]
  18. Calvert, C.S.; Palkowsky, D.A.; Pevear, D.R. A Combined X-Ray Powder Diffraction and Chemical Method for the Quantitative Mineral Analysis of Geologic Samples. In Quantitative Mineral Analysis of Clays; Clay Minerals Society Workshop Lectures: Chantilly, VA, USA, 1989; ISBN 978-1-881208-21-1. [Google Scholar]
  19. Bish, D.L.; Post, J.E. Quantitative Mineralogical Analysis Using the Rietveld Full-Pattern Fitting Method. Am. Mineral. 1993, 78, 932–940. [Google Scholar]
  20. Lemière, B.; Uvarova, Y.A. New Developments in Field-Portable Geochemical Techniques and on-Site Technologies and Their Place in Mineral Exploration. Geochem. Explor. Environ. Anal. 2020, 20, 205–216. [Google Scholar] [CrossRef]
  21. Mathia, E.; Ratcliffe, K.; Wright, M. Brittleness Index—A Parameter to Embrace or Avoid? In Proceedings of the 4th Unconventional Resources Technology Conference; American Association of Petroleum Geologists, San Antonio, TX, USA, 1–3 August 2016. [Google Scholar]
  22. Montgomery, P.; Ratcliffe, K.; Bell, C.R.; Locklair, R. System and Method for Determining Stratigraphic Location and Areal Extent of Total Organic Carbon Using an Integrated Stratigraphic Approach 2019. U.S. Patent No. 10,365,261, 30 July 2019. [Google Scholar]
  23. Dehaine, Q.; Tijsseling, L.T.; Rollinson, G.K.; Buxton, M.W.N.; Glass, H.J. Geometallurgical Characterisation with Portable FTIR: Application to Sediment-Hosted Cu-Co Ores. Minerals 2022, 12, 15. [Google Scholar] [CrossRef]
  24. Murthy, M.K.; Kirby, E.M. Infrared Study of Compounds and Solid Solutions in the System Lithia-Alumina-Silica. J. Am. Ceram. Soc. 1962, 45, 324–329. [Google Scholar] [CrossRef]
  25. Yan, W.; Liu, D.; Tan, D.; Yuan, P.; Chen, M. FTIR Spectroscopy Study of the Structure Changes of Palygorskite under Heating. Spectrochim. Acta Part A Mol. Biomol. Spectrosc. 2012, 97, 1052–1057. [Google Scholar] [CrossRef]
  26. Nayak, P.S.; Singh, B.K. Instrumental Characterization of Clay by XRF, XRD and FTIR. Bull. Mater. Sci. 2007, 30, 235–238. [Google Scholar] [CrossRef] [Green Version]
  27. Database of Raman Spectroscopy, X-ray Diffraction and Chemistry of Minerals. Available online: https://rruff.info/ (accessed on 20 December 2021).
  28. Moore, R.L.; Haynes, B.S.; Montoya, A. Effect of the Local Atomic Ordering on the Stability of β-Spodumene. Inorg. Chem. 2016, 55, 6426–6434. [Google Scholar] [CrossRef] [PubMed]
  29. Ncube, T.; Oskierski, H.; Senanayake, G.; Dlugogorski, B.Z. Two-Step Reaction Mechanism of Roasting Spodumene with Potassium Sulfate. Inorg. Chem. 2021, 60, 3620–3625. [Google Scholar] [CrossRef] [PubMed]
Figure 1. Lithium spodumene sample (a) before and (b) after grinding.
Minerals 12 00175 g001
Figure 2. XRD diffraction pattern of non-heat-treated lithium spodumene sample. Phase quantification using the Rietveld method, zoom in to selected angle (10° to 50° 2θ). Orange peaks belong to the silicon powder used as an internal standard. Red trace in the spectra is the observed pattern; blue trace is the calculated pattern. The red trace in the lower graphic shows the difference between the observed and calculated patterns (Rwp = 6.99%).
Minerals 12 00175 g002
Figure 3. XRD diffraction patterns of the heat-treated samples compared with the reference sample at selected angles (10° to 50° 2θ), only main peaks are annotated for clarity. Abbreviations: alb = albite; α-spd = α-spodumene; β-spd = β-spodumene; γ-spd = γ-spodumene; qtz = quartz.
Minerals 12 00175 g003
Figure 4. XRD diffraction patterns of the heat-treated samples compared with the reference sample at selected angles (18° to 24° 2θ) with annotated peaks. Abbreviations: alb = albite; α-spd = α-spodumene; β-spd = β-spodumene; γ-spd = γ-spodumene; qtz = quartz.
Minerals 12 00175 g004
Figure 5. Compiled results from all XRD analyses.
Minerals 12 00175 g005
Figure 6. Summary of FTIR spectra through heat treatment stage, original peak maximas on the 25 °C sample indicated with solid lines.
Minerals 12 00175 g006
Figure 7. Normalised FTIR spectra for heat-treated samples (normalised to 25 °C sample spectra).
Minerals 12 00175 g007
Table 1. Composition of the lithium spodumene ore measured with ICP-OES and XRF.
Al2O3SiO2TiO2Fe2O3MnOMgOCaONa2OK2OP2O5ScYSLiLOI
%%%%%%%%%%ppmppmppmppm%
ICP-OES16.978.30.020.210.150.290.350.360.160.048.0924.527222,485n.d.
XRF16.976.6<0.010.080.170.110.070.340.120.04n.d.n.d.19.1n.d.0.46
n.d.: not determined; LOI: loss of ignition.
Table 2. Composition of the lithium spodumene ore measured with ICP-MS.
ICP-MSBeVCrCoNiCuZnGaRbSrYZrNb
ppmppmppmppmppmppmppmppmppmppmppmppmppm
7.323.5654.70.6932.57.7113.477.422.912.924.835510.3
MoSnCsBaLaCePrNdSmEuGdTbDy
ppmppmppmppmppmppmppmppmppmppmppmppmppm
6.7836720.891.41.121.980.250.860.190.040.180.030.16
HoErTmYbLuHfTaWTlPbThU
ppmppmppmppmppmppmppmppmppmppmppmppm
0.030.060.010.070.018.325.811.350.093.060.400.44
Table 3. Summary of QXRD results.
XRD25 °C850 °C950 °C1050 °C1100 °C
wt.%wt.%wt.%wt.%wt.%
α-Spodumene57.850.924.10.00.0
β-Spodumene0.02.214.946.955.6
γ-Spodumene0.01.616.510.00.0
Quartz40.443.942.741.743.1
Albite1.81.41.81.41.3
Table 4. A comparison between the magnitude and position of peaks in the FTIR spectrum and the weight % spodumene from XRD analysis.
Wavenumber cm−125 °C850 °C950 °C1050 °C1100 °CMineral Phase *
425–450--(sh)(sh)(sh)(γ, β)-Spd
4500.2340.2150.2140.1730.185Spd, Qtz
518 (sh) (sh)(sh) 0.0730.077Spd, Qtz
555---(sh)(sh)β-Spd
5930.080.0790.07(sh)(sh)Spd
6410.0660.0670.063--(α, γ)-Spd
6950.0330.0390.050.060.07Qtz
7790.090.10.110.10.11Qtz
7970.090.110.110.10.1Qtz
8600.990.098(sh)--α, γ-Spd
9190.1410.146(sh) - -α, γ-Spd
970–1020
(1011)
(sh)
 
(sh)
(0.293)
(sh)
(0.316)
β-Spd
10600.2460.263 0.3120.2800.304Qtz
1072(sh)(sh)---α-Spd
1085(sh)(sh)(sh)--Qtz
11630.100.100.120.130.14Qtz
α-Spodumene57.850.924.100
β-Spodumene02.214.946.955.6
γ-Spodumene01.616.5100
* Using spectral data from RRUF database [27]; (sh) = shoulder, Spd = spodumene, Qtz = quartz.
Publisher’s Note: MDPI stays neutral with regard to jurisdictional claims in published maps and institutional affiliations.

