Abstract
The TTZ-South seismic profile follows the Teisseyre-Tornquist zone (TTZ) at the SW margin of the East European craton (EEC). Investigation results reveal the upper lithospheric structure as representing the NW-vergent, NE-SW striking overthrust-type, Paleoproterozoic (~1.84–1.8 Ga) Fennoscandia-Sarmatia suture. The Sarmatian segment of the EEC comprises two crustal-scale tectonic thrust slices: the Moldavo-Podolian and Lublino-Volhynian basement units, overriding the northerly located Lysogoro-Radomian unit of Fennoscandian affinity. The combined results of the TTZ-South and other nearby deep seismic profiles are consistent with a continuation of the EEC cratonic basement across the TTZ to the SW and its plunging into the deep substratum of the adjacent Paleozoic platform. Extensional deformation responsible for the formation of the mid to late Proterozoic (~1.4–0.6 Ga), SW-NE trending Orsha-Volhynia rift basin is probably also recorded. The thick Ediacaran succession deposited in the rift was later tectonically thickened due to Variscan deformation. The Moho depth varies between 37 and 49 km, resulting in the thinnest crust in the SE, sharp depth changes across the TTZ, and slow shallowing from 49 to 43 km to the NW. The abrupt Moho depth increase from 43 to 49 km is considered to reflect the overlying lower crust tectonic duplication within the suture zone.
1. Introduction
The Teisseyre-Tornquist zone (TTZ) or line (TTL), a continental scale, NW-SE directed geophysical feature traversing Europe between the Baltic and Black seas (Figure 1) across Poland, Ukraine, Moldova, and Romania (e.g., [1,2,3,4,5]), for many decades has been considered to follow the southwestern edge of the East European craton (EEC), representing one of the most prominent tectonic boundaries in Europe.
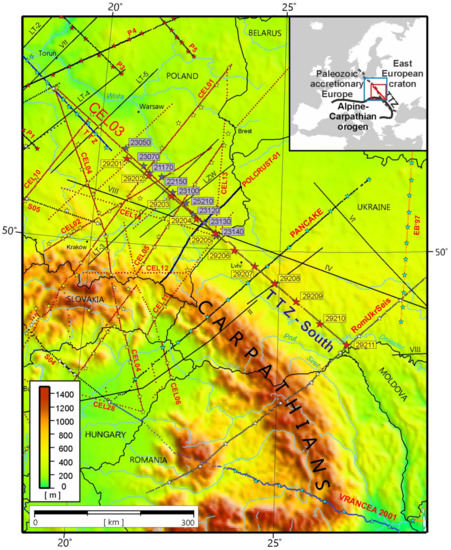
Figure 1.
Location of the TTZ-South, CEL03 and other deep seismic sounding (DSS) profiles on a map of East-Central Europe (red box in the inset map, whereas the blue box shows the area hosting the whole, long TTZ-CEL03-TTZ-South transect). Stars and numbers refer to locations of shot points along the transect TTZ-CEL03-TTZ-South. The beginning of this long transect corresponds to the coast of the Baltic Sea (not seen on the map). TTZ—Teisseyre-Tornquist zone.
The TTZ occurs at the junction of the three main tectonic provinces of Europe (Figure 1 and Figure 2): the Paleoproterozoic East European craton (EEC), the Paleozoic platform of Central and Western Europe (PP), represented by its TESZ (Trans-European Suture zone; [1,3,6,7], see Section 2.3 of this paper) domain and the Meso-Cenozoic Carpathian fragment of the vast Alpine-Himalayan orogenic system. The complex spatial relationships between these diverse composite tectonic realms were developed during a >2 billion year-long geodynamic evolution. It is perhaps no wonder that these relationships are still not well understood at depths exceeding the reach of boreholes and are currently a matter of lively discussions and controversial interpretations (e.g., [8,9,10,11,12,13,14,15,16,17,18,19,20,21]).
The TTZ-South survey was made subparallel to a ~575 km-long, NW-SE trending stretch of the TTZ and its close vicinities (Figure 2a,b), using the wide-angle reflection/refraction (WARR) seismic method, and its first results have been published in [22]. The TTZ-South profile extends between the vicinities of the town of Radom in southeast-central Poland and Chernivtsi in Ukraine, close to the border with Moldova.


Figure 2.
Tectonic setting of the TTZ-South profile: (a) in the context of major basement domains at SW margin of the East European craton (EEC) shown on map by Bogdanova et al. (ref [23] simplified by Mężyk et al. [24]) and (b) on the top of crystalline basement outline map of the East European platform by Krzemińska et al. (ref [25] modified after Mężyk et al. [24]). The red square shows the location of Figure 2b. The TTZ boundaries in (b) are shown according to Mazur et al. [9] and Mikołajczak [26].
Profile TTZ-South is chronologically the third in a series of WARR profiles carried out along the TTZ, aimed at exploring its lithospheric structure. Previously, the Polish part of the TTZ was investigated along profiles named TTZ (in 1993; [27]) and CEL03 (in 2000; [28]). Profiles TTZ and CEL03 in the northwest, together with the TTZ-South profile in the southeast, define a 1025 km-long lithospheric transect roughly parallel to the southwestern margin of the EEC, extending from the Baltic Sea to the border of Ukraine with Moldova.
The general scientific goal of the TTZ-South experiment was to provide more information on the crustal structure of the EEC along its SW margin by a profile extending further to the SE than the earlier ones. Among others, the experiment also attempted to determine the location and geometry of contact between the Fennoscandian and Sarmatian domains of the EEC, supposed to represent a tectonic suture. It also aimed to shed new light on the uppermost mantle structure and, if possible, to solve questions concerning, e.g., the constraints on the supposed Paleozoic motions and depth extent of the nearby terranes, believed to compose the basement of the PP within its TESZ domain.
2. Geological and Geophysical Setting
The geology of SE Poland and Western Ukraine around the TTZ-South profile is that of the surroundings of a “triple junction” between the main tectonic components of Europe. The northeastern one, the East European craton (EEC), has its crystalline basement composed of two major Paleoproterozoic domains, Sarmatia in the SE and Fennoscandia in the NW [29,30,31]. In its part covered by Phanerozoic deposits, the EEC is interchangeably also referred to here as the East European Platform (EEP). It is adjoined in the west by erosionally planated Paleozoic and Neoproterozoic fold belts covered with a thick Permo-Mesozoic to a recent sedimentary succession of the Polish-German basin and traditionally referred to as the Paleozoic platform of Central and Western Europe (PP). The Carpathian fold belt, produced by the Alpine tectonism in Cretaceous to Cenozoic times, occurs in the south and southwest. Due to its relatively superficial, thin-skinned style of tectonics and mostly peripheral position with respect to the TTZ-South profile, its stratigraphic content and internal structure are not discussed in this paper.
2.1. Uppermost Sedimentary Layer: Phanerozoic to Ediacaran Platform Cover
The geology of southeastern Poland is much different at various structural levels. The near-surface geology offers little insight into the deep structure, which is fully concealed below the Cenozoic, Mesozoic, Paleozoic and, locally, also Neoproterozoic (Ediacaran), sedimentary cover of varying thickness. The sub-Cenozoic regional geological map (Figure 3a) shows successive stages of mostly shallow marine Cretaceous sedimentary deposits that cover most of the area, particularly on the EEP. The Cretaceous lies horizontally over the EEP and is very gently folded on a regional scale (e.g., [32]) over the PP due to the Late Cretaceous–Palaeocene trans-European compressional event [33,34,35], together with the underlying Jurassic, Triassic and Permian strata. The folding has produced, among others, the NW-SE trending and hundreds of kilometres long Mid-Polish swell (or anticlinorium) elevated on both sides by as much as ~2–3 km above the adjacent shallow synclinoria (Figure 3a). In its most elevated segment, the Holy Cross-Sambir high, the Mid-Polish swell exposes earlier folded Palaeozoic and Ediacaran strata, subcropping at the base of the Miocene Carpathian foredeep succession [36,37].
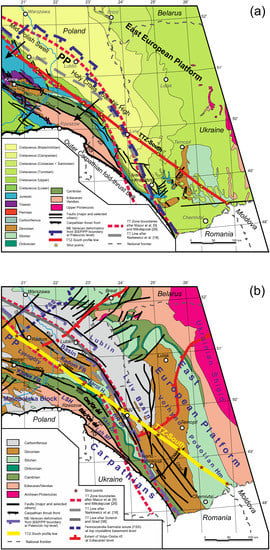
Figure 3.
Geological situation of the TTZ-South profile (a) on base-Cenozoic subcrop geological map, (b) on base-Permian subcrop geological map. The maps are based on various sources, most notably on [37,38,39,40,41,42], and show the approximate location of (1) the boundary between the Precambrian East European (EEP) and Paleozoic (PP) platforms at the top Paleozoic level, (2) the Ediacaran Orsha-Volhynia rift basin (after [23,42]), (3) the Fennoscandia-Sarmatia suture (FSS) on top of the crystalline basement (based on modified data from [23,25,42] combined with results presented in this paper) and (4) the TTZ or TTL according to various authors. The location of the figures is marked by the red quadrangle in Figure 2a. Abbreviations: Cm/Or dd—Cambrian/Ordovician deformation domain; Edc/CM dd—Ediacaran/Cambrian deformation domain; f—fault/fault zone, FB—fold belt, H—high, Hm—homocline; Kkh—Kokhanivka; LSH—Lower San horst, Lzh—Lezhaisk; Mf—massif, PP—Paleozoic platform; RR—Rava Ruska; U—unit; Zn—zone. Annotated faults: Cherf—Chernivtsi fault zone; Chmf—Chmielnik fault; FCf—Fore-Carpathian fault; FSS—Fennoscandia—Sarmatia suture; Gf—Grójec fault; Hf—Hanna fault; HCf—Holy Cross fault; IZf—Izbica-Zamość fault; Kf—Kock fault; Kkf—Krakovets fault; KUf—Kazimierz—Ursynów fault; NMRf—Nowe Miasto—Radom fault; RRf—Rava Ruska fault; RWf—Ryszkowa Wola fault; TNM—Tiachevo-Nadvirna-Monastyrets fault zone.
Around the southeastern end of the TTZ-South profile in Ukraine, on the EEP, nearly subhorizontal Palaeozoic and Ediacaran strata locally emerge from below the Cretaceous and Jurassic (Figure 3a). Further east, on approaching the Ukrainian shield, Paleoproterozoic and Archean crystalline basement outliers occur as well. On the margin of the PP, roughly along the axis of the Mid-Polish swell, the base-Cenozoic map (Figure 3a) exposes pre-Permian (Paleozoic and Ediacaran) tightly folded sedimentary successions defining distinct, tectonically juxtaposed structural units with different deformation histories. They occupy the core of the end-Cretaceous Holy Cross-Sambir high, which nearly coincides with that of the late Carboniferous Narol high, mostly buried below the Mesozoic strata.
A more diverse geological situation is revealed by the pre-Permian subcrop map (Figure 3b) where, as expressed by Krzywiec et al. [14], the tectonic pattern at the transition from the EEP to the PP is dominated by ESE- to SE-striking Variscan and older tectonic units that partly overlie and partly adhere to the EEP margin along the TTZ. From the NE to SW, these units include the Lublin and Lviv basins, the Lysogory-Radom (Polish: Łysogóry-Radom) Variscan fold belt, with the Narol high as its elevated southeasterly extension, and the Kielce fold belt, deformed in Sandomirian (end Cambrian) and, then, in Variscan orogenic events. To the SW, there is one more tectonic unit, the Małopolska block, containing the elevated Lower San horst affected by end Ediacaran deformation. To the southeast, in Ukraine, the Lysogory-Radom fold belt continues as the Rava-Ruska zone, the Kielce fold belt as the Kokhanivka zone, and the Lower San horst as the Lezhaisk massif [37].
All these units contain Ediacaran and Paleozoic sedimentary suites, mostly shallow to open marine, of distinct sedimentation and deformation histories, and with some volcanic input (in the Ediacaran and early Carboniferous). The structural units in question (except the Lublin and Lviv basins, but including the Brunovistulia block located SW of Małopolska), are often interpreted as early Palaeozoic terranes of either Gondwana or (peri-)Baltica provenance, that were accreted to the Baltica margin during the early Paleozoic (e.g., [1,3,43,44,45,46,47,48]).
To the SE of Lviv, the TTZ-South profile crosses the Volhyno-Podolian homocline, composed of gently NW-dipping Upper Proterozoic—Paleozoic and, also, Mesozoic strata of the eastern slope of the Lviv basin. The Lviv basin together with the eastern part of the Lublin basin rest firmly on the cratonic basement of the EEP and are essentially unaffected by Ediacaran or Phanerozoic compressional deformation (for Ediacaran and Palaeozoic evolution of sedimentary basins of the SW margin of the EEP in Poland see [49], and references therein). The Carboniferous of western and southwestern parts of the Lublin and Lviv basins, together with that of the Lysogory-Radom fold belt is, however, affected by the late Carboniferous thin-skinned thrusting and folding of the most peripheral zone of the outer fold-and-thrust belt of the Variscan orogen [13,14,15,50]. In the Lysogory area, no lower Cambrian strata are known, whereas the Ediacaran substratum is interpreted from deep seismics. The Kielce fold belt is also affected by the late Variscan folding [51], but differs from the Lysogory-Radom and Lublin areas in respect of its lower Paleozoic stratigraphy, particularly in lacking most of the Cambrian system and in showing intensely deformed Lower Cambrian flysch-like clastics. The Sandomirian tectonic event (e.g., [45,52]) responsible for this deformation is interpreted [45] as due to the late Cambrian collision of the Kielce unit with the Baltica margin during an early stage of terrane amalgamation within the TESZ area. The Małopolska block (or terrane e.g., [45,47,53]), located further to the SW (considered here separately from the Kielce fold belt after Buła and Habryn [37] and Buła in [54]), is, in contrast to the former three units, practically unaffected by Variscan folding. It is, instead, composed of Ediacaran, partly anchimetamorphosed, marine siliciclastic deposits in its basement, deformed at the turn of the Neoproterozoic and Cambrian e.g., [55] and overlain by scanty patches of unfolded Ordovician and Silurian clastics and carbonates followed by carbonate Devonian and lower Carboniferous. The Lysogory-Radom and Kielce fold belts were deformed by the end of Carboniferous times and, together with the Małopolska block, have their Paleozoic strata not metamorphosed but planated by erosion. The Małopolska, Kielce, and Lysogory-Radom fold belts are all included in the TESZ zone and serve as the sub-Permian “basement” to the PP, underlying its Permian to Cenozoic cover. The boundary between the EEP and PP is assumed to follow the Variscan deformation front (Figure 3b), to the southwest of which the drilled Carboniferous and Devonian strata become steeply dipping in boreholes [13,56]. Additionally, it is just below the Variscan front (shown in Figure 3a,b) that the EEP crystalline basement starts its systematic SW-ward descent cf. [16].
The sub-Permian deformed basement of the PP is cut by a network of faults, only the most important of which are shown on the map in Figure 3b. Their locations and courses (mostly inferred from drill hole data and/or industrial seismic reflection lines) are interpreted differently by particular authors. In general, the major WNW-ESE-directed faults tend to sub-parallel the TTZ-South profile over most of the Polish territory but change their strike slightly clockwise and assume an NW-SE trend on approaching the Ukrainian border, and, further on, tend to cross the profile, assuming an en-echelon attitude with respect to it. Some of the major faults are considered by, e.g., Narkiewicz (in [8,18,57]) as subvertical discontinuities inherited from pre-Devonian wrenching, that continue directly from the crystalline basement into the Paleozoic succession at or near the southwestern edge of the EEP. Their regional persistence, continuity, subvertical attitude at depth and direct relationships with the deep basement are, however, currently questioned [10,14,15,16,17] on the grounds of the recent seismic data and finding that some of them represent Variscan listric thrusts involved in thin-skinned tectonics reaching down to the Ediacaran/crystalline basement interface [14,15].
The Ediacaran sedimentary-volcanic succession, overlying much of the crystalline basement NE of the TTZ-South profile, mostly represents the fill of an extensive NE-trending >1000 km long graben, the Orsha-Volhynia rift basin, exceeding 250 km in width, that developed parallel to the suture zone between the Fennoscandia and Sarmatia (FSS; Figure 2a and Figure 3b) provinces of the EEC. The Orsha-Volhynia rift system (or Volyn-Orsha/Central Russian rift, or aulacogen of other authors) is one of a system of Meso- to Neoproterozoic major trans-cratonic grabens and troughs, that mostly formed along the Paleoproterozoic sutures and junctions where the three main tectonic provinces of the EEC had been welded together earlier.
The Orsha-Volhynia rift system was intermittently active at ~1.4–1.3 Ga [30,31,58], i.e., during the Mesoproterozoic, and showed important activity during late Neoproterozoic Vendian/Ediacaran times (~700–600 Ma according to [47]). During the Neoproterozoic, the Orsha-Volhynia basin struck perpendicular to and must have ended at the Tornquist rift in the SW, which had developed along the TTZ due to the Rodinia/Pannotia breakup [47,59,60]. A late extensional event at ~600–540 Ma, during Ediacaran times, occurred in both the Tornquist and Orsha-Volhynia rifts and was accompanied by abundant continental flood basalts and related gabbro-dolerite intrusions [51,61,62,63], dated at ~600–550 Ma cf. [64,65,66,67,68] and considered as being related to early- to syn-rift stages of the extension. Both the intersecting rifts must have formed a triple junction at approximately this time interval in the late Ediacaran. Two arms of the triple junction, located roughly along the future TTZ, underwent a complete continental-to-oceanic rift evolution, resulting in the opening of the Tornquist ocean and breakup of the Rodinia/Pannotia supercontinent, whereas the third arm, represented by the Orsha-Volhynia aulacogen became aborted before the Cambrian [66].
The above concept, which assumes that the Tornquist ocean formed in the late Ediacaran along the SW edge of the East European craton, if identified with the supposed TTZ deep fracture, is, however, at variance with the idea of, e.g., [55,69,70,71], who, on sediment provenance- and/or seismic-based arguments, advocate close proximity of the Małopolska and Lysogory terranes to Baltica during Neoproterozoic times. The latter idea, in its turn, is able to successfully explain the present-day position of the deformation belt made of Ediacaran rocks within the Małopolska terrane adjacent to the little deformed Ediacaran deposits in the Orsha-Volhynia rift on the EEC side of the TTZ.
2.2. Precambrian Crystalline Basement
At still deeper levels of the upper crust, below the Palaeozoic and Ediacaran successions shown on the maps in Figure 2b and Figure 3b, there is a Precambrian basement (Figure 2b) of the EEP [42,59,72,73]. According to studies based on PolandSPAN seismic data and potential field modelling [16,26] (see also Krzywiec et al. [14]), the top of the Precambrian crystalline basement in Poland occurs at a depth of 500 to (locally) 5000 m on the EEP, NE of the Variscan front (Figure 3b). Below the Lublin basin, however, starting approximately below the Kock fault zone and Izbica-Zamość fault, at a distance of 80–90 and 30–50 km, respectively, away from the TTZ-South profile, it rapidly descends to 10–15 km and more, thus becoming inaccessible for drilling. It may attain even as much as ~20 km beneath the SW part of the Radom area in the Lysogory Radom fold belt [8,57]. The EEP basement continues at least several tens of kilometres further to the southwest, beyond the TTZ, possibly even as far as 150–200 km [74]. In Ukraine, the top of the EEP crystalline basement lies, generally, at shallower depths below the TTZ-South profile, but to the SW, across the TTZ, below the Carpathians, it descends to similar depths as in Poland [42].
To the NE of the TTZ-South profile, the EEC crystalline basement (Figure 2a,b and Figure 3b) is characterized by a NE-SW structural grain, created during its Paleoproterozoic consolidation [23,25,31,43], which results in successive structural units approaching the TTZ at an approximately right angle. The main part of the EEC adjacent to the TTZ is represented by the Sarmatia province of the craton in Ukraine, composed of Palaeoproterozoic orogenic belts (with 2.2–2.0 Ga crust), encircling Archean (3.75–2.7 Ga) cores [23,43]. To the NW, they are replaced by the extensive, ~200 km wide NE-trending Osnitsk-Mikashevichi igneous belt (Figure 2a,b), intruded at 2.0–1.95 Ga, that straddles the Ukrainian-Polish border and, further on, adjoins the ~2.0–1.85 Ga Sarmatia marginal zone, bordered on the NW by the Fennoscandia-Sarmatia Suture (FSS). The FSS was earlier considered [29,30,31] to follow the Minsk Fault (Figure 2b), but in more recent papers [23,43], the Okolowo-Holeszów terrane and Belarus-Podlasie Granulite Belt (with crustal ages between 2.0 and 1.85 Ga; the former of oceanic and the latter of magmatic arc affinities) were reinterpreted as components of the Sarmatia crustal domain. This meant shifting the suture position to the NW border of the Belarus-Podlasie Belt. The FSS is believed to have formed due to an oblique collision between the two EEC crustal provinces (“craton segments”), Volgo-Sarmatia and Fennoscandia, at ~1.84–1.8 Ga [23,31,43,58]. In the neighbourhood of the TTZ-South profile, the EEC crystalline basement is not accessible by drilling, and the possible effect of the FSS on the gravity and magnetic fields is obscured by those related to abundant high velocity/high-density bodies in the middle crust (see below). Therefore, it is only by extrapolation of the Fennoscandia and Sarmatia structures and, in particular, of the trace of the FSS, along with their NE-SW trends on the top surface of the crystalline basement, that the likely intersection of the FSS trace with the TTZ-South profile can be predicted (cf. Figure 2 and Figure 3b). The SW-ward extension of the FSS trace (as delineated by [23,43], with a modification that stems from the TTZ-South, results presented further on in this paper) intersects the TTZ-South profile near the NW end of the Polish segment of the TTZ-South profile (Figure 3b).
The south-easternmost part of the Fennoscandian province of the EEC, labelled on the map in Figure 2b as the Mazowsze domain, is composed of successively accreted belts of the Svecofennian orogen, adjoining the FSS from the NW at an approximately right angle. The Svecofennian crust adjacent to the FSS near the NW end of the TTZ-South profile is represented by metasedimentary formations of continental origin massively intruded by granitoids and consolidated at ~1.84–1.82 Ga [23,25]. At ~1.82–1.80 Ga, the accretionary evolution of the Svecofennian orogen was complicated by an oblique continental collision between Fennoscandia and Sarmatia, which resulted in a regional SW-NE directed contraction [23]. The descent of the EEC crystalline basement top across the TTZ, making it “plunge beneath the thick Ediacaran to Cenozoic sedimentary cover” [8,57] coincides with “a south-westward shallowing of the Moho depth from 42–50 km beneath the EEC to 31–38 km below the PP over a distance of ~50 km” ([38]; quotations from [14]). These phenomena typify a SW-ward transition across the TTZ from the thick cratonic crust typical of the EEC, with its crystalline basement occurring at relatively shallow levels to the thinner, extended crust underlying the West European PP (e.g., [75,76]). The transition is considered as the result of the late Neoproterozoic rifting of the SW margin of Baltica during the breakup of Rodinia and the opening of the Tornquist Ocean [47,59].
In the area located mostly NE of the TTZ-South profile in Poland, beneath the Radom area of the Lysogory-Radom fold belt and the SW Lublin basin (Figure 2b), the crystalline basement contains anomalous high density/high seismic velocity bodies, inferred from deep seismic sounding (DSS) profiles (e.g., [28,71,77,78,79]). Malinowski et al. [71] suggested that these anomalies are related to mafic igneous intrusions emplaced at the turn of Precambrian and Cambrian times. Recent qualitative analyses of gravity data [26] point to a still more abundant presence of such bodies in the areas in question than earlier suggested on the basis of seismic data and to its (at least partial) correlation with the extent of the so-called Małopolska gravity high (Figure 4a and, e.g., [12]).

Figure 4.
Location of the TTZ-CEL03-TTZ-South transect and the Teisseyre–Tornquist line on potential field maps of Central Europe (modified after Wybraniec & Majorowicz [80]). (a) The TTZ-CEL03-TTZ-South transect is shown on a Bouguer gravity anomaly map. (b) The T-T line is shown on a map of magnetic anomalies illuminated from the SE. T-T line—Teisseyre–Tornquist line; STZ—Sorgenfrei–Tornquist zone; thin white lines represent the net of CELEBRATION 2000 profiles. The bottom left inset in (b) shows the location of the study area (red rectangle) and the location of the maps (a,b) in Europe (blue box). EEC—East European craton; TESZ—Trans-European Suture zone; TTZ—Teisseyre-Tornquist zone.
2.3. Teisseyre-Tornquist Zone (TTZ)
The Teisseyre-Tornquist zone (TTZ, also named the Teisseyre–Tornquist line or lineament, TTL, when considered as an element of negligible width) has been known since the late 19th century [81,82,83,84]. It extends in the NW-SE direction between the Baltic and Black seas (Figure 1 and Figure 4) across Poland, westernmost Ukraine, and Moldova through to Romania (e.g., [1,2,3,4,5]). The TTZ constitutes a geophysical feature distinctive in the gravity and magnetic fields on the regional to continental scale [4,5,9,12,20,85,86,87,88,89], being also reflected in the distribution of heat flow at the surface [90,91,92].
The TTZ is most clearly visible in the magnetic field (Figure 4) and relates to the zone of strong gradients separating the complex field with large anomalies caused by highly magnetic rocks of the shallow Precambrian basement of the craton and its SW slope, from the subdued field with small anomalies, representing the PP of Western Europe and caused by the SW deepening of its Paleozoic–Ediacaran basement, composed of rocks with reduced magnetization [9,12,88,93]. In the EEC, the magnetic field exhibits a complex pattern with the presence of mosaic-like and linear features and anomaly magnitudes ranging from −1000 to 1800 nT, whereas, over the PP, anomalies are much smaller, ranging in magnitude from −200 to 100 nT.
The manifestation of the TTZ in the gravity field (Bouguer anomalies) is not so obvious as that in the magnetic field (Figure 4a). The gravity field to the NE of the TTZ is mainly caused by the diversity of composition in the EEC crystalline basement, whereas to the SW of the TTZ in Ukraine it is due mainly to the tectonics of the Permo-Mesozoic complex. Within the TTZ itself and its immediate vicinity, one can observe (Figure 4) gravity lows above deep troughs at the edge of the EEC, related to the Carpathians and their foredeep. The TTZ-South profile in Poland crosses an extensive domain with a weakly positive gravity field (up to +10 mGal). In Ukraine, it passes through the extensive minimum (low) of the Lviv basin, reaching values of −70 to −75 mGal. It then traverses an area with a monotonic rise of the gravity field (up to −20 mGal) over the Volhyno-Podolian homocline. The southern end of the profile is marked by a Bouguer anomaly rise to +5 mGal on the SW slope of the Ukrainian shield (Figure 4).
The edge of the EEC also clearly manifests itself on the maps of terrestrial heat flow. The TTZ separates the region of “cold” cratonic lithosphere in the NE, where the heat flow is about 40 mW/m2, from the “hot” lithosphere with a surface heat flow of 60–80 mW/m2 over the Paleozoic terranes in the SW [90,92]. The lowest values of heat flow (30–35 mW/m2) on the TTZ-South profile are recorded on the Volhyno-Podolian homocline in the SE part of the profile. Further NW, within the Lviv basin, the heat flow values increase and reach their maximum on the profile (~50 mW/m2) at the transition from the trough to the Narol high, where the heat flow is ~40 mW/m2. In the Radom-Lysogory unit, the average level of heat flow is about 35 mW/m2.
For decades, the TTZ has been considered to trace the southwestern edge of the EEC, separating it from the PP (Figure 2a,b). This edge was long believed to follow a deep, subvertical, crustal-scale fault zone, developed between the thick EEC crust and the much thinner crust of the PP. Since the early 1990s, an approximately 200 km-wide margin of the PP, proximal with respect to the EEC and adjacent to the TTZ, has often been referred to as the already mentioned TESZ and interpreted as a pre-Devonian collage of Neoproterozoic through Paleozoic terranes (e.g., [1,3,20,44,45,46,94]).
The TT zone or line has been located somewhat differently by various workers (recent accounts are given in, e.g., [4,5,12,16,20,48,95], using diverse criteria. These rely, first of all, on the location of the maximum horizontal gradient zone of magnetic anomalies or—to a lesser degree—on the distribution of gravimetric highs and lows (e.g., [85,86,89,95]). The criteria were also derived from the results of tectonic interpretation of deep seismic profiles and were based on the position of an increased gradient of the Moho depth changes (e.g., [9,10,16]), or even on the location of particularly interpreted high-angle to vertical faults in the Paleozoic through Mesozoic sedimentary cover, believed to correspond to the East European platform basement boundary at depth [20,48]. The suggested positions of the TTL according to diverse exemplary assessments (after Guterch & Grad [38], and Narkiewicz et al. [18]) and of the TTZ (according to [9] and to [26]) are shown in Figure 3a,b as projections from the basement and, more directly, in Figure 2b on the map of the crystalline basement by Krzemińska et al. [25].
The simple model of a deep, subvertical fracture contact along the TTL between the EEC and the TESZ margin of the PP has been, however, challenged by ideas assuming an SW-ward continuation of the EEC crystalline basement across the TTZ at gradually increasing depth below the PP (e.g., [3,9,75,96]). The recent, high-resolution reflection seismic profiles of the PolandSPAN project [9,10] and, in particular, the POLCRUST-01 deep reflection profile [8,10], seem to show, indeed (in contradiction to the interpretation of Narkiewicz in [8,18]), an apparently uninterrupted SW-ward continuation of the EEC crystalline basement across the TTZ [9,12,15], which is independently corroborated by potential field modelling of [16,26].
3. Previous Deep Seismic Studies
Among numerous methods used for studies of the crust and uppermost mantle, some are particularly useful for determining the lithospheric structure and composition and these, among others, include geophysical and petrological studies, absolute-age determination methods, and deep drilling, penetrating usually to depths of 2–5 km. Usually, various seismic experiments are the basis for these investigations. In order to answer fundamental questions about the tectonics and geodynamics of Central Europe, active-source seismic studies were performed. During the last few decades, several deep seismic (or wide-angle reflection and refraction—WARR) profiles were executed in the area of the TESZ. The experiments were done to the same standard, concerning both the field measurements and the methods of interpretation. This allowed for a consistent, progressive determination of the structure and a credible comparison of the properties of various parts of the TESZ and neighbouring tectonic units.
The TTZ experiment, carried out in 1993, was the first profile running along the northwestern part of the TTZ (Figure 1). In the frame of the POLONAISE’97 and CELEBRATION 2000 projects, a net of WARR profiles was set up in Poland (Figure 1). Also, the first deep reflection seismic profile, POLCRUST-01, was acquired across the Teisseyre-Tornquist zone(TTZ) in SE Poland. Based on the data collected during these experiments, several works were published, describing results of great importance for the determination of the structure of the crust and uppermost mantle in this region (e.g., [8,18,28,57,71,78,79,97,98,99,100,101]).
As the extent of the CELEBRATION 2000 experiment in this region was limited by the Polish-Ukrainian border, no information was acquired about the structure of the southern, Ukrainian part of the Teisseyre–Tornquist zone, or, more generally, of the TESZ. A number of Deep Seismic Sounding (DSS) profiles were made in west Ukraine previously. Early Soviet DSS profiles—Geotraverses II, IV, and VI (Figure 1)—were acquired in the 1970s–1980s [102]. All the previous investigations were focused mainly on the recording of reflected seismic phases and provided only limited velocity information. Two modern DSS profiles that cross the southeastern part of the TTZ were PANCAKE, performed in 2008 [103], and RomUkrSeis in 2014 [104].
As already stated, profile TTZ-South is the third of WARR profiles carried out along the Polish part of the TTZ. The previous profiles, TTZ [27] and CEL03 [28], relatively poorly resolved the structure near the end points of profiles (approximately up to 100 km from each end), due to the nature of the WARR technique. In this method, seismic rays do not probe the crust vertically, but at a certain angle of inclination. Therefore, ray density and, in consequence, the amount of data constraining the structure substantially decrease beneath the marginal parts of the profile. Therefore, the southeastern end of the TTZ—CEL03 transect in southeastern Poland, particularly important in terms of the expected tectonic information, was not illuminated by seismic rays. To address this shortcoming, the TTZ-South profile was designed to overlap the southeastern part of the CEL03 profile and to extend much further to the southeast. As a result, the TTZ, CEL03, and TTZ-South profiles together define a 1025 km-long lithospheric transect roughly parallel to the southwestern margin of the EEC, between the Baltic Sea and the border of Ukraine with Moldova.
4. Field Experiment and Seismic Data
4.1. Data Acquisition
The fieldwork for the seismic experiment TTZ-South was conducted in September 2018. The ~550 km long profile was located along the edge of the EEC in southeastern Poland (~230 km) and Western Ukraine (~320 km). It was designed to be an extension of the older profiles extending along the EEC margin—TTZ [27] and CEL03 [28]. Eleven shot points were detonated along the profile (see Table 1). The largest shots were located close to the profile ends. Data acquisition was accomplished using 320 vertical-component seismic recorders (110 Reftek 125-Texan and 210 DSS-CUBE) with 4.5 Hz geophones and 100 Hz sampling rate, with ~1.7 km spacing. Unfortunately, not all recordings on the Ukrainian side were correct, and several gaps between traces on the seismic sections are present.

Table 1.
Locations and other parameters of explosive sources used along the TTZ-South profile.
4.2. P-Wave Seismic Wavefield
We observe in the recorded wavefield (Figure 5) all the phases necessary to obtain the velocity models (Figure 6 and Figure 7). The seismic records allow for correlation of refracted P-wave phases from the sedimentary and deeper crustal layers (Psed, Pg, and Pov), reflections from crustal discontinuities (PcP), reflections (PMP), and refractions (Pn) from the Moho discontinuity and mantle phases (Pmantle). The picks of the above phases, designated as the observed travel time curves, served as the basis for the determination of the seismic velocity distribution and depths to velocity discontinuities in the crust and upper mantle. The first P-wave arrivals represent the refracted arrivals from the upper crustal sedimentary layers (Psed), the upper/middle crystalline crust (Pg), and the refractions from the upper mantle (Pn). For most of the shot points, the first arrivals can be correlated up to a 200–220 km offset for the Pg phase and to about 300–450 km offset for the Pn phase. Near the shot points, the refractions from the sedimentary layers (Psed) show a variation in offset range and in their apparent velocity because of the different depths of the sedimentary basins and different P-wave velocities (Vp). In the northwestern part of the profile, at some shot points (SP29201, SP29202, and SP29204) in the offset range from 0 to 5–10 km, Psed has apparent velocities <3 km/s, reflecting low-velocity sediments in this region. At larger offsets, up to 80 km, in the northwestern and central part of the profile, the Psed phase shows apparent velocities of 5.0–5.7 km/s. These phases are practically absent in the record sections from the four southeastern shots (SPs 29208-29211). Here, the Pg phase with an apparent velocity of 6.1–6.25 km/s is dominant as the first arrivals at offsets up to 100–150 km. Its apparent velocity suggests it originates as refractions from the consolidated (crystalline?) basement. In the northwestern and central part, the Pg phase, propagating in the basement beneath a thicker sedimentary layer, shows higher apparent velocities of ~6.5 km/s at offsets of 50–200 km. In some places, the apparent velocity of Pg increases to 6.7 km/s or more (Figure 5, SP29202, SP29204, SP29205), indicating high Vp in the upper/middle crust.
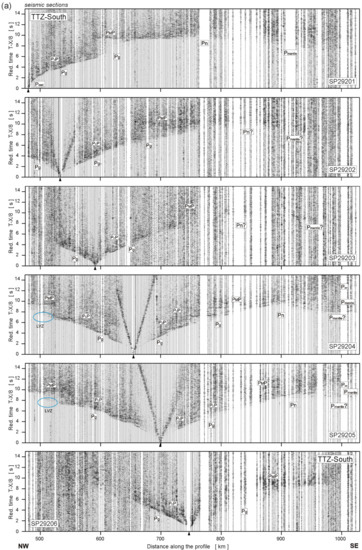
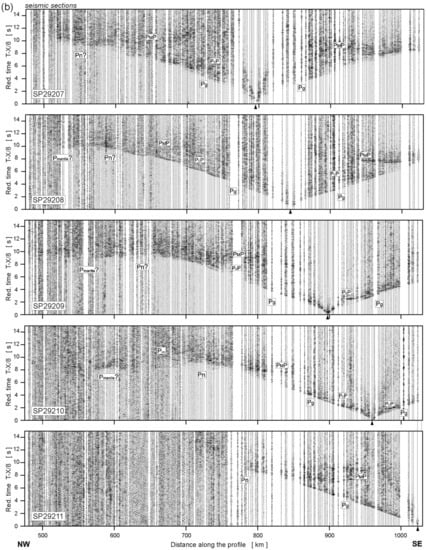
Figure 5.
Examples of trace-normalized, vertical-component seismic record sections for (a) SP29201-SP29206 and (b) SP29207-SP29211. A band-pass filter (2–15 Hz) has been applied. Psed—P refractions from sedimentary layers; Pg—P refractions from the upper and middle crystalline crust; Pov—P overcritical crustal phases; PcP—P reflections from the mid-crustal discontinuities; PMP—P reflections from the Moho boundary; Pn—P refractions from the sub-Moho upper mantle; Pmantle—lower lithospheric P phases; LVZ—low-velocity zone. The reduction velocity is 8.0 km/s.
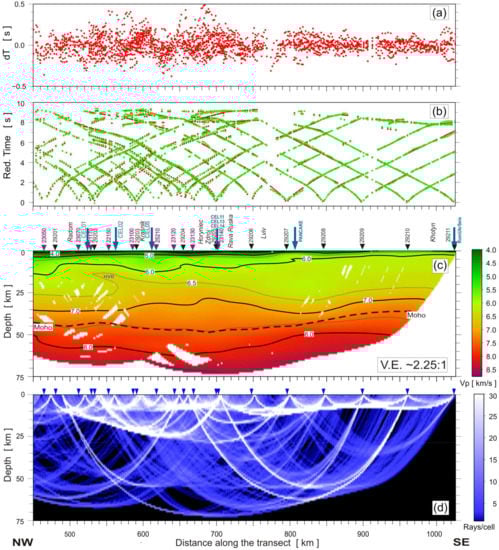
Figure 6.
Results of two-dimensional tomographic inversion of P-wave first arrival travel times obtained using the program package by Hole [105]. Diagrams show (a) Travel time residuals; (b) Theoretical and observed travel times; green points—observed P-wave arrivals, red points—theoretical travel times, reduction velocity is 8 km/s; (c) Two-dimensional tomographic P-wave velocity model, where numbers are velocities in km/s, black dashed line marks Moho interface, and HVB is the high-velocity body; (d) Ray coverage from tomographic modelling along the profile.
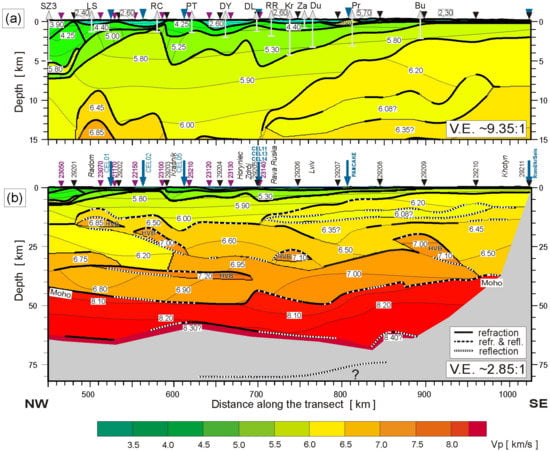
Figure 7.
Two-dimensional models of P-wave seismic velocities in the crust and upper mantle (a,b) along the TTZ-South and part of CEL03 profiles derived by forward ray-trace modelling using SEIS83 [106]. The initial model was based on information from other geophysical investigations in the region, such as drillholes (marked as bright vertical lines in (a): SZ3—Szwejki IG-3 (NE—7 km); LS—Lisów 1 (NE—24 km); RC—Rachów-1 (SW—3.2 km); PT—Potok IG-1 (NE—4 km); DY—Dyle IG-1 (NE—9 km); DL—Doliny-1 (SW—2.5 km); RR—Rava Ruska 4 (NE—8.4 km); Kr—Krekhiv 1 (NE—16.9 km); Za—Zashkiv 97 (NE—11.2 km); Du—Dublyany 3, no info; Pr—Peremyshlyany 1 (SW—5.5 km); Bu—Buchach 3 (SW—10.6 km)) and shallow reflection profiles. Thick, black solid, and dashed lines represent major velocity discontinuities (boundaries). HVB means a high velocity body. Only those parts of the discontinuities that have been constrained by reflected or refracted arrivals of P-waves are shown: solid line—refraction only; dashed line—refraction and reflection; dotted line—reflection only. Thinner lines represent inferred velocity isolines with values in km/s shown in white boxes. The positions of tectonic units at the surface, including the approximate extent of the TTZ along the profile, are indicated. Inverted triangles show positions of shot points. Blue arrows show intersections with other WARR profiles (cf. Figure 1). Wells considered when constructing an initial geological model prior to the velocity modelling are also shown. Vertical exaggeration is ~9.35:1 for the upper part of the model (a) and ~2.85:1 for the whole model (b).
Arrivals from within the crystalline crust include reflected events (PcP), typically at 50–150 km offsets, which are interpreted as reflections from boundaries within the crust, based upon the velocity changes modelled at the discontinuities (SP29204, SP29207). The strongest reflected arrivals from the crust arise from the PMP phase, the reflection from the Moho boundary. This phase is visible as secondary arrivals, typically in the offset range of 120–220 km. In some cases, PMP apparently continues as over-critical arrivals or merges with refracted arrivals (Pov) up to large offsets of 300 km (e.g., SP29204, SP29205, SP29210). Modelling of the overcritical PMP phase gives valuable information about lower crustal velocities and allows to estimate the maximum velocity in the lower crust. Particularly clear PMP phases are recorded in the sections of SP29201, SP29207, and SP29210 (Figure 5).
The refractions propagating in the uppermost mantle (Pn and perhaps Pmantle) are observed on several shot points for the offset range of about 200–500 km, sometimes with a high amplitude (e.g., SP29205). Their apparent velocity varies in the range of 8.0–8.4 km/s. We also observed waves probably reflected from uppermost mantle discontinuities, e.g., for SP29202, SP29204, and SP29205 at offsets of 250–370 km. A strong seismic phase from the lower lithosphere (Pmantle) is observed as a later arrival in record sections SP29204 and SP29205 at offsets of 300–400 km (Figure 5). It is characterized by a high apparent velocity of 8.5–9 km/s.
5. Seismic Modelling
5.1. Modelling Methods
Two methods for seismic data modelling were used. Firstly, 2D tomographic inversion was used to produce a smooth P-wave velocity model based on first arrival travel times. Secondly, ray-tracing trial-and-error modelling was performed. Finally, amplitudes of synthetic seismograms were computed using full waveform calculations with a finite-difference (FD) code, based on the final trial-and-error model.
5.1.1. Travel-Time Tomography
Tomographic inversion of the P-wave first arrivals of the TTZ-South, as well as the SE part of the CEL03 profiles, was conducted using the back-projection method proposed by Hole [105]. A model area measuring 1026 × 72 km (length × depth) was chosen. The 1D velocity-depth model that was utilized as the initial model for the 2D inversion was calculated using the Wiechert–Herglotz inversion method. The input for the Wiechert–Herglotz method was an average travel-time curve obtained by fitting a polynomial to all first-arrival picks. The first inversion steps were carried out for picks up to 60 km offset and in subsequent iterations, picks for up to maximum offsets of 120 km, 180 km, 360 km, and 690 km, respectively, were used, which corresponded to an increasing penetration depth of the seismic rays in the model. In total, 4196 P-wave first arrivals were used in the inversion process. In each iteration, smoothing filters were applied to the velocity corrections, which were then added to the previous velocity model. The size of the smoothing filter was gradually decreased with the number of the iteration, in order to start with a smooth solution and, in subsequent steps, to gradually increase the resolution of the model. The spacing of the model grid, which was 1 × 1 km, is definitely smaller than the obtainable resolution of the model itself. For the calculation of the final model, 45 iterations in total were used. The root mean square (RMS) travel-time residual for the final model was 140 ms.
The final model (Figure 6) illustrates the velocity distribution along the TTZ-South profile to a maximum depth of 70 km. The northwestern part of the model generally shows lower velocities in the upper crust compared to the southeastern section as shown by, for example, the depth of the 6 km/s isoline which decreases from ~15 km depth in the NW to ~2.5 km in the SE. Noteworthy is a wedge-shaped zone at a depth of about 15 km in the vicinity of SP29202 (HVB in Figure 6), with high velocities of over 6.5 km/s, which continues to a depth of ~30 km at a 750 km distance. It is surrounded by relatively low velocities (Vp = 6.2–6.3 km/s). Isolines with velocities of 7.0 km/s and 8.0 km/s are at depths of ~27–37 km and ~50–62 km, respectively.
Where can we expect the Moho boundary? The interpretation adopted here is based on the fact that the model parameterization and the smoothing applied in the tomographic inversion results in a smoothing of the velocity discontinuities. By estimating the velocities above and below the Moho from a known model for the studied area, we can use their average as an estimate of the velocity isoline which approximates the Moho location. For the northwestern portion of the transect, the respective velocity values are 6.8 and 8.1 km/s (Figure 6), and the average value is 7.45 km/s. For the central and southeastern portions of the transect, this approach suggests that the Moho should be interpreted approximately as the 7.55 and 7.35 km/s isolines, respectively. Adopting this approach, the Moho depths (dashed black line in Figure 6) vary from 45–50 km in the northwestern part of the profile via just over 50 km depth in the central part of the profile to about 40 km depth in the southeastern part of the profile.
5.1.2. Trial-and-Error Modelling Strategy
Trial-and-error forward modelling was carried out using the 2D SEIS83 code [106,107], supplemented with the graphical interfaces MODEL [108] and ZPLOT [109]. The algorithm implements the ray method for the calculation of ray paths, travel-times, and synthetic seismograms in the high-frequency approximation. The model consists of layers with smoothly varying velocities, separated by velocity discontinuities. In each layer, the P-wave velocity is parameterized on an arbitrarily defined rectangular grid and interpolated by bicubic splines.
For the preparation of the uppermost part of the initial model, available geological and geophysical data from boreholes located near the profile, as well as information on seismic velocities from previous refraction, WARR and shallow reflection seismic profiles were used. In this way, adding a priori information helped to produce the most realistic starting model to be further modified by the trial-and-error ray-tracing procedure. The top layers were then slightly changed if needed to satisfy the data recorded during this study.
Subsequently, the model was iteratively modified in order to reach an optimal travel-time fit. The simultaneous calculation of synthetic seismograms and a qualitative comparison of the amplitudes of synthetic and observed data was performed. This provided additional constraints on the velocity gradients and contrasts at velocity discontinuities. During each iteration, the model was modified in order to decrease the misfit and to ensure similar amplitudes between synthetic and observed data. The iterations proceeded until a satisfactory level of agreement between the observed and calculated travel-times and amplitudes for the main phases was reached and a final model was obtained (Figure 7). Examples of ray-trace forward modelling, as well as examples of synthetic seismograms, including full waveform synthetics, are shown in Figure 8 and Figure 9. A resolution analysis is shown in Figure 10.
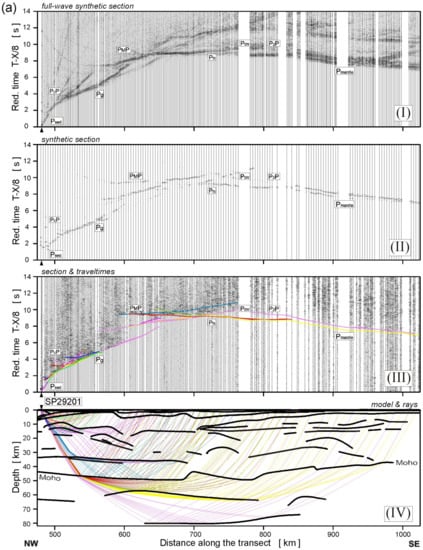
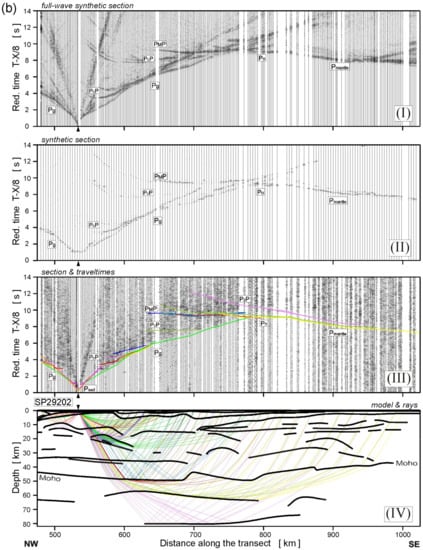
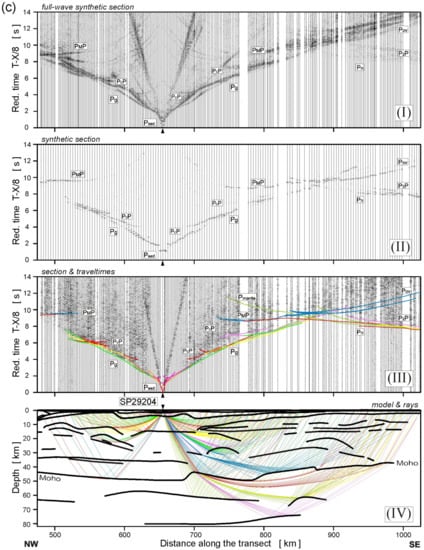
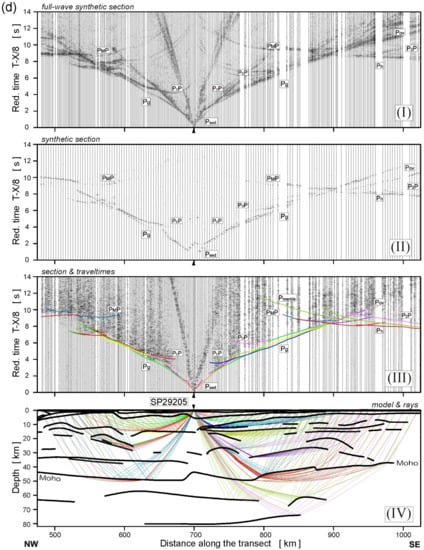
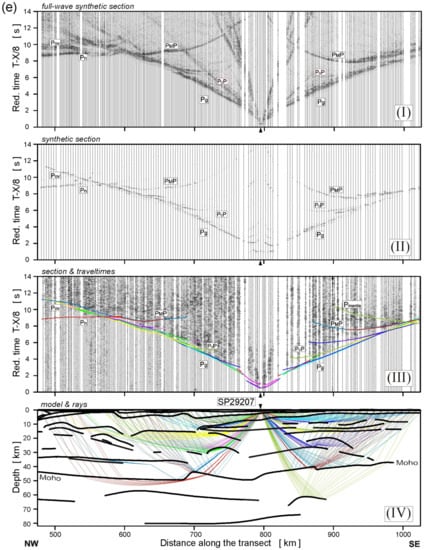
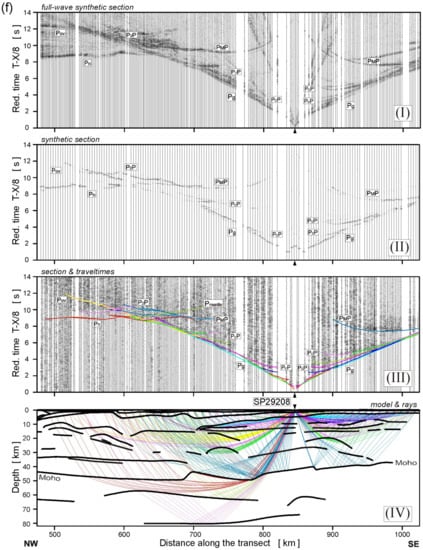

Figure 8.
Examples of seismic modelling along the TTZ-South profile, for the model presented in Figure 7: (a) SP29201, (b) SP29202, (c) SP29204, (d) SP29205, (e) SP29207, (f) SP29208 and (g) SP29210. Diagrams: (I) Full-wave synthetic seismograms derived from the SEIS83 velocity model using TESSERAL package [110]; (II) Synthetic seismograms derived by using the SEIS83 package; (III) Seismic record section (trace-normalized, vertical-component, 2–15 Hz band-pass filtered, reduction velocity of 8.0 km/s) of P-waves with theoretical travel-times calculated using SEIS83 [106]; (IV) Selected rays from SEIS83 defining the prominent model interfaces. Abbreviations of seismic phases as in Figure 5 and P1P, P2P—lower lithospheric P-wave reflections.
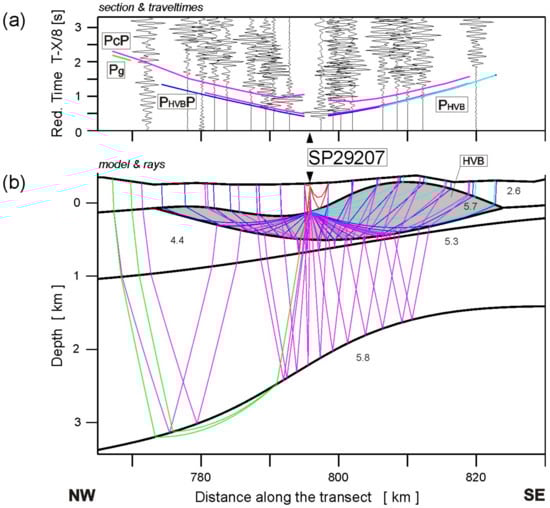
Figure 9.
Example of seismic modelling of the high-velocity body (HVB) in the upper crust near SP29207, along the TTZ-South profile. (a) Seismic record section of P-waves with theoretical travel-times for the corresponding model (Figure 7) calculated using the SEIS83 ray-tracing package [106]. The seismograms show the trace-normalized, vertical-component of ground motion band-pass filtered from 2–15 Hz. Reduction velocity is 8.0 km/s. (b) Ray diagram of selected rays using the SEIS83 package. Abbreviations of seismic phases as in Figure 5 and PHVB and PHVBP—refraction through and reflection from the base of the high-velocity body, respectively.

Figure 10.
Diagrams showing: (a) Travel-time residuals (b) Theoretical and observed travel-times (c) Ray coverage from forward modelling along the profile. Green points—observed P-wave arrivals, black circles—theoretical travel-times. Yellow lines—elements of discontinuities constrained by reflected phases. The red points plotted along the interfaces mark the bottoming points of the modelled reflected phases (every third point is plotted) and their density is a measure of the location accuracy of the reflectors. DWS—derivative weight sum. Reduction velocity is 8 km/s.
5.2. Crustal Model
For the Polish part of the profile, the initial model for trial-and-error modelling with SEIS83 software was based on the model previously calculated for the transect TTZ-CEL03 [28]. It should be noted that the NW end of the TTZ-South profile (SP292001) has an offset of ~12 km to the SW from profile TTZ-CEL03. This offset in location decreases to the SE and, in the vicinity of the Polish-Ukrainian border, the profiles overlap. For the Ukrainian part, the initial model was prepared based on the available data about the uppermost crustal structure, velocity measurements from six boreholes reaching 1–4.5 km depth, shallow reflection seismics (e.g., [42]), and geological studies. Unfortunately, all the boreholes were more than 5 km away from the profile, which may explain differences between the depths of the top crystalline basement estimated from borehole data for the southeasternmost part of the profile presented on the cross-section in Figure 11 (discussed later) and those interpreted from the model. A high-velocity body (HVB, Vp ~ 5.7 km/s) with a lens shape and a thickness of up to 1 km was detected near the surface in the vicinity of SP29207 (see Figure 7 and Figure 10). This body was not detected by the borehole Peremyshlyany-1 (Pr in Figure 7) located a short distance from SP29207, but distant from the profile (5.5 km to the SW). On the other hand, a similar body at a depth of ~300 m was detected along the PANCAKE profile at the crossing with the TTZ-South profile, and in another borehole commonly known as Peremyshlyany, ~7 km to the SE of the PANCAKE profile.

Figure 11.
Geological cross-section along the TTZ-South seismic profile. The section is much simplified, with no faults shown, 5 times vertically exaggerated and partly hypothetical, combining drillhole results for shallow levels with reflection seismic data of the PolandSPANTM project (as presented by Mikołajczak et al. [16] and Mikołajczak [26]) and wide-angle reflection/refraction seismic models from this and previous papers for deeper levels, and data from other sources (e.g., [42,111]). Faults are completely omitted as they mostly cannot be unambiguously interpreted from the available data, particularly when the profile stretches along or at a very low angle to the trend of the major structures. Along-strike projections of the range of several predicted locations for the Fennoscandia—Sarmatia suture (FSS, after [23,31,43], taking into account data from [24,25] and of the Orsha—Volhynia rift basin system (after [23,43]) from the East European craton are also shown.
The model for the Polish part of the profile is generally similar to the model for the southeastern part of the TTZ-CEL03 profile. However, in some places, the structure and depths have been slightly changed during modelling in order to fit the crustal and upper mantle travel-time data from the present profile. The total thickness of the uppermost sedimentary layer (layers with Vp: 2.6 km/s, 4.25–4.4 km/s, 3.9 km/s, 5.0–5.3 km/s) varies along the TTZ-South profile from ~7.5 km in the NW at 450 km distance to ~1.5 km at the distance of ~580 km. It then increases to ~5 km at distances of ~600 and ~700 km and gently decreases to a few hundred meters from a distance of 900 km to the SE end of the profile. The next layer (interpreted as comprising strongly lithified, mostly sedimentary Paleozoic and Ediacaran rocks) with Vp ~ 5.8–6.0 km/s presents a similar pattern, with a substantial depth of 10–15 km to the base of this layer in the NW, and the central part of the profile, up to a distance of ~700 km. Further SE, the depth to the base of this layer gradually decreases.
According to [112,113], these Paleozoic/Ediacaran sequences in the distance range 500–700 km are characterized by distinct azimuthal seismic anisotropy with a WNW-ESE-oriented fast axis as a result of extensive deformation (tight folding) of intrinsically anisotropic low-grade metasediments. Such anisotropy can explain an observed discrepancy in P-wave velocity in the uppermost crust at the intersection with the CEL02 profile (~570 km distance). The difference in velocities (~5.8–5.9 km/s along the TTZ-South profile and ~5.3–5.7 km/s along the CEL02 profile), is consistent with the results of the above-mentioned studies.
The top of the crystalline crust, with P-wave velocities of 6.15–6.25 km/s, is located at a ~2 km depth at the SE end of the seismic model and slopes gently to ~15 km at a distance of ~700 km. Further to the NW, at a depth of ~15 km, we observe a boundary in the mid-crustal layer with Vp ~ 6.5 km/s below it. Except for small changes of a few kilometres in depth, this boundary generally shallows and reaches a depth of ~10 km at a distance of ~500 km. At ~485 km, the layer with a high Vp of ~6.5 km/s disappears. From a distance of ~700 km towards the SE, the boundary at the top of the layer with a Vp of ~6.5 km/s occurs at depths of 15–20 km, although its course is not quite clear. In this part of the profile, above this boundary, within the upper crustal layer, a low-velocity layer (LVL) has been detected. Of course, it is not possible to accurately determine its Vp and thickness. The value of the velocity in the layer below the LVL is also only assumed. A similar LVL in the form of a lens with a decrease in velocity to 6.1 km/s has been obtained at the same depths, 10–17 km, also on the PANCAKE profile that intersects the TTZ-South profile at SP29207, at a 795 km distance. In general, it should be noted that there is a good agreement in the velocity models along both profiles, TTZ-South and PANCAKE, at their intersection. In detail, this refers to the sediment thickness (4–5 km), a thick upper crustal layer, extending to ~25 km depth, and the Moho depth, which was found to be ~45 km on both profiles. Only the top of the lower crust with Vp = 6.95–7.0 km/s is slightly higher (32 km) on the TTZ-South profile than on the PANCAKE profile (35 km).
The mid-crustal layer with Vp = 6.45–6.6 km/s has a thickness of ~7 km at a distance of ~500 km, and increases to ~15 km in the central part of the profile and to ~25 km, reaching the Moho boundary, at the SE end of the profile. This is in good agreement with the velocity model along the recently acquired RomUkrSeis profile (for location, see Figure 1; [104]), which crosses the TTZ-South profile at the southern end of the profile, at a 1020 km distance. Despite the fact that this region belongs to the marginal part of the profile at the SW slope of the Ukrainian Shield, one can see here the crust with the lowest velocity due to the large thickness of the middle crust with Vp = 6.45–6.55 km/s and the absence of high-velocity lower crust. Four high-velocity bodies (HVB) with Vp = 6.85–7.1 km/s were detected in this layer at distances of ~500 km, ~600 km, ~740 km, and ~900 km, at depths of ~15–25 km. The presence of these high-velocity bodies in the model is confirmed by travel-times of refracted and reflected phases for several seismic sections, e.g., SP29204, SP29205, SP29208, SP29211.
Deeper, between 450–600 km along the transect, a layer with a thickness of ~12 km and a lower Vp of ~6.2 km/s (?) reaching a depth of ~28–35 km was detected, similar to the model for the TTZ-CEL03 transect. Below, another high-velocity layer with a Vp of ~7.2 km/s, a large horizontal extent from ~500 km to ~700 km distance, and a thickness of up to ~5 km was detected at a depth of ~35 km (see Pov, SP29201). It is located slightly deeper and reaches much further to the SE than a similar HVB on the profile TTZ-CEL03, but a reflecting horizon was also detected at the intersection with the modified model for the CEL05 profile [78,100]. In the lower crust, a layer with a thickness of ~15–20 km and a Vp = 6.75–7.05 km/s was modelled from 450 km to ~960 km along the transect. Higher velocities (Vp = 6.95–7.05 km/s) were obtained in the lower crust of the Ukrainian sector of the profile at ~680–970 km distance, while in the Polish part, at distances of 450–680 km, the lower crust is characterised by slightly lower velocities (6.75–6.95 km/s) and the presence of a very thin HVB with Vp = 7.20 km/s, already mentioned above (Figure 7).
5.3. Moho Boundary and Upper Mantle
The model shows substantial variations in the Moho depth along the profile. Its position is modelled based on the PMP and Pn phases from several seismic sections from the TTZ-South profile and from the SE part of the CEL03 profile. At the NW end, the Moho is at ~42 km depth. Towards the SE, it deepens gradually for a while and then becomes almost horizontal at a depth of ~50 km at a distance of ~685 km along the transect. Further SE, the Moho discontinuity shallows rather abruptly over a short distance interval of ~25 km to ~43 km depth. Reflections from this steep slope are not observed. Further to the SE, the Moho gently sinks again, reaching a depth of ~50 km at a distance of ~785 km. From this point until the end of the profile, it shallows gradually, reaching a depth of ~37 km at the SE end of the model. The only small disturbance in this section is a rapid increase in depth by ~2 km at ~875 km along the transect. Almost the whole section of the Moho boundary from ~700 km to the SE is constrained by both PMP and Pn phases from several seismic sections. Furthermore, along the whole profile, the sub-Moho velocities are ~8.05–8.1 km/s, while at depths of 57–63 km the modelled mantle velocity reaches 8.2–8.25 km/s. Beneath the NW and central part of the profile, two sub-horizontal reflectors/refractors were modelled in the upper mantle. The first one, similar to one in the TTZ-CEL03 model, is ~20 km below the Moho at a depth of ~63 km. The second one at distances of 570–770 km, occurs ~10–15 km below the Moho at a depth of ~57–65 km. It is modelled based on the reflections and refractions (P1P, Pmantle, e.g., SP29202, Figure 8) from the TTZ-South profile and SE part of the CEL03 profile. In the southeastern part, at distances of ~835–880 km, at depths of ~60–68 km, a third reflector/refractor strongly sinking towards the northwest was modelled. P-wave velocities under these boundaries were modelled as 8.3–8.4 km/s based on the refracted phases from SP29201 and SP29202. In the central part of the profile, at distances of ~680–850 km, at a depth of ~80 km, one more reflector (P2P) was modelled (e.g., SP29201), slightly dipping to the NW.
5.4. Full Waveform Synthetic Sections
Full waveform synthetic sections were calculated using the Tesseral package [110]. The code is based on a fast and accurate finite–difference computational scheme. It allows for efficient calculation of the wavefield in an arbitrarily complex elastic medium. In the present study, as with the models of the GEORIFT 2013 [114] and RomUkrSeis profiles, the final ray-tracing velocity model (Figure 7) was transformed into the input model in the Tesseral format, which consists of a sequence of layers defined by layer-like polygons. Thus, individual layers of the final ray-tracing model were converted to polygons with the same P- and S-wave velocities as in the final ray-tracing model. Subsequently, the polygons were edited and smoothed. The surface topography was also taken into account. Several source wavelets were tested, and finally, the [115] wavelet with 10 Hz frequency was chosen. It allowed performing the calculations for such a large model in a reasonable time, given the available computational resources, and avoided spatial aliasing and numerical instability. Due to the large volume of input data, the computations were parallelized using a grid of computers [116]. Comparison of the full waveform synthetic sections with the observed seismic record sections, as well as the ray diagrams, are presented in Figure 8, respectively. We observed a good agreement between synthetic sections and observed data, which also confirms that the velocity model has a satisfactory accuracy, as discussed further in the article.
5.5. Resolution Analysis
The planning stage of any WARR experiment setup is very important. Any deviations of shot points or receiver positions from the profile line is a possible reason for future problems in the interpretation, e.g., if a shot point is located on rocks that are different from those where the nearby line of stations is located. Additionally, all shot and receiver points should be located in places guaranteeing the best energy propagation and shots, where the charge, type of explosives, drilling setup, and depths are very important and should be prepared for the best effectiveness.
During WARR projects, there are several factors which introduce errors in the experimental data, and, as a consequence, in the interpretation. The most significant errors originate from ordinary mistakes like wrong coordinates of shot points or receivers, as well as shot time measurement inaccuracies. Using modern GPS timing and positioning and careful geometry description during the fieldwork allows to easily avoid such problems. The data correctness in the sense of timing and location was tested by checking the reciprocity of the travel-time branches in the record sections. No problems were found. The accuracy of the ray-tracing technique depends mainly on the uncertainties of the subjectively picked travel-times, which are estimated in this project to be of the order of 0.1 s for the first arrivals and 0.2 s for later phases. Furthermore, the accuracy increases with increasing quality and amount of data, e.g., signal-to-noise ratio, the effectiveness of sources, number of shots and receivers. These parameters correspond to the calculated ray coverage of the seismic model.
The high quality of the recorded data made it possible to determine a velocity model that fitted the observed (experimental) travel-times for both refracted and reflected phases. Previous works (e.g., [79,97,98,117,118,119,120]) showed that the accuracy of such a modelling procedure is at best ±0.1 km/s and ±2 km, for P-wave velocity and Moho depth, respectively. A diagram showing travel-time residuals, a comparison of theoretical and observed travel-times for all the phases along the profile, and ray coverage from forward modeling, are shown in Figure 10. The RMS residual values derived from all the shot points and phases used for the modelling are exceptionally low. The total RMS residual value for 4045 picks is 0.08 s. Although the RMS values for the individual phases are similar, the modelling accuracy is marginally better for the Moho phases, being 0.077 s for Pn and PMP. The seismic velocity structure along the profile is precisely determined, and the model fits the data in the range of the picking precision.
6. Comparison with Previous DSS Profiles in the Area
As already stated, the TTZ, CEL03 and TTZ-South profiles jointly define a 1025 km-long lithospheric transect parallel to the southwest margin of the EEC. The discrepancies between the models for the SE part of the TTZ-CEL03 transect and for the respective part of the TTZ-South profile are largely minor and can be explained by differences in the location of both profiles. These minor discrepancies change neither the general image of the crustal structure nor the interpretation of the velocity model. The only significant qualitative discrepancy is the lack of the Moho boundary uplift from ~50 km to ~43 km depth in the final section of the Polish part of the TTZ-South profile at ~640 km distance along the transect, as was previously suggested based on the data from the TTZ-CEL03 [28]. Re-modelling of the wavefield in the seismic sections of the previous TTZ-CEL03 profile supplemented by the new data from the TTZ-South experiment allowed us to reliably model this part of the Moho boundary as extending sub-horizontally at ~50 km depth up to ~685 km distance along the transect. The relevant phases observed in the sections can be explained as signals from the mantle discontinuity at depths of ~53–60 km which is present in both models. A similar mantle discontinuity was also detected on the modified model for the CEL05 profile [78,100]. Further, a critical reconsideration of the data from the ends of the CEL11, CEL13, and CEL14 profiles does not permit a Moho boundary uplift at the intersection with the TTZ-South profile to 36 km depth, as was previously suggested [78,100], but an uplift to ~43 km depth is observed. Further southeast, where the TTZ-South profile crosses the PANCAKE profile [103], Moho depths are similar—close to ~47 km in both models. At the southeastern end of the TTZ-South profile, where it crosses the RomUkrSeis profile, the Moho boundary can be quite easily extrapolated to the depth of ~37 km which is found along the RomUkrSeis profile at the intersection [104].
On one of the profiles made in SE Poland and Western Ukraine in the 1970s and 1980s (profile VIII in Polish terminology, see, e.g., [77,121,122,123] and Geotraverse IV in Ukrainian terminology, see, e.g., [102]) the Moho boundary at the intersection with the TTZ-South profile (Figure 1) is much deeper, usually reaching depths of 65 km and is only locally uplifted to ~52 km. For modeling of the data from the old 1960s to 1980s profiles, in the interpretation of the reflected waves, the method of effective parameters was used (e.g., [78,124,125]). This method cannot provide reliable constraints on the velocities, in particular below reflectors. Given the DSS (WARR) acquisition conditions, the modelled value of the effective velocity may exceed the value of the mean velocity by as much as 10–15%. The effective depth determined from the reflected wave travel-times is also greater than the true depth of the reflecting boundary. The difference increases with increasing distance from the source, and with the DSS data, it may exceed 20–30% [125].
7. Tectonic Interpretation and Discussion
7.1. Near Surface Geology along the TTZ-South Profile
A simplified geological cross-section (Figure 11) has been made along the entire length of the TTZ-South seismic profile in order to show the shallow geological features of SW Poland and westernmost Ukraine relevant to the tectonic interpretation of the seismic results. The cross-section is much simplified through removing all faults because of insufficient data and the existing fundamental controversies as to the structural style of faults mapped on the surface (interpreted as subvertical ones by Narkiewicz in [8,18,57] but, based on seismic arguments, considered as shallow-dipping thrust-type discontinuities by Krzywiec et al. [14,15]). Introducing faults would also cause additional difficulties as the TTZ-South profile extends along or at a very low angle to the trend of most major tectonic discontinuities in the Paleozoic and Mesozoic strata. The cross-section combines information from borehole data and diverse published geological maps, including surficial and subcrop maps constructed at various structural levels [39,40,41], horizontal section maps by Kotański et al. [111], as well as the interpretation of the PolandSPANTM project seismic reflection results (as presented on structural maps by Mikołajczak et al. [16] and Mikołajczak [26]. The position of the crystalline basement top was derived from the TTZ-South and previous seismic velocity models. For the sake of simplicity concerning the tectonic interpretation, both the cross-section in question (Figure 11) and the TTZ-South seismic model (Figure 8) are described below in the inverted sequence of kilometres originally measured along the profile during the data acquisition (i.e., starting the description from the simplest structure at profile km 1025, henceforth referred to just as km 1025, at the SE end, and moving to km 450 at the NW end).
In the southeastern part of the TTZ-South profile, in Ukraine, a simple platformal structure is presented on the cross-section (Figure 11), with a crystalline Paleoproterozoic to Archean basement of the EEC, capped by Ediacaran through Carboniferous cover and a thin veneer of Cretaceous deposits. The cover is tectonically undisturbed from the SE end of the profile at km 1025, up to km ~750, where, near Lviv, it starts showing symptoms of late Carboniferous, Variscan tectonic deformation ([36]; not visible at the scale of the cross-section). This marks a passage from the Precambrian EEP to the PP at the cover level cf. [13,56], where the deformed Ediacaran through Carboniferous strata take on the role of the platform basement with respect to the overlying undeformed (Permo-) Meso-Cenozoic succession.
The top of the EEC crystalline basement continues NW-ward, apparently undisturbed, below the tectonized Ediacaran-to-Palaeozoic succession, while systematically increasing in depth, from ~0.3 km near the SE end of the profile to ~4.5 km at around km 800 and to ~14 km at km 695. Subsequently, the basement top attains its maximum depth in excess of 15 km at km ~640 on the TTZ-South profile and, afterward, oscillates, shallowing again to ~12 km at km 580 and even to ~9 km at km ~510, before deepening to >15 km at km 450, at the NW end of the transect.
The Neoproterozoic (Ediacaran) through Carboniferous sedimentary succession gradually thickens from the SE to the NW along the TTZ-South profile, from the initial ~0.3 km to ~6 km near Lviv (at km ~770). Further northwest, the Ediacaran member of the succession enormously increases in thickness, attaining ~11 km at km 695, to ultimately reach at least 16 km at km 680–620 and, probably, to wedge out at km ~530. The thickening is accompanied by a ~6–7 km-elevation of the Ediacaran top, which is draped by the overlying Cambrian through Devonian and, now almost completely eroded, Carboniferous strata. The elevation defines the prominent Narol structural high, where (at km ~690–600) successive Paleozoic members subcrop at the base Jurassic and/or base Miocene level. This structural high has been described in the literature as the Narol structural unit or Biłogoraj-Narol block (Dadlez in [18,28]). Its continuation in Ukraine is the Rava-Ruska zone to the SW of the Rava-Ruska fault ([36]; labelled as RRf in Figure 3b), where at km 715–690 Lower Paleozoic strata subcrop at the base Jurassic (Figure 11).
The thick Ediacaran succession is interpreted in the literature as a product of late Neoproterozoic rifting along (and across) the SW Baltica margin and deposition in the Orsha-Volhynia rift system basin near its intersection with the Tornquist rift (see below). This was followed by thermal subsidence in the Peri-Baltica basin system during the Cambrian and Ordovician and by Silurian flexural bending of the basin floor in the foredeep zone of the Caledonian orogenic belt [59,60,66]. The post-orogenic Devonian succession is siliciclastic in its lower and carbonate in its middle and upper parts (e.g., [126]). Its formation preceded the deposition of syn- to late-orogenic Carboniferous clastics in the peripheral part of the extensive Variscan foreland basin (e.g., [13,127]), deformed by the late Variscan tectonism to the NW of Lviv [36]. The Devonian and Carboniferous sediments have recorded the main stage of deposition in the Lviv basin, which was preceded by subsidence in the Ediacaran (Vendian), Cambrian, and Silurian.
The overlying unconformable epicontinental, mostly shallow marine Jurassic and Cretaceous through Cenozoic sedimentary successions show a total thickness not exceeding 1 km over the most part of the profile. It is only at its NW end, from km ~540 to 450, that the quickly NW-ward thickening (up to 2.5 km) Permian and Triassic strata of the peripheral SE part of the Polish basin become the lower members of the Palaeozoic platform post-orogenic cover.
7.2. Crustal Structure
The crust along the TTZ-South transect, as represented by the seismic velocity model (Figure 7 and Figure 12), is characterized by:

Figure 12.
Tectonic interpretation of the TTZ-South seismic velocity model shown on a 2.85 times vertically exaggerated section of the upper lithosphere. Locations of the TT zone (TTZ) and TT line (TTL) are projected, respectively, from maps in [9,18,26,38]; an approximate range of top basement locations for the Fennoscandia-Sarmatia suture (FSS) and the Orsha-Volhynia rift basin are extrapolated, respectively, from maps in [23,25,30,31,43,58]). Abbreviations: BPGB—Belarus-Podlasie granulite belt; bu—basement unit; EEC—East European craton; HVB—high-velocity body; OHB—Okolovo-Holeszow belt; OMIB—Osnitsk-Mikashevichi igneous belt. Geochronological terms: Ar—Archean; Edc—Ediacaran; Mz—Mesozoic; P—Permian; Ptz—Proterozoic; Pz—Paleozoic.
- Variable arrangement of crystalline crustal layers, changing both laterally and vertically along the transect, with four-layer and three-layer segments in various configurations;
- A tectonic imbrication style with NW-vergent wedge-shaped crustal-scale structural units, likely indicative of a thick-skinned thrust stacking and/or—conversely—of a possible large-scale extensional deformation of SE-polarity;
- Frequent Moho depth changes along the transect, particularly in its central and SE segments which, in general, seem to accommodate the overlying crustal structure complexities;
- Laterally extensive Vp inversion interfaces, where rocks with higher seismic velocities rest on top of those with lower velocities;
- The presence of high-velocity, lens-shaped bodies distributed along the bottom part of the middle crust or near the top of the lower crust;
- A topmost, sedimentary layer of low, ~2 km thickness in the SE in Ukraine, which gradually increases to the NW, up to as much as 8 to 18 km in the Polish part of the TTZ-South profile.
The longest profile segment at km 1025–700 in the SE (Figure 7 and Figure 12), covering the entire Ukrainian part of the transect, in general exhibits a four-layer crustal structure, with (1) an uppermost sedimentary layer (Vp ~ 2.6–6 km/s), (2) crystalline upper crust (Vp ~ 6.15–6.35 km/s), (3) middle crust (Vp ~ 6.40–6.65 km/s) and (4) lower crust (Vp ~ 6.95–7.05 km/s). However, the individual crystalline layers exhibit thickness changes along the profile, due to an undulating, SE-dipping structural discontinuity of apparently tectonic origin, which crosses the entire crystalline crust from its top at km 705 to its base at km 965 to 1025 (Figure 12).
In the successive TTZ-profile segment from km 705 to 600, the crust is composed of only three layers (though with some internal complexities), being deprived of the crystalline upper crust. Still further to the NW, from km 600 to 485, a four-layer structure can, once again, be seen on the velocity model (Figure 12). However, in contrast to the southeastern profile segment from km 1025 to 700, the crystalline upper crust (identified as such with Vp ranging between 6.15 and 6.25 km/s) in the segment from km 600 to 485 underlies, rather than overlies, the middle crust (Vp ~ 6.45–6.65). The northwestern segment of the profile, from km 485 to 450 shows, once more, a three-layer structure, as does the segment from km 705 to 600. However, unlike the latter, it is devoid of the middle crust, and not the crystalline upper crust.
The Moho varies in depth along the transect from a minimum of 37 km in the SE, at km 980, to a maximum value of 49 km at km 780 and, again, from km 685 to ~630. Between km 685 and the SE end of the transect, depth variations of the Moho occur—some of them abrupt (a rise of ~7 km from km 685 to 700; a drop by ~4 km from km 870 to 875), and others gradual (a descent from ~43 km at km 700 to ~50 km at km 780 and a general ascent to the SW of km 780). To the NW of the Moho depth maximum from km 630 to 685, there is a uniform, gradual, very gentle Moho rise to 42 km at the NW end of the transect at km 450.
The TTZ-South velocity model yields information on the uppermost mantle to a depth of 60–65 km, except for the “blind” SE end of the transect. The mantle rocks are characterized by Vp ~ 8.05–8.25 km/s directly below the Moho and by Vp possibly as high as 8.30–8.40 km/s below extensive undulating, reflecting/refracting horizons, occurring at a depth of 57–65 km.
From the tectonic point of view, the TTZ-South transect can be divided into two, SE and NW, halves (Figure 2a, Figure 3a,b, and Figure 12). The SE half covers the Ukrainian part of the transect and, tectonically, is entirely located within the interior of the East European craton (EEC) in its Sarmatian crustal segment. The NW half, located in Poland, occurs in a transitional position (1) between the Sarmatian and Fennoscandian segments of the EEC cf. [23,29,30,43,58] and (2) between the craton and the Trans-European Suture zone (TESZ) of the PP (cf., e.g., [1,3,6,7]).
The SE, ‘cratonic’ segment of the TTZ-South transect shows systematic SE-ward thinning of the crust (Figure 12 and Figure 13), starting from km 785, and is reflected in a consistent rising of the Moho from 49 to 37 km, accompanied by a SE-ward thickness reduction and eventual disappearance of the lower crust. On the other hand, the ‘transitional’, NW half of the transect, occurring to the NW of km 700, is related to a crust of a more stable and—in general—greater thickness, mostly in excess of 45 km, whose internal structure is, however, more complex than that in the SE half. In our interpretation, discussed in more detail below, the two halves of the transect below the sedimentary layer consist of the EEC crystalline basement, showing significant effects of Paleoproterozoic NW-vergent, crustal- or even lithospheric-scale thrusting, which was probably followed by a later extensional event that resulted in the formation of a deep, rift-related Ediacaran basin within the uppermost, sedimentary crustal layer. The basin fill was then buried below Paleozoic strata and deformed by the late Carboniferous Variscan orogeny (Figure 3b).
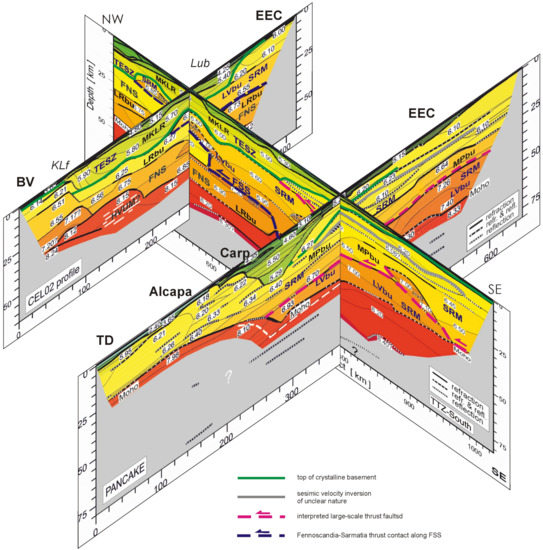
Figure 13.
Tectonic relationships across the TTZ-South seismic profile derived from the earlier CEL02 and PANCAKE profiles running at a high angle to it (for location see Figure 1). For simplicity, the profiles are assumed to intersect at 90° and no attempts were made to reduce depth discrepancies of the same features interpreted on different profiles. Abbreviations: BV—Brunovistulian terrane; Carp—Carpathian orogen; EEC—East European craton; FNS—Fennoscandia; FSS—Fennoscandia-Sarmatia suture; HVUM?—high-velocity upper mantle; KLf—Krakow-Lubliniec fault zone; LRbu—Lysogoro-Radomian basement unit; Lub—Lublin basin; LVbu—Lublino-Volhynian basement unit; MKLR—Małopolska-Kielce-Lysogory-Radom terrane assemblage; MPbu—Moldavo-Podolian basement unit; SRM—Sarmatia, TD—Tisa-Dacia crustal block; TESZ—Trans-European Suture zone.
7.2.1. Sarmatia—Fennoscandia Contact
As an important key to the tectonic interpretation of the TTZ-South transect, we consider the possible implications of its expected intersection at around km 450 to 600 (Figure 11) with the deeply buried southwestern extension of the Paleoproterozoic Fennoscandia-Sarmatia suture (FSS) known from the EEC crystalline basement further to the NE ([23,30,31,43,58]; see also [25] and Section 2.2 in this paper).
Thus it seems justified to look for possible effects of a major collisional-type tectonic discontinuity in the crystalline basement as reflected by the seismic model of the transect (Figure 7 and Figure 12).
Furthermore, at around km 600, at the mid and lower crustal levels, an abrupt change occurs in the tectonic pattern, where the three-layer, horizontal crustal structure occurring to the SE (Figure 7 and Figure 12), is replaced to the NW by an apparently four-layer structure reaching to km 485. This four-layer structure shows a distinct velocity inversion at 17 to 25 km depth, defined by an offshoot of the middle crust, branching from the main Sarmatian cratonic middle crustal body from km ~600 to 800 (Figure 12). This offshoot rests on top of the crystalline upper crustal layer of what, based on comparison with data from the CEL02 and CEL01 profiles [78], can be identified as a lateral continuation of the deep basement to the shallow-level structural units (or terranes) of the Małopolska block and Kielce and Lysogory-Radom fold belts (below collectively referred to as the MKLR).
This upper crustal tectonic insert of the MKLR basement, occurring between the middle and lower crustal layers, does not continue SE-ward beyond km 600. At the same time, the underlying lower crust from km ~600 to km 700, becomes included in the already mentioned three-layer structure of the segment SE of km 600. However, on closer inspection the lower crust from km ~600 to 700 appears to be of a complex nature with an upper, “faster” (Vp ~ 6.90–7.05 km/s) layer, which continues from Ukraine to km ~600, overlying a slightly “slower” layer (Vp ~ 6.75–6.95 km/s, except in the HVB near the top) that starts at km 700 and extends to the NW at the bottom of the crust.
This situation can be reliably interpreted in terms of a map-view continuation to the SW towards the TTZ-South transect of the Fennoscandia-Sarmatia suture (FSS), along the structural grain of the EEC (Figure 2b and Figure 3b). The interpreted location of the suture on maps by Bogdanova et al. [30,31,58] was changed in [23,43], due to the recent reinterpretation and assignment of the Okolowo-Holeszów and Belarus-Podlasie belts/terranes (see Figure 2a,b) to the Sarmatia crustal domain of the EEC. These belts/terranes were earlier considered being part of Fennoscandia. In their recent paper, however, based on reflection seismic arguments, Mężyk et al. [24] maintain that the FSS “cannot be interpreted as a localised lithospheric discontinuity” following the Minsk fault (see Figure 2b), but rather as a “diffused cryptic” one, split into the particular terranes within the NW Sarmatian margin and their respective boundaries. Taking into account all of these variants, we show the FSS position according to the relatively recent interpretation of [23] in the map of Figure 3b, while presenting the entire postulated map-based location range in Figure 11 and Figure 12. Figure 14 offers, however, a new, localised FSS position based on the tectonic interpretation of the TTZ-South Vp model presented in this paper (see below). The latter, localised, FSS position appears to be in agreement with that on the map in Figure 3b.
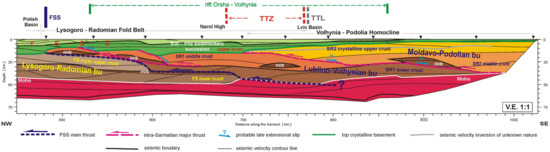
Figure 14.
True-scale, schematic tectonic section showing structural geometry of extensive NW-vergent, wedge-shaped, flat-lying, crustal-scale thrust units composing the crystalline basement of the East European craton at and SE of the junction between the Fennoscandian and Sarmatian crustal segments. Abbreviations: bu—basement unit; Edc—Ediacaran; FS—Fennoscandia; FSS—Fennoscandia-Sarmatia suture; HVB—high-velocity body; Phz—Phanerozoic; SR—Sarmatia (with numbers 1 and 2 denoting crustal variations in distinct tectonic units); TESZ—Trans-European Suture zone. Thin solid lines within particular crustal layers are Vp contours from the seismic model; the thick line in the uppermost mantle follows a refractive/reflective horizon.
From the structural geometry relationships between the particular crustal units represented on the TTZ-South seismic model (Figure 12), one can infer the FSS as a major, crustal-scale overthrust. It juxtaposes the upper plate middle and lower crust of the Sarmatia segment of the EEC, extending to the NW from the central and southeastern parts of the model, against the lower plate crystalline upper and lower crust of the Fennoscandia segment of the craton, occupying the northwesternmost part. The latter, Fennoscandian crust constitutes the deep basement to the TESZ domain of the PP (Figure 1 and Figure 2a, Figure 13 and Figure 14), which in its shallow crustal level is composed of the variously tectonically deformed Ediacaran-Paleozoic sedimentary sequences of the MKLR structural units/terranes. This Fennoscandian deep basement to the MKLR terranes, in particular to the Lysogory-Radom Variscan fold belt (Figure 3b), which are recorded by the TTZ-South profile at a shallow level in its northwestern part, is here named the Lysogoro-Radomian deep basement unit (Figure 12 and Figure 14). Thus, the 7–12 km thick mid-crustal layer, with its base shallowing NW-ward from 28 to 14 km between km 600 and 480, is here interpreted to represent a northwesterly extension (offshoot) of the Sarmatia middle crust, branching off from the main mid-crustal body located SE of km 600. The 10–15 km thick upper crustal layer underlying the Sarmatian offshoot and the 12–17 km thick lower crustal units have been identified on the SW-NE trending CEL02 seismic profile and can be successfully followed laterally cf. [78] into the basement of the Małopolska (M), Kielce (K) and Lysogory-Radom (LR) terranes of the MKLR domain. The CEL02 profile also shows [78] that the middle crustal offshoot of Sarmatia, overlying the crystalline upper crust between km 485 and 600 on the TTZ-South profile, tapers off soon to the SW. The Sarmatian middle crust also wedges out to the SW on the profile CEL05 [78]. The difference with CEL02 is that there is no upper crustal intercalation occurring below the middle crust.
The above discussed lower plate of the FSS thrust system is considered here to represent the Fennoscandian province of the EEC, and not a primary deep basement of the MKLR Ediacaran-Palaeozoic terranes, since both this plate and the juxtaposing/overlying Sarmatian plate, together with the tectonic contact between them, appear on the TTZ-South seismic section to be overstepped by thick Ediacaran and Palaeozoic sedimentary successions of the MKLR structural units. Therefore, the juxtaposition must have occurred before Ediacaran times, i.e., before the formation of the MKLR successions and their possible accretion to the EEC within the TESZ domain.
The staircase trajectory cf. [128] of the FSS overthrust interpreted by us on the seismic model (Figure 12) appears to resemble a “ramp-and-flat” geometry, regarded as typical of thrust tectonics and often recognized at shallower crustal levels, in which thrusts commonly propagate ”up-section” in their attempt to ultimately reach the surface (e.g., [128,129,130]). Nevertheless, its locally sharp, dogleg shape can partly be an artefact, due to a somewhat arbitrarily plotted subvertical velocity boundary between ~6.25 and ~6.90 km/s domains at 27–35 km depth at km ~600 on the seismic model and, also, result from the vertical exaggeration of the model (cf. a relatively smooth staircase geometry on a true-shape cross-section in Figure 14)
A thrust-type contact between the Sarmatia and Fennoscandia segments of the EEC, as shown in Figure 12 and Figure 14, explains the abrupt Moho depth increase from 43 km at km 700 to 49 km at km 685 as a result of the lower crustal duplexing due to the Sarmatia lower crust overthrusting that of Fennoscandia.
As already mentioned, the crustal-scale geometry and structural characteristics of the contact between Fennoscandia and Sarmatia were recently analysed by Mężyk et al. [24] in an area located directly NE of the TTZ-South transect, over the EEC area proper. Using deep reflection seismic data of the PolandSPAN™ survey, these authors advocate for a NW-vergent, complex, diffuse, thrust wedge-like geometry of the contact zone in question, ~150 km wide and “rooted at the lower-middle crust interface underneath the Ivanowo-Borisov zone” (cf. Figure 2a,b).
The tectonic interpretation presented in this paper is based on a different type of seismic data, and, hence, apparently dissimilar in many details in comparison to that of [24]. Nevertheless, it appears broadly in agreement with the general conclusions of the latter authors, in particular those concerning the wedge-shaped structural geometry, polarity, and approximate location of the Fennoscandia-Sarmatia contact zone. At the same time, the interpretation presented here seems to be more geologically straightforward, since it shows the extent of particular tectonic units with their specific geophysical characteristics (defined by the respective areas of the Vp field), which facilitates analysis concerning the tectonic nature and evolution of crustal and sub-crustal structures. In this way, the two papers in question seem to be mutually complementary in supplying up-to-date knowledge on the FSS in the Polish part of the EEC.
7.2.2. The Sarmatian Domain: Two Major and Two Minor Crustal Units
The Sarmatian crustal segment of the EEC on the TTZ-South seismic model (Figure 12 and Figure 14) is composed of two distinct wedge-shaped major tectonic basement units, the Lublino-Volhynian, in the northwest and Moldavo-Podolian in the southeast, both of different crustal structures. The latter is overthrust to the NW over the former, which, in turn, tectonically overlies the Fennoscandian, Lysogoro-Radomian deep basement unit across the FSS.
The Lublino-Volhynian basement unit extends NW-ward at relatively shallow levels, ranging between 27 and 8 km depth, including the already mentioned “offshoot” of the Sarmatian middle crust between km 600 and 480. We interpret this offshoot to be likely composed of two smaller-scale thrust slices, corresponding to the Belarus-Podlasie and Okołowo-Holeszów accretionary belts (terranes) of the NW margin of Sarmatia ([23,43]; Figure 2a,b). Both of these belts took part in the Paleoproterozoic, collision-related overthrusting of Fennoscandia together with the main Sarmatian rock mass, the Lublino-Volhynian basement unit at its leading edge.
Within the Sarmatian crustal segment of the EEC, on the basis of the velocity models from the TTZ-South, RomUkrSeis and DOBRE-4 deep seismic profiles, a southeastern, Moldavo-Podolian basement unit is here distinguished, in addition to the “Sarmatian crust proper”, represented by the Lublino-Volhynian basement unit (Figure 12). The Moldavo-Podolian unit seems to be of distinct composition and affinities from the “Sarmatian proper” Lublino-Volhynian basement unit, being typified by the lack of >6.9 km/s lower crust and a basement structure composed of two crustal layers, the lower with 6.45–6.55 km/s “middle crust” and the upper with ~6.15 to 6.35 km/s “crystalline upper crust” seismic velocities. The Moldavo-Podolian unit is thrust over the Lublino-Volhynian basement unit between km 965 and 705. The latter unit is composed, in turn, of “true” lower crustal (with Vp from 6.9 to 7.05 km/s) and middle crustal (Vp from 6.45 to 6.65 km/s) layers.
In the Ukrainian half of the TTZ-South seismic transect (SE of km 700), entirely composed of the Sarmatian basement, the boundaries between the upper, middle, and lower crustal layers, together with the Moho and other detected reflectors and refractors, are mainly very gently inclined to the NW. As examples, we note the top of the crystalline crust between km 890 and 705 and the Moho between km 980 and 780. Near the surface, this translates into the westerly dipping Volhyno-Podolian homocline (Figure 3b, Figure 11, Figure 12, and Figure 14).
At around km 785, the Moho assumes its maximum depth in the Ukrainian segment of the transect, equivalent to the maximum crustal thickness of 49 km. The Moho and the top of the lower crust, on approaching this point from both the SE and NW, are inclined towards it and, thus, define a very gentle mid- to lower-crustal synform between, approximately, km 690 and 870 along the transect. Its origin does not seem to have anything to do with crustal-scale buckling but can be explained as due to a passage from the zone with a relatively thick crust NW of km 785, to the zone located SE of this point, where the crust becomes progressively thinner along the transect, up to at least km 970. The inclination of the NW limb of this synform parallels and accommodates the involvement of the lower and middle crustal layers in the Lublino-Volhynian unit overriding the Fennoscandian unit to the NW. At the same time, it geometrically fits the overlying frontal thrust of the Moldavo-Podolian basement unit ascending over the Lublino-Volhynian unit from the SE (Figure 12 and Figure 14).
7.2.3. Extensional Features of Sarmatian Crust
Apart from the clear record of crustal-scale contraction and the NW-directed overthrusting of the Sarmatian basement units, the TTZ-South profile also reveals certain structural features that can be considered as being due to later tectonic extension. These features (Figure 12), interpretable in terms of displacements on a large-scale extensional detachment system, comprise (1) elevation changes of up to ~7 km of the top crystalline basement surface at km ~520–535 and km ~580–605 km, showing depressed SE sides of the BPGP and OHB units, interpreted here as large-scale tectonic slices that were earlier thrust to the NW and (2) an apparent ‘rollover’ (or ‘half-graben’) morphology of the NW-dipping slopes in the three downthrown slices—the OHB, the Ivanovo-Borisov zone of the Lublino-Volhynian basement unit, and the Moldavo-Podolian basement unit. This rollover morphology is partly also expressed by sags in the Vp contour lines, such as that of the top middle crust at km 795–830 on approaching at a high angle the SE-dipping, listric-shaped surface underlying this part of the middle crust, here interpreted as a probable extensional detachment, reactivating an original NW-vergent thrust. This hypothesized extensional detachment, as well as the others interpreted on the section are, thus, considered here as having developed through inversion of the sense of displacement on the former thrusts (Figure 12 and Figure 14). Another extensional feature could possibly be the turtleback shape of the lower crust top from km 770 to 960, underlying the base of the Moldavo-Podolian basement unit.
The spectacular wedging out to zero of the lower crust from km 880 to 960 (Figure 12) in the footwall of the probable low-angle extensional detachment which, theoretically, might have removed the lower crust continuation in the hanging wall, only at first sight appears to be another convincing argument in favour of large-scale extensional deformation in the southern part of the Sarmatian domain of the EEC. The lack of the lower crust continues, however, as far SE as the Black Sea coast north of Dobruja, i.e., at a distance of ~350 km cf. [131], and also by at least ~200 km to the NE along the RomUkrSeis seismic transect [104], beyond its intersection with the EUROBRIDGE’97 profile. This speaks in favour of a distinct crustal structure and separate origin of the Moldavo-Podolian unit with respect to the Lublino-Volhynian unit and not of a tectonic removal of the lower crust to the rear part of the former unit.
The overall configuration of the hypothetical extensional detachment system on the TTZ-South seismic model, with its turtleback-like swell of the top of the lower crust between km ~770 and 960, together with the inferred displacement effects, can be hypothetically compared to those involved in the formation of metamorphic core complexes cf. [132,133,134,135], although this process does not seem to be much advanced here. As mentioned earlier, the hypothetical extensional detachment in question must have reactivated the earlier collision-related thrust.
The structural characteristics of the Sarmatian crust interpreted from the TTZ-South seismic model over a ~500 km-long section seem to be very different from those described and illustrated by Bogdanova et al. [31] along a ~300 km-long section of EUROBRIDGE’96 crossing the Sarmatian side of the FSS (near Minsk; the Central Belarus suture of the latter authors). Nevertheless, considering these two profiles in very general terms, one can realize that both, though differently, are interpreted in terms of the original, compressional, collisional nature of the contact between the Sarmatian and Fennoscandian crusts and later extensional tectonism.
7.2.4. Moho and Uppermost Mantle
The two Moho depressions (at km 685 and 775), coincide with the two boundaries of the TTZ delineated on the maps by [9,16,26], and projected on the TTZ-South profile (Figure 3b and Figure 12). This coincidence is fully in line with the criteria (variation in the Moho depth) these authors used for tracing their TTZ “corridor” on maps. In our tectonic interpretation, the first depression marks the SE end of the Fennoscandia lower crust, overridden from the SE by the Lublino-Volhynian unit of Sarmatia with its own, distinct, lower crust at its base. In consequence, the lower crust is tectonically duplicated at km 590–690, which results in an abrupt increase in the Moho depth by 7–8 km from km 700 to 690 and the subhorizontal continuation of the Moho to the NW at roughly the same depth. Since no negative gravity anomaly occurs above the tectonically thickened lower crust (Figure 7), an increased density (probably reflected in Vp) of the uppermost mantle below this area can be expected to meet the requirements of isostatic equilibrium and, indeed, such a Vp increase seems to be present on the seismic model (Figure 12).
Paradoxically, below the Orsha-Volhynia rift, from km ~530 to 830, the crustal thickness and Moho depth are at their maximum along the TTZ-South profile, reaching almost 50 km. From km 690 to the SE the Moho varies in depth, being involved in the already described ~250 km wide, crustal-scale synform. This involvement results in consistent shallowing of the Moho from 50 km depth at km 780, where the axis of the synform occurs, to ~32 km depth at km 960–980.
Within the upper mantle, at depths varying between 60 and 80 km, two generally subhorizontal, Moho-subparallel, though in places gently folded, ~60 to 250 km long reflectors/refractors occur. They may represent fossil thrust surfaces (or, conversely, low-angle extensional detachments due to the breakup of Rodinia?), whose relationships with the intra-crustal thrust systems, although possible, cannot be perceived on the seismic velocity model. The general arrangement of reflectors in the Ukrainian part of the upper mantle, between km 700 and 980, at depths varying between 60 and 80 km, seems to roughly follow the synformal pattern of the overlying Sarmatian lower crust top. This, together with the Moho-subparallel attitude of the Vp field contours on the seismic model, points to the top part of the upper mantle involvement in the synform formation, which probably post-dated the NW-ward thrusting of the Volhynian and Moldavo-Podolian units. The accompanying SE-ward thinning of the crust to the SE of km 780 seems to be either the result of isostatic rebound of the crust following the tectonic emplacement of the lighter and thinner Moldavo-Podolian unit on top of the Lublino-Volhynian unit or of extensional processes, which must have occurred in several extension episodes, spanning the wide time interval between the Paleoproterozoic and Cenozoic (see below).
7.2.5. Crystalline Basement Changes across the TTZ
All the deep seismic refraction profiles crossing at high angles the northern part of the TTZ-South transect, i.e., CEL01, CEL02, and CEL05 (Figure 1) show the crystalline upper crust of the EEC, together with the middle crust, to wedge out to the SW beneath the Lublin basin and to terminate (or nearly terminate) approximately on approaching the TTZ-South profile [38,78,79]. Furthermore, CEL02 [78] illustrates thinning and SW-ward disappearance of the Sarmatian middle crust offshoot (Figure 13) which, according to the interpretation presented here, is thrust over the Małopolska-Kielce-Lysogory-Radom crystalline upper crustal basement (the Lysogoro-Radomian basement unit) along the FSS (Figure 12). CEL01, in turn, also shows an extreme SW-ward thinning of both the middle crust and crystalline upper crust of the Fennoscandia structural units of the EEC on approaching and a structural discontinuity on arriving at a major high-velocity body (HVB), just before reaching the TTZ-South line [78].
Consequently, to the SW of the TTZ-South line along its NW segment, there seems to be no continuation of the middle crust from the EEC to the southwest. Further, the upper crystalline crust on the SW side of the TTZ-South transect may well be distinct from that occurring on the NE side. According to the seismic models resulting from the TTZ-South CEL01, CEL02, and CEL05 profiles, it is only the lower crust, that seems to be relatively reliably followable from the EEC interior to the southwest across the TTZ, and it extends as far as up to the Kraków-Lubliniec fault zone at the SW border of the collectively considered Małopolska-Kielce-Lysogory-Radom (MKLR) assemblage of (relatively shallow-rooted?) tectonic units (terranes). Therefore, the lower crust, occurring at ~32 to 50 km depth, between km 450 and 700 along the TTZ-South profile, and which on the CEL03 profile has been traced ~250 km further to the NW within the so-called Kuiavian unit of that transect [28], can be reliably considered to be of EEC origin and of Fennoscandian affinity.
As already mentioned in Section 2.3 of this paper devoted to the TTZ, on the basis of high-resolution deep seismic reflection data and recent potential field modelling results [8,16,26,57], the deep crystalline basement units underlying the PP directly SW of the TTZ along the TTZ-South transect are currently often believed to represent terranes accreted to the EEC along its Teisseyre-Tornquist edge, either already in Precambrian times at ~1 Ga, during the formation of Rodinia, and thus enlarging the Baltica paleocontinent [9,10,12], or later, during a pre-Devonian tectonic event [18,20,136]. However, the burial of the crystalline crust below the thick Ediacaran and lower Paleozoic strata, as interpreted from the TTZ-South and neighbouring seismic profiles, and the inferred Paleoproterozoic age of the overthrust-type tectonic contact between the Fennoscandian and Sarmatian crustal segments of the EEC along the FSS (by analogy to the age of the FSS interpreted further NE, [23,25,31,43]), rather precludes a post-Ediacaran, early Paleozoic accretion of terranes with deeply reaching crystalline roots to the TTZ edge of the EEC. On the other hand, Palaeozoic accretion of shallow-rooted terranes with no significant crystalline basement would still have been possible within the TESZ area of the PP.
In contrast to the situation around the northwestern one-third of the TTZ-South seismic transect, to the southeast of the point where the FSS, as interpreted by us, reaches the Moho (Figure 12 and Figure 14), no distinct changes in the EEC crystalline basement across the TTZ and, also, below the Carpathians cf. [42], can be observed on the seismic refraction profiles that cross it in a transverse manner, i.e., on CEL11, CEL13 and CEL14 [78] and PANCAKE [103]. The Sarmatian crust on those profiles continues in an undisturbed manner to the SW (Figure 13). In this way, the idea of extending the Baltica crystalline crust to the southwest in the deep substratum of the Palaeozoic platform beyond the TTZ seems to be substantiated by the deep seismic data for the Sarmatian segment of the EEC.
A notable exception to this picture is, however, the southeastern end of the TTZ-South profile, SE of km 965, where the lower crustal layer is entirely lacking, being replaced by the middle crust down to the Moho. The lower crust is also lacking on the RomUkrSeis profile ([104]; please note that the layer identified as the “lower crust” in the latter paper is characterized by Vp values of 6.45 to less than 6.60 km/s, which we, in this paper, consider typical of the middle crust on the TTZ-South transect). On RomUkrSeis even the middle crust (termed the “lower crust” by Starostenko et al. [104]) wedges out ~20 km to the SW of the TTZ-South profile on approaching the Carpathian foredeep, which leaves the upper mantle in contact with crust characterized by Vp values of 6.30–6.40 km/s at depths of 37 to 45 km. It is worth noting that such Vp values on the TTZ-South profile are related to the crystalline upper crust directly underlying the sedimentary layer of the Volhynia-Podolia homocline.
The abnormally low Vp values of the EEC crust on the RomUkrSeis profile, particularly “the lack of lower crust with Vp > 6.9 km” [104], occur also along the entire DOBRE-4 [131] deep seismic profile that runs parallel to the RomUkrSeis profile ~315 km further to the SE. Thus, the lack of ‘normal velocity’ lower crust, as along the TTZ-South profile SE of km 960, appears characteristic of the relatively large area of the EEC that covers SE Podolia, Bukovina, and Moldavia, through to Dobrudja in Romania and the Ukrainian Black Sea coast in the SE. This is the area geologically included in the Podolian domain of the Sarmatian segment of the EEC by Bogdanova et al. [23,31,43]. According to [104], the crustal “velocity structure of the Podolian domain as seen on RomUkrSeis, is comparable to other mainly Archaean domains found outside Europe, such as the Superior Province in Canada, the Pilbara and Yilgarn cratons in western Australia and the Kaapvaal and Zimbabwe cratons in southern Africa (e.g., [137]), which mainly do not display high velocity lower crustal layers”.
7.2.6. Rift Basin of Orsha-Volhynia
The rift system (aulacogen) of Orsha-Volhynia ([23,30,31,43]; named Volyn-Orsha by authors of the cited papers) approaches the TTZ roughly between km ~530 and 860 along the TTZ-South seismic profile (Figure 11 and Figure 12) at an approximately right angle (Figure 2a and Figure 3b). It straddles nearly symmetrically the Narol High (Figure 11), which clearly owes its elevation to the enormous thickness (~15 km) of Ediacaran strata within a large-scale, ~200 km wide lens or bulge. The bulge is draped from above by the overlying Cambrian through Carboniferous strata that are elevated by 4–8 km with respect to their position outside the lens. The age of these strata implies that the elevation of the envelope to the Ediacaran bulge, together with the bulge itself, was produced by Variscan tectonic shortening during the late Carboniferous times. The great increase in thickness of the Ediacaran deposits with respect to the thickness in areas outside the “bulge” is, on the one hand, likely the result of the significant Ediacaran subsidence of the Orsha-Volhynia aulacogen at the junction with the Tornquist rift and its infilling with a thick succession of syn-rift sediments and igneous rocks. This is in contrast to the much lesser thickness of its equivalents further to the NE within the rift below the Lublin basin [72]. On the other hand, the lensoidal shape of the Ediacaran mega-lithosome must have been, at least to a large part, achieved through Variscan tectonic shortening and structural inversion (cf., e.g., [138]) of the Ediacaran basin fill.
An alternative explanation, that can, however, be successfully combined with the first solution, is Ediacaran thickness multiplication by Variscan thrusting cf. [11,16,26], possibly producing a mega-duplex structure (cf., e.g., [129,139]) which, by its very nature, would be lensoidal in shape and, typically, lift up the overlying strata. Furthermore, according to PolandSPAN seismic data [14,15], the sole thrust of the Variscan Radom-Kraśnik fold-and-thrust belt is rooted in the Ediacaran sedimentary succession. In this context, it should be borne in mind that the simplified regional cross-section of Figure 11, in general, does not show the expected intense Variscan thin-skinned tectonic structures in the Paleozoic succession of the Radom fold belt and the adjoining areas [14,15,50], which would almost certainly crosscut the Ediacaran-Phanerozoic boundary. However, presenting such effects in Figure 11, even in a conceptual scheme, would not appear to be geometrically convincing on an along-strike section, since the Carboniferous thrusting within the Radom fold belt was to the NE, i.e., roughly perpendicular to the cross-section plane.
7.2.7. High-Velocity Bodies
Five (out of six in total, see below) high-velocity bodies (HVB) detected by seismic modelling along the TTZ-South profile (Figure 7 and Figure 12), are mostly located in the middle crust near its base and, in one case, within the lower crust near its top, at depths of ~15–37 km, along the entire profile. Two of the HVBs were already described along the CEL03 [28,78], CEL01 [112], CEL02 [71], and POLCRUST-01 [8,57] deep seismic profiles and interpreted as intrusive mafic bodies that had witnessed the Neoproterozoic breakup of the Rodinia supercontinent [71]. This interpretation is sustained here. According to Mikołajczak [26], who studied the crustal structure around the Polish part of the TTZ-South profile, using potential field analysis, the high velocity/high-density bodies in the basement of the Radom fold belt and western Lublin basin areas have densities of 2.77–2.90 g/cm3 in the middle (“upper” crust of Mikołajczak) and 3.05–3.15 g/cm3 in the lower crust. The known tectonic environments that are comparable to the palaeotectonic position of the area in question and that contain bodies of similar densities within the continental crust are those of volcanic continental rifts, whose products are retained within the recent, volcanic-type passive continental margins (e.g., [140,141,142,143,144]). In the case of the southeastern part of the TTZ, the HVBs is most likely represented by Ediacaran mafic intrusions emplaced into the extended passive margin of Baltica during the early stages of the opening of the Tornquist ocean within the triple junction of the Tornquist rift and the Orsha-Volhynia aulacogen [59,66]. The shallow level manifestations of the deep crustal igneous processes are products of mafic volcanism represented by abundant continental flood basalts and related gabbro-dolerite intrusions emplaced at ~600–550 Ma (see Section 2 for more information).
On the other hand, the near-surface high-velocity body at around SP29207 (Figure 7 and Figure 9) most likely corresponds to folded Upper Devonian dolomitized limestone embedded in normal-velocity siltstones and sandstones, as encountered in the Peremyshlany-1 borehole. A contribution from a Mississipian mafic igneous subvolcanic intrusion cannot be excluded, either cf. [49], though this has not been recognized in boreholes (from which, however, no lithological data are preserved, except for Pr-1).
7.2.8. Seismic Velocity Inversions
Seismic velocity inversions consisting of “faster” (in terms of higher Vp) resting on top of “slower” rock complexes and having a lateral extent from tens to hundreds of kilometres, were recorded at various depths and locations along the TTZ-South profile (Figure 7 and Figure 12) and, also, on some of the transverse seismic profiles. Their origin, in most cases, can be ascribed cf., (e.g., [128,129,145]) to crustal-scale thrusting processes that tectonically emplaced previously lower-lying (older/heavier/“faster”) rock packages onto higher (younger/lighter/“slower”) ones, most likely during orogenic compressive events related to plate collision and orogeny.
The most prominent Vp inversion along the TTZ-South profile is that whose upper interface increases from 16 to 27 km depth from km 485 to 600, where the middle crust is emplaced on top of the crystalline upper crust. This interface, which then continues at a lower level at ~35 km depth in the lower crust from km 600 to 690, and eventually jumps one more step down and follows the Moho at a depth of ~43 km at km 700 is, as already mentioned, interpreted here as a vestige of the ~1.8 Ga collision [23,31,43,58] and the resultant NW-vergent thrusting of the Sarmatian segment over the Fennoscandian segment of the EEC, to produce the FSS. The much later Variscan tectonism, related to NE-SW orogenic compression cf. [13,14], and producing intense thin-skinned thrusting and folding phenomena reported from the overlying, near-surface Lysogory-Radom fold belt [13,14,15,50], may have possibly modified this Paleoproterozoic thrust system, but the potential effects are not separable from the earlier ones on the TTZ-South seismic model.
In contrast to the hypothetical late Variscan contribution to the thick-skinned crustal-scale thrust geometry along the TTZ-South profile in Poland, the Variscan tectonism is the obvious reason for the shallowest velocity inversion, occurring at a depth of ~4–7 km at km 450–490 in the sedimentary layer. This inversion can be taken as direct evidence for the Lysogory-Radom area involvement in late Carboniferous thin-skinned thrusting and folding at the marginal zone of the Variscan orogenic belt, otherwise well-known from recent reflection seismics [13,14,15,50].
The persistent, relatively shallow, subhorizontal velocity inversion at ~7–14 km depth along almost the entire length, from km 705 to 980, of the crystalline upper crust in the Moldavo-Podolian thrust unit, due to its extreme length, smooth trajectory, and shallow occurrence, seems to be very difficult to explain as a result of regional-extent thick-skinned thrusting, even if one tries to resort to the Late Cenozoic Carpathian orogeny that occurred nearby. The top of this inversion is identified [42] to represent the top surface of an Archean so-called proto-socle, which is termed the K2 horizon on Ukrainian seismic sections.
8. Conclusions and Regional Implications
The TTZ-South seismic model (Figure 7 and Figure 12) portrays the Fennoscandia-Sarmatia suture (FSS) of the East European craton along its SW margin. The two major crustal segments of the craton are in tectonic contact, where Sarmatia is interpreted to be overthrust to the NW, on top of Fennoscandia, along a tectonic suture, the FSS.
The southern, Sarmatian, segment of the East European craton basement is composed of two distinct crustal-scale, wedge-shaped thrust slices: the Moldavo-Podolian and Lublino-Volhynian units (Figure 12 and Figure 14) and two smaller units at its NW edge. The southeasterly located Moldavo-Podolian basement unit is overthrust to the NW, onto the Lublino-Volhynian unit which, at its front, overthrusts the Okolowo-Holeszów and Belarus-Podlasie accretionary belts. These belts, in turn, are thrust over the rear part of the Fennoscandian segment of the East European Craton, named here the Lysogoro-Radomian basement unit. The crustal-scale thrusting of Sarmatia onto Fennoscandia must have taken place during their Palaeoproterozoic collision at ~1.84–1.8 Ga [23,31,43] that contributed to the amalgamation of the East European craton. The thrusting of the Moldavo-Podolian onto Lublino-Volhynian units of Sarmatia may have likely occurred at the same time or, possibly, earlier, during the amalgamation of Sarmatia.
As corroborated by earlier deep seismic transects, made at a high angle to the TTZ-South profile, the EEC crystalline crust continues from the NE to SW across the TTZ, to become the deep substratum of the adjacent Paleozoic platform of north-western Europe. In the area covered by the southeastern part of the TTZ-South profile, this deep crystalline basement corresponds to the Sarmatian crust (cf., e.g., [8,57,78]), whereas to the northwest of the FSS, the deep basement represents the Fennoscandian segment of the craton.
The occurrence of a very thick Ediacaran succession exactly at the projected intersection of the TTZ-South profile (Figure 3b, Figure 11 and Figure 12) with the SW-trending Orsha-Volhynia rift basin (aulacogen), independently confirmed by other geophysical data cf. [16,26], reflects increased subsidence and deposition at or near the junction of this rift system with the perpendicularly trending, NW-SE Tornquist rift system, also active during the late Neoproterozoic Pannotia/Rodinia breakup cf. [47,49,59,60,66]. This must have led to regional crustal thinning and the formation of the EEC passive margin to the SW of the TTZ and, eventually, to the opening of the Tornquist ocean [66], located still further to the SW.
Furthermore, altogether, five high-velocity bodies (HVB’s) several tens of kilometres long (170 km at maximum) and up to ten kilometres thick were revealed near the bottom of the middle crust within the Sarmatian tectonic units and, in one case, at the top of the inferred Fennoscandian lower crust. They are interpreted as mafic intrusions related to the Rodinia/Pannotia supercontinent breakup [71], which formed during the early stages of the Tornquist ocean opening at the triple junction of the Tornquist rift and the Orsha-Volhynia aulacogen [59,66].
The effects of the NW-SE-directed late Neoproterozoic basement extension necessary for the subsidence of the Orsha-Volhynia rift can be perceived on the TTZ-South seismic model as probable low-angle extensional detachments, reactivating interfaces between the four tectonic units composing the Sarmatia domain of the crystalline basement (Figure 12 and Figure 14). These interfaces likely acted earlier as major NW-vergent thrusts.
The continuation of the Ediacaran succession from the Orsha-Volhynia basin to the southwest of the TTZ, into the Trans-European Suture zone (TESZ) of the Paleozoic platform [16,26] at the basal level of the supposed TESZ terranes and, eventually, its merging with the thick Ediacaran orogenic wedge of the Malopolska terrane, speaks in favour of the concept that the Ediacaran succession in those areas, i.e., on both sides of the TTZ, was deposited on the Baltica crystalline basement and is in no part exotic with respect to the EEC e.g., [55,69,146].
The Late Carboniferous, NE-vergent Variscan thrusting, tectonic stacking, and duplexing, known from their thin-skinned effects on the Paleozoic sedimentary deposits at the shallowest crustal level [15,50] must have also contributed to a significant thickness increase of the Ediacaran succession that was earlier deposited in the Orsha-Volhynia rift basin. The Variscan effects are clearly responsible for an important uplift of the top of the “bulging” Ediacaran succession, together with the overlying Cambrian to Carboniferous strata, within the Narol high, by ~5–8 km with respect to those in the adjacent areas (Figure 11).
The space for possible tectonic transport and emplacement of the MKLR (Malopolska, Kielce, and Lysogory-Radom) terranes composing the TESZ domain adjacent to the TTZ from the SW, which are believed by some authors to have accreted to the EEC between late Neoproterozoic and early Palaeozoic times e.g., [1,3,20,44,45,46,53,94], seems to have been limited to a relatively shallow crustal level, i.e., the sedimentary layer, above the earlier formed crystalline cratonic basement composed of the Lysogoro-Radomian and Lublino-Volhynian basement units (cf. Figure 12 and Figure 14).
The subhorizontal seismic velocity (Vp) inversions occurring on the TTZ-South seismic model in all crustal layers (Figure 7 and Figure 12), some of them of significant lateral extent, are mostly the result of extensive overthrusting during the Paleoproterozoic amalgamation of the EEC, although some contribution from later tectonic events, such as the Sveconorwegian collision at ~1 Ga cf. [10] and the late Carboniferous Variscan orogenic tectonism at ~300 Ma [14,15] is either possible or probable (the former event) or still ascertained in the sedimentary crustal layer (the latter event). If the Sveconorwegian or Variscan orogenic compressional events have indeed resulted in partial reactivation of the deep-seated NW-vergent Paleoproterozoic thrusts, then it must have happened under a different structural regime, in the case of the Variscan event controlled by an NNE-SSW to NE-SW shortening [10,13,14,15].
Several deep seismic sounding profiles carried out in SW Poland and Western Ukraine during the last decades, that has now been significantly complemented by the new TTZ-South profile investigating the junction of the two main constituent components of the craton, resulted in major advances in the exploration of the deep crustal and uppermost mantle structure of the region. Yet, new research projects employing deep reflection and WARR seismics combined with potential field studies are still needed, as they may bring further important discoveries and help to better understand the lithospheric structure and evolution of this part of Europe.
Author Contributions
Conceptualization, T.J., V.S. and P.Ś.; data curation, T.J., W.C., P.Ś., D.W., D.L. and J.M.; resources, T.J., S.C., A.T., P.Ś., D.W., V.O., D.L., D.G., K.K. and J.M.; investigation, T.J., S.C., A.T., W.C., P.Ś., D.W., V.O., D.L., D.G. and K.K.; supervision, T.J., V.S., S.C., A.T., O.L. and V.O.; methodology and data analysis, T.J., P.A., W.C., P.Ś., D.W., D.L., K.K. and A.G.; software, P.Ś.; visualization, T.J., P.A., P.Ś., T.Y., A.M., D.L., K.K., T.A., D.W. and A.G.; writing—original draft preparation, T.J., P.A., W.C., P.Ś., T.Y., A.M., K.Z., D.L., K.K., D.W. and A.G.; writing—review and editing, P.A., T.J., W.C., P.Ś., T.Y., A.M. and J.M.; funding acquisition, T.J. and V.S. All authors have read and agreed to the published version of the manuscript.
Funding
This research was funded by the National Science Centre, Poland, research project No. 2016/22/M/ST10/00347 for the Polish part of the work. Participation of the Ukrainian part was supported by the National Academy of Sciences of Ukraine, research project No. II-6-17-19. Bilateral contacts were supported by statutory activities No. 3841/E-41/S/2016-2019 of the Ministry of Science and Higher Education of Poland. A large part of the instrumentation on the territory of Ukraine was provided by the Geophysical Instrument Pool of the Deutsches GeoForschungsZentrum—GFZ, Potsdam, Germany.
Data Availability Statement
The data presented in this study are available on request from the corresponding author. The data are not yet publicly available due to the project embargo for study time. doi:10.25171/InstGeoph_PAS_IGData_TTZ-South_2021_003.
Acknowledgments
The TTZ-South profile was acquired in international collaboration between institutions and organisations from Poland (Institute of Geophysics, Polish Academy of Sciences, and “Geofizyka Toruń” Ltd.) and Ukraine (Institute of Geophysics, National Academy of Sciences of Ukraine, and the State Geophysical Enterprise “Ukrgeofizika”, Kiev) with help of the Geophysical Instrument Pool of the Deutsches GeoForschungsZentrum—GFZ, Potsdam, Germany. The authors express their sincere appreciation for the activities by the many people who took part in the fieldwork and data acquisition. Critical reading of an early version of the manuscript by Stanisław Mazur of the PAS Institute of Geological Sciences, Cracow, as well as helpful assistance from Andrzej Biel and Iwona Sieniawska of the Polish Geological Institute, Wrocław, in preparing geology figures, are gratefully acknowledged. Thanked are also two anonymous reviewers, whose highly critical comments undoubtedly contributed to the quality of the paper. The public domain GMT package [147] was used to produce some of the geophysical figures.
Conflicts of Interest
The authors declare no conflict of interest.
References
- Pharaoh, T.C. Palaeozoic terranes and their lithospheric boundaries within the Trans-European suture zone (TESZ): A review. Tectonophysics 1999, 314, 17–41. [Google Scholar] [CrossRef]
- Banka, D.; Pharaoh, T.C.; Williamson, J.P. TESZ Project Potential Field Core Group. Potential field imaging of Palaeozoic orogenic structure in northern and central Europe. Tectonophysics 2002, 360, 23–45. [Google Scholar] [CrossRef]
- Winchester, J.A. The PACE TMR Network Team. Palaeozoic amalgamation of Central Europe: New results from recent geological and geophysical investigations. Tectonophysics 2002, 360, 5–21. [Google Scholar] [CrossRef]
- Grad, M. Podolian, Saxonian and Baltic plates—Teisseyre-Tornquist Line and the edge of the East European Craton. Geochemistry 2019, 79, 422–433. [Google Scholar] [CrossRef]
- Grad, M. Teisseyre-Tornquist Line—Evolution of the view on the edge of the East European Craton. Prz. Geof. LXIV 2019, 1–2, 167–183. (In Polish) [Google Scholar] [CrossRef]
- Berthelsen, A. From Precambrian to Variscan Europe. In A Continent Revealed—The European Geotraverse; Blundell, D.J., Freeman, R., Mueller, S., Eds.; Cambridge University Press: New York, NY, USA, 1992; pp. 153–164. [Google Scholar]
- Berthelsen, A. Where different geological philosophies meet: The Trans-European Suture Zone. Publ. Inst. Geophys. Pol. Acad. Sci. 1993, 255, 19–31. [Google Scholar]
- Malinowski, M.; Guterch, A.; Narkiewicz, M.; Probulski, J.; Maksym, A.; Majdański, M.; Środa, P.; Czuba, W.; Gaczyński, E.; Grad, M.; et al. Deep seismic reflection profile in Central Europe reveals complex pattern of Paleozoic and Alpine accretion at the East European Craton margin. Geophys. Res. Lett 2013, 40, 3841–3846. [Google Scholar] [CrossRef]
- Mazur, S.; Mikołajczak, M.; Krzywiec, P.; Malinowski, M.; Buffenmyer, V.; Lewandowski, M. Is the Teisseyre-Tornquist Zone an ancient plate boundary of Baltica? Tectonics 2015, 34, 2465–2477. [Google Scholar] [CrossRef]
- Mazur, S.; Mikołajczak, M.; Krzywiec, P.; Malinowski, M.; Buffenmyer, V.; Lewandowski, M. Reply to Comment by Narkiewicz, M.; Petecki, Z. on “Is the Teisseyre-Tornquist Zone an ancient plate boundary of Baltica?”. Tectonics 2016, 35, 1600–1607. [Google Scholar] [CrossRef]
- Mazur, S.; Gągała, Ł.; Kufrasa, M.; Krzywiec, P. Application of two-dimensional gravity models as input parameters to balanced cross-sections across the margin of the East European Craton in SE Poland. J. Struct. Geol. 2018, 116, 223–233. [Google Scholar] [CrossRef]
- Mazur, S.; Krzywiec, P.; Malinowski, M.; Lewandowski, M.; Aleksandrowski, P.; Mikołajczak, M. On the nature of the Teisseyre-Tornquist Zone. Geol. Geophys. Environ. 2018, 44, 17–30. [Google Scholar] [CrossRef]
- Mazur, S.; Aleksandrowski, P.; Gągała, Ł.; Krzywiec, P.; Żaba, J.; Gaidzik, K.; Sikora, R. Late Palaeozoic strike-slip tectonics versus oroclinal bending at the SW outskirts of Baltica: Case of the Variscan belt’s eastern end in Poland. Int. J. Earth Sci. 2020, 109, 1133–1160. [Google Scholar] [CrossRef]
- Krzywiec, P.; Gągała, Ł.; Mazur, S.; Słonka, Ł.; Kufrasa, M.; Malinowski, M.; Pietsch, K.; Golonka, J. Variscan deformation along the Teisseyre-Tornquist Zone in SE Poland: Thick-skinned structural inheritance or thin-skinned thrusting? Tectonophysics 2017, 718, 83–91. [Google Scholar] [CrossRef]
- Krzywiec, P.; Mazur, S.; Gągała, Ł.; Kufrasa, M.; Lewandowski, M.; Malinowski, M.; Buffenmyer, V. Late Carboniferous thin-skinned compressional deformation above the SW edge of the East European craton as revealed by seismic reflection and potential field data—Correlations with the Variscides and the Appalachians. In Linkages and Feedbacks in Orogenic Systems; Law, R.D., Thigpen, J.R., Merschat, A.J., Stowell, H.H., Eds.; The Geological Society of America Memoir 213; Geological Society of America: Boulder, CO, USA, 2017; pp. 353–372. [Google Scholar]
- Mikołajczak, M.; Mazur, S.; Gągała, Ł. Depth-to-basement for the East European Craton and Teisseyre-Tornquist Zone in Poland based on potential field data. Int. J. Earth Sci. 2019, 108, 547–567. [Google Scholar] [CrossRef]
- Mikołajczak, M.; Mazur, S.; Gągała, Ł. Reply to Comment by M. Narkiewicz on “Depth-to-basement for the East European Craton and Teisseyre-Tornquist Zone in Poland based on potential field data, by Mikołajczak et al., International Journal of Earth Sciences (2019) 108, 547–567”. Int. J. Earth Sci. 2019, 108, 1767–1771. [Google Scholar] [CrossRef]
- Narkiewicz, M.; Maksym, A.; Malinowski, M.; Grad, M.; Guterch, A.; Petecki, Z.; Probulski, J.; Janik, T.; Majdański, M.; Środa, P.; et al. Transcurrent nature of the Teisseyre-Tornquist Zone in Central Europe: Results of the POLCRUST-01 deep reflection seismic profile. Int. J. Earth Sci. 2015, 104, 775–796. [Google Scholar] [CrossRef]
- Narkiewicz, M.; Petecki, Z. Comment on “Is the Teisseyre-Tornquist Zone an ancien plate boundary of Baltica?” by Mazur et al. Tectonics 2016, 35, 1595–1599. [Google Scholar] [CrossRef]
- Narkiewicz, M.; Petecki, Z. Teisseyre-Tornquist Zone—Evolving approaches and new data. Przegląd Geol. 2019, 67, 837–848, (In Polish, English abstract). [Google Scholar] [CrossRef]
- Narkiewicz, M. Comment on “Depth-to-basement for the East European Craton and Teisseyre-Tornquist zone in Poland based on potential field data” by Mikołajczak et al. Int. J. Earth Sci. 2019, 108, 1763–1765. [Google Scholar] [CrossRef]
- Janik, T.; Starostenko, V.; Aleksandrowski, P.; Yegorova, T.; Czuba, W.; Środa, P.; Murovskaya, A.; Zajats, K.; Kolomiyets, K.; Lysynchuk, D.; et al. TTZ-South seismic experiment. Geophys. J. 2020, 42, 3–15. [Google Scholar] [CrossRef]
- Bogdanova, S.V.; Gorbatschev, R.; Garetsky, R.G. EUROPE|East European Craton. Reference Module in Earth Systems and Environmental Sciences; Elsevier: Amsterdam, The Netherlands, 2016; pp. 1–18. ISBN 9780124095489. [Google Scholar] [CrossRef]
- Mężyk, M.; Malinowski, M.; Mazur, S. Structure of a diffuse suture between Fennoscandia and Sarmatia in SE Poland based on interpretation of regional reflection seismic profiles supported by unsupervised clustering. Precambrian Res. 2021, 358, 106176. [Google Scholar] [CrossRef]
- Krzemińska, E.; Krzemiński, L.; Petecki, Z.; Wiszniewska, J.; Salwa, S.; Żaba, J.; Gaidzik, K.; Williams, I.S.; Rosowiecka, O.; Taran, L.; et al. Geological Map of Crystalline Basement in the Polish Part of the East European Platform 1:1,000,000; Państwowy Instytut Geologiczny: Warszawa, Poland, 2017. [Google Scholar]
- Mikołajczak, M. Analiza Strukury Podłoża Prowincji Łupków Gazonośnych Centralnej Polski w Oparciu o Dane Grawimetryczne i Magnetyczne. Ph.D. Thesis, Institute of Geological Sciences PAS, Kraków, Poland, 2016; 345p. (In Polish, English abstract). [Google Scholar]
- Grad, M.; Janik, T.; Yliniemi, J.; Guterch, A.; Luosto, U.; Komminaho, K.; Środa, P.; Höing, K.; Makris, J.; Lund, C.-E. Crustal structure of the Mid Polish Trough beneath TTZ seismic profile. Tectonophysics 1999, 314, 145–160. [Google Scholar] [CrossRef]
- Janik, T.; Grad, M.; Guterch, A.; Dadlez, R.; Yliniemi, J.; Tiira, T.; Keller, G.R.; Gaczyński, E.; CELEBRATION 2000 Working Group. Lithospheric structure of the Trans-European Suture Zone along the TTZ & CEL03 seismic profiles (from NW to SE Poland). Tectonophysics 2005, 411, 129–156. [Google Scholar] [CrossRef]
- Bogdanova, S.V. Segments of the East European Craton. In EUROPROBE in Jablonna 1991; Gee, D.G., Beckholmen, M., Eds.; Polish Academy of Sciences and European Science Foundation: Warszawa, Poland, 1993; Volume 255, pp. 33–38. [Google Scholar]
- Bogdanova, S.V.; Pashkevich, I.K.; Gorbatschev, R.; Orlyuk, M.I. Riphean rifting and major Palaeoproterozoic crustal boundaries in the basement of the East-European Craton: Geology and geophysics. Tectonophysics 1996, 268, 1–21. [Google Scholar] [CrossRef]
- Bogdanova, S.; Gorbatschev, R.; Grad, M.; Janik, T.; Guterch, A.; Kozlovskaya, E.; Motuza, G.; Skridlaite, G.; Starostenko, V.; Taran, L.; et al. EUROBRIDGE: New insight into the geodynamic evolution of the East European Craton. Geol. Soc. Lond. Mem. 2006, 32, 599–625. [Google Scholar] [CrossRef]
- Mazur, S.; Scheck-Wenderoth, M.; Krzywiec, P. Different modes of inversion in the German and Polish basins. Int. J. Earth Sci. 2005, 94, 782–798. [Google Scholar] [CrossRef]
- Kley, J.; Voigt, T. Late Cretaceous intraplate thrusting in central Europe: Effect of Africa-Iberia-Europe convergence, not Alpine collision. Geology 2008, 36, 839–842. [Google Scholar] [CrossRef]
- Kley, J. Timing and spatial patterns of Cretaceous and Cenozoic inversion in the Southern Permian Basin. In Mesozoic Resource Potential in the Southern Permian Basin; Kilhams, B., Kukla, P.A., Mazur, S., Mckie, T., Mijnlieff, H.F., Van Ojik, K., Eds.; Geological Society: London, UK, 2018; Volume 469, pp. 1–18. [Google Scholar] [CrossRef]
- Krzywiec, P.; Stachowska, A.; Stypa, A. The only way is up-on Mesozoic uplifts and basin inversion events in SE Poland. In Mesozoic Resource Potential in the Southern Permian Basin; Kilhams, B., Kukla, P.A., Mazur, S., Mckie, T., Mijnlieff, H.F., Van Ojik, K., Eds.; Geological Society: London, UK, 2018; Volume 469, pp. 33–57. [Google Scholar]
- Kruglov, S.S.; Arsiriy, Y.O.; Bobrov, O.B.; Veklich, J.M.; Velikanov, V.Y.; Vishniakov, I.B.; Heychenko, M.V.; Gintov, O.B.; Yentin, V.A.; Znamenskaya, T.O.; et al. Tectonic Map of the Ukraine M 1:1000000. In Explanatory Note, P.1, Min. of Environment Protection, St. Geol. Survey, Ukr.DGRI, Kiev; Kruglov, S., Gursky, S., Eds.; State Geological Service of Ukraine: Kyiv, Ukraine, 2007; 96p. (In Russian) [Google Scholar]
- Buła, Z.; Habryn, R. Precambrian and Palaeozoic basement of the Carpathian Foredeep and the adjacent Outer Carpathians. Ann. Soc. Geol. Pol. 2011, 81, 221–239. [Google Scholar]
- Guterch, A.; Grad, M. Lithospheric structure of the TESZ in Poland based on modern seismic experiments. Geol. Q. 2006, 50, 23–32. [Google Scholar]
- Pożaryski, W. (Ed.) Mapa Geologiczna Polski i Krajów Ościennych Bez Utworów Kenozoicznych 1: 1,000,000; Państwowy Instytut Geologiczny: Warszawa, Poland, 1979. (In Polish) [Google Scholar]
- Pożaryski, W.; Dembowski, Z. (Eds.) Mapa Geologiczna Polski i Krajów Ościennych Bez Utworów Kenozoicznych, Mezozoicznych i Permskich, 1:1 000 000; Państwowy Instytut Geologiczny: Warszawa, Poland, 1984. (In Polish) [Google Scholar]
- Galetsky, L.S. (Ed.) An Atlas of the Geology and Mineral Deposits of Ukraine (Scale 1:5,000,000); University of Toronto Press: Toronto, ON, Canada, 2007; 168p. [Google Scholar]
- Zayats, K. Hlubinna Budova Nadr Zakhidnoho Rehionu Ukrainy na Osnovi Seysmichnykh Doslidshzen’ i Napriamky Poshukovykh Robit na Naftu ta Haz (The Structure of Minerals of the Western Region of Ukraine on the Basis of Seismic Studies and the Directions for Oil and Gas Exploration Studies); Monograph, USGEI: Lviv, Ukraine, 2013; Volume 2015, 80p. (In Ukrainian) [Google Scholar]
- Bogdanova, S.; Gorbatschev, R.; Skridlaite, G.; Soesoo, A.; Taran, L.; Kurlovich, D. Trans-Baltic Palaeoproterozoic correlations towards the reconstruction of supercontinent Columbia/Nuna. Precambrian Res. 2015, 259, 5–33. [Google Scholar] [CrossRef]
- Pożaryski, W. Central Europe’s Caledonides as a strike-slip orogen composed of terranes. Przegląd Geol. 1990, 38, 1–9, (In Polish, English abstract). [Google Scholar]
- Belka, Z.; Valverde-Vaquero, P.; Dörr, W.; Ahrendt, H.; Wemmer, K.; Franke, W.; Schäfer, J. Accretion of first Gondwana-derived terranes at the margin of Baltica. Geol. Soc. Lond. Spec. Publ. 2002, 201, 19–36. [Google Scholar] [CrossRef]
- Dadlez, R.; Grad, M.; Guterch, A. Crustal structure below the Polish Basin: Is it composed of proximal terranes derived from Baltica? Tectonophysics 2005, 411, 111–128. [Google Scholar] [CrossRef]
- Nawrocki, J.; Poprawa, P. Development of Trans-European Suture Zone in Poland: From Ediacaran rifting to early Palaeozoic accretion. Geol. Q. 2006, 50, 59–76. [Google Scholar]
- Narkiewicz, M.; Grad, M.; Guterch, A.; Janik, T. Crustal seismic velocity structure of southern Poland: Preserved memory of a pre-Devonian terrane accretion at the East European Platform margin. Geol. Mag. 2011, 148, 191–210. [Google Scholar] [CrossRef]
- Poprawa, P. Geological setting and Ediacaran–Palaeozoic evolution of the western slope of the East European Craton and adjacent regions. Ann. Soc. Geol. Pol. 2019, 89, 347–380. [Google Scholar] [CrossRef]
- Tomaszczyk, M.; Jarosiński, M. The Kock Fault Zone as an indicator of tectonic stress regime changes at the margin of the EastEuropean Craton (Poland). Geol. Q. 2017, 61, 908–925. [Google Scholar]
- Mizerski, W. Geotectonic evolution of the Holy Cross Mts in Central Europe. Biul. Państwowego Inst. Geol. 1995, 372, 1–47. [Google Scholar]
- Gągała, Ł. Pre-Ordovician polyphase tectonics of the Cambrian sequences in the Kielce Unit, Holy Cross Mts. (CentralPoland). Geol. Q. 2005, 49, 53–66. [Google Scholar]
- Belka, Z.; Ahrendt, H.; Franke, W.; Wemmer, K. The Baltica–Gondwana suture in central Europe: Evidence from K-Ar ages of detrital muscovites and biogeographical data. Geol. Soc. Lond. Spec. Publ. 2000, 179, 87–102. [Google Scholar] [CrossRef]
- Żelaźniewicz, A.; Aleksandrowski, P.; Buła, Z.; Karnkowski, P.H.; Konon, A.; Oszczypko, N.; Ślączka, A.; Żaba, J.; Żytko, K. Regionalizacja Tektoniczna Polski (Geological Division of Poland); Commitee of Geological Sciences, Polish Academy of Sciences: Wrocław, Poland, 2011; 60p. (In Polish) [Google Scholar]
- Żelaźniewicz, A.; Buła, Z.; Fanning, M.; Seghedi, A.; Żaba, J. More evidence on Neoproterozoic terranes in southern Poland and southeastern Romania. Geol. Q. 2009, 53, 93–124. [Google Scholar]
- Aleksandrowski, P.; Mazur, S. On the new tectonic solutions in the Geological Atlas of Poland. Przegląd Geol. 2017, 65, 1499–1510, (In Polish, English abstract). [Google Scholar]
- Malinowski, M.; Guterch, A.; Narkiewicz, M.; Petecki, Z.; Janik., T.; Środa, P.; Maksym, A.; Probulski, J.; Grad, M.; Czuba, W.; et al. Geophysical constraints on the crustal structure of the East European Platform margin and its foreland based on the POLCRUST-01 deep reflection seismic profile. Tectonophysics 2015, 653, 109–126. [Google Scholar] [CrossRef]
- Bogdanova, S.V.; Bingen, B.; Gorbatschev, R.; Kheraskova, T.N.; Kozlov, V.I.; Puchkov, V.N.; Volozh, Y.A. The East European Craton (Baltica) before and during the assembly of Rodinia. Precambrian Res. 2008, 160, 23–45. [Google Scholar] [CrossRef]
- Poprawa, P.; Pacześna, J. Late Neoproterozoic to Early Palaeozoic developmentof a rift at the Lublin-Podlasie slope of the East European Craton-analysis of subsidence and facies record (eastern Poland). Prz. Geol. 2002, 50, 49–63. [Google Scholar]
- Pacześna, J.; Poprawa, P. Eustatic versus tectonic control on the development of Neoproterozoic and Cambrian stratigraphic sequences of the Lublin-Podlasie Basin (SW margin of Baltica). Geosci. J. 2005, 9, 117–127. [Google Scholar] [CrossRef]
- Białowolska, A.; Bakun-Czubarow, N.; Fedoryshyn, Y. Neoproterozoic flood basalts of the upper beds of the Volhynian Series (East European Craton). Geol. Q. 2002, 46, 37–58. [Google Scholar]
- Emetz, A.; Piestrzyński, A.; Zagnitko, V. Geological framework of the Volhyn copper fields with a review of the Volhyn flood basalt province (western margin of the East-European Craton). Ann. Soc. Geol. Pol. 2004, 74, 257–265. [Google Scholar]
- Krzemińska, E. The outline of geochemical features of the Late Neoproterozoic volcanic activity in the Lublin-Podlasie basin, eastern Poland. Mineral. Soc. Pol. Spec. Pap. 2005, 26, 47–51. [Google Scholar]
- Compston, W.; Sambridge, M.S.; Reinfrank, R.F.; Moczydłowska, M.; Vidal, G.; Claesson, S. Numerical ages of volcanic rocks and the earliest faunal zone within the Late Precambrian of east Poland. J. Geol. Soc. Lond. 1995, 152, 111–128. [Google Scholar] [CrossRef]
- Velikanov, V.; Korenchuk, L. Phases of magmatism and their relation to the sediment deposition in the Late Precambrian (Riphean-Vendian) of the Volhyn-Podolia. Geol. Zhurnal 1997, 1-2, 124–131. [Google Scholar]
- Poprawa, P. Neoproterozoic break-up of the supercontinent Rodinia/Pannotia recorded by development of sedimentary basins at the western slope of Baltica. Pr. Państwowego Inst. Geol. 2006, 186, 165–188, (In Polish, English summary). [Google Scholar]
- Shumlyanskyy, L.; Nosova, A.; Billström, K.; Söderlund, U.; Andréasson, P.-G.; Kuzmenkova, O. The U-Pb zircon and baddeleyite ages of the Neoproterozoic Volyn Large Igneous Province: Implication for the age of the magmatism and the nature of a crustal contaminant. GFF 2016, 13, 17–30. [Google Scholar] [CrossRef]
- Poprawa, P.; Krzemińska, E.; Pacześna, J.; Amstrong, R. Geochronology of the Volyn volcanic complex at the western slope of the East European Craton—Relevance to the Neoproterozoic rifting and the break-up of Rodinia/Pannotia. Precambrian Res. 2020, 346, 105817. [Google Scholar] [CrossRef]
- Żelaźniewicz, A.; Buła, Z.; Jachowicz, M.; Żaba, J. The crystalline basement SW of the Trans-European Suture Zone in Poland: Neoproterozoic (Cadomian) Orogen. Terra Nostra 1997, 97, 167–171. [Google Scholar]
- Żelaźniewicz, A. Rodinian-Baltican link of the Neoproterozoic orogen in southern Poland. Acta Univ. Carolinae Geol. 1998, 42, 509–515. [Google Scholar]
- Malinowski, M.; Żelaźniewicz, A.; Grad, M.; Guterch, A.; Janik, T.; CELEBRATION 2000 Working Group. Seismic and geological structure of the crust in the transition from Baltica to Palaeozoic Europe in southeast Poland—CELEBRATION 2000 experiment, profile CEL02. Tectonophysics 2005, 401, 55–77. [Google Scholar] [CrossRef]
- Pacześna, J. Ewolucja późnoneoproterozoicznych-wczesnokambryjskich ryftowych depocentrów i facji w lubelsko-podlaskim basenie sedymentacyjnym. Pr. Państwowego Inst. Geol. 2006, 186, 9–38. [Google Scholar]
- Pacześna, J. The evolution of late Ediacaran riverine-estuarine system in the Lublin-Podlasie slope of the East European Craton, southeastern Poland. Pol. Geol. Inst. Spec. Pap. 2010, 27, 1–96. [Google Scholar]
- Smit, J.; Van Wees, J.D.; Cloetingh, S. The Thor suture zone: From subduction to intraplate basin setting. Geology 2016, 44, 707–710. [Google Scholar] [CrossRef]
- Grad, M.; Guterch, A.; Mazur, S. Seismic refraction evidence for continental structure in the central part of the Trans-European Suture Zone in Poland. Geol. Soc. Lond. Spec. Publ. 2002, 201, 295–309. [Google Scholar] [CrossRef]
- Grad, M.; Keller, G.R.; Thybo, H.; Guterch, A. POLONAISE Working Group. Lower lithospheric structure beneath the Trans-European Suture Zone from POLONAISE ’97 seismic profiles. Tectonophysics 2002, 360, 153–168. [Google Scholar] [CrossRef]
- Perchuć, E. Structure of the Earth’s crust in southeastern Poland. Publ. Inst. Geophys. Pol. Acad. Sci. 1984, 160, 77–86. [Google Scholar]
- Janik, T.; Grad, M.; Guterch, A.; CELEBRATION 2000 Working Group. Seismic structure of the lithosphere between the East European Craton and the Carpathians from the net of CELEBRATION 2000 profiles in SE Poland. Geol. Q. 2009, 53, 141–158. [Google Scholar]
- Środa, P.; Czuba, W.; Grad, M.; Guterch, A.; Tokarski, A.; Janik, T.; Rauch, M.; Keller, G.R.; Hegedűs, E.; Vozár, J.; et al. Crustal structure of the Western Carpathians from CELEBRATION 2000 profiles CEL01 and CEL04: Seismic models and geological implication. Geophys. J. Int. 2006, 167, 737–760. [Google Scholar] [CrossRef]
- Wybraniec, S.; Majorowicz, J. Kompleksowe modelowanie pól potencjalnych (grawimetria, magnetyka, geotermia) wzdłuż profili sejsmicznych CELEBRATION 2000. In Kompleksowa Interpretacja Anomalii Pól Potencjalnych Wzdłuż Wszystkich Profili Głębokich Badań Refrakcyjnych Zrealizowanych na Całym Obszarze CELEBRATION 2000, Stow. Dla Głębokich Badań Geol. (ADGiP), Rap. Końcowy Dla Minist. Środowiska; Guterch, A., Grad, M., Eds.; ADGiP: Warszawa, Poland, 2008. rozdz. IV.7. (In Polish)(In Polish) [Google Scholar]
- Teisseyre, W. Całokształt płyty paleozoicznej Podola galicyjskiego. Rzecz o przyszłych wierceniach głębokich na Podolu opolskiem. Kosmos 1893, 18, 319–336. (In Polish) [Google Scholar]
- Teisseyre, W. Der paläozoische Horst von Podolien und die ihn umgehenden Senkungsfelder. In Beiträge zur Paläontologie und Geologie Österreich-Ungarns und des Orients; W. Braumüller: Vienna, Austria, 1903; pp. 101–126. [Google Scholar]
- Tornquist, A. Die Feststellung des Südwesttrendes des baltisch–russischen Schildes und die geotektonische Zugehöringheit der ost-preussischen Scholle. Schr. Der Phys. Ökonomischen Ges. Zu Königsberg 1908, 49, 1–12. [Google Scholar]
- Tornquist, A. Geologie Von Ostpreussen; Gebrüder Borntraeger: Berlin, Germany, 1910; 231p. [Google Scholar]
- Królikowski, C.; Petecki, Z. Gravimetric Atlas of Poland; Polish Geological Institute: Warszawa, Poland, 1995. [Google Scholar]
- Królikowski, C.; Wybraniec, S. Gravity and magnetic maps of Poland—Historical background and modern presentation. Publ. Inst. Geophys. Pol. Acad. Sci. 1996, M18, 87–92. [Google Scholar]
- Grabowska, T.; Bojdys, G.; Dolnicki, J. Three-dimensional density model of the Earth’s crust and the upper mantle for the area of Poland. J. Geodyn. 1998, 25, 5–34. [Google Scholar] [CrossRef]
- Grabowska, T.; Bojdys, G. The border of the East-European Craton in south-eastern Poland based on gravity and magnetic data. Terra Nova 2001, 13, 92–98. [Google Scholar] [CrossRef]
- Wybraniec, S. Transformations and visualization of potential field data. In Polish Geological Institute Special Papers, 1; Polish Geological Institute: Warszawa, Poland, 1999; pp. 1–59. [Google Scholar]
- Majorowicz, J.A.; Čermák, V.; Šafanda, J.; Krzywiec, P.; Wróblewska, M.; Guterch, A.; Grad, M. Heat flow across the Trans-European Suture Zone in the area of the POLONAISE’97 seismic experiment. Phys. Chem. Earth 2003, 28, 375–391. [Google Scholar] [CrossRef]
- Majorowicz, J.; Wybraniec, S. Variscan geotherms in the context of the new heat flow map of Central Europe corrected for the paleoclimatic glacial-hiolocene change. Schiftenreihe Der Dtsch. Gesselschaft Für Geowiss. 2009, 63, 168. [Google Scholar]
- Majorowicz, J.; Wybraniec, S. New terrestrial heat flow map of Europe after regional paleoclimatic correction application. Int. J. Earth Sci. 2011, 100, 881–887. [Google Scholar] [CrossRef]
- Grabowska, T.; Bojdys, G.; Bielik, M.; Csicsay, K. Density and magnetic models of the lithosphere along CELEBRATION 2000 profile CEL 01. Acta Geophys. Pol. 2011, 59, 526–560. [Google Scholar] [CrossRef]
- Narkiewicz, M.; Petecki, Z. Basement structure of the Paleozoic Platform in Poland. Geol. Q. 2017, 6, 502–520. [Google Scholar] [CrossRef]
- Grabowska, T.; Bojdys, G.; Petecki, Z. Application of the magnetic anomalies for identification of structure of the crystalline basement of southeastern Poland. Biul. Państwowego Inst. Geol. 2017, 470, 17–48, (In Polish, English summary). [Google Scholar] [CrossRef]
- Berthelsen, A. The Tornquist Zone northwest of Carpathians: An intraplate pseudosuture. Geol. För. Stockh. Förh. 1998, 120, 223–230. [Google Scholar] [CrossRef]
- Grad, M.; Guterch, A.; Keller, G.R.; Janik, T.; Hegedűs, E.; Vozár, J.; Ślączka, A.; Tiira, T.; Yliniemi, J. Lithospheric structure beneath trans-Carpathian transect from Precambrian platform to Pannonian basin CELEBRATION 2000 seismic profile CEL05. J. Geophys. Res. 2006, 111, B03301. [Google Scholar] [CrossRef]
- Grad, M.; Janik, T.; Guterch, A.; Środa, P.; Czuba, W.; EUROBRIDGE’94–97, POLONAISE’97 & CELEBRATION 2000 Seismic Working Groups. Lithospheric structure of the western part of the East European Craton investigated by deep seismic profiles. Geol. Q. 2006, 50, 9–22. [Google Scholar]
- Guterch, A.; Grad, M.; Keller, G.R.; Brückl, E. Crustal and Lithospheric Structures Between the Alps and East European Craton from Long-Range Controlled Source Seismic Experiments. In Treatise on Geophysics, 2nd ed.; Schubert, G., Romanowicz, B., Dziewonski, A., Eds.; Deep Earth Seismology; Elsevier: Amsterdam, The Netherlands; Oxford, UK, 2015; Volume 1, pp. 557–586. [Google Scholar] [CrossRef]
- Janik, T.; Grad, M.; Guterch, A.; Vozár, J.; Bielik, M.; Vozárova, A.; Hegedűs, E.; Kovács, C.S.; Kovács, I.; Keller, G.R.; et al. Crustal structure of the Western Carpathians and Pannonian Basin: Seismic models from CELEBRATION 2000 data and geological implications. J. Geodyn. 2011, 52, 97–113. [Google Scholar] [CrossRef]
- Środa, P. The bright spot in the West Carpathian upper mantle: A trace of the Tertiary plate collision—And a caveat for a seismologist. Geophys. J. Int. 2010, 182, 1–10. [Google Scholar] [CrossRef]
- Sollogub, V.B.; Chekunov, A.V.; Kaluznaya, L.T. Lithosphere structure along the geotraverse II. In Lithosphere of Central and East Europe. Geotraverse I, II, V; Naukova Dumka: Kiev, Ukraine, 1988; p. 63. (In Russian) [Google Scholar]
- Starostenko, V.; Janik, T.; Kolomiyets, K.; Czuba, W.; Środa, P.; Grad, M.; Kovács, I.; Stephenson, R.; Lysynchuk, D.; Thybo, H.; et al. Seismic velocity model of the crust and upper mantle along profile PANCAKE across the Carpathians between the Pannonian Basin and the East European Craton. Tectonophysics 2013, 608, 1049–1072. [Google Scholar] [CrossRef]
- Starostenko, V.; Janik, T.; Mocanu, V.; Stephenson, R.; Yegorova, T.; Amashukeli, T.; Czuba, W.; Środa, P.; Murovskaya, A.; Kolomiyets, K.; et al. RomUkrSeis: Seismic model of the crust and upper mantle across the Eastern Carpathians—From the Apuseni Mountains to the Ukrainian Shield. Tectonophysics 2020, 794, 228620. [Google Scholar] [CrossRef]
- Hole, J.A. Nonlinear high-resolution three-dimensional seismic travel time tomography. J. Geophys. Res. 1992, 97, 6553–6562. [Google Scholar] [CrossRef]
- Červený, P.; Pšenčík, I. SEIS83—Seismic Program Package; University Karlova: Prague, Czech Republic, 1983. [Google Scholar]
- Červený, V.; Pšenčík, I. SEIS83—Numerical modelling of seismic wave fields in 2-D laterally varying layered structures by the ray method. In Documentation of Earthquake Algorithms; Engdal, E.R., Ed.; Rep. SE-35; World Data Center (A) for Solid Earth Geophysicists: Boulder, CO, USA, 1984; pp. 36–40. [Google Scholar]
- Komminaho, K. Software Manual for Programs MODEL and XRAYS: A Graphical Interface for SEIS83 Program Package; University of Oulu: Oulu, Finland, 1998; p. 31. [Google Scholar]
- Zelt, C.A. Software Package ZPLOT; Bullard Laboratories, University of Cambridge: Cambridge, UK, 1994. [Google Scholar]
- Kostyukevich, A.S.; Starostenko, V.I.; Stephenson, R.A. The full-wave images of the models of the deep lithosphere structures constructed according to DSS and CDP data interpretation. Geophys. J. 2000, 22, 96–98. [Google Scholar]
- Kotański, Z. (Ed.) Geological Atlas of Poland—Geological Maps of Horizontal Section 1:750,000; Państwowy Instytut Geologiczny: Warszawa, Poland, 1997. (In Polish) [Google Scholar]
- Środa, P. Seismic anisotropy of the upper crust in southeastern Poland—Effect of the compressional deformation at the EEC margin: Results of CELEBRATION 2000 seismic data inversion. Geophys. Res. Lett. 2006, 33, L22302. [Google Scholar] [CrossRef]
- Środa, P. Crustal Structure, Seismic Anisotropy and Deformations of the Ediacaran/Cambrian of the Małopolska Block in SE Poland Based on Data from Two Seismic Wide-Angle Experiments. Pure Appl. Geophys. 2017, 174, 1711–1728. [Google Scholar] [CrossRef][Green Version]
- Starostenko, V.; Janik, T.; Yegorova, T.; Czuba, W.; Środa, P.; Lysynchuk, D.; Aizberg, R.; Garetsky, R.; Karataev, G.; Gribik, Y.; et al. Lithospheric structure along wide-angle seismic profile GEORIFT 2013 in Pripyat-Dnieper-Donets Basin (Belarus and Ukraine). Geophys. J. Int. 2018, 212, 1932–1962. [Google Scholar] [CrossRef]
- Puzyrev, N.N. Time Fields of Reflected Waves and the Method of Effective Parameters; Nauka: Novosibirsk, Russia, 1979; 294p. (In Russian) [Google Scholar]
- Kolomiyets, A.V.; Kharchenko, A.V. Tuning parallel computations for low-bandwidth network. Comput. Math. 2008, 1, 63–69. (In Russian) [Google Scholar]
- Janik, T.; Yliniemi, J.; Grad, M.; Thybo, H.; Tiira, T.; POLONAISE P2 Working Group. Crustal structure across the TESZ along POLONAISE’97 seismic profile P2 in NW Poland. Tectonophysics 2002, 360, 129–152. [Google Scholar] [CrossRef]
- Grad, M.; Jensen, S.L.; Keller, G.R.; Guterch, A.; Thybo, H.; Janik, T.; Tiira, T.; Yliniemi, J.; Luosto, U.; Motuza, G.; et al. Crustal Structure of the Trans-European suture zone region along POLONAISE’97 seismic profile P4. J. Geophys. Res. 2003, 108, 2541. [Google Scholar] [CrossRef]
- Grad, M.; Guterch, A.; Mazur, S.; Keller, G.R.; Špičák, A.; Hrubcová, P.; Geissler, W.H. Lithospheric structure of the Bohemian Massif and adjacent Variscan belt in central Europe based on profile S01 from the SUDETES 2003 experiment. J. Geophys. Res. 2008, 113, B10304. [Google Scholar] [CrossRef]
- Janik, T.; Kozlovskaya, E.; Heikkinen, P.; Yliniemi, J.; Silvennoinen, H. Evidence for preservation of crustal root beneath the Proterozoic Lapland-Kola orogen in the northern Fennoscandian shield derived from P-and S-wave velocity models of POLAR and HUKKA wide-angle reflection and refraction profiles and FIRE4 reflection transect. J. Geophys. Res. 2009, 114, B06308. [Google Scholar] [CrossRef]
- Guterch, A. Structure and physical properties of the Earth’s crust in Poland in the light of new data of DSS. Publ. Inst. Geophys. Pol. Acad. Sci. 1977, A-4, 347–357. [Google Scholar]
- Guterch, A.; Grad, M.; Materzok, R.; Perchuć, E. Deep structure of the Earth’s crust in the contact zone of the Palaeozoic and Precambrian platforms in Poland (Tornquist-Teisseyre zone). Tectonophysics 1986, 128, 251–279. [Google Scholar] [CrossRef]
- Guterch, A.; Grad, M.; Materzok, R.; Perchuć, E.; Janik, T.; Gaczyński, E.; Doan, T.T.; Białek, T.; Gadomski, D.; Młynarski, S.; et al. Structure of the lower crust of the Paleozoic Platform in Poland from seismic wide-angle and near-vertical reflection surveys. Publ. Inst. Geophys. Pol. Acad. Sci. 1991, A-19, 41–62. [Google Scholar]
- Egorkin, A.V. Analysis of the accuracy determination of velocity cross-section in the Earth’s crust from travel time of reflected waves. Izv. Akad. Nauk SSSR. Fiz. Zemli 1966, 9, 72–81. (In Russian) [Google Scholar]
- Grad, M. Determination of mean velocities and depths of boundaries in the Earth’s crust from reflected waves. Acta Geophys. Pol. 1983, 31, 231–241. [Google Scholar]
- Narkiewicz, M. Development and inversion of Devonian and Carboniferous basins in the eastern part of the Variscan foreland (Poland). Geol. Q. 2007, 51, 231–256. [Google Scholar]
- Mazur, S.; Aleksandrowsk, P.; Turniak, K.; Krzemiński, L.; Mastalerz, K.; Górecka-Nowak, A.; Kurowski, L.; Krzywiec, P.; Żelaźniewicz, A.; Fanning, M.C. Uplift and late orogenic deformation of the Central European Variscan belt as revealed by sediment provenance and structural record in the Carboniferous foreland basin of western Poland. Int. J. Earth Sci. 2010, 99, 47–64. [Google Scholar] [CrossRef]
- McClay, K.R. Glossary of thrust tectonics terms. In Thrust Tectonics; McClay, K.R., Ed.; Chapman & Hall: London, UK, 1992; pp. 419–433. [Google Scholar]
- Boyer, S.E.; Elliott, D. Thrust systems. Am. Assoc. Pet. Geol. Bull. 1982, 66, 1196–1230. [Google Scholar]
- Butler, R.; Bond, C. Thrust systems and contractional tectonics. In Regional Geology and Tectonics, 2nd ed.; Volume 1: Principles of Geologic Analysis; Elsevier: Amsterdam, The Netherlands, 2020; pp. 149–167. [Google Scholar] [CrossRef]
- Starostenko, V.; Janik, T.; Lysynchuk, D.; Środa, P.; Czuba, W.; Kolomiyets, K.; Aleksandrowski, P.; Gintov, O.; Omelchenko, V.; Komminaho, K.; et al. Lithosphere-scale buckling of the east European Craton in southern Ukraine: DOBRE-4 deep seismic profile. Geophys. J. Int. 2013, 195, 740–766. [Google Scholar] [CrossRef]
- Crittenden, M.D.; Coney, P.J.; Davis, G.H. (Eds.) Cordilleran Metamorphic Core Complexes; Geological Society of America: Boulder, CO, USA, 1980; Volume 153, 490p. [Google Scholar]
- Lister, G.S.; Davis, G.A. The origin of metamorphic core complexes and detachment faults formed during Tertiary continental extension in the northern Colorado river region, U.S.A. J. Struct. Geol. 1989, 11, 65–94. [Google Scholar] [CrossRef]
- Scott, R.J.; Lister, G.S. Detachment faults: Evidence for a low-angle origin. Geology 1992, 20, 833–836. [Google Scholar] [CrossRef]
- Wheeler, J.; Butler, R.W.H. Criteria for identyfying structures related to true crustal extension in orogens. J. Struct. Geol. 1994, 16, 1023–1027. [Google Scholar] [CrossRef]
- Narkiewicz, M. Geological History of Poland; Wydawnictwa Uniwersytetu Warszawskiego: Warszawa, Poland, 2020; 279p. (In Polish) [Google Scholar]
- Abbott, D.H.; Mooney, W.D.; VanTongeren, J.A. The character of the Moho and lower crust within Archean cratons and the tectonic implications. Tectonophysics 2013, 609, 690–705. [Google Scholar] [CrossRef]
- Coward, M. Inversion tectonics. In Continental Deformation; Hancock, P.L., Ed.; Pergamon Press: Oxford, UK, 1994; pp. 289–304. [Google Scholar]
- Mitra, S. Duplex structures and imbricate thrust systems: Geometry, structural position and hydrocarbon potential. Am. Assoc. Petrol. Geol. Bull. 1986, 70, 1087–1112. [Google Scholar]
- Maystrenko, Y.; Scheck-Wenderoth, M. Density contrasts in the upper mantle and lower crust across the continent—Ocean transition: Constraints from 3-D gravity modelling at the Norwegian margin. Geophys. J. Int. 2009, 179, 536–548. [Google Scholar] [CrossRef]
- Mjelde, R.; Faleide, J.I.; Breivik, A.J.; Raum, T. Lower crustal composition and crustal lineaments on the Voring Margin, NE Atlantic: A review. Tectonophysics 2009, 472, 183–193. [Google Scholar] [CrossRef]
- Mjelde, R.; Goncharov, A.; Müller, R.D. The Moho: Boundary above upper mantle peridotites or lower crustal eclogites? A global review and new interpretations for passive margins. Tectonophysics 2013, 609, 636–650. [Google Scholar] [CrossRef]
- Reynisson, R.F.; Ebbing, J.; Lundin, E.; Osmundsen, P.T. Properties and Distribution of Lower Crustal Bodies on the Mid-Norwegian Margin; Petroleum Geology Conference Series 7; Geological Society of London: London, UK, 2010; pp. 843–854. [Google Scholar]
- Becker, K.; Franke, D.; Trumbull, R.; Schnabel, M.; Heyde, I.; Schreckenberger, B.; Koopmann, H.; Bauer, K.; Jokat, W.; Krawczyk, C. Asymmetry of high-velocity lower crust on the South Atlantic rifted margins and implications for the interplay of magmatism and tectonics in continental breakup. Solid Earth 2014, 5, 1011–1026. [Google Scholar] [CrossRef]
- Butler, R.W.H. Thrust sequences. J. Geol. Soc. Lond. 1987, 144, 619–634. [Google Scholar] [CrossRef]
- Żelaźniewicz, A.; Oberc-Dziedzic, T.; Slama, J. Baltica and the Cadomian orogen in the Ediacaran–Cambrian: A perspective from SE Poland. Int. J. Earth Sci. 2020, 109, 1503–1528. [Google Scholar] [CrossRef]
- Wessel, P.; Smith, W.H.F. New version of the Generic Mapping Tools released. Eos Trans. Am. Geophys. Union 1995, 76, 329. [Google Scholar] [CrossRef]


Publisher’s Note: MDPI stays neutral with regard to jurisdictional claims in published maps and institutional affiliations. |
© 2022 by the authors. Licensee MDPI, Basel, Switzerland. This article is an open access article distributed under the terms and conditions of the Creative Commons Attribution (CC BY) license (https://creativecommons.org/licenses/by/4.0/).