
Genesis and Evolution of Hydrothermal Fluids in the Formation of the High-Grade Hishikari Gold Deposit: Carbon, Oxygen, and Sulfur Isotopic Evidence


Abstract
:1. Introduction
2. Geology and Mineralogy in the Hishikari Mining Area
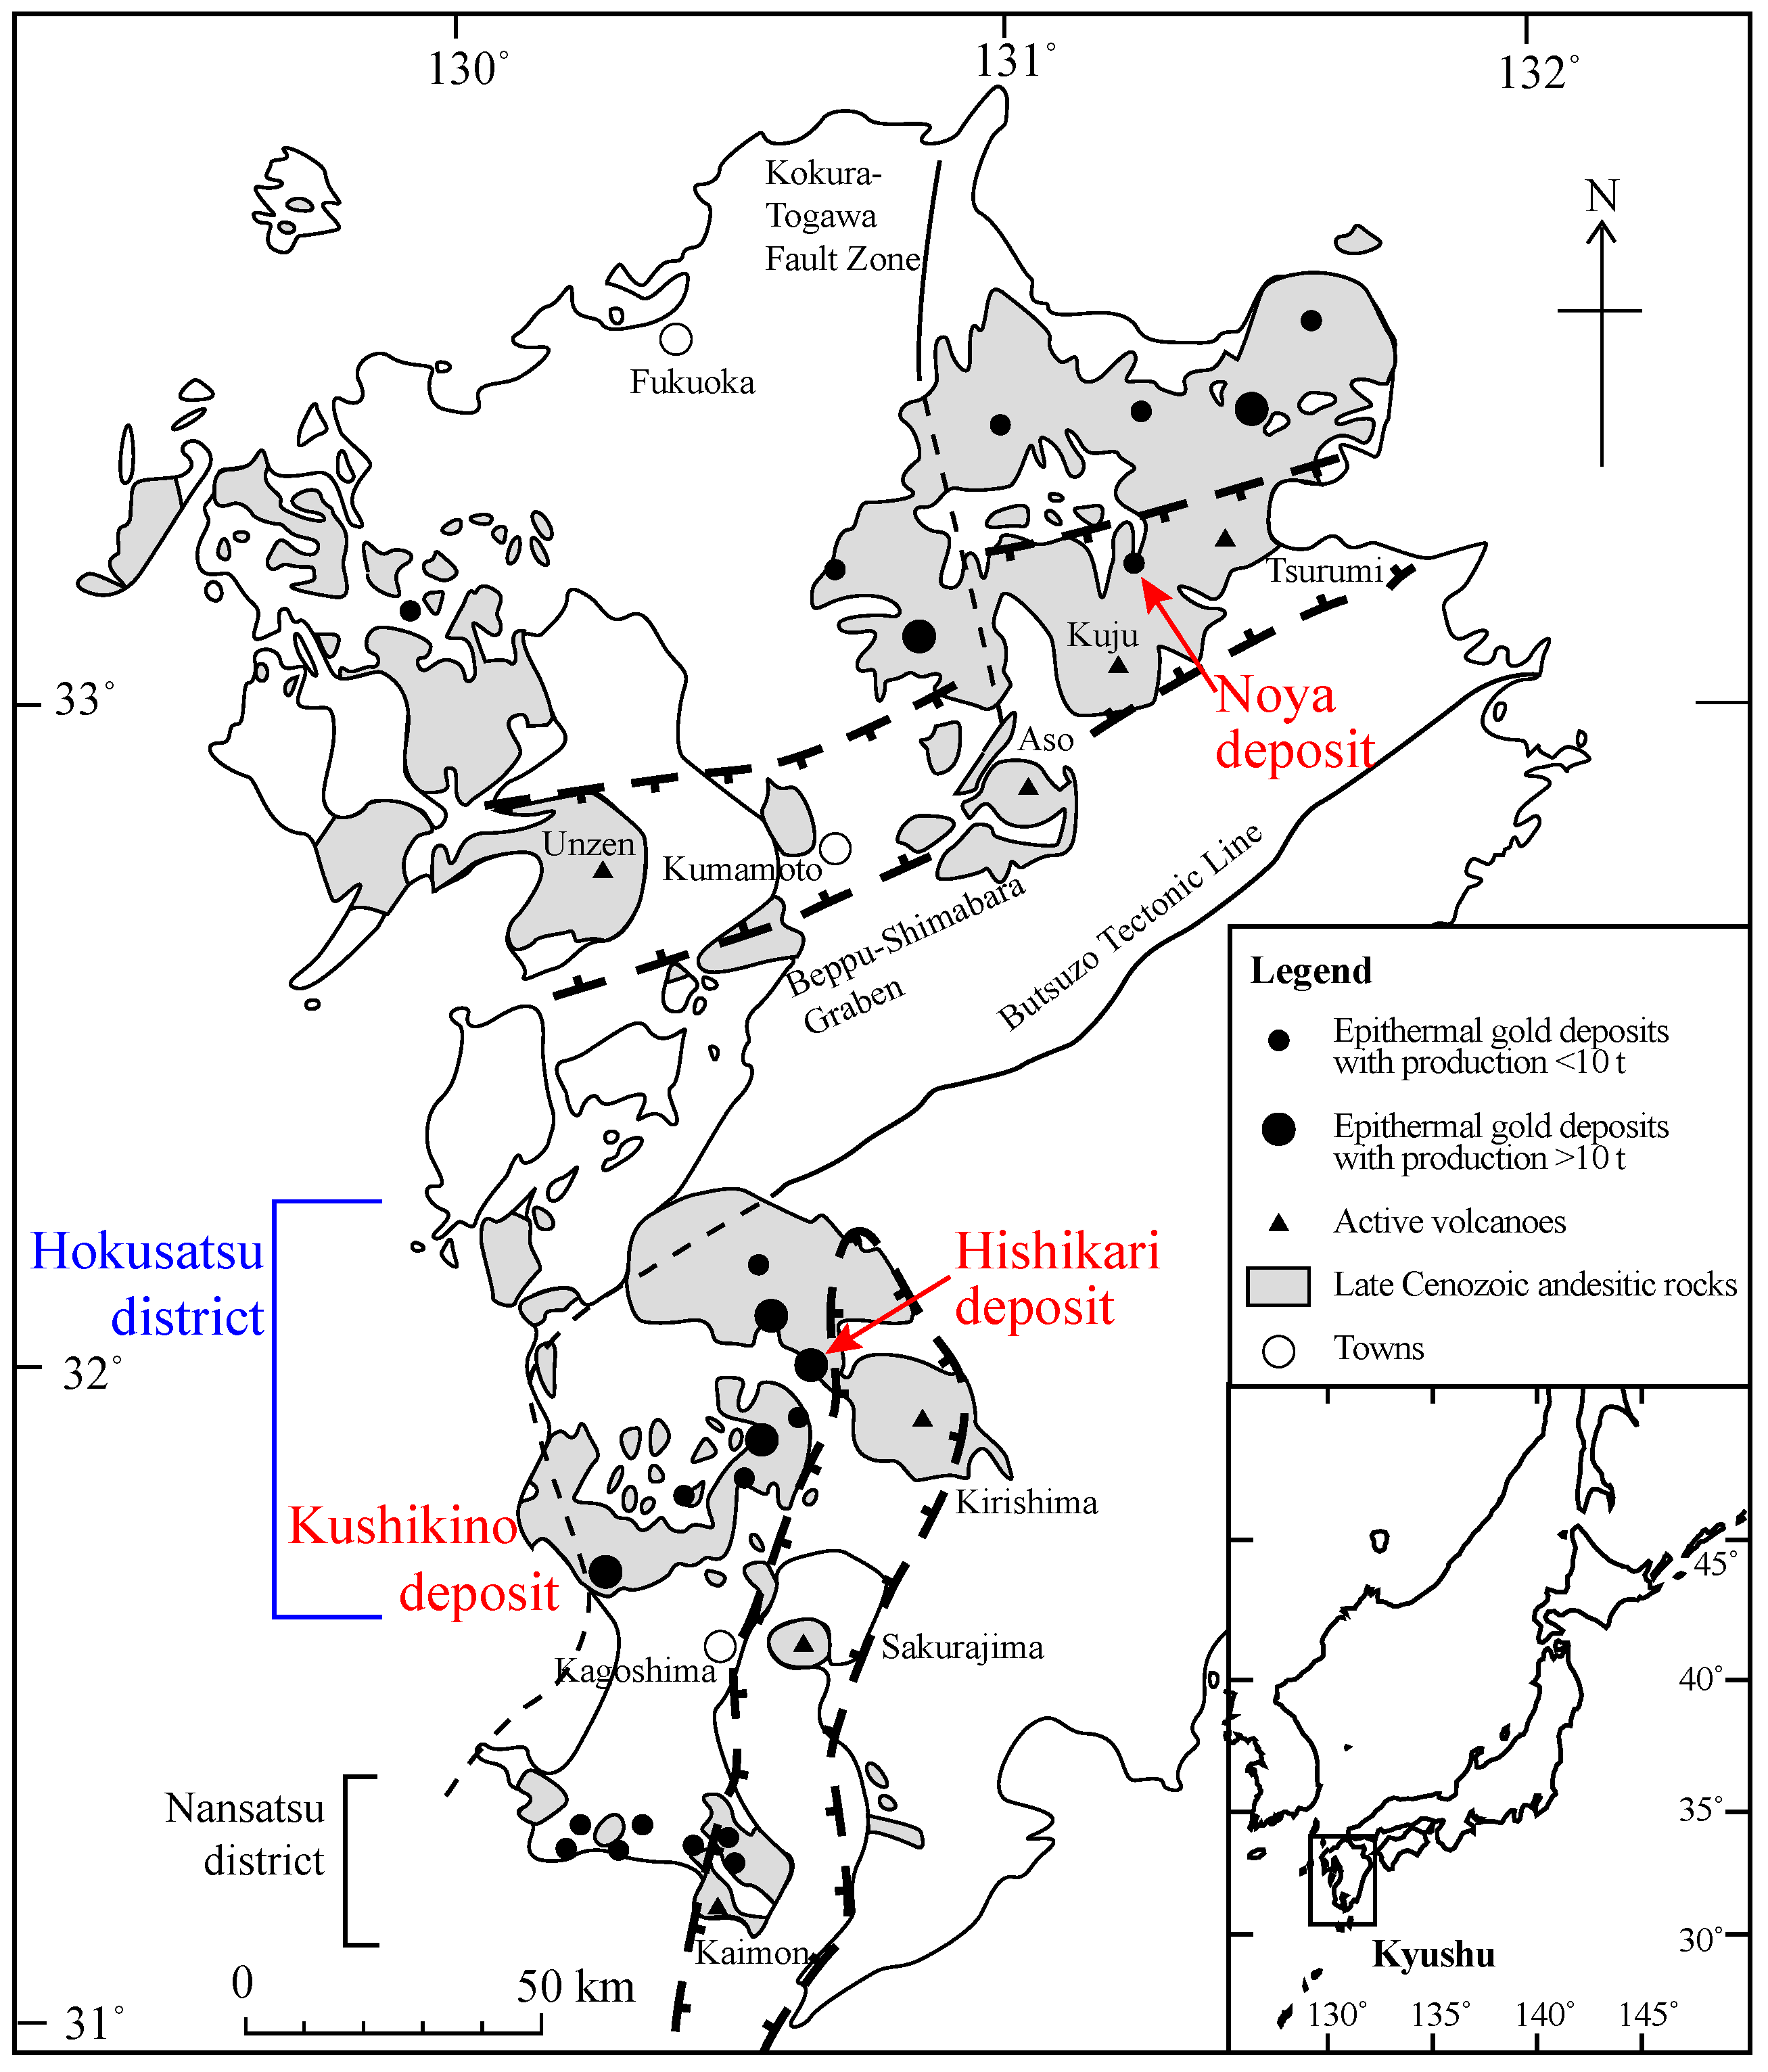
2.1. Geologic Setting and Au Deposits
2.2. Gold-Bearing Veins and Mineral Paragenesis
3. Materials and Methods
3.1. Materials
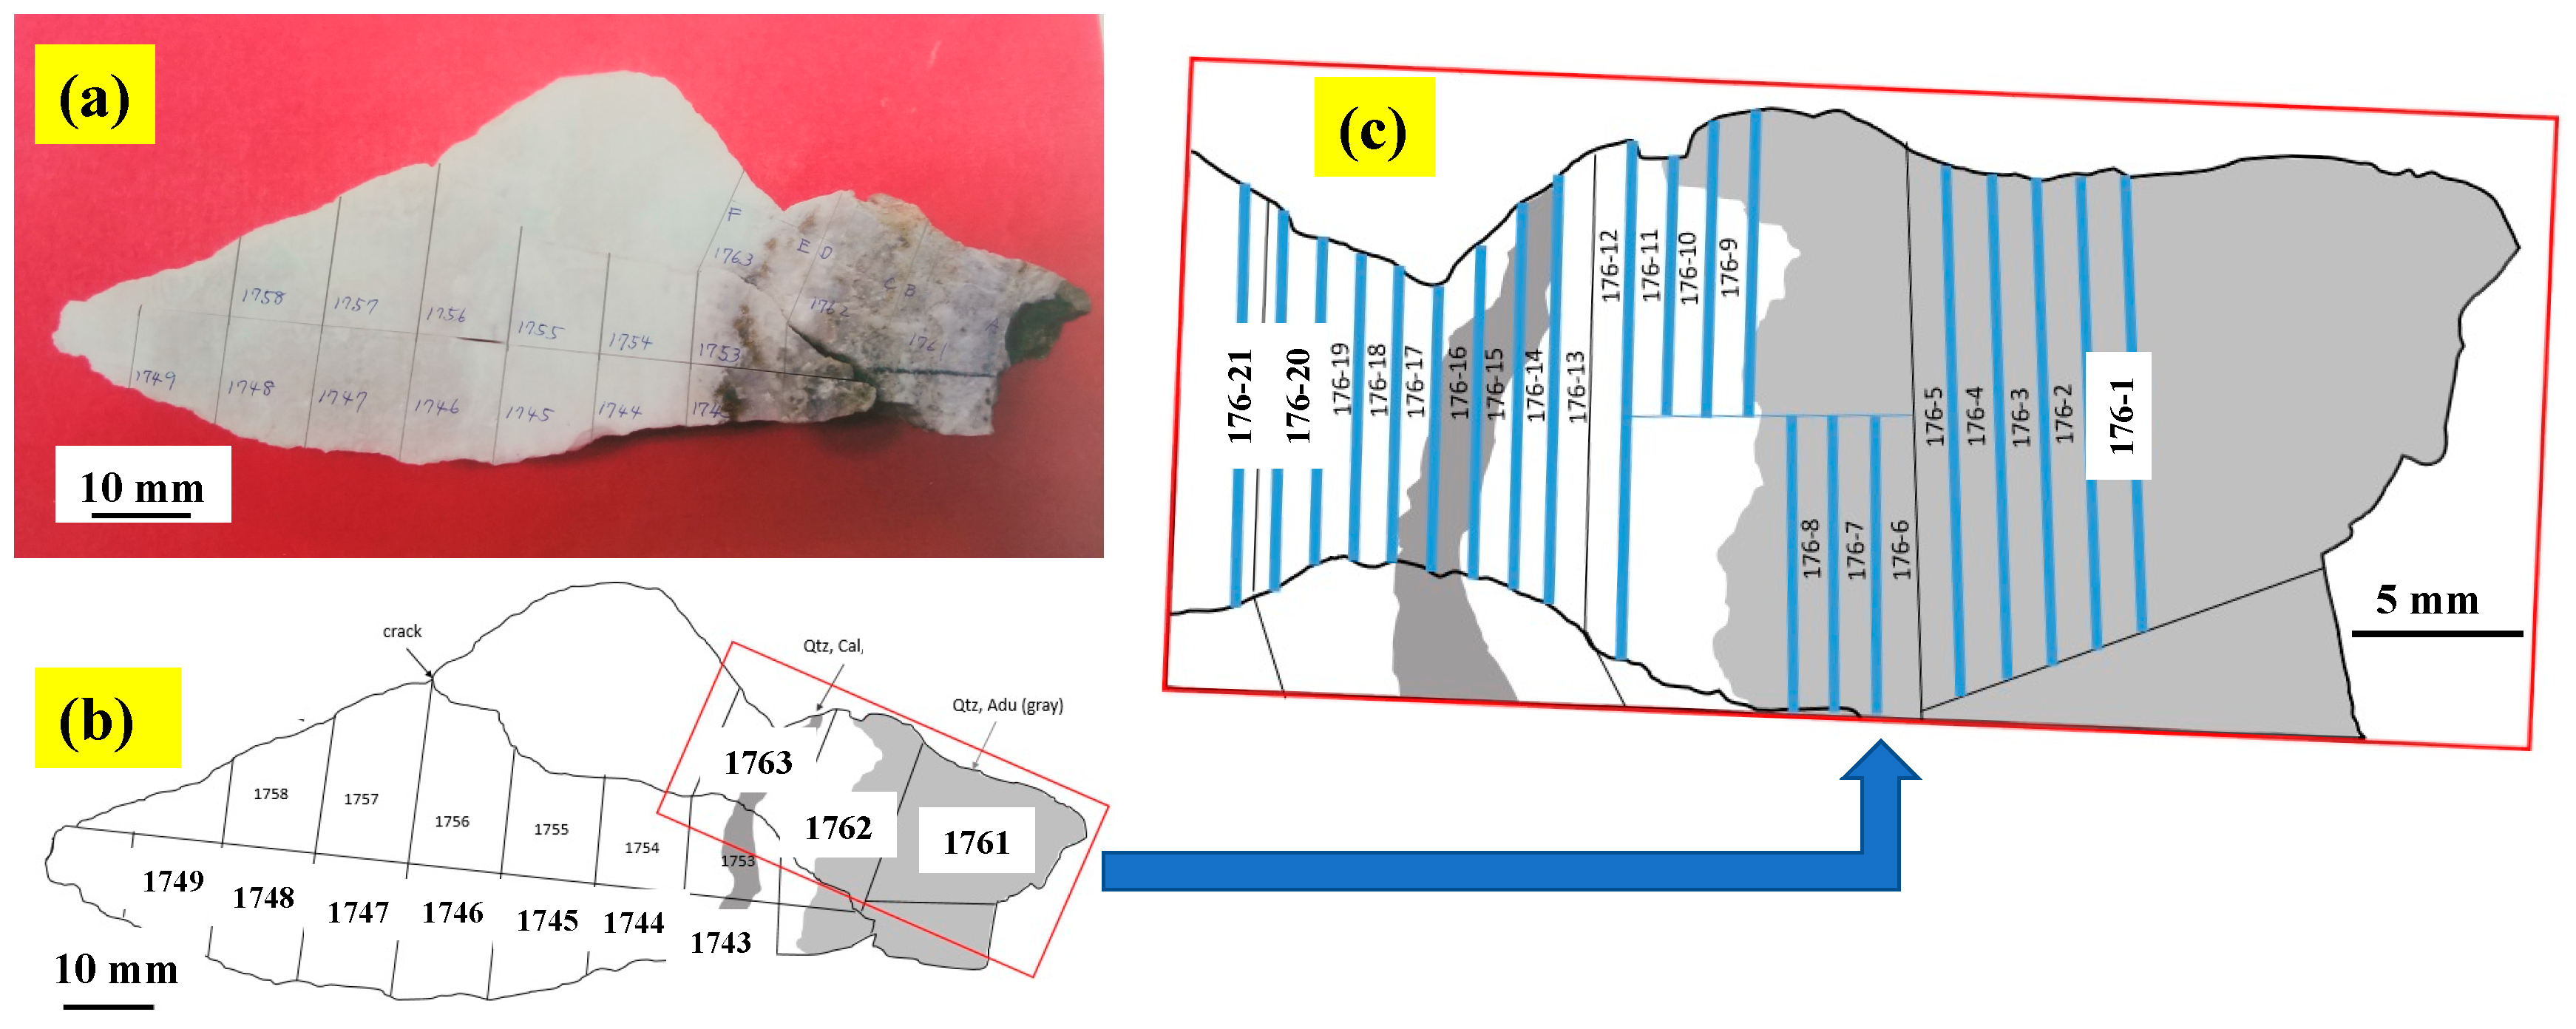
3.1.1. Calcite-Bearing Hand Specimens
3.1.2. A Calcite-Dominant Vein Sample for Microanalysis

| Sample No. | Mineralization Order | Mineral Composition (%) * | δ13C (‰) | δ18O (‰) |
|---|---|---|---|---|
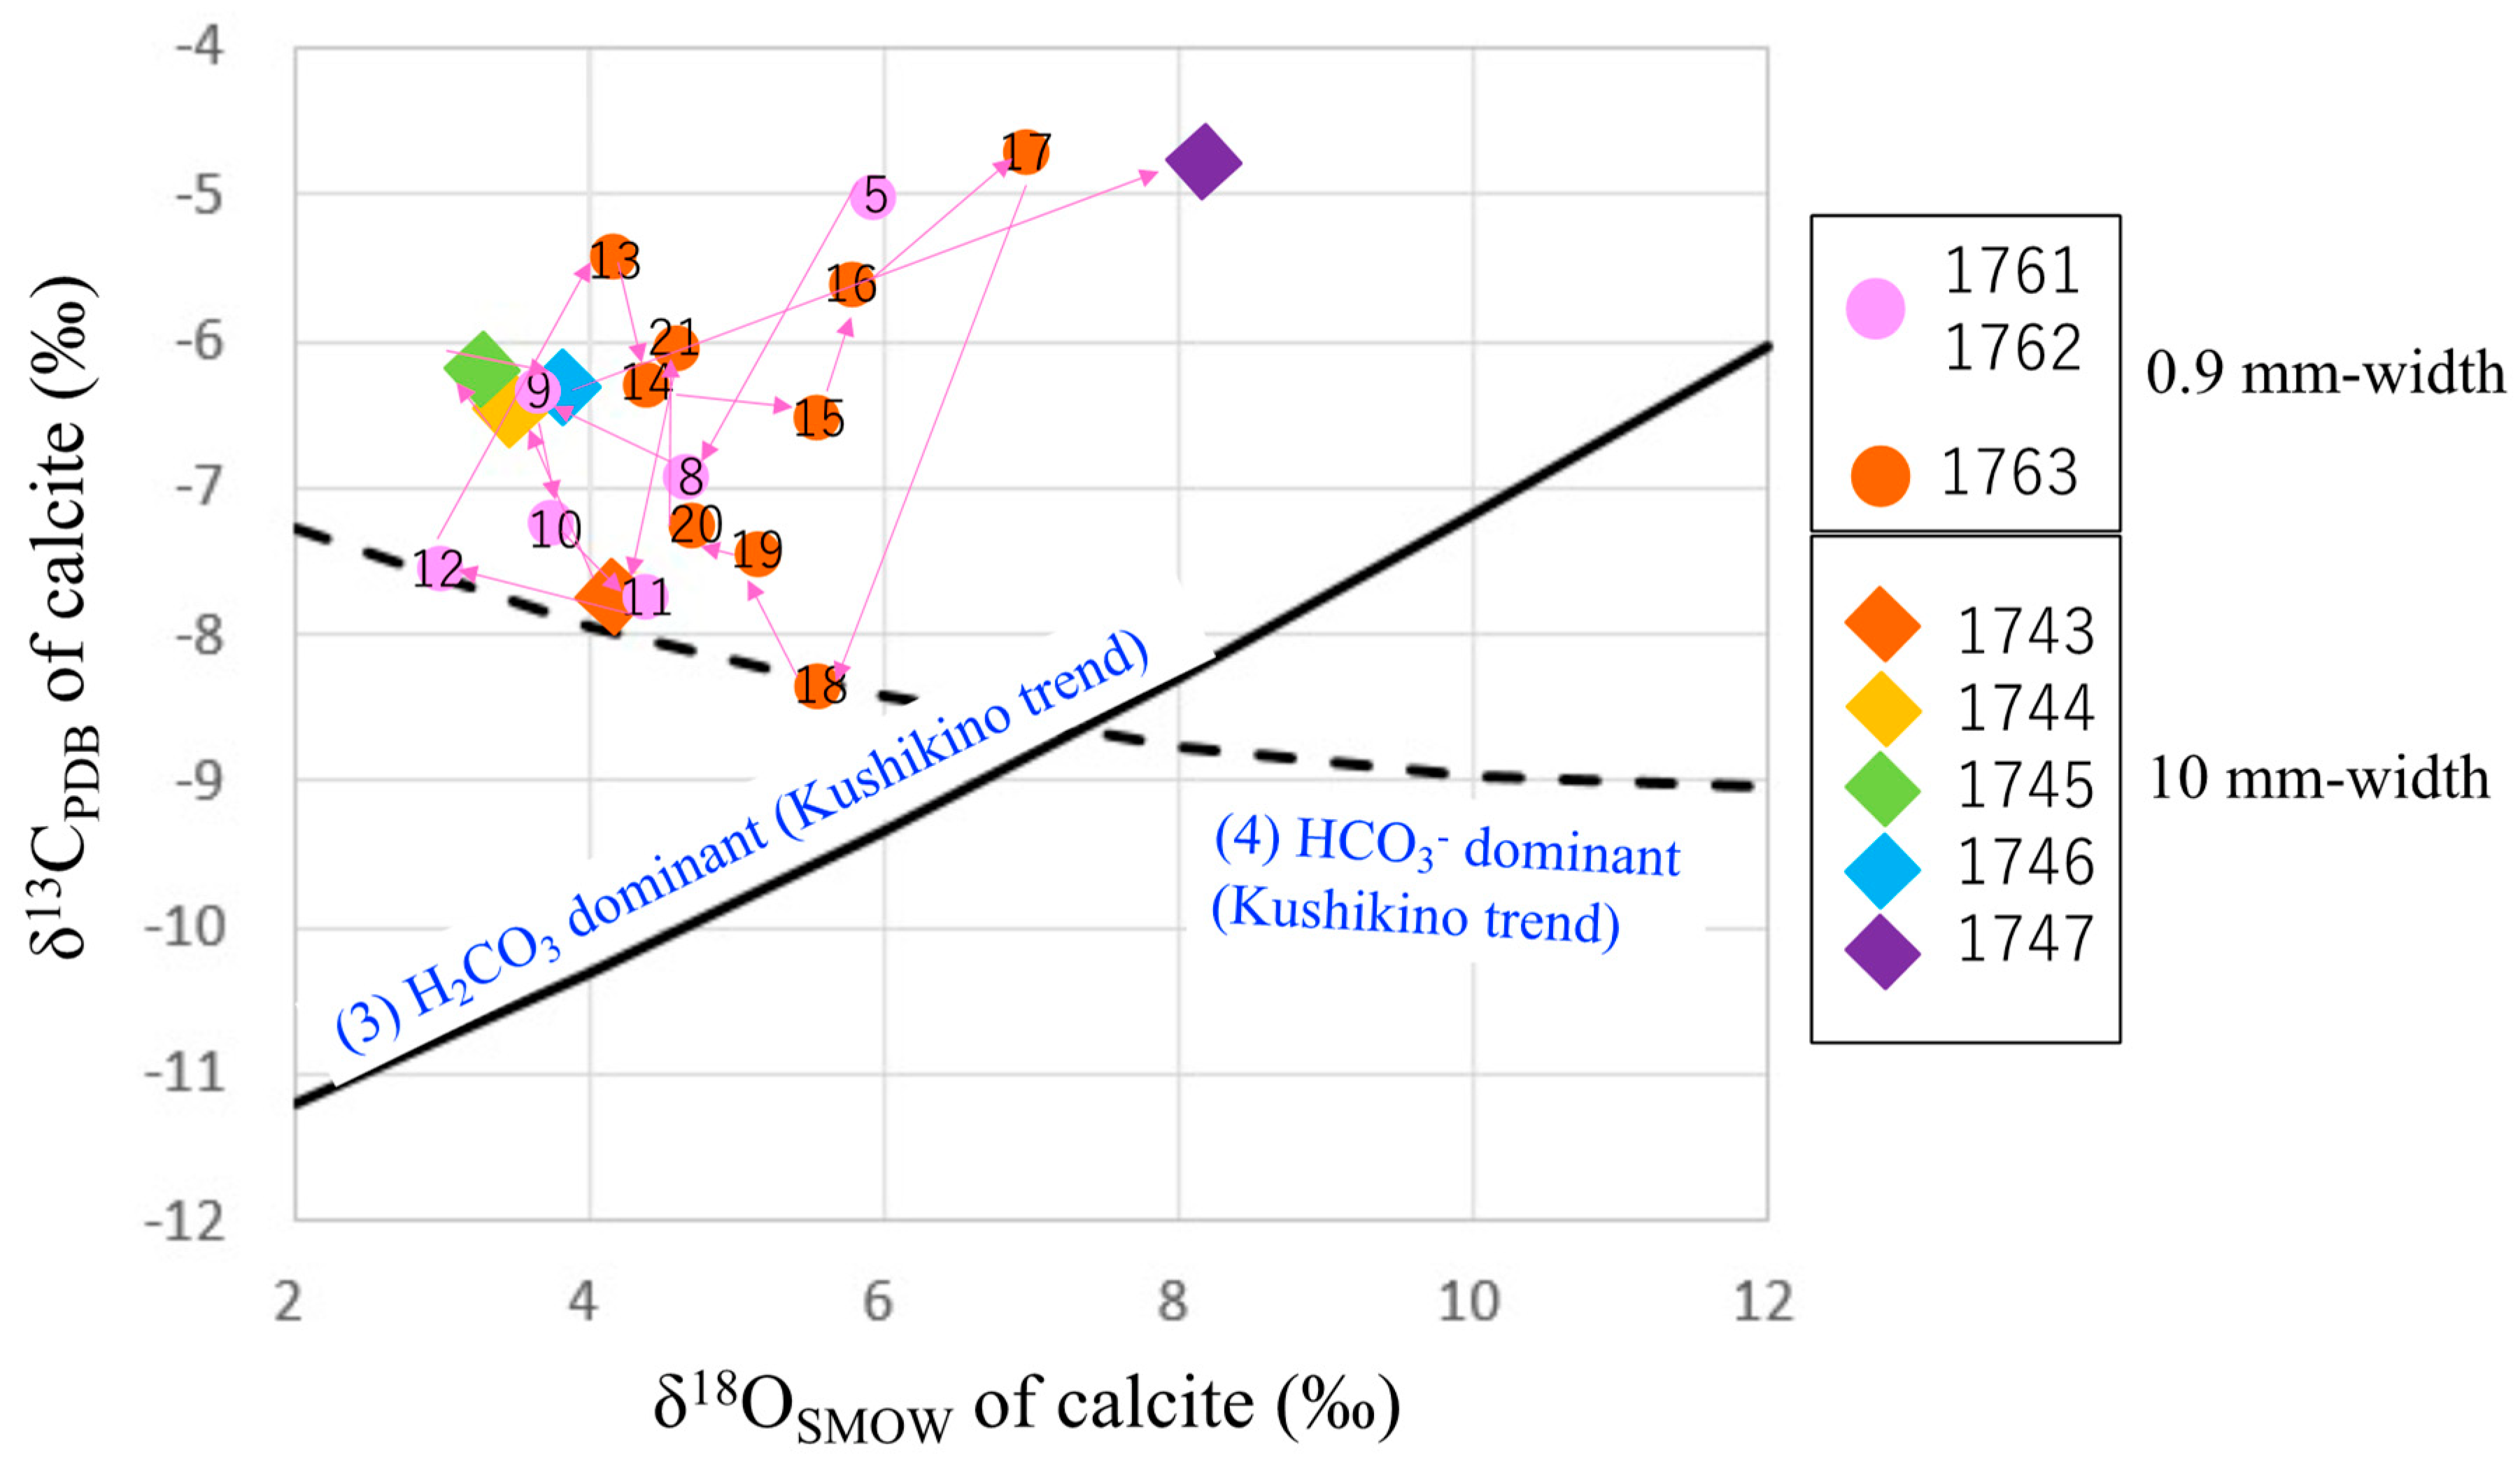
| 1743 | (Early) | Quartz (83), Calcite (17) | −7.7 | 4.3 |
| 1744 |  | Quartz (19), Calcite (81) | −6.5 | 3.5 |
| 1745 | Quartz (29), Calcite (71) | −6.2 | 3.4 | |
| 1746 | Quartz (86), Calcite (14) | −6.3 | 3.9 | |
| 1747 | Quartz (94), Calcite (6) | −4.8 | 8.2 | |
| 1748 | (Late) | Quartz (100) | - | - |
| 1749 | Center of the vein | Quartz (100) | - | - |
| Sample No. | Mineralization Order | Calcite Abundance * | δ13C (‰) | δ18O (‰) |
|---|---|---|---|---|
| 176-1 | Wall rock side | 0% | ||
| 176-2 | (Early) | 0% | ||
| 176-3 |  | 0% | ||
| 176-4 | 0% | |||
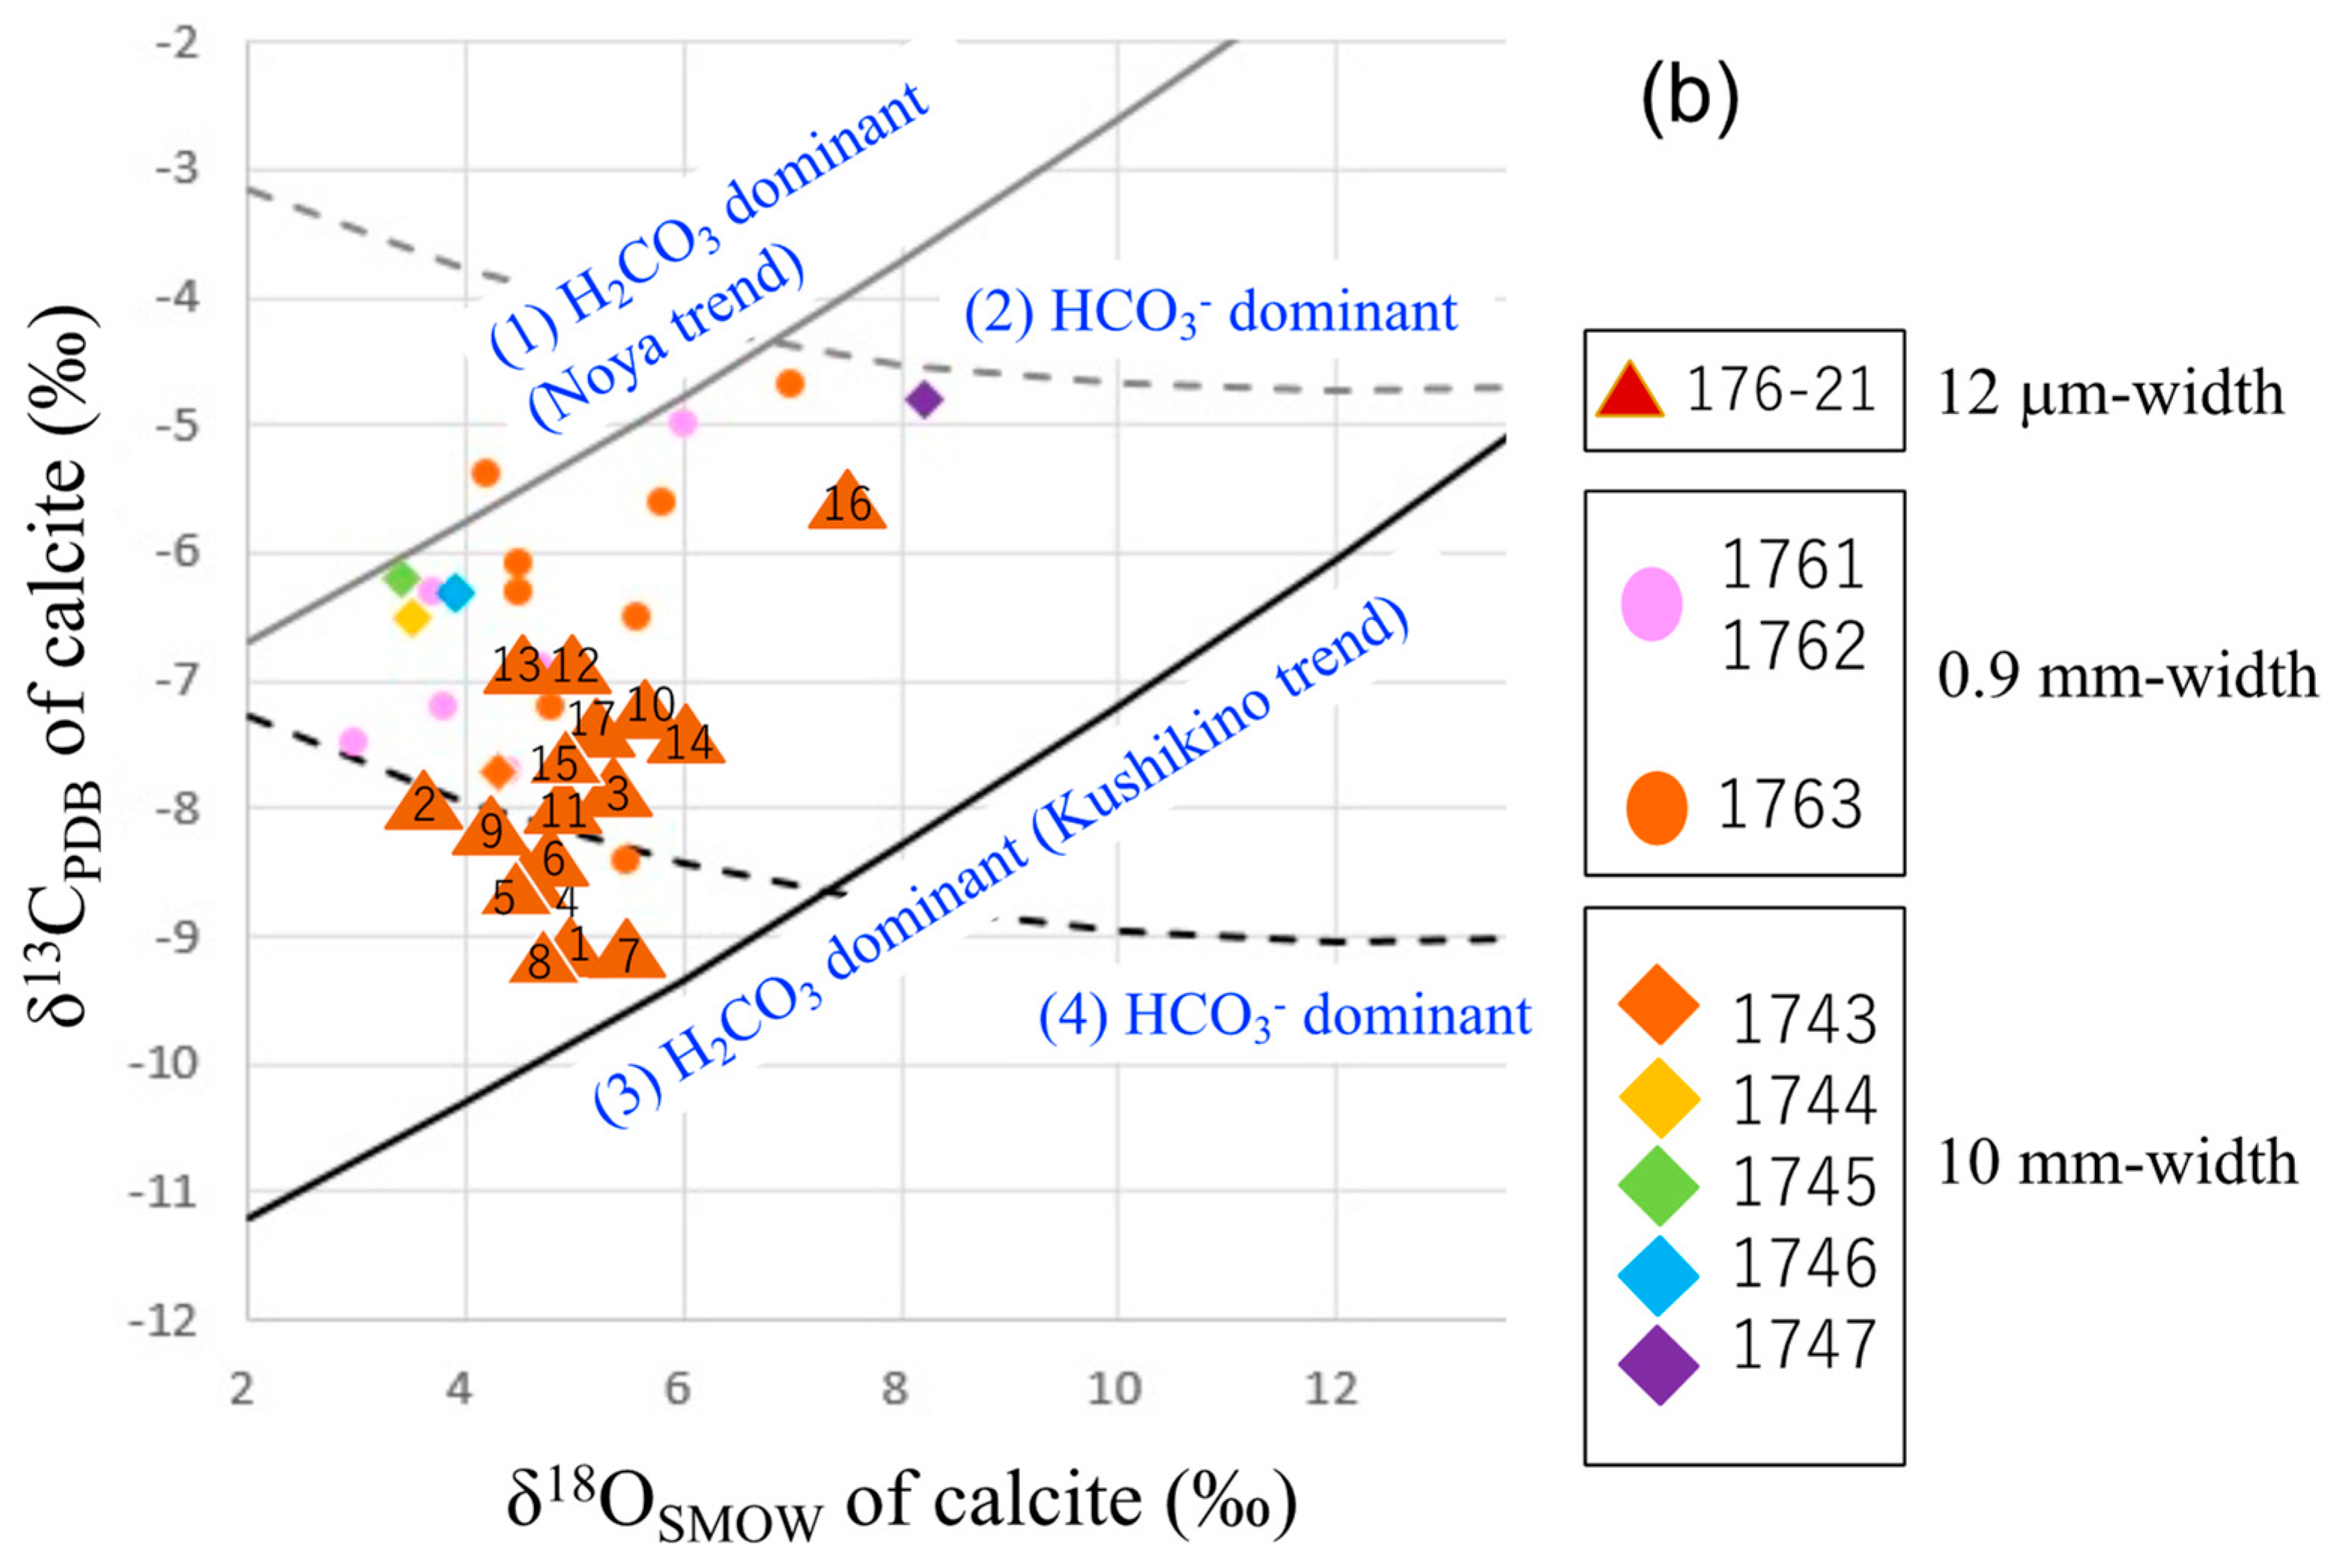
| 176-5 | 4% | −5.0 | 6.0 | |
| 176-6 | 0% | |||
| 176-7 | 0% | |||
| 176-8 | 16% | −6.9 | 4.7 | |
| 176-9 | 5% | −6.3 | 3.7 | |
| 176-10 | 3% | −7.2 | 3.8 | |
| 176-11 | 9% | −7.7 | 4.4 | |
| 176-12 | 17% | −7.5 | 3.0 | |
| 176-13 | 31% | −5.4 | 4.2 | |
| 176-14 | 25% | −6.3 | 4.5 | |
| 176-15 | 17% | −6.5 | 5.6 | |
| 176-16 | 11% | −5.6 | 5.8 | |
| 176-17 | 6% | −4.7 | 7.0 | |
| 176-18 | 33% | −8.4 | 5.5 | |
| 176-19 | 73% | −7.4 | 5.2 | |
| 176-20 | 70% | −7.2 | 4.8 | |
| 176-21 | (Late) | 72% | −6.1 | 4.5 |
| Sample No. | Distance (μm) from the ‘Origin’ * | Mineralization Order | δ13C (‰) | δ18O (‰) |
|---|---|---|---|---|
| 176-20-1 | 7 | Early | −6.3 | 8.4 |
| 176-20-2 | 15 |  | −8.4 | 5.9 |
| 176-20-3 | 26 | −9.1 | 5.0 | |
| 176-20-4 | 37 | −7.7 | 4.8 | |
| 176-20-5 | 42 | −4.5 | 9.9 | |
| 176-20-6 | 57 | −5.5 | 7.4 | |
| 176-20-7 | 76 | −8.2 | 5.2 | |
| 176-20-8 | 87 | −7.7 | 6.5 | |
| 176-20-9 | 107 | −9.5 | 5.1 | |
| 176-20-10 | 121 | −8.0 | 5.7 | |
| 176-20-11 | 137 | −6.9 | 6.5 | |
| 176-20-12 | 144 | −2.5 | 10.9 | |
| 176-21-1 | 1207 | −9.1 | 5.0 | |
| 176-21-2 | 1212 | −7.9 | 3.6 | |
| 176-21-3 | 1222 | −7.8 | 5.3 | |
| 176-21-4 | 1234 | −8.5 | 4.5 | |
| 176-21-5 | 1241 | −8.5 | 4.5 | |
| 176-21-6 | 1247 | −8.4 | 4.8 | |
| 176-21-7 | 1255 | −9.1 | 5.4 | |
| 176-21-8 | 1274 | −9.1 | 5.0 | |
| 176-21-9 | 1285 | −8.2 | 4.3 | |
| 176-21-10 | 1301 | −7.2 | 5.7 | |
| 176-21-11 | 1315 | −8.0 | 4.9 | |
| 176-21-12 | 1319 | −6.9 | 4.9 | |
| 176-21-13 | 1324 | −6.9 | 4.7 | |
| 176-21-14 | 1343 | −7.4 | 6.0 | |
| 176-21-15 | 1361 | −7.6 | 5.0 | |
| 176-21-16 | 1381 | −5.6 | 7.5 | |
| 176-21-17 | 1388 | Late | −7.4 | 5.2 |
3.1.3. Pyrite Samples
3.2. Analytical Methods
3.2.1. Carbon and Oxygen Isotope Ratios of Calcite
3.2.2. Sulfur Isotope Ratios of Pyrite
4. Results
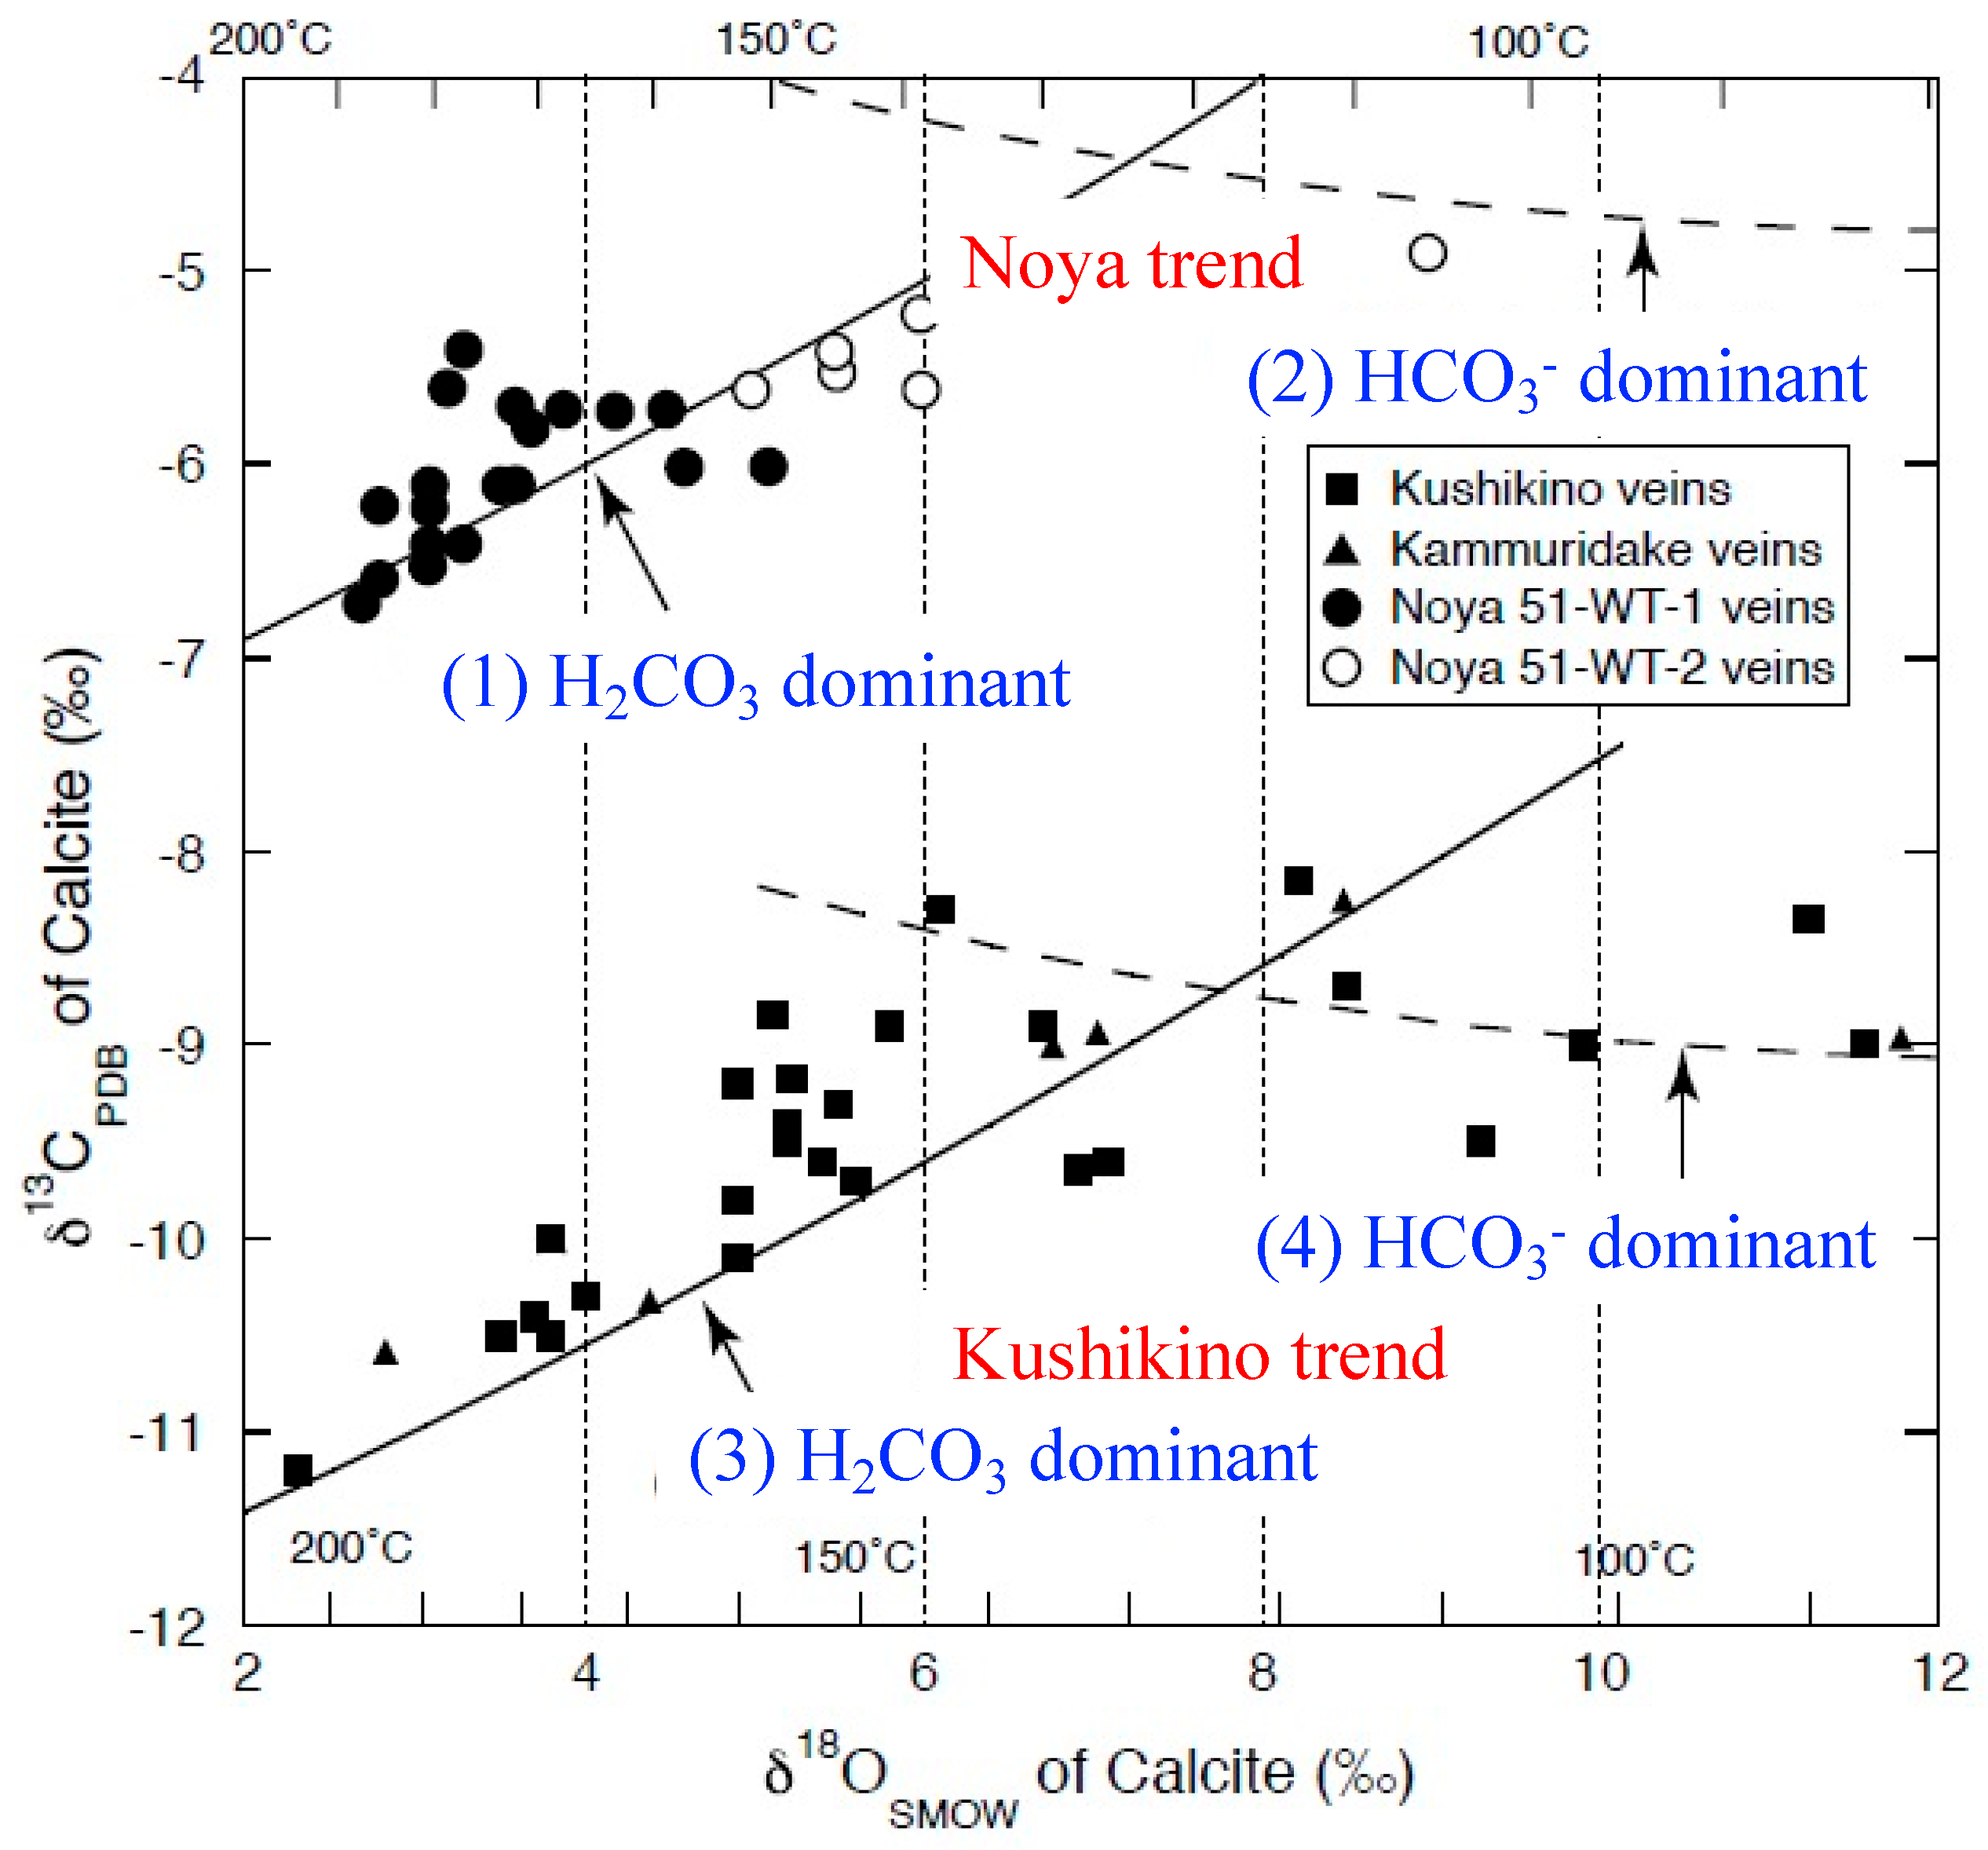
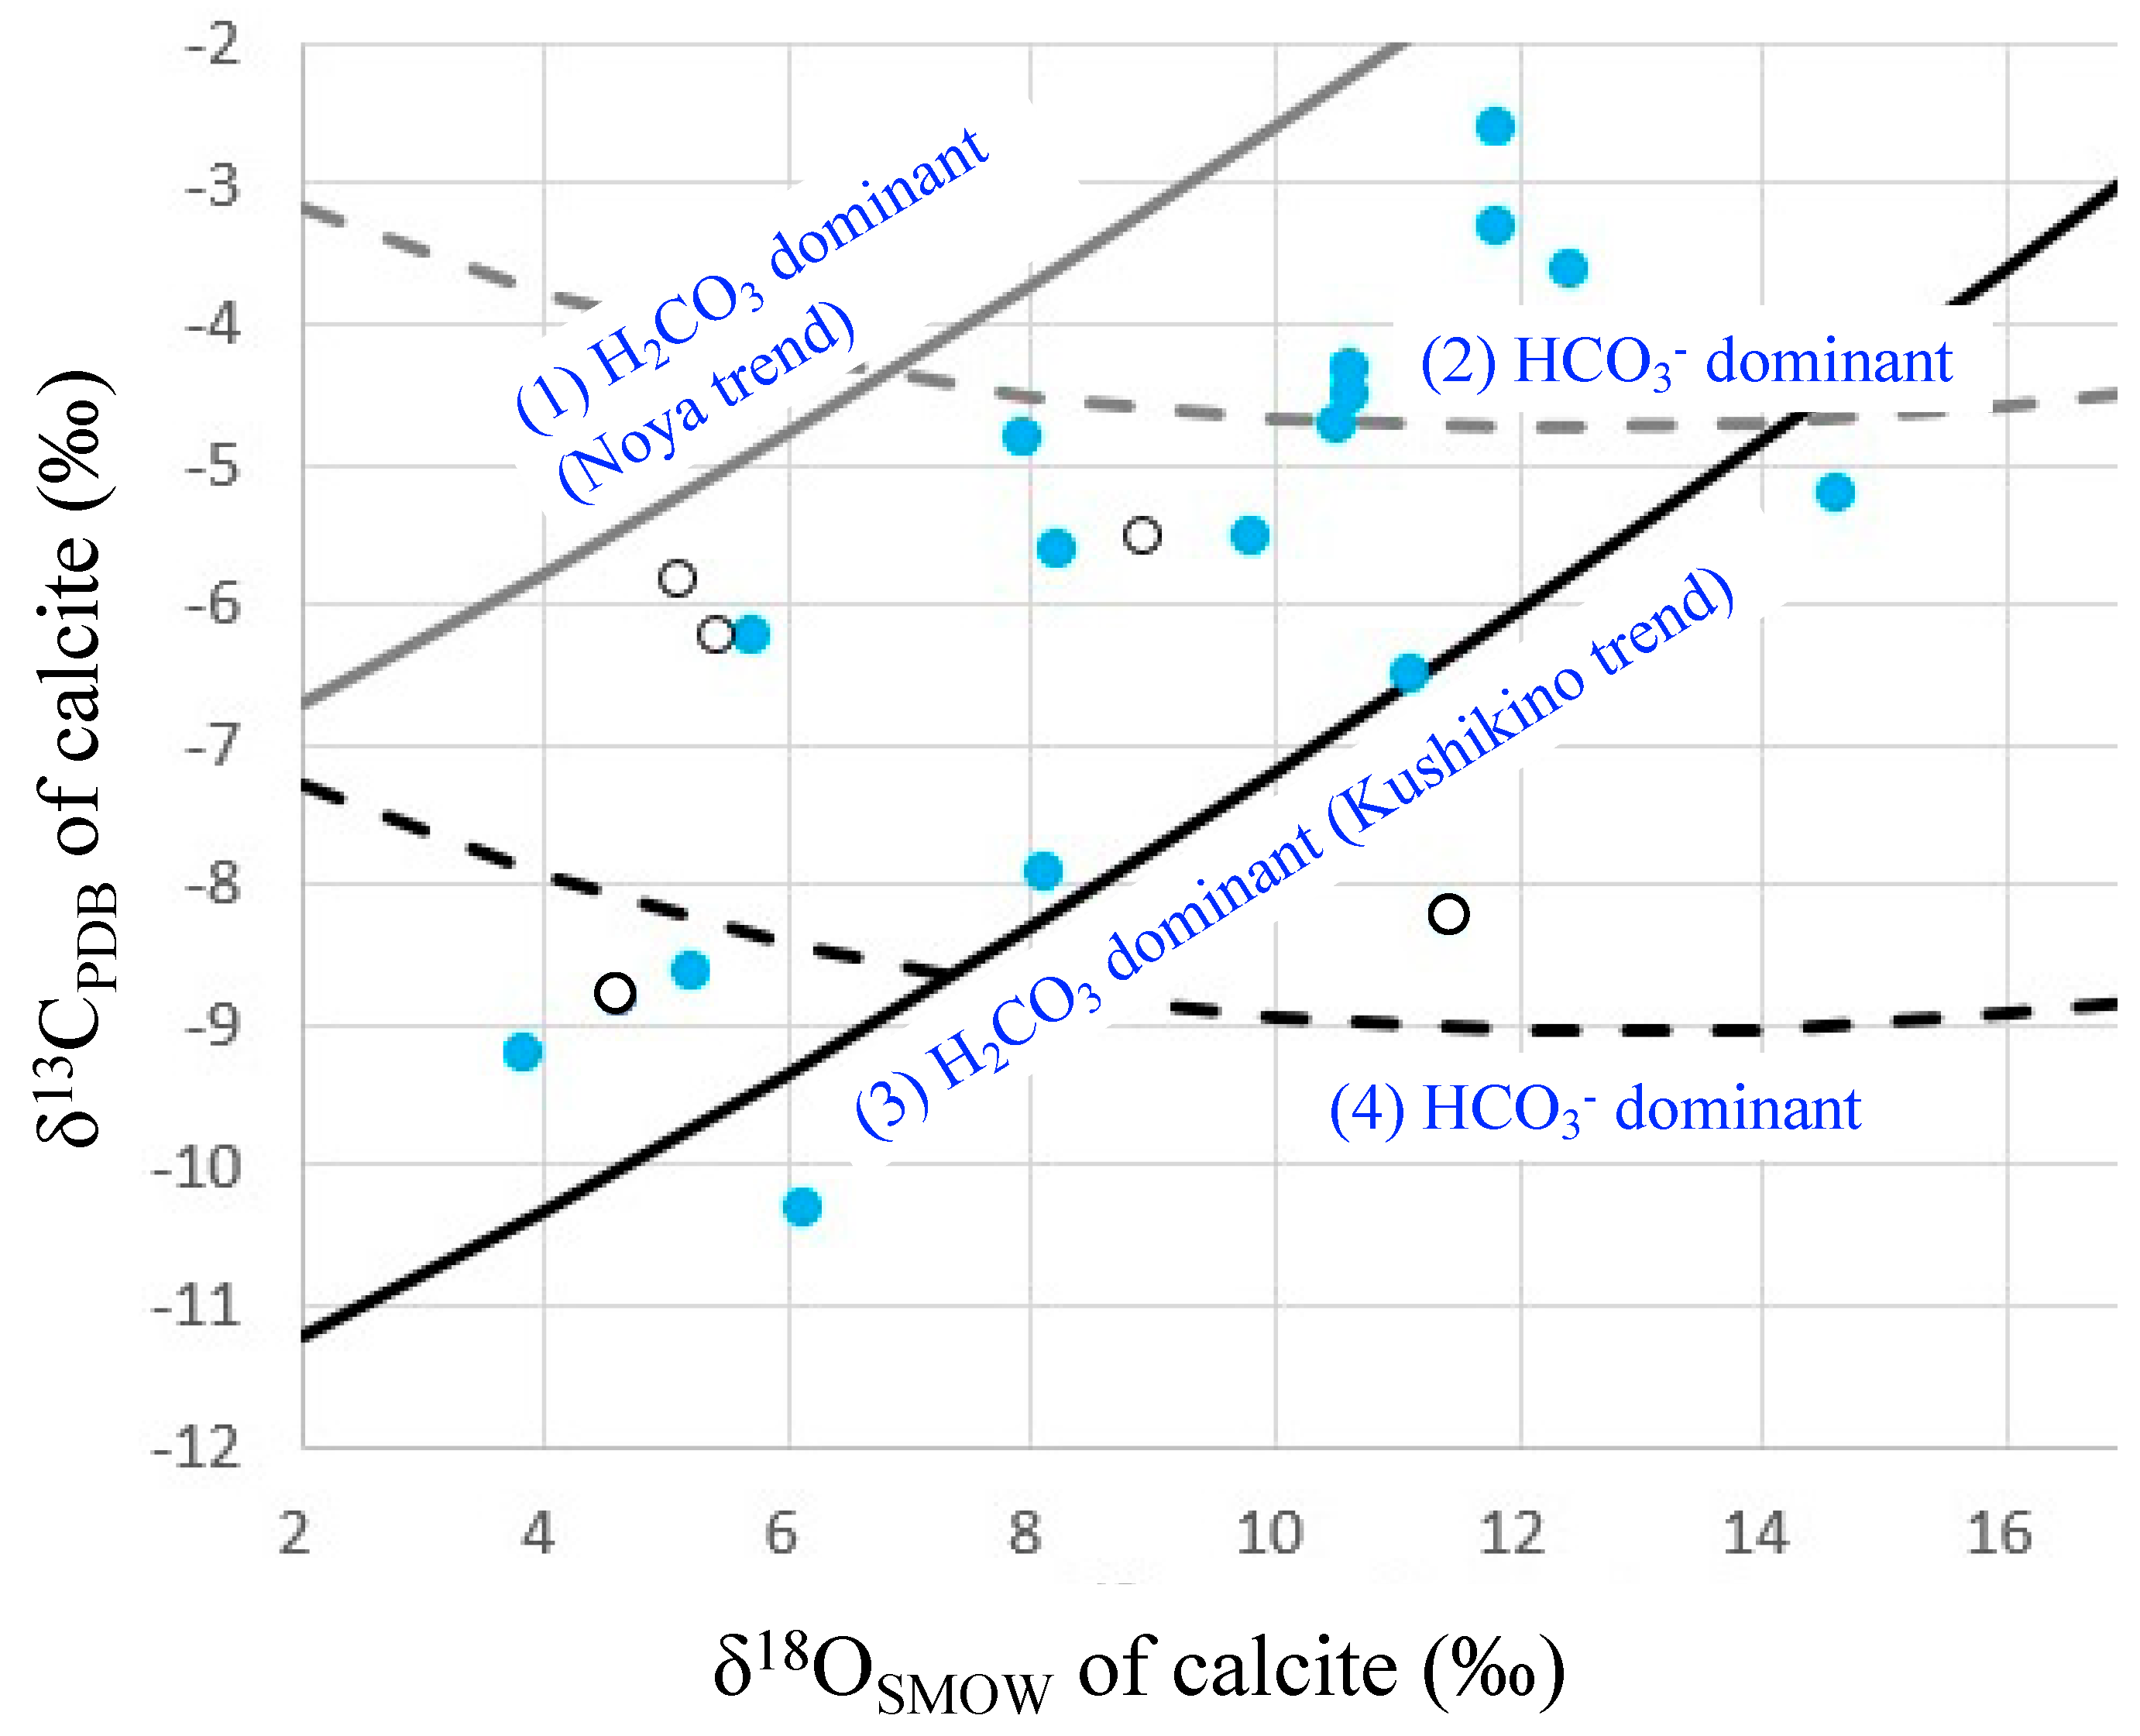
4.1. Carbon and Oxygen Isotope Ratios of Calcite-Bearing Hand Specimens
4.2. Microanalysis of Calcite from a Calcite-Dominant Vein
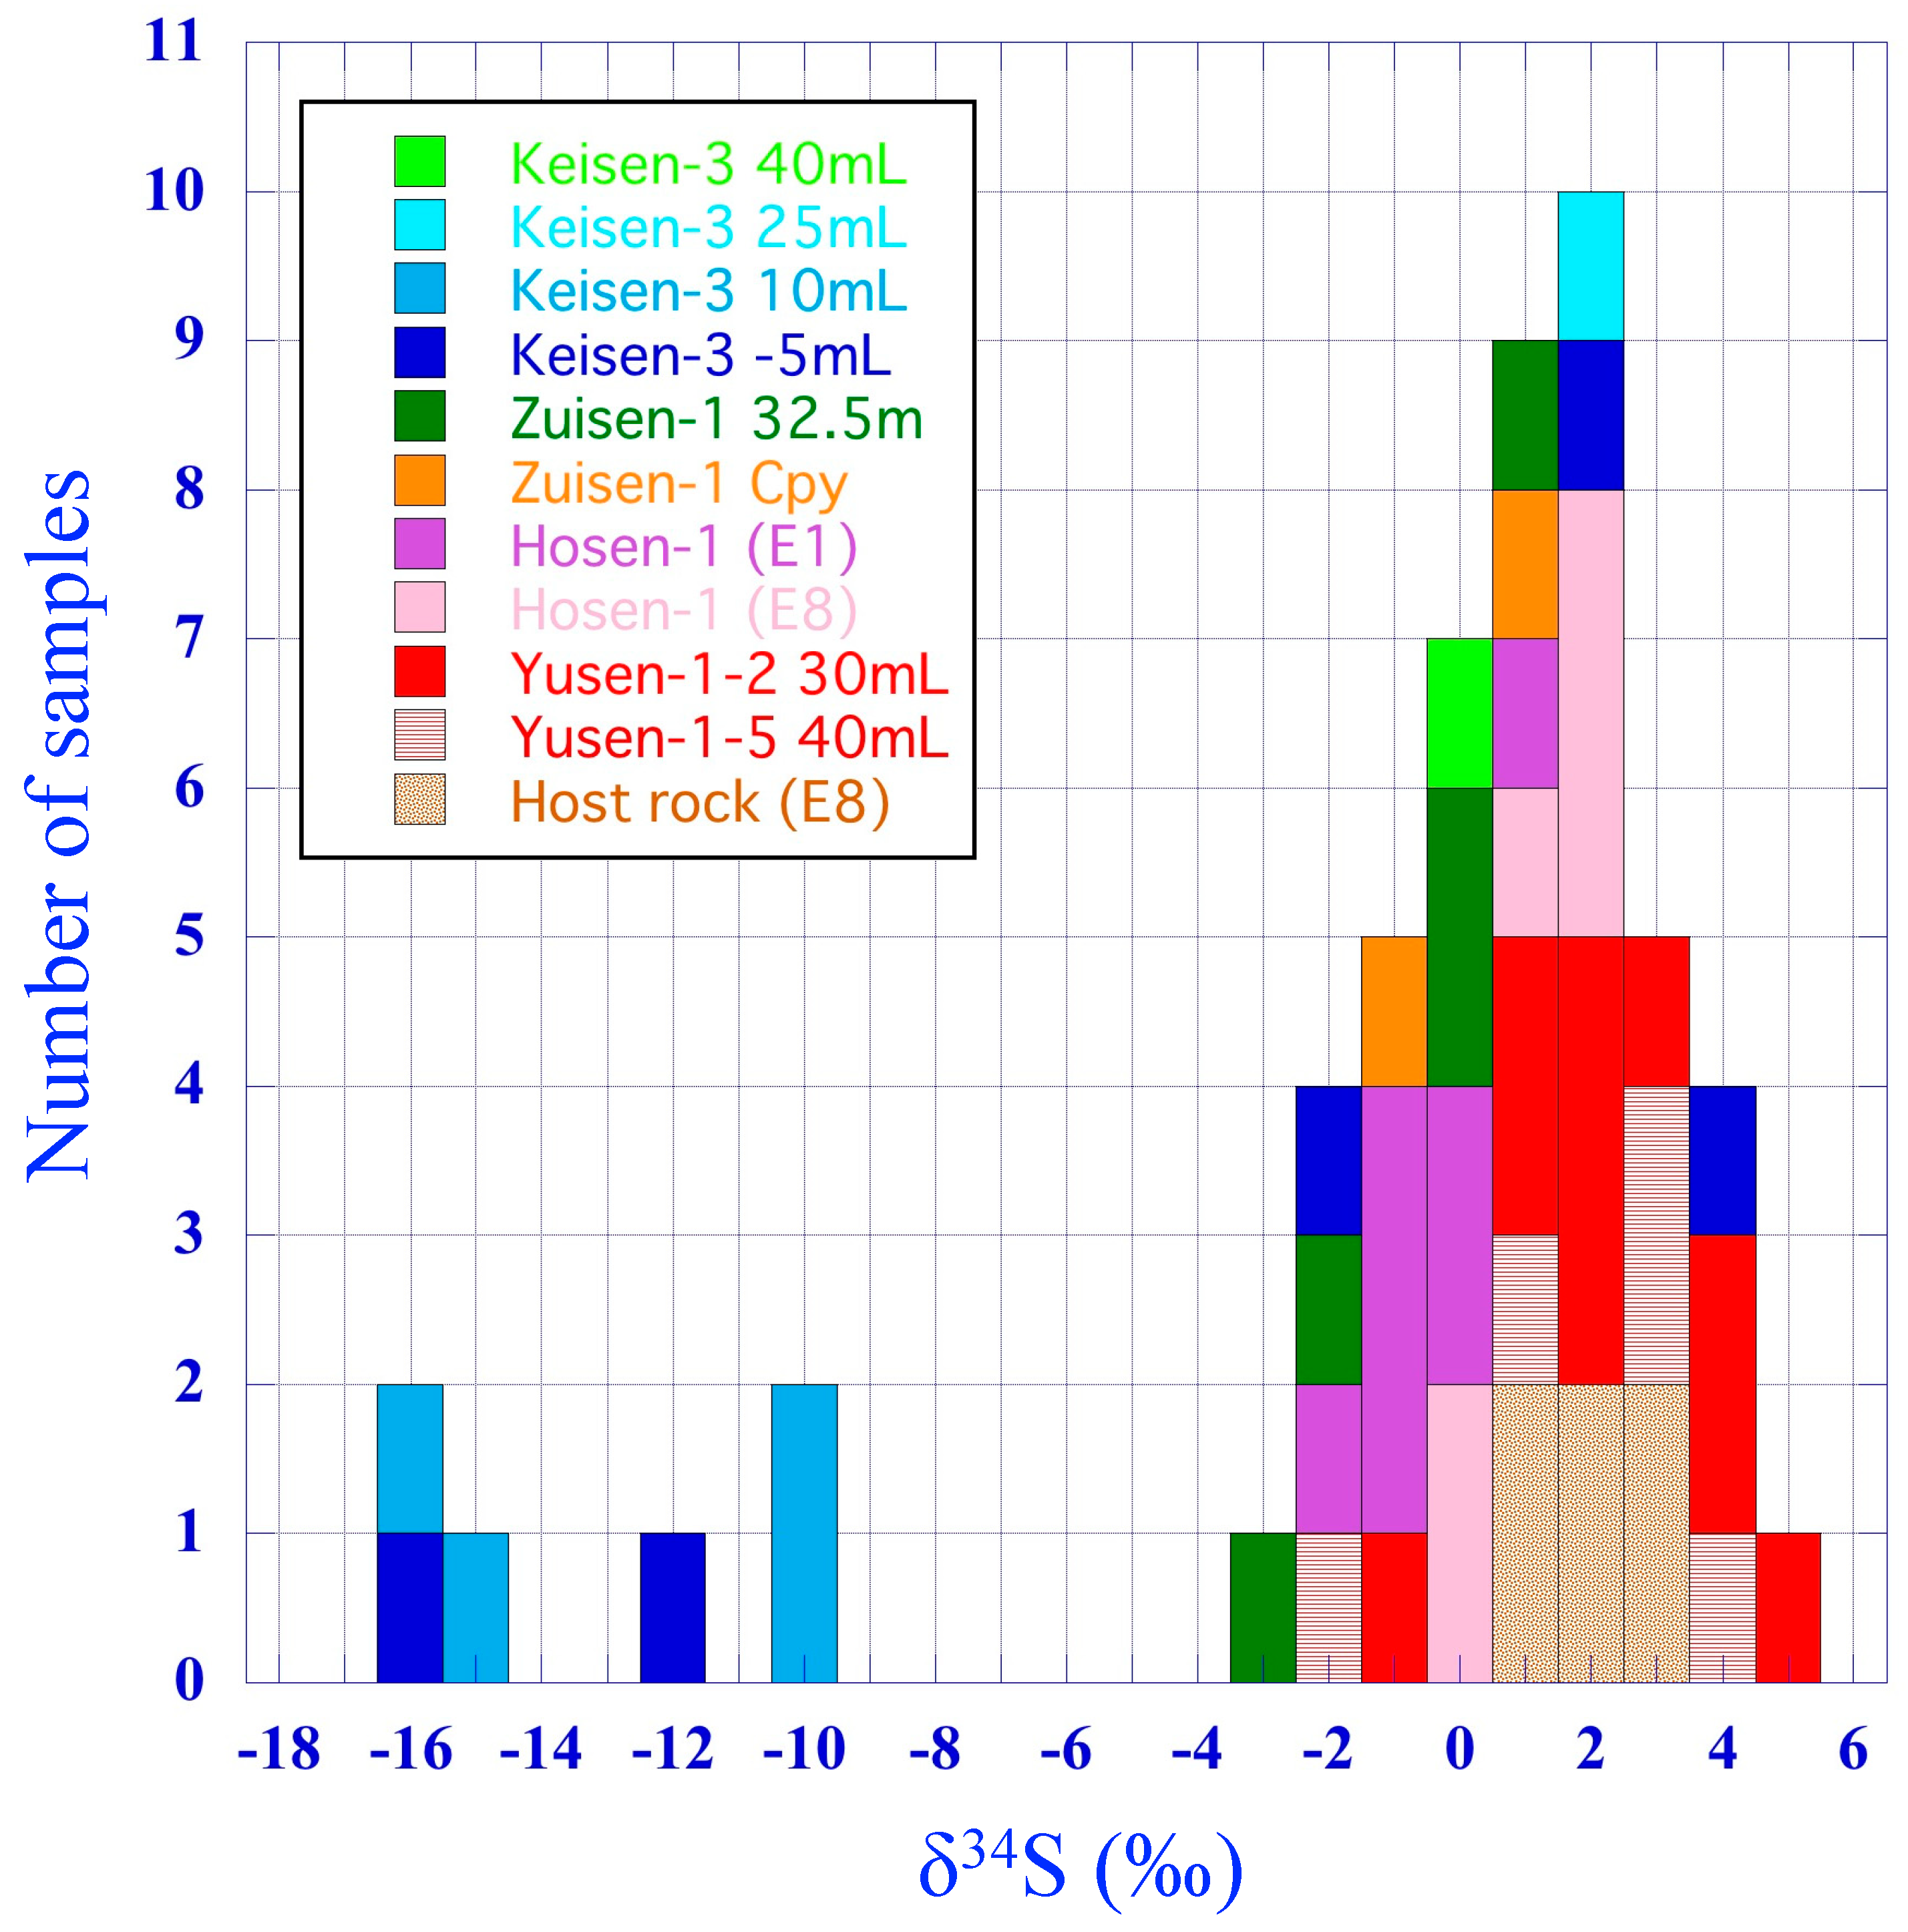
4.3. Sulfur Isotope Ratios of Pyrite
5. Discussion
5.1. Role of Basement in the Epithermal Au Deposits in Kyushu
5.2. Hydrothermal Fluids for the Hishikari Deposit
5.3. Sulfur Isotopes
5.4. Genesis and Evolution of Hydrothermal Fluids in the Formation of the Hishikari Deposit
6. Concluding Remarks
Author Contributions
Funding
Data Availability Statement
Acknowledgments
Conflicts of Interest
References
- Sumitomo Metal Mining Co., Ltd. Facts at a glance of the Hishikari Mine. 2022; Unpublished Company Brochure. 1p. (In Japanese) [Google Scholar]
- Matsuhisa, Y.; Aoki, M. Temperature and oxygen-isotope variations during formation of the Hishikari epithermal gold-silver veins, Southern Kyushu, Japan. Econ. Geol. 1994, 89, 1608–1613. [Google Scholar] [CrossRef]
- Shikazono, N.; Nagayama, T. Origin and depositional mechanism of the Hishikari gold-quartz-adularia mineralization. Resour. Geol. Sp. Issue 1993, 14, 47–56. [Google Scholar]
- Hayashi, K.; Maruyama, T.; Satoh, H. Submillimeter scale variation of oxygen isotope of vein quartz at the Hishikari deposit, Japan. Resour. Geol. 2000, 50, 141–150. [Google Scholar] [CrossRef]
- Hayashi, K.; Maruyama, T.; Satoh, H. Precipitation of gold in a low-sulfidation epithermal gold deposit: Insights from a submillimeter scale oxygen isotope analysis of vein quartz. Econ. Geol. 2001, 96, 211–216. [Google Scholar] [CrossRef]
- Faure, K.; Matsuhisa, Y.; Metsugi, H.; Miozota, C.; Hayashi, S. The Hishikari Au–Ag epithermal deposit, Japan: Oxygen and hydrogen isotopic evidence in determining the source of paleohydrothermal fluids. Econ. Geol. 2002, 97, 481–498. [Google Scholar] [CrossRef]
- Morishita, Y.; Shimada, N.; Shimada, K. Invisible gold and arsenic in pyrite from the high-grade Hishikari gold deposit, Japan. Appl. Surf. Sci. 2008, 255, 1451–1454. [Google Scholar] [CrossRef]
- Morishita, Y.; Shimada, N.; Shimada, K. Invisible gold in arsenian pyrite from the high-grade Hishikari gold deposit, Japan: Significance of variation and distribution of Au/As ratios in pyrite. Ore Geol. Rev. 2018, 95, 79–93. [Google Scholar] [CrossRef]
- Hosono, T.; Nakano, T.; Murakami, H. Sr-Nd-Pb isotopic compositions of volcanic rocks around the Hishikari gold deposit, southwest Japan: Implications for the contribution of a felsic lower crust. Chem. Geol. 2003, 201, 19–36. [Google Scholar] [CrossRef]
- Izawa, E.; Urashima, Y.; Ibaraki, K.; Suzuki, R.; Yokoyama, T.; Kawasaki, K.; Koga, A.; Taguchi, S. The Hishikari gold deposit—High-grade epithermal veins in Quaternary volcanics of Southern Kyushu, Japan. J. Geochem. Explor. 1990, 36, 1–56. [Google Scholar] [CrossRef]
- Izawa, E.; Etoh, J.; Honda, M.; Motomura, Y.; Sekine, R. Hishikari gold mineralization: A case study of the Hosen No. 1 vein hosted by basement Shimanto sedimentary rocks, southern Kyushu, Japan. SEG Guideb. Ser. (CD-ROM) 2001, 34, 21–30. [Google Scholar]
- Izawa, E.; Urashima, Y. Quaternary gold mineralization and its geologic environments in Kyushu, Japan. SEG Guideb. Ser. (CD-ROM) 2001, 34, 1–9. [Google Scholar]
- Ibaraki, K.; Suzuki, R. Gold-silver-quartz-adularia veins of the Main, Yamada and Sanjin deposits, Hishikari gold mine; A comparative study of their geology and ore deposits. Resour. Geol. Sp. Issue 1993, 14, 1–11. [Google Scholar]
- Nagayama, T. Precipitation sequence of veins at the Hishikari deposit, Kyushu, Japan. Resour. Geol. Sp. Issue 1993, 14, 13–27. [Google Scholar]
- Yamato, Y.; Ohno, M.; Ushirone, N. Exploration and development of the Yusen No.1 vein group based on the vein structure, Yamada deposit, Hishikari Mine. Shigen Chishitsu 2002, 52, 11–17, (In Japanese with English Abstract). [Google Scholar]
- Sekine, R.; Izawa, E.; Watanabe, K. Timing of fracture formation and duration of mineralization at the Hishikari deposit, southern Kyushu, Japan. Resour. Geol. 2002, 52, 395–404. [Google Scholar] [CrossRef]
- Geological Survey of Japan, AIST. Geological map of Japan 1:2,000,000. In 1:2,000,000 Map, Series No. 4; 5th ed.; Geological Survey of Japan: Tsukuba, Japan, 2002. [Google Scholar]
- Sanematsu, K.; Duncan, R.; Imai, A.; Watanabe, K. Geochronological constraints using 40Ar/39Ar dating on the mineralization of the Hishikari epithermal gold deposit, Japan. Resour. Geol. 2005, 55, 249–266. [Google Scholar] [CrossRef]
- Morishita, Y.; Nakano, T. Role of basement in epithermal deposits: The Kushikino and Hishikari gold deposits, southwestern Japan. Ore Geol. Rev. 2008, 34, 597–609. [Google Scholar] [CrossRef]
- Etoh, J.; Izawa, E.; Taguchi, S. A fluid inclusion study on columnar adularia from the Hishikari low-sulfidation epithermal gold deposit, Japan. Resour. Geol. 2002, 52, 73–78. [Google Scholar] [CrossRef]
- Imai, A.; Uto, T. Association of electrum and calcite and its significance to the genesis of the Hishikari gold deposits, southern Kyusyu, Japan. Resour. Geol. 2002, 52, 381–394. [Google Scholar] [CrossRef]
- Fournier, R.O. The behavior of silica in hydrothermal solution. Rev. Econ. Geol. 1985, 2, 45–61. [Google Scholar]
- Morishita, Y.; Hammond, N.Q.; Momii, K.; Konagaya, R.; Sano, Y.; Takahata, N.; Ueno, H. Invisible gold in pyrite from epithermal, banded-iron-formation-hosted, and sedimentary gold deposits: Evidence of hydrothermal influence. Minerals 2019, 9, 447. [Google Scholar] [CrossRef] [Green Version]
- Wada, H.; Niitsuma, N.; Saito, T. Carbon and oxygen isotopic measurements of ultra-small samples. Geosci. Rep. Shizuoka Univ. 1982, 7, 35–50, (In Japanese with English Abstract). [Google Scholar]
- Morishita, Y.; Matsuhisa, Y. Measurement of carbon and oxygen isotope ratios of carbonate reference samples. Bull. Geol. Surv. Jpn. 1984, 35, 69–79, (In Japanese with English Abstract). [Google Scholar]
- Morishita, Y.; Takeno, N. Nature of the ore-forming fluid at the Quaternary Noya gold deposit in Kyushu, Japan. Resour. Geol. 2010, 60, 359–376. [Google Scholar] [CrossRef]
- Matsuhisa, Y.; Morishita, Y.; Sato, T. Oxygen and carbon isotope variations in gold bearing hydrothermal veins in the Kushikino mining area, southern Kyushu, Japan. Econ. Geol. 1985, 80, 283–293. [Google Scholar] [CrossRef]
- Craig, H. The geochemistry of the stable carbon isotopes. Geochim. Cosmochim. Acta 1953, 3, 53–92. [Google Scholar] [CrossRef]
- Fuex, A.N.; Baker, D.R. Stable carbon isotopes in selected granitic, mafic, and ultramafic igneous rocks. Geochim. Cosmochim. Acta 1973, 37, 2509–2521. [Google Scholar] [CrossRef]
- Taylor, H.P., Jr.; Frechen, J.; Degens, E.T. Oxygen and carbon isotope studies of carbonatites from the Laacher See district, Sweden. Geochim. Cosmochim. Acta 1967, 31, 407–430. [Google Scholar] [CrossRef]
- Pineau, F.; Javoy, M.; Bottinga, Y. 13C/12C ratios of rocks and inclusions in popping rocks of the problem of isotopic composition of deep-seated carbon. Earth Planet. Sci. Lett. 1976, 29, 413–421. [Google Scholar] [CrossRef]
- Morishita, Y. Carbon and oxygen isotopic characteristics of epithermal veins in the Hokusatsu gold district, southern Kyushu, Japan. Resour. Geol. Sp. Issue 1993, 14, 103–114. [Google Scholar]
- Bottinga, Y. Calculation of fractionation factors for carbon and oxygen isotopic exchange in the system calcite–carbon dioxide–water. J. Phys. Chem. 1968, 72, 800–808. [Google Scholar] [CrossRef]
- Mook, W.G.; Bommerson, J.C.; Staverman, W.H. Carbon isotope fractionation between dissolved bicarbonate and gaseous carbon dioxide. Earth Planet. Sci. Lett. 1974, 22, 169–176. [Google Scholar] [CrossRef]
- O’Neil, J.R.; Clayton, R.N.; Mayeda, T.K. Oxygen isotope fractionation in divalent metal carbonates. J. Chem. Phys. 1969, 51, 5547–5558. [Google Scholar] [CrossRef]
- Kohn, M.J. Carbon isotope compositions of terrestrial C3 plants as indicators of (paleo)ecology and (paleo)climate. Proc. Natl. Acad. Sci. USA 2010, 107, 19691–19695. [Google Scholar] [CrossRef] [PubMed] [Green Version]
- Matsubaya, O.; Ueda, A.; Kusakabe, M.; Matsuhisa, Y.; Sakai, H.; Sasaki, A. An isotopic study of the volcanoes and the hot springs in Satsuma Iwo-jima and some areas in Kyushu. Bull. Geol. Surv. Jpn. 1975, 26, 375–392. [Google Scholar]
- Chappell, B.W.; White, A.J.R. Two contrasting granite types. Pacific Geol. 1974, 8, 173–174. [Google Scholar]
- Ishihara, S. The magnetite-series and ilmenite-series granitic rocks. Mining Geol. 1977, 27, 293–305. [Google Scholar]
- Ishihara, S.; Sakamaki, Y.; Sasaki, A.; Teraoka, Y.; Terashima, S. Role of the basement in the genesis of the Hishikari gold-quartz vein deposit, southern Kyushu, Japan. Mining Geol. 1986, 36, 495–509. [Google Scholar]
- Imai, A.; Shikazono, N.; Shimizu, M.; Shimazaki, H. Sulfur isotope study on Hg and Sb deposits in Japan. Resour. Geol. 2006, 56, 37–48. [Google Scholar] [CrossRef]
- Shimizu, T. Sulfur isotopic ratios and mode of occurrence of stibnite at the Hishikari epithermal Au-Ah deposit, Japan. Bull. Geol. Surv. Japan 2017, 68, 111–117. [Google Scholar] [CrossRef] [Green Version]
- Sasaki, A.; Ishihara, S. Sulfur isotopic composition of the magnetite-series and ilmenite-series granitoids in Japan. Contrib. Mineral. Petrol. 1979, 68, 107–115. [Google Scholar] [CrossRef]
- Takahashi, R.; Tagiri, R.; Blamey, N.J.F.; Imai, A.; Watanabe, Y.; Takeuchi, A. Characteristics and behavior of hydrothermal fluids for gold mineralization at the Hishikari deposits, Kyushu, Japan. Resour. Geol. 2017, 67, 279–299. [Google Scholar] [CrossRef] [Green Version]
- Sanematsu, K.; Watanabe, K.; Duncan, R.A.; Izawa, E. The history of vein formation determined by 40Ar/39Ar dating of adularia in the Hosen-1 vein at the Hishikari epithermal gold deposit, Japan. Econ. Geol. 2006, 101, 685–698. [Google Scholar] [CrossRef]
- Seward, T.M. Thio complexes of gold and the transport of gold in hydrothermal ore solutions. Geochim. Cosmochim. Acta 1973, 37, 379–399. [Google Scholar] [CrossRef]
- Drummond, S.E.; Ohmoto, H. Chemical evolution and mineral deposition in boiling hydrothermal systems. Econ. Geol. 1985, 80, 126–147. [Google Scholar] [CrossRef]


| Sample No. | Locality *1 | Vein | Level *2 | Mineral Composition (%) *3 | δ13C | δ18O |
|---|---|---|---|---|---|---|
| (‰) | (‰) | |||||
| 31001a | 70W111SE-6E | Seisen-6 | 70 mL | Calcite (100) | −10.3 | 6.1 |
| 31001b | 70W111SE-6E | Seisen-6 | 70 mL | Quartz (62), Adularia (12), Calcite (26) | −4.3 | 10.6 |
| 31001c | 70W111SE-6E | Seisen-6 | 70 mL | Quartz (59), Adularia (6), Calcite (35) | −7.9 | 8.1 |
| 31002c | 25E57S42HW | Shosen S42 | 25 mL | Quartz (5), Calcite (95) | −9.2 | 3.8 |
| 31002d | 25E57S42HW | Shosen S42 | 25 mL | Quartz (32), Calcite (68) | −8.6 | 5.2 |
| 31003-1e | 20W112SE-2W | Seisen-6 | 20 mL | Quartz (93), Calcite (7) | −3.6 | 12.4 |
| 31003-2a | 20W112SE-2W | Seisen-6 | 20 mL | Quartz (90), Calcite (10) | −4.7 | 10.5 |
| 31003-2b | 20W112SE-2W | Seisen-6 | 20 mL | Quartz (6), Calcite (94) | −2.6 | 11.8 |
| 31003-2c | 20W112 SE-2W | Seisen-6 | 20 mL | Quartz (45), Adularia (21), Calcite (34) | −3.3 | 11.8 |
| 31506b | 20W112SE-2W | Seisen-6 | 20 mL | Quartz (66), Calcite (34) | −6.5 | 11.1 |
| 31506c | 20W112SE-2W | Seisen-6 | 20 mL | Quartz (57), Calcite (43) | −23.4 | 17.9 |
| 31004a | 40 No.2 Vent | 40 mL | Quartz (75), Calcite (25) | −4.8 | 7.9 | |
| 31004b | 40 No.2 Vent | 40 mL | Quartz (71), Calcite (29) | −5.5 | 9.8 | |
| 31004c | 40 No.2 Vent | 40 mL | Quartz (35), Calcite (65) | −5.6 | 8.2 | |
| 31005c | 70E53 cross cut | Kinsen-1-1 | 70 mL | Quartz (36), Calcite (64) | −4.5 | 10.6 |
| 31615c | 70E53 cross cut | Kinsen-1-1 | 70 mL | Quartz (69), Calcite (31) | −25.1 | 17.1 |
| 31610b | 100E28RY-6E | Ryosen-6 | 100 mL | Calcite (100) | −6.2 | 5.7 |
| 31611b | 100E28RY-6E | Ryosen-6 | 100 mL | Quartz (70), Adularia (13), Calcite (17) | −5.2 | 14.6 |
| 20100317 | 25E60KE-3-1E | Keisen-3-1 | 25 mL | Quartz, Calcite: See Table 2 | See Table 2, Table 3 and Table 4. | |
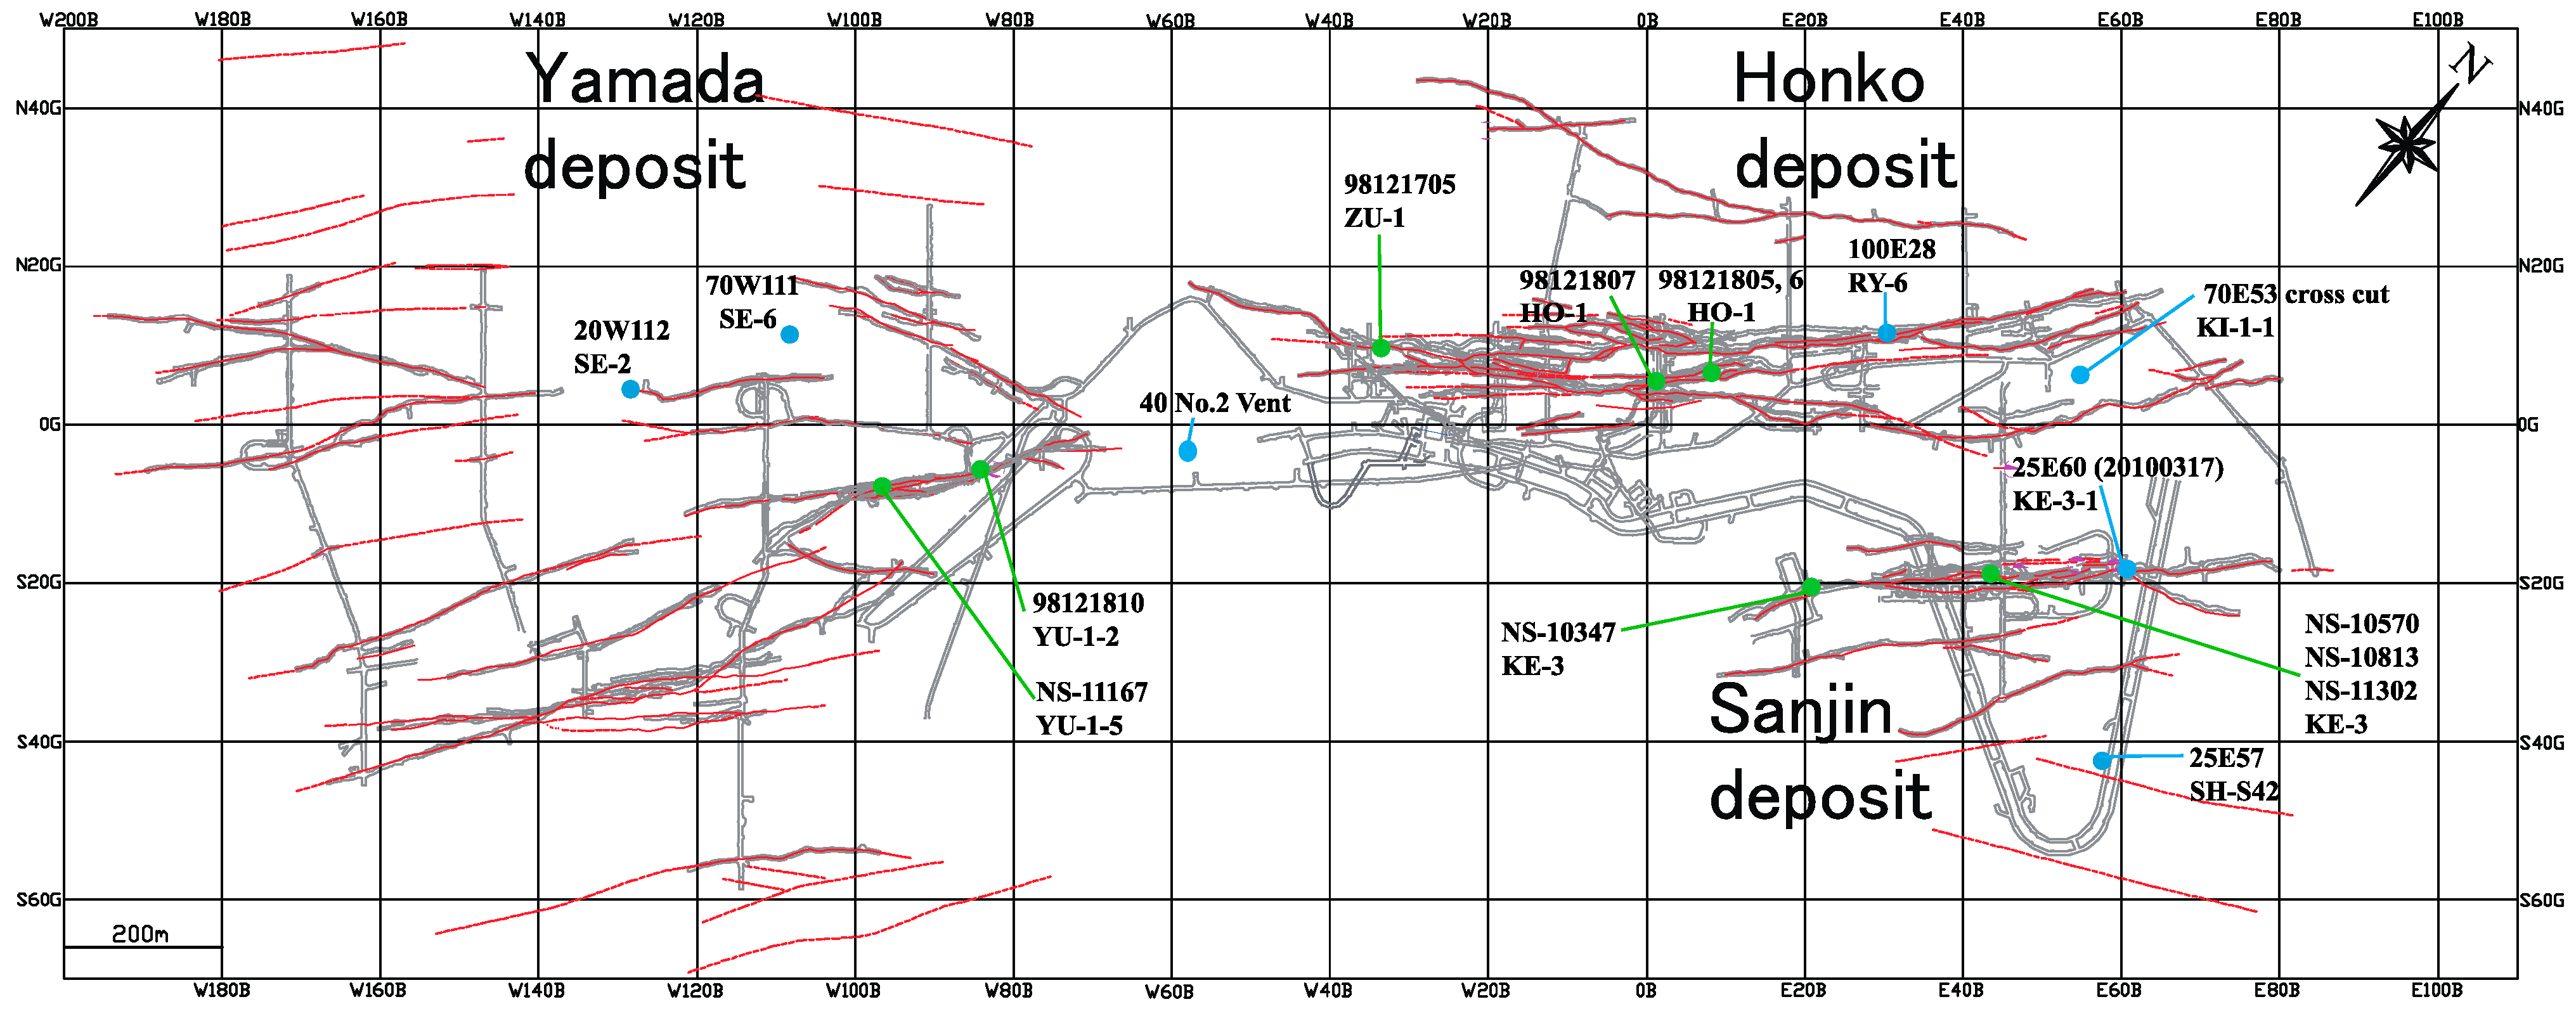
| Ore Zone | Sample Name | Vein *1 | Level *2 | Sample Locality | Host Rock | Analysis Spot | Analysis No. | δ34S (‰) |
|---|---|---|---|---|---|---|---|---|
| Sanjin | NS-10347 | Keisen No.3 | 40 mL | E21 | andesite | 13-52 | SMB3*76.ais | −0.4 |
| Sanjin | NS-10570 | Keisen No.3 | 25 mL | E45 | shale | 6-26 | SMB3*73.ais | 2.1 |
| Sanjin | NS-10813 | Keisen No.3 | 10 mL | E45 | shale | 1-2 | SMB3*69.ais | −10.2 |
| 1-3 | SMB3*70.ais | −15.1 | ||||||
| 1-1 | SMB3*71.ais | −16.4 | ||||||
| 2-5 | SMB3*72.ais | −10.1 | ||||||
| Sanjin | NS-11302 | Keisen No.3 | −5 mL | E45 | shale | 1-1 | SMB2*47.ais | −2.1 |
| 2-1 | SMB2*48.ais | −16.5 | ||||||
| 2-2 | SMB2*49.ais | −12.1 | ||||||
| 3-1 | SMB2*50.ais | 1.7 | ||||||
| 4-1 | SMB2*51.ais | 3.5 | ||||||
| Honko | 98121705 | Zuisen No.1 | 25 mL + 2sl *3 | W33 | andesite | 1-18 *4 | SMB3*80.ais | −1.4 |
| 1-1 | SMB3*81.ais | 0.5 | ||||||
| 2-4 | SMB3*82.ais | −3.4 | ||||||
| 2-6 | SMB3*83.ais | 0.2 | ||||||
| 2-19 *4 | SMB3*84.ais | 1.0 | ||||||
| 4-13 | SMB3*86.ais | −0.4 | ||||||
| 4-15 | SMB3*87.ais | −2.0 | ||||||
| Honko | 98121807 | Hosen No.1 | 55 mL + 2sl | W1 | shale | 1-1 | SMB1*30.ais | 0.4 |
| (E1) *5 | 1-2 | SMB1*31.ais | 0.1 | |||||
| 1-3 | SMB1*32.ais | −1.4 | ||||||
| 2-2 | SMB1*33.ais | −1.6 | ||||||
| 2-3 | SMB1*34.ais | 0.6 | ||||||
| 2-4 | SMB1*35.ais | −0.7 | ||||||
| 2-5 | SMB1*36.ais | −1.2 | ||||||
| Honko | 98121806 | Hosen No.1 | 55 mL + 2sl | W1 | shale | 1-1 | SMB3*92.ais | 0.3 |
| (E8) *5 | 1-2 | SMB3*93.ais | 0.6 | |||||
| 1-4 | SMB3*94.ais | −0.1 | ||||||
| 1-6 | SMB3*95.ais | 1.9 | ||||||
| 1-9 | SMB3*96.ais | 1.5 | ||||||
| 1-10 | SMB3*97.ais | 2.1 | ||||||
| Honko | 98121805 | Shale | 55 mL + 2sl | W1 | 3-2 | SMB1*21.ais | 3.2 | |
| Host rock for the Hosen No.1 vein | (E8) *5 | 3-3 | SMB1*22.ais | 2.2 | ||||
| 3-5 | SMB1*23.ais | 2.7 | ||||||
| 1-1 | SMB1*24.ais | 2.0 | ||||||
| 4-1 | SMB1*25.ais | 0.7 | ||||||
| 5-1 | SMB1*26.ais | 1.3 | ||||||
| Yamada | 98121810 | Yusen No.1-2 | 30 mL | W85 | andesite | 2-23 | SMB3*101.ais | 1.2 |
| 2-22 | SMB3*102.ais | 0.7 | ||||||
| 2-18 | SMB3*103.ais | 2.3 | ||||||
| 2-17 | SMB3*104.ais | 1.7 | ||||||
| 2-13 | SMB3*105.ais | −1.0 | ||||||
| 3-30 | SMB3*106.ais | 4.5 | ||||||
| 3-36 | SMB3*107.ais | 3.1 | ||||||
| 3-41 | SMB3*108.ais | 4.3 | ||||||
| 3-47 | SMB3*109.ais | 1.5 | ||||||
| 3-48 | SMB3*110.ais | 4.4 | ||||||
| Yamada | NS-11167 | Yusen No.1-5 | 40 mL | W95 | andesite | 2-1 | SMB2*58.ais | 4.0 |
| 2-2 | SMB2*59.ais | 2.9 | ||||||
| 2-3 | SMB2*60.ais | 3.4 | ||||||
| 6-2 | SMB2*64.ais | 0.8 | ||||||
| 7-1 | SMB2*65.ais | −2.0 | ||||||
Publisher’s Note: MDPI stays neutral with regard to jurisdictional claims in published maps and institutional affiliations. |
© 2022 by the authors. Licensee MDPI, Basel, Switzerland. This article is an open access article distributed under the terms and conditions of the Creative Commons Attribution (CC BY) license (https://creativecommons.org/licenses/by/4.0/).
Share and Cite
Morishita, Y.; Yabe, Y. Genesis and Evolution of Hydrothermal Fluids in the Formation of the High-Grade Hishikari Gold Deposit: Carbon, Oxygen, and Sulfur Isotopic Evidence. Minerals 2022, 12, 1595. https://doi.org/10.3390/min12121595
Morishita Y, Yabe Y. Genesis and Evolution of Hydrothermal Fluids in the Formation of the High-Grade Hishikari Gold Deposit: Carbon, Oxygen, and Sulfur Isotopic Evidence. Minerals. 2022; 12(12):1595. https://doi.org/10.3390/min12121595
Chicago/Turabian StyleMorishita, Yuichi, and Yoriko Yabe. 2022. "Genesis and Evolution of Hydrothermal Fluids in the Formation of the High-Grade Hishikari Gold Deposit: Carbon, Oxygen, and Sulfur Isotopic Evidence" Minerals 12, no. 12: 1595. https://doi.org/10.3390/min12121595
APA StyleMorishita, Y., & Yabe, Y. (2022). Genesis and Evolution of Hydrothermal Fluids in the Formation of the High-Grade Hishikari Gold Deposit: Carbon, Oxygen, and Sulfur Isotopic Evidence. Minerals, 12(12), 1595. https://doi.org/10.3390/min12121595