Article

Instability Mechanism and Control Method of Surrounding Rock of Water-Rich Roadway Roof

Key Laboratory of Deep Coal Resource Mining, Ministry of Education, China University of Mining and Technology, Xuzhou 221116, China
*
Author to whom correspondence should be addressed.
Minerals 2022, 12(12), 1587; https://doi.org/10.3390/min12121587
Submission received: 4 November 2022 / Revised: 22 November 2022 / Accepted: 6 December 2022 / Published: 10 December 2022
(This article belongs to the Special Issue Green Mining of Coal Mine in China)

Abstract

:
Surrounding rock properties and occurrence stability of a coal seam roof are prerequisites for ensuring the safe and efficient operation of mines. In this study, the mechanisms and control of weakened water-rich roadway roof slabs were investigated regarding the engineering background of water-rich roadway roof slab destabilization in a coal mine in the western Qingyang mining area. The spatial and temporal evolution law of rock deformation and damage of such roadways during excavation were determined through field measurements. First, we tested the strength of the roof slab surrounding rock in water-rich roadways with different water contents and concluded that the primary and excavation-disturbing fissures of the coal-sedimentary rock body are the external conditions for the occurrence of water–rock interaction in water-rich coal seam roadways. Moreover, the rock mechanical damage phenomenon exhibited by clay minerals in contact with water is the key factor leading to the destabilization of the water-rich roof slab’s surrounding rock. Second, a technical approach for controlling the stability of the surrounding rock by adjusting the form of the roadway section and optimizing the support parameters was proposed, and the distribution law of the surrounding rock stress field and displacement field of each section was revealed via numerical calculation. It is considered that adjustment of the stress and displacement control of the surrounding rock of the roadway is more favorable for the straight wall circular arch section. Based on the results of the sensitive orthogonal numerical simulation test, the technical parameters and scheme of the roadway support optimization were proposed. Finally, the research results were applied in the field, and the deformations of the top and bottom slab and the two ribs of the roadway after optimizing the section and support parameters were calculated as 61% and 34% lower, respectively, than those before optimization, indicating that the proposed approach can effectively control the deformation of the water-rich roadway’s surrounding rock and achieve more economic and effective stability control of this type of roadway. The research results provide new ideas and methods for controlling the surrounding rock of water-rich soft rock roadways in the western mining areas of China, which has broad application value and prospects.

1. Introduction

The water–rock response mechanism of coal mines is an important research topic in the field of coal mining [1]. Water-rich roadways generally refer to a type of roadway that contains water in the surrounding rock, and instability of the surrounding rock is easily caused under the action of mine water. Such roadways are mostly distributed in Jurassic coal seams in western China mining areas, and their roofs mainly constitute soft and water-bearing rock layers. Among them, weak rock layers are generally coal-measure sedimentary rock layers with an argillization tendency and exhibit engineering characteristics such as nonlinear large deformation and significant rheology after encountering water [2,3]. From a microscopic point of view, changes in the external environment caused by the roadway during excavation and mining alter the migration state of the hydraulic field of the surrounding rock, resulting in complex physical, chemical, and mechanical effects which in turn change the microstructure and mechanical properties of the rock [4]. Hence, engineering accidents are likely to occur, and it is extremely difficult to maintain the surrounding rock stability of water-rich roadways, which is the primary scientific problem to be solved urgently in such mines.
In order to solve the above problems, related scholars have carried out a series of research and industrial tests on the water–rock interaction mechanism and stability control technology for water-rich coal measures roadways surrounding rock and achieved a series of useful results. Generally, a rock sample that has been immersed in water for a longer period of time possesses a higher water content, and consequently, its mechanical parameters—such as uniaxial compressive strength, elastic modulus, and tensile strength—decrease more significantly compared to that of a sample that has not been immersed in water [5,6,7]. Water intrusion into coal and rock increases the pore water pressure, reduces the effective stress, weakens the elastic energy storage and release ability, and alters the stress state and microstructure of coal and rock [8,9]. Chen et al. [10] found that the water–rock interaction was complicated by increasing the discreteness of the rock surface height and the enhanced deviation and roughness of the reference surface. Laska-Ripour et al. [11] studied the rock strength damage law by changing the water content of test blocks and concluded that the uniaxial compressive strength of mud shale decreases negatively exponentially with the increase of water content. Daraei et al. [12,13] looked into the role of moisture content on the critical and breaking strains of rocks by uniaxial compression tests, and the rocks used in the tests included eight types of sandstone, conglomerate, mudstone, limestone, siltstone, schist, sillimanite, and amphibolite, and they found that the critical strain increased after most of the rocks reached saturation, and as the moisture content increased, the maximum value of rock-breaking strain became 2.14 times the critical strain. Deng et al. [14,15,16] studied the damage caused by the interaction between water and sandstone under dry and wet cycles and proposed the strength weakening law of sandstone and its constitutive equation, which provided a theoretical basis for realistic engineering problems. Li et al. [17] established the creep constitutive model of coal–rock combination considering the influence of moisture content based on the Burgers creep model. According to the experimental results of triaxial creep of rock, the relationship between the moisture content and the parameter of the Burgers creep model was derived, and the correctness of the constitutive model in this study was verified. Under the same stress state, with the increased of moisture content, the strain rate of the coal–rock combination exhibited a nonlinear rapid increase in the constant velocity creep stage The limit creep deformation, the instantaneous elastic deformation increased, and the viscosity coefficient significantly decreased. Dong et al. [18] studied the moisture content variation of tuff in water absorption tests, and the mechanical and failure characteristics of tuff under different moisture contents were studied through uniaxial compression tests with a Micro-II acoustic emission (AE) control acquisition system. The results showed that the moisture content of tuff increases rapidly at the initial stage of water absorption tests and stabilizes after 180 h of immersion. According to the results of uniaxial compression tests, both uniaxial compressive strength and elasticity modulus decreased with the increase in moisture content. The AE parameters analyses showed that when the moisture content increased, the accumulated AE counts and energy gradually decreased, and the “quiet period” at the initial stage of uniaxial compression tests lasted longer. At present, the maintenance of water-rich coal measures roadways often adopts a combination of control techniques, and many scholars have conducted considerable amounts of field research. Xu et al. [2] studied the deformation law of muddied soft rock roadway under the action of water and proposed the dynamic process control technology of muddied soft rock roadway. Li et al. [19,20] revealed the destabilization mechanism of weakly bonded roof and proposed the long anchor cable and short anchor cable roof control techniques. Zhang et al. [21,22] studied the destabilization and collapse of the roadway due to weakly interbedded rock masses and revealed the mechanism of roof destabilization under the influence of dynamic pressure via roof muddification and weakly interbedded layers. Tang et al. [23] simulated the floor heave processes of a swelling rock tunnel under high humidity through simulation with RFPA. González-Nicieza et al. [24] investigated the influence of the depth and cross section of the tunnel on the radial displacement via the convergence–confinement method.
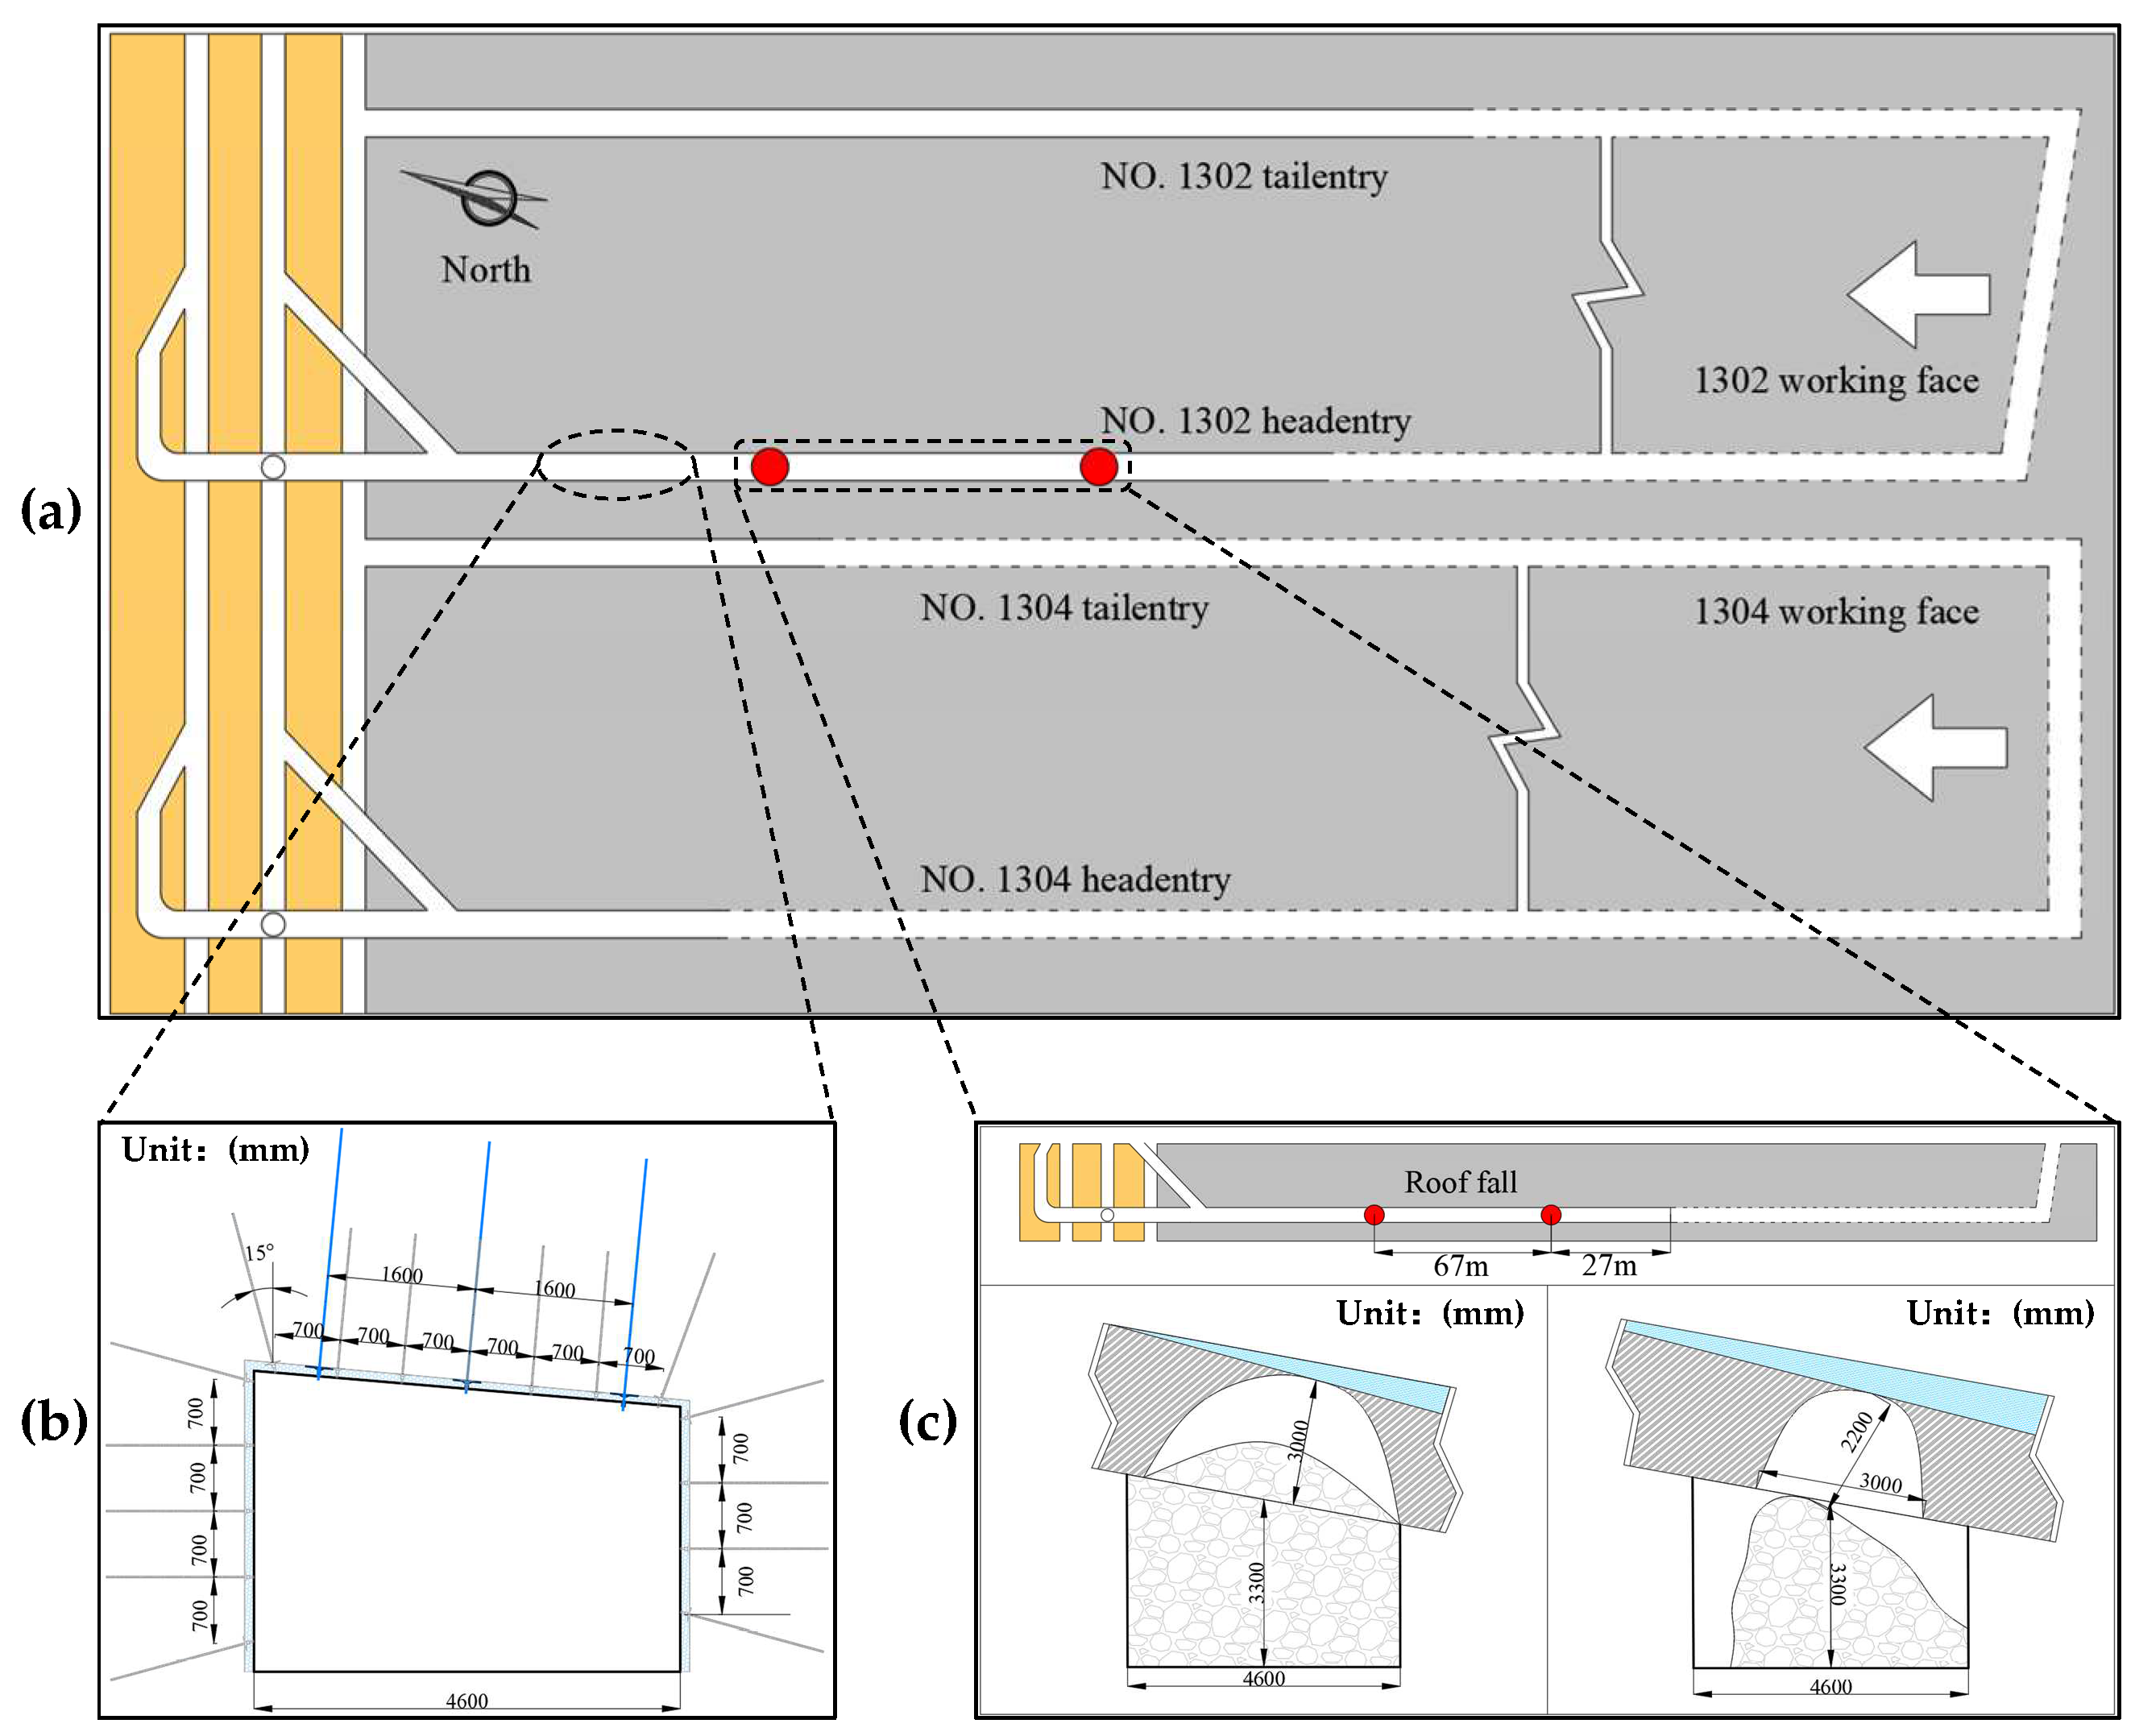
Considering the engineering background of a water-rich roadway in a coal mine in the Qingyang mining area in western China, this study proposed a scheme for controlling the stability of the surrounding rock of the roof of the water-rich roadway by systematically investigating the mechanical property damage law and strength-weakening mechanism of the roof under water–rock interaction. Accordingly, the developed scheme was applied in a coal mine. Through field measurements, the space–time evolution characteristics of the deformation and failure of the surrounding rock of the water-rich roadway were determined. The research results can provide reference for controlling the surrounding rock of the mine and even the same type of roadway and thus have practical significance.

2. Engineering Background

The main mining area of a mine in Qingyang City is coal seam #3, which is a soft rock coal seam of the Middle Jurassic Yan’an Group, with a simple coal seam structure, average coal thickness of 3.1 m, and average burial depth of 409.50 m. As shown in Figure 1a, the mining area in the south wing of the mine is divided into 1302 and 1304 integrated mechanized coal mining workings—in which the 1302 transport road is a water-rich roadway—dug along the top plate of coal seam #3, with a design length of 1725 m and net width of 4600 mm. The roadway support is an “anchor network cable”, and the roadway section is obliquely rectangular in shape, as depicted in Figure 1b; the top plate comprises muddy sandstone and siltstone, and the siltstone is a water-bearing layer, as shown in Figure 2. When the excavated working face advanced to 250 m, roofing accidents occurred at 27 and 67 m of the lagging working face successively, and the interval between the two accidents did not exceed 15 h. In addition, the scope of roofing was not less than 3 m (length) × 3 m (width) × 2.2 m (height), as shown in Figure 1c. The accidents prove that the traditional support design concept and control measures fail to effectively explain and guide the common problems in controlling the stability of the rock surrounding the roof slab in the water-rich roadway of the mine. Thus, the mining succession and safe recovery of this workface and the neighboring workfaces were threatened.

3. Weakening Mechanism of Strength of Rock Surrounding Water-Rich Roadway Top Slab

3.1. Specimen Preparation

The rock sample used for the test was taken from the muddy sandstone at the roof of the 1302 haul road in the mine. It was sealed by wrapping with cling film to prevent the specimen from weathering. According to the “Regulation for testing the physical and mechanical properties of rock” (DZ/T 0276.18-2015 [25]), the rock was processed into standard rectangular rock samples of dimensions 50 mm × 50 mm × 100 mm; the adjacent faces of the rock samples were perpendicular to each other, as required, with a maximum deviation of not more than 0.25°; the non-parallelism between the opposite faces was less than 0.1 mm. In total, 24 rectangular rock samples were processed. The finished samples were dried and weighed, and the drying temperature and time were set to 105 °C and 24 h, respectively, as shown in Figure 3. To reduce the influence of sample dispersion on the test pattern, the wave velocity was measured using an acoustic wave detector (RSM-SY6, SINOROCK, Wuhan, China), and individuals with large deviations in sound velocity after drying were excluded.

3.2. Test Equipment and Scheme

The test was divided into four groups—dry group, intermediate water content group 1, intermediate water content group 2, and saturated group—with 5 specimens in each group and 20 rock samples in total. The specific water content of the two intermediate groups was determined according to the water absorption curves of the rock samples.
First, the dry rock samples were immersed in water using nondestructive water immersion experimental equipment (Figure 3c, ANDWID) until the samples were completely saturated. In the presoaking period, the rock sample was weighed every 0.5 h, and after the water absorption slowed, it was weighed every 1 h until the mass of the rock sample no longer increased. The saturated water content of the rock sample obtained was 2.1%. The relationship between the water content of the rock sample and the soaking time is presented in Figure 3e.
The formula for calculating the water content of rock samples is given by
w t = m t m 0 m 0 × 100 %
where wt is the water content of the rock sample (%), m0 is the mass of the dry rock sample (g), and mt is the mass of the submerged rock sample (g).
By fitting the curves, it was found that the water content increased negatively and exponentially with soaking time. The growth rate of the water content of rock samples decreased gradually with increasing soaking time. When the soaking time was less than 48 h, the water content of the rock samples increased almost linearly with the soaking time. After 48 h of soaking, the growth rate of the water content of rock samples began to decrease, and it almost stabilized after 220 h. Thus, the trend of water content with water immersion time can be divided into three stages: (I) rapid growth stage of water content (0–48 h): in this stage, water molecules enter the rock interior of dried specimens through micropores on the specimen surfaces, and the water content of the rock samples increases from 0 to 1.7%; (II) slow growth stage of water content (48–220 h): in this stage, the water content slowly increases from 1.7% to 2.05%, the water molecules gradually diffuse to the interior of the rock, close to the saturation water content; (III) stabilization of water content (>220 h): in this stage, the water content (2.10%) of the rock sample remained almost constant for 130 h (220–350 h)—at this point, it is considered that the rock sample has reached saturation.
To study the strength damage characteristics and acoustic emission (AE) characteristics of muddy sandstone with different water contents, representative water contents of rock samples were selected, and the water contents required for this test were determined to be 0 (dry), 0.7%, 1.4%, and 2.1% (saturated) with reference to the typical water contents of each stage in the literature [26,27].
An MTS electrohydraulic servo universal testing machine (Figure 4a, C64.106, MTS Industrial Systems (China) Co., Ltd, Shanghai, China) was used for the uniaxial compression test of the prepared water content rock samples. To reduce the size effect [28], a loading rate of 0.10 mm/min was selected for loading, and the rock samples were loaded until they were destroyed at to obtain the σ-ε curves of the rock samples with different water contents. In the process of conducting uniaxial compression tests, AE data were collected in real time using a PCI-2 AE system (PCI-2, Physical Acoustic Corporation, Mercer County, NJ, USA), in which six NANA-30 AE probes with operating frequencies of 125–750 kHz were arranged on the surface of each specimen; the orientation of the probe arrangement is depicted in Figure 4c. Small pieces of muddy sandstone cores were selected and ground into powder for X-ray diffraction (XRD) experiments (D8 ADVANCE, Bruker, Germany) to obtain the mineral composition of the rock samples.

3.3. Test Results and Analysis

3.3.1. XRD Test Results

Two sets of muddy sandstone samples were prepared for XRD analysis, and the corresponding results were compared and examined to obtain more representative test results. The XRD patterns of the muddy sandstone are displayed in Figure 5, and the percentages of each component are listed in Table 1 and Table 2.
The test results show that the contents of each component of the muddy sandstone include quartz, clay minerals, orthoclase, sodium feldspar, and rhodochrosite in descending order: quartz and clay minerals account for more than 81%, clay minerals account for 31.6%, and kaolinite and muscovite account for 96% of the clay minerals. Quartz and orthoclase in the top slab muddy sandstone component constitute the rock skeleton, and the cement consists of clay minerals and rhodochrosite. The percentage of clay minerals in the cement was more than 96%; therefore, the cementation type of the rock was judged to be mud cementation.

3.3.2. Strength Damage Characteristics of Muddy Sandstone with Varying Water Content

Figure 6a presents the σε curves of typical specimens in each test group, indicating the general characteristics of the four stages of change. The compressive density phase becomes slower and longer with the increase in water content. The elastic phase is longer before the peak of dry rock samples and those with water contents of 0.7%. No obvious plastic yield phase is observed. The elastic phase becomes shorter with the increase in water content of rock samples, the shear slip section near the peak stress is prolonged, and the curve after the peak decreases linearly. The curves for the rock samples with water contents of 1.4% and the saturated rock samples are stepped downward after the peak. As the water content increased, the rock samples softened, dissolution holes and internal damage increased, and plasticity was enhanced. It can be observed that the roof plate deforms more under water-rich environmental conditions, that the bearing capacity is weakened, and that it is difficult to control the rock surrounding the roadway.
Table 3 details the effective peak stresses of the three rock samples in each group. With an increase in water content, the peak stress of rock samples gradually decreases, and the strength damage of water-saturated rock samples is more than 80% compared to dry rock samples.
The relationship between the peak stress and water content is presented in Figure 6b; with the increase in water content, the peak stress of the rock sample decreases exponentially, and the fitting relationship is given by
y = 100 e x 1.43 3.93 ;   R 2 = 0.982
where y is the peak stress (MPa), x is the moisture content (%), and R2 is the fitted correlation coefficient.
The modulus of elasticity results for the three rock samples are provided in Table 4; the water content is negatively correlated with the modulus of elasticity, and the average modulus of elasticity decreases from 7.34 to 2.69 GPa with the increase in water content, which is 63%. Figure 7 displays the fitted relationship between the rock elastic modulus and water content, which approximately conforms to the primary linear function relationship. The fitted relationship is expressed as
y = 2257.58 x + 7258.79 ; R 2 = 0.949
where y is the modulus of elasticity (Mpa), x is the moisture content (%), and R2 is the correlation coefficient of the fitting function.

3.3.3. Acoustic Emission Characteristics of Muddy Sandstone with Varying Water Content

The uniaxial compression process of rock samples can be divided into the fracture compression, elastic stage, fracture stable development, fracture unstable development, and post-peak destabilization stages, where the AE generated when damage or defects are enlarged inside the rock samples has certain regularity, and each stage is divided based on the magnitude and frequency of AE counts. The relationship between σ and ε, the AE counts of typical rock samples in each group and the division of each stage are shown in Figure 8.
The AE counts of the saturated rock samples decreased significantly compared to those of the dry rock samples. The OA section is the fracture compression stage (I), in which the primary pores and fractures of the rock samples are closed by compression. The volume of the rock samples is compressed, the skeleton is compacted by adjustment, and the AE mainly comes from the fracture closure and the friction of particles biting each other. The AE count of the saturated rock sample at this stage is obviously reduced. The AB section is the elastic stage (II); the rock sample produces recoverable deformation in this stage. The AE count increases compared to the previous stage; the AE count is basically stable, and no special high point is produced. The BC section is the fissure stable development stage (III); the rock sample produces irrecoverable deformation from this stage and under the action of force causes the primary fissure to extend and connect. The CD section is the stage of unstable fracture development (IV), which is the most intense stage of damage before the destruction of the rock sample. After point D, in the post-peak destabilization stage (V), the rock sample still has a certain bearing capacity and fracture expansion, and weak surface damage will continue to occur in some relatively intact block structures.
The stress thresholds of the specimens with different water contents at each stage are shown in Figure 9.
The water content significantly affected the stress thresholds at each stage, and the fracture closure threshold, initial fracture development threshold, and fracture damage threshold (corresponding to A, B, and C, respectively, in Figure 8) were approximately quadratic functions of the water content. The relatively small dispersion of the fracture closure threshold indicates that the stresses were uniformly distributed within the specimens, and the stresses required for fracture closure were almost the same. As the water content increased from 0% to 0.7%, the fracture closure threshold reduced by 30% from 32.99 to 23.31 MPa. The reduction in the threshold increased gradually with the increase in water content, and the threshold of the saturated rock sample reduced to 8.87 Mpa, which is 27% of the threshold of dry rock sample. This indicates that the lubricating and softening effects of water inside the specimen promote the transfer of stress in the specimen at the initial stage of loading, which causes fracture closure to occur at a lower stress state. The initial development threshold of fractures represents the end of the elastic stage of the specimen and the beginning of the fracture stable development stage. With the increase in water content, the initial development threshold of fracture decreased and the percentage decrease increased gradually. The initial fracture development threshold decreased from 62.53 Mpa in dry rock samples to 12.83 Mpa in saturated rock samples, and the decrease reached 79.5%. Additionally, the fracture damage threshold decreased by 81.4% from 82.99 Mpa in the dry condition to 15.43 Mpa in the saturated condition. In the interval between the fracture damage threshold and the peak stress, the main stage for the formation of large fractures and the destruction of the main load-bearing structure in the specimens, new fractures are constantly formed, rapidly expanded, and connected on the weak side of the structure. The fracture damage thresholds of the rock samples with different water contents were 82.99, 53.14, 30.62, and 15.43 Mpa, respectively.
According to the engineering geological characteristics and test results of the 1302 transportation road, the muddy sandstone of the roadway roof mainly comprised quartz and feldspar as skeleton particles and clay minerals as the main cementing material. The intrinsic destabilization mechanism is as follows: the external environment changes due to the disturbance of the roadway excavation so that the rock body originally in the extrusion state to the interior of the roadway undergoes loose expansion and deformation when it reaches its load-bearing limit, followed by damage. Then, numerous horizontal and longitudinal fissures develop in the roof, and the roadway support elements are drilled together with the basic top of the aquifer so that it is transformed from interlayer runoff to vertical runoff. In the process of interaction with water, the large amount of swelling and absorbent clay minerals contained in the muddy sandstone of the roof plate changed the original physical and mechanical properties of the roof plate of the roadway, exhibiting an increase in peak strain and a significant weakening of the peak strength and elastic modulus while generating large swelling stress and large deformation, forming new fissures inside the roof plate, resulting in a significant reductions in its strength and stiffness. Disintegration and destruction occurred with an increase in the water immersion time and water content, the range of the loosening circle of the roadway enclosure rock was continuously expanded, and the stability of the anchorage structure was significantly reduced. Therefore, it is considered that the primary and excavation-disturbing fissures of the coal-sedimentary rock body are the external conditions for water–rock interaction occurring in water-rich coal seam roadways and that the rock mechanical damage phenomenon exhibited by clay minerals in contact with water is the key factor leading to the destabilization of the water-rich roof surrounding rock.

4. Stability Control Technology of Rock Surrounding Water-Rich Roadway Roof

4.1. Technical Ideas

Based on the weakening mechanism of the surrounding rock at the top of the water-rich roadway and the characteristics of the surrounding rock deposit, the following control ideas were considered:
(1) Roadway section shape optimization
The shape of the roadway section is closely related to the stability of the surrounding rock and is of considerable significance to ensure that the shape of the roadway section is optimized to give full play to the self-supporting capacity of the surrounding rock and to improve the adaptability of the surrounding rock stress environment. Based on this, the idea of optimizing the shape of the roadway section was proposed, and the distribution characteristics of the surrounding rock stress field and displacement fields of four typical roadway section shapes—namely rectangle, trapezoid, slanted-top rectangle, and straight-walled arc arch—were simulated and studied through numerical calculations to provide a scientific basis for optimization of the support parameters.
(2) Support parameter optimization
Based on the optimization results of the roadway section form, active prestressing reinforcement technology and an optimized technical solution to improve the anchorage stability of the roadway roof slab surrounding rock were proposed through orthogonal numerical simulation tests to improve the stress state and give full play to the self-supporting capacity of the roadway’s surrounding rock.

4.2. Characteristics of Distribution of Stress Field and Displacement Field in Tunnel Surroundings under Different Cross-Sectional Conditions

4.2.1. Numerical Model Establishment

Taking the water-rich roof return tunnel of this coal mine as the engineering background, FLAC3D (FLAC3D 5.0, DuPage County, IL, USA) was used to establish four types of numerical calculation models for the roadway sections. The model size was designed to be 20 times the radius of the roadway, i.e., 40 m wide and 32 m high, and the roadway excavation location was the center of the model. Because the physical and mechanical properties of rocks satisfy the characteristics of elastic–plastic materials and the damage of rock masses is mainly based on shear and tensile damage, the parameters required for the Mohr–Coulomb intrinsic relationship are fewer and easier to obtain. Accordingly, the corresponding determination methods are closer to the engineering reality; hence, the Mohr–Coulomb strength criterion was chosen as the material damage criterion in the numerical model in this study [29]. The model lower boundary constrains the longitudinal and lateral displacement and velocity; the left, right, front, and rear boundaries apply horizontal constraints, the upper boundary is unconstrained, the model upper boundary applies the vertical downward compensating load of equivalent mining depth, the average rock layer capacity was considered as 25,000 N/m3, the lateral pressure coefficient was 1.3, and the model X and Y directions apply the maximum and minimum horizontal principal stresses, respectively. The physical and mechanical parameters of each rock layer are listed in Table 5.

4.2.2. Characteristics of Stress Field Distribution in the Surrounding Rock

As shown in Figure 10, after excavation of the tunnel, a low-stress area formed near the surrounding rock and was mainly distributed in the surrounding rock near the top and bottom of the tunnel. In particular, the stress field of the surrounding rock in the rectangular section was symmetrically distributed as an “X” shape, and the peak stress of the surrounding rock was determined as 8.44 Mpa, 4.96 m away from the right gang, as shown in Figure 10a. The slanted-top rectangular form of the tunnel section is currently used in the mine, and the corresponding stress field of the surrounding rock presents asymmetrically distributed “X,” realizing the peak value of 8.12 Mpa at 2.18 m from the right gang, as shown in Figure 10b. Meanwhile, the characteristics of the surrounding rock stress distribution of the straight wall arc arch section are similar to those of the rectangular section, with the peak stress of 7.97 Mpa, as shown in Figure 10c. The surrounding rock stress of the trapezoidal section reached the peak value of 8.79 Mpa at 6.51 m from the right gang, as shown in Figure 10d. The descending order of the peak stress of the surrounding rock on both sides of the tunnel was trapezoidal, rectangular, slanted-top rectangular, and straight-walled arc arch, and the peak stress range of the rib of the straight wall arc arch section was only 1.64 m. The bottom corner of each section produces an evident stress concentration, and the degree of stress concentration follows: trapezoidal, straight-walled arc arch, rectangle, and slanted-top rectangle. According to the limit equilibrium zone theory, the plastic zone of the surrounding rock in the form of a straight-wall arc arch section is smaller, the two ribs of the roadway have sufficient bearing capacity to ensure the stability of the top plate surrounding rock, and the section form is conducive to the safe excavation succession of the working face. As shown in Figure 11, the distribution range of the low-stress zone of the horizontal stress in the surrounding rock of the roadway is wide, mainly concentrated in the coal seam and direct top, and directly affects the distribution range of the low-stress zone in descending order of influence as: straight-walled arc arch, oblique rectangle, trapezoid, and rectangle. Thus, the same vertical stress distribution characteristics indicate that the straight wall circular arch section is more conducive to maintaining the stability of the roadway envelope and strengthening water-rich roadway roof envelope management.

4.2.3. Distribution Characteristics of the Surrounding Rock Displacement Field

As shown in Figure 12, the distribution characteristics of the displacement field of the surrounding rock in different roadway sections are basically the same, among which the distribution range of the high displacement of the roof plate in the straight-walled circular arch section is smaller than that of the other three sections. The displacement fields of the roof plate in the rectangular section, oblique rectangular section, and trapezoidal section exhibit an inverted U-type distribution, which is not conducive to the stability of the roof plate. In each section, the top plate and right rib were arranged to extract the displacement distribution characteristics of the top and right ribs, as shown in Figure 13.
Figure 13a reflects the displacement distribution of the top plate in different sections. The overall performance is characterized by fast and large drop, particularly in the oblique rectangular section. The peak displacement of the top plate was 135.7 mm, and it stabilized at 3.2 m above the top plate with a drop of 103.8 mm. The displacement of the top plate in each section is negatively correlated with the distance and is stabilized in the range of 3.0–3.3 m. The initial displacement of the top plate in each section is in the order of oblique rectangular section > rectangular section > trapezoidal section > straight-walled circular arch section, and the displacements of the top plate of each section in the stable area (3–12 m) follow the order of rectangular section > trapezoidal section > straight-walled circular arch section > oblique rectangular section. In general, the displacement of the top plate of the straight-walled circular arch section was optimal in the range of 0–12 m.
As shown in Figure 13b, the displacement of the right rib’s surrounding rock in each section is linearly negatively correlated with the distance; the displacement and distribution characteristics of the rectangular section and straight-walled circular arc arch section are the same, and the displacement of the right rib in each section tends to be stable in the range of 8–10 m until 12 m, which is closely related to the distribution of the plastic zone in the rib. After 12–14 m of the right rib, the surrounding rock stress is the original rock stress; the initial displacement of the right rib of the roadway in descending order is oblique rectangular section > trapezoidal section > rectangular section > straight-walled circular arch section, and in the whole monitoring range, the displacement of the right rib of the straight-walled circular arch section is the minimum value. Therefore, it can be concluded that the straight-walled circular arch section is the best section form for a water-rich roadway in a mine.

4.3. Water-Rich Roadway Support Parameter Sensitivity Orthogonal Test

Based on a previous study, this section presents research on the optimization of support parameters of water-rich roadways during excavation through orthogonal numerical simulation tests, analyzes the influence of different support parameter conditions on the deformation and damage of the surrounding rock of the roadway, and then proposes technical support optimization solutions to improve the anchorage stability of the surrounding rock at the roof of a water-rich roadway.

4.3.1. Numerical Model Establishment

According to the actual engineering geological conditions of working face 1302, a numerical calculation model was established with the model size of length (x) × width (y) × height (z) of 357 m × 100 m × 32 m, and the length of the working surface was 210 m. A 35 m boundary area was set on each side of the model to eliminate the boundary effect, as shown in Figure 14. The Mohr–Coulomb intrinsic model was adopted and has the tendency of the working face in the length direction and the strike direction in the width direction. The grid near the back mining tunnel was encrypted. The lower boundary of the model constrains the longitudinal and lateral displacement and velocity. The left, right, front, and rear boundaries of the model impose horizontal constraints; the upper boundary is unconstrained. The vertical downward compensation load of the equivalent mining depth is applied to the upper boundary of the model. The average capacity of the rock layer is 25,000 N/m3. The lateral pressure coefficient is 1.3; the physical and mechanical parameters of each rock layer are listed in Table 5.

4.3.2. Orthogonal Numerical Simulation Test Program

The support parameters in this test mainly included the anchor diameter, anchor length, inter-row distance between anchors, anchor preload torque, and anchor cable preload force. These parameters were employed in the orthogonal test, and four values were considered for each. The variations of factors and levels are shown in Table 6.
In this study, the orthogonal test scheme L16 (45) with five factors and four levels was selected; the specific scheme is detailed in Table 7. Sixteen numerical calculation models were established according to Table 7, and the support parameters of each model were determined according to the corresponding test number; three φ21.6 mm × 7300 mm anchor cables were arranged in the top plate of each model group with an inter-row distance of 1400 mm × 1600 mm. Therefore, the displacement of each model was taken as the evaluation index, and the displacement of the roadway was considered as the sum of the displacements of the top and bottom plates and the two gangs of the roadway.

4.3.3. Analysis of Orthogonal Test Results

As shown in Table 8, from the orthogonal numerical simulation test results, the extreme difference of factor C (inter-row distance between anchors) was the largest, followed by factor D (anchor preload torque) and factor E (anchor cable preload force), and the extreme difference of factor B (anchor rod length) was the smallest. Thus, the distance between the anchor rows is the most sensitive to the deformation damage of the roadway’s surrounding rock. The sensitivity of the anchor preload torque and anchor cable preload is in the middle, and the influences of the anchor rod diameter and anchor rod length are relatively small.
As can be seen from Figure 15, the total amount of roadway deformation decreased with the strengthening of each influencing factor, and the influence of the anchor diameter and anchor length on the deformation of the roadway’s surrounding rock exhibited similar trends; the difference between the two factors for levels 3 and 4 of the roadway’s surrounding rock deformation is not large. With a decrease in the inter-row distance between anchor rods, the reinforced area between anchor rods forms a whole support structure, the deformation of the roadway’s surrounding rock decreases significantly, and the inter-row distance decreases from 800 mm × 800 mm to 600 mm × 600 mm. When the anchor cable preload force was 230 kN, the deformation of the roadway’s surrounding rock was significantly improved compared to that of a force of 200 kN, but there is not much change compared to that of a force of 260 kN. When the anchor preload torques were 400 N m and 500 N m, the differences in roadway deformation were very small, although the deformation of the roadway’s surrounding rock was greatly improved when the anchor preload torque was 600 N m; however, the requirements for the construction machinery were high and not easy to meet. It is difficult to satisfy the high requirements of construction tools. Considering the sensitivity of all factors to the deformation of the roadway’s surrounding rock and the construction level and economic efficiency, the best roadway support parameters were determined as follows: anchor rod type φ22 mm × 2400 mm, inter-row distance 800 mm × 800 mm, anchor preload torque 400 Nm, and anchor cable preload force 230 kN.

4.3.4. Technical Parameters for Support Optimization

The optimized technical parameters for the support of the water-rich roadway in the mine were determined based on the results of the orthogonal numerical calculation tests. Three high-strength anchor ropes of 1 × 7 strands φ21.6 mm × 7300 mm with an inter-row distance of 1400 mm × 1600 mm were arranged in each row of the roof, each of which was equipped with a drum tray of 300 mm × 300 mm × 16 mm with a tension loss of not less than 230 kN; the top slab was arranged with six rows of φ22 mm × 2400 mm left-handed rebar-less threaded steel anchors with an inter-row spacing of 800 mm × 800 mm connected with a φ12 mm × 4200 mm steel ladder and anchored using three MSK2350 resin coils; the gang section was arranged with three rows of φ22 mm × 2400 mm left-handed rebar-less threaded steel anchors with an inter-row spacing of 800 mm × 800 mm connected with a φ12 mm × 2200 mm steel ladder using one MSCK2335 and one MSK2350. The anchors were preloaded with a torque of not less than 400 Nm, connected with 150 mm × 150 mm × 10 mm high-strength drum pallets, and sprayed with C20 concrete with the thickness of 50 mm, 20 m behind the tunneling face. Specific support forms are displayed in Figure 16.

5. Field Test

The field test was conducted in the 1302 haulage lane of the mine, and the optimized support design was applied to the section of the 1302 haulage lane to be dug. The stability control effect of the roof surrounding rock of the water-rich roadway was comprehensively evaluated through the arrangement of the rock pressure monitoring station, which includes monitoring of the working resistance of the anchor bolt (cable), deformation of the roadway’s surrounding rock, and roof separation. The arrangement of the measurement stations is shown in Figure 17.
The monitoring data of measurement stations I and III were selected for comparison and analysis; measurement station I was at the junction section between the original support form and optimized support design, and the deformation and damage characteristics of the roadway’s surrounding rock at this station were significantly different from those at measurement station III, described as follows:
(1) As shown in Figure 18, during the 150 m advance of the excavation face, the relative displacement of the top and bottom plates of measurement station I was 205 mm, and that of the two ribs of the roadway was 70 mm, of which the deformation of the coal pillar rib was relatively larger, and 28 mm more than that of the coal wall; the average rate of relative displacement of the top and bottom plates was 11 mm/d, with a maximum rate of 42 mm/d, while that of the two ribs was 3.7 mm/d. The average rate of the relative shift of the top and bottom plates was 11 mm/d, exhibiting the maximum rate of 42 mm/d; that of the two helpers was 3.7 mm/d, with a maximum rate of 21 mm/d.
(2) As shown in Figure 19, during the 150 m advance of the excavation face, the relative displacements of the top and bottom plates and the two helpers at measurement station III were 79 and 46 mm, respectively, which are 61% and 34%, respectively, lower than those at measurement station I. The average rates of the two relative displacements were 62% and 35% lower than those at measurement station I, respectively. The monitoring results show that the roof of the roadway was effectively controlled compared with the original support area, the integrity of the surrounding rock was high, and the active support elements in the roadway were in good working condition.
In comparison, station I is in the transition zone between the original support and the optimized support, and the spatial and temporal evolution characteristics of the surrounding rock deformation can reflect the deformation and damage of the original support. Compared to station I, the deformation of the surrounding rock at station III has the following advantages:
(1) The time for the deformation and stabilization of the surrounding rock is advanced; specifically, the time for yielding and deformation failure of the roof and sidewalls is delayed, and the degree and scope of the deformation and failure of the lag excavation face are reduced.
(2) The scope, timing, duration, creep rate, and degree of creep of the surrounding rock were significantly reduced compared with those of the original support.
(3) There are some commonalities with the deformation and damage characteristics of the rocks surrounding station I; for example, the deformation and damage of the coal pillar is always higher than that of the coal wall side, which is closely related to the bearing performance of the coal pillar and solid coal and are affected by the advancement speed of the excavation working face to a certain extent.

6. Conclusions

A study was conducted on the mechanism of strength weakening of rock surrounding a water-rich roadway roof slab; the mechanical property damage law of a muddy sandstone roof slab was investigated under water–rock interaction considering surrounding rock stress distribution characteristics and total displacement change, and the key technical parameters for stability control of rock surrounding the water-rich roadway were determined. The research results of this paper are summarized as follows:
(1) The main minerals of the top slab muddy sandstone included quartz (51.4%), clay (31.7%), and orthoclase (13%); particularly, the main components of the clay minerals were determined to be kaolinite and muscovite. With increasing water content from dry to saturated, the average peak strength and elastic modulus of the muddy sandstone decreased linearly by 80.0% from 96.07 to 19.25 MPa and by 63.4% from 7.34 to 2.69 GPa, respectively.
(2) Water content was found to be the key factor influencing the AE event count of the muddy sandstone rock samples, exhibiting negative correlation. Correspondingly, the stress thresholds at each stage of the rock samples with different water contents maintained this trend and were approximately quadratic. The fracture closure threshold, fracture initial development threshold, and fracture damage threshold of the saturated rock samples were 73%, 79.5%, and 81.4% lower than those of the dry rock samples, respectively, and the weakening effect due to water was obvious.
(3) A technical idea of adjusting the roadway section and optimizing the support parameters for controlling the surrounding rock was proposed. Based on this, a numerical calculation study of the optimized roadway section form was conducted. The results showed that the straight wall circular arch section is more favorable for the adaptation of the surrounding rock under this geological condition. By conducting sensitivity orthogonal tests on the parameters of the roadway support components, the support parameters of the anchor rods and anchor cables in the roadway were determined, and an optimized technical scheme for water-rich roadway support was realized.
(4) An industrial test was conducted, and the application results indicate that the deformation of the top and bottom plates of the roadway and the two gangs after optimizing the section and support parameters reduced by 61% and 34%, respectively, compared to before optimization. The stability control effect of the roadway’s surrounding rock was remarkable. The results show that the deformation and damage of the water-rich roadway before and after the optimization of the support parameters were reduced by 61% and 34%, respectively, and the stability of the roadway was controlled significantly.

Author Contributions

Conceptualization, F.W. and Q.Y.; methodology, Q.Y. and X.L.; software, F.W. and C.W.; validation, F.W., C.W. and S.C.; investigation, C.W., H.L. and G.Z.; data curation, C.W.; writing—original draft preparation, F.W.; writing—review and editing, Q.Y. and X.L.; supervision, X.L.; project administration, Q.Y. and Y.L.; funding acquisition, X.L. All authors have read and agreed to the published version of the manuscript.

Funding

This work is funded by the National Natural Science Foundation of China (No. 51874285).

Data Availability Statement

Not applicable.

Acknowledgments

This work was financially supported by the National Natural Science Foundation of China (No. 51874285).

Conflicts of Interest

The authors declare no conflict of interest.

References

  1. Yao, Q.L.; Li, X.H.; Qu, Q.D. Instability mechanism and technique of surrounding rock control of water- enriched roofs of coal drifts. J. China Coal Soc. 2011, 36, 12–17. [Google Scholar]
  2. Xu, X.L.; Zhang, N. Study of Control Process Deformation Behavior and of Soft Rock Drift Under Rich Water Condition. J. China Univ. Min. Technol. 2007, 36, 298–302. [Google Scholar]
  3. Yao, Q.L.; Chen, T.; Li, X.H.; Liu, K.; Liang, S.; Zhu, C.G. Numerical analysis on percolation characteristics of water-enriched roof of roadway. J. Min. Saf. Eng. 2016, 33, 12–18. [Google Scholar]
  4. Yao, Q.L.; Li, X.H.; Chen, Q.F. Research on the characteristics and classification of water-enriched sandstone roofs. J. China Univ. Min. Technol. 2013, 42, 50–56. [Google Scholar]
  5. Hashiba, K.; Fukui, K.; Kataoka, M. Effects of water saturation on the strength and loading-rate dependence of andesite. Int. J. Rock Mech. Min. Sci. 2019, 117, 142–149. [Google Scholar] [CrossRef]
  6. Erguler, Z.A.; Ulusay, R. Water-induced variations in mechanical properties of clay-bearing rocks. Int. J. Rock Mech. Min. Sci. 2009, 46, 355–370. [Google Scholar] [CrossRef]
  7. Celik, M.Y.; Akbulut, H.; Ergul, A. Water absorption process effect on strength of Ayazini tuff, such as the uniaxial compressive strength, flexural strength and freeze and thaw effect. Environ. Earth Sci. 2014, 71, 4247–4259. [Google Scholar] [CrossRef]
  8. Yang, F.; Zhou, H.; Zhang, C.; Lu, J.; Lu, X.; Geng, Y. An analysis method for evaluating the safety of pressure water conveyance tunnel in argillaceous sandstone under water-weakening conditions. Tunnel. Undergr. Space Technol. 2020, 97, 103264. [Google Scholar] [CrossRef]
  9. Shen, R.; Qiu, L.; Zhao, E.; Han, X.; Li, H.; Hou, Z.; Zhang, X. Experimental study on frequency and amplitude characteristics of acoustic emission during the fracturing process of coal under the action of water. Saf. Sci. 2019, 117, 320–329. [Google Scholar] [CrossRef]
  10. Chen, Y.; Cao, P.; Chen, R.; Teng, Y. Effect of water-rock interaction on the morphology of a rock surface. Int. J. Rock Mech. Min. Sci. 2010, 47, 816–822. [Google Scholar] [CrossRef]
  11. Lashkaripour, G.R.; Nakhaei, M. A statistical investigation on mudrocks characteristics. In Proceedings of the ISRM-EUROCK Symposium on Rock Mechanics, Espoo, Finland, 4–7 June 2001; pp. 131–136. [Google Scholar]
  12. Daraei, A.; Zare, S. Effect of water content variations on critical and failure strains of rock. KSCE J. Civ. Eng. 2018, 33, 3331–3339. [Google Scholar] [CrossRef]
  13. Daraei, A.; Zare, S. Determination of critical saturation degree in rocks based on maximum loss of uniaxial compression strength and deformation modulus. Geomech. Geophys. Geo-Energy Geo-Resour. 2018, 4, 343–353. [Google Scholar] [CrossRef]
  14. Deng, H.F.; Fang, J.C.; Li, J.L.; Li, G.Y.; Qi, Y.; Xu, X.L. Damage evolution of dynamic characteristics of sandstone under the sequential action of water-rock interaction and cyclic loading and unloading. Rock Soil Mech. 2021, 42, 343–351. [Google Scholar]
  15. Deng, H.F.; Hu, A.L.; Li, J.L.; Zhang, X.J.; Hu, Y.; Chang, D.L.; Zhu, M. Statistical damage constitutive model of sandstone under water-rock interaction. Rock Soil Mech. 2017, 38, 631–639. [Google Scholar]
  16. Deng, H.F.; Xiao, Z.Y.; Li, J.L.; Hu, Y.Y.; Zhou, M.L. Deteriorating change rule test research of damage sandstone strength under water-rock interaction. Chin. J. Rock Mech. Eng. 2015, 34, 2690–2698. [Google Scholar]
  17. Li, X.B.; Liu, X.S.; Tan, Y.L.; Ma, Q.; Wu, B.Y.; Wang, H.L. Creep Constitutive Model and Numerical Realization of Coal-Rock Combination Deteriorated by Immersion. Minerals 2022, 12, 292. [Google Scholar] [CrossRef]
  18. Dong, W.L.; Han, L.J.; Meng, L.D.; Zhu, H.X.; Yan, S.; Xu, C.Y.; Dong, Y.N. Experimental Study on the Mechanical and Acoustic Emission Characteristics of Tuff with Different Moisture Contents. Minerals 2022, 12, 1050. [Google Scholar] [CrossRef]
  19. Li, H.G.; Li, H.M.; Xu, S.G. Influence of water content on mechanical characteristics of weakly cemented sandstone. J. Min. Strat. Control Eng. 2021, 3, 60–66. [Google Scholar]
  20. Li, H.G.; Li, H.M.; Wang, H.J.; Chen, S.L. Physical and mechanical characteristics and definition of weakly cemented sandstone. Coal Sci. Technol. 2017, 45, 1–7. [Google Scholar]
  21. Zhang, N.; Li, G.C.; Xu, X.L. Argillation of a roof weak interlayer due to water seepage and its influence on roadway stability. J. China Univ. Min. Technol. 2009, 38, 757–763. [Google Scholar]
  22. Zhang, N.; Li, G.C.; Kan, J.G. Influence of soft interlayer location in coal roof on stability of roadway bolting structure. Rock Soil Mech. 2011, 32, 2753–2758. [Google Scholar]
  23. Tang, S.B.; Tang, C.A. Numerical studies on tunnel floor heave in swelling ground under humid conditions. Int. J. Rock Mech. Min. Sci. 2012, 55, 139–150. [Google Scholar] [CrossRef]
  24. González-Nicieza, C.; Álvarez-Vigil, A.E.; Menéndez-Díaz, A.; González-Palacio, C. Influence of the depth and shape of a tunnel in the application of the convergence-confinement method. Tunn. Undergr. Space Technol. 2008, 23, 25–37. [Google Scholar] [CrossRef]
  25. Hubei Geological Research Laboratory. Regulation for testing the physical and mechanical properties of rock Part 18: Test for determing the uniaxial compressive strength of rock. Appl. Thermal Eng. 2015, DZ/T 0276.18-2015, 1–12. [Google Scholar]
  26. Fang, J.; Yao, Q.L.; Wang, W.N.; Tang, C.J.; Wang, G. Experimental study on damage characteristics of siltstone under water action. J. China Coal Soc. 2018, 43, 412–419. [Google Scholar]
  27. Tang, C.J.; Yao, Q.L.; Wang, W.N.; Wang, X.H. Experimental study on damage characteristics of sandy mudstone under the action of water. J. China Coal Soc. 2019, 44, 882–890. [Google Scholar]
  28. Zhang, J.F.; Yang, Y.Z. Rock size effect and acoustic emission characteristics under the influence of loading rate. China Min. Mag. 2021, 30, 205–210. [Google Scholar]
  29. Hu, J.L.; Sun, L.C.; Cui, H.H.; Gao, P.F. Numerical Analysis of Deep Foundation Pit Deformation Based on Modified Mohr- Coulomb Mode. Sci. Technol. Eng. 2021, 21, 7717–7723. [Google Scholar]
Figure 1. Schematics of mining area roadway layout and roof fall: (a) mining area plan; (b) original roadway support section; (c) diagram of roof fall accident.
Minerals 12 01587 g001
Figure 2. Description of coal and rock seams.
Minerals 12 01587 g002
Figure 3. Pre-test treatment: (a) specimen weighing; (b) specimen drying; (c) nondestructive water immersion device; (d) wave velocity test results; (e) variation in moisture content with immersion time.
Minerals 12 01587 g003
Figure 4. Test equipment and scheme: (a) MTS electrohydraulic servo testing machine; (b) uniaxial compression test; (c) diagram of acoustic emission (AE) probe arrangement.
Minerals 12 01587 g004
Figure 5. XRD patterns of muddy sandstone samples (a) 1 and (b) 2.
Minerals 12 01587 g005
Figure 6. Mechanical damage characteristics of muddy sandstone with varying moisture content: (a) full stress–strain curves of muddy sandstone with different moisture contents; (b) peak stress fitting relationship of muddy sandstone with different moisture contents.
Minerals 12 01587 g006
Figure 7. Fitting relationship of elastic modulus of muddy sandstone with different moisture contents.
Minerals 12 01587 g007
Figure 8. AE counts versus stress for specimens with different moisture contents: (a) dry specimens; (b) 0.7% moisture content; (c) 1.4% moisture content; (d) 2.1% moisture content.
Minerals 12 01587 g008
Figure 9. Stress thresholds for specimens with different moisture contents: (a) fracture closure threshold; (b) fracture initial development threshold; (c) fracture damage threshold.
Minerals 12 01587 g009
Figure 10. Vertical stress distribution characteristics of the surrounding rock in different channel section forms: (a) rectangle; (b) slanted-top rectangle; (c) straight-walled circular arch; (d) trapezoid.
Minerals 12 01587 g010
Figure 11. Horizontal stress distribution characteristics of surrounding rock in different channel section forms: (a) rectangle; (b) slanted-top rectangle; (c) straight-walled circular arch; (d) trapezoid.
Minerals 12 01587 g011
Figure 12. Characteristics of displacement field distribution of surrounding rock in different channel section forms: (a) rectangle; (b) slanted-top rectangle; (c) straight-walled circular arch; (d) trapezoid.
Minerals 12 01587 g012
Figure 13. Displacement evolution curves of surrounding rock in different roadway section forms: (a) displacement evolution law of top slab; (b) displacement evolution law of right gang.
Minerals 12 01587 g013
Figure 14. Numerical calculation model.
Minerals 12 01587 g014
Figure 15. Sensitivity characteristics of each influencing factor in the deformation of roadway’s surrounding rock under different horizontal conditions.
Minerals 12 01587 g015
Figure 16. 1302 transport roadway support technical scheme: (a) roadway support section diagram; (b) roadway support floor plan.
Minerals 12 01587 g016
Figure 17. Layout of mine pressure monitoring stations.
Minerals 12 01587 g017
Figure 18. Spatial and temporal evolution characteristics of the deformation and damage of the surrounding rock at station I; (a) the displacement of the roadway surface; (b) the deformation speed of the roadway surface.
Minerals 12 01587 g018
Figure 19. Spatial and temporal evolution characteristics of the deformation and damage of the surrounding rock at station III: (a) displacement of the roadway surface; (b) deformation speed of the roadway surface.
Minerals 12 01587 g019
Table 1. Composition of rock components.
Sample NameMineral Composition Ratio/%
QuartzOrthoclaseSideriteSodium FeldsparClay
152.514.41.3-31.8
250.311.50.95.731.6
Table 2. Composition of clay minerals.
Sample NameMineral Composition Ratio/%
KaoliniteWhite MicaTalcOblique Chlorite
142.1353.774.1-
235.7661.712.53-
Table 3. Peak stress of rock samples with different water content.
Moisture Content of Rock Sample/%Peak Stress/MPaAverage Peak Stress/MPa
0100.00, 95.73, 92.4896.07
0.762.76, 56.62, 53.2357.54
1.438.16, 35.17, 27.6433.66
2.123.96, 19.36, 14.4319.25
Table 4. Modulus of elasticity of rock samples with different water contents.
Moisture Content of Rock Sample/%Modulus of Elasticity/GpaAverage Modulus of Elasticity/Gpa
07.66, 7.17, 7.207.34
0.75.66, 5.06, 6.345.69
1.44.06, 3.58, 3.863.83
2.13.11, 2.89, 2.082.69
Table 5. Numerical simulation of physical and mechanical parameters of coal seams.
Rock LayerDensity/kg·m−3Bulk Modulus/GpaShear Modulus/GpaCohesion/MpaInternal Friction Angle/°Tensile Strength/Mpa
Sandy mudstone25102.562.362.16321.84
Fine sandstone267316.041.716.3255.75
Siltstone283010.838.076.15386.15
Muddy sandstone28913.212.092.64382.15
3# Coal13801.050.381.220.70.35
Sandy mudstone25405.124.372.45382.01
Fine sandstone287018.0214.023.85434.96
4#Coal14921.270.460.32150.64
Mudstone24682.171.450.24290.68
Sandy mudstone26024.93.21.18352.07
Table 6. Experimental factor scheme of orthogonal numerical simulation.
LevelA. Bolt Diameter/mmB. Bolt Length/mmC. Bolt Inter-Row Spacing/mm × mmD. Bolt Pre-Tightening Torsion/N·mE. Bolt Pre-Tension/kN
11820001200 × 1200300170
22022001000 × 1000400200
3222400800 × 800500230
4252600600 × 600600260
Table 7. Orthogonal numerical simulation test scheme.
Test NumberFactorResult
Bolt Diameter/mmBolt Length/mmBolt Inter-Row Spacing/mm × mmBolt Pre-Tightening Torsion/N·mBolt Pre-Tension/kNRoadway Displacement/mm
11(18)1(2000)1(1200 × 1200)1(300)1(170)261.4
21(18)2(2200)2(1000 × 1000)2(400)2(200)224.3
31(18)3(2400)3(800 × 800)3(500)3(230)203.1
41(18)4(2600)4(600 × 600)4(600)4(260)193
52(20)1(2000)2(1000 × 1000)3(500)4(260)214.8
62(20)2(2200)1(1200 × 1200)4(600)3(230)222.2
72(20)3(2400)4(600 × 600)1(300)2(200)210.1
82(20)4(2600)3(800 × 800)2(400)1(170)209.9
93(22)1(2000)3(800 × 800)4(600)2(200)202.5
103(22)2(2200)4(600 × 600)3(500)1(170)205.5
113(22)3(2400)1(1200 × 1200)2(400)4(260)217.1
123(22)4(2600)2(1000 × 1000)1(300)3(230)215.5
134(24)1(2000)4(600 × 600)2(400)3(230)198.8
144(24)2(2200)3(800 × 800)1(300)4(260)203.9
154(24)3(2400)2(1000 × 1000)4(600)1(170)212.4
164(24)4(2600)1(1200 × 1200)3(500)2(200)220.7
Table 8. Results of visual analysis of approach volume.
AverageDisplacement/mm
Bolt Diameter/mmBolt Length/mmBolt Inter-Row Spacing/mm × mmBolt Pre-Tightening Torsion/N·mBolt Pre-Tension/kN
1220.5 219.4 230.4 222.7 222.3
2214.3 214.0 214.0 212.5 214.4
3210.2 210.7 204.9 211.0 209.9
4209.0 209.8 201.9 207.5 207.2
Range11.5 9.6 28.5 15.2 15.1
Publisher’s Note: MDPI stays neutral with regard to jurisdictional claims in published maps and institutional affiliations.

