Article

Automatic Cutting Speed Control System of Boom-Type Roadheader Based on Geological Strength Index

1
School of Mechanical Engineering, Xi’an University of Science and Technology, Xi’an 710054, China
2
Shanxi Key Laboratoty of Mine Electromechanical Equipment Intelligence Monitoring, Xi’an 710054, China
3
Shaanxi Coal and Chemical Technology Institute Co., Ltd., Xi’an 710065, China
*
Author to whom correspondence should be addressed.
Minerals 2022, 12(12), 1582; https://doi.org/10.3390/min12121582
Submission received: 1 November 2022 / Revised: 3 December 2022 / Accepted: 7 December 2022 / Published: 9 December 2022
(This article belongs to the Special Issue Application of Emerging Technology in Mining Operations)

Abstract

:
The boom-type roadheader is the foremost mining equipment in coal mines. At present, the automatic cutting technology is still immature for adjusting cutting speed automatically in accordance with rock strength, resulting in energy dissipation. In this study, we put forward a method with respect to detecting the geological strength index of coal seam profile through visual inspection, as well as characterize the geological strength index and control the cutting head for adjusting speed automatically based on inspecting fracture features on coal rock’s surface, aiming at achieving energy conservation control of boom-type roadheader. The image processing algorithm is adopted for detecting joint characteristics of palisades fracture, and a quantitative model of the geological strength index is established. The fractal dimension is used to obtain the distribution of geological strength indicators of a coal seam, and the heading machine’s cutting head is controlled for adjusting speed automatically. A vision control platform of boom-type roadheader is built in the laboratory to perform ground simulation experiments. According to experimental results, the difference between the geological strength index of the coal seam detected through visual inspection and the set value in the geological strength index chart is up to 3.5%, and the results are basically consistent, so the quantification of geological strength index can be performed rapidly and effectively. The average energy consumption of boom-type roadheader decreases by 5.4% after adopting self-adaptation control, realizing energy conservation and consumption reduction as well as intelligent control of coal mine machinery.

1. Introduction

The boom-type roadheader plays an important role in the mining, loading, and transportation process of the coal face. The high-speed rotation of the cutting head cuts the coal wall of the coal face, and the coal is continuously transported to the ground through the belt conveyor. It is one of the most widely used mining equipment in coal mines at present. Boom-type roadheader can greatly improve the efficiency of fully mechanized mining, reduce labor costs, reduce labor intensity, and provide good mining conditions for coal miners. Therefore, the boom-type roadheader has a good development prospect. At present, boom-type roadheader is mainly operated manually, and the positioning accuracy and automatic cutting technology are not mature. Although most boom-type roadheaders are equipped with explosion-proof frequency converters, the cutting head still operates at a constant speed without automatic speed regulation according to the strength of coal and rock, resulting in a great waste of electric energy [1,2,3].
The geological strength index (GSI) is a quantitative index to judge the stability of rock mass. It is a part of the Hoek–Brown criterion and reflects the stability of rock mass. The GSI is expressed by a value between 0 and 100. The larger the geological strength index is, the fewer the rock mass cracks are and the more stable the structure is, and the smaller the GSI is, the more cracks in the rock mass and the more unstable the structure is [4,5]. The traditional GSI is judged by professionals according to the GSI image, and the judgment result is prone to deviation due to personnel subjective factors. The GSI is often used in rock mass engineering. In recent years, some experts have introduced the GSI into coal geological engineering, which is an important parameter in comprehensive excavation, gas drainage, and other links [6]. Researchers all over the world have made detailed research on the GSI system [7,8,9,10,11,12,13,14,15,16].
The team of Professor Miao Wu from the China University of Mining And Technology proposed a control strategy for boom-type roadheaders based on a multi-sensor information fusion algorithm, aiming at the problem that a boom-type roadheader cannot adjust adaptively according to the rock hardness of coal mine. It drives the intelligent cutting of the cutting arm by detecting motor current, cylinder pressure, and vibration acceleration of the cutting arm [17,18,19]. The team of Professor Xuhui Zhang from Xi’an University of Science and Technology proposed a visual servo control system for boom-type roadheaders, which adopts the combination of visual measurement, electro-hydraulic servo control, path planning, and manual teaching to realize the visual servo control of boom-type roadheaders in a complex environment [20,21,22]. Xianbo Su and Hongyu Guo from the Henan University of Technology used the GSI to quantitatively characterize the coal structure and explored the quantitative relationship between the GSI and the coal firmness coefficient, the initial velocity of gas emission, and the gas permeability [23,24]. According to the GSI, the coal structure is divided into primary structure coal, crushed coal, crushed coal, and mylonite coal. The mobile image processing technology is used to analyze the special coal core to obtain the GSI value [25]. These studies have been widely used in gas drainage and coalbed methane development projects. Kunui Hong proposed a method to quantitatively measure the GSI of in situ jointed rock mass by using image processing technology. The relative error between the measured results and the values given in the GSI chart is less than 3.6 [26]. Sen Yang introduced local histogram equalization and adaptive gamma correction into rock surface treatment, combined with regional growth and Hough transform, automatically extracted GSI and verified them in two sites [27]. Using control systems to reduce energy consumption in mining is not new. Kaike Albuquerque has designed rule-based controls to automatically control the speed of dump trucks and the number of bins in use [28]. H. G. Brand has studied different project types that can be identified using existing data sources and implemented them in a mine, saving 10.66 MW, and demonstrating the effectiveness of the system [29].
This study proposes a visual control system for a boom-type roadheader, which controls the automatic speed regulation of the cutting head by detecting the geological strength index of the coal wall in the heading face, so as to realize energy saving, consumption reduction, and intellectualization of boom-type roadheader. In this study, the visual measurement method is introduced. Through the camera installed in front of the boom-type roadheader, the coal wall of the working face is photographed and analyzed, the characteristics of fissures and joints are extracted, and the geological strength index is quantified quickly and efficiently. Through the fractal dimension, the geological strength index on the cutting path is gridded, and the cutting head automatically adjusts the speed according to the coal and rock geological strength index of the cutting path, so as to realize the adaptive energy-saving control of the roadheader cutting head.

2. Geological Strength Index

The Hoek–Brown criterion is used to estimate the strength of underground rock mass in the study of underground rock mass engineering. the geological strength index theory is proposed to provide parameters for Hoek–Brown failure criterion. Hoek–Brown strength criterion has become an indispensable theoretical method in the rock engineering industry, which is mainly applied to underground mining, slope stability research, and tunnel engineering. Hoek–Brown strength criterion is expressed as [30]:
σ 1 = σ 3 + σ c ( m b σ 3 σ c + s ) α
where σ 1 and σ 3 are the maximum principal stress and the minimum principal stress of the coal, respectively; σ c is the compressive strength of coal.
m b   s , and α are Hoek–Brown criterion constants of coal blocks. As important parameters of rock engineering, they are widely used in coal mining, gas extraction, and other projects. The expression formula is as follows:
m b = m i exp ( G S I 28 100 D )
s = exp ( G S I 28 100 3 D )
α = 1 2 + 1 6 ( e G S I 15 e 20 3 )
where D is the coal disturbance factor, D ( 0 , 1 ) , and the value of no disturbance is 0, the value of semi disturbance is 0.5, and the value of full disturbance is 1; m i is the Hoek–Brown constant of coal; GSI refers to the geological strength index. Hoek–Brown estimated the geological strength index value according to the rock mass structure and surface fractures, as shown in Table 1.
Researchers quantify the geological strength index of rock mass according to the geological strength index reference table, which mainly depends on experience. Affected by subjective factors, the parameter estimation results have errors and cannot meet the needs of value stability. Therefore, it is necessary to explore a stable method to detect the geological strength index. In this study, the visual inspection method is used. First, the image of the coal wall cutting surface is obtained, and then the image is preprocessed. Then, the GSI is predicted through the artificial neural network. Finally, the distribution of the GSI of the coal wall cutting surface is analyzed through the fractal dimension, and the boom-type roadheader is guided to carry out adaptive control of the cutting head and arm.

3. Image Detection

3.1. Acquire Image

An explosion-proof camera is installed on the body of the boom-type roadheader, which is facing the coal wall of the heading face. A high-intensity light source is installed on the head of the roadheader, which can illuminate the whole coal wall so that the camera can obtain the coal wall photos of the cracks and joints clearly displayed. The coal wall image of the heading face obtained by taking photos is transmitted to the industrial control computer of the boom-type roadheader using industrial Ethernet. The industrial control computer software first preprocesses the image to improve the clarity of the image and then calculates the geological strength index according to the cracks and joints of the coal wall image to control the action of the cutting head. The structure of the boom-type roadheader visual control system is shown in Figure 1.
Before taking photos of the coal wall, first of all, ensure that the light is sufficient to clearly see the joints of the coal wall. Secondly, manually clean the remaining coal under the coal wall to make the coal wall completely exposed to the camera.
The boom-type roadheader will produce a large amount of pulverized coal mist and dust during operation. The video image collected by the mine camera is affected by the coal dust, and the video image cannot be clearly displayed. The roadway lighting in the heading face is less, and the lighting distribution is uneven, which will also greatly affect the quality of video images. Therefore, it is necessary to clear the collected video image to obtain a clear image of the coal mine and improve the accuracy of image detection.

3.2. Crack Detection

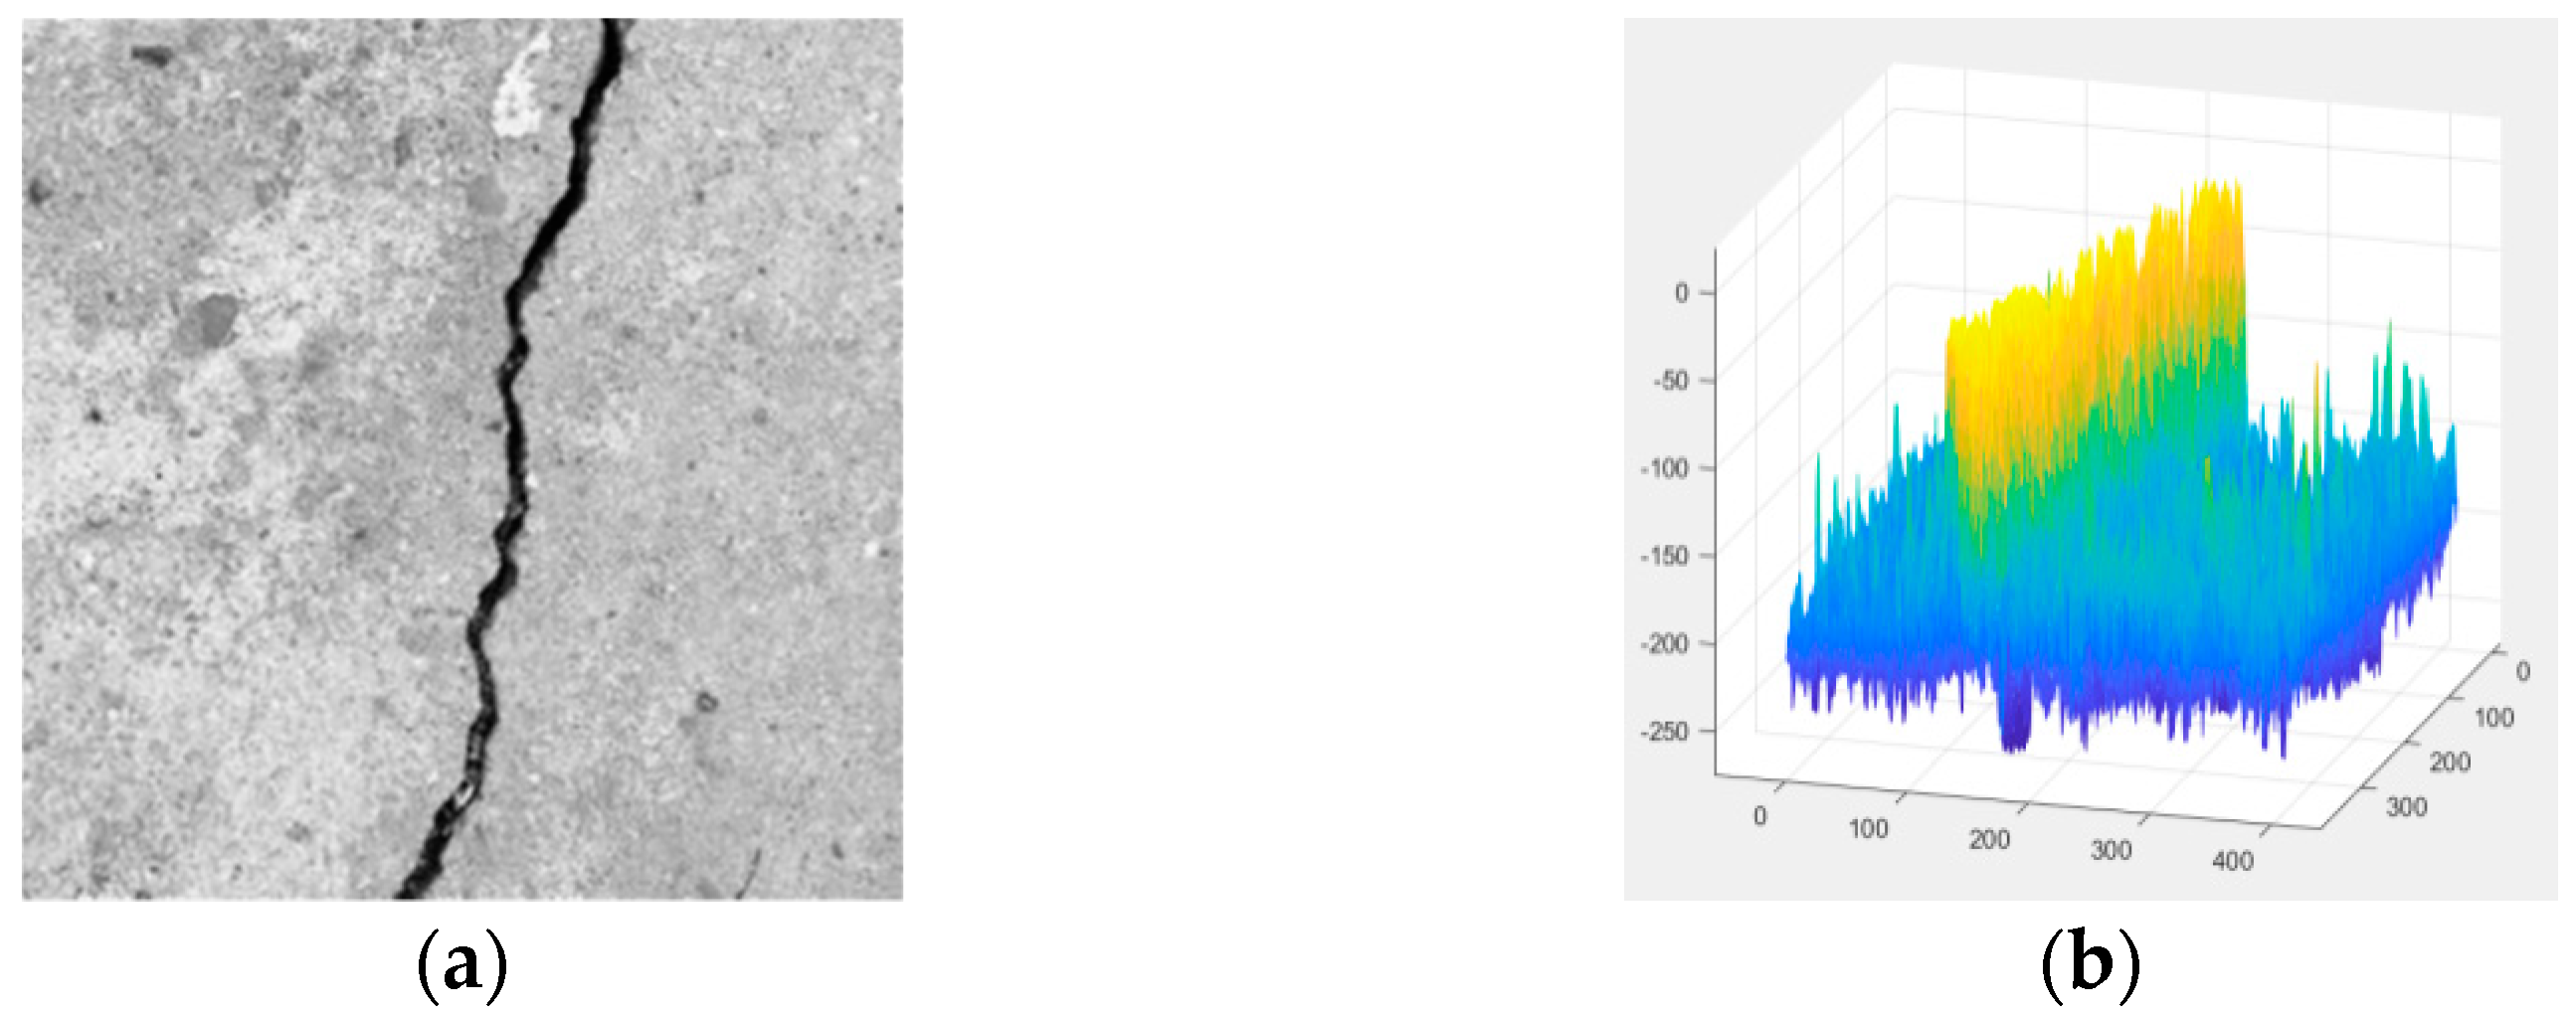
A fissure joint is a kind of cracking site caused by various stresses in nature during the formation of coal. The more fissure joints, the more serious the cracking phenomenon of the coal seam, and the instability of the coal seam structure, and the fewer fissures and joints, the more stable the coal seam structure is. There is a high correlation between the GSI of rock and fissure joints. The more fissure joints, the smaller the GSI, and the fewer fissure joints there are, the greater the geological strength is. Therefore, the fitting relationship between the GSI and the fissure joints can be explored, and the GSI can be expressed quantitatively through the extraction of the characteristics of the fissure joints. As shown in Figure 2, (a) is rock fissure, (b) is 3D graph of gray value. The gray values of the fissures are clearly different. The fissures can be accurately detected by the following image processing methods.
  • Edge detection:
Edge detection can extract the edge information in the image, calculate the gradient amplitude, calculate the edge pixels, eliminate the non-edge pixels, and finally accurately locate the edge position.
2.
Binarization:
The image binarization can set the gray value of the pixel to 0 or 255 so that the whole image is set to black and white, which can more clearly show the crack joints of the coal image.
3.
Noise removal:
Noise removal can reduce the noise in the binary image, and the pepper and salt noise in the image can be eliminated through Gaussian filtering. The image contains a large number of non-crack pixels. By detecting the crack connected area, calculate the area of the connected area, and eliminate the noise whose area is less than the threshold.
4.
Skeleton connection:
In the process of fracture extraction, edge fracture will occur. At this time, the true length of the fracture cannot be detected. Therefore, skeleton connection is required to connect the fractured fractures.
Coal rock images contain false positive cracks, which need to be removed. The false positive cracks are mainly scattered dots, and the absolute value H of the length and width difference of the crack pixels and the number of false positive cracks of the crack pixel area A are calculated, as shown in Table 2 and Table 3.
Therefore, when the absolute value of the difference in coal fissure length and width is smaller, the smaller the area, the false positive proportion is higher.

3.3. Fracture Characteristic

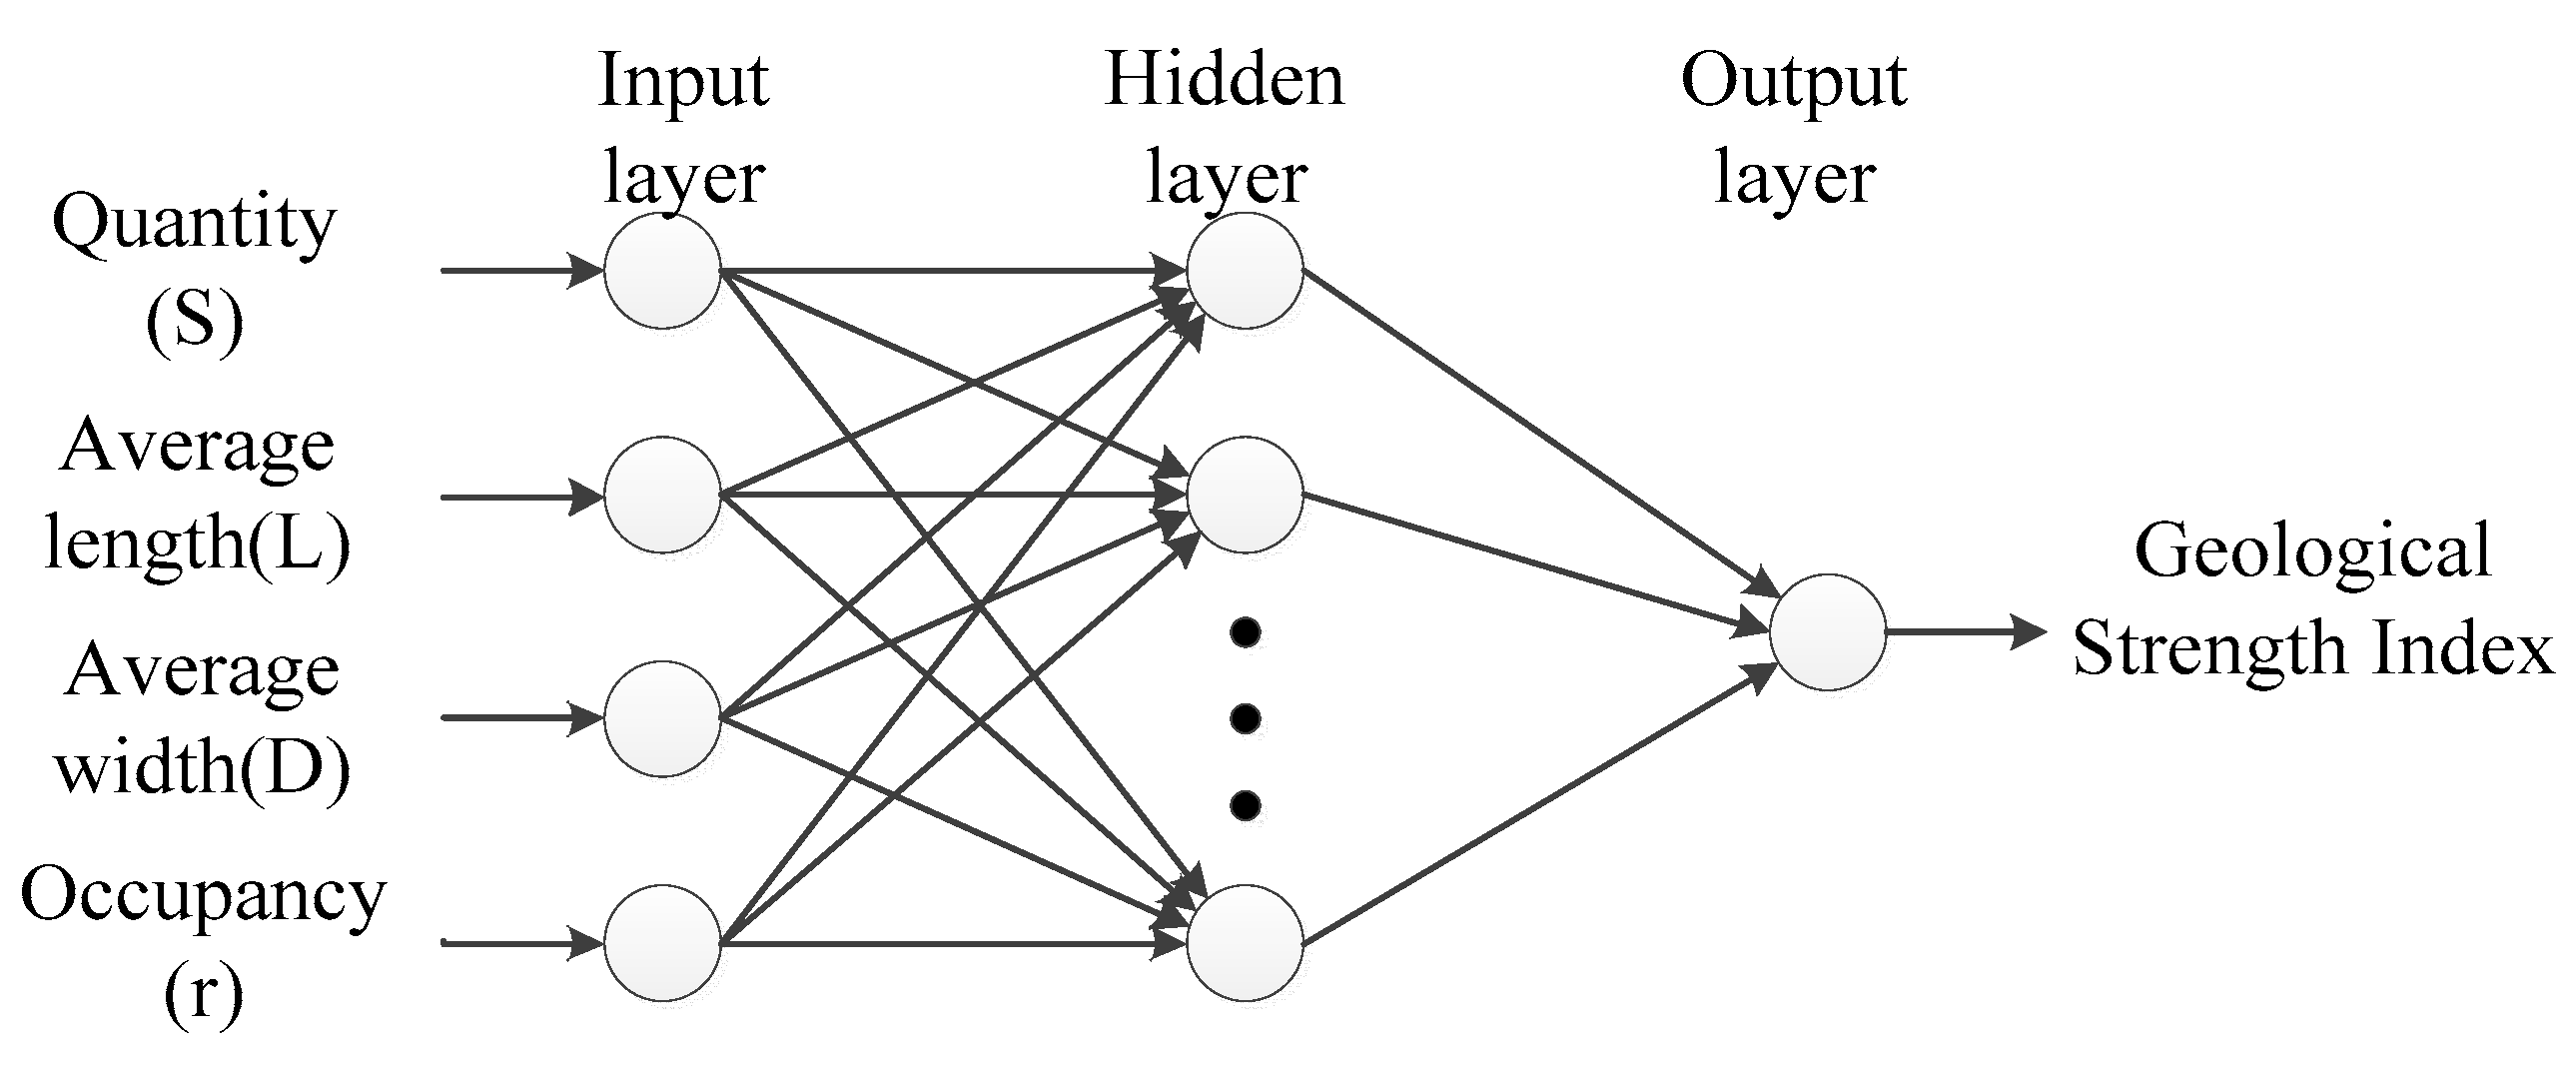
After obtaining a clear coal wall image, the characteristics of fracture joints can be visually expressed through the gray value three-dimensional view. The gray value of fracture pixels is significantly higher than that of surrounding non-fracture pixels. Through the calibration of the camera, the proportional relationship between the actual size of the image and the pixel size can be determined. In this way, the pixel size of the image crack can be calculated to correspond to the actual size of the crack joint. In this study, the number, average length, average width, and occupancy of fissure joints are used to characterize the geological strength index.
  • Quantity: the quantity of fissure joints in the image is calculated by calculating the lines with continuous gray values, and the line length needs to be greater than the set threshold.
  • Length: the length of the image corresponding to each pixel is known. The distance between horizontal or vertical adjacent pixels is 1 pixel interval, and the distance between 45° adjacent pixels is a pixel interval. The crack joint length is the product of the number of central points of the contour skeleton and the length of a single pixel:
    L = ( n + 2 m ) ε
    where L is the crack length, n is the number of horizontally or vertically adjacent pixels on the centerline, m is the number of 45° adjacent pixels on the centerline, and ε is the length of a single pixel.
  • Width: make a vertical line on the skeleton centerline of the fracture joint. The width of the fracture is the product of the number of vertical lines of the skeleton centerline of the contour and the length of a single pixel:
    D = ( p + 2 q ) ε
    where D is the crack width, p is the number of horizontally or vertically adjacent pixels on the vertical line, q is the number of 45° adjacent pixels on the vertical line, and ε is the length of a single pixel.
  • Occupancy: The occupancy rate can reflect the complexity of fissure joints in the image, which is determined by the ratio of the number of pixels of fissure joints to the number of pixels of non-fissure joints in the image.
Count the characteristic values of coal wall sample images, including fissure and non-fissure images. The characteristic values of some samples are shown in the Table 4:

3.4. GA-BP Neural Network

In the process of detecting the geological strength index of coal seam fractures and joints, the geological strength index often needs to be determined by multiple parameters, in which there is an accurate mapping relationship. ANN has incomparable advantages in handling the internal relations of such complex nonlinear systems, so ANN is used to train and test the coal rock samples. the fitting relationship between the geological strength index GSI and the fracture characteristics can be determined through the artificial neural network.
As shown in Figure 3, the artificial neural network structure applied to the identification of GSI consists of three layers, with the number of coal wall fissure joints s, average length L, average width D, and occupancy as the input layer and the GSI as the output layer. The training samples and test samples are mainly from the on-site images of the heading face in the coal mine. After the optimization of the artificial neural network controller, the stability and convergence of the output GSI achieve the best effect.
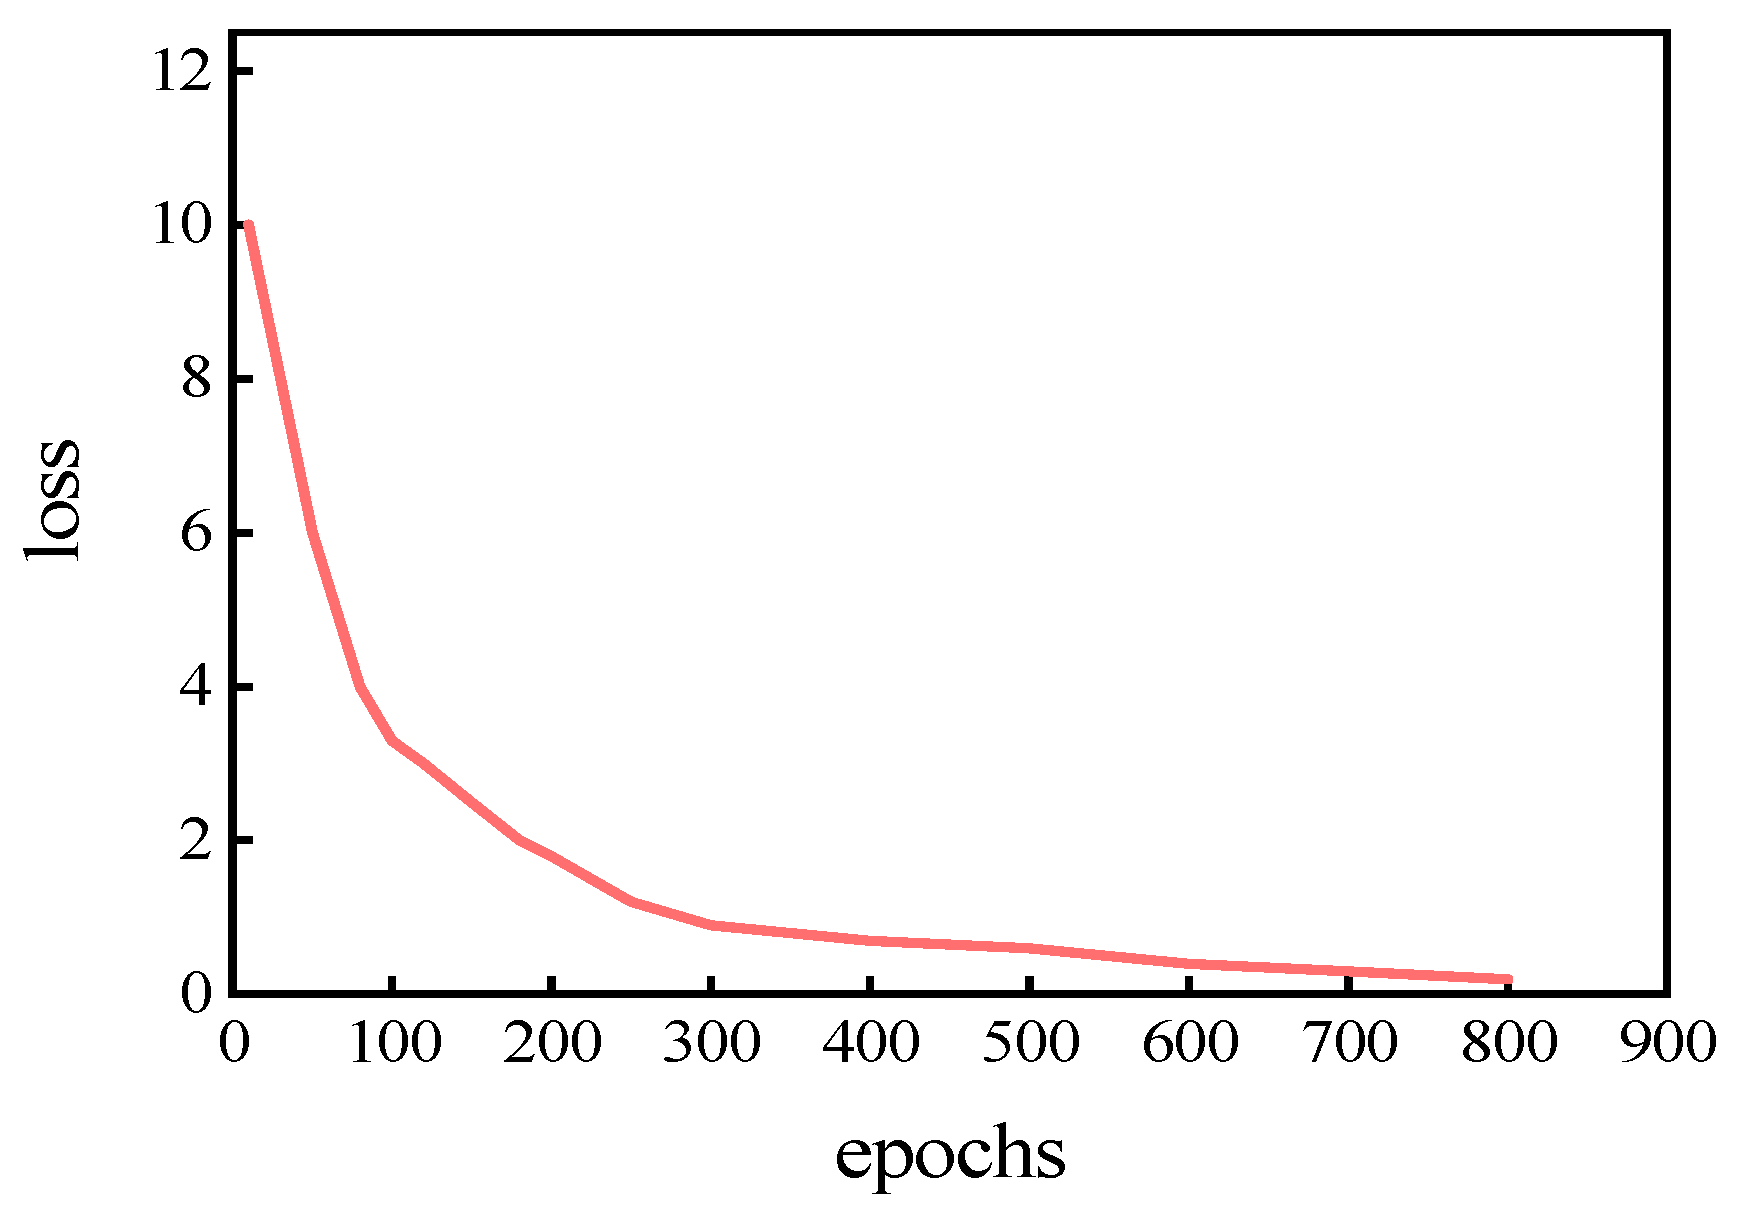
In the designed BP neural network, the training function is traingda, the hidden layer activation function is logsig, the output layer activation function is purelin, the set maximum iteration number is 1000, the learning rate is 0.01, the learning rule is the error gradient descent method, and the number of neurons in the hidden layer is 10. The total collected data was 1000 groups, mainly from multiple different coal wall images, with 800 groups as training set and 200 groups as test set.
In this study, genetic algorithm was used to optimize BP neural network (GA-BP), whose input matrix of p = [ S , L , D , r ] , set the individual population of 40, maximum genetic generation number of 500, variable dimension of 4, binary number of 20, and 0.9. The results showed that the optimized neural networks have fewer iterations and faster convergence. The network update module is added to the designed GA-BP neural network model to update the GA-BP model by importing historical data to improve the accuracy and applicability of the model.
The iteration error of the GA-BP neural network model is shown in Figure 4:
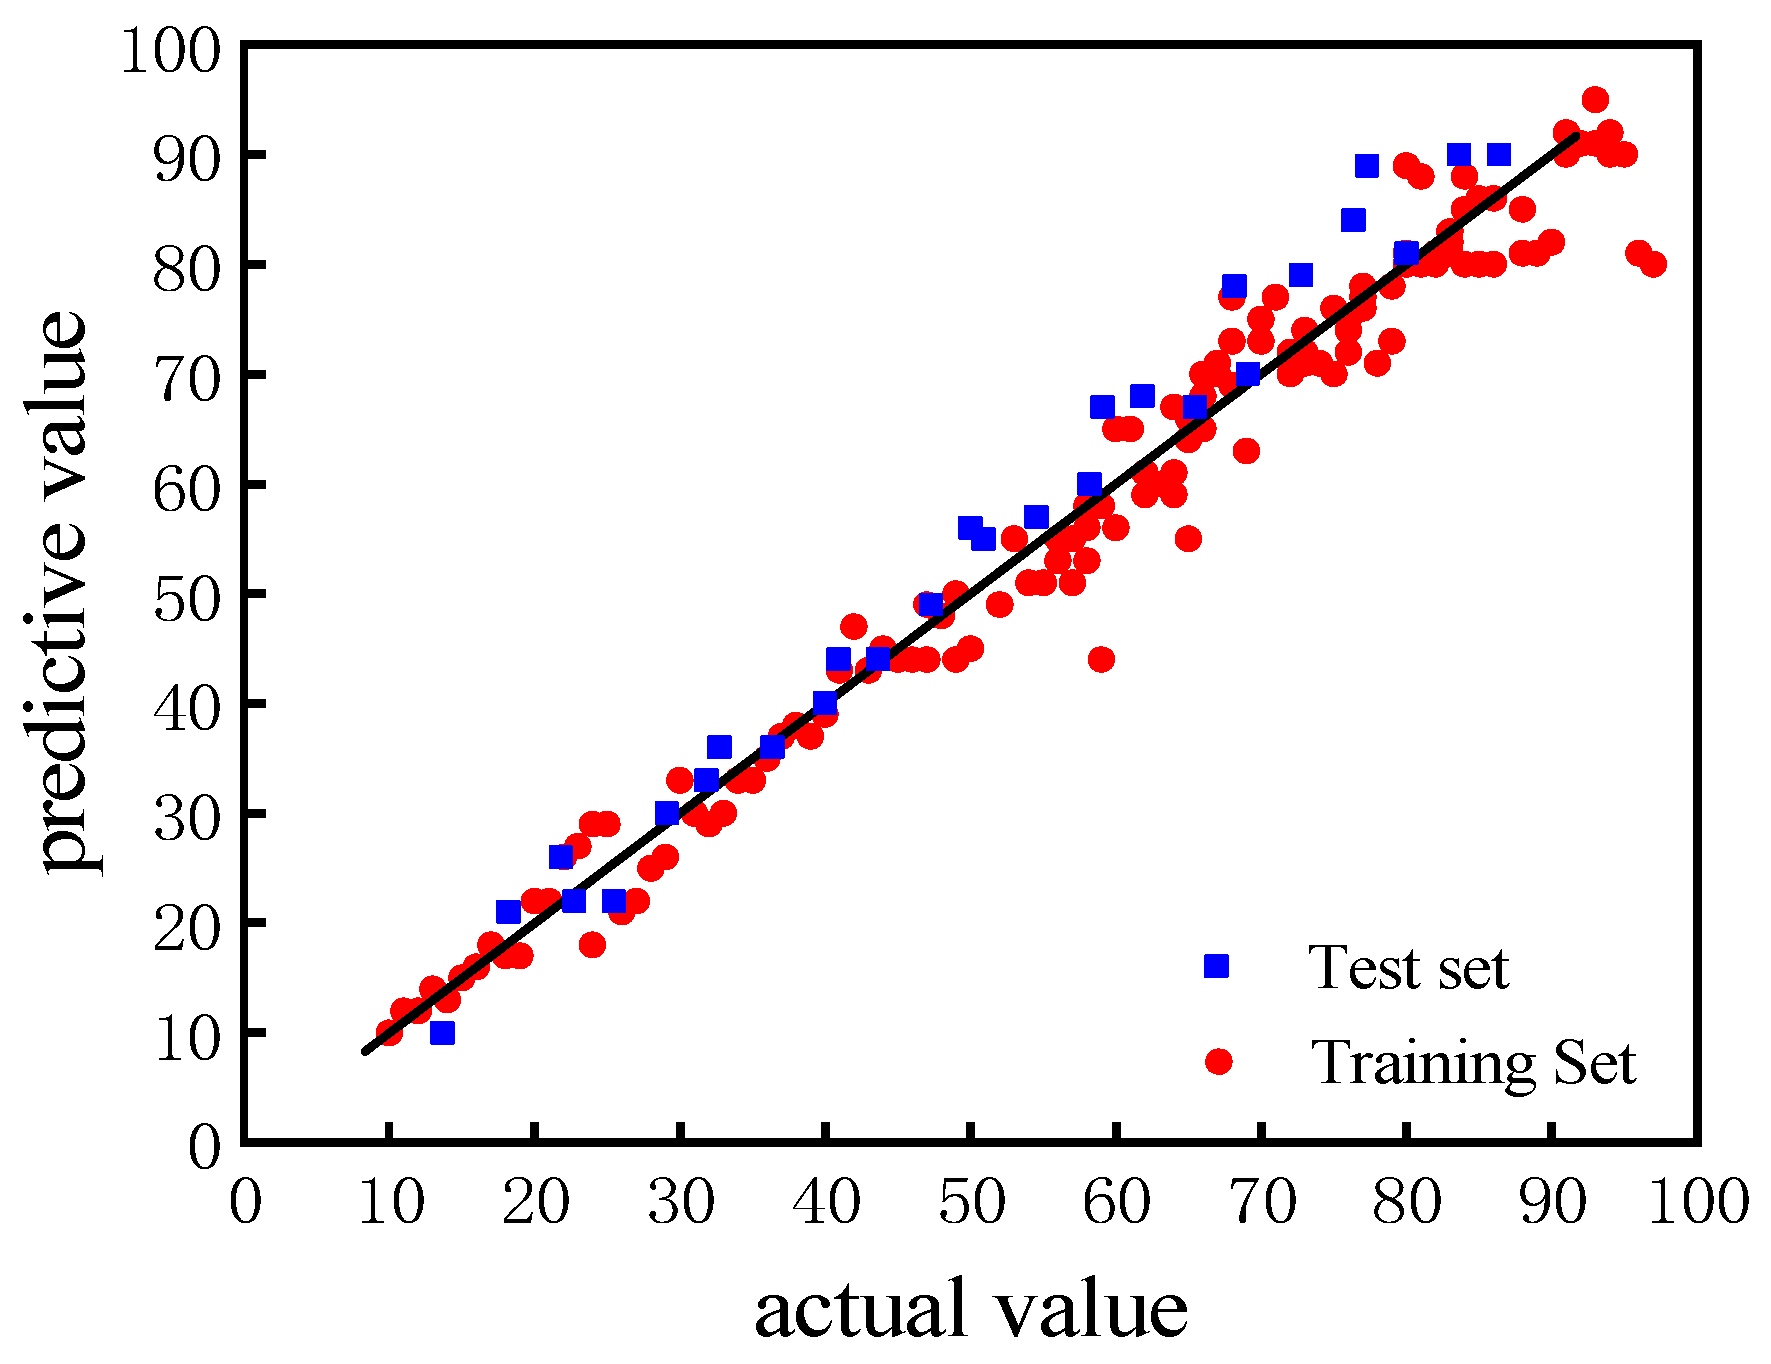
The error between the predicted value of the GA-BP neural network model and the actual value is shown in Figure 5:

4. Automatic Cutting Control Strategy

4.1. Fractal Dimension

Fractal dimension is a mathematical term, which is a set of mathematical theories with fractal characteristics as the research theme. The fractal theory is a new geometric theory that takes irregular geometry as its research object. It mainly studies the similarity between local form and overall form. After studying the curve characteristics of the coastline, Mandelbrot found that the long-distance coastline is very similar to the enlarged two photos of the short-distance coastline and gave a simple and intuitive fractal definition: set a, if the part of a is similar to the whole in some way, a is called a fractal set [31,32].
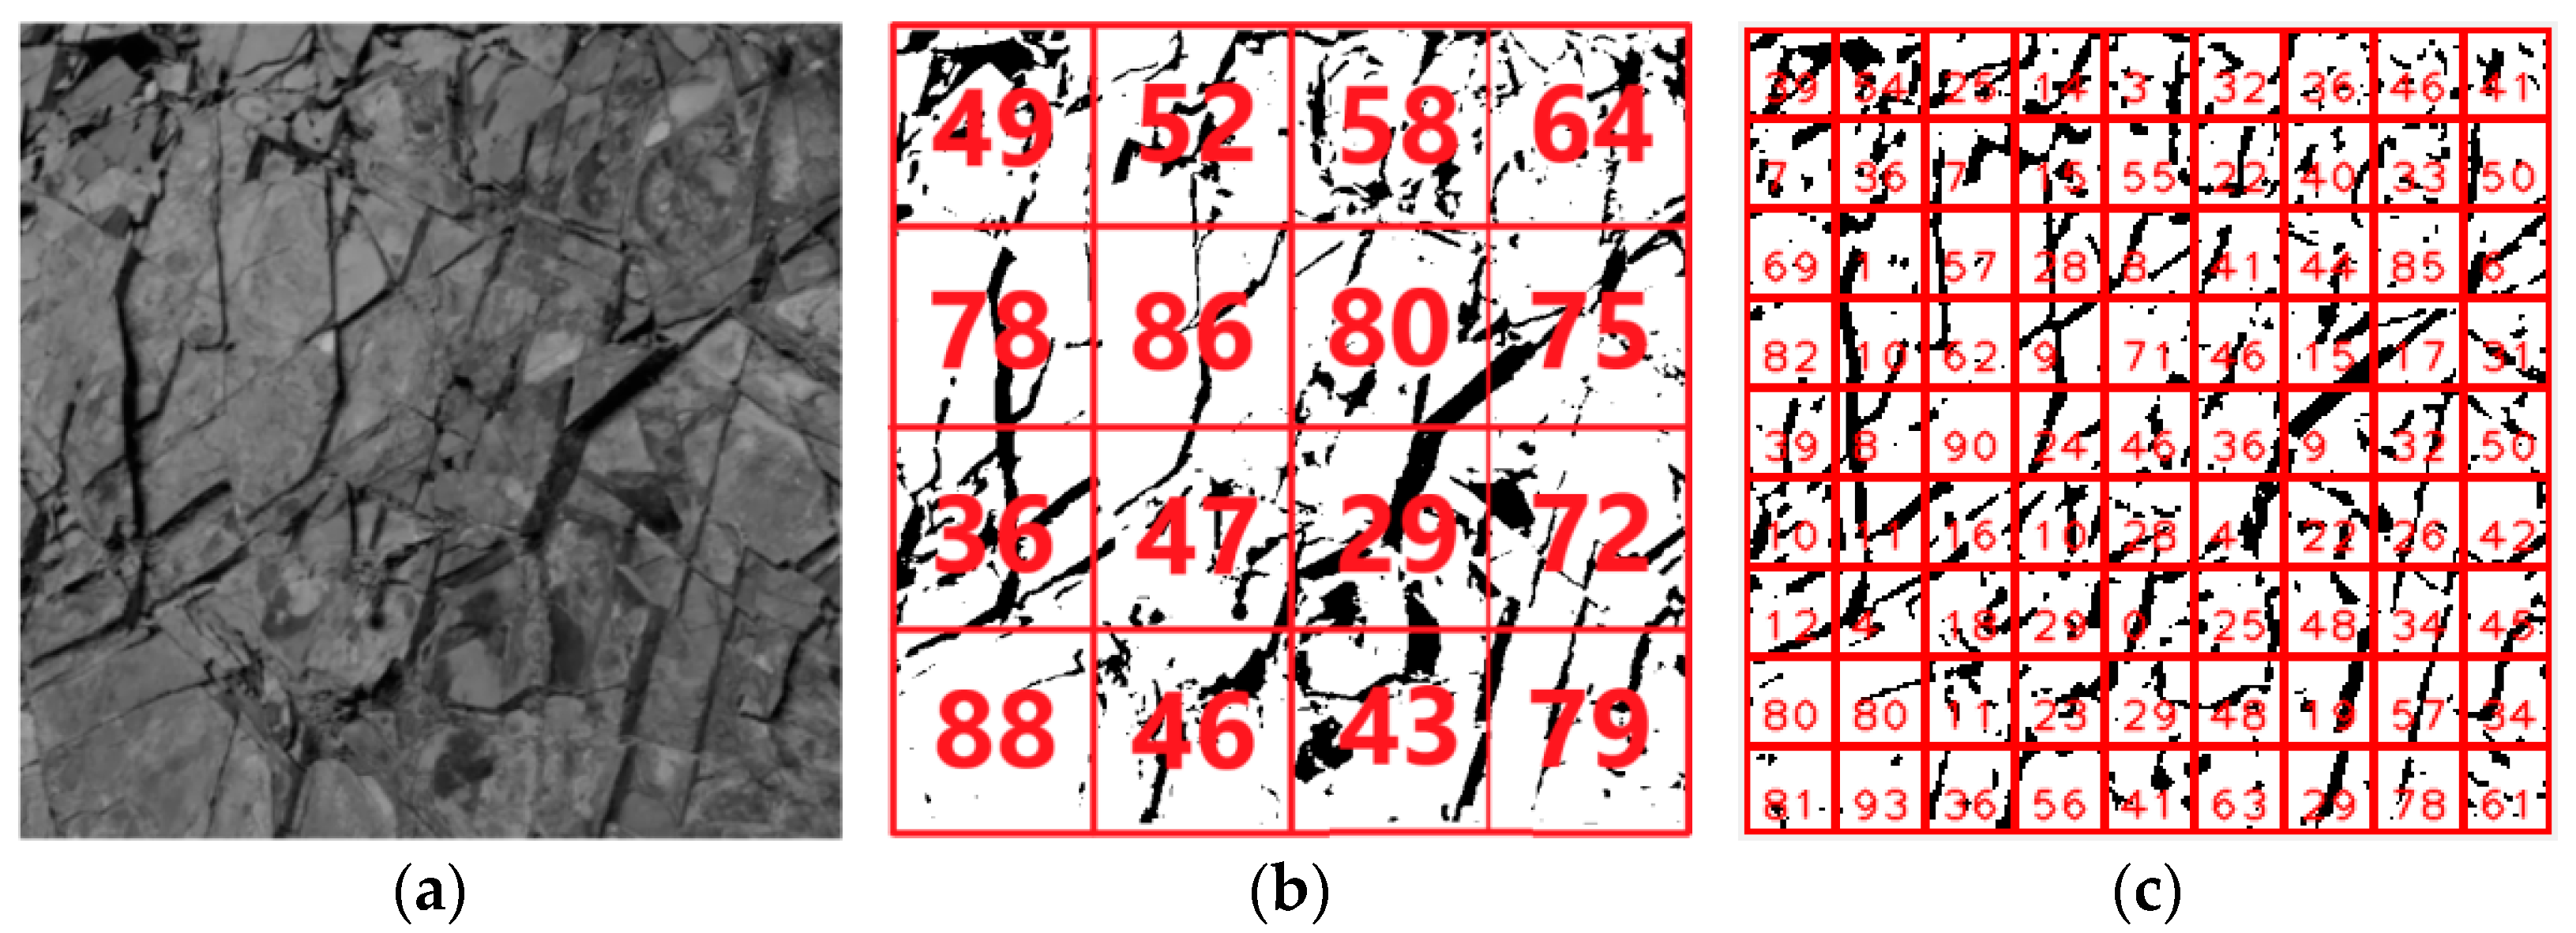
The fractal dimension theory is used to analyze the fracture joints of the coal wall of the heading face. The coal wall of the heading face is meshed, the fracture characteristics in each grid are extracted, and the geological strength index of each grid is calculated, which can characterize the rock strength of the corresponding position, so as to obtain the rock strength distribution of the whole coal wall.
As shown in Figure 6, (a) is the original image of the coal wall of the heading face, (b) is the grid image that divides part of the coal wall into dimensions, and (c) is the grid image that divides part of the coal wall into dimensions. The corresponding geological strength index is displayed in each grid, which can quantify the coal wall fracture. In this study, an image is divided into grid images, and the GSI in each grid are calculated and displayed in the grid. The larger the fractal dimension is, the higher the number of grids is, and the more accurate the detection accuracy is.

4.2. Control Strategy

The cutting arm of boom-type roadheaders mainly has horizontal and vertical swing modes. The horizontal swing is driven by the rotary oil cylinders on both sides. When the roadheader swings to the left, the oil cylinder on the left extends and the oil cylinder on the right shortens; when the roadheader swings to the right, the left cylinder shortens, and the right cylinder extends. The vertical swing is driven by a pair of lifting cylinders. When the cutting arm swings upward, the lifting cylinders on the left and right sides extend at the same time; when the cutting arm swings downward, the lifting cylinders on the left and right sides are shortened at the same time. The cutting head rotates counterclockwise, and the speed is controlled by the frequency converter of the roadheader. Changing the frequency of the frequency converter of the roadheader can adjust the rotation speed of the cutting head.
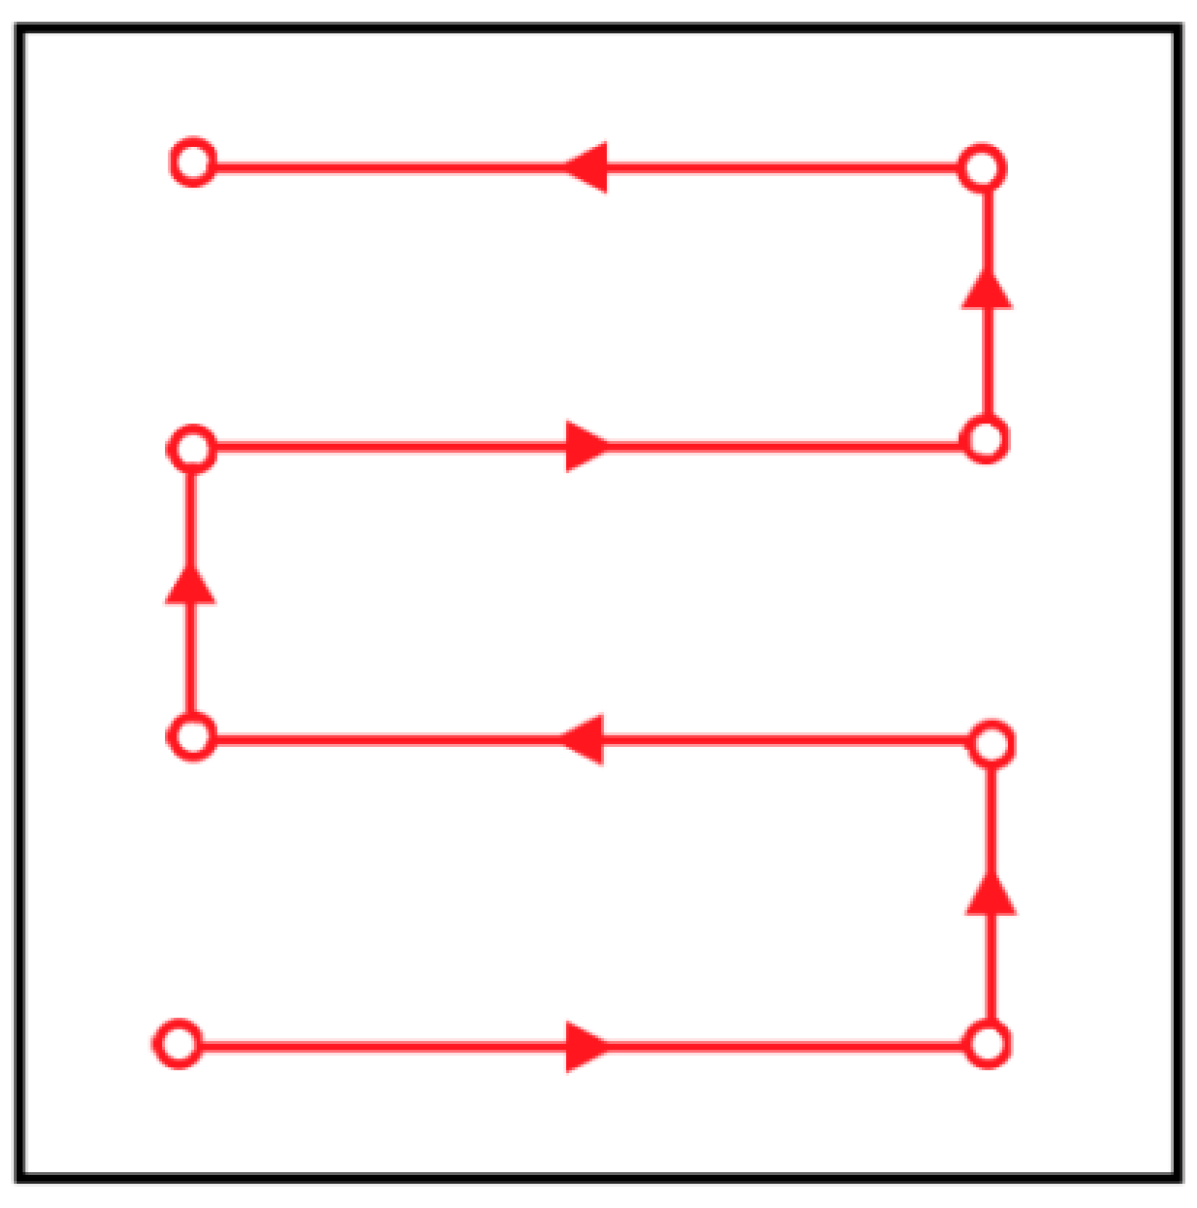
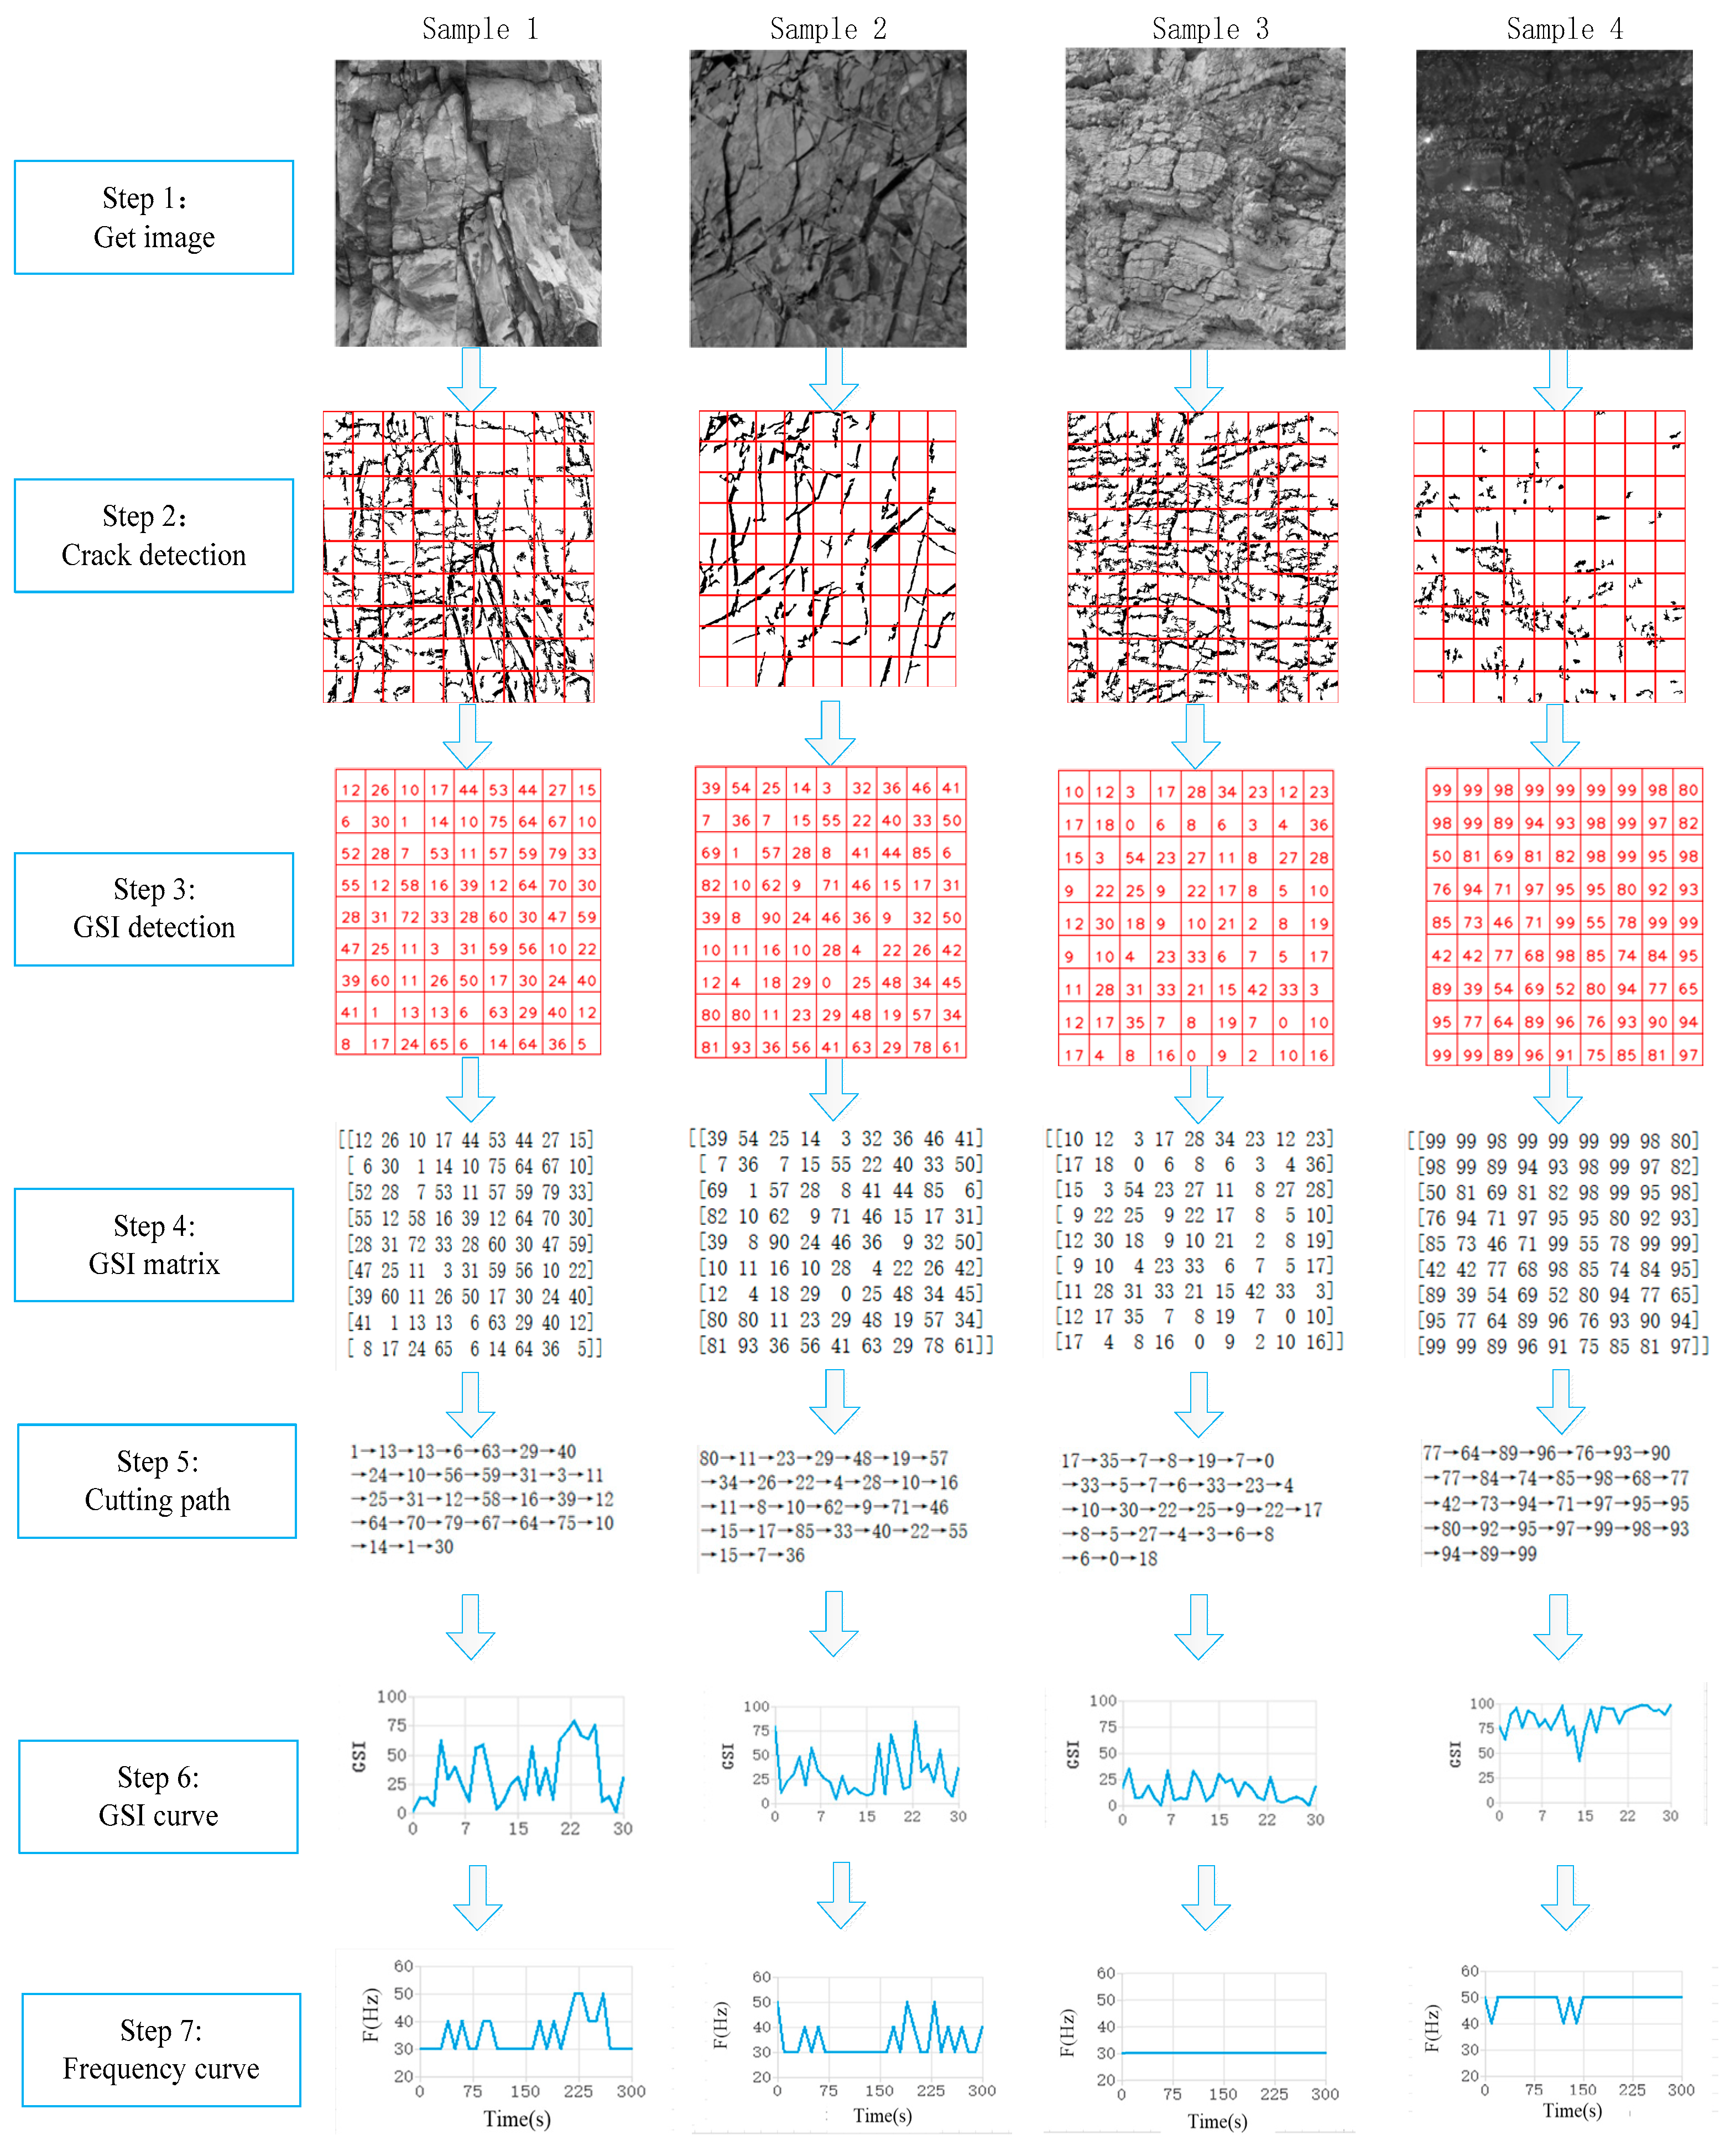
The cutting process of the roadheader is the lifting oil cylinder drives the cutting arm to swing vertically, and the rotary oil cylinder drives the cutting arm to swing horizontally. While the cutting arm swings, the cutting head operates at high speed to cut the coal wall, and the coal falls under the cutting head and is transported through the belt conveyor. The cutting path is the cutting arm starts from the lower left corner, swings horizontally to the right, reaches the predetermined boundary on the right side of the coal wall, cuts upward a certain height along the vertical direction, cuts horizontally and reversely to the predetermined boundary on the left, and then cuts vertically upward. This repeatedly realizes the cutting of the section of the heading face. The cutting path is shown in Figure 7.
Adaptive cutting is mainly divided into two modules: visual detection module and cutting head control module, as shown in Figure 8. The visual detection module obtains the coal wall image through the explosion-proof industrial camera and obtains the coal wall fracture and joint map through the image processing technology. By analyzing the characteristics of the fracture and joint, the corresponding GSI is calculated according to the factors such as the number, length and width of the fracture, and the image is divided into grids using fractal dimension to display the GSI in each grid. The cutting head speed control module adaptively controls the rotation speed of the cutting head according to the geological strength index of each grid during the cutting process. The greater the geological strength index is, the higher the strength of coal and rock is, and the speed of cutting head increases. The smaller the GSI is, the lower the strength of coal and rock is, and the speed of cutting head decreases.
The geological strength index is imported into the PID control module to improve the stability and efficiency of the speed control of the cutting head, and then the speed of the cutting head is controlled by controlling the frequency of the explosion-proof frequency converter to realize the automatic speed regulation of the cutting head following the geological strength index. The parameters of PID controller are automatically adjusted by adaptive algorithm. Because of its simple structure, good stability and easy adjustment, it has been widely used in industrial process control. The control equation for the PID controller is:
v ( t ) = K P [ δ ( t ) + K I 0 t δ ( t ) d t + K D d δ ( t ) d t ]
where v(t) is the intercept speed output value, δ ( t ) is the difference between the intercept output current and the set current, KP is the proportional coefficient, KI is the integral coefficient, KD is the differential coefficient, and the PID controller adjusts the intercept speed by taking the value of the three coefficients.
The correction module obtains the real-time running current of the roadheader through the current sensor installed on the boom-type roadheader and corrects the visual analysis results through the real-time current. Considering the considerable instability of visual detection, the current correction module is added to reduce the error of visual detection.
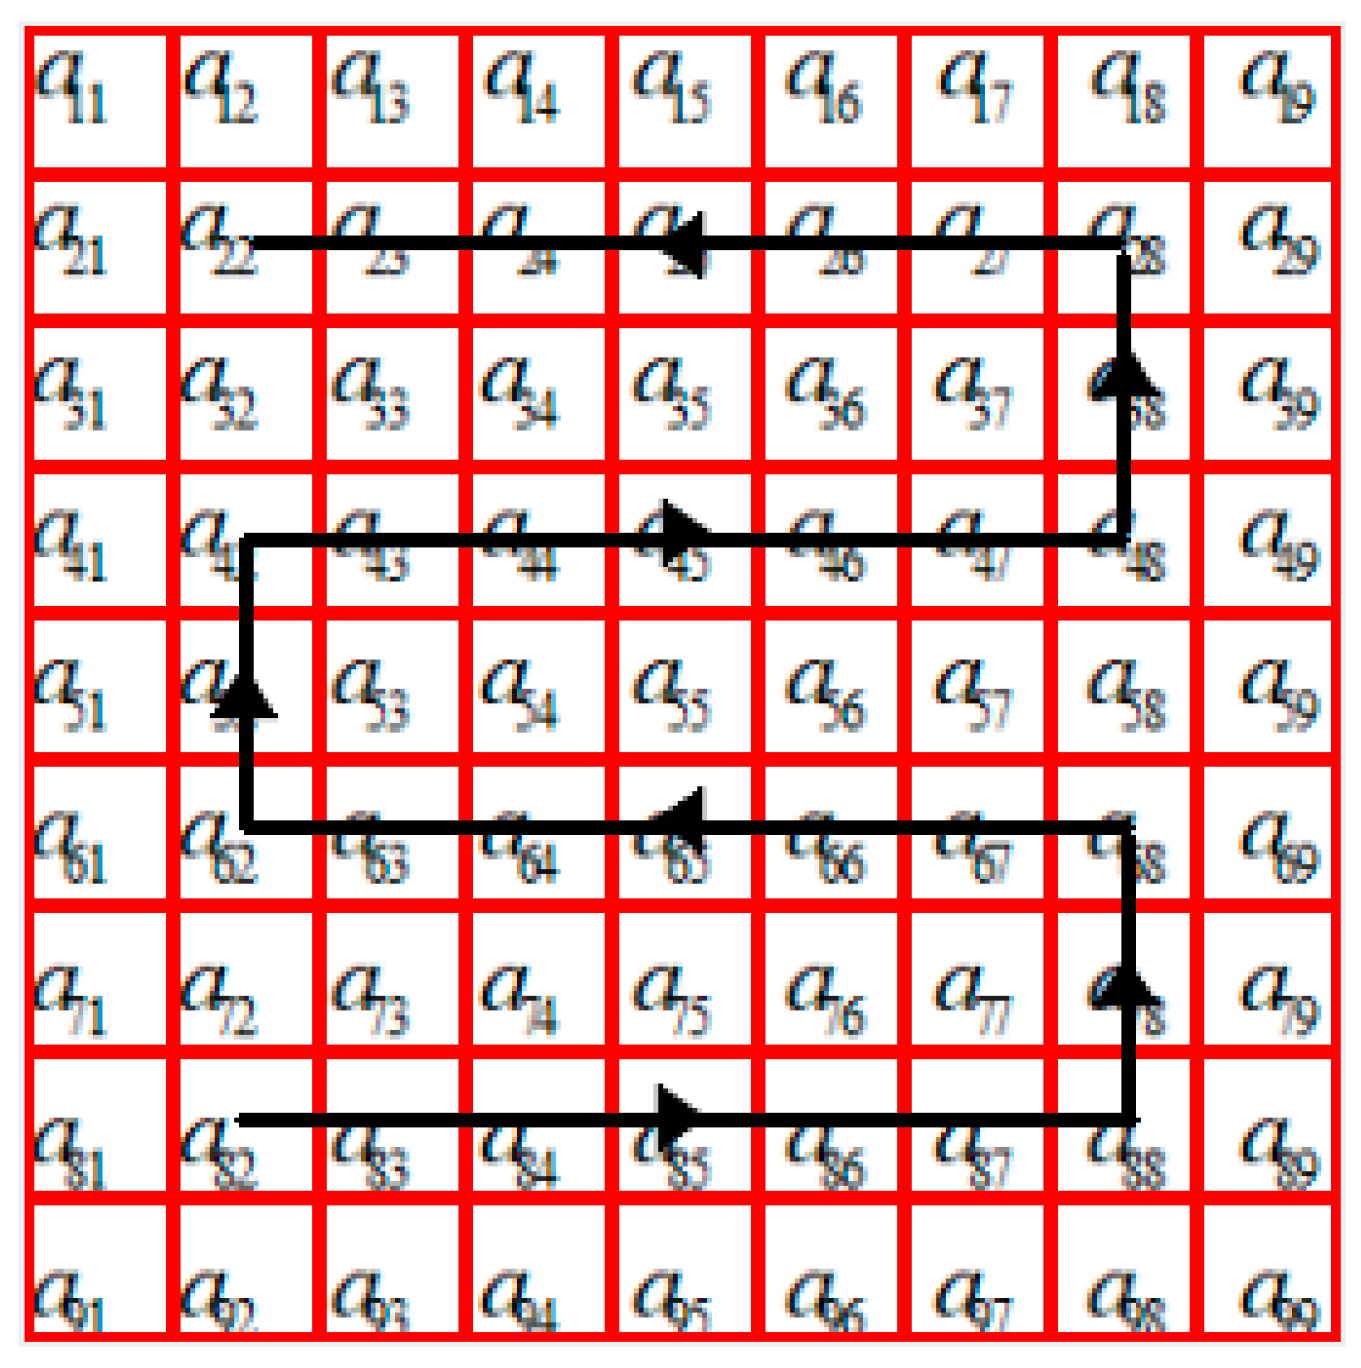
As shown in Figure 9, after obtaining the coal wall image, detect and recognize the crack and joint characteristics of the coal wall, and divide the image into 9 using fractal dimension ×9 grid, calculate the geological strength index according to the crack and joint conditions in each grid, and display the geological strength index in the grid. In order to reduce the error of the GSI and increase the robustness of the system, this method uses mean filtering to smooth the data. By detecting the coordinates of the target points and the mean value of the GSI in the surrounding eight grids, the GSI of the target grid is assigned, and the GSI of the grid is transformed into the corresponding 9 × 9 matrix A, which is represented as follows:
A = [ a 11 a 12 a 13 a 14 a 15 a 16 a 17 a 18 a 19 a 21 a 22 a 23 a 24 a 25 a 26 a 27 a 28 a 29 a 31 a 32 a 33 a 34 a 35 a 36 a 37 a 38 a 39 a 41 a 42 a 43 a 44 a 45 a 46 a 47 a 48 a 49 a 51 a 52 a 53 a 54 a 55 a 56 a 57 a 58 a 59 a 61 a 62 a 63 a 64 a 65 a 66 a 67 a 68 a 69 a 71 a 72 a 73 a 74 a 75 a 76 a 77 a 78 a 79 a 81 a 82 a 83 a 84 a 85 a 86 a 87 a 88 a 89 a 91 a 92 a 93 a 94 a 95 a 96 a 97 a 98 a 99 ]
The geological strength index along the cutting path is:
a 82 a 83 a 84 a 85 a 86 a 87 a 88 a 78 a 68 a 67 a 66 a 65 a 64 a 63 a 62 a 52 a 42 a 43 a 44 a 45 a 46 a 47 a 48 a 38 a 28 a 27 a 26 a 25 a 24 a 23 a 22
The cutting head swings along the planned path. The cutting head passes through different grids, and the speed of the cutting head is adjusted according to the geological strength index GSI value in the grid. The speed mode of the cutting head of the roadheader is divided into three modes: high speed, medium speed, and low speed. The speed mode of the cutting head can be switched by adjusting the frequency of the frequency converter of the roadheader, so as to realize the automatic speed regulation of the cutting head of the roadheader. The geological strength index is in the range of 0–35, and the speed of cutting head is low. The geological strength index is in the range of 35–70, the cutting head speed is medium, and the geological strength index is in the range of 70–100, the cutting head speed is high, as shown in Table 5.

5. Experiments and Results

5.1. Establishment of Experimental Platform

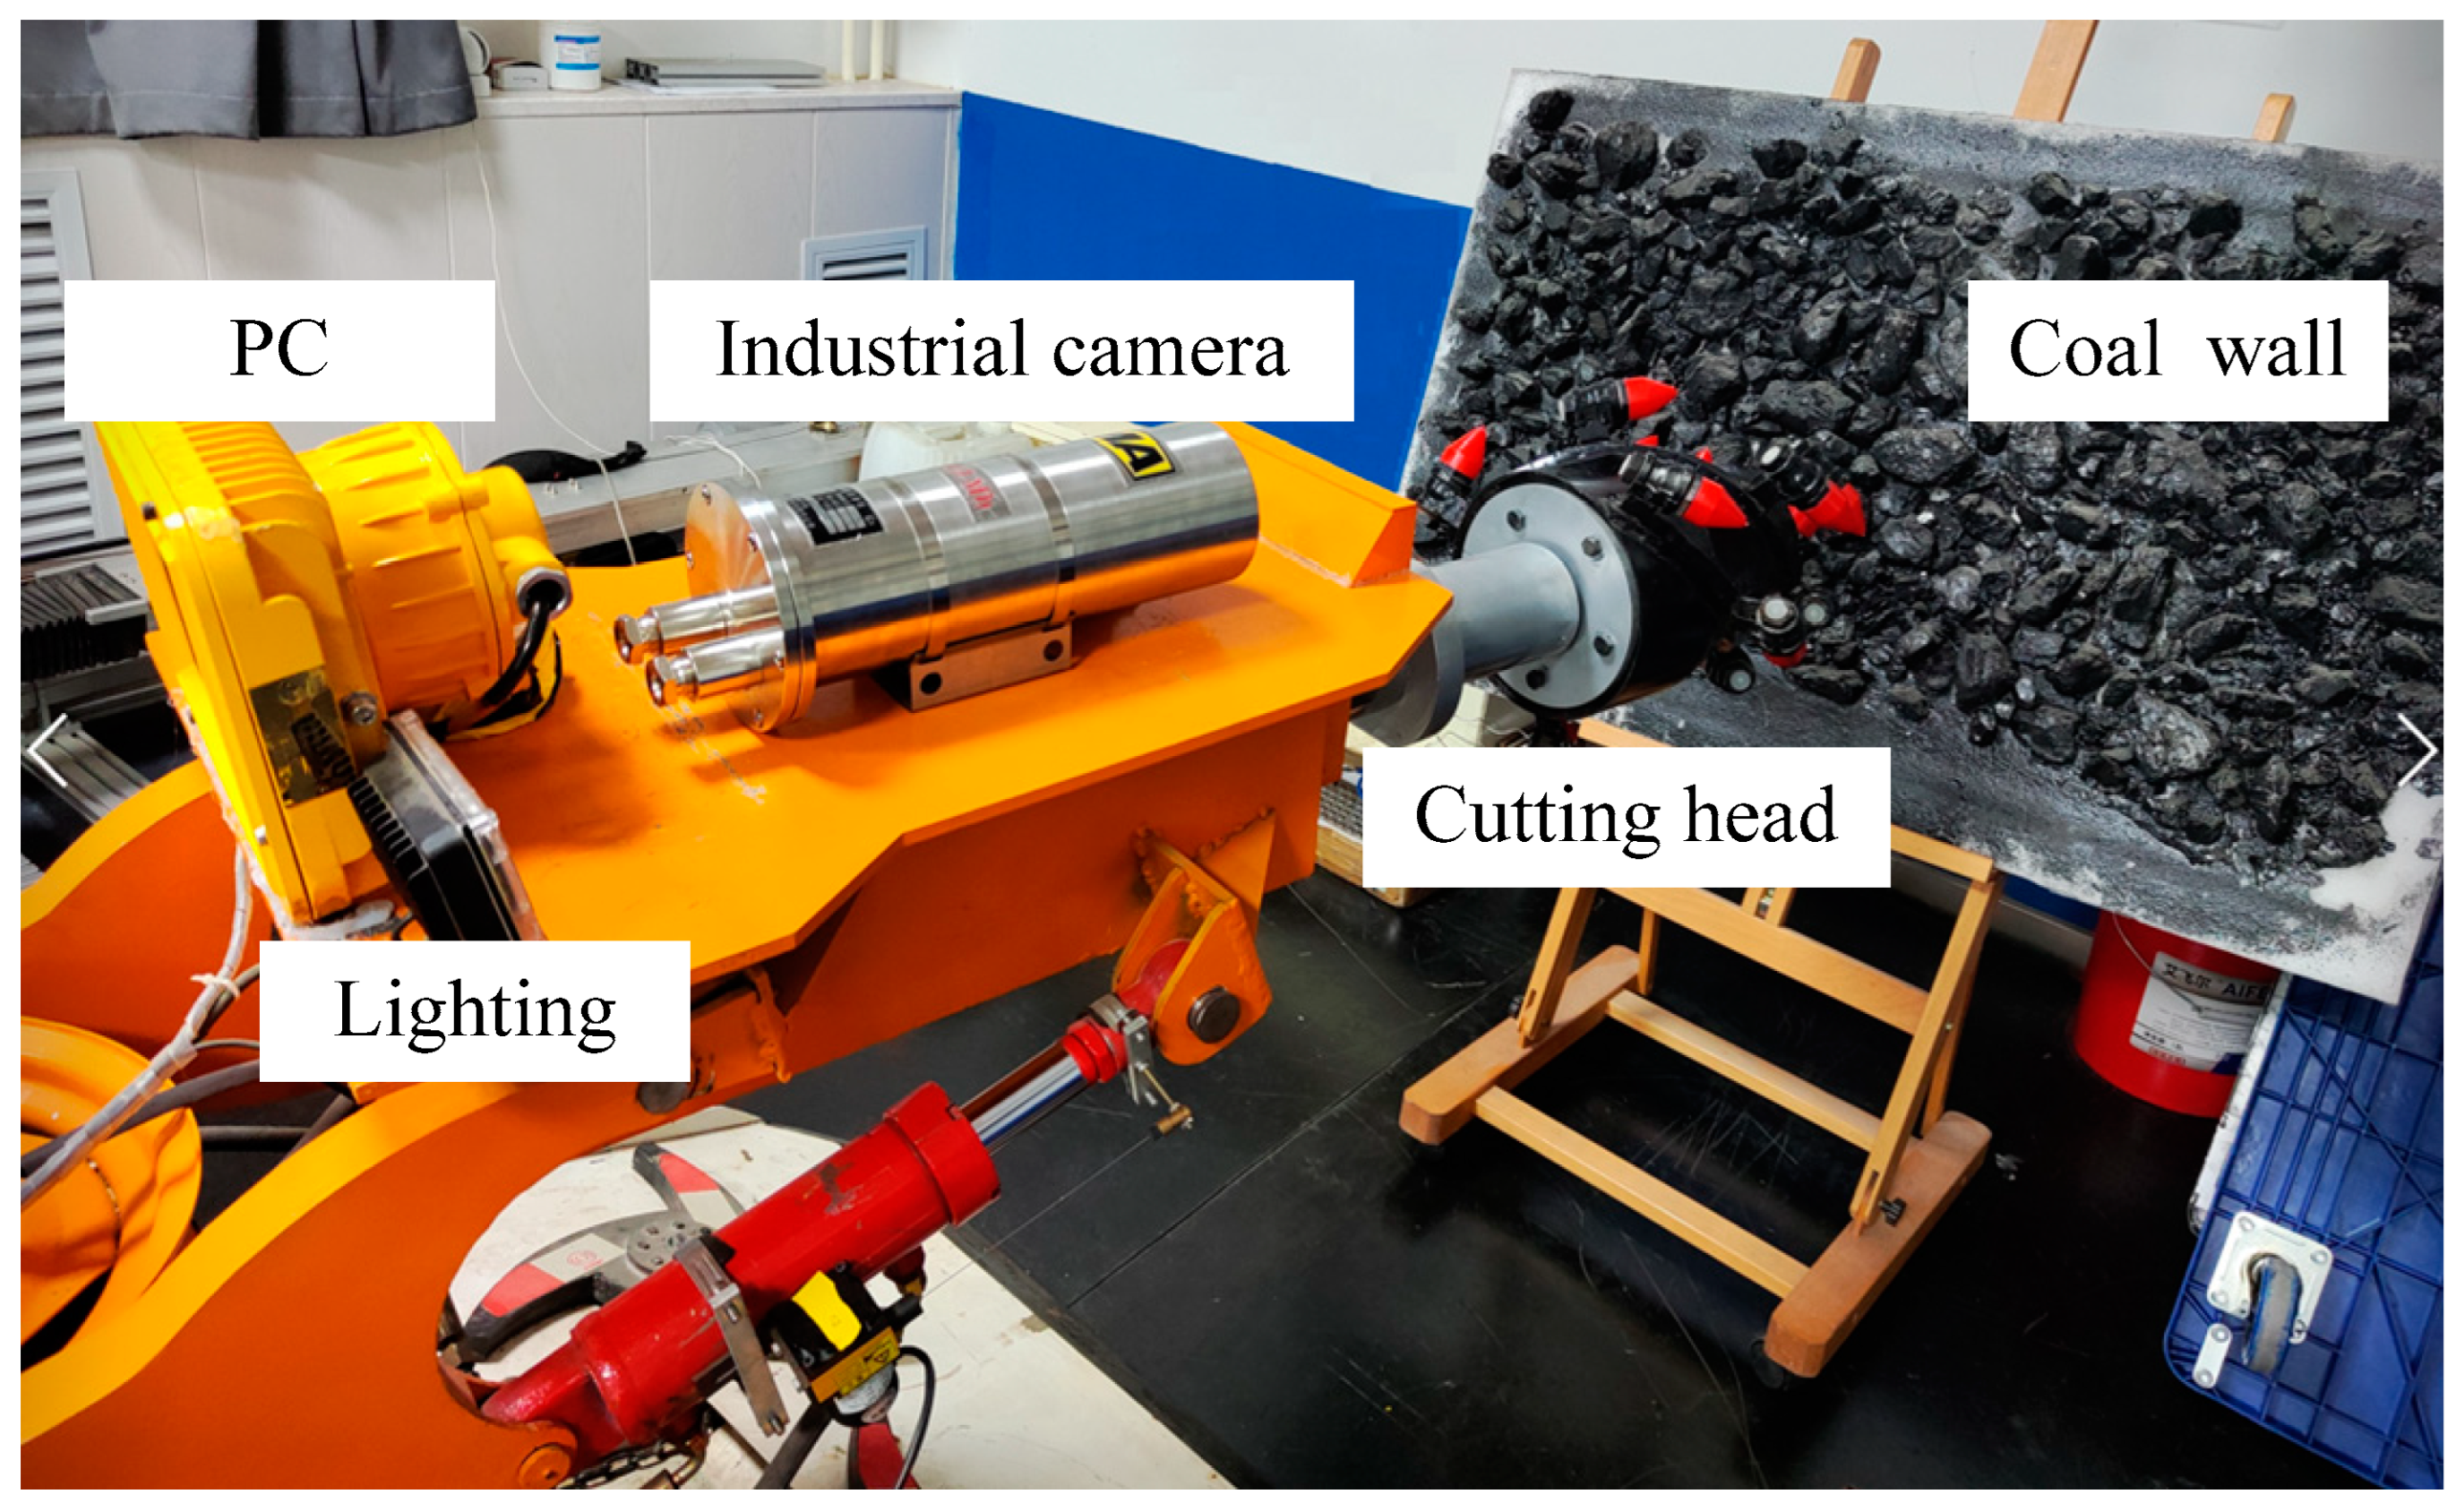
An intelligent boom-type roadheader platform is built in the laboratory to simulate the working environment of the coal mine heading face. The experimental model is the EBZ160 boom-type roadheader, a 5:1 reduced roadheader. The upper computer control program runs in the industrial computer, is written with Visual Studio software, and calls OpenCV for image processing. Mitsubishi FX3U-64M is selected as the PLC control system to monitor the running state of the roadheader. The explosion-proof camera uses Xi’an WEISHI CCD industrial camera, the model is mv-em-510c, and the resolution is 2456 × 2058, with a frame rate of 15 fps, and can stably obtain clear images. The camera has the advantages of a compact body and low power consumption. The laboratory roadheader is shown in Figure 10.
During the operation of the roadheader, image processing, and data analysis are completed in the high-performance industrial control computer, and the visual interface is also used for human–computer interaction in the industrial control computer. The lower computer is PLC programmable logic controller. The sensors include a current sensor, oil cylinder hydraulic sensor, speed sensor, frequency converter, etc., which are used to detect the swing speed of the cutting arm and the rotation speed of the cutting head of the boom-type roadheader.
Considering the influence of underground lighting in the coal mine on the quality of image acquisition, lighting devices were installed in front of the boring machine, and three incandescent lamps of different power were purchased. Image acquisition was performed in the dark laboratory using incandescent lamps with different power separately, and the experimental results showed that the image clarity increased with the increasing incandescent lamp power. Therefore, it is very necessary to keep the system in sufficient light during operation.

5.2. Coal Wall Sample

In order to verify the accuracy of the geological strength index value of machine vision detection in this study, the coal wall images of heading face with different fractures taken in the coal mine site are used for analysis.
The GSI value is estimated according to the GSI chart, and then the method of this study is used to detect the coal wall image. The estimated and detected values of some samples are shown in Table 6. Comparing the estimated value with the detected value, it can be found that the maximum relative error is 3.5%, which can meet the detection requirements.

5.3. Cutting Experiment

In the cutting experiment, the coal wall image of the heading face is printed as 1 m×1 m and is placed directly in front of the EBZ160 boom-type roadheader to simulate the underground cutting environment of the coal mine. Ensure that the camera takes pictures of the drawings completely, and detects the joints clearly. Then, calculate the cutting parameters. The total length of the cutting path is 3 m, the total cutting time is 300 s, the lateral swing speed of the cutting arm is 0.01 m/s, and the longitudinal swing speed of the cutting arm is 0.01 m/s. The frequency of the cutting is automatically adjusted according to the current geological strength index of the path. The operation steps of some samples are shown in Figure 11.
Select the coal wall images of different heading faces as experimental materials and record the speed of constant speed operation and visual inspection automatic speed regulation operation of the heading machine under a no-load state. The energy consumption produced by the two methods is detected by an electricity meter. The power of the experimental cutting motor is 55 kW, and some of the energy consumption data are shown in Table 7. It can be concluded that the energy consumption of the roadheader using visual inspection automatic speed regulation operation is about 5.4% lower than that of constant speed operation, which shows that the method of this study can carry out frequency conversion speed regulation of the cutting head and effectively reduce the energy consumption of the boom-type roadheader.

6. Conclusions

The paper aims at developing an automatic adaptive control procedure for cutting the speed of a roadheader. The proposed strategy is based on a two-stage methodology: a first step, for rock image acquisition and identification, to provide an automatic mapping of the front characterized in terms of the geological strength index; a second phase, providing the control process for cutting head, based on previous results, toward automatic and optimized cutting speed control strategy. Compared with the traditional manual comparison estimation method, this method has higher detection accuracy and faster detection speed and effectively quantifies the coal rock geological strength index. The laboratory established the cutting model of the roadheader, and the operation results showed that the cutting head can be automatically adjusted for speed control according to the GSI, and the energy consumption is reduced by 5.4%, which has the effect of energy saving and consumption reduction. This method has certain theoretical and practical significance for protecting the structural parts of the cut head, extending the service life of the roadheader, and reducing the energy saving and consumption reduction of the coal mine machinery.

Author Contributions

Funding acquisition, X.Z.; investigation, M.L.; methodology, Z.D. and W.Y.; project administration, C.Z.; software, J.W.; supervision, X.Z.; visualization, L.H.; writing—review and editing, Z.D. All authors have read and agreed to the published version of the manuscript.

Funding

The authors give thanks to the financial support of The National Natural Science Founds of China (Grant No.52174150; Grant No.52104166) and Shaanxi Coal Joint Fund (Grant No.2021JLM-03).

Data Availability Statement

The data are available on request, subject to restrictions (e.g., privacy or ethical restrictions).

Acknowledgments

The study was approved by the College of Mechanical Engineering in Xi’an University of Science and Technology and Shaanxi Key Laboratory of Mine Electromechanical Equipment Intelligent Monitoring.

Conflicts of Interest

The authors declare no conflict of interest.

References

  1. Wang, G.F.; Ren, H.W.; Pang, Y.H. Research and engineering progress of intelligent coal mine technical system in early stages. Coal Sci. Technol. 2020, 48, 1–27. [Google Scholar] [CrossRef]
  2. Wang, G.F.; Du, Y.B. Development direction of intelligent coal mine and intelligent mining technology. Coal Sci. Technol. 2019, 47, 1–10. [Google Scholar] [CrossRef]
  3. Wang, H.; Wang, B.K.; Zhang, X.F. Key technology and engineering practice of intelligent rapid heading in coal mine. J. China Coal Soc. 2021, 46, 2068–2083. [Google Scholar] [CrossRef]
  4. Zhang, Y.B.; Liu, X.R.; Liu, X.; Wang, S.Y.; Ren, F.Y. Numerical characterization for rock mass integrating GSI/Hoek-Brown system and synthetic rock mass method. J. Struct. Geol. 2019, 126, 318–329. [Google Scholar] [CrossRef]
  5. Bertuzzi, R.; Douglas, K.; Mostyn, G. Improving the GSI Hoek-Brown criterion relationships. Int. J. Rock. Mech. Min. 2016, 89, 185–199. [Google Scholar] [CrossRef]
  6. Michalowski, R.L.; Park, D. Stability assessment of slopes in rock governed by the Hoek-Brown strength criterion. Int. J. Rock. Mech. Min. 2020, 127, 104217. [Google Scholar] [CrossRef]
  7. Marinos, P.; Hoek, E.; Marinos, V. Variability of the engineering properties of rock masses quantified by the geological strength index: The case of ophiolites with special emphasis on tunnelling. B. Eng. Geol. Environ. 2006, 65, 129–142. [Google Scholar] [CrossRef]
  8. Somodi, G.; Bar, N.; Kovács, L.; Arrieta, M.; Török, Á.; Vásárhelyi, B. Study of Rock Mass Rating (RMR) and Geological Strength Index (GSI) Correlations in Granite, Siltstone, Sandstone and Quartzite Rock Masses. Appl. Sci. 2021, 11, 3351. [Google Scholar] [CrossRef]
  9. Hoek, E.; Wood, D.; Shah, S. A modified Hoek-Brown criterion for jointed rock masses. In Proceedings of the Rock Characterization: ISRM Symposium, Eurock’92, Chester, UK, 14–17 September 1992; Thomas Telford Publishing: London, UK, 1992; pp. 209–214. [Google Scholar]
  10. Marinos, P.; Hoek, E. Estimating the geotechnical properties of heterogeneous rock masses such as Flysch. Bull. Eng. Geol. Environ. 2001, 60, 85–92. [Google Scholar] [CrossRef]
  11. Saeidi, A.; Cloutier, C.; Kamalibandpey, A.; Shahbazi, A. Evaluation of the Effect of Geomechanical Parameters and In Situ Stress on Tunnel Response Using Equivalent Mohr-Coulomb and Generalized Hoek-Brown Criteria. Geosciences 2022, 12, 262. [Google Scholar] [CrossRef]
  12. Chen, C.; Li, T.; Ma, C.; Zhang, H.; Tang, J.; Zhang, Y. Hoek-Brown Failure Criterion-Based Creep Constitutive Model and BP Neural Network Parameter Inversion for Soft Surrounding Rock Mass of Tunnels. Appl. Sci. 2021, 11, 10033. [Google Scholar] [CrossRef]
  13. Jearsiripongkul, T.; Keawsawasvong, S.; Thongchom, C.; Ngamkhanong, C. Prediction of the Stability of Various Tunnel Shapes Based on Hoek–Brown Failure Criterion Using Artificial Neural Network (ANN). Sustainability 2022, 14, 4533. [Google Scholar] [CrossRef]
  14. Cai, M.; Kaiser, P.K.; Uno, H.; Tasaka, Y.; Minami, M. Estimation of rock mass deformation modulus and strength of jointed hard rock masses using the GSI system. Int. J. Rock. Mech. Min. 2004, 41, 3–19. [Google Scholar] [CrossRef]
  15. Zhang, Q.; Huang, X.; Zhu, H.; Li, J. Quantitative assessments of the correlations between rock mass rating (RMR) and geological strength index (GSI). Tunn. Undergr. Space Tech. 2019, 83, 73–81. [Google Scholar] [CrossRef]
  16. Osgoui, R.R.; Unal, E. An empirical method for design of grouted bolts in rock tunnels based on the geological strength index (GSI). Eng. Geol. 2009, 107, 154–166. [Google Scholar] [CrossRef]
  17. Wang, P.J.; Yang, Y.; Wang, D.J. Intelligent cutting control system and method of coal and gangue in robotic roadheader. J. China Coal Soc. 2021, 46, 1124–1134. [Google Scholar] [CrossRef]
  18. Zong, K.; Fu, S.C.; Wu, M. Simulation of control strategy for swing speed of roadheader’s cutting arm based on GA-BP network. J. China Coal Soc. 2021, 46, 511–519. [Google Scholar] [CrossRef]
  19. Wang, S.Y.; Ma, D.C.; Ren, Z. A multi-objective optimization method for cantilever roadheader section forming trajectory. Chin. J. Sci. Instrum. 2021, 41, 183–192. [Google Scholar] [CrossRef]
  20. Lei, M.Y.; Zhang, X.H.; Yang, W.J. Current status and trend of research on visual pose detection and control of tunneling equipment in coal mines. J. China Coal Soc. 2021, 1–14. [Google Scholar] [CrossRef]
  21. Zhang, X.H.; Zhao, J.X.; Zhang, C. Visual servo control system for cutting of boom-type roadheader. Coal Sci. Technol. 2022, 50, 263–270. [Google Scholar]
  22. Yang, W.J.; Zhang, X.H.; Zhang, C. Research on intelligent cutting control system for roadway forming of boom-type tunneling robot. Ind. Mine Autom. 2019, 45, 40–46. [Google Scholar] [CrossRef]
  23. Wang, P.; Su, X.B.; Han, Y. Quantitative Characterization of Coal Structure and Its Significance. Saf. Coal Mines 2014, 45, 12–15. [Google Scholar] [CrossRef]
  24. Guo, H.Y.; Su, X.B.; Xia, D.P. Relationship of the permeability and geological strength index (GSI) of coal reservoir and its significance. J. China Coal Soc. 2010, 35, 1319–1322. [Google Scholar] [CrossRef]
  25. Wang, T.H.; Dong, Z.; Liu, J.Q.; Guo, H.Y. Design and complete of coal GSI detection system based on mobile image processing. Coal Sci. Technol. 2021, 49, 154–159. [Google Scholar] [CrossRef]
  26. Hong, K.; Han, E.; Kang, K. Determination of geological strength index of jointed rock mass based on image processing. J. Rock. Mech. Geotech. 2017, 9, 702–708. [Google Scholar] [CrossRef]
  27. Yang, S.; Liu, S.; Zhang, N. A fully automatic-image-based approach to quantifying the geological strength index of underground rock mass. Int. J. Rock. Mech. Min. 2021, 140, 104585. [Google Scholar] [CrossRef]
  28. Albuquerque, K.; Silva, H.; Teodoro, E.; Fonseca, A.; Garioli, G.; Lopes, E.; Cota, L.; Euzébio, T. Averaging level control of bulk solid material using a tripper car. IFAC-Pap. 2019, 52, 147–152. [Google Scholar] [CrossRef]
  29. Brand, H.G.; Vosloo, J.C.; Mathews, E.H. Automated energy efficiency project identification in the gold mining industry. In Proceedings of the 2015 International Conference on the Industrial and Commercial Use of Energy (ICUE) IEEE, Cape Town, South Africa, 18–19 August 2015. [Google Scholar]
  30. Hoek, E.; Brown, E.T. Practical estimates of rock mass strength. Int. J. Rock. Mech. Min. 1997, 34, 1165–1186. [Google Scholar] [CrossRef]
  31. Mandelbrot, B.B. How long is the coast of Britain? Statistical self-similarity and fractal dimension. Science 1967, 155, 636–638. [Google Scholar] [CrossRef] [Green Version]
  32. Mandelbrot, B.B.; Blumen, A. Fractal Geometry: What is it, and What Does it do? [and Discussion]. Proc. R. Soc. London. Ser. A Math. Phys. Sci. 1989, 1864, 3–16. [Google Scholar]
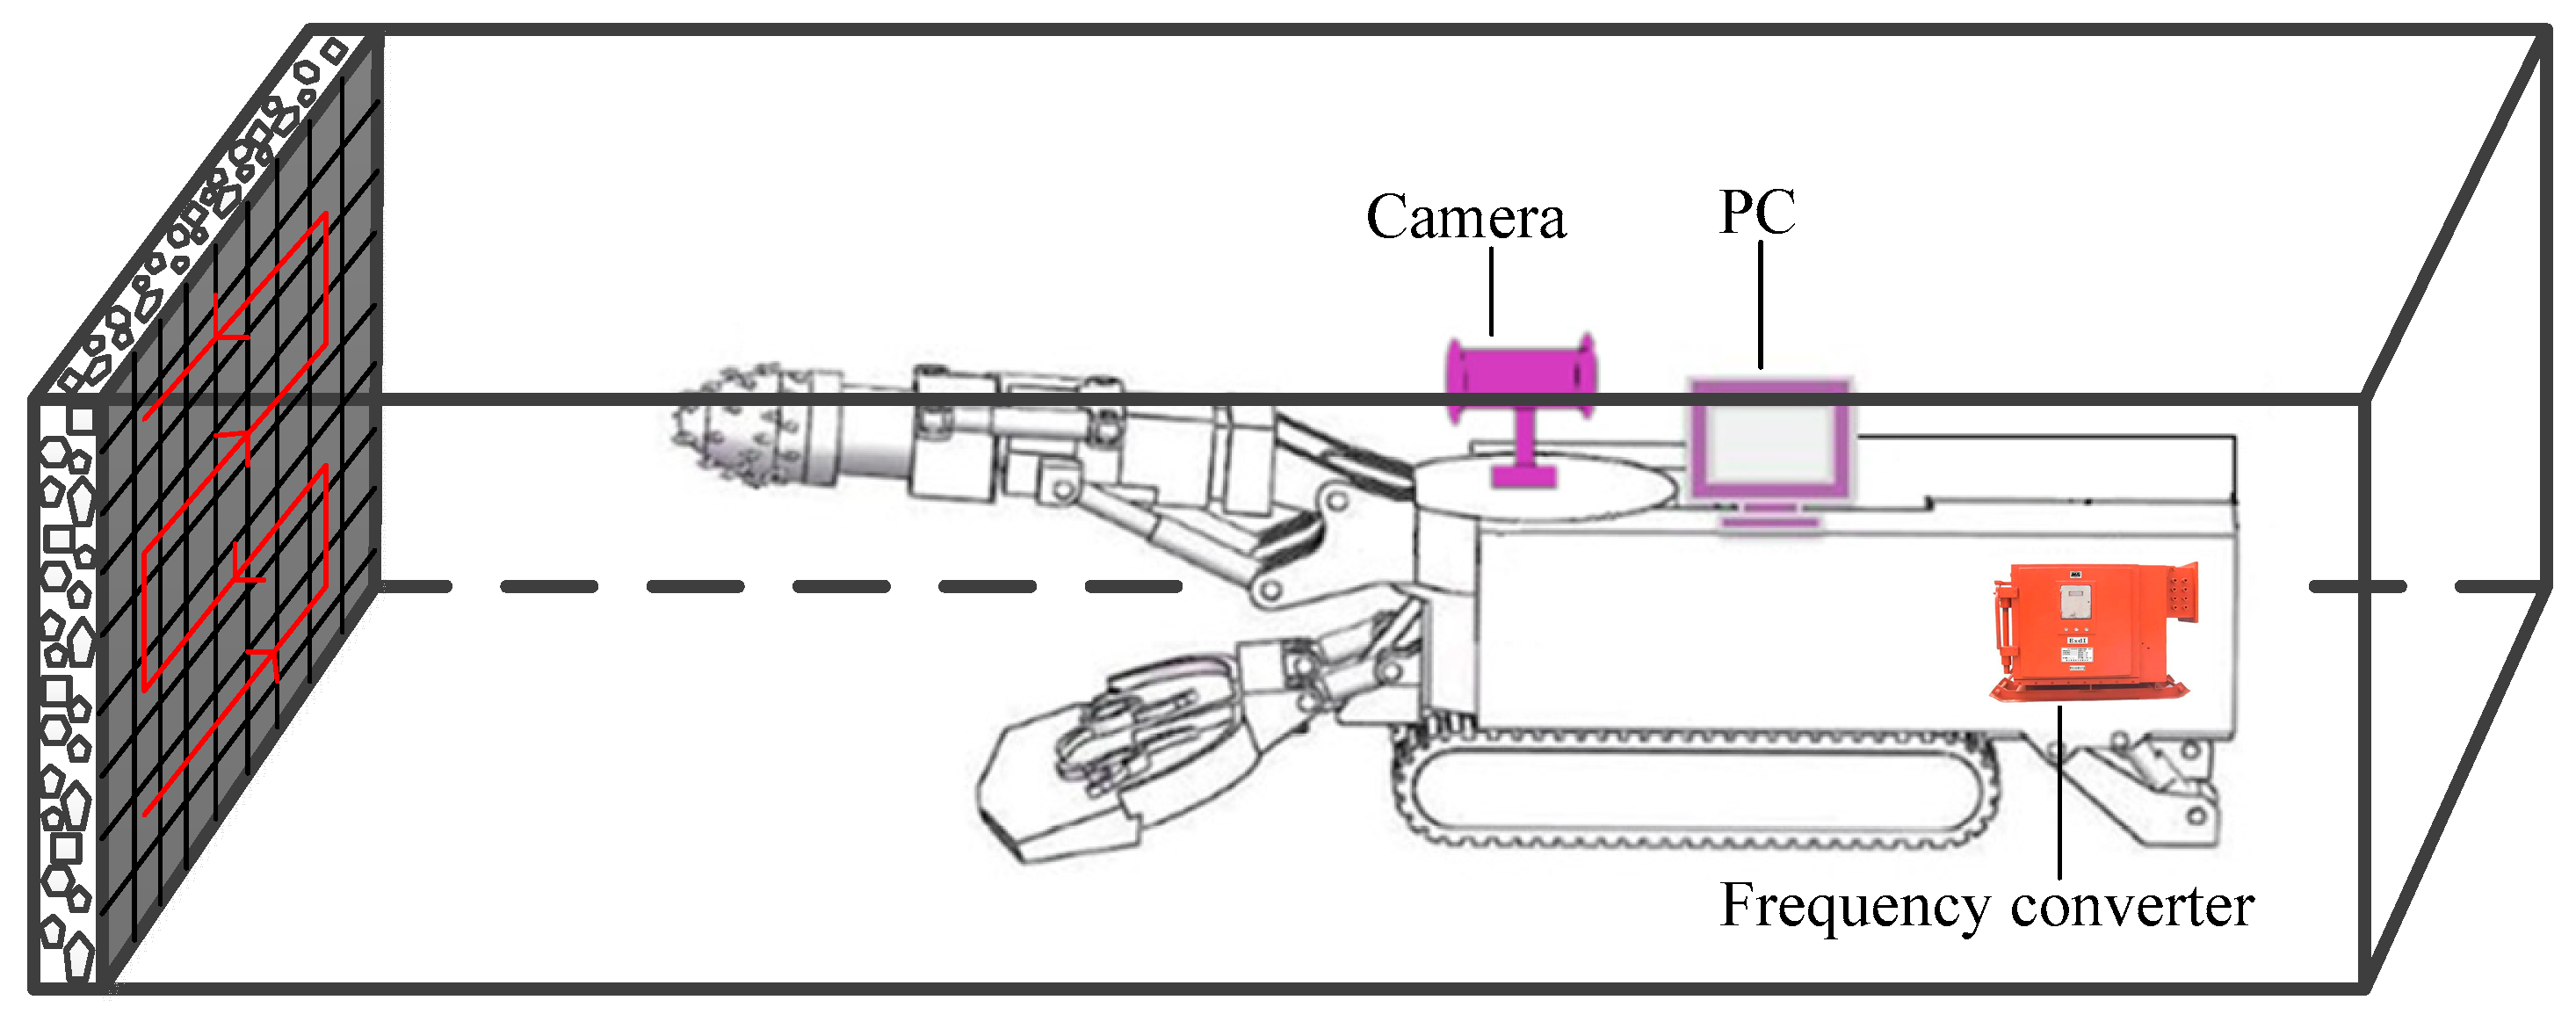
Figure 1. Vision control system of roadheader.
Minerals 12 01582 g001
Figure 2. Gray value of fissure joint. (a) Rock fissure, (b) 3D graph of gray value.
Minerals 12 01582 g002
Figure 3. Design of artificial neural network.
Minerals 12 01582 g003
Figure 4. Iteration error of GA-BP neural network model.
Minerals 12 01582 g004
Figure 5. GA-BP neural network model error.
Minerals 12 01582 g005
Figure 6. Fractal dimension. (a) Original image, (b) 4 × 4 fractal dimension, (c) 9 × 9 fractal dimension.
Minerals 12 01582 g006
Figure 7. Cutting path.
Minerals 12 01582 g007
Figure 8. Adaptive cutting control strategy.
Minerals 12 01582 g008
Figure 9. Fractal dimension and path planning.
Minerals 12 01582 g009
Figure 10. Laboratory simulation operation.
Minerals 12 01582 g010
Figure 11. Vision-based cutting speed control steps.
Minerals 12 01582 g011
Table 1. Reference table of geological strength index.
Geological Strength IndexStructure Characteristics
VERY
GOOD
GOODFAIRPOORVERY
POOR
STRUCTUREDECREASING SURFACE QUALITY →
Minerals 12 01582 i001The rock mass has complete structure, few cracks, high hardness and is not easy to be damaged N/AN/A
90
Minerals 12 01582 i002The block has relative dislocation, multiple groups of intersecting fissures, and the coal body is hard. 80
70
Minerals 12 01582 i003The coal seam is curved, the coal joint density is large, and the coal body hardness is low. 60
50
Minerals 12 01582 i004The coal body is cemented by grains, with many cracks, which are easy to twist into fragmentation. 40
30
Minerals 12 01582 i005The rock mass is extremely broken and mixed, consisting of angular or rounded fragmentsN/AN/A 20
10
Table 2. The ratio of the absolute value H of the length and width and percent of false positives.
H/PixelPercent/%
50 < H < 750.68
25 < H < 503.15
0 < H < 2590.12
Table 3. The ratio of area A and percent of false positives.
A/Pixel2Percent/%
500 < A < 10000.29
100 < A < 5004.20
0 < A < 10091.44
Table 4. Characteristic values of fissure joints.
No.QuantityAverage LengthAverage WidthOccupancy
130908.320.24
242283.440.13
327673.740.27
438521.350.17
5151332.140.04
61214326.90.06
7166740.07
8381364.60.09
959452.60.52
107873120.52
Table 5. Speed regulation mode of cutting head.
ModeSpeed
(r/min)
Frequency (Hz)Geological Strength
Index (GSI)
High speed465070–100
Medium speed354035–70
Low speed23300–35
Table 6. Estimated and detected values.
No.Estimated ValueDetection ValueRelative Error (%)
158580
273721.4
391921.1
462611.6
577761.3
659581.7
768691.5
877781.3
956551.8
1065661.5
1176742.6
1286860
1358563.5
1476751.3
1565641.5
1693952.2
1783821.2
1866683
1949502
2055561.8
Table 7. Comparison of energy consumption.
No.Time
(s)
Uniform Energy
Consumption (kW·h)
Eegulation Energy Consumption (kW·h)Energy Consumption Comparison
13001.51.434.7%
23001.51.46.6%
33001.51.453.3%
43001.51.434.7%
53001.51.416%
63001.51.46.6%
Publisher’s Note: MDPI stays neutral with regard to jurisdictional claims in published maps and institutional affiliations.