Article

Facies Changes, Evolution of Biogenic Structures, and Carbon Isotope Stratigraphy of the Cambrian Series 2 to Miaolingian Transition on the Southern North China Craton

School of Resources and Environment, Henan Polytechnic University, Jiaozuo 454003, China
*
Author to whom correspondence should be addressed.
Minerals 2022, 12(12), 1526; https://doi.org/10.3390/min12121526
Submission received: 17 October 2022 / Revised: 22 November 2022 / Accepted: 24 November 2022 / Published: 28 November 2022
(This article belongs to the Section Mineral Geochemistry and Geochronology)

Abstract

:
The Cambrian Series 2–Miaolingian transition is a pivotal period during Earth history, which witnessed the decline of biodiversity and the reduction in biomass, i.e., the redlichiid–olenellid trilobite extinction. The notable δ13C excursion (RECE) near the Cambrian Series 2–Miaolingian boundary in east Gondwana and China apparently corresponds with the redlichiid trilobite extinction. To better understand the causal mechanism of this biotic crisis, we report the carbon isotope stratigraphy and facies changes from Cambrian Series 2–Miaolingian transition of the Mantou Formation on the southern North China Craton. The carbon isotope excursions at the Cambrian Series 2–Miaolingian transition in the study area are 0.7‰ in the Chishanhe section and −0.2‰ in the Luoquan section, respectively, showing a weak negative excursion or even no negative excursion. The sedimentary environments in the study area gradually changed through time from a clastic tidal flat to a carbonate platform across the transition, which indicated a gradual rise in sea level, with anoxic conditions occurring predominantly before the RECE δ13C excursion. Microbially induced sedimentary structures and oncoids occurred widely at the top of Cambrian Series 2. Abundant metazoan trace fossils were preserved in the Miaolingian Series of the study area. The evolution of biogenic structures across the Cambrian Series 2–Miaolingian transition indicates the emergence of harsh environments associated with the proliferation of MISS and oncoids at the RECE horizon and the recovery of benthic metazoan fauna after the RECE biotic crisis.

1. Introduction

A large negative excursion occurred close to the Series 2 to Miaolingian (Stage 4–Wuliuan) boundary and is named the Redlichiid–Olenellid Extinction Carbon Isotope Excursion (ROECE) [1]. It apparently corresponds with the extinction of redlichiid trilobites in Gondwana and olenellid trilobites in Laurentia [1]. This δ13C negative excursion has been confirmed in South China [2,3,4,5,6,7,8,9], Northwest China [10,11], northern Iran [12], North America [13,14], Europe [15,16,17], and the eastern Siberian Platform [18]. However, recent studies [12,19,20,21] have questioned the ROECE definition documenting that δ13C excursions at the lower–middle Cambrian boundary interval from Laurentia are difficult to correlate with those of from Gondwana (including China), because the extinction levels of olenellids and redlichiids are asynchronous. Amin-Rasouli and Lasemi (2021) [12] suggested separating the ROECE into “RECE” (Redlichiid Extinction Carbon Isotope Excursion) and “OECE” (Olenellid Extinction Carbon Isotope Excursion).
The paleoredox and paleoproductivity changes have been deemed as triggers for the biotic crisis [13]. The anoxic water led to the redlichiid-olenellid trilobite extinction together with a sharp decline in the biomass, thus resulting in poor 13C carbon isotope composition in the anoxic water. The anoxic water body with 12C-enriched, 13C-depleted, or negative 13C/12C composition formed an upwelling, which led to the negative 13C excursion of platform carbonates [5,13]. In geological records, the decrease in dissolved oxygen in seawater and rapid transgression caused by high-temperature climate conditions are often regarded as the most important factors in the development of extensive anoxic conditions in paleoceans [22,23,24,25]. Owing to rapid eruption of the Kalkarindji igneous province (511 Ma), large amounts of CO2 and other volatiles were emitted into the atmosphere, leading to a rapid increase in temperature [26], which reduced the dissolved oxygen level in seawater. The low-latitude continentality and depressed meridional temperature gradients at early Cambrian greenhouse time may also have caused the formation of an anoxic water column below the surface mixed layer during the transgression [27,28]. The transgression pushed deep anoxic seawater onto epicontinental seas, causing widespread oxygen deficit and trilobite extinction in shallow marine areas [23,24,29]. However, this environment generated favorable conditions for the growth of microbiota that were not overly reliant on the oxygen level. During and after the end of the Early Cambrian, the widespread distribution of dysaerobic fauna and pyrite-rich laminated black shale [29,30] may imply substantial hypoxia and eutrophication in shallow-sea settings during this period [30,31,32].
However, research concerning the RECE event in the North China Craton is rare. The only report on the RECE event came from Jiagou section near Huainan (Anhui Province), which records a positive δ13C excursion of 1.45‰, and there is no negative excursion in the interval between the extinction horizon of redlichiids and the first occurrence of Pagetia and Probowmaniella [2]. The North China Craton is a shallow platform at the Cambrian Series 2–Miaolingian transition and is dominated by shallow mixed clastic and carbonate deposits formed in supratidal to intertidal environments. No doubt the oxidizing conditions of these depositional environments reduced the rate of organic matter burial, resulting in a decline in δ13C values in local seawater [2]. Negative δ13C excursions have been recorded in many other shallow marine inner platform facies [2,4,7,9,10,11,12,16,33]. Whether or not the signature of global RECE negative excursion is recorded in the North China Craton needs further verification.
The Cambrian Series 2 to Miaolingian transition is well developed in the Weihui area of the southern North China Craton. This study aims to enhance our understanding of the global RECE event by elucidating the significant δ13C negative excursion characteristics of the transition in the study area, combining lithofacies and environmental changes, redox analysis, and the evolution of biogenic structures.

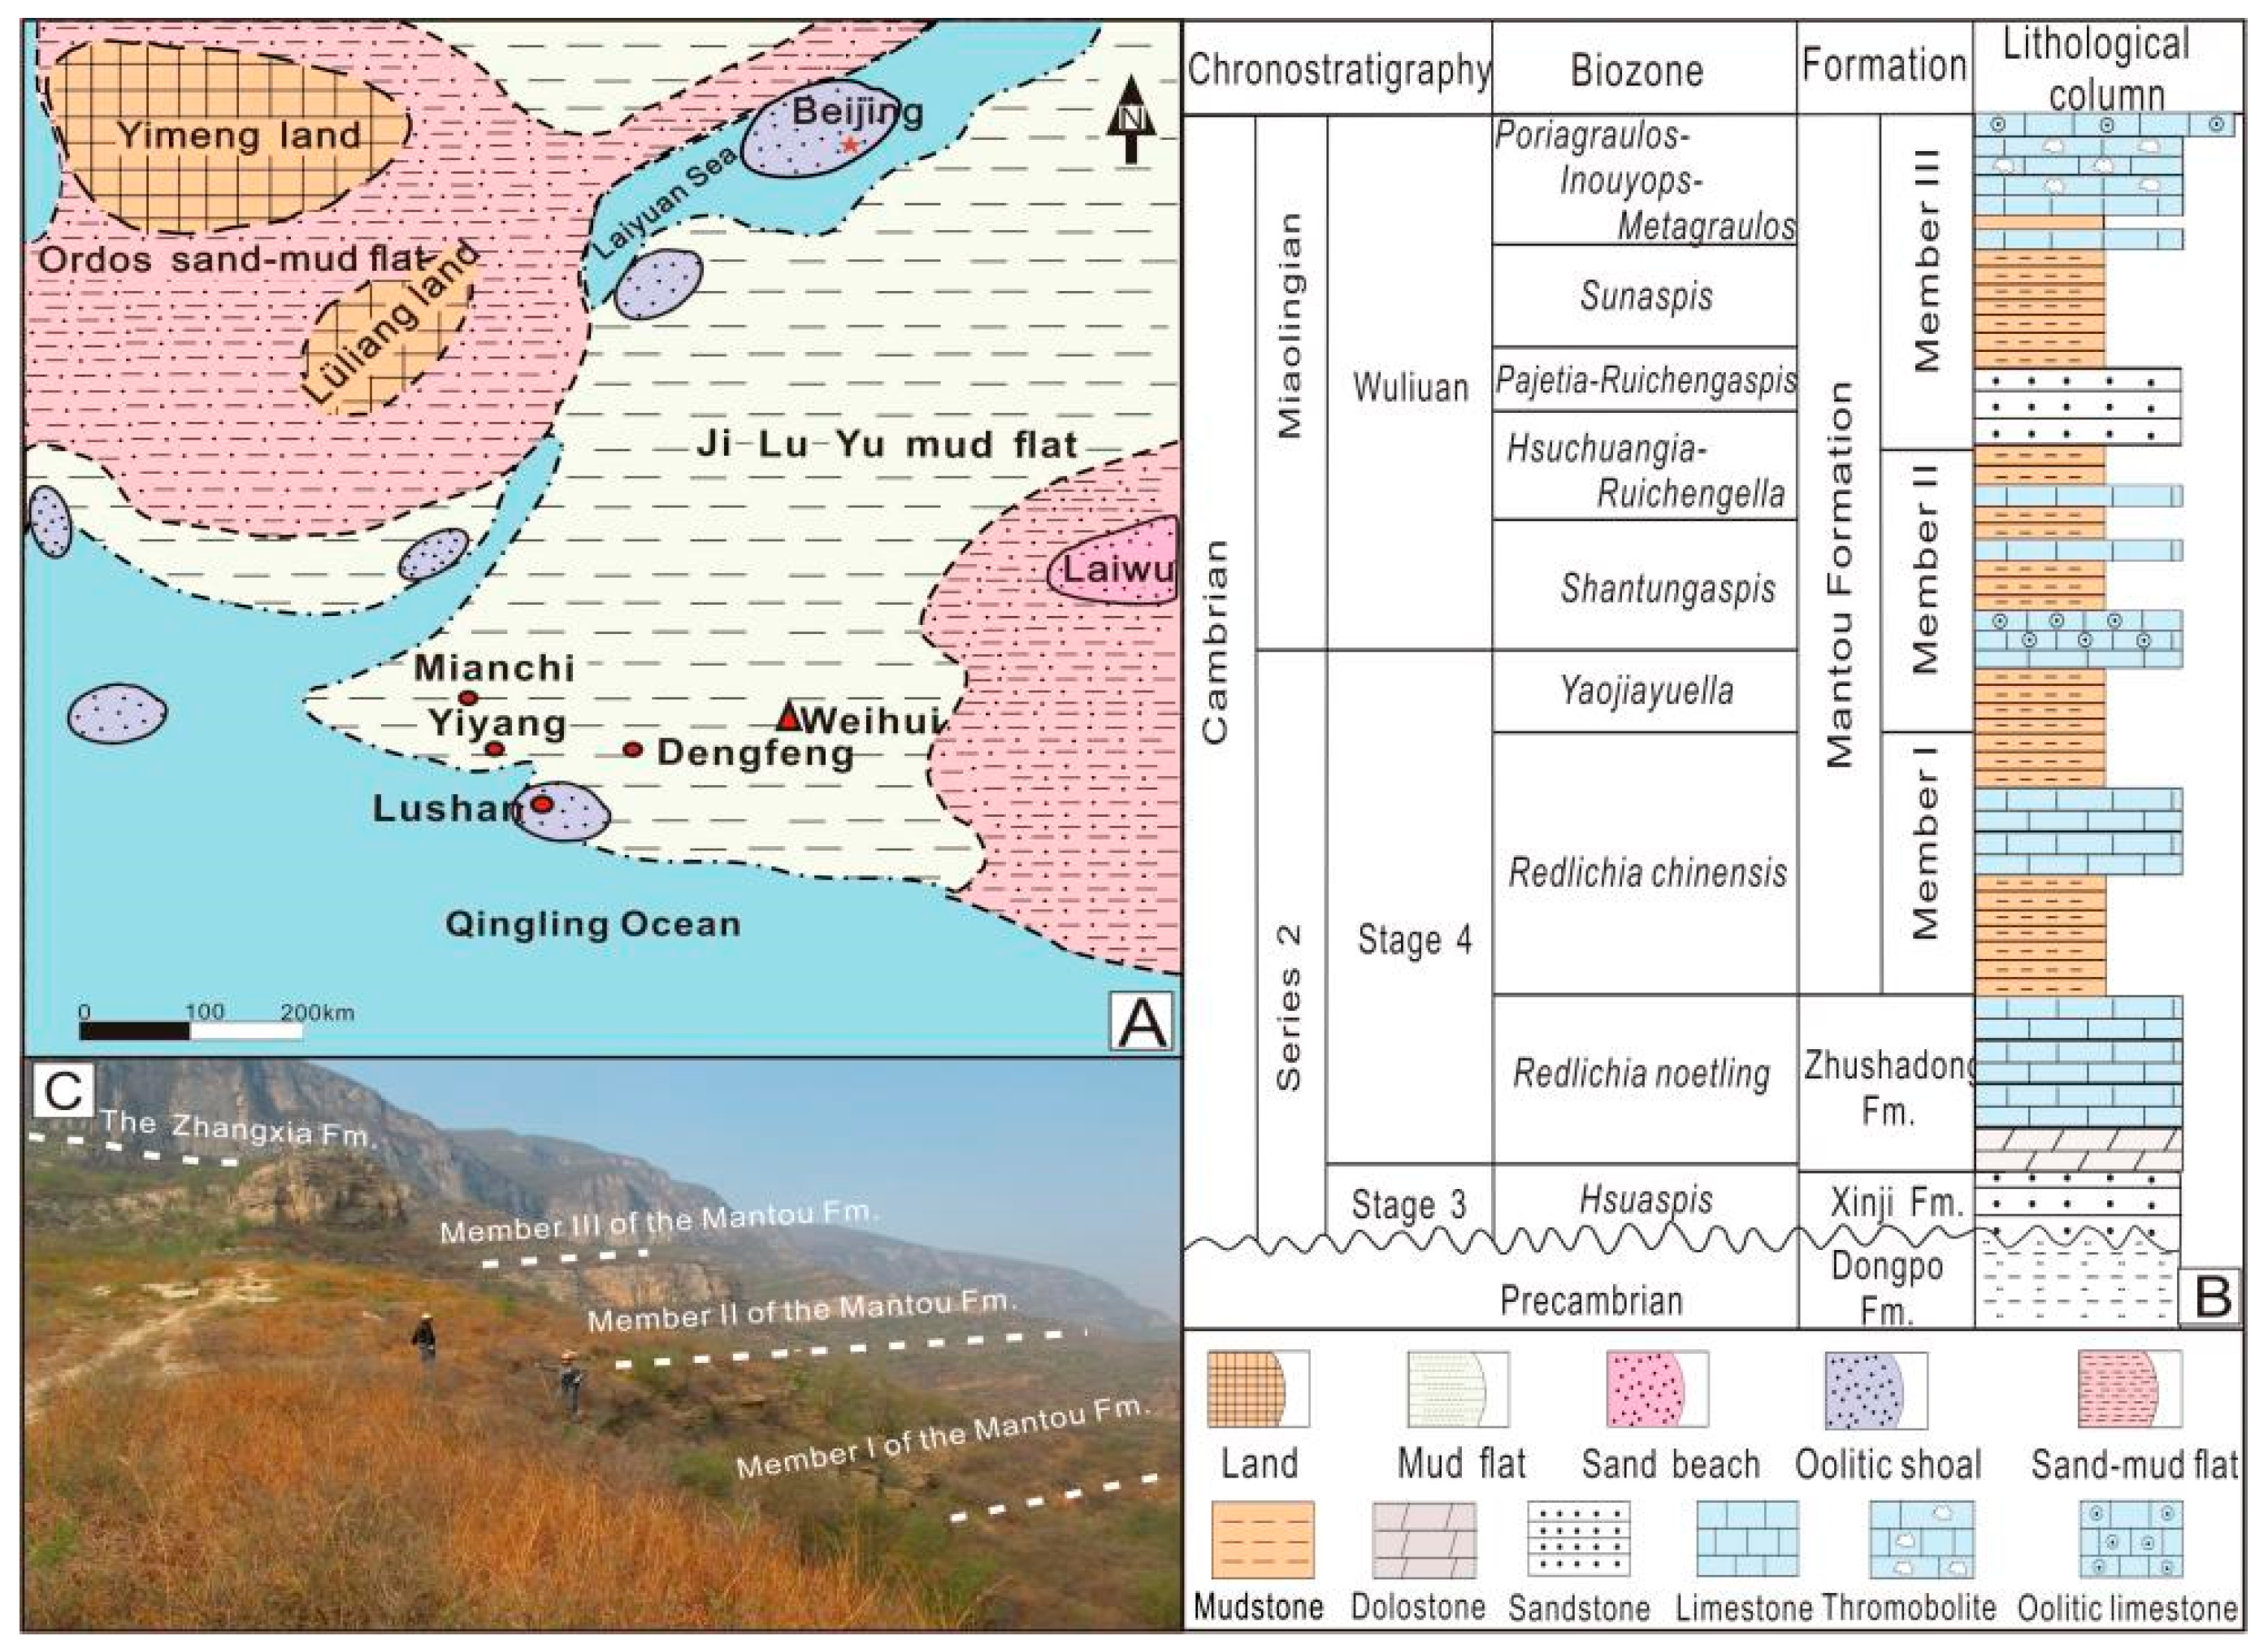
2. Geological Background and Biostratigraphy

The first Phanerozoic transgression on the North China Craton started during Cambrian Stage 2 [34]. Series 2 is characterized by calcitic dolostone, dolomitic limestone, and aubergine mudstone of flat tidal facies. The Miaolingian Series is dominantly deposited as carbonates, particularly oolitic limestones. Another transgression from Paibian Stage to Stage 10 of the Furongian Series elevated sea level and deposited micritic limestone with flat-pebble conglomerates. The Cambrian succession on the North China Craton was a typical epicontinental sea-depositional system with a second-order transgressive setting [34,35].
The Chishanhe and Luoquan sections are located in the Weihui area, southern North China Craton (Figure 1A). The continuous and well-exposed Cambrian strata herein comprise (in ascending order) the Zhushadong Formation and the Mantou Formation Member I of Cambrian Series 2, followed by the Mantou Formation Members II and III, the Zhangxia and Gushan formations of Miaolingian Series, and the Chaomidian and Sanshanzi formations of Furongian Series (Figure 1B).
The Cambrian Series 2 to Miaolingian transition is dominated by the Mantou Formation, which comprises three lithological members in the study area (Figure 1C). Member I consists of gray-yellow laminated dolostone, purple-red calcareous shales, and light-gray micrites interbedded with flat-pebble conglomerates. Member II is characterized by the alternation of oncolite-bearing limestones and oncoidal oolitic limestones with purple shales. Member III mainly comprises purple-red shales and oolitic limestone interbedded with calcareous sandstone. The Mantou Formation is interpreted as the transition from the mixed siliciclastic carbonates of tidal flat to oolites of carbonate platform [36].
The trilobite Redlichia chinensis Zone is developed in the Mantou Formation Member I in the study area, reported from Shandong Province of North China and Yunnan Province of South China, and is the representative fossil of upper Stage 4 of Cambrian Series 2 [36]. The Yaojiayuella Zone, Shantungaspis Zone, and lower part of the Hsuchuangia–Ruichnegella Zone are developed in Member II. Yaojiayuella Zone can be correlated with the Yaojiayuella ocellata Zone or Yaojiayuella–Weijiaspis Zone at the top of Stage 4 in Cambrian Series 2 of North China [37,38]. Member III contains the upper part of the Hsuchuangia–Ruichnegella Zone and the Pagetia–Ruichengaspis, Sunaspis, and Poriogranulos–Inouyops–Metagraulos Zones. These trilobite fossil zones are the index fossils of North China and are correlated with the Wuliuan Stage of Miaolingian Series [37,38].

3. Samples and Method

A total of 149 samples were collected from the Mantou Formation of the Chishanhe and Luoquan sections in the Weihui area of Henan Province, southern North China. Matrix-supported carbonates were obtained from the most homogeneous parts of freshly cut surfaces to avoid veins and diagenetic alteration areas and to eliminate the influence of carbonate heterogeneity. Carbonate carbon isotopes are generally regarded as less susceptible to diagenetic alteration [39,40]. The samples were pulverized into ca. 200 mesh size using a 0.7 mm diameter dental drill. The prepared powdered samples were put into labeled sample tubes for analyses of trace elements along with carbon and oxygen isotopes. Microscopic observation of thin sections was performed on a Zeiss Axio Imager M2 polarizing microscope. The ultramicroscopic characterization was conducted using a Zeiss Merlin Compact scanning electron microscope and an OXFORD energy dispersive spectrometer (EDS) in the Analysis and Testing Center of Henan Polytechnic University. Concentrations of trace elements were measured with MS61c–MS81c (relative deviation of precision control <10%, relative error of accuracy control <10%) inductively coupled plasma mass spectrometry at ALS Chemex Co. Ltd. in Guangzhou. Carbon and oxygen isotope analyses were conducted using a Finnigan MAT-253 mass spectrometer in the Analysis and Testing Center of Henan Polytechnic University. The international standard sample NBS-19 (δ13C = 1.95‰, δ18O = −2.2‰, the Vienna Pee Dee Belemnite standard, VPDB) was used in the whole process of carbonate rock powder-sample tests.

4. Results

4.1. Facies and Paleoredox Analyses

The Cambrian Series 2–Miaolingian transition in the study area is a succession of clastic-dominated to mixed clastic carbonate deposits under a gradual and continuous transgressive setting (Figure 2 and Figure 3). Ten lithofacies were identified at the transition (Table 1). These were grouped into a clastic tidal flat to shallow carbonate platform trend spanning supratidal to subtidal environments. In this study, the sedimentary facies and redox conditions were determined based on lithofacies and sedimentary and biogenic structures. Some trace elements sensitive to redox conditions, such as V, Cr, Ce, U, and Th, can be used to interpret the ancient redox conditions. These sensitive trace elements usually have high solubility in relatively oxidized water, so their content in sedimentary rocks is low. On the contrary, the solubility in the relatively reduced water is lower; therefore, the content in sedimentary rocks is higher [41]. U/Th, V/Cr, V/(V + Ni), and Ce/La ratios along with δU values [42,43,44,45,46] were selected as reliable indicators of redox conditions in the study area.

4.1.1. Upper Stage 4

The upper Stage 4 of the study area can be divided into two intervals. The first interval is located in Member I and the lower part of Member II of the Mantou Formation (Figure 2 and Figure 3). Five lithofacies types occur in this interval: shale (SH, Figure 4A); alternation of dolomudstone and dolomitic limestone (DDL, Figure 4B,C); siltstone with mudstone interbeds (SMI, Figure 4D); micrite (MIC, Figure 4E); and flat pebble conglomerate (FPC, Figure 4F) (Figure 2). The Redlichia chinensis trilobite zone occurs in this interval. The vugular cavities in dolomudstones (Figure 4C), partially or entirely filling with calcite crystals during diagenesis, may form as a result of air or gas bubble formation or desiccation shrinkage in the supratidal or intertidal zone. The millimeter- to centimeter-scale laminations of dolomudstone and dolomitic limestone, referred to as rhythmites and tidal bedding or heterolithic stratification, form due to waning current during the slack water period of a tidal cycle, and represent deposition in intertidal settings [47]. The flat pebble conglomerate occurs occasionally in this interval, recording deposition during a storm process. The U/Th, V/Cr, V/(V + Ni), and Ce/La ratios and δU values show that the first interval was formed under an overall oxidizing environmental condition (Figure 5).
The second interval is located in the middle part of Member II of the Mantou Formation and is dominated by the oncolite-bearing limestones of the subtidal zone (Figure 2 and Figure 3). Three lithofacies types occur in this interval: siltstone with mudstone interbeds (SMI); oncolite-bearing limestone (OBL, Figure 6A–C); and oncoidal oolitic limestone (OOL, Figure 6D). The Yaojiayuella trilobite zone occurs in this interval. Oncoids in the oncolite-bearing limestone are dominated by micritic nuclei and irregular concentric cortices, and their cortex consists of bright laminae cemented with microspherical calcites and discontinuous dark laminae characterized by micrites (Figure 6B). Spindle shrinkage cracks (MISS) occur on the surfaces of limestone (Figure 6E,F). The change from oncolite-bearing limestone lithofacies upward into oncoidal ooiltic limestone lithofacies (Figure 2 and Figure 3) records an increase in current energy in a restricted subtidal lagoon in which the ooid grains were derived from the nearby oolitic shoal. The fluctuation of U/Th, V/Cr, V/(V+Ni), and Ce/La ratios and δU values shows that the deposits in this interval were formed under suboxic to anoxic environmental conditions (Figure 5).

4.1.2. Wuliuan Stage

The Wuliuan Stage in the study area is located in the upper part of Member II and Member III of the Mantou Formation and can be divided into three transgressive–regressive cycles with similar sedimentary characteristics (Figure 2 and Figure 3). Trilobites Shantungaspis, Hsuchuangia–Ruichnegella, Pagetia–Ruichengaspis, Sunaspis, and Poriogranulos–Inouyops–Metagraulos zones occur in the deposits of Wuliuan Stage. Each cycle changes from oolite (OO) lithofacies (Figure 7A), of oolitic shoal to fine sandstone interbedded with siltstone and silty mudstone (SSM) lithofacies (Figure 7B), silty mudstone interbedded with siltstone and micrite (MSM) lithofacies (Figure 7C), and siltstone with mudstone interbeds (SMI) in the intertidal–subtidal clastic tidal flat environments. Trilobite traces Cruziana, Rusohycus, Diplichnites, Dimorphicnus (Figure 7D,E), straight or curved burrows Planolites and Palaeophycus (Figure 7F) developed widely on the siltstone or sandy mudstone bedding surfaces. The variation in U/Th, V/Cr, V/(V + Ni) and Ce/La ratios and δU values indicate that the Wuliuan Stage in the study area was generally formed under suboxic environmental conditions (Figure 5).

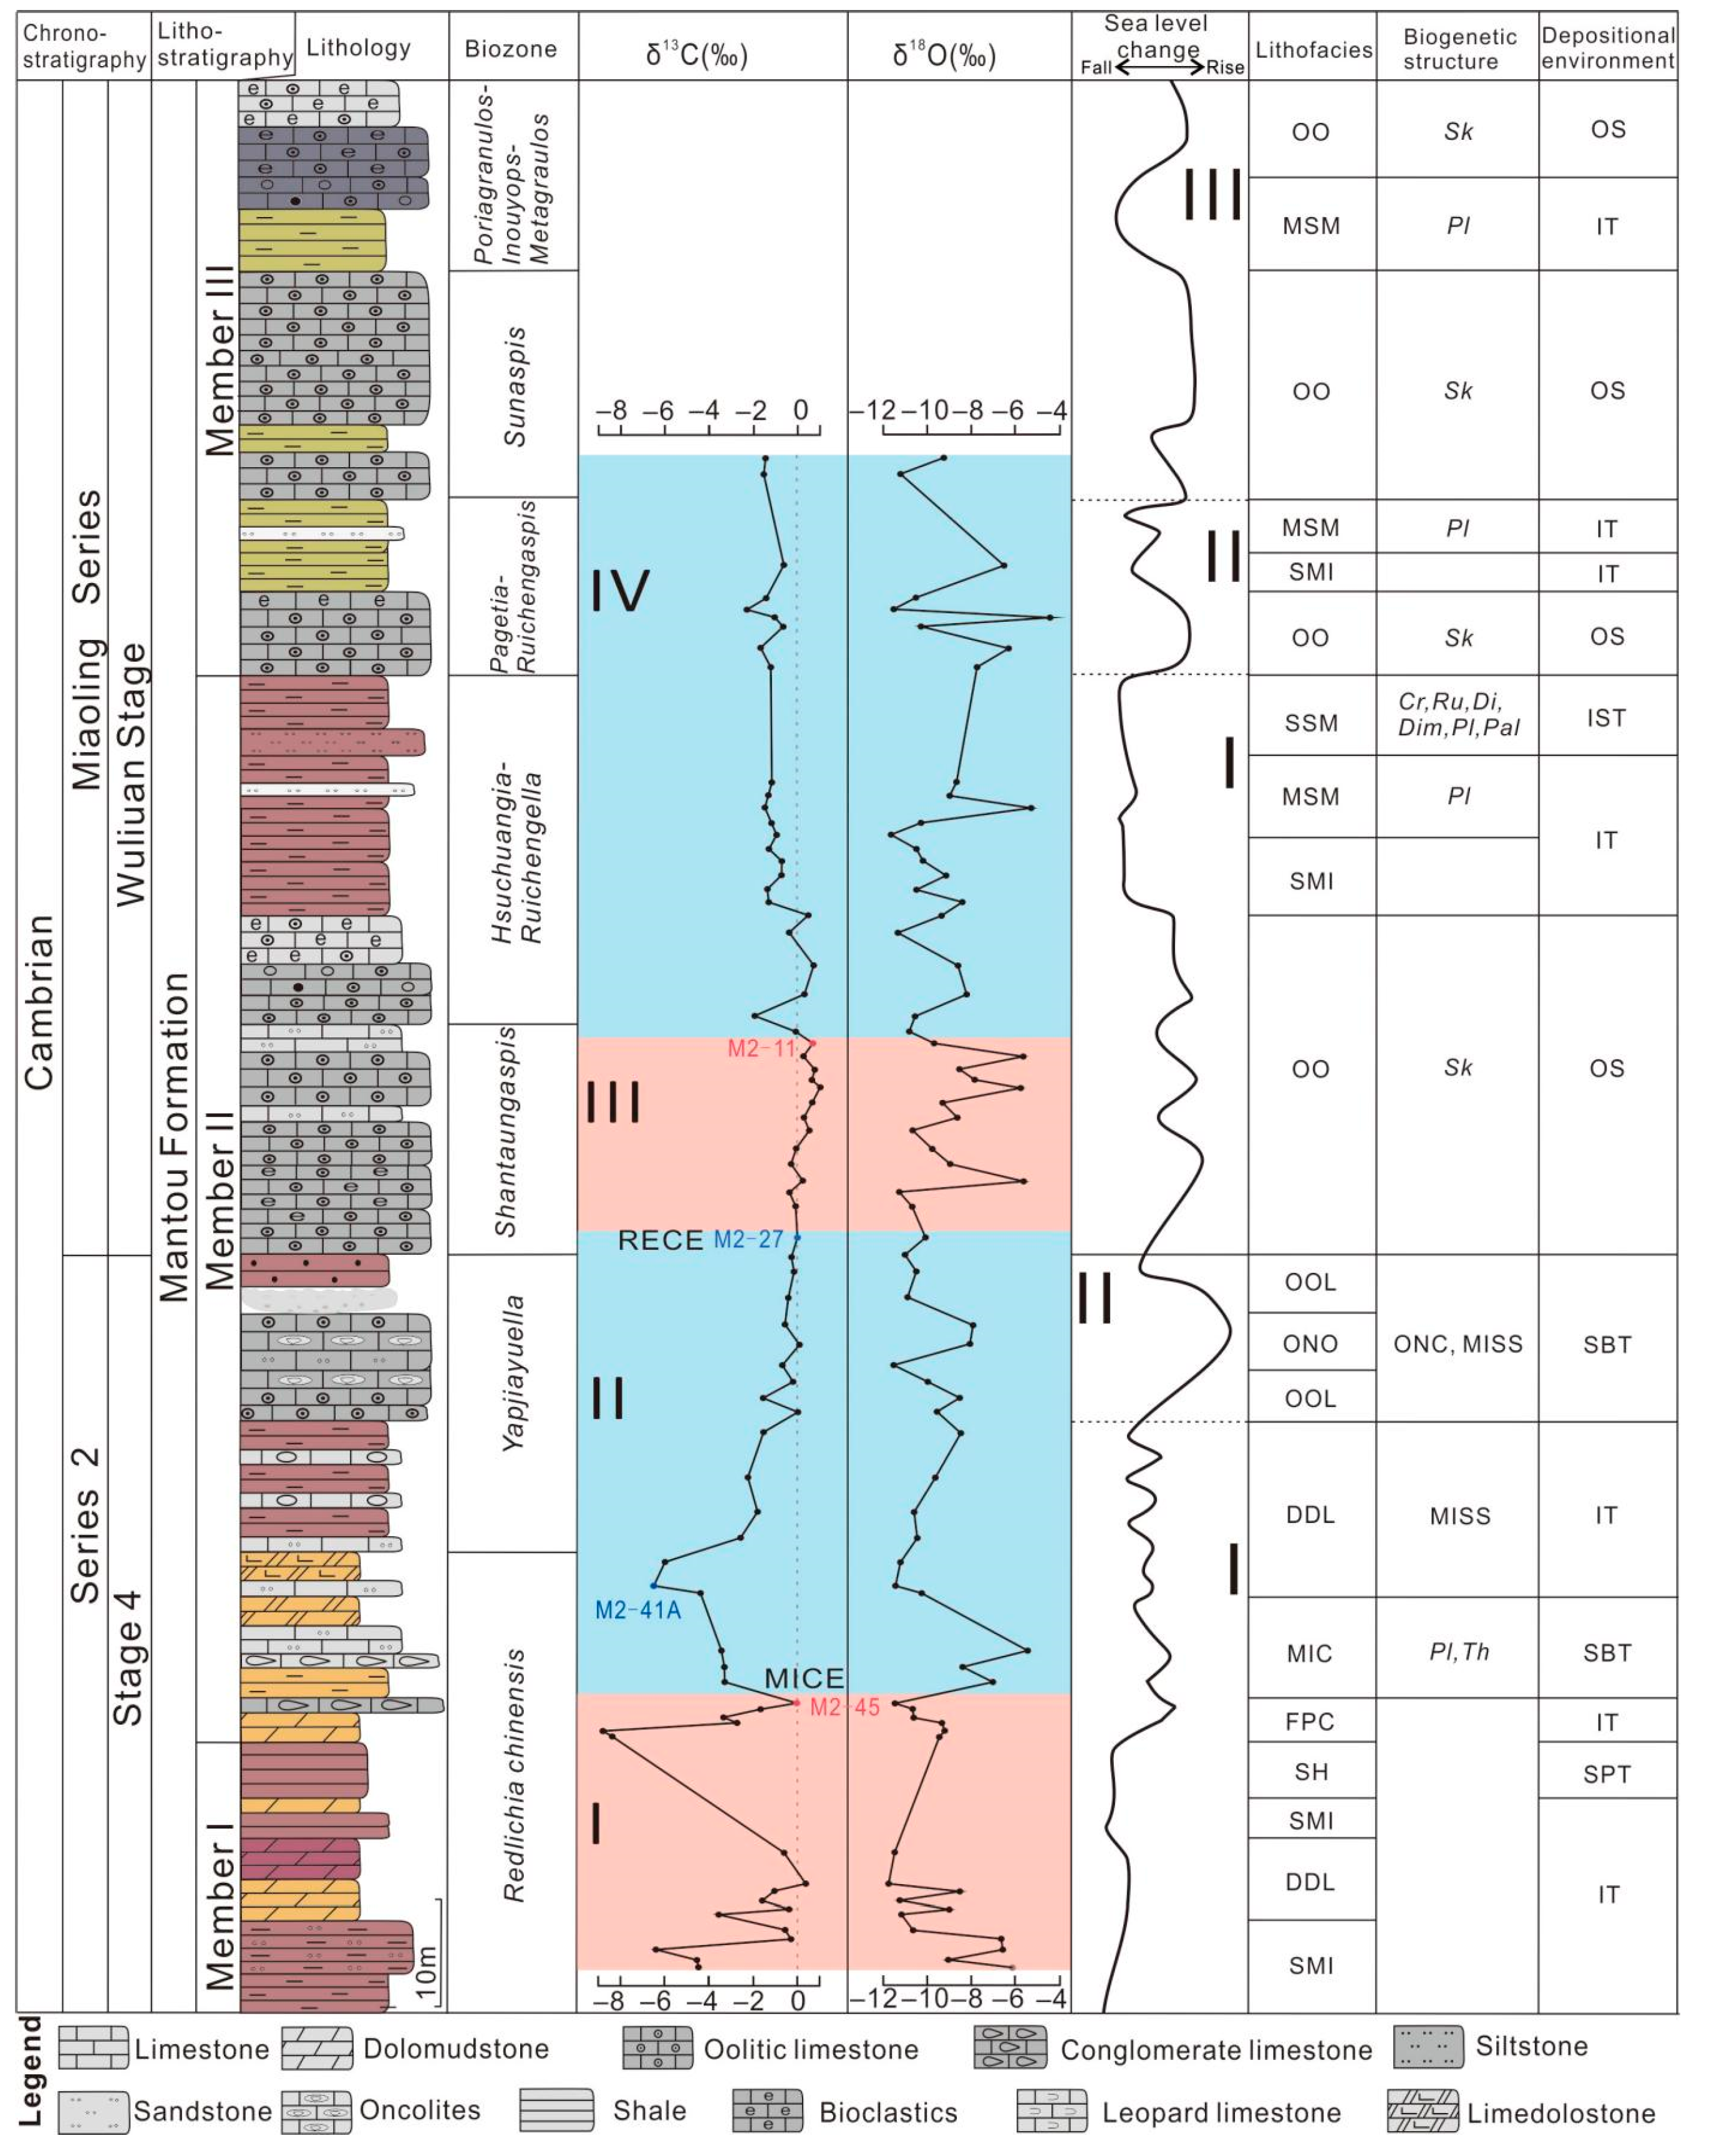
4.2. Carbon and Oxygen Isotopic Composition

Carbonates are prone to exchange carbon and oxygen isotopic components with their surroundings during burial diagenesis; particularly, the oxygen isotope composition is highly prone to fractionation [48,49,50]. To prevent the loss and misinterpretation of information about the ancient marine sedimentary environments preserved in the rocks, the effective preservation of carbon and oxygen isotope fraction data of the carbonate sample needs to be evaluated before their interpretation. The most effective isotopic parameter is the covariation in δ13C and δ18O values of the carbonates [39,51,52] when δ18O values are less than −10‰ or −11‰ [40,53,54,55].
To evaluate the reliability of our isotope data, we assess the preservation of the primary carbon isotope signals in our samples. The covariant graph shows that the distribution of δ13C and δ18O values in the two sections of the study area is relatively discrete and does not have a significant positive correlation, indicating that the marine carbonates maintain the original carbon and oxygen isotopic information (Figure 8A,B). While preparing the powder sample, all samples were collected from rocks having a large amount of muddy matrix (Figure 8C,D). The carbon isotopic compositions have common evolutionary trends in the two sections, indicating that the carbon isotopic compositions can be used for comparative studies of the Cambrian strata. However, the test results for some samples are lower than −10‰, which may be influenced by the addition of freshwater during late action or formed by the exchange of a large amount of freshwater with normal seawater during the early sea erosion.

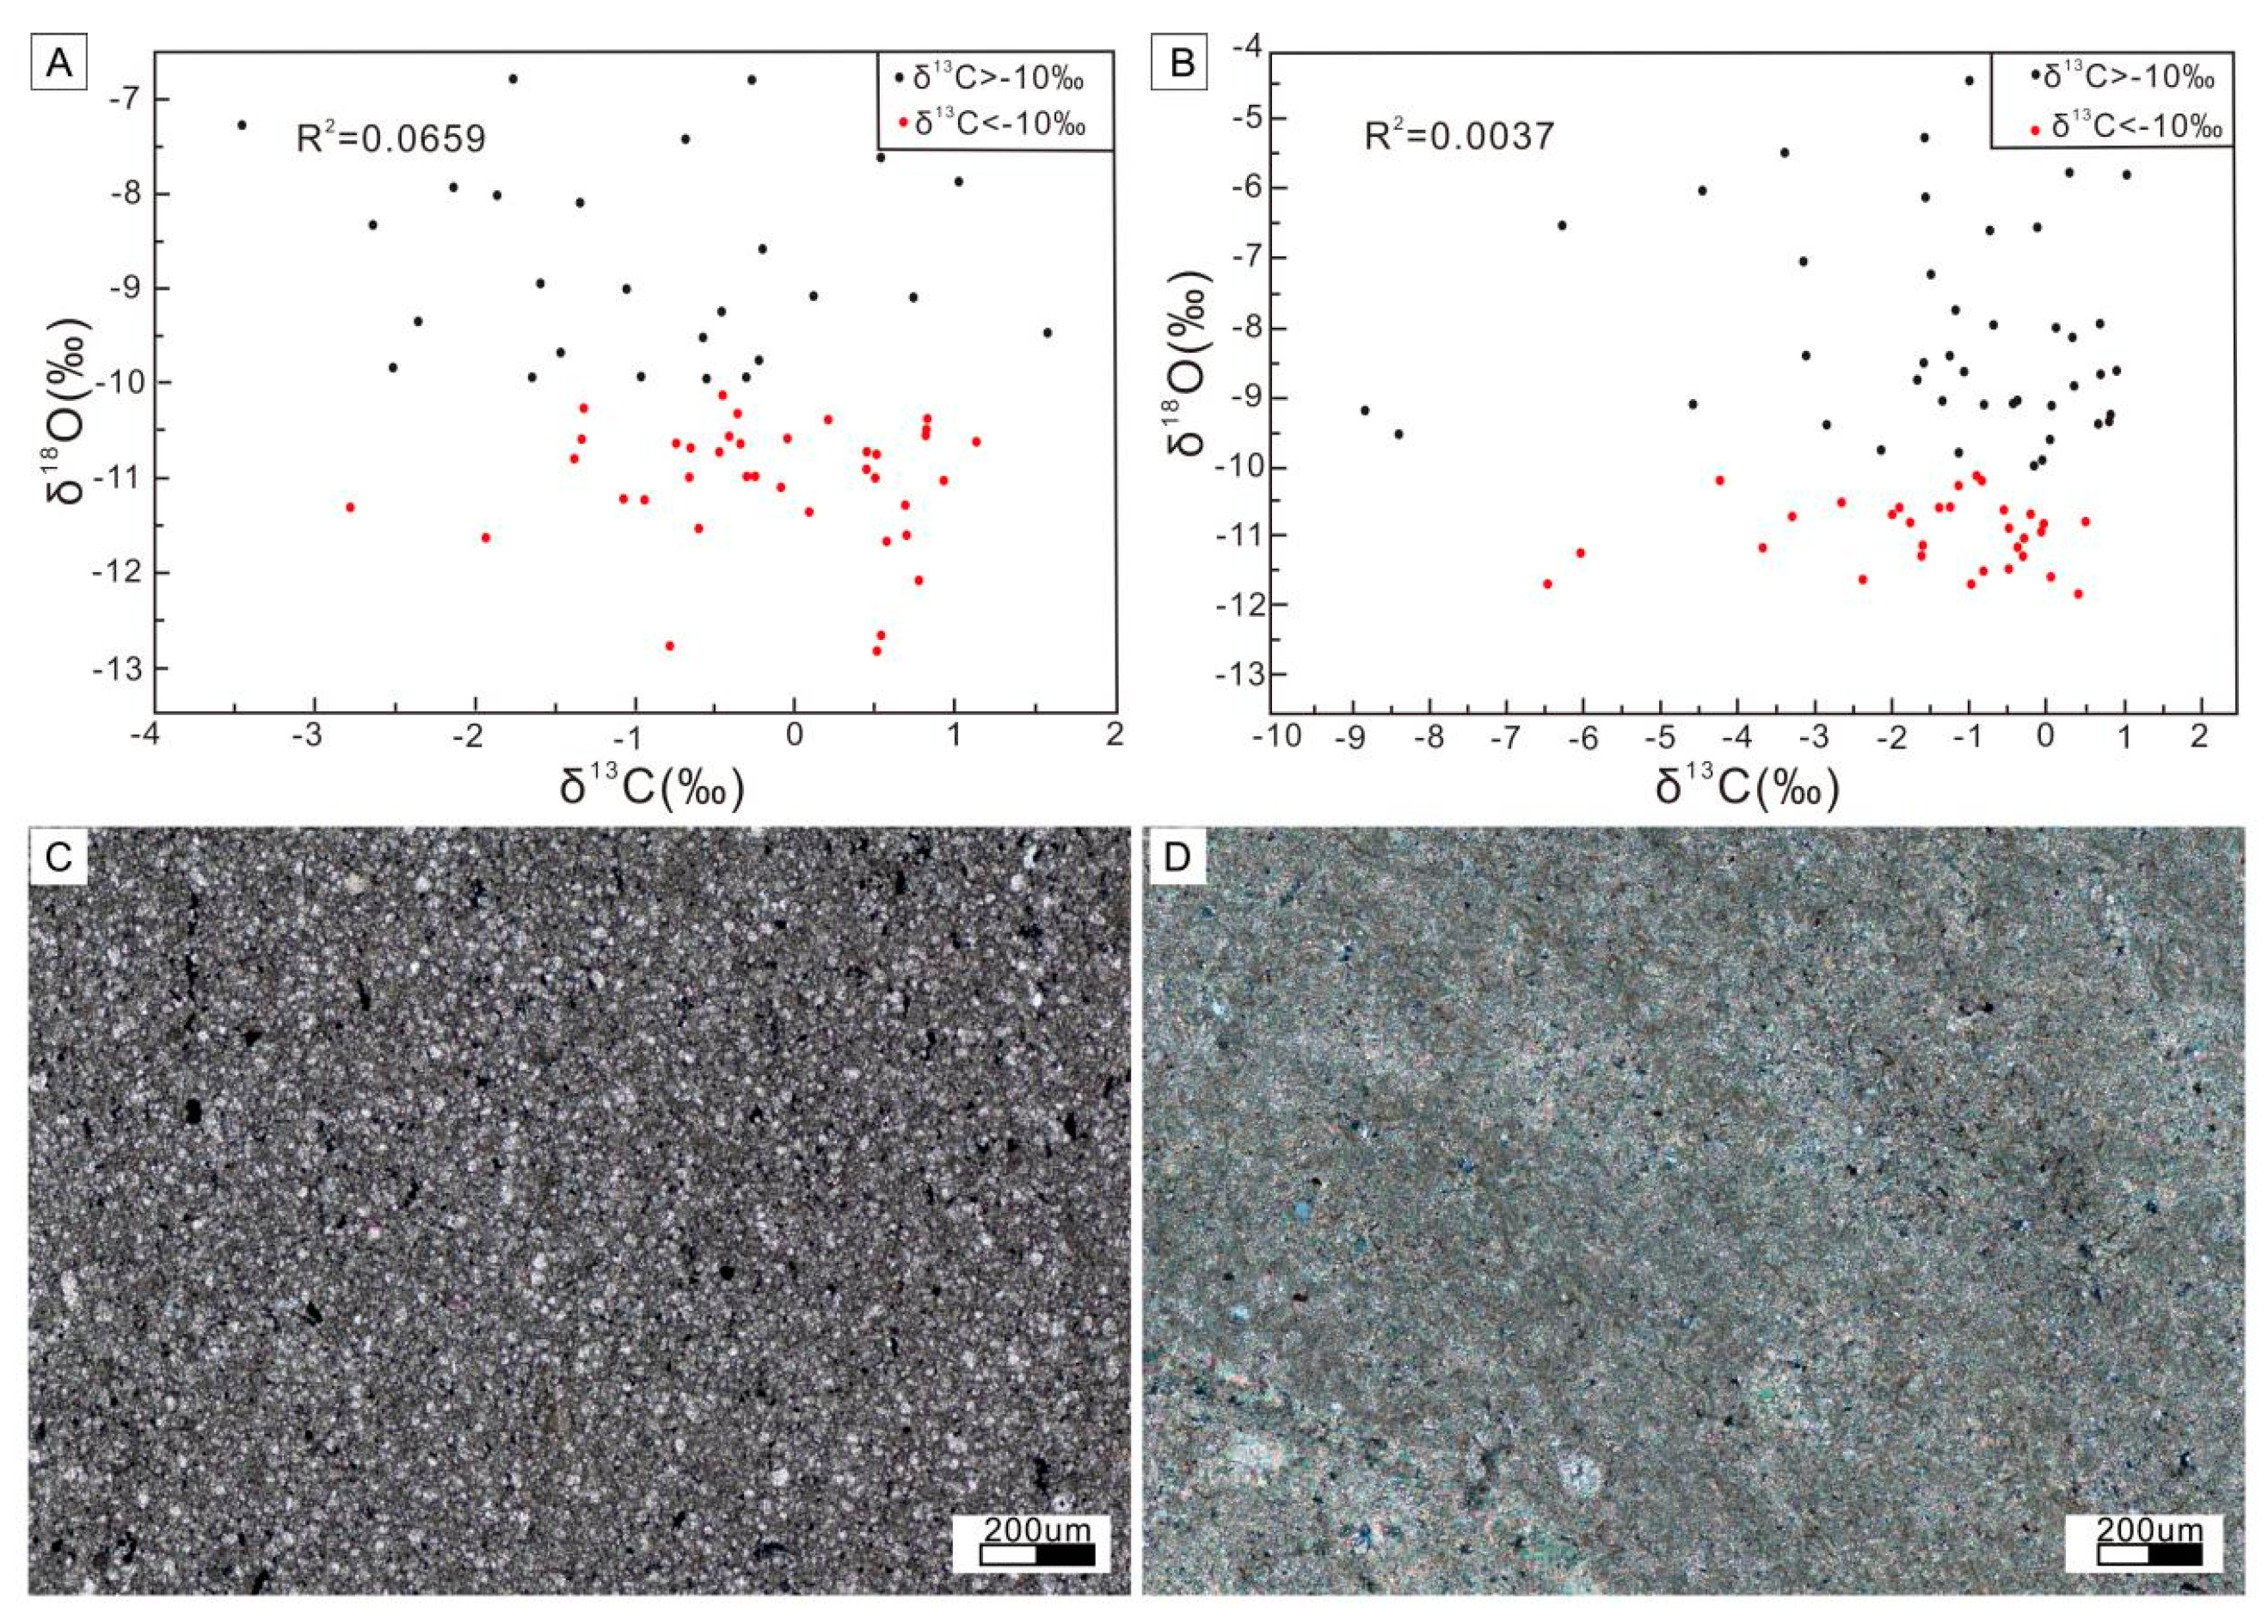
4.2.1. Carbon and Oxygen Isotopic Composition of the Chishanhe Section

The distribution of carbonate δ13C values of Cambrian Stage 4 to Wuliuan Stage in the Chishanhe section ranges from −3.45‰ to 1.59‰, with a mean value of −0.44‰ in a total of 65 samples (Table 2). The distribution of δ18O values ranges from −12.80‰ to −6.78‰, with a mean value of −10.05‰. Four excursion phases are identified in the carbon isotope curve of the Chishanhe section (Figure 2). The initial δ13C value of phase I is positive and drops rapidly and sharply to a negative value, reaching a minimum peak of −2.77‰ at point M-11, after which the δ13C value rises rapidly until it reaches a weakly positive position of 0.75‰ (M-13) at the end of the phase. Phase II exhibits an overall negative and gradual change from negative to positive excursion, ending with a peak positive excursion of 0.7‰ at point M-36. Phase III maintains an overall weak positive excursion after point M-30 until point M-46. In phase IV, the δ13C curve again shows a slow negative excursion from the weak positive excursion.
The deposits below point M-36 contain the trilobite Yaojiayuella Zone, which is the index fossil zone on the top of Stage 4, and the deposits above point M-36 contain the trilobite Shantungaspis Zone, which is the index fossil zone at the bottom of Wuliuan Stage; thus, the 0.7‰ δ13C value at point M-36 corresponds to the global RECE event. The weak positive excursion (0.75‰) at point M-13 occurs in the intersection of the trilobite Yaojiayuella Zone and Redlichia chinensis Zone of Stage 4, corresponding to the global Mingxinsi Carbon Isotope Excursion (MICE) event (Figure 2) [1]. It is noteworthy that there is a remarkable negative excursion of −3.45‰ at point M-30 (Figure 2). Stratigraphically, this point occurs 11.79 m below the Cambrian Series 2 to Miaolingian boundary and is not correlated with RECE. Purple laminated calcareous mudstone occurs at this point and was deposited in an intertidal environment. No doubt the oxidizing conditions of this sedimentary environment reduced the burial rate of organic matter, resulting in the decline of carbon isotope value in local seawater.

4.2.2. Carbon and Oxygen Isotopic Composition of the Luoquan Section

The carbonate δ13C values of Cambrian Stage 4 to Wuliuan Stage in the Luoquan section range from −8.82‰ to 1.04‰, with an average value of −1.29‰ in a total of 75 samples (Table 3). The carbonate δ18O values range from −11.83‰ to −4.46‰, with an average value of −9.19‰. The δ13C data from the Luoquan section can be divided into four phases (Figure 3). Phase I is a positive excursion in a larger value domain, fluctuating from −4.45‰ at the bottom of the Mantou Formation to 0.05‰ for point M2-45. Phase II exhibits an overall negative excursion and ends a peak negative excursion of −0.2‰ at point M2-27. Phase III gradually tends toward a positive excursion from a negative excursion of −0.2‰ at point M2–27 to 0.82‰ at point M2-11. Phase IV gradually tends toward a small negative excursion from a weak positive excursion.
The trilobite Yaojiayuella Zone and Shantungaspis Zone occur below and above point M2-27, respectively, reflecting that the −0.2‰ δ13C value at point M2-27 corresponds to the global RECE event, which can be compared with point M-36 in the Chishanhe section. The weak positive excursion (0.05‰) at point M2-45 can correspond to the global MICE event and can be compared with point M-13 in the Chishanhe section. There is a strong negative excursion of −6.46‰ at point M2-41A (Figure 3). Stratigraphically, this point occurs at 24.2 m below the Cambrian Series 2 to Miaolingian boundary and is not correlated with RECE. The reason for the decline to the carbon isotope value at this point is similar to that for point M-30 in the Chishanhe section.

5. Discussion

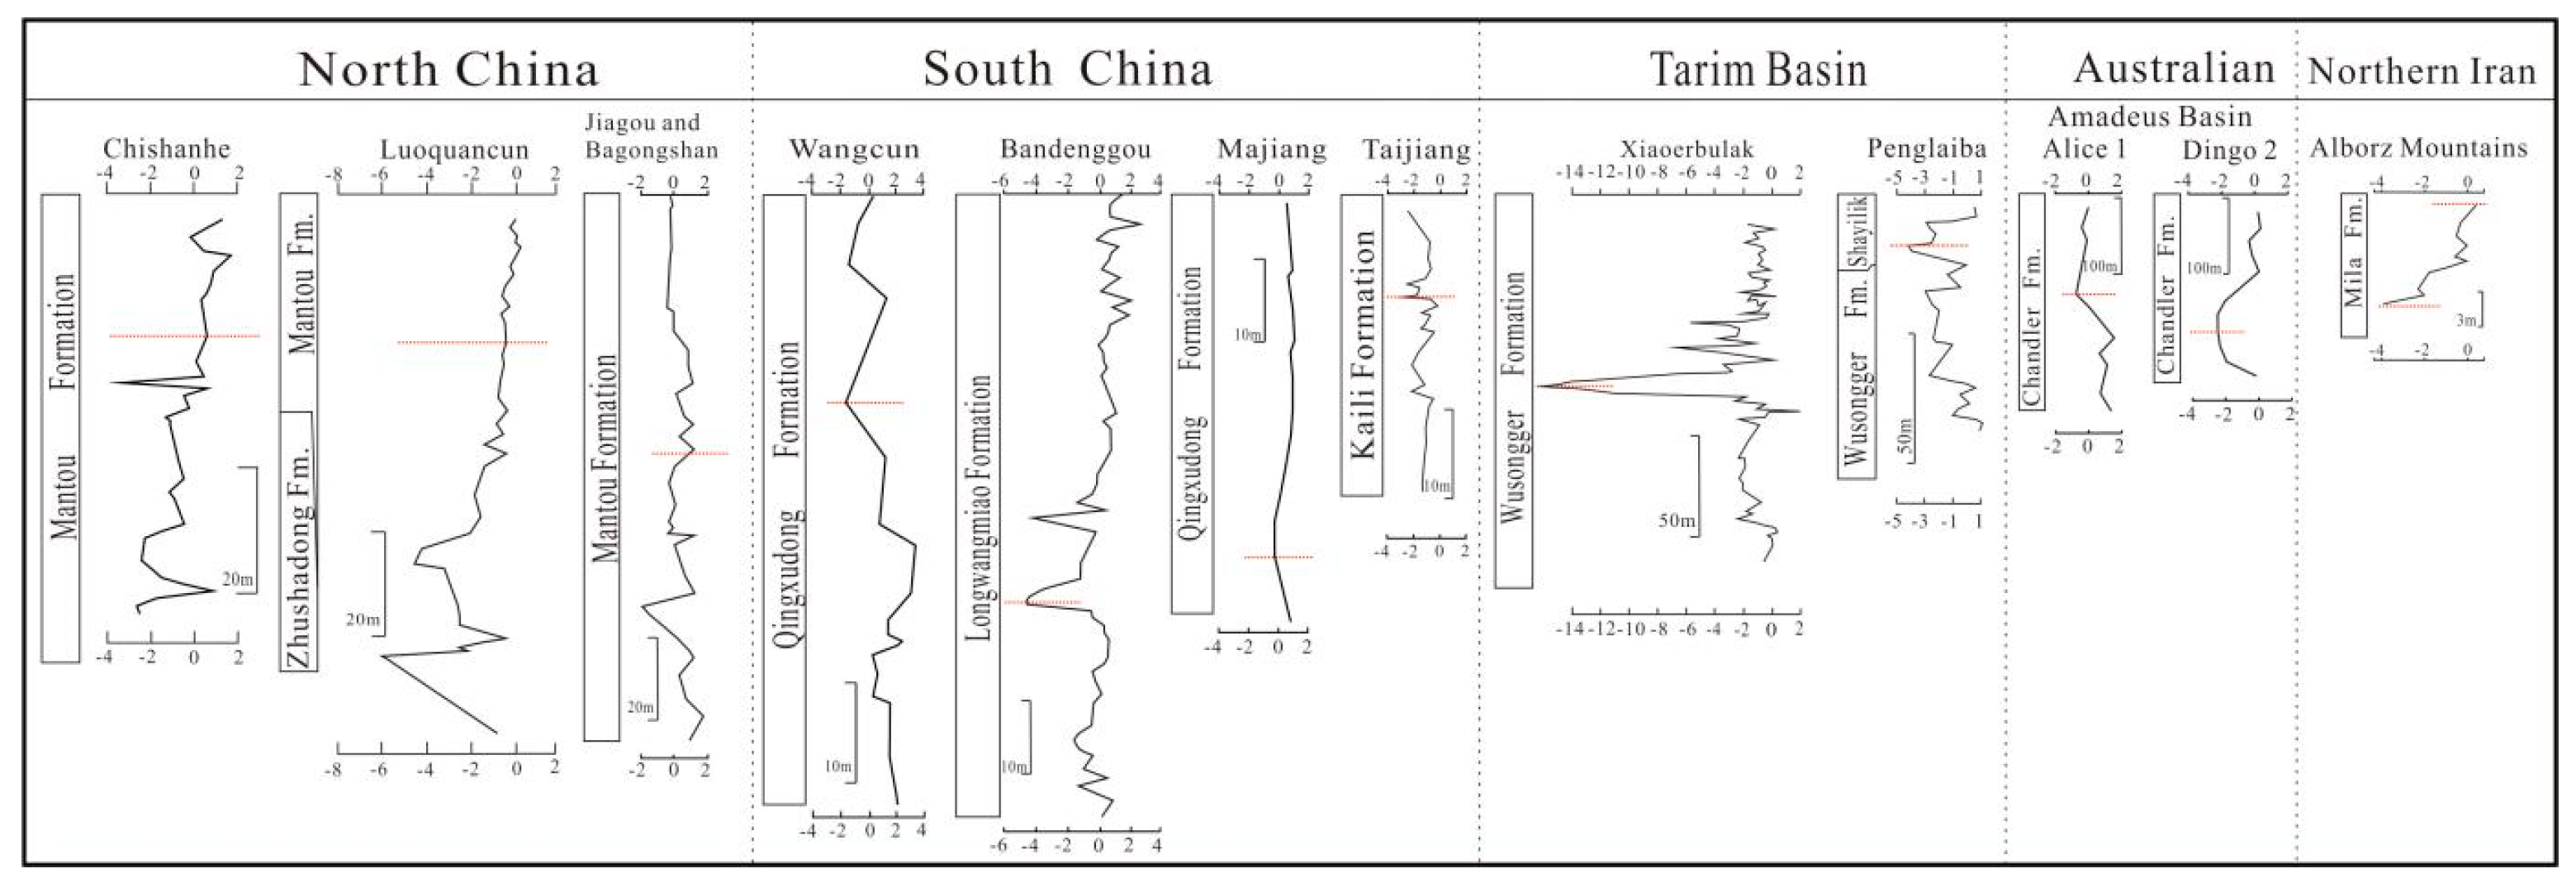
5.1. Global Correlation of the RECE Event

The variation in carbon isotope values from Chiashanhe and adjacent Luoquan sections shows that the carbon isotope excursions of two sections can be well correlated (Figure 2 and Figure 3). Phase I and II in two sections exhibit the variable negative values as a whole, except for the positive values of some limestone beds. The variation in carbon isotope excursion may be associated with the sedimentary environments of phase I and II, which are dominated by mudstones and silty mudstones of the supratidal–intertidal zone. The intermittently exposed sedimentary environments are easily affected by the inflow of local rivers and long-term oxidizing conditions, inducing the decay amplification of organic matter and the decline of organic carbon burial rate. Phase III exhibits a stable δ13C negative excursion as a whole, which is related to the high primary productivity and burial rate of organic carbon in carbonate platform environments. Phase IV shows a slow negative excursion trend with some weak positive values, which is associated with the alternation of carbonate platform and intertidal environment. The carbon isotope values at the Cambrian Series 2 to Miaolingian boundary in the Chishanhe section and the Luoquan section in the study area are 0.7‰ and −0.2‰, respectively, showing a weak negative excursion or even no negative excursion. The variation in carbon isotope excursions at the transition in the study area is very similar to that of the Jiagou section in southeastern North China [2].
The Global Boundary Stratotype Section and Point (GSSP) for the Miaolingian Series and Wuliuan Stage is based on the FAD of Oryctocephalus indicus in the Kaili Formation, Wuliu–Zengjiayan section, Jianhe County, Guizhou Province, China [56]. The robust negative carbon excursions (RECE) represent the critical interval in between the FAD of O. indicus and the extinction of redlichiid trilobites [5,56]. Tandem U–Pb detrital zircon MDAs from the Tapeats Sandstone in Arizona and Nevada of USA indicate that olenellid trilobites in Laurentia went extinct before the extinction of redlichiids and prior to the onset of the Miaolingian [21]. The statements above show that the globally synchronous extinctions of olenellids and redlichiids has been falsified [19,20,21]. In consideration of the asynchronous extinctions of olenellids and redlichiids, the correlations of carbon isotope excursions (RECE) below are related to the extinction of redlichiids in east Gondwana and China.
The distribution of RECE carbon isotope data for shallow-water environmental sections from twelve sections in the world ranges from −15.6‰ to 0.77‰ (Figure 9). The three remarkable negative excursions come from the Xiaoerbulak section of northwestern China, the Bandengou section of South China, and the Alborz Mountains of northern Iran (Figure 9). The carbon isotope values of the other nine sections range from −2.7‰ to 0.77‰ at the extinction horizon, in which four sections even show positive carbon isotope excursions. The RECE carbon isotope data distribution for the global shallow-water environments shows a relatively large dispersion and a poor distribution pattern. It can be seen that the greater dispersion and poorer distribution pattern of RECE carbon isotope data in shallow-water environments are related to lower organic carbon burial rates [8,13] and the oxidation conditions in shallow-water platforms amplifying decay of organic matter [2], in addition to the massive extinction of organisms due to sea invasion of shallow-water environments by anoxic water bodies. Shallow marine inner platform facies (commonly micritic carbonates) easily recorded the large magnitude negative δ13C excursions, which are valuable for global correlation. Numerous C isotope excursions are recorded for various Phanerozoic events, including the RECE event, and they coincide with global mass extinctions [2,12,57].
The distribution of RECE carbon isotope data from four deep-water environmental sections in South China is more stable, with values ranging from −6.9‰ to −2.76‰ (Figure 10). In general, all sections in the deep-water environments of the world exhibit significant negative excursions at the RECE horizon, with a small difference and stable distribution of δ13C peaks. There are no reports of positive carbon isotope excursion in the deep-water environments worldwide.
The high δ13C value (−2.76‰) of M3 in the Well K2 on the eastern Yangtze Platform, South China, was located in a shallow area close to the Ning–Chao Ancient Land, whereas the low δ13C value (−6.23‰) of D3 in the Well WN2 was in a deep region close to the Jiangnan Basin [8,59]. In the western Yangtze Platform, absolute δ13C values in the Wangcun section (−2.3‰) from the shallow-sea setting and the Jianshan section (−6.9‰) from the deep-sea setting have a similar situation in the eastern Yangtze Platform [8]. These confirm the existence of a shallow-to-deep seawater δ13C gradient at the Cambrian Series 2–Miaolingian transition [8]. The deep-water sections tend to have a buffer function for local conditions relative to those from the shallow-water platform, with similar δ13C records of the former and variable δ13C records of the latter [9].

5.2. Facies Changes and Anoxia at the Cambrian Series 2 to Miaolingian Transition

The upper Stage 4 of Cambrian Series 2 in the study area is dominated by the supratidal to subtidal zone of mixed clastic carbonates. The Wuliuan Stage are characterized by three similar depositional cycles changing from the oolites of oolitic shoal to mixed clastic carbonates of the intertidal–subtidal zone. The Cambrian Series 2–Miaolingian transition of the study area recorded a gradual rise of sea level. The suboxic to anoxic condition, reflected by geochemical data occurs in oncolite-bearing limestone (OBL) lithofacies at the top of Cambrian Series 2 (Figure 5), indicates that dysoxia was crucial to the reduction in organic carbon burial and RECE biotic crisis.
The Cambrian Series 2–Miaolingian transition recorded a gradual decrease in clastic deposits and a significant increase in carbonates in the Wuhai area of Inner Mongolia on the western margin of the North China Platform, reflecting the gradual expansion of sedimentary environments from nearshore to shallow-water continental shelves with transgression [32,60]. Pyrite framboids and heterotrophic bacteria reflecting anoxic/dysoxic bottom-water conditions are common in organic-rich dark laminae of oncoids, most likely located above the Cambrian Series 2–Miaolingian boundary.
A slow transgression was recorded at the Cambrian Series 2–Miaolingian transition in the western Tarim Platform, Xinjiang, reflecting the transformation from the evaporative and restricted platform dolostone of Stage 4 to the restricted and open platform limestones of Wuliuan. However, there is still no report of anoxic deposition [10,11,61].
The Cambrian Series 2–Miaolingian transition in South China is dominated by terrigenous clastic rock–carbonate successions in the western Yangtze Platform and carbonate–shale successions in the eastern Yangtze Platform [2,5,6,8,62]. The transgressive event at the transition resulted in temporal changes in the depositional environment, with parts of the shelf being flooded with less oxygenated basinal bottom waters [5].
The Thorntonia Limestone in the south Georgina Basin of Australia containing the Redlichia forresti trilobite zone is overlain by pyritic, anoxic–ferruginous conditions within the basal “Hot Shale” of the Arthur Creek Formation, marking the persistent anoxic conditions in a shallow continental seaway transgressing onto the Gondwanan continent [63,64]. The position of the R. forresti biozone in the Thorntonia Limestone and the overlying succession of black shales suggest that redlichiid trilobite extinction may either predate this severe anoxic event or coincide with the top of the Thorntonia Limestone and the onset of black shales [63,64].
It is noteworthy that the “greenhouse” paleoclimate state prevailed in carbonate platforms of many paleocontinents during much of the Cambrian time [27], except during Early Cambrian glaciation [65]. The rising temperature during the “greenhouse” interval would warm and expand sea water to increase sea-level rise [66,67]. Sea-level rise led to a feedback by which higher insolation heated epeiric seas and warmed the world ocean. More extensive epeiric seas heightened oceanic and global temperature as heat storage capacity increased and led to the formation of very intense greenhouse conditions (global hyperwarming) [68]. There are nine dysoxic/anoxic (d/a) intervals corresponding to the time of very intense greenhouse conditions in Early Paleozoic, in which the Hatch Hill dysoxic/anoxic (d/a) interval initiated from the terminal lower middle and led to the deposition of black-dark gray, d/a mudstone on the lower middle slope and shelf [68,69,70]. An anoxic water column below the surface mixed layer may have developed in Early Cambrian oceans during the transgression, accompanied by sluggish circulation and strong stratification. The paleoredox decreases with onlap and then leads to the extinction of trilobites in shallow water, which may have involved thickening and intensification of persistent, mid-water oxygen minimum zones (OMZs) and onlap onto continental shelves [71]. The persistence of anoxia/dysoxia to the shoreline resulted in shallow-water faunas experiencing relatively long-term environmental stress and a sharp decline in biomass [2,8,13,32,72].
Although the sharp decline in biomass at the Cambrian Series 2 to Miaolingian transition may have been affected by dysoxic/anoxic seawater resulting from the global transgression, regional events may also have been a contributing factor [73]. The transgression was unlikely to have completely impinged on shallow water environments under the influence of the local paleoenvironments [73]. The transformation of redox conditions from oxic to anoxic is inconsistent with RECE [74] and indicates that anoxia is not the sole cause of the prolonged major decline in metazoan diversity [8].

5.3. The Evolution of Biogenic Structures at the Cambrian Series 2 to Miaolingian Transition

The oncoids and MISS (Figure 6) occur widely in oncolite interbedded with marlstone lithofacies and oncoidal oolite lithofacies in the second interval of upper Stage 4, implying the emergence of a harsh environment associated with the RECE biotic crisis. In the Wuliuan Stage, there are many trace fossils in both carbonates and siliciclastic rocks. There are many trilobite traces such as Cruziana, Rusohycus, Diplichnites, Dimorphicnus (Figure 7D,E), and straight or curved worm traces Planolites and Palaeophycus (Figure 7F) on the fine sandstone or siltstone bedding surfaces. The diversification development of marine bottom communities in the Wuliuan Stage of the study area led to a noticeable increase in ichnodiversity, ichnoabundance, bioturbation intensity, depth of bioturbation, and burrow size, reflecting the occurrence of complex morphology and behavior pattern of benthic metazoan feeding structures, which indicates the recovery of benthic metazoa after the RECE biotic crisis.

6. Conclusions

The Cambrian Series 2–Miaolingian transition in the study area records a gradual rise in sea level and the evolution of depositional environments from clastic tidal flats to carbonate platforms. During this period, the overall environmental conditions were dysaerobic, or even locally anoxic. The suboxic to anoxic conditions are generally correlated with the RECE δ13C excursions and are hosted in oncolite-bearing limestone (OBL) lithofacies at the top of Cambrian Series 2. There is a general trend of sea-level deepening across the boundary of the Series 2–Miaolingian, reflecting the influences of transgression and seawater anoxia to RECE biotic crisis.
The carbon isotope excursions at the Cambrian Series 2–Miaolingian transition in the study area are 0.7‰ in the Chishanhe section and −0.2‰ in the Luoquan section, respectively, showing a weak negative excursion or even no negative excursion. The distribution of RECE carbon isotope data from the shallow-water environment of twelve sections in the world ranges from −15.6 to 0.77‰, showing a relatively large dispersion and a poor distribution pattern. The RECE carbon isotope values from the deep-water environments range from −6.9 to −2.76‰, reflecting a more stable data distribution with good comparability. These features indicate that the carbon isotope excursions of the shallow-water settings are closely related to the expansion of organic matter decay caused by the oxidative conditions and the reduction in primary productivity due to long-term river inflow.
The upper Stage 4 of the study area is dominated by both MISS and oncoids, implying the emergence of a harsh environment associated with the RECE biotic crisis. In Wuliuan Stage, carbonates and clastic rocks are heavily developed with metazoan bioturbated structures. The increase in ichnodiversity and ichnoabundance reflects the complex morphological and behavioral patterns exhibited by benthic metazoan feeding structures, suggesting the recovery of benthic metazoan fauna after the RECE biotic crisis.

Author Contributions

Conceptualization, Y.-A.Q. and M.-Y.D.; formal analysis, W.-Y.H.; funding acquisition, Y.-A.Q., M.-Y.D., M.W. and D.L.; investigation, B.-C.L. and G.-X.X.; project administration, Y.-A.Q.; software, W.-Y.H. and J.-B.L.; writing—original draft, W.-Y.H.; writing—review and editing, Y.-A.Q. All authors have read and agreed to the published version of the manuscript.

Funding

This work was financially supported by the Natural Science Foundation of China (grant no. 41872111 and 42272130) and the National Natural Science Foundation for Young Scientists of China (grant no. 41902115 and 41902113).

Data Availability Statement

All data and materials generated or analyzed during this study are included in this published paper.

Acknowledgments

The authors sincerely thank the anonymous reviewers for their detailed comments and constructive suggestions, which greatly improved this manuscript.

Conflicts of Interest

The authors declare no conflict of interest.

References

  1. Zhu, M.Y.; Babcock, L.E.; Peng, S.C. Advances in Cambrian stratigraphy and paleontology, integrating correlation techniques, paleobiology, taphonomy and paleoenvironment reconstruction. Palaeoworld 2006, 15, 217–222. [Google Scholar] [CrossRef]
  2. Zhu, M.Y.; Zhang, J.M.; Li, G.X.; Yang, A.H. Evolution of C isotopes in the Cambrian of China: Implications for Cambrian subdivision and trilobite mass extinctions. Geobios 2004, 37, 287–301. [Google Scholar] [CrossRef]
  3. Yang, R.D.; Zhu, L.J.; Wang, S.J.; Yuan, J.L.; Zhao, Y.L. Biological and stratigraphic significance of carbon isotopic negative abnormality near the boundary line of Taijiang River and Lower Cambrian in Guizhou. Chin. J. Geochem. 2002, 24, 108–115. [Google Scholar] [CrossRef]
  4. Guo, Q.J.; Strauss, H.; Liu, C.Q.; Zhao, Y.L.; Pi, D.H.; Fu, P.Q.; Zhu, L.J.; Yang, R.D. Carbon and oxygen isotopic composition of Lower to Middle Cambrian sediments at Taijiang, Guizhou Province, China. Geol. Mag. 2005, 142, 723–733. [Google Scholar] [CrossRef]
  5. Guo, Q.J.; Strauss, H.; Liu, C.Q.; Zhao, Y.L.; Yang, X.L.; Jin, P.; Yang, H. A negative carbon isotope excursion defines the boundary from Cambrian Series 2 to Cambrian Series 3 on the Yangtze platform, South China. Palaeogeogr. Palaeoclimatol. Palaeoecol. 2010, 285, 143–151. [Google Scholar] [CrossRef]
  6. Zuo, J.X.; Peng, S.C.; Zhu, X.J. Carbon isotope composition of Cambrian carbonate rocks in Yangtze Platform, South China and its geological implications. Geochimica 2008, 37, 118–128. [Google Scholar] [CrossRef]
  7. Ma, Z.X.; Li, B.; Liu, T.X.; Luo, L. Geochemical characteristics and implications for the evolution of sedimentary environments of Early Cambrian Qingxudong Formation in Eastern Guizhou, Southwestern China. Geol. Sci. Technol. Inf. 2015, 34, 71–77, (In Chinese with English Abstract). [Google Scholar]
  8. Chang, C.; Hu, W.X.; Wang, X.L.; Yu, H.; Yang, A.H.; Cao, J.; Yao, S.P. Carbon isotope stratigraphy of the lower to middle Cambrian on the eastern Yangtze Platform, South China. Palaeogeogr. Palaeoclimatol. Palaeoecol. 2017, 479, 90–101. [Google Scholar] [CrossRef]
  9. Ren, Y.; Zhong, D.K.; Gao, C.L.; Liang, T.; Sun, H.T.; Wu, D.; Zheng, X.W. High-resolution carbon isotope records and correlations of the lower Cambrian Longwangmiao Formation (Stage 4, Toyonian) in Chongqing, South China. Palaeogeogr. Palaeoclimatol. Palaeoecol. 2017, 485, 572–592. [Google Scholar] [CrossRef]
  10. Schmid, X.L.; Hu, W.X.; Yao, S.P.; Chen, Q.; Xie, X.M. Carbon and strontium isotopes and global correlation of Cambrian Series 2–Series 3 carbonate rocks in the Keping area of the northwestern Tarim Basin, NW China. Mar. Pet. Geol. 2011, 28, 992–1008. [Google Scholar] [CrossRef]
  11. Wu, Y.S.; Wang, W.; Jiang, H.X.; Cui, Y.; Zhao, R.; Huang, Z.B.; Yang, Z.L.; Chen, Y.Q. Evolution patterns of seawater carbon isotope composition during the Cambrian and their stratigraphic significance. Geol. J. 2021, 56, 457–474. [Google Scholar] [CrossRef]
  12. Amin-Rasouli, H.; Lasemi, Y. Facies changes and a major negative δ13C shift suggest the base of Mila Formation as the likely base of the Miaolingian Series, Alborz Mountains, northern Iran. Sediment. Rec. 2021, 19, 11–14. [Google Scholar] [CrossRef]
  13. Montañez, I.P.; Osleger, D.A.; Banner, J.L. Evolution of the Sr and C isotope composition of Cambrian oceans. GSA Today 2000, 10, 1–7. [Google Scholar]
  14. Dilliard, K.A. Stable isotope geochemistry of the lower Cambrian Sekwi Formation, Northwest Territories, Canada: Implications for ocean chemistry and secular curve generation. Palaeogeogr. Palaeoclimatol. Palaeoecol. 2007, 256, 174–194. [Google Scholar] [CrossRef]
  15. Álvaro, J.J.; Ahlberg, P.; Axheimer, N. Skeletal carbonate productivity and phosphogenesis at the Lower-Middle Cambrian transition of Scania, southern Sweden. Geol. Mag. 2010, 147, 59–76. [Google Scholar] [CrossRef]
  16. Wotte, T.; Strauss, H.; Fugmann, A.; Garbe-Schönberg, D. Paired δ34S data from carbonate associated sulfate and chromium–reducible sulfur across the traditional Lower–Middle Cambrian boundary of W-Gondwana. Geochim. Cosmochim. Acta 2012, 85, 228–253. [Google Scholar] [CrossRef]
  17. Faggetter, L.E.; Wignall, P.B.; Pruss, S.B.; Newton, R.J.; Sun, Y.D.; Crowley, S. Trilobite extinctions, facies changes and the ROECE carbon isotope excursion at the Cambrian Series 2-3 boundary, Great Basin, western USA. Palaeogeogr. Palaeoclimatol. Palaeoecol. 2017, 478, 53–66. [Google Scholar] [CrossRef]
  18. Shabanov, Y.Y.; Korovnikov, I.V.; Pereladov, V.S. The section of the Kuonamka Formation of the Molodo River—A candidate for a global stratigraphy of the lower boundary of the Middle Cambrian (East Siberian Platform). In Proceedings of the 13th International Field Conference of the Cambrian Subdivision Working Group (Siberian Platform, Western Yakutia), Yakutsk, Russia, 20 July–1 August 2008; pp. 60–70. Available online: https://www.academia.edu/2516364/13th_International_Field_Conference_of_the_Cambrian_Stage_Subdivision_Working_Group_Siberian_Platform_Western_Yakutia_ (accessed on 16 September 2021).
  19. Lin, J.P.; Sundberg, F.A.; Jiang, G.; Montañez, I.P.; Wotte, T. Chemostratigraphic correlations across the first major trilobite extinction and faunal turnovers between Laurentia and South China. Sci. Rep. 2019, 9, 1–15. [Google Scholar] [CrossRef] [PubMed] [Green Version]
  20. Geyer, G. A comprehensive Cambrian correlation chart. Episodes 2019, 42, 321–332. [Google Scholar] [CrossRef]
  21. Sundberg, F.A.; Karlstrom, K.E.; Geyer, G.; Foster, J.R.; Hagadorn, J.W.; Mohr, M.T.; Schmitz, M.D.; Dehler, C.M.; Crossey, L.J. Asynchronous trilobite extinctions at the early to middle Cambrian transition. Geology 2020, 48, 441–445. [Google Scholar] [CrossRef]
  22. Erwin, D.H. Lessons from the past: Biotic recoveries from mass extinctions. Proc. Natl. Acad. Sci. USA 2001, 98, 5399–5403. [Google Scholar] [CrossRef] [PubMed] [Green Version]
  23. Wignall, P.B. Large igneous provinces and mass extinctions. Earth-Sci. Rev. 2001, 53, 1–33. [Google Scholar] [CrossRef]
  24. Hallam, T. Catastrophes and Lesser Calamities: The Causes of Mass Extinctions; Oxford University Press: Oxford, UK, 2005; pp. 1–274. [Google Scholar] [CrossRef]
  25. Meyer, K.M.; Kump, L.R.; Ridgwell, A. Biogeochemical controls on photic-zone euxinia during the end-permian mass extinction. Geology 2008, 36, 747–750. [Google Scholar] [CrossRef]
  26. Evins, L.Z.; Jourdan, F.; Phillips, D. The Cambrian Kalkarindji large igneous province: Extent and characteristics based on new 40Ar/39Ar and geochemical data. Lithos 2009, 110, 294–304. [Google Scholar] [CrossRef] [Green Version]
  27. Berner, R.A. Atmospheric carbon dioxide through Phanerozoic time. Science 1990, 249, 1382–1386. [Google Scholar] [CrossRef]
  28. Railsback, L.B. Influence of changing deep ocean circulation on the Phanerozoic oxygen isotopic record. Geochim. Cosmochim. Acta 1990, 54, 1501–1509. [Google Scholar] [CrossRef]
  29. Zhuravlev, A.Y.; Wood, R.A. Anoxia as the cause of the mid-Early Cambrian (Botomian) extinction event. Geology 1996, 24, 311–314. [Google Scholar] [CrossRef]
  30. Mata, S.A.; Bottjer, D.J. Microbes and mass extinctions: Paleoenvironmental distribution of microbialites during times of biotic crisis. Geobiology 2012, 10, 3–24. [Google Scholar] [CrossRef]
  31. Hough, M.L.; Shields, G.A.; Evins, L.Z.; Strauss, H.; Henderson, R.A.; Mackenzie, S. A major Sulphur isotope event at c.510Ma: A possible anoxia-extinction-volcanism connection during the Early-Middle Cambrian transition? Terra Nova 2006, 18, 257–263. [Google Scholar] [CrossRef]
  32. Zhang, W.H.; Shi, X.Y.; Jiang, G.Q.; Tang, D.J.; Wang, X.Q. Mass-occurrence of oncoids at the Cambrian Series2-Series 3 transition: Implications for microbial resurgence following an Early Cambrian extinction. Gondwana Res. 2015, 28, 432–450. [Google Scholar] [CrossRef]
  33. Schmid, S. Chemostratigraphy and palaeo-environmental characterisation of the Cambrian stratigraphy in the Amadeus basin, Australia. Chem. Geol. 2017, 451, 169–182. [Google Scholar] [CrossRef]
  34. Feng, Z.Z.; Peng, Y.M.; Jin, Z.K.; Bao, Z.D. Lithofacies Paleogeography of the Cambrian and Ordovician in China; Petroleum Industry Press: Beijing, China, 2004; p. 233. (In Chinese) [Google Scholar]
  35. Mei, M.X.; Guo, R.T.; Hu, Y. Sedimentary fabrics for the stromatolitic bioherm of the Cambrian Gushan Formation at the Xiaweidian section in the western suburb of Beijing. Acta Petrol. Sin. 2011, 27, 2473–2486. [Google Scholar] [CrossRef]
  36. Pei, F.; Zhang, H.Q.; Yan, G.S. Stratigraphic Paleontology Research of Henan Province, Early Paleozoic Era, North China; Yellow River Water Resources Press: Zhengzhou, China, 2008; pp. 1–302. [Google Scholar]
  37. Yuan, J.L.; Li, Y. Lower and Middle Cambrian boundary and trilobite fauna of the Laoying Mountains, Huainan, Anhui Province. Acta Palaeontol. Sin. 1999, 38, 407–422, (In Chinese with English Abstract). [Google Scholar]
  38. Zhu, M.Y.; Yang, A.H.; Yuan, J.L.; Li, G.X.; Zhang, J.M.; Zhao, F.C.; Ahn, S.Y.; Miao, L.Y. Cambrian integrative stratigraphy and timescale of China. Sci. China Earth Sci. 2019, 62, 25–60. [Google Scholar] [CrossRef]
  39. Banner, J.L.; Hanson, G.N. Calculation of simultaneous isotopic and trace element variations during water rock interaction with applications to carbonate diagenesis. Geochim. Cosmochim. Acta 1990, 54, 3123–3137. [Google Scholar] [CrossRef]
  40. Kaufman, A.J.; Knoll, A.H. Neoproterozoie variations in the C-isotopic composition of seawater: Stratigraphic and biogeochemical implications. Precambrian Res. 1995, 73, 27–49. [Google Scholar] [CrossRef]
  41. Nie, Y.; Fu, X.; Xu, W.; Wen, H.G.; Wang, Z.W.; Song, C.Y. Redox conditions and climate control on organic matter accumulation and depletion during the Toarcian in the Qiangtang Basin, eastern Tethys. Int. J. Earth Sci. 2020, 109, 1977–1990. [Google Scholar] [CrossRef]
  42. Jones, B.; Manning, D.A.C. Comparison of geochemical indices used for the interpretation of palaeoredox conditions in ancient mudstones. Chem. Geol. 1994, 111, 111–129. [Google Scholar] [CrossRef]
  43. Bai, S.L. Devonian Events and Biostratigraphy of South China; Peking University Press: Beijing, China, 1994; pp. 21–23. [Google Scholar]
  44. Hatch, J.R.; Leventhal, J.S. Relationship between inferred redox potential of the depositional environment and geochemistry of the Upper Pennsylvanian (Missourian) Stark Shale Member of the Dennis Limestone, Wabaunsee County, Kansas, U.S.A. Chem. Geol. 1992, 99, 65–82. [Google Scholar] [CrossRef]
  45. Wignall, P.B.; Twitchett, R.J. Oceanic Anoxian and the End Permian Mass Extinction. Science 1996, 272, 1155–1158. [Google Scholar] [CrossRef]
  46. Xiong, G.Q.; Jiang, X.S.; Cai, X.Y.; Wu, H. The charactristics of trace element and REE Geochemistry of the Cretaceous Mudrock and Shales from Southern Tibet and Its analysis of Redox Condition. Adv. Earth Sci. 2010, 25, 730–745. (In Chinese) [Google Scholar]
  47. Lasemi, Y.; Jahani, D.; Amin-Rasouli, H.; Lasemi, Z. Ancient carbonate tidalites. In Principles of Tidal Sedimentology; Davis, R.A., Dalrymple, R.W., Eds.; Springer Science+Business Media: Berlin/Heidelberg, Germany, 2012; pp. 567–607. [Google Scholar] [CrossRef]
  48. Kumar, B.; Sharma, S.D.; Sreenivas, B.; Dayal, A.M.; Rao, M.N.; Dubey, N.; Chawla, B.R. Carbon, oxygen and strontium isotope geochemistry of Proterozoic carbonate rocks of the Vindhyan Basin, central India. Precambrian Res. 2002, 113, 43–63. [Google Scholar] [CrossRef]
  49. Knauth, L.P.; Kennedy, M.J. The Late Precambrian greening of the Earth. Nature 2009, 460, 728–732. [Google Scholar] [CrossRef] [PubMed]
  50. Frank, T.D.; Lyons, T.W. The integrity of δ18O records in Precambrian carbonates, a Mesoproterozoic case study. Soc. Sediment. Geol. 2012, 67, 315–326. [Google Scholar] [CrossRef]
  51. Jacobson, S.B.; Kaufman, A.J. The Sr, C, and O isotopic evolution of the Neoproterozoic seawater. Chem. Geol. 1999, 161, 37–57. [Google Scholar] [CrossRef]
  52. Swart, P.K.; Oehlert, A.M. Revised interpretations of stable C and O patterns in carbonate rocks resulting from meteoric diagenesis. Sediment. Geol. 2018, 364, 14–23. [Google Scholar] [CrossRef]
  53. Derry, L.A.; Kaufman, A.J.; Jacobsen, S. Sedimentary cycling and environmental change in the late Proterozoic: Evidence from stable and radiogenic isotopes. Geochim. Cosmochim. Acta 1992, 56, 1317–1329. [Google Scholar] [CrossRef]
  54. Kaufman, A.J.; Jacobsen, S.B.; Knoll, A.H. The Vendian record of Sr and C isotopic variations in seawater: Implications for tectonics and paleoclimate. Earth Planet. Sci. Lett. 1993, 120, 409–430. [Google Scholar] [CrossRef]
  55. Ngia, N.R.; Hu, M.; Gao, D.; Hu, Z.; Sun, C.Y. Application of stable strontium isotope geochemistry and fluid inclusion microthermometry to studies of dolomitization of the deeply buried cambrian carbonate successions in west-central Tarim basin, northwestern China. J. Earth Sci. 2019, 30, 176–193. [Google Scholar] [CrossRef]
  56. Zhao, Y.; Yuan, J.L.; Babcock, L.E.; Guo, Q.J.; Peng, J.; Yin, L.M.; Yang, X.L.; Peng, S.C.; Wang, C.J.; Gaines, E.R.; et al. Global Standard Stratotype-Section and Point (GSSP) for the conterminous base of the Miaolingian Series and Wuliuan Stage (Cambrian) at Balang, Jianhe, Guizhou, China. Episodes 2019, 42, 165–184. [Google Scholar] [CrossRef] [Green Version]
  57. Saltzman, M.R.; Edwards, C.T.; Adrain, J.M.; Westrop, S.R. Persistent oceanic anoxia and elevated extinction rates separate the Cambrian and Ordovician radiations. Geology 2015, 43, 807–810. [Google Scholar] [CrossRef] [Green Version]
  58. Guo, Q.J.; Strauss, H.; Yang, Y.; Zhao, Y.L.; Yang, X.L.; Jin, P.; Deng, Y. Reconstructing marine redox conditions for the transition between Cambrian Series 2 and Cambrian Series 3, Kaili area, Yangtze Platform: Evidence from biogenic sulfur and degree of pyritization. Palaeogeogr. Palaeoclimatol. Palaeoecol. 2014, 398, 144–153. [Google Scholar] [CrossRef]
  59. Lu, L.; Ji, Y. Sequence stratigraphic framework and palaeogeography evolution of the Cambrian in lower Yangtze area. J. Palaeogeogr. 2013, 15, 765–776. [Google Scholar] [CrossRef]
  60. Zhang, W.H.; Shi, X.Y.; Tang, D.J.; Wang, X.Q. Mass-occurrence of oncoids in the Early–Middle Cambrian transition at western margin of North China Platform: A response of microbial community to shallow marine anoxia. J. Palaeogeogr. 2014, 16, 305–318, (In Chinese with English Abstract). [Google Scholar] [CrossRef]
  61. Yang, R.C.; Fan, A.P.; Han, Z.Z.; Chi, N.J. Status and prospect of studies on oncoid. Adv. Earth Sci. 2011, 26, 465–474. [Google Scholar] [CrossRef] [Green Version]
  62. Zhao, Y.L.; Yuan, J.L.; Peng, S.C.; Babcock, L.E.; Peng, J.; Jih-Pai Lin Guo, Q.J.; Wang, Y.X. New data on the Wuliu–Zengjiayan section (Balang, South China), GSSP candidate for the base of Cambrian Series 3. Mem. Assoc. Australas. Palaeoutolagists 2007, 33, 57–65. Available online: http://ir.nigpas.ac.cn/handle/332004/10501 (accessed on 23 November 2022).
  63. Creveling, J.R.; Johnston, D.T.; Poulton, S.W.; Kotrc, B.; März, C.; Schrag, D.P.; Knoll, A.H. Phosphorus sources for phosphatic Cambrian carbonates. Geol. Soc. Am. Bull. 2014, 126, 145–163. [Google Scholar] [CrossRef]
  64. Pagès, A.; Schmid, S. Euxinia linked to the Cambrian Drumian carbon isotope excursion (DICE) in Australia: Geochemical and chemostratigraphic evidence. Palaeogeogr. Palaeoclimatol. Palaeoecol. 2016, 461, 65–76. [Google Scholar] [CrossRef]
  65. Landing, E.; MacGabhann, B.A. First evidence for Cambrian glaciation provided by sections in Avalonian New Brunswick and Ireland—Additional data for Avalon–Gondwana separation by the earliest Palaeozoic. Palaeogeogr. Palaeoclimatol. Palaeoecol. 2010, 285, 174–185. [Google Scholar] [CrossRef]
  66. Kidder, D.L.; Worsley, T.R. Causes and consequences of extreme Permo-Triassic warming and relation to globally equable climate and relation to the Permo-Triassic extinction and recovery. Palaeogeogr. Palaeoclimatol. Palaeoecol. 2004, 203, 207–257. [Google Scholar] [CrossRef]
  67. Kidder, D.L.; Worsley, T.R. Phanerozoic Large Igneous Provinces (LIPs), HEATT (Haline Euxinic Acidic Thermal Transgression) episodes, and mass extinctions. Palaeogeogr. Palaeoclimatol. Palaeoecol. 2010, 295, 162–197. [Google Scholar] [CrossRef]
  68. Landing, E. Time-specific black mudstones and global hyperwarming on the Cambrian–Ordovician slope and shelf of the Laurentia palaeocontinent. Palaeogeogr. Palaeoclimatol. Palaeoecol. 2012, 367, 256–272. [Google Scholar] [CrossRef]
  69. Landing, E.; Geyer, G.; Bartowski, K.E. Latest Early Cambrian small shelly fossils, trilobites, and Hatch Hill dysaerobic interval on the east Laurentian continental slope. J. Paleontol. 2002, 76, 285–303. [Google Scholar] [CrossRef]
  70. Landing, E.; Webster, M. Iapetan rift–passive margin transition in NE Laurentia and eustatic control on continental slope oxygenation, Taconic slate colors, and Early Paleozoic climate. In Proceedings of the 110th New England Intercollegiate Geological Conference and 90th New York Geological Association, Lake George, NY, USA, 12–14 October 2018; Grover, T.W., Mango, H., Eds.; Fort William Henry Hotel and Conference Center: Lake George, NY, USA; pp. A5-1–A5-41. [Google Scholar]
  71. Landing, E.; Westrop, S.R.; Geyer, G. Trans-Avalonian green–black boundary (early Middle Cambrian): Transform fault-driven epeirogeny and onset of 26 m.y. of shallow marine anoxia in Avalonia (Rhode Island–Belgium) and Baltica. Can. J. Earth Sci. 2022; in press. [Google Scholar]
  72. Wilde, P.; Berry, W.B.N. Destabilization of the oceanic density structure and its signifificance to marine “extinction” events. Palaeogeogr. Palaeoclimatol. Palaeoecol. 1984, 48, 143–162. [Google Scholar] [CrossRef]
  73. Zhang, P.Y.; Wang, Y.L.; Zhang, X.J.; Wei, Z.F.; Wang, G.; Zhang, T.; He, M.; Wei, J.Y.; He, W.; Ma, X.Y.; et al. Carbon, oxygen and strontium isotopic and elemental characteristics of the Cambrian Longwangmiao Formation in South China: Paleoenvironmental significance and implications for carbon isotope excursions. Gondwana Res. 2022, 106, 174–190. [Google Scholar] [CrossRef]
  74. Li, C.; Jin, C.; Planavsky, N.J.; Algeo, T.J.; Cheng, M.; Yang, X.; Zhao, Y.; Xie, S. Coupled oceanic oxygenation and metazoan diversification during the early–middle Cambrian? Geology 2017, 45, 743–746. [Google Scholar] [CrossRef]
Figure 1. Location of the section; (A) paleogeography of the North China Craton in the Cambrian Miaolingian (modified after [34]); (B) stratigraphic classification of the Cambrian in the North China Craton [36]; (C) field photograph of the study area.
Minerals 12 01526 g001
Figure 2. Facies changes, biogenic structures, and chemostratigraphy of the Cambrian Series 2 to Mialingian transition in the Chishanhe section. The sea-level curve and biostratigraphy data are modified after [36].
Minerals 12 01526 g002
Figure 3. Facies changes, biogenic structures, and chemostratigraphy of the Cambrian Series 2 to Mialingian transition in the Luoquan section. The sea-level curve and biostratigraphy data are modified after [36].
Minerals 12 01526 g003
Figure 4. Field photographs from the first interval of upper Stage 4: (A) shales in SH lithofacies; (B) alternation of dolomudstone and dolomitic limestone in DDL lithofacies; (C) vugular cavities partially or entirely filled with calcite crystals in DDL lithofacies; (D) siltstone interbedded with mudstone in SMI lithofacies; (E) micrites in MIC lithofacies; (F) flat pebble conglomerates in FPC lithofacies.
Minerals 12 01526 g004
Figure 5. Analysis of trace elements showing the redox condition variation at the Cambrian Series 2 to Miaolingian transition in the study area.
Minerals 12 01526 g005
Figure 6. Field photographs from the second interval of upper Stage 4: (A) oncolite-bearing limestone in OBL lithofacies; (B) polarizing micrograph of oncoid; (C) erosional surface in an oncolite-bearing limestone; (D) oncoidal ooiltic limestone in OOL lithofacies; (E,F) spindle shrinkage cracks on the surfaces of limestone.
Minerals 12 01526 g006
Figure 7. Field photographs from Wuliuan Stage: (A) oolitic limestones in OO lithofacies; (B) fine sandstones with cross beddings in SSM lithofacies; (C) silty mudstone interbedded with siltstone and micrite in MSM lithofacies; (D,E) trilobite traces on the surfaces of siltstones in SSM lithofacies; (F) straight or curved burrows on the surfaces of siltstones in SSM lithofacies.
Minerals 12 01526 g007
Figure 8. Crossplot of δ18O vs. δ13C, and microscopic photograph of study area: (A) Chishanhe section; (B) Luoquan section; (C,D) micrograph of micrite matrix.
Minerals 12 01526 g008
Figure 9. The distribution of ROECE carbon isotope data for shallow water environmental sections worldwide. Data from Chishanhe and Luoquan, this study; Jiagou and Bagongshan, North China [2]; Wangcun, South China [2]; Bandenggou, South China [9]; Majiang, South China [7]; Taijiang, South China [4]; Xiaoerbulak, Northwest China [11]; Xiaoerbulak, Northwestern China [10]; Alice 1 and Dingo 2 in Amadeus Basin, Australia [33]; Alborz Mountains, northern Iran [12].
Minerals 12 01526 g009
Figure 10. The distribution of RECE carbon isotope data for deep-water environmental sections in South China. Data from Wuliu–Zengjiayan and Jianshan, South China [58]; Well K2 and Well WN2, East China [8].
Minerals 12 01526 g010
Table 1. The abbreviations for lithofacies types, biogenic structures, and depositional environments of the study area.
Lithofacies TypeBiogenic StructuresDepositional Environment
Shale (SH) supratidal zone (SPT)
Alternation of dolostone and dolomitic limestone (DDL) intertidal zone (IT)
Siltstone with mudstone interbeds (SMI) intertidal zone (IT)
Micrite (MIC) subtidal zone (SBT)
Flat pebble conglomerate (FPC) intertidal zone (IT)
Oncolite-bearing limestone (OBL)oncoids (ONC), microbially induced sedimentary structures (MISS)subtidal zone (SBT)
Oncoidal oolitic limestone (OOL)microbially induced sedimentary structures (MISS)subtidal zone (SBT)
Oolite (OO)trace fossils Skolithos (Sk)oolite shoal (OS)
Fine sandstone interbedded with Siltstone and silty mudstone (SSM)trace fossils Cruziana (Cr), Rusophycus (Ru), Diplichnites (Di), Dimorphichnus (Dim), Planolites (Pl), Palaeophycus (Pal)intertidal–subtidal zone (IST)
Silty mudstone interbedded with Siltstone and micrite (MSM)trace fossil Planolites (Pl)intertidal zone (IT)
Table 2. Data of δ13C and δ18O of the Cambrian Series 2 to Mialingian transition in the Chishanhe section (VPDB, ‰).
Sample IDδ13Cδ18ORockNumberδ13Cδ18ORock
M–65−0.65−10.66LM–360.70−11.58L
M–64−0.58−9.52LM–350.50−10.98L
M–63−0.34−10.62LM–340.21−10.37L
M–62−0.27−6.78LM–330.51−10.74L
M–61−0.41−10.54LM–32−0.09−11.08L
M–60−1.07−11.20LM–310.44−10.90L
M–59−0.94−11.21LM–30−3.45−7.27M
M–58−1.86−8.02LM–290.51−12.80L
M–57−0.30−9.94LM–28−0.78−12.73L
M–56−0.25−10.97LM–27−0.57−9.95L
M–55−1.33−10.57LM–26−1.48−9.68L
M–54−0.36−10.30LM–25−1.34−8.09L
M–53−0.47−10.70LM–24−1.38−10.78L
M–52−0.04−10.57LM–23−0.96−9.94L
M–51−0.22−9.76LM–22−0.74−10.62L
M–49−0.30−10.97LM–21−1.32−10.24L
M–48−0.66−10.97LM–20−1.07−9.01D
M–47.5②0.09−11.34LM–19−0.70−7.42D.L
M–47.50.57−11.65LM–18−1.64−9.94L
M–470.54−12.64LM–17.5−2.35−9.34L
M–460.78−12.06LM–17−2.49−9.83L
M–450.69−11.27LM–16−2.13−7.94L
M–44.50.54−7.62LM–15−1.59−8.91L
M–440.82−10.52LM–14−0.60−11.50L
M–430.82−10.47LM–130.75−9.10L
M–420.93−11.01LM–12−1.93−11.61L
M–411.59−7.27LM–11−2.77−11.27L
M–401.13−10.60LM–10−2.63−8.31L
M–39−0.45−10.11LM–9−1.76−6.79D
M–38.50.45−10.70LM–4−0.20−8.55D
M–381.57−9.46LM–3−0.46−9.22D
M–370.83−10.36LM–20.11−9.08D
M–11.03−7.87D
D—dolostone; L—limestone; M—marlstone; D.L—dolomitic limestone. M–47.5② is the dense supplement sample point of M-47.5.
Table 3. Data of δ13C and δ18O of the Cambrian Series 2 to Mialingian transition in the Luoquan section (VPDB, ‰).
Sample IDδ13Cδ18ORockNumberδ13Cδ18ORock
M3-1−1.53−7.24LM2-24−0.03−10.84L
M3-2−1.61−11.16LM2-250.07−9.13L
M3-3−0.75−6.57LM2-26−0.33−11.04L
M3-4−1.33−10.56LM2-27−0.20−10.69L
M3-5−2.38−11.62LM2-28−0.48−10.90L
M3-6−1.03−4.46LM2-29−0.69−7.97L
M3-7−0.85−10.20LM2-300.13−8.01L
M3-8−1.60−6.13LM2-31−0.82−11.51L
M3-9−1.18−7.77LM2-32−0.15−9.99L
M3-10−1.13−9.81LM2-330.05−9.62L
M3-11−1.35−9.06LM2-34−1.70−8.76L
M3-12−1.57−5.27LM2-35−1.63−8.51L
M3-13−1.13−10.30LM2-37−2.14−9.77L
M3-14−0.97−11.70LM2-38−1.91−10.62L
M3-15−1.24−10.57LM2-39−2.64−10.51L
M3-16−0.89−10.15LM2-40−6.05−11.24L
M3-17−0.81−9.13LM2-41A−6.46−11.67L
M3-18−1.39−10.58LM2-41B−4.24−10.21L
M3-19−1.26−8.41LM2-42−3.39−5.49L
M3-200.68−9.38LM2-43−3.14−8.41L
M2-5−0.32−11.29LM2-44−3.18−7.06L
M2-70.71−8.68LM2-450.05−11.59L
M2-80.33−8.15LM2-46−1.75−10.81L
M2-9−1.99−10.68LM2-47−3.30−10.73L
M2-10−0.06−10.93LM2-48−2.84−9.40L
M2-110.82−9.28LM2-49−8.82−9.20L
M2-120.29−5.78LM2-50−8.42−9.55L
M2-130.91−8.63LM1-2−0.49−11.47D
M2-140.70−7.96LM1-30.40−11.83D
M2-151.04−5.81LM1-4−1.07−8.64L
M2-160.81−9.36LM1-5−1.60−11.35L
M2-170.35−8.84LM1-6−0.42−9.08D
M2-180.50−10.81LM1-7−3.67−11.15D
M2-19−0.06−9.92LM1-8−0.55−10.64D
M2-20−0.38−9.06LM1-10−0.16−6.58L.D
M2-210.23−5.78LM1-11−6.30−6.54D
M2-23−0.37−11.15LM1-12−4.58−9.10D
M1-13−4.45−6.04D
Publisher’s Note: MDPI stays neutral with regard to jurisdictional claims in published maps and institutional affiliations.

