Abstract
Experimental data from viscosity measurements of 124 glassy slags were used to drive and develop machine learning models that could be used for direct or indirect viscosity prediction. Samples were categorized according to the content of chemical components or general competitive neural network. The direct viscosity prediction using artificial neural network models of different kinds of slag samples was established. The prediction average error and maximum absolute error in the corresponding models were significantly smaller than the artificial neural network without categorizing the samples. Moreover, the viscosity curve for each glassy slag was fitted by a general formula, and the corresponding parameters were obtained. The principal component analysis (PCA)–particle swarm optimization (PSO)–back propagation (BP) neural network models for predicting parameters were proposed. This indirect approach was considered to successfully overcome the limitations of temperature and viscosity ranges in direct prediction while delivering smooth viscosity curves.
1. Introduction
Molten gasification is considered a promising technology for clean processing and safe disposal of hazardous wastes, which combines chemical conversion and fusion of inorganic substances. When the temperature exceeds the melting point of hazardous minerals, chemical transformation and mineral melting take place simultaneously. At the same time, the organic matter is completely decomposed. The harmful substances released are completely absorbed by the slag [1,2,3]. In order to discharge the slag stably and reliably, it is necessary to ensure that the viscosity of the slag meets the requirements of the molten gasifier. In addition, the slag should be converted into glass with the least leaching tendency, so that the harmful elements contained will be unable to leak into the environment. The high-temperature flow characteristics of slag determine the stable operation of the gasifier, which is mainly affected by the ash chemical composition of hazardous wastes [4,5,6]. The fluidity of slag is often obtained by viscosity measurement, which is very time-consuming, expensive, and laborious [2,6,7]. Therefore, the prediction of slag viscosity has important theoretical and practical significance. The viscosity of glassy slag varies relatively smoothly with temperature and has no sudden change-point, which is the main object of prediction [5,6,7]. The atmosphere and cooling rate during viscosity measurement can affect the results [4,8,9]. The level of Na2O content also has a significant impact on the accuracy of the viscosity prediction model [6,7,10,11].
An artificial neural network model established by collecting a large amount of experimental data can predict accurately the viscosity over a broad range of temperatures and slag compositions [12,13,14]. For the division based on slag composition, unsupervised learning algorithms of neural networks can be applied [15,16]. Furthermore, other algorithms of machine learning can optimize predictive models to improve accuracy. Principal component analysis (PCA) can reduce the redundant input of the model to improve the prediction accuracy [17,18]. A swarm-intelligence-optimized neural network also can avoid results from falling into a local minimum and improve prediction performance. Particle swarm optimization (PSO) is commonly used to optimize the neural network, which is expected to further improve the accuracy of slag viscosity prediction [19,20]. By applying these machine learning techniques, suitable methods can be screened out by comparing the results.
The purpose of this research is to develop and validate viscosity prediction models for glassy slag by machine learning technology. The viscosity data measured in a mildly reducing atmosphere were used in the model development process. Primarily, the glassy slag was divided according to the inorganic chemical composition by artificial (according to Na2O wt%) and competitive neural networks. Artificial neural network models for viscosity prediction of different categories of slag were developed. Then, indirect prediction methods of slag viscosity were explored. Multivariate regression was performed on the viscosity curve for each glassy slag to generate the corresponding parameters for model’s establishment process. The PCA–PSO–BP neural network models for predicting parameters were proposed. This indirect method was used to overcome the limitation of temperature and viscosity range in direct prediction while delivering smooth viscosity curves.
2. Materials and Methods
2.1. Database Construction
Many experimental data for measured slag viscosity were collected from previous work. Details of the slag viscosity data can be found in [13]. Abundant data of slag samples for viscosity measurement were carried out under a mildly reducing atmosphere (60CO/40CO2), which is similar to the common environment of a molten gasifier. These samples also had the broadest chemical composition distribution relative to samples measured in various atmospheres. The chemical composition range for 124 different glassy slag samples is displayed in Table 1. The temperature range of slag viscosity measurements was between 1100 and 2000 °C. The selected viscosity value was less than 200 Pa·s.

Table 1.
Chemical composition of glassy slag (inorganic component wt%).
2.2. Viscosity Prediction Model for Slag with Different Components
2.2.1. Method for Categorizing Slag Samples
Samples were firstly categorized based on the proportion of Na2O wt%. Accordingly, the samples with Na2O > 2.00 wt% were classified as high-alkali slag, and the others were considered as low-alkali slag. On the other hand, a generic competitive neural network was used to divide the slag into different categories, which could take into account the differences between all chemical components and completed the process quickly. To identify similar samples, the method was based on the Euclidean distance between chemical components [15,16].
2.2.2. Model Development for Predicting Different Slag Viscosity Categories
A corresponding neural network model was developed to predict the viscosity using sample data that were gathered. The initialization and development of the model were similar, and more details are available from our previous work [13].
2.3. Indirect Prediction Model for Slag Viscosity
2.3.1. Multivariate Nonlinear Regression Formula for Slag Viscosity Data
An empirical formula could directly draw the ideal type of viscosity–temperature curve [6]. Inspired by the empirical formula, the slag viscosity was a multivariate regression defined by a mathematical formula. The model parameters were determined by slag chemical components.
2.3.2. Grey Relational Analysis of Model Parameters
Through grey relational analysis, we could not only know the influence of each input variable on the model, but the analysis could also help to eliminate irrelevant variables. The calculation method of grey relational analysis was obtained from the literature [21]; the greater the calculated correlation, the higher the correlation among variables.
2.3.3. Principal Component Analysis of Model Inputs
Each variable represented part of the information affecting slag viscosity, with some overlapping contributions. To some extent, the complexity of the model was affected by the number of input variables. Eliminating redundant variables by principal component analysis (PCA) could reduce the amount of computation and improve the accuracy of the prediction [17,18].
2.3.4. Model Development of PCA–BP Neural Network
The development process of a BP neural network referred to the previous method, and its structure was determined through multiple attempts. The simplified model input variables were obtained by the PCA. To obtain the optimal model structure, the model performance was evaluated using the mean squared error in the actual prediction results.
2.3.5. Swarm Intelligence Optimization Neural Network Model
The global search capability of the swarm intelligence optimization algorithm could improve the model performance. Particle swarm optimization (PSO) sought the optimal solution by simulating the flocking behavior of birds and sharing information among individuals in the swarm. The particle update process and iterative formulations were available in the literature [19,20].
3. Results
3.1. Viscosity Prediction Results for Slag with Different Components
3.1.1. Viscosity Prediction Results for Slag with Different Na2O wt% Content
The samples were divided into low-alkali and high-alkali slag by the weight percent of Na2O. There were 99 low-alkali and 25 high-alkali glassy slag samples used in viscosity measurement under a mildly reducing atmosphere. Neural network models for viscosity prediction of these two kinds of slag were developed [13]. The structural parameters of the slag viscosity prediction models are shown in Table 2. The double hidden structure of the neural network was most optimal, and further increasing the hidden layer numbers could not effectively improve model performance. In addition, the best algorithm function for the neural network was trainlm.
Table 2.
Structure parameters of low-alkali and high-alkali slag viscosity prediction models.
In the test set, 300 low-alkali and 100 high-alkali slag viscosity points were randomly assigned to represent the generalization ability of the model. As shown in Figure 1a, the maximum error between the predicted and experimental viscosity of the low-alkali slag was 3.71 Pa·s, and the average error was 0.48 Pa·s. As shown in Figure 1b, the maximum error between the predicted and experimental viscosity of the high-alkali slag was 3.17 Pa·s, and the average error was 0.75 Pa·s.
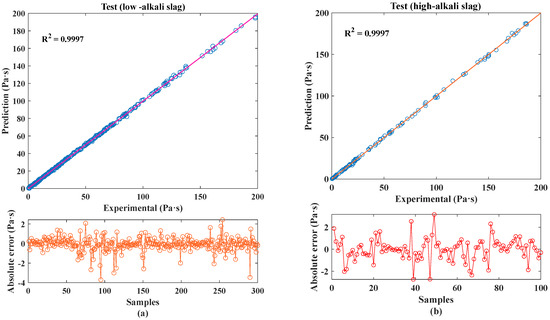
Figure 1.
Viscosity prediction results: (a) low-alkali slag, (b) high-alkali slag.
3.1.2. Prediction Results from the Competitive Neural Network
Samples were divided into six categories using a competitive neural network. The training function of the competitive neural network was trainru and the learning rate was 0.1. The number of glassy slag samples divided were 22, 20, 21, 19, 22, and 20. Then, 100 viscosity data were randomly assigned as validation and test set, respectively, and the remaining data were used as a training set to develop the BP neural network for viscosity prediction. The training functions selected for the model were all trainlm, and the other structural parameters are shown in Table 3.
Table 3.
Structural parameters of different prediction models.
The errors in the predicted and experimental values of each model on the test set are shown in Figure 2. The randomly assigned test set contained data points with high viscosity values in the low-temperature region; nevertheless, the low viscosity values were in the high-temperature region. The ordinate of experimental value and the predicted value are on the left axis shown in Figure 2. Likewise, the ordinate of the error value is the right axis shown in Figure 2. The average predicted viscosity errors of the six categories of slag were 0.62, 0.24, 0.59, 0.57, 0.55, and 0.48 Pa·s. By dividing the slag using the competitive neural network, the BP neural network model developed based on the viscosity data in the second category had the highest prediction accuracy.
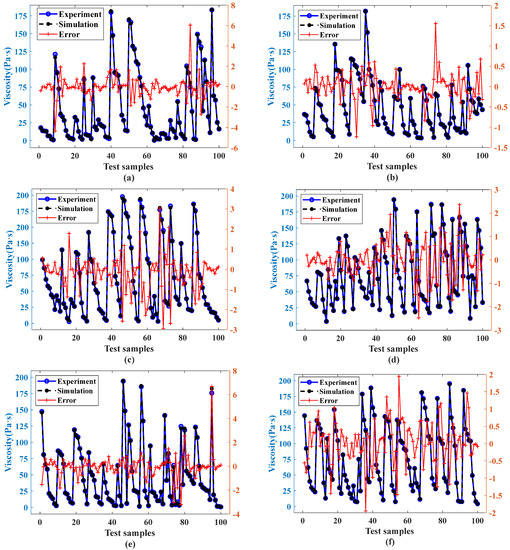
Figure 2.
Prediction errors for the different prediction models: (a) model 1; (b) model 2; (c) model 3; (d) model 4; (e) model 5; (f) model 6.
3.1.3. Comparative Analysis of Viscosity Prediction
The viscosity prediction error obtained by the BP neural network was lower than that of traditional mathematical ones, whether the samples were categorized manually or by the competitive neural network. As displayed in Figure 3, the maximum error in the slag viscosity prediction model developed without sample classification was 8.65 Pa·s, and the average prediction error was 0.86 Pa·s. After dividing the slag using either method, the prediction accuracy of the developed model was improved. Therefore, separating the glassy slag into different categories was an effective method to improve the prediction accuracy.
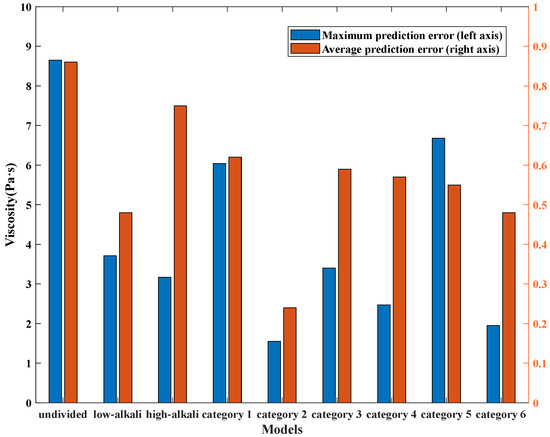
Figure 3.
Comparison of prediction errors.
3.1.4. Technical Application of the Viscosity Prediction Model for Slag with Different Components
Whether categorized manually or by unsupervised learning, the slag viscosity prediction accuracy was higher compared to those that were undivided. In simple terms, the slag division and viscosity prediction methods with high accuracy are shown in Figure 4. First, manually determine whether the sample was low-alkali slag according to the mass percentage of Na2O in the component. For low-alkali slag samples, the viscosity values were obtained using the low-alkali slag viscosity prediction model. If the content of Na2O in the slag composition was greater than 2.00 wt%, then the slag was categorized by using the previously trained competitive neural network. The viscosity value was then calculated using the BP neural network model of the corresponding category.
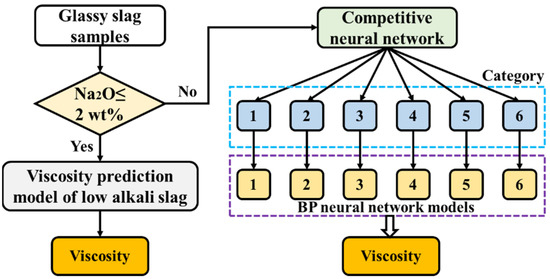
Figure 4.
Slag categorization and high accuracy prediction route of viscosity.
The predicted results of the slag viscosity are shown in Figure 5. Typically, larger errors occurred at low temperatures, for which the viscosity changes more rapidly with temperature. The predicted viscosity of the low-alkali slag in experiments 2 and 4 had a relatively large error at high temperature, and the values of SiO2 (wt%), S/A, and A/B of the sample were relatively low. Overall, the viscosity prediction error for the high-alkali slag was larger than that for the low-alkali slag, perhaps due to relatively few driving data. The viscosity–temperature curve for prediction 6 was relatively different from that of experiment 6. The SiO2 (wt%) and A/B ratio of this sample were 25.63 and 0.71, respectively, which were much lower than the other samples.
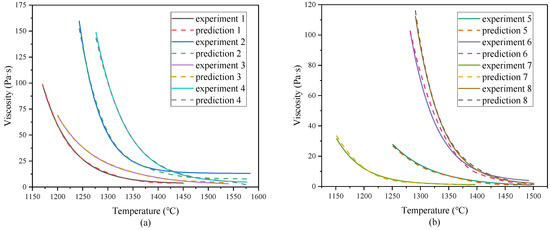
Figure 5.
Simulation results: (a) low-alkali slag, (b) high-alkali slag.
3.2. Indirect Prediction Results of Slag Viscosity
3.2.1. Multiple Regression Results for the Viscosity–Temperature Curves
The viscosity curve for glassy slag decreases slowly with the increase in temperature, which approximates to an exponential or logarithmic function [6,22]. After investigation, Yu et al. fitted experimental data and obtained a high-precision empirical formula [23]. After many practical verifications, the fitting accuracy of this model formula to most of experimental data was very high (R2 = 0.99). In Formula (1), T is temperature (°C), η is viscosity (Pa·s), and variables a through d are four regression parameters:
In order to fit the empirical formula and generate the corresponding regression parameters, 124 kinds of glassy slag measured in a mildly reducing atmosphere were used. After multiple regression, four corresponding model parameters: a, b, c, and d, were obtained for the 124 samples. The four constants were obtained based on slag chemical composition using a machine learning algorithm.
3.2.2. Grey Correlation Analysis Results for the Model Parameters
It can be seen from the grey relational analysis results shown in Figure 6 that the grey relational degree of each variable to the model parameters exceeds 0.9. The choice of input variables was reasonable and strongly related to model parameters. Overall, the top four input variables with the greatest influence on model parameters were SiO2 wt% > A/B wt% > Al2O3 wt% > S/A wt%, followed by CaO wt%, Fe2O3 wt%, MgO wt%, TiO2 wt%, cooling rate, and Na2O wt%. The two input variables with the least effect on the model parameters were K2O wt% and SO3 wt%.
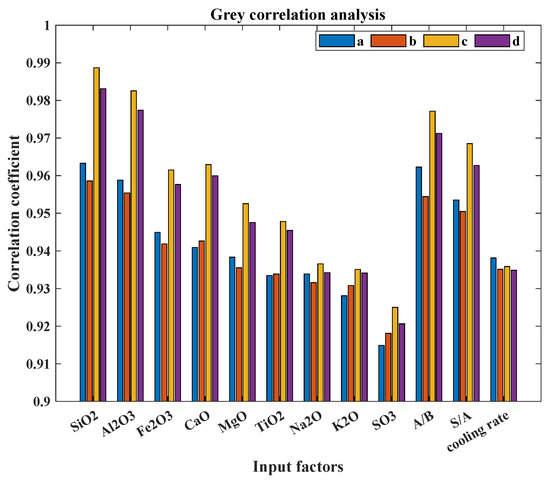
Figure 6.
Grey correlation analysis results for the input variables and model parameters.
3.2.3. PCA Results for the Model Inputs
PCA was used to calculate the comprehensive evaluation value with p (p ≤ 12) principal components. Six principal components with eigenvalues greater than 1 were extracted using principal component analysis, and their cumulative contribution rate exceeded 82%, which well represented the entire sample. The normalized eigenvectors of the first six principal components, i.e., the corresponding loading, are displayed in Figure 7. The original input variables were combined with linear regression through the load number [17].
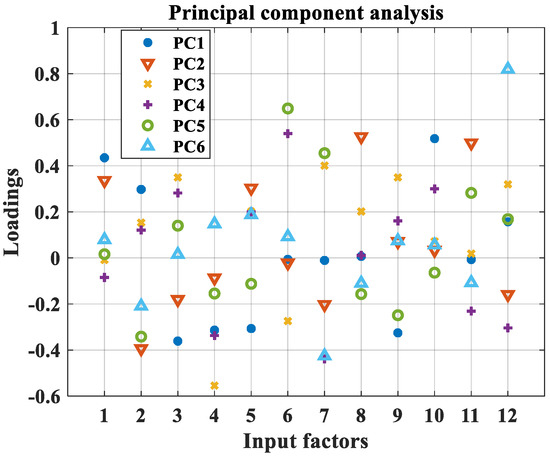
Figure 7.
Principal component analysis result for the input variables.
3.2.4. Model Parameters Prediction Results for Different Machine Learning Algorithms
- (1)
- BP neural network and PCA–BP neural network
The validation and test sets each contained data for 20 samples, and the remaining 85 samples were training sets. After PCA processing, the input of the model was reduced from 12 to 6 by linear combination. After the test, the activation function for the second hidden layer of each model was determined to be tansig. The number of hidden neurons and the mean square error (MSE) for each model are shown in Table 4. Compared with the BP neural network, the prediction errors of the PCA–BP neural network for parameters a through d were reduced by 41.61%, 28.84%, 19.76%, and 3.74%, respectively. PCA could simplify the model input variables and reduce the redundant variables without losing crucial information, thereby improving prediction accuracy [18]. The PCA–BP neural network had better prediction results and potential for further optimization.
Table 4.
Number of hidden neurons and mean square error for the neural network models.
- (2)
- PCA–PSO–BP neural network
The PSO algorithm had shown great potential in exploring global optimization results. The maximum and minimum individuals and weights are shown in Table 5. The PCA–PSO–BP neural network was used to predict the allocated test-set data. The results are shown in Figure 8. The prediction errors for each parameter were smaller than other models. The denormalized mean square errors of the four parameters were 1.53, 9.06 × 10⁶, 41.71 × 10², and 46.18, respectively. Compared with the PCA–BP neural network, the parameter means square errors predicted by the PCA–PSO–BP neural network were reduced by 76.35%, 49.92%, 31.94%, and 73.66%, respectively.
Table 5.
The parameters of the particle swarm optimization.
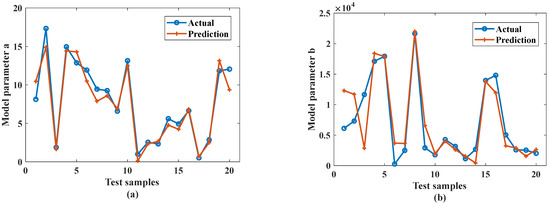
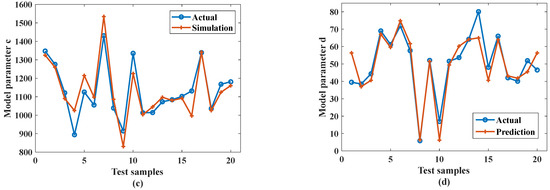
Figure 8.
Prediction results of test samples based on the PCA–PSO–BP neural network: (a) model PCA–PSO–BP-a; (b) model PCA–PSO–BP-b; (c) model PCA–PSO–BP-c; (d) model PCA–PSO–BP-d.
- (3)
- Other relevant machine learning algorithms
The global search capability of the swarm intelligence optimization algorithm could improve model performance. Genetic algorithms (GA) mimicked the natural selection principle of genetics for adaptive probabilistic optimization [20,24]. The PCA–GA–BP neural network was used to predict slag viscosity. In addition, support vector regression (SVR) in the machine learning algorithm was also used to predict slag viscosity. This study applied the most popular algorithm, ε-SVR, which used an insensitive loss function to locate hyperplanes [25,26]. The results show that the predicted MSE (constants a, b, c, and d) of the PCA–PSO–BP neural network was 46.88%, 39.68%, 6.50%, and 36.28% lower than that of the PCA–GA–BP neural network, respectively. The PCA–SVR model’s prediction accuracy was lower than that of the BP neural network, which was not suitable for indirect prediction of viscosity. Therefore, the PCA–PSO–BP neural network was the best indirect prediction method for slag viscosity. The best algorithm and concise results were presented previously.
3.2.5. Technical Use of the Viscosity Indirect Prediction Model
The process of using the indirect prediction model of slag viscosity is shown in Figure 9. In the indirect prediction of slag viscosity, the four parameters a through d necessary in the prediction model are firstly required; the PCA–BP neural network optimized by PSO is used to predict the four model parameters. The viscosity–temperature curve for the slag is then obtained by bringing the parameters into the formula. The technical use of the viscosity indirect prediction model is universal for different systems.
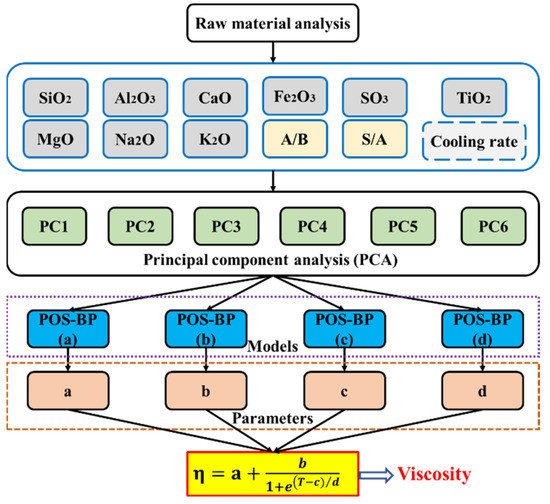
Figure 9.
Indirect prediction process for glassy slag viscosity.
Figure 10 shows the indirect prediction of slag viscosity compared with the experimental results. Experiments 1, 2, and 3 shown in Figure 10a were the measurement results of the same sample at different cooling rates. The slag viscosity decreases significantly with the increase in cooling rate [27]. With the increase in cooling rate, mass transfer instead of subcooling becomes the main factor affecting the crystal growth rate [28]. However, the prediction results for experiments 1 and 2 were obviously larger, and the results for experiment 3 were small. The viscosity prediction results shown in Figure 10b still suffered from significant errors compared with the experimental values.
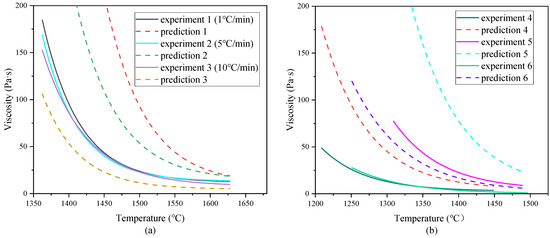
Figure 10.
Indirect prediction results for slag viscosity: (a) the same sample at different cooling rates; (b) different samples.
4. Discussion
The direct prediction model of slag properties was limited by the range of driven data, and could only calculate viscosity within the range. Even though the existing data were insufficient to achieve results that agreed completely, the model still could be used with high accuracy to predict viscosity within the conventional input range. The division of slag into several categories mainly relied on subjective judgment and needs further study. It was necessary to continuously supplement accurate experimental data to the driving database. For these problems, the parameter error in the indirect prediction model was still relatively large. With continuous research on slag viscosity–temperature characteristics, increasingly more slag viscosity data will be generated, which is expected to further consummate the indirect prediction model. In addition, more advanced optimization algorithms and deep neural networks need to be applied.
5. Conclusions
The viscosity of the slag is an important process parameter for the design and operation of molten gasification. In this study, the slag was firstly categorized according to chemical component content or unsupervised learning, and the corresponding BP neural network viscosity direct prediction model was established. In addition, a nonlinear regression of viscosity data was performed using a mathematical formula, and the corresponding four parameters were generated. Then, a PCA–PSO–BP neural network was used to predict the model parameters. In conclusion, this work is a key technique to minimize the technical risks related to the abnormal phase transition and rheological behavior of slag.
The viscosity of artificially divided low-alkali and high-alkali slag (Na2O > 2 wt%) was predicted by the BP neural network model. The average prediction errors for the independent test data were 0.48 and 0.75 Pa·s, respectively. The maximum prediction absolute error was less than 4 Pa·s. In addition, a general competitive neural network (unsupervised learning) was used to divide slag into six categories according to the Euclidean distance of the chemical composition. The average prediction errors in the corresponding BP neural network models on the test data were 0.62, 0.24, 0.59, 0.57, 0.55, and 0.48 Pa·s, respectively, which were also significantly smaller than the traditional empirical formula and the model developed without sample classification. It could be seen that dividing the glassy slag samples into different categories and then predicting their viscosity separately was an effective method to improve the prediction accuracy. In order to obtain the predicted viscosity with a relatively small error, the BP neural network viscosity prediction model for low-alkali slag was preferentially used. When the sample was high-alkali slag, and using the competitive neural network to divide sample, then the corresponding BP neural network was used to predict viscosity, thereby improving the prediction accuracy.
The viscosity data for each glassy slag was nonlinearly regressed mathematically, and the corresponding four parameters (a–d) were generated, which could be used to indirectly predict slag viscosity. Grey correlation analysis results showed that the chemical composition and cooling rate used in the viscosity measurements were more than 0.9 correlated with the model parameters, indicating a strong correlation between the selected variables. Overall, the four variables and their rankings that had the greatest effect on the model parameters were SiO2, A/B, Al2O3, and S/A. Then, principal component analysis (PCA) was performed on the original 12 variables, and 6 principal components with eigenvalues greater than 1 were extracted as new variables. The PCA–BP neural network for predicting the model parameters was established. In addition, the PCA–BP neural network was optimized by the particle swarm algorithm (PSO). In this study, the general mathematical formula combined with the PCA–PSO–BP neural network was the best indirect prediction method for slag viscosity. Although further research is needed to improve the model accuracy, this approach has overcome the limitations of temperature and viscosity ranges in direct prediction while delivering smooth viscosity curves.
Author Contributions
Writing—original draft preparation, C.L.; investigation and formal analysis, W.X.; conceptualization and data curation, C.W.; project administration and methodology, X.L.; resources, D.X.; supervision, Y.W. All authors have read and agreed to the published version of the manuscript.
Funding
This work was supported by the National Natural Science Foundation of China (grant numbers 21978319 and 22008253).
Data Availability Statement
Not applicable.
Acknowledgments
Not applicable.
Conflicts of Interest
The authors declare no conflict of interest.
References
- Moustakas, K.; Fatta, D.; Malamis, S.; Haralambous, K.; Loizidou, M. Demonstration plasma gasification/vitrification system for effective hazardous waste treatment. J. Hazard. Mater. 2005, 123, 120–126. [Google Scholar] [CrossRef] [PubMed]
- Roberts, L.; Mason, P.; Jones, J.; Gale, F.; Williams, A.; Hunt, A.; Ashman, J. The impact of aluminosilicate-based additives upon the sintering and melting behavior of biomass ash. Biomass Bioenerg. 2019, 127, 105284. [Google Scholar] [CrossRef]
- Tanigaki, N.; Manako, K.; Osada, M. Co-gasification of municipal solid waste and material recovery in a large-scale gasification and melting system. Waste Manag. 2012, 32, 667–675. [Google Scholar] [CrossRef]
- Groen, J.; Brooker, D.; Welch, P.; Oh, M. Gasification slag rheology and crystallization in titanium-rich, iron-calcium-aluminosilicate glasses. Fuel Process. Technol. 1998, 56, 103–127. [Google Scholar] [CrossRef]
- Zhang, Y.; Ren, Q.; Lyu, Q. Fusibility characteristic and flow properties of semi-char from industrial circulating fluidized bed gasification. Fuel 2018, 234, 904–913. [Google Scholar] [CrossRef]
- Reid, W. The relation of mineral composition to slagging, fouling and erosion during and after combustion. Prog. Energy Combust. 1984, 10, 159–169. [Google Scholar] [CrossRef]
- Park, W.; Oh, M. Slagging of petroleum coke ash using Korean anthracites. J. Ind. Eng. Chem. 2007, 14, 350–356. [Google Scholar] [CrossRef]
- Ilyushechkin, A.; Hla, S.; Roberts, D.; Kinaev, N. The effect of solids and phase compositions on viscosity behavior and TCV of slags from Australian bituminous coals. J. Non-Cryst. Solids 2011, 357, 893–902. [Google Scholar] [CrossRef]
- He, C.; Bai, J.; Kong, L.; Xu, J.; Guhl, S.; Li, X.; Ge, Z.; Cao, X.; Bai, Z.; Li, W. Effects of atmosphere on the oxidation state of iron and viscosity behavior of coal ash slag. Fuel 2019, 243, 41–51. [Google Scholar] [CrossRef]
- Ma, Y.; Wu, G.; Guo, Q.; Liu, X.; Gong, Y.; Yu, G. Investigation of fluctuation behavior in viscosity of coal slags used in entrained-flow gasifiers. Fuel Process. Technol. 2018, 181, 133–141. [Google Scholar] [CrossRef]
- Ilyushechkin, A.; Roberts, D.; Harris, D. Characteristics of solid by-products from entrained flow gasification of Australian coals. Fuel Process. Technol. 2014, 118, 98–109. [Google Scholar] [CrossRef]
- Duchesne, M.; Macchi, A.; Lu, D.; Hughes, R.; McCalden, D.; Anthony, E. Artificial neural network model to predict slag viscosity over a broad range of temperatures and slag compositions. Fuel Process. Technol. 2010, 91, 831–836. [Google Scholar] [CrossRef]
- Lin, X.; Xi, W.; Dai, J.; Wang, C.; Wang, G. Prediction of slag characteristics based on artificial neural network for molten gasification of hazardous wastes. Energies 2020, 13, 5115. [Google Scholar] [CrossRef]
- Chen, Z.; Wang, M.; Meng, Z.; Wang, H.; Liu, L.; Wang, X. Development of structure-informed artificial neural network for accurately modeling viscosity of multicomponent molten slags. Ceram. Int. 2021, 47, 30691–30701. [Google Scholar] [CrossRef]
- Xu, P.; Xu, S.; Yin, H. Application of self-organizing competitive neural network in fault diagnosis of suck rod pumping system. J. Petrol. Sci. Eng. 2007, 58, 43–48. [Google Scholar] [CrossRef]
- Saggaf, M.; Toksoez, M.; Marhoon, M. Seismic facies classification and identification by competitive neural networks. Geophysics 2003, 68, 1984–1999. [Google Scholar] [CrossRef]
- Yevick, D. Conservation laws and spin system modeling through principal component analysis. Comput. Phys. Commun. 2021, 262, 107832. [Google Scholar] [CrossRef]
- Ouiyangkul, P.; Tantishaiyakul, V.; Hirun, N. Exploring potential coformers for oxyresveratrol using principal component analysis. Int. J. Pharmaceut. 2020, 587, 119630. [Google Scholar] [CrossRef]
- Hu, Y.; Li, J.; Hong, M.; Ren, J.; Lin, R.; Liu, Y.; Liu, M.; Man, Y. Short term electric load forecasting model and its verification for process industrial enterprises based on hybrid GA-PSO-BPNN algorithm-A case study of papermaking process. Energy 2019, 170, 1215–1227. [Google Scholar] [CrossRef]
- Zhou, G.; Zhou, Y. Analysis on mass flow rate of R22 and R407C through coiled adiabatic capillary tubes with GA and PSO optimized BP networks. J. Mech. Sci. Technol. 2020, 34, 3445–3455. [Google Scholar] [CrossRef]
- Sarrafa, F.; Nejad, S. Improving performance evaluation based on balanced scorecard with grey relational analysis and data envelopment analysis approaches: Case study in water and wastewater companies. Eval. Program Plann. 2020, 79, 101762. [Google Scholar] [CrossRef] [PubMed]
- Lin, X.; Liu, J.; Ideta, K.; Miyawaki, J.; Wang, Y.; Mochida, I.; Yoon, S. Cation induced microstructure and viscosity variation of molten synthetic slag analyzed by solid-state NMR. Fuel 2020, 267, 117310. [Google Scholar] [CrossRef]
- Ni, J.; Zhou, Z.; Yu, G. Molten slag flow and phase transformation behaviors in a slagging entrained-flow coal gasifier. Ind. Eng. Chem. Res. 2010, 49, 12302–12310. [Google Scholar] [CrossRef]
- Yu, F.; Xu, X. A short-term load forecasting model of natural gas based on optimized genetic algorithm and improved BP neural network. Appl. Energy 2014, 134, 102–113. [Google Scholar] [CrossRef]
- Tan, A.; Zhao, Y.; Sivashanmugan, K.; Squire, K.; Wang, A. Quantitative TLC-SERS detection of histamine in seafood with support vector machine analysis. Food Control 2019, 103, 111–118. [Google Scholar] [CrossRef]
- Fan, G.; Peng, L.; Hong, W.; Sun, F. Electric load forecasting by the SVR model with differential empirical mode decomposition and auto regression. Neurocomputing 2016, 173, 958–970. [Google Scholar] [CrossRef]
- Kong, L.; Bai, J.; Li, W.; Wen, X.; Li, X.; Bai, Z.; Guo, Z.; Li, H. The internal and external factor on coal ash slag viscosity at high temperatures, Part 1: Effect of cooling rate on slag viscosity, measured continuously. Fuel 2015, 158, 968–975. [Google Scholar] [CrossRef]
- Ediger, M.; Harrowell, P.; Yu, L. Crystal growth kinetics exhibit a fragility-dependent decoupling from viscosity. J. Chem. Phys. 2008, 128, 34709. [Google Scholar] [CrossRef]
Publisher’s Note: MDPI stays neutral with regard to jurisdictional claims in published maps and institutional affiliations. |
© 2022 by the authors. Licensee MDPI, Basel, Switzerland. This article is an open access article distributed under the terms and conditions of the Creative Commons Attribution (CC BY) license (https://creativecommons.org/licenses/by/4.0/).