Article

Production Decline Analysis of Tight Conglomerate Reservoirs with Small Well Spacing, Based on the Fractal Characteristics of Fracture Networks

1
Exploration and Development Research Institute of Xinjiang Oilfield Company, PetroChina, Karamay 834000, China
2
State Key Laboratory for Geomechanics and Deep Underground Engineering, China University of Mining and Technology (Beijing), Beijing 100083, China
*
Author to whom correspondence should be addressed.
Minerals 2022, 12(11), 1433; https://doi.org/10.3390/min12111433
Submission received: 29 September 2022 / Revised: 1 November 2022 / Accepted: 10 November 2022 / Published: 11 November 2022
(This article belongs to the Section Mineral Geochemistry and Geochronology)

Abstract

:
The conglomerate matrix and fracture propagation are special in tight conglomerate reservoir with small well spacing. In this article, the fractal propagation characteristics of the fracture network in conglomerate reservoirs are described by experiment and a micro-mathematical model. According to the core slice, the conglomerate reservoir matrix presents the multi-modal pore structure, described as the “pseudo-dual-media” model. Given the above, the unsteady seepage mathematical model, comprehensively considering the fractal fracture network, stress sensitivity of main fractures, and threshold pressure gradient of the reservoir matrix, was developed and analytically solved. The Blasingame type curves for production decline analysis were plotted, and the sensitive parameters were analyzed. The field application was performed for validation. The research results show that the fractal dimension decides the complexity of the fracture network distribution. As it increases, the unsteady flow occurs earlier, and the boundary flow is delayed. The anomalous diffusion exponent represents the smoothness of crude oil migration and a higher value leads to higher resistance to oil migration and larger pressure drawdown for the same production rate. The growth of the threshold pressure gradient within a certain range can result in a localized downward shift of the type curves. The field application in a conglomerate oil reservoir showed that the presented model presents a fitting accuracy 10% higher than that of the conventional SRV model and has high reliability and precision for the production performance evaluation of the small-well-spacing development of tight conglomerate reservoirs.

1. Introduction

The Mahu tight conglomerate oil reservoir, as the largest conglomerate reservoir oil in the world, is characterized by the complex lithology, tight reservoir, high heterogeneity, and large difference between the maximum and minimum horizontal principal stresses [1,2]. Due to the tight reservoir, the conventional development approach fails to build large-scale production cost-effectively. With numerous attempts, the unique small well spacing development technique of the Mahu oilfield was formed. The post-frac performance evaluation, well-controlled reserve estimation, and determination of fracture parameters in the context of this development approach are vital for guiding the development deployment.
Production decline analysis is an emerging method to evaluate the fracturing performance and calculate relevant parameters of reservoirs and fractures, based on production data [3,4]. Typically, in this method, the Blasingame type curve is derived from the unsteady seepage theory, and the reservoir and fracture parameters are then computed by fitting the type curve to production data [5,6]. In 1993, Blasingame introduced the material balance time into the production performance analysis, which solved the problem caused by the variable bottomhole flowing pressure and developed the typical Blasingame type curves [7]. In 1998, by extending the Blasingame model, Palacio developed the Blasingame type curves based on the radial flow and elliptical flow [8]. In 2007, D. Ilk introduced the β function into the Blasingame type curve to eliminate the solution multiplicity of the model [9]. Following the point source theory, Wang solved the asymptotic expression of pressure for the boundary-controlled flow of hydraulically fractured horizontal wells in 2014 and plotted the Blasingame type curve of such wells [10]. In 2015, Sun systematically investigated the methodology of modern production decline analysis and developed the type curves for model production decline analysis of different well types [11]. In 2017, Cao established the production prediction charts of horizontal wells, wherein the stress sensitivity of reservoir matrix and the influence of starting pressure gradient are introduced [12]. In 2019, Lin further studied hydraulically fractured horizontal wells. In this research, four seepage physical models were considered, namely the ones with small well spacing and small cluster spacing, small well spacing and large clustering spacing, large well spacing and small cluster spacing, and large well spacing and large cluster spacing, respectively. Correspondingly, the Blasingame curves of fractured horizontal wells, based on the bi-linear flow, combined bi-linear flow, tri-linear flow, and five-region multi-linear flow, were plotted [13]. Recently, Wang et al. characterized diverting of fractures of re-fractured horizontal wells and semi-analytically illustrated the effects of various fracture diverting angles on the shapes of production decline curves [14]. The extensive literature review performed in this research indicates that the previous construction and analysis of the production decline model are commonly based on the single-porosity model of the sandstone matrix, which is different from the multi-porosity characteristic of the conglomerate matrix [15,16,17], especially for fracturing development mode of small spacing horizontal wells in tight conglomerate reservoir.
In this paper, the fracture propagation characteristics of conglomerate reservoir with small well spacing and the micro seepage model of matrix are analyzed by the perspectives of experiments and the micro mathematical model. The research modified the current SRV model by introducing the fractal characteristic parameters of the fracture network and the dual pore structure of matrix. This unsteady seepage mathematical model was developed and solved for the tight conglomerate reservoir with the development mode of small well spacing. The corresponding Blasingame type curve was obtained using the solution of the model. According to typical curve, the sensitive parameters are analyzed, and the reliability of the presented model was validated via the field application.

2. Fracture and Matrix Characteristics of Conglomerate Reservoir

2.1. Characteristics of Fracturing Network

The M131 demonstration project has adopted the development model of small well spacing, small cluster spacing, three-dimensional well pattern, and staggered fractures in the Mahu oilfield. The interpretation of the micro-seismic monitoring shows that the dense micro seismic events has been formed with the condition of small well spacing and small cluster spacing (Figure 1). It is believed that a complex fracture network has been formed. Considering full coverage of fracturing fractures, it generally conforms to the macro-seepage mode of the SRV model [18,19].
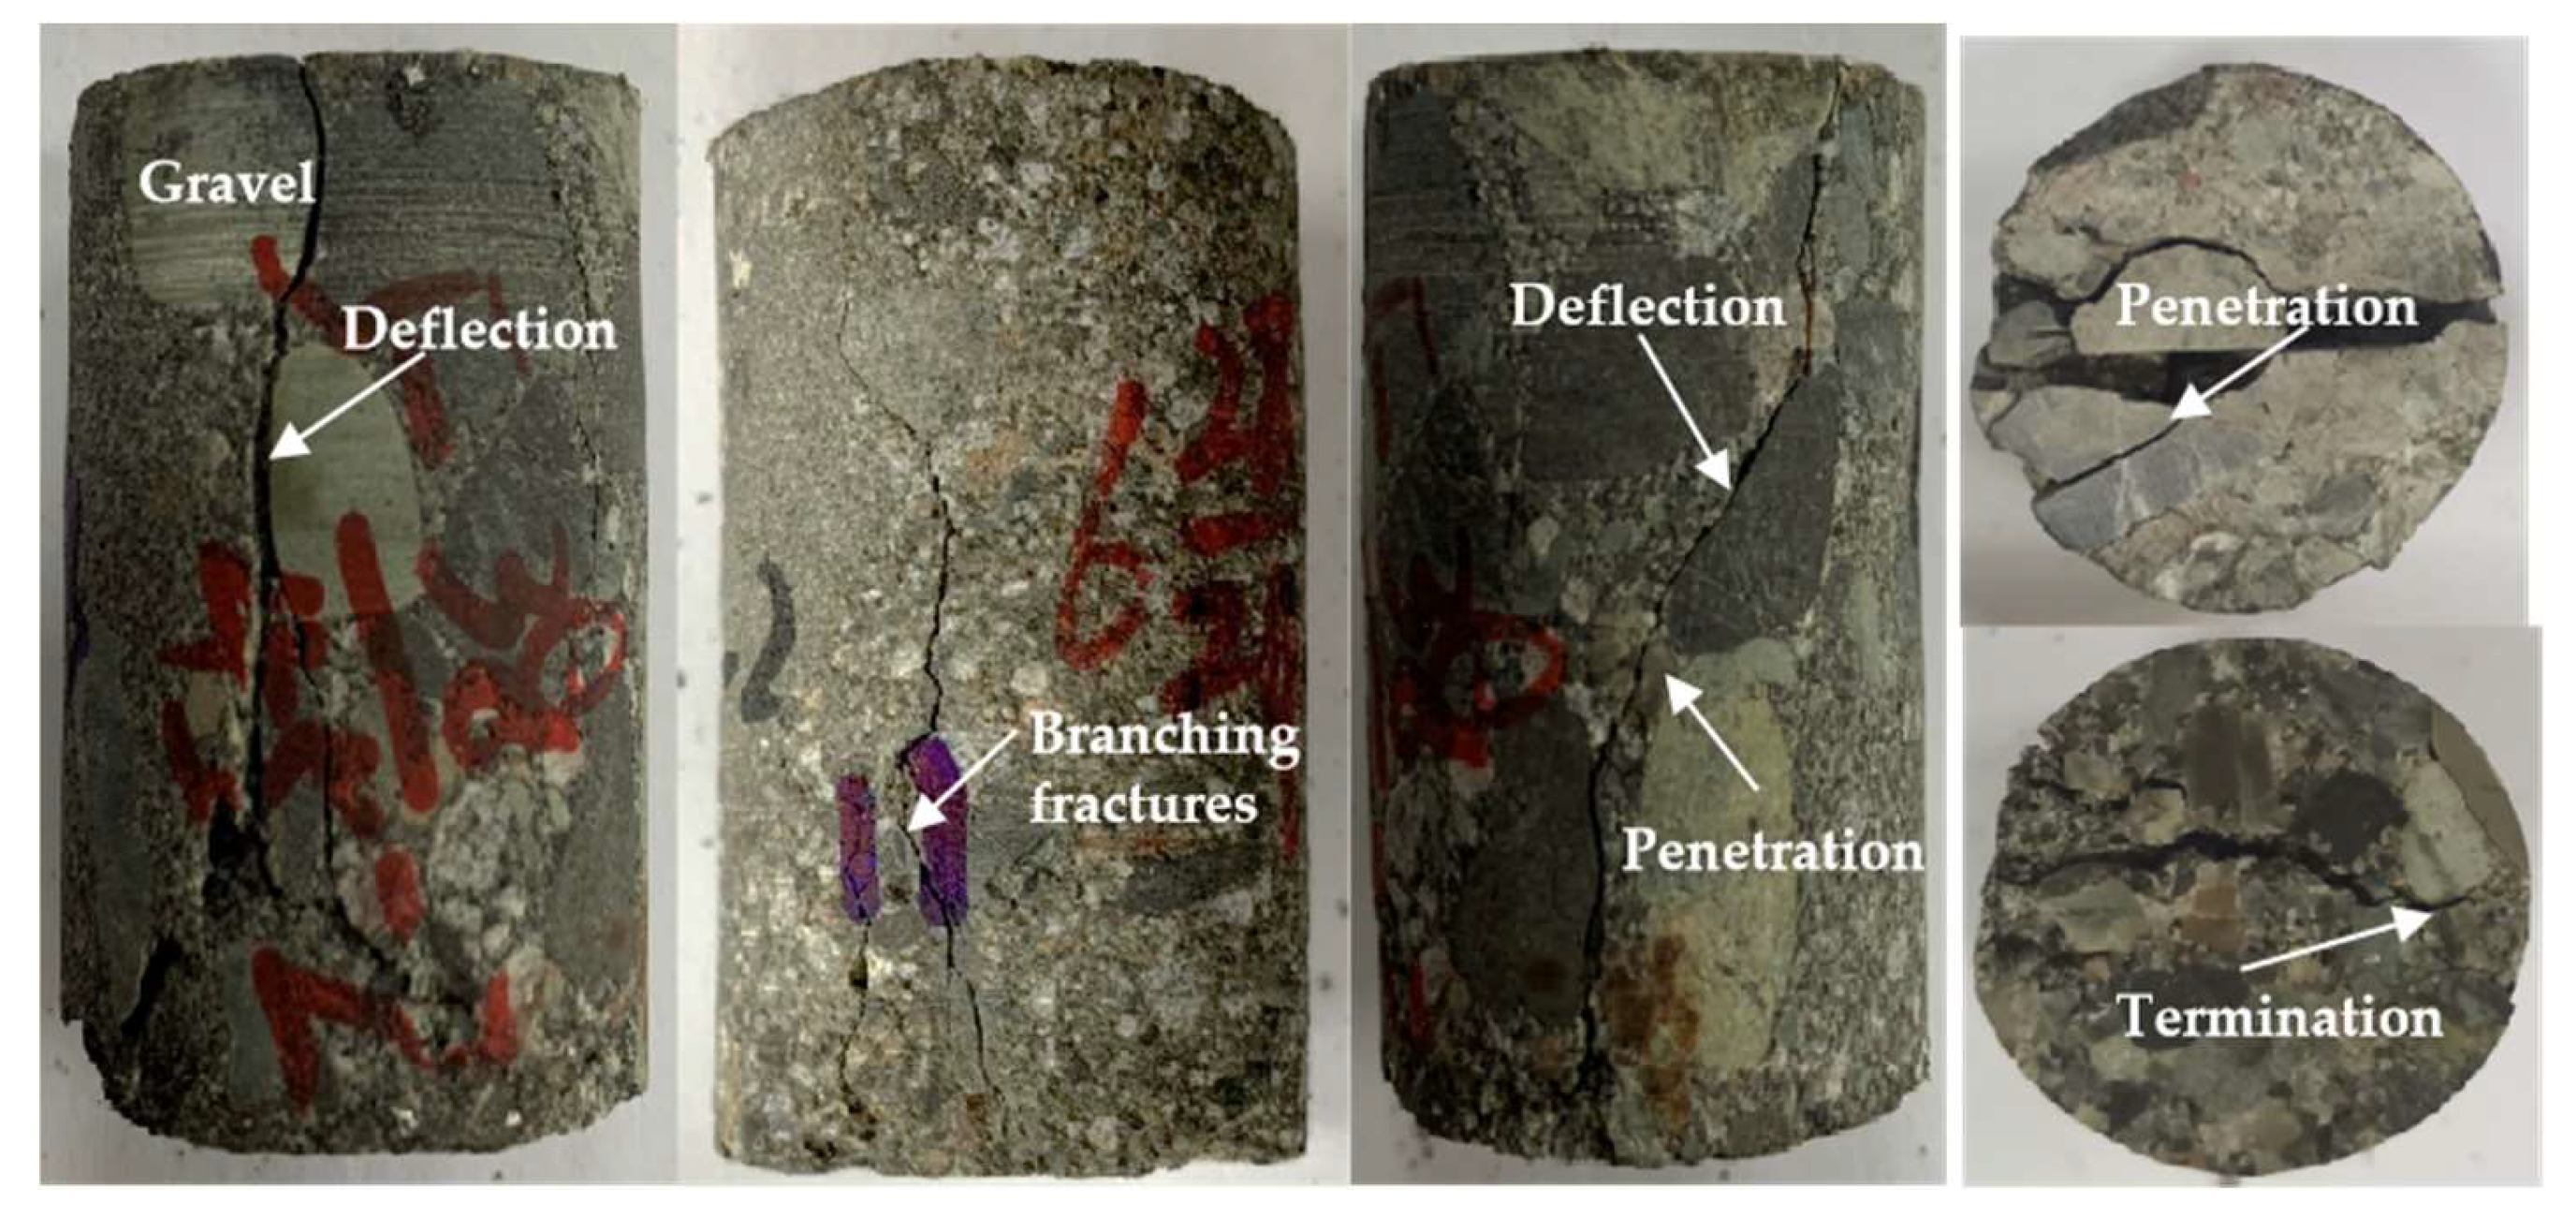
The core fracture experiment shows that the conglomerate cores showed the three modes of fracture propagation in conglomerate, namely “termination (arrest), deflection, and penetration” (Figure 2). According to statistics, the deflection is the main fracture propagation mode, which forms the main mode of artificial micro fractures. It is confirmed that the multiple modes are the main reason for complex fracture network formed by the fracturing in the conglomerate reservoir.
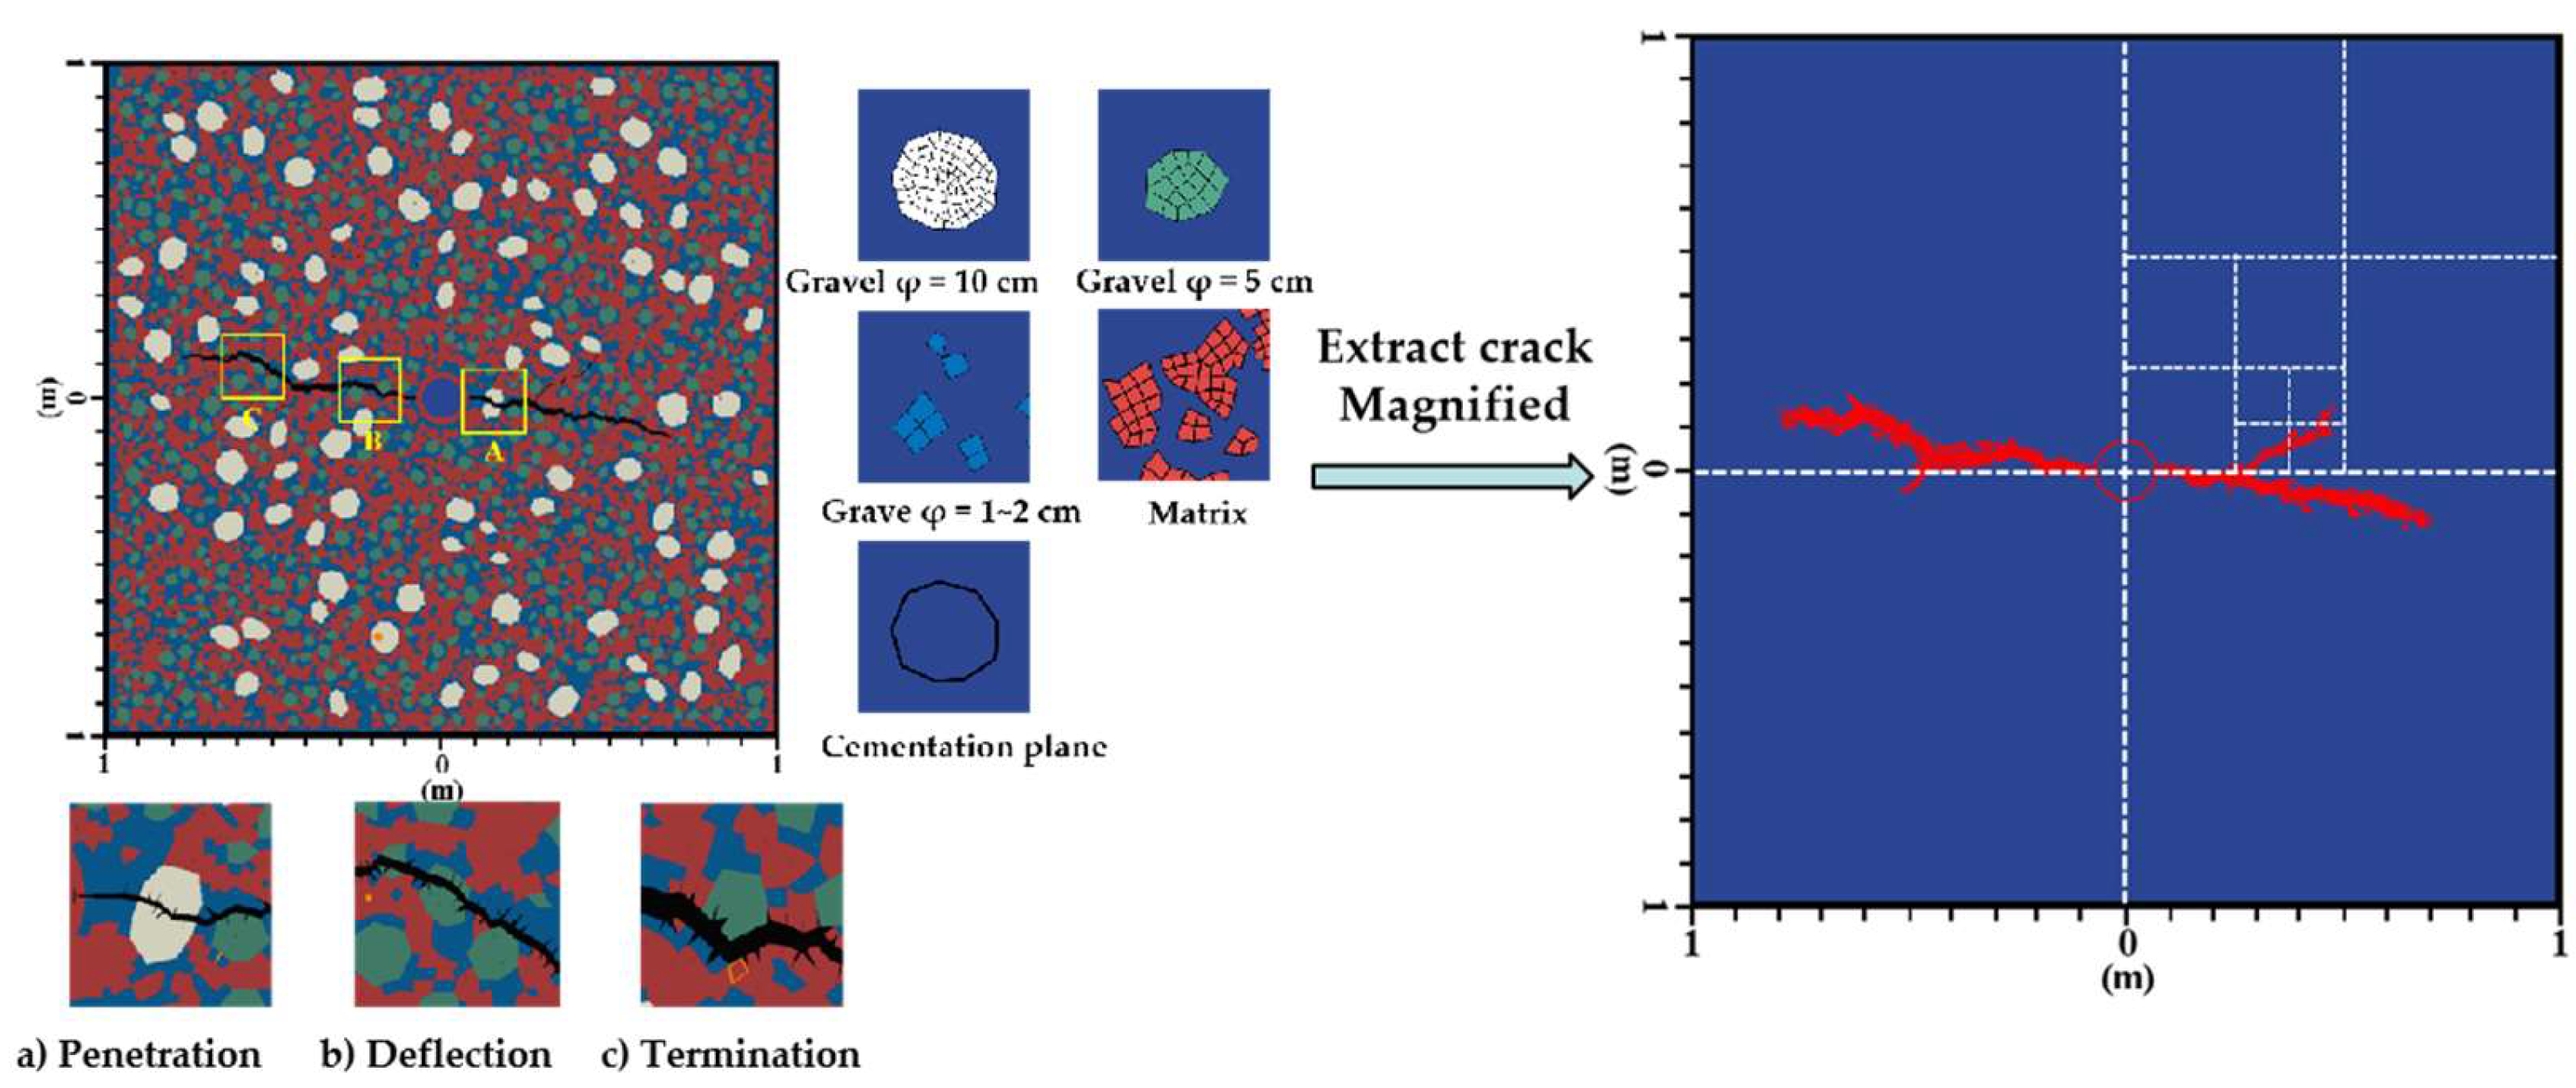
From the microscopic scale, the conglomerate is regarded as a three-phase composite material composed of gravel, matrix, and cemented surface between gravel and matrix. A cohesive element with zero thickness is inserted between two adjacent geometric elements, and a global cohesion element model is obtained to simulate the initiation and expansion of rock cracks by programming. Model: 2 m × 2 m size; 49,985 discrete geometric elements (the minimum grid size is 0.01 m); 62% gravel content, 38% matrix content.
The simulation results show that the fractures encounter the gravel propagation characteristics, mainly including three modes: termination (arrest), deflection, and penetration, which are consistent with the core experimental results (Figure 3 left). The reliability of simulation results is confirmed. The in-depth study of the model shows that the three modes lead to the formation of a complex fracture network structure with fractal characteristics (Figure 3 right). When using the SRV model to establish a seepage model, the fractal theory needs to be introduced to describe the seepage law of artificial micro-fractures. Fractal dimension can be used to describe the correlation of fractures and the complexity of fracture network.
Fractal dimension is a concept introduced to quantitatively describe fractal images. It reflects the effectiveness of the space occupied by the complex shapes and is a measure of the irregularity of the complex shape. Corresponding to the integer dimension in Euler geometry, fractal theory holds that the dimension can contain decimals and its value can be calculated with the following formula.
The formula for calculating the fractal dimension Df is:
D f = ln N ln S
where N is number of self-similar local shapes and S is the similarity ratio.
From the classical seepage theory, the core physical parameters describing fluid flow are permeability and porosity, which are related to the geometric properties of the reservoir. Similarly, the permeability and porosity in the fractal network reflect the geometric properties of the fractal structure, which leads to the inevitable connection between the permeability/porosity and the fractal dimension. The anomalous diffusion index reflects connectivity and is necessarily related to permeability. In order to quantitatively characterize their correlation, Chang [20] proposed the expressions of fractal permeability and fractal porosity, which show a power-law function with distance. Under the reference length, the expressions of fractal permeability and porosity are divided into:
{ K f ( y ) = K fi ( y w f ) D f θ f d ϕ f ( y ) = ϕ f ( y w f ) D f d
In this paper, a two-dimensional plane seepage model (d = 2) is used, and the pressure index relationship is introduced considering the influence of pressure change on porosity. The formula is as follows:
{ K f ( y ) = K fi ( y w f ) D f θ f 2 ϕ f ( y ) = ϕ f ( y w f ) D f 2 e C fi ( p f p 0 )
Using Equation (3), the change of seepage law with fractal characteristic in fracture network structure can be studied.

2.2. Matrix Seepage Description

The difference between the conglomerate reservoir and the sandstone reservoir is that the conglomerate reservoir has multi-level filling, which forms the unique complex modal structure of the conglomerate reservoir. The complex modal structure is that the pores formed by the gravel skeleton are partially or completely filled with sand particles, and the pores composed of sand particles are partially filled with loam-grade and clay-grade particles. Based on this structure, the microscopic pore throat characteristics of conglomerate reservoirs are diverse.
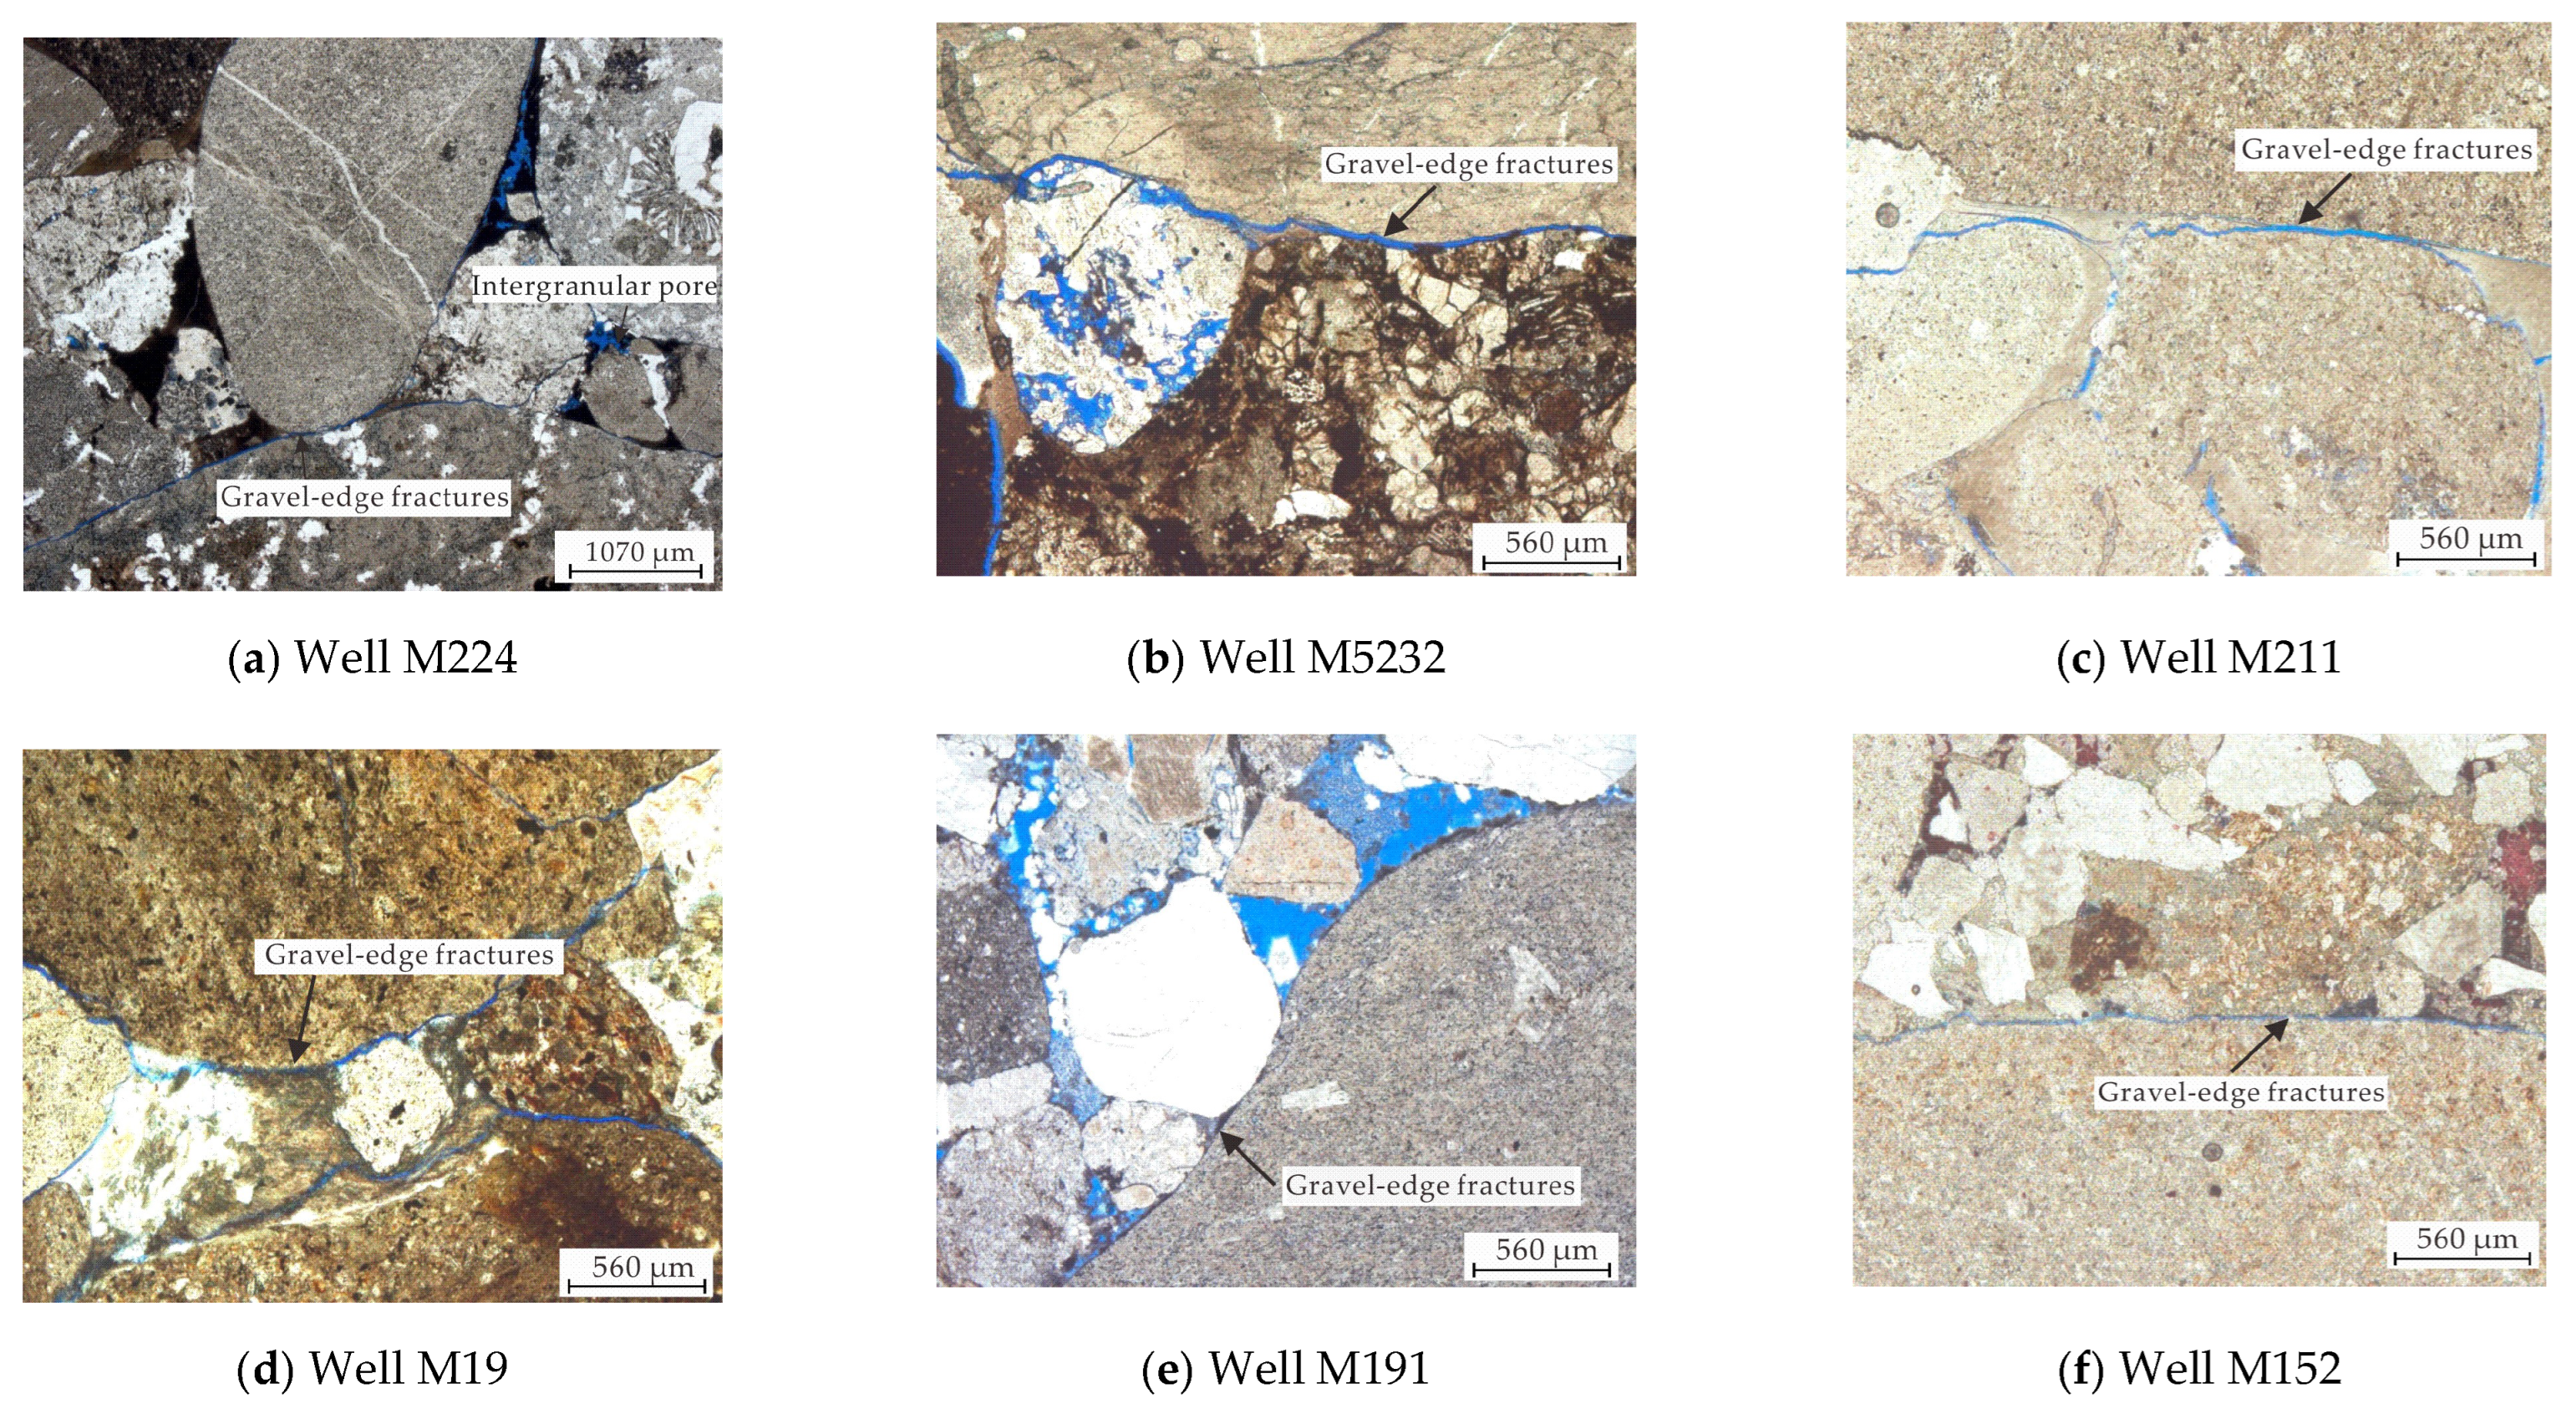
According to the occurrence of pores, the pores of conglomerate reservoirs can be divided into intergranular pores, interstitial pores, and gravel–edge fractures [21]. The thin section observation of cores (Figure 4) demonstrates the presence of numerous complex gravel–edge fractures in the Mahu conglomerate reservoir, accounting for more than 8%. Compared with other matrix pores, the conglomerate-edge fractures have higher permeability. The high conductivity of gravel–edge fractures makes the characteristics of “pseudo dual medium” more prominent in the tight conglomerate reservoirs. As a result, the microscopic seepage simulation and characterization of the Mahu conglomerate reservoir cannot be described by a single-pore structure, but by a “pseudo dual medium” composed of inter-gravel matrix pores and conglomerate-edge fractures. In view of this, the microscopic seepage pattern of this matrix can be described as the flow of matrix pores between gravels to the gravel–edge fractures, and the flow of gravel–edge fractures to the artificial complex fracture network [22].

3. Mathematical Model

3.1. Physical Assumptions

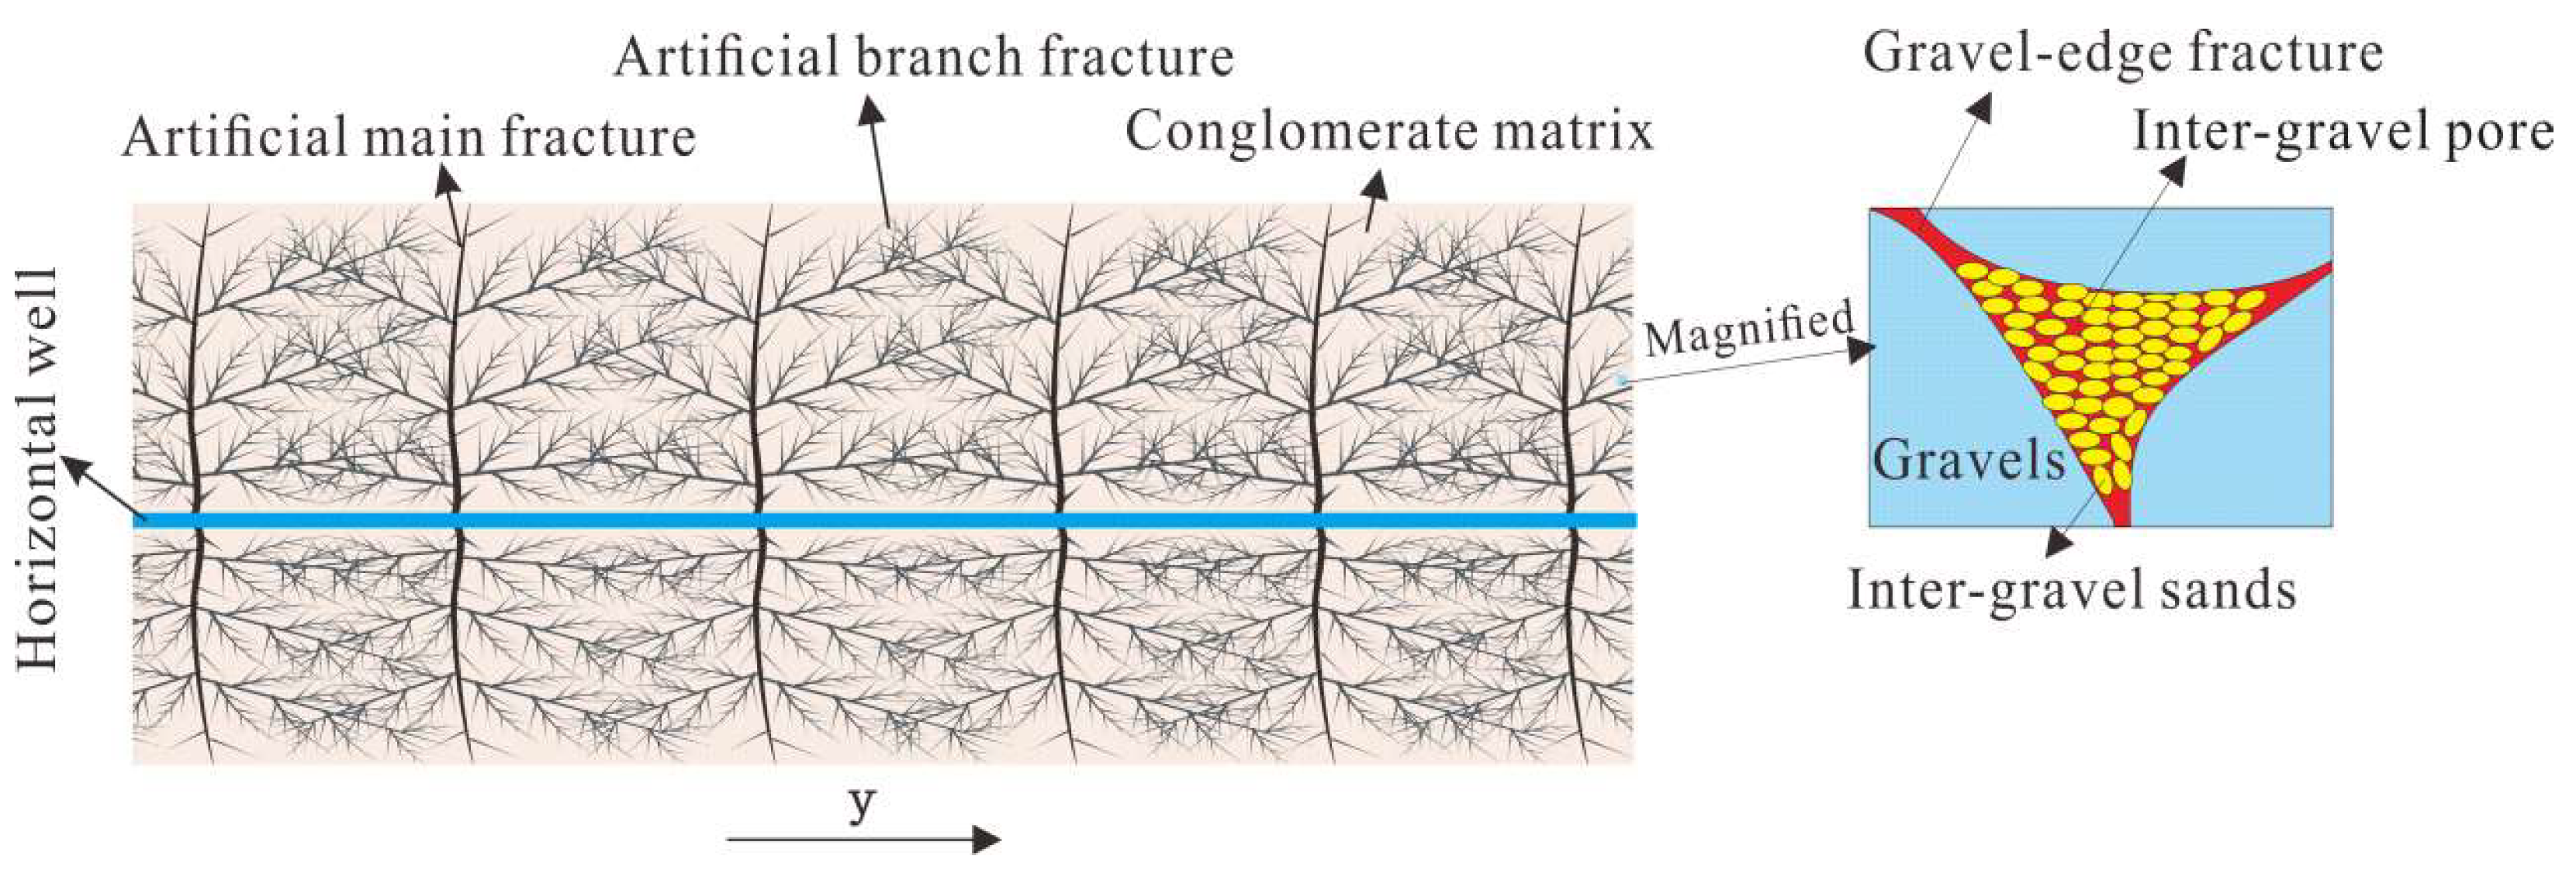
According to the description of fracturing fracture and matrix seepage characteristics of conglomerate reservoir, conglomerate reservoir includes artificial main fracture, artificial branch fracture, gravel-edge fracture and inter-gravel pore (Figure 5). The description and assumptions of the physical model are presented below:
(1)
A fractured horizontal well with finite fracture conductivity is located in the center of the bounded conglomerate reservoir and fracturing results in the complex fracture network, consisting of main fractures and artificial micro fractures (in other words, artificial branch fractures).
(2)
The conglomerate reservoir matrix features the multi-modal structure that satisfies the structural characteristic of “pseudo-multi-porosity” [15,16,17] and the effects of clay minerals on the conglomerate pore structure are ignored—the conglomerate reservoir is considered as bi-modal and thus treated as the “pseudo-dual-porosity medium” composed of the inter-gravel pore formed purely by sands around gravels and the gravel–edge fracture formed by gravels and objects in contact with such gravels.
(3)
It is assumed that pseudo-steady cross flow occurs from the inter-gravel pore to the gravel–edge fracture, while unsteady flow, following the De Swaan model [23], exists from the gravel–edge fracture to the artificial micro fracture; the linear Darcy flow is present from the artificial micro fracture to the main fracture and also from the main fracture to the wellbore.
(4)
n fractured zones are formed and evenly distributed along the horizontal wellbore after fracturing and each consists of the main fracture and numerous micro artificial fractures [24]. The artificial micro fracture follows a given fractal characteristic and the main fracture is stress sensitive.
(5)
The rock and fluid are both slightly compressible. The production proceeds at a constant production rate. The effects of gravity, capillary pressure, reservoir temperature variation, and wellbore friction are neglected.

3.2. Mathematic Model

The definitions of dimensionless variables are presented below (Table 1):
Symbols in the table: x, y, and r are the distance, m; xe is the recovered half length, m; R is the spherical radius of the matrix system, m; ye is the half spacing of main fractures, m; xF is the half length of main fractures, m; h is the pay zone thickness, m; wF is the fracture width, m; p0 is the original formation pressure, MPa; qF is the production rate of one main fracture, m3/d; B is the crude oil formation volume fractor; u is the formation oil viscosity, mPa·s; I is the pore type code for the region; m ,   g ,   f ,   and   F refer to the inter-gravel pore, gravel–edge fracture, artificial micro fracture, and main fracture, respectively; pi is the pressure corresponding to the code i, MPa; Ki is the permeability associated with the code I, μm2; Ci is the compressibility associated with the code I, MPa−1; ϕ i is the porosity associated with the code i, decimals; α i is the cross flow coefficient associated with the code i; and γ i is the permeability stress sensitivity coefficient associated with the code i.

3.2.1. SRV Region

The SRV includes the reservoir matrix and artificial micro-fracture, and the matrix pore consists of the inter-gravel pore and gravel–edge fracture. These three components constitute the “pseudo-triple-porosity” medium.
(1)
Reservoir matrix
From the inter-gravel pore to the gravel–edge fracture exists only the pseudo-steady cross flow, which can be expressed as:
α m K m μ ( p m p g ) = ϕ m C m p m t
An unsteady flow following the De Swaan model occurs from the gravel–edge fracture to the artificial micro fracture, of which the governing equation is shown below:
α m K m μ ( p m p g ) 1 r 2 r ( r 2 ρ g v g ) = ϕ g C g p g t
The kinematic equation of the gravel–edge fracture is expressed using the non-Darcy flow:
ν g = K g μ ( p g r G )
Substituting Equation (6) into Equation (5) produces Equation (7):
α m K m μ ( p m p g ) + K g μ ( 2 p g r 2 + 2 r p g r 2 G r ) = ϕ g C g p g t
The dimensionless expressions of Equations (1) and (4) can be obtained in accordance with the boundary conditions, and the mathematic model of the SRV region is presented below:
{ λ m ( p mD p gD ) = ω m p mD t D 2 p gD r D 2 + 2 r D p gD r D 2 M r D + λ m k g , F ( p mD p gD ) = ω gD k g , F p gD t D p gD r D | r D = 0 = 0 p gD | r D = r RD = p fD
where M = 2 π K Fi h x F q F B μ G .
(2)
Artificial micro fractures
The artificial micro fractures of this region are set to have a complex fractal network structure. The pore space of artificial micro fractures is assumed to be elastic and independent of stress sensitivity. Consequently, the porosity and permeability can be expressed as below [25,26]:
{ K f ( y ) = K fi ( y w f ) D f θ f 2 ϕ f ( y ) = ϕ f ( y w f ) D f 2 e C fi ( p f p 0 ) ϕ f ( y w f ) D f 2 ( 1 + C fi ( p f p 0 ) )
where D f represents the fractal dimension and θ f represents the anomalous diffusion exponent.
The governing equation of artificial micro fractures can be obtained from the derivation of Gu et al. [27] and Jiang et al. [28].
K fi μ ( y w f ) D f θ f 2 ( D f θ f 2 y p f y + 2 p f y 2 ) 3 R K g μ ( y w f ) D f 2 ( d p g d r G ) | r = R = ϕ f C f ( y w f ) D f 2 p f t
Again, Equation (10) is normalized with respect to the boundary condition and simplified to construct the mathematic model of artificial branched fractures:
{ 2 p fD y D 2 + D f θ f 2 y D p fD y D 3 r eD k g , f ( y D w FD ) θ f ( d p gD d r D + M ) | r D = R eD = ( y D w FD ) θ f k F , f ( 1 ω m ω g ) p fD t D p fD | y D = w FD / 2 = p FD | y D = w F D / 2 p fD y D | y D = y e D = 0

3.2.2. Main Fracture Region

For the main fracture region, the liquid supply from the SRV region is incorporated, and the corresponding fluid flow is expressed as below:
x ( ρ F v F ) + ρ o K f μ p f y 2 w F | y = w F / 2 = ( ρ F ϕ F ) t
In this region, the fluid flow is Darcy flow, and the kinematic equation is:
ν F = K F μ p F y
It is assumed that main fractures are stress-sensitive, and their permeability modulus can be expressed as an exponential function [27,28]:
K F = K F i e γ F ( p F - p 0 )
By substituting Equations (13) and (14) into Equation (12), the governing equation of this region can be simplified as:
e γ F ( p F p 0 ) ( γ F ( p F x ) 2 + 2 p F x 2 ) + K f i K F i p f y 2 w F | y = w F / 2 = 1 η F p F t
Similarly, the normalization based on the boundary condition and subsequent simplification of Equation (15) are performed to gain the mathematic expression of this region:
{ e - γ FD p F D ( 2 p FD x D 2 γ F D ( p FD x D ) 2 ) + k f , F p F D y D 2 w F D | y D = w FD / 2 = η f , F k f , F p FD t D p F D | t D = 0 = 0 e - γ FD p F D p F D x D | x D = 1 = 0 p F D | x D = 0 = p w D ( t D ) , e - γ F D p F D p F D x D | x D = 0 = π C F D

3.3. Solving the Model and Plotting Type Curves

3.3.1. SRV Region

(1)
Reservoir matrix
The Laplace transform of Equation (8) (the mathematic model of the reservoir matrix) is performed, and we have:
{ λ m ( p m D ¯ p gD ¯ ) = ω m s p m D ¯ 2 p g D ¯ r D 2 + 2 r D p gD ¯ r D 2 M r D + λ m k g , F ( p m D ¯ p gD ¯ ) = ω g k g , F s p gD ¯ p gD ¯ r D | r D = 0 = 0 p gD ¯ | r D = r R D = p f D ¯
After substituting the pseudo-steady cross flow equation of inter-gravel pores into the unsteady flow equation of the gravel–edge fracture and corresponding simplification, we have:
2 p g D ¯ r D 2 + 2 r D p g D ¯ r D ε p gD ¯ = 2 M r D
where ε = s k g , F ( λ m ω m ω m s + λ m + ω g ) .
Then, by substituting p g D ¯ = u ¯ r D into Equation (18), the variable of the mathematic equation is changed [29]:
{ 2 u ¯ r D 2 ε u ¯ = 2 M u ¯ | r D = 0 = 0 u ¯ | r D = r RD = r R D p f D ¯
By solving Equation (19), we have:
u ¯ = sinh ( r D ε ) sinh ( r R D ε ) r R D p fD ¯ + 2 M ε [ ( 1 e r R D ε ) sinh ( r D ε ) sinh ( r R D ε ) + e r D ε 1 ]
Afterward, the derivative of p g D ¯ at r D = r R D can be calculated as:
p g D ¯ r D | r D = r R D = ( ε coth ( r R D ε ) 1 r R D ) p fD ¯ + χ
where χ = 2 M r R D ε [ ( 1 e r R D ε coth ( r R D ε ) + e r R D ε ] .
(2)
Artificial micro fractures
The Laplace transform of Equation (11) (the mathematic model of artificial micro fractures) is performed and Equation (22) is obtained after substituting Equation (21) into the transformed Equation (11):
{ 2 p f D ¯ y D 2 + D f θ f 2 y D p f D ¯ y D A y D θ f p f D ¯ = B y D θ f p f D ¯ | y D = w F D / 2 = p FD | y D = w F D / 2 p f D ¯ y D | y D = y e D = 0
where A = 3 r R D w FD θ f k g , f ( ε coth ( r R D ε ) 1 r R D ) + ( 1 ω m ω g ) s k f , F w F D θ f , and B = ( 1 w F D ) θ f 3 r R D k g , f ( χ + M ) .
The particular solution of this equation is determined to be −B/A via a trial-and-error process referring to the solving method of the universal solution of this equation by Pei [25]. Accordingly, the expression of the universal solution plus the particular solution is presented below:
p f D ¯ = y D a [ C 1 I n ( b y D ϑ ) + C 2 K n ( b y D ϑ ) ] B A
where a = 3 D f + θ f 2 , n = 3 D f + θ f θ f + 2 , ϑ = 2 + θ f 2 , and b = A ϑ .
C1 and C2 are calculated by substituting Equation (23) into the boundary condition and the partial derivative of the equation at y D = w FD 2 is computed:
p f D ¯ y D | y D = w F D 2 = E p F D ¯ | y D = w F D 2 + B A E
where E = A ( w FD 2 ) θ f 2 [ K n - 1 ( b y eD ϑ ) I n - 1 ( b ( w FD 2 ) ϑ ) I n - 1 ( b y eD ϑ ) K n - 1 ( b ( w FD 2 ) ϑ ) I n ( b ( w FD 2 ) ϑ ) K n - 1 ( b y eD ϑ ) + I n - 1 ( b y eD ϑ ) K n ( b ( w FD 2 ) ϑ ) ] .

3.3.2. Main Fracture Region

Since the mathematical model of the main fracture is nonlinear, it is required to introduce the Pedrosa transform [30] and perturbation theory to eliminate the nonlinearity of the equation. The equations are presented below:
p F D = 1 γ D ln ( 1 γ D ξ F D )
ξ F D = ξ F D   0 + γ D ξ F D   1 + γ D 2 ξ F D   2 +
1 1 - γ D ξ F D = 1 + γ D ξ F D + γ D 2 ξ F D 2 +
1 γ D ln ( 1 γ D ξ F D ) = ξ F D + 1 2 γ D ξ F D 2 +
After eliminating the nonlinearity of Equation (16), the Laplace transform is performed:
{ 2 ξ F D 0 ¯ x D 2 + 2 K f , F w FD p f D ¯ y D | y D = w FD / 2 = η f , F k f , F s ξ F D 0 ¯ ξ F D 0 ¯ | t D = 0 = 0 ξ F D 0 ¯ x D | x D = 1 = 0 ξ F D 0 ¯ | x D = 0 = ξ w D 0 ¯ ( s ) , ξ F D 0 ¯ x D | x D = 0 = π C F D s
By substituting Equation (24) into Equation (29) and simplifying the resultant expression, Equation (30) is obtained:
2 ξ F D 0 ¯ x D 2 F 1 ( E ) ξ F D 0 ¯ F 2 ( E ) = 0
where F 1 ( E ) = η f , F k f , F s 2 K f , F w FD E and F 2 ( E ) = 2 K f , F w FD B A E .
Solving Equation (30) yields:
ξ F D 0 ¯ = π cosh ( F 1 ( E ) ( x D 1 ) ) C F D s F 1 ( E ) sinh ( F 1 ( E ) ) F 2 ( E ) F 1 ( E )
When x D = 0 , the pressure solution of the main fracture is equal to the dimensionless bottomhole pressure of the Laplace space:
ξ w D 0 ¯ = ξ F D 0 ¯ | x D = 0 = π coth ( F 1 ( E ) ) C F D s F 1 ( E ) F 2 ( E ) F 1 ( E )
Meanwhile, the dimensionless wellbore storage factor and skin factor are introduced on the basis of the Duhamel theory. The bottomhole pressure solution, considering the wellbore storage and skin effects, is [27]:
ξ w D ¯ = s ξ w D 0 ¯ + S s [ 1 + C D s ( s ξ w D 0 ¯ + S ) ]
Finally, through the Stehfest numerical inversion and perturbation inverse-transform of Equation (34), the true bottomhole pressure solution is obtained [31].
p wD = 1 γ F D ln ( 1 γ F D L 1 [ ξ w D ¯ ] )

3.3.3. Blasingame Type Curves

The solution of the Laplace space can be obtained via the numerical transform of Equation (34). Then, the production rate of the Laplace space can be calculated [32], according to the correlation between the dimensionless production rate with the constant bottomhole pressure and the dimensionless bottomhole pressure with the constant production rate:
q D = L 1 [ 1 p wD ¯ s 2 ]
In the case of the boundary-controlled flow, the dimensionless bottomhole pressure can be expressed as:
p w D = α t D + ς
The dimensionless time can be defined as:
t D d = α ς t D
The dimensionless production rate can be defined as:
q D d = ς q D
The integral of the dimensionless production rate is:
q D d i = N p D d t D d = 1 t D d 0 t D d q D d ( τ ) d τ
The derivative of the dimensionless production rate integration is:
q D d i d = d q D d i d ln t D d = t D d d q D d i d t Dd
The function of the derivative of the integral is:
β = q D d i d q D d i
α and ς in Equation (36) are constants. This paper refers to Lin‘s method to value the constants coefficient [13]. According to the correlation coefficient, the Blasingame curve is plotted with Matlab software. The Blasingame type curves of the model in this research are illustrated below (Figure 6).

4. Results and Discussion

4.1. Effects of the Fractal Dimension on the Curve Shape

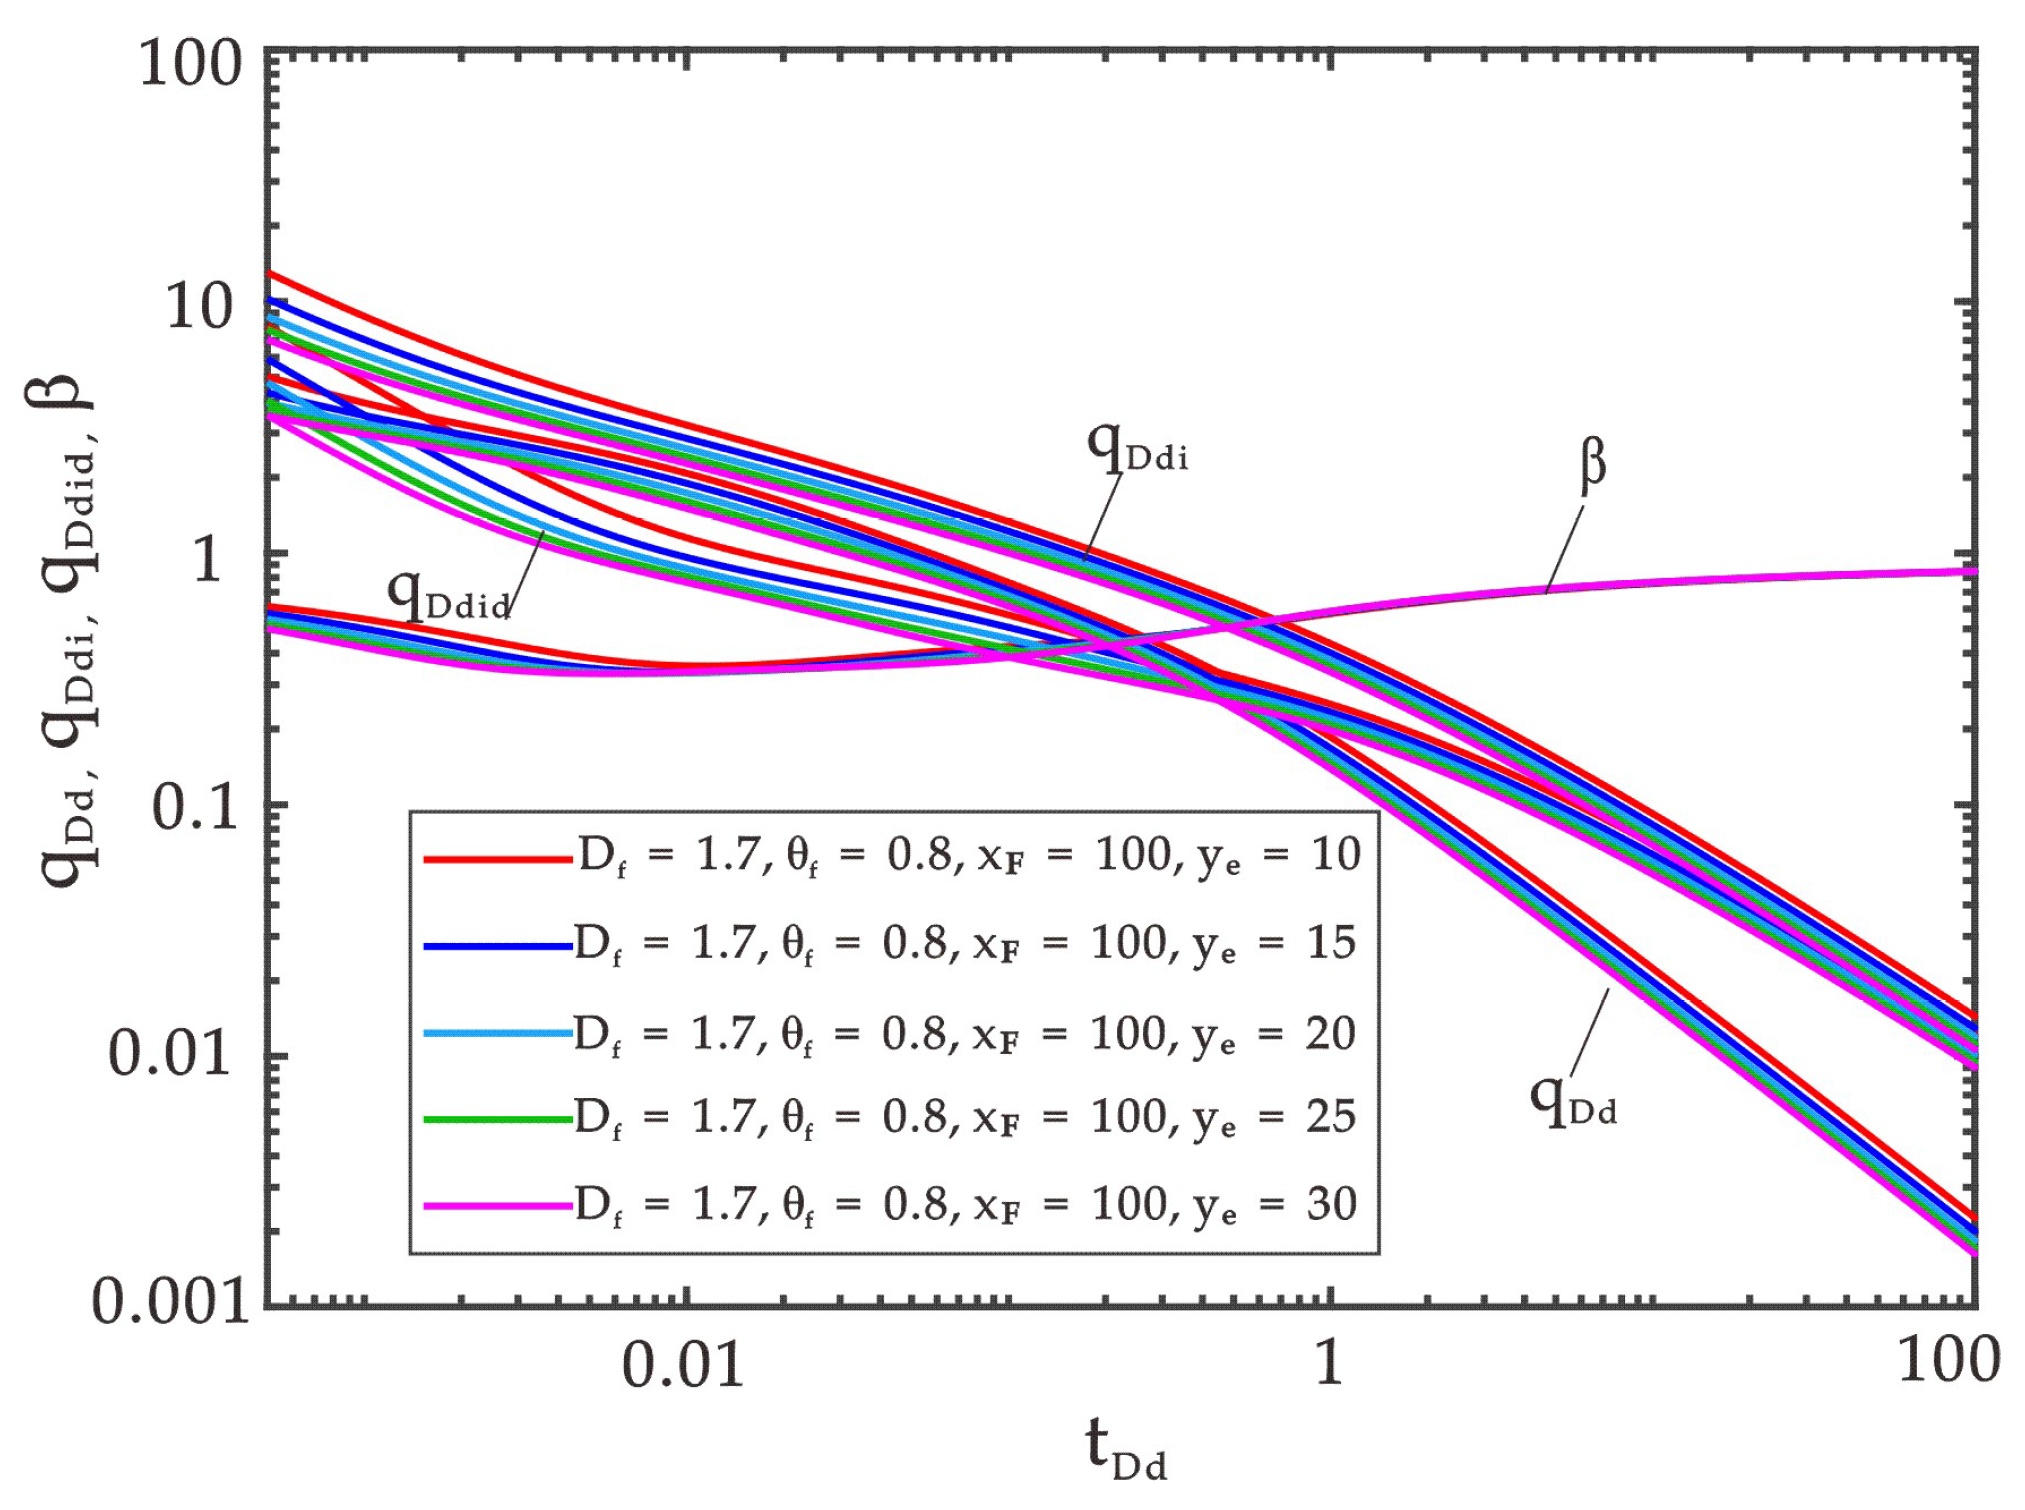
The Blasingame curves for different fractal dimensions were calculated and plotted. The results show that with the increasing fractal dimension, the dimensionless production rate, dimensionless production rate integral, and dimension less production rate integral derivative all shift obliquely upward, with smaller deviations in the front and larger deviations in the rear, which results in the delayed boundary flow. The β function of the integral derivative presents an opposite phenomenon—the front and rear of curves almost converge and, yet, the middle section of curves shifts downward (Figure 7). These can be explained as below: the fractal dimension determines the complexity of the artificial micro fracture distribution. The higher fractal dimension leads to a smaller density of artificial micro fractures and, consequently, simpler fracture distribution. Also, the differentiation of porosity and permeability is reduced, the flow distance of crude oil via the complex fracture network is shortened, and the overall flow resistance is lowered, which promote dimensionless production. However, as the density of artificial fractures declines, the probability of contact between the reservoir matrix and artificial fractures reduces. Hence, difficulties in flowing of crude oil from inter-gravel pores to the artificial fracture network are raised, and the corresponding time is extended, which leads to the delay of the boundary flow.

4.2. Effects of the Anomalous Diffusion Exponent on the Curve Shape

The case of the anomalous diffusion exponent is just the opposite of that of the fractal dimension. An increasing anomalous diffusion exponent results in smaller early and late deviations and larger middle deviations and also late parallel arrangement for the curves of the dimensionless production, dimensionless production integral, and dimensionless production integral derivative. It should also be noted that the curves present larger downward movements with the rising anomalous diffusion exponent. Unlike the above three curves, the integral derivative β function shifts upward in the early production and presents localized downward deviations in the late production, after which the curves gradually coincide into one (Figure 8).
The analysis shows that the anomalous diffusion exponent stands for the smoothness and degree of disorder of the oil migration through artificial branch fractures and is the representation of the fluid flow capacity of the complex intersecting branch fracture network. A higher anomalous diffusion exponent suggests lower connectivity of the branched fracture network, higher degrees of flow disorder, and, ultimately, stimulated resistance for oil migration toward the wellbore. Correspondingly, with the growth of the anomalous diffusion exponent, the pressure drawdown required for fluids to flow from the formation to the wellbore is enhanced and the dimensionless production rate declines, which is manifested as the synchronized downward shifting of the curves of the dimensionless production rate, dimensionless production rate integral, and the dimensionless production rate integral derivative.
At the same time, the influence of anomalous diffusion index on permeability under fractal network has a correlation with the distance from the main fracture. Basically, it shows that the closer the distance to the main fracture, the smaller the negative impact of the branch fracture network complexity on permeability. It is explained that the main fractures and near-main fractures are mainly used for fluid supply in the early stage of production, and the anomalous diffusion index has little influence on them. With the passage of time, when the branched fracture network is completely involved in the liquid supply, the influence of the anomalous diffusion index reaches the maximum, and the offset of the curve reaches the maximum. In the later stage, the shape of the curve is affected by the weakening of the liquid supply capacity and the pseudo-steady crossflow, not by the anomalous diffusion exponent. Therefore, the curve gradually decreases from the offset distance to the parallel state.

4.3. Effects of the Fluid Flow Threshold Pressure on the Shape Curve

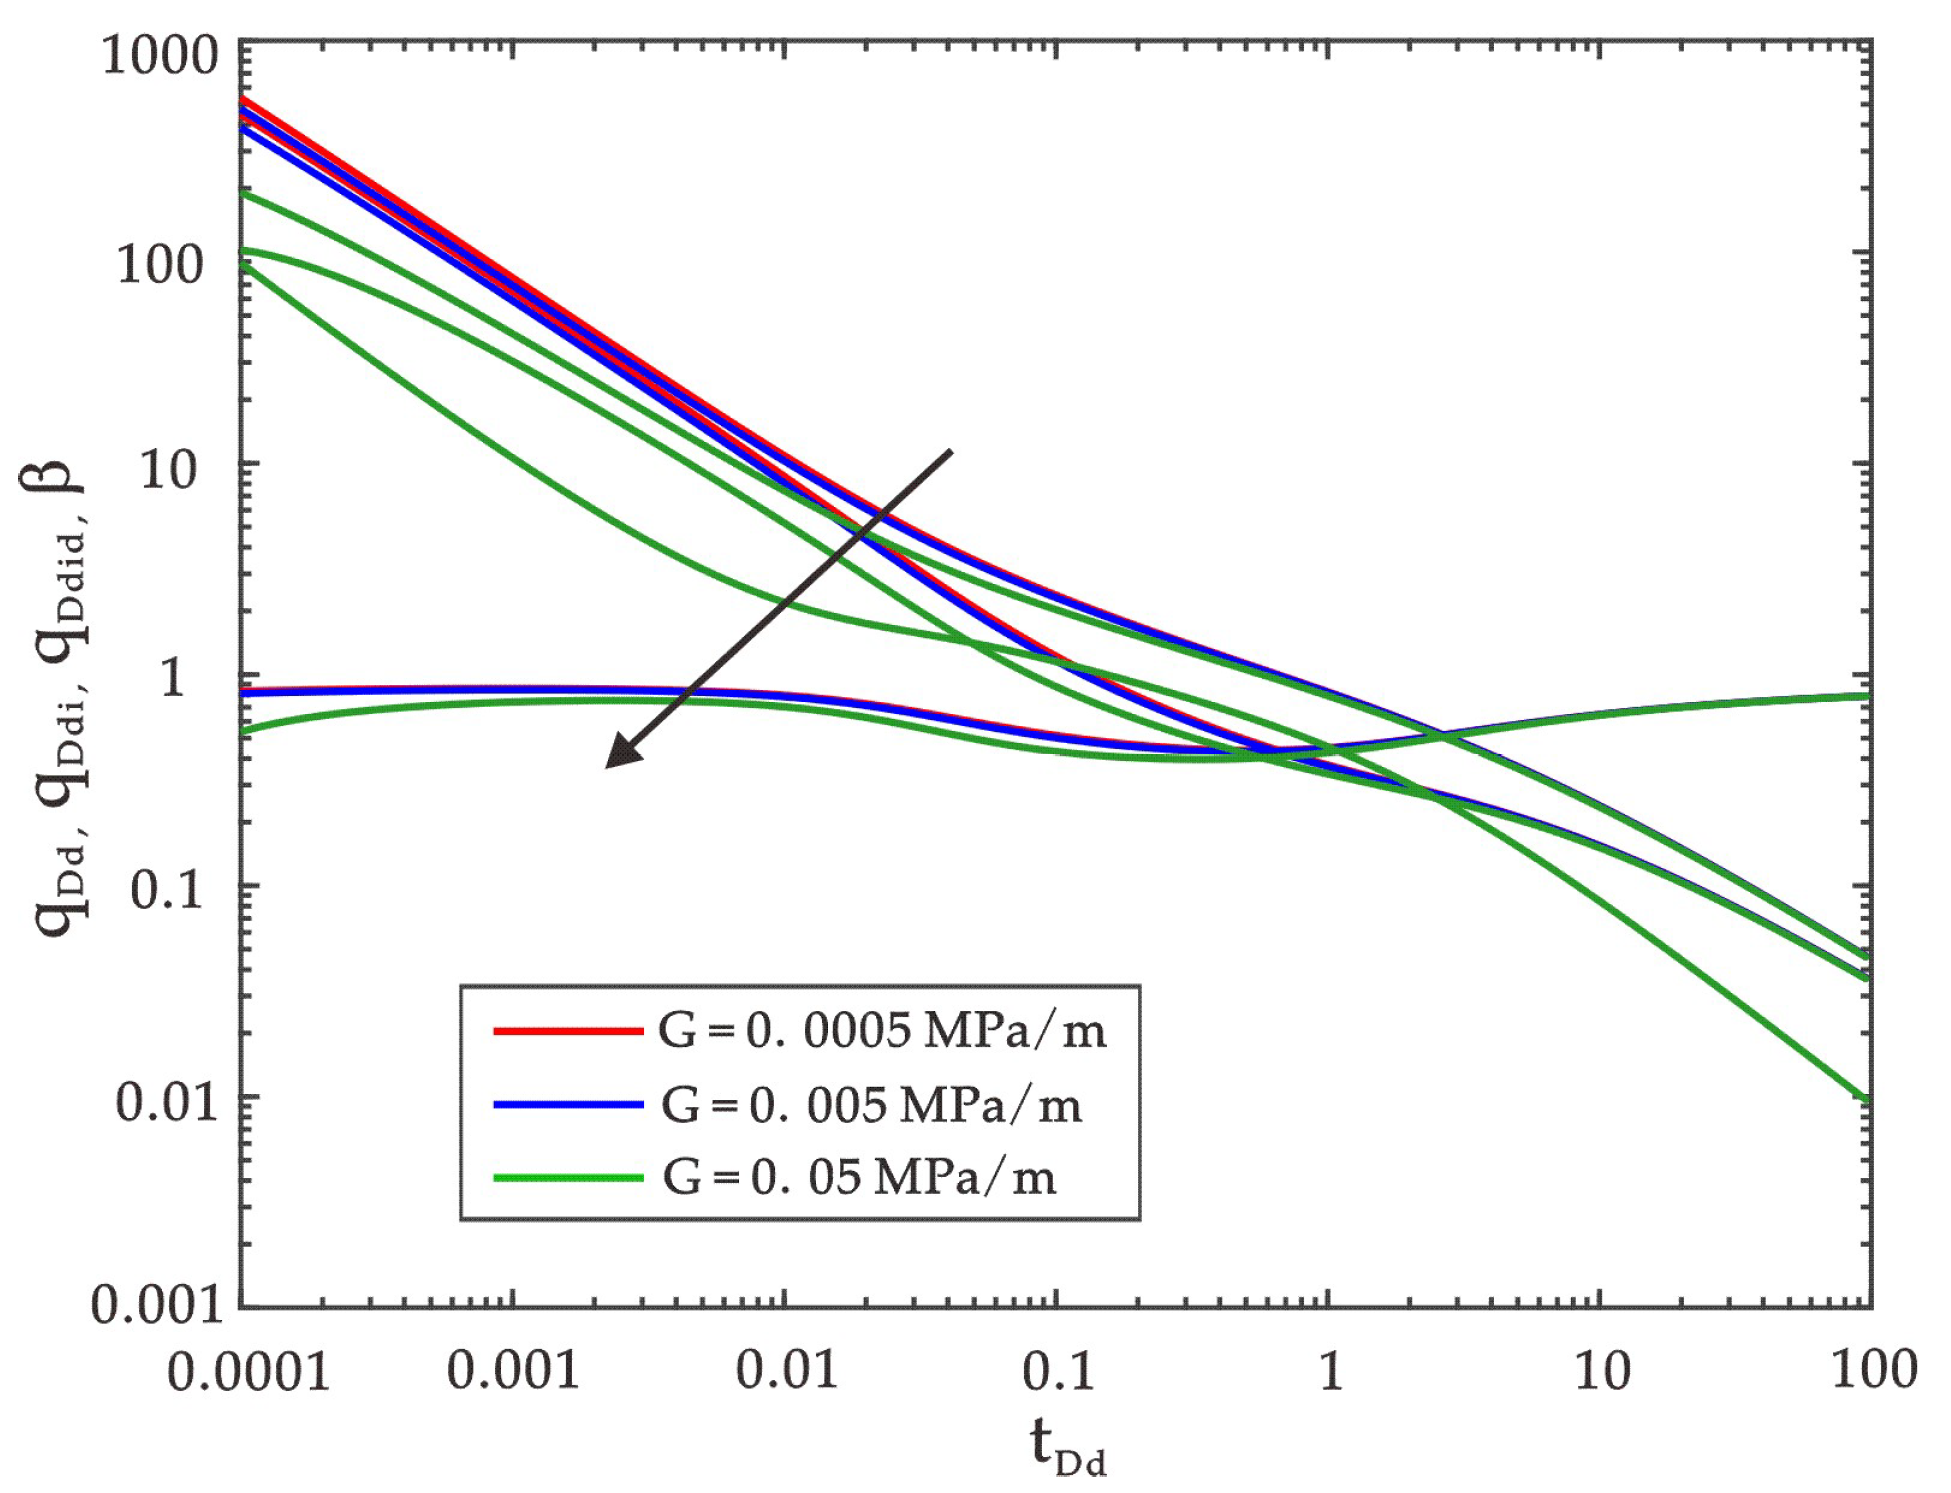
The effects of the threshold pressure gradient on the Blasingame curves are illustrated in Figure 9. It is seen that the dimensionless production rate curve rarely changes as the threshold pressure gradient climbs up from 0.0005 MPa/m to 0.05 MPa/m. Yet, the curves of the dimensionless production integral, dimensionless production integral derivative, and integral derivative function β all shift downward in the early stage, and the drop magnitudes grow with the increasing threshold pressure gradient. In the late stage (of the boundary flow), the curves are free of the threshold pressure gradient, and all coincide with each other. It is believed that the threshold pressure gradient represents the minimum resistance that fluids need to overcome during the initial flow. A higher threshold pressure gradient means higher initial flow resistance to recover the reservoir matrix. Hence, under the same conditions, the higher the threshold pressure gradient is, the lower the pressure inside the artificial fracture needs to be for the purpose of producing from the reservoir matrix. Correspondingly, lower bottomhole flowing pressure is required, and the time required to enable matrix fluid flow is prolonged, which leads to the downward shifting of the curves of the dimensionless production rate integral, dimensionless production integral derivative, and integral derivative β function in the early stage. As the production reaches the late stage, enough pressure difference exists between the matrix and artificial fracture, and the fluids in the reservoir matrix have already been recovered—the threshold pressure gradient no longer impacts the flow, which is manifested as the coincidence of all curves of different threshold pressure gradients.

5. Model Application

To validate the reliability of the presented model, the production decline analysis of well M1 of the small well spacing demonstration project of the Mahu conglomerate oil reservoir was performed using the model of this research and the conventional SRV model, respectively. The original formation pressure of this well is 38.8 MPa; the effective reservoir thickness, 14.9 m; the porosity, 10%; the oil saturation, 55.85%; the horizontal wellbore length, 1736 m; the drilled pay zone length, 1734 m. The horizontal wellbore was divided into 23 fracturing stages with 80 clusters. The total liquid consumption of fracturing reached 24,043 m3, and 1677 m3 of proppants were injected. The peak oil production is 53.2 t/d, and the well is still producing now, with daily oil production of 9.6 t.
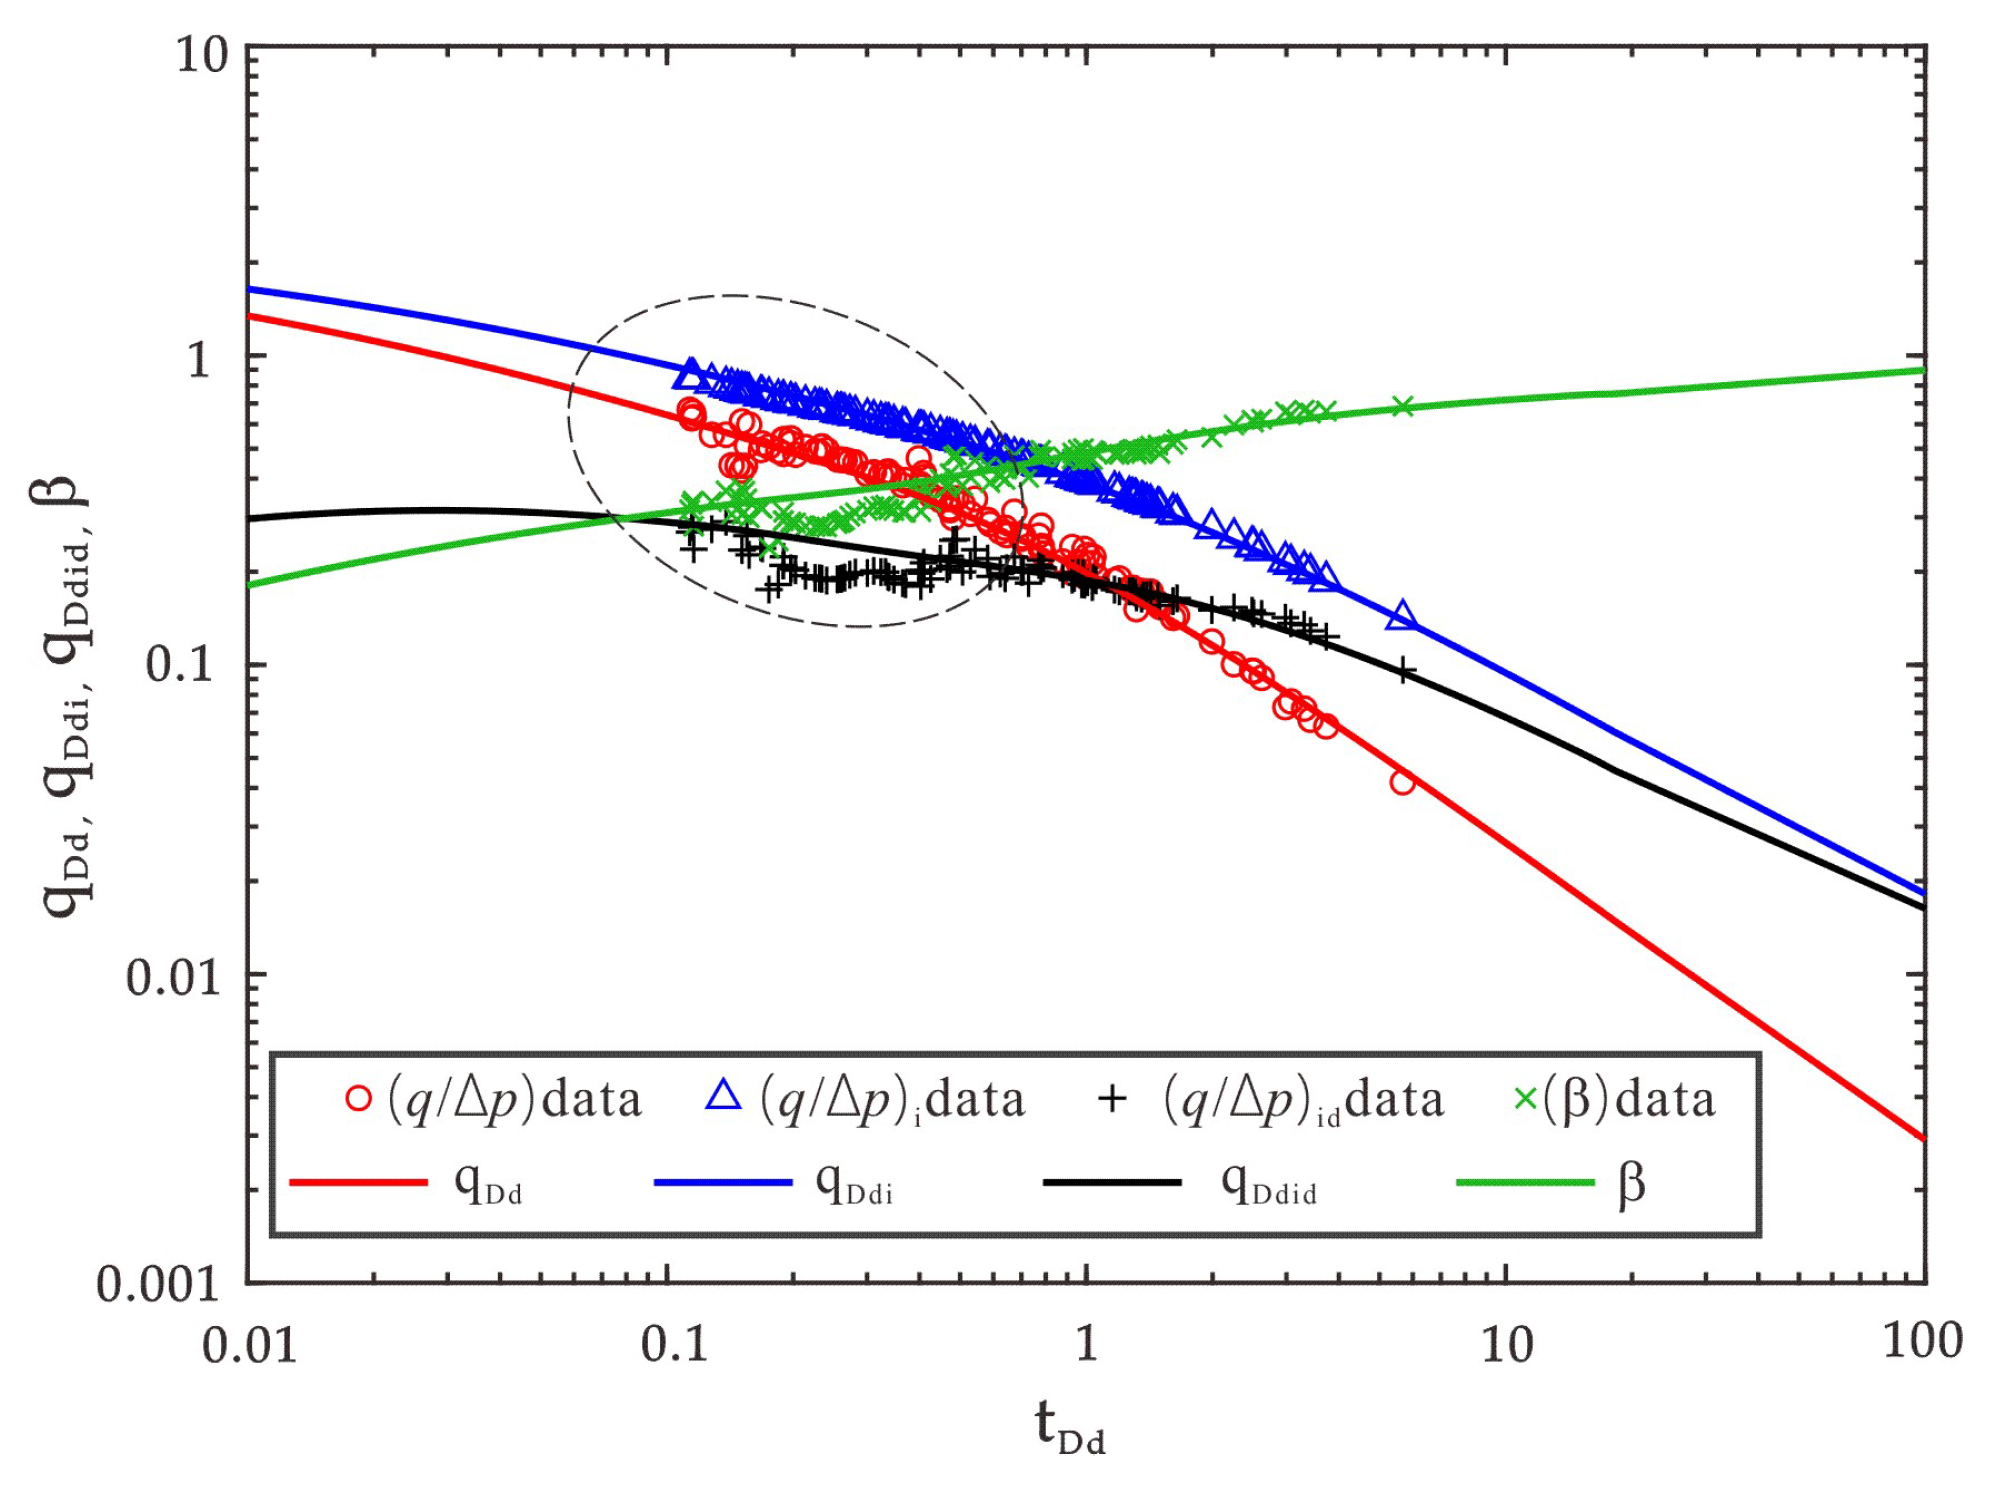
The curve section with high-quality pressure and production data was chosen to perform fitting so as to avoid irregularity of normalized curves caused by the flowback of fracturing fluids, and the fitting results of the two models were compared (Figure 10 and Figure 11). The fitting accuracy of the model presented in this research is higher than that of the conventional SRV model. Although the interpreted fracture half-length and well-controlled reserve of the former are smaller than those of the latter, the resultant fracture conductivity is higher. The interpretation results are shown in Table 2. The present model incorporates the dual-porosity structure, the threshold pressure gradient of the conglomerate reservoir matrix, and the fractal characteristic of the fracture network, which leads to the concave curve feature of the dimensionless production rate integral. It is this curve feature that promotes the fitting accuracy by 10% and delivers a more reliable evaluation.

6. Conclusions

In this article, a mathematical seepage model was presented for the tight conglom-erate reservoirs with small well spacing. Novelties provided in this work include: (a) the model considers the multi-porous structure of the conglomerate reservoir matrix; (b) the propagation characteristics of the fracturing network are analyzed in conglomerate res-ervoirs, and the fractal theory is introduced to describe the complex fracture network structure considering pressure sensitivity; (c) incorporated with the fractal theory and the characteristics of double porous in matrix, a novel analytical solution in the SRV flow model was presented for unconventional conglomerate reservoir. The detailed conclusions are as follows.
(1)
Microseismic monitoring, core experiments, core numerical simulations, etc., have confirmed that the complex fractures can be formed in conglomerate reservoirs. Under this condition, the fractal porosity and fractal permeability models can be used. The core slices have confirmed that the matrix cannot be described by a single-pore model due to the development of gravel–edge fractures. Modeling can be simplified to a pseudo-dual-porosity medium.
(2)
The mathematic model of the fractured horizontal well with small well spacing was developed, with the multi-modal pore structure of the tight conglomerate reservoir, the fractal characteristic of the branch fracture network, threshold pressure gradient for fluid flow in the matrix, and stress sensitivity taken, into consideration. The sensitive parameters were analyzed, and it was confirmed that the model conforms to the seepage law.
(3)
The field application validated the feasibility and reliability of the developed Blasingame curves for the parameter evaluation of developing tight conglomerate reservoirs using small-spacing horizontal wells. The fitting accuracy is 10% higher than that of the conventional SRV model.

Author Contributions

Conceptualization, X.L. and J.S.; methodology, H.P.; formal analysis, K.G.; investigation, S.W. and L.Y.; resources H.Y., L.W., X.W., S.L., T.L. and G.L.; writing original draft preparation, J.S. and H.P.; writing—review and editing, X.L. and L.Y.; visualization, K.G. All authors have read and agreed to the published version of the manuscript.

Funding

This research was funded by the National Major Scientific and Technological Project (Grant No. 2017ZX05070-001).

Data Availability Statement

Data will be made available upon request.

Acknowledgments

We thank CNPC for the permission for the release of this study. We appreciate the valuable comments from the editors and anonymous reviewers.

Conflicts of Interest

The authors declare no conflict of interest.

References

  1. Li, G.; Qin, J.; Xian, C.; Fan, X.; Zhang, J.; Ding, Y. Theoretical understandings, key technologies and practices of tight conglomerate oilfield efficient development: A case study of the Mahu oilfield, Junggar Basin, NW China. Pet. Explor. Dev. 2020, 47, 1185–1197. [Google Scholar] [CrossRef]
  2. Qin, J.; Zhang, J.; Jiang, Q.; Feng, Y.; Zhao, Y.; Zhu, J.; Lu, Z.; Wu, S. Sweet spot classifi cation evaluation of tight conglomerate reservoir in Mahu sag and its engineering application. China Pet. Explor. 2020, 25, 110–119. [Google Scholar]
  3. Yan, Y. Production Decline Analysis on Volumetric Fractured Horizontal Wells in Tight Reservoir. Master’s Thesis, China University of Petroleum (East China), Qingdao, China, 2017. [Google Scholar]
  4. Cao, Y. Application of Modern Production Decline Analysis to Prefracture Assessment of Refracturing Technology. Master’s Thesis, Chengdu University of Technology, Chengdu, China, 2016. [Google Scholar]
  5. Sun, H.; Ouyang, W.; Zhang, M.; Tang, H.; Chen, C.; Ma, X.; Fu, Z. Advanced production decline analysis of tight gas wells with variable fracture conductivity. Pet. Explor. Dev. 2018, 45, 455–463. [Google Scholar] [CrossRef]
  6. Liu, X.; Zou, C.; Jiang, Y.; Yang, X. Theory and application of modern production decline analysis. Nat. Gas Ind. 2010, 30, 50–54. [Google Scholar]
  7. Blasingame, T.A.; Johnston, J.L.; Lee, W.J. Type Curve Analysis Using the Pressure Integral Method. In Proceedings of the SPE California Regional Meeting (Society of Petroleum Engineers), Bakersfield, CA, USA, 5 April 1989. [Google Scholar]
  8. Palacio, J.C.; Blasingame, T.A. Decline Curve Analysis Using Type Curves: Analysis of Gas Well Production Data. In Proceedings of the SPE California Regional Meeting (Society of Petroleum Engineers), Denver, CO, USA, 26–28 April 1993. [Google Scholar]
  9. Blasingame, T.A.; Iik, D.; Hosseinpour, Z.N. Application of the B-Derivative Function to Production Analysis. In Proceedings of the SPE Annual Technical Conference & Exhibition, Anaheim, CA, USA, 11–14 November 2007. [Google Scholar]
  10. Wang, J.L.; Yan, C.Z.; Jia, A.L.; He, D.B.; Wei, Y.S.; Qi, Y.D. Rate decline analysis of multiple fractured horizontal well in shale reservoir with triple continuum. J. Cent. South Univ. 2014, 21, 4320–4329. [Google Scholar] [CrossRef]
  11. Sun, Z. Research on Horizontal Well and Fractured Horizontal Well Advanced Production Dynamics Analysis Method and Software Development. Master’s Thesis, China University of Petroleum (East China), Qingdao, China, 2015. [Google Scholar]
  12. Cao, L. Research on Unstable Percolation Theory and Rate Transient Analysis in Tight Gas Reservoirs. Ph.D. Thesis, Southwest Petroleum University, Chengdu, China, 2017. [Google Scholar]
  13. Li, W. Study on Pressure Production Dynamic Model and Method of Tight Oil Reservoirs with Fractured Horizontal Well. Ph.D. Thesis, China University of Geosciences (Beijing), Beijing, China, 2019. [Google Scholar]
  14. Wang, M.; Dou, X.; Ming, R.; Li, W.; Zhao, W.; Tan, C. Semi-Analytical rate decline solutions for a refractured horizontal well intercepted by multiple reorientation fractures with fracture face damage in an anisotropic tight reservoir. Energies 2021, 14, 7482. [Google Scholar] [CrossRef]
  15. Liu, J. An investigation on structure model of conglomeratic reservoir and its evaluation. Pet. Explor. Dev. 1983, 10, 45–56. [Google Scholar]
  16. Lu, Y. Experimental Studies on Water-Flooding Mechanisms of Glutenite Reservoirs. Master’s Thesis, China University of Petroleum (East China), Qingdao, China, 2017. [Google Scholar]
  17. Yin, S.; Chen, G.; Chen, Y.; Wu, X. Mechanism of complex modes of the pore structure of sandstone/conglomerate reservoirs. J. Southwest Pet. Univ. (Sci. Technol. Ed.) 2019, 41, 1–17. [Google Scholar]
  18. Zou, Y.; Shi, S.; Zhang, S.; Yu, T.; Tian, G.; Ma, X.; Zhang, Z. Experimental modeling of sanding fracturing and conductivity of propped fractures in conglomerate: A case study of Mahu tight conglomerate in Junggar Basin, NW China. Pet. Explor. Dev. 2021, 48, 1383–1392. [Google Scholar] [CrossRef]
  19. Li, L.; Li, G.; Meng, Q.; Wang, Z. Numerical simulation of propagation of hydraulic fractures in glutenite formation. Rock Soil Mech. 2013, 34, 1501–1507. [Google Scholar]
  20. Chang, J.; Yortsos, Y.C. Pressure-transient analysis of fractal reservoirs. SPE Form. Eval. 1990, 5, 31–38. [Google Scholar] [CrossRef]
  21. Yang, L.; Ge, H.; Shi, X.; Cheng, Y.; Zhang, K.; Chen, H.; Shen, Y.; Zhang, J.; Qu, X. The effect of microstructure and rock mineralogy on water imbibition characteristics in tight reservoirs. J. Nat. Gas Sci. Eng. 2016, 34, 1461–1471. [Google Scholar] [CrossRef]
  22. Jia, B.; Xian, C.-G. Permeability measurement of the fracture-matrix system with 3D embedded discrete fracture model. Pet. Sci. 2022, 19, 1757–1765. [Google Scholar] [CrossRef]
  23. DeSwaan, O.A. Analytic solutions for determining naturally fractured reservoir properties by well testing. Soc. Pet. Eng. J. 1976, 16, 117–122. [Google Scholar] [CrossRef] [Green Version]
  24. Shao, S.; Tian, S.; Li, G.; He, Z. Fracture spacing optimization for fracture network fracturing in horizontal well. Pet. Drill. Tech. 2014, 42, 86–90. [Google Scholar]
  25. Pei, Y. Establishment and Application of Seepage Mathematical Model for Fractured Horizontal Wells in Tight Gas Reservoirs. Ph.D. Thesis, China University of Petroleum (Beijing), Beijing, China, 2019. [Google Scholar]
  26. Zhang, C.; Jiang, R.; Qiao, X.; Cui, Y.; Shen, Z.; Zhang, F.; Yuan, J. Transient pressure analysis of the horizontal well in dual-medium tight fractal gas reservoir. J. Northeast. Pet. Univ. 2018, 42, 95–103. [Google Scholar]
  27. Gu, D.; Tian, L.; Dong, J. A new percolating model for the SRV horizontal well based on fractal and anomalous diffusion. Pet. Geol. Oilfield Dev. Daqing 2019, 38, 61–69. [Google Scholar]
  28. Jiang, R.; Zhang, C.; Gao, Y.; Geng, Y.; Hui, Y.; Li, H. Fractal nonlinear seepage model of horizontal wells in fractured-vuggy carbonate reservoirs. Lithologic Reservoirs 2019, 31, 118–126. [Google Scholar]
  29. Chen, Z. Model of spherical flow through porous media in the homogenous reservoirs and Laplace space solution. J. Chengdu Univ. Technol. (Sci. Technol. Ed.) 2011, 38, 641–644. [Google Scholar]
  30. Pedrosa, J.R. Pressure Transient Response in Stress-Sensitive Formations. In Proceedings of the SPE California Regional Meeting (Society of Petroleum Engineers), Oakland, CA, USA, 2 April 1986. [Google Scholar]
  31. Jiang, R.; Liu, X.; Cui, Y.; Zhang, C.; Hao, Y.; Pan, H.; Wang, X. Bottomhole pressure analysis of multistage fractured horizontal well during unsteady crossflow. Pet. Geol. Recovery Effic. 2019, 26, 86–95. [Google Scholar]
  32. Huang, Y.; Li, X.; Tan, X. Research on rate decline analysis for horizontal well in triple-porosity composite reservoir. Nat. Gas Geosci. 2018, 29, 1190–1197. [Google Scholar]
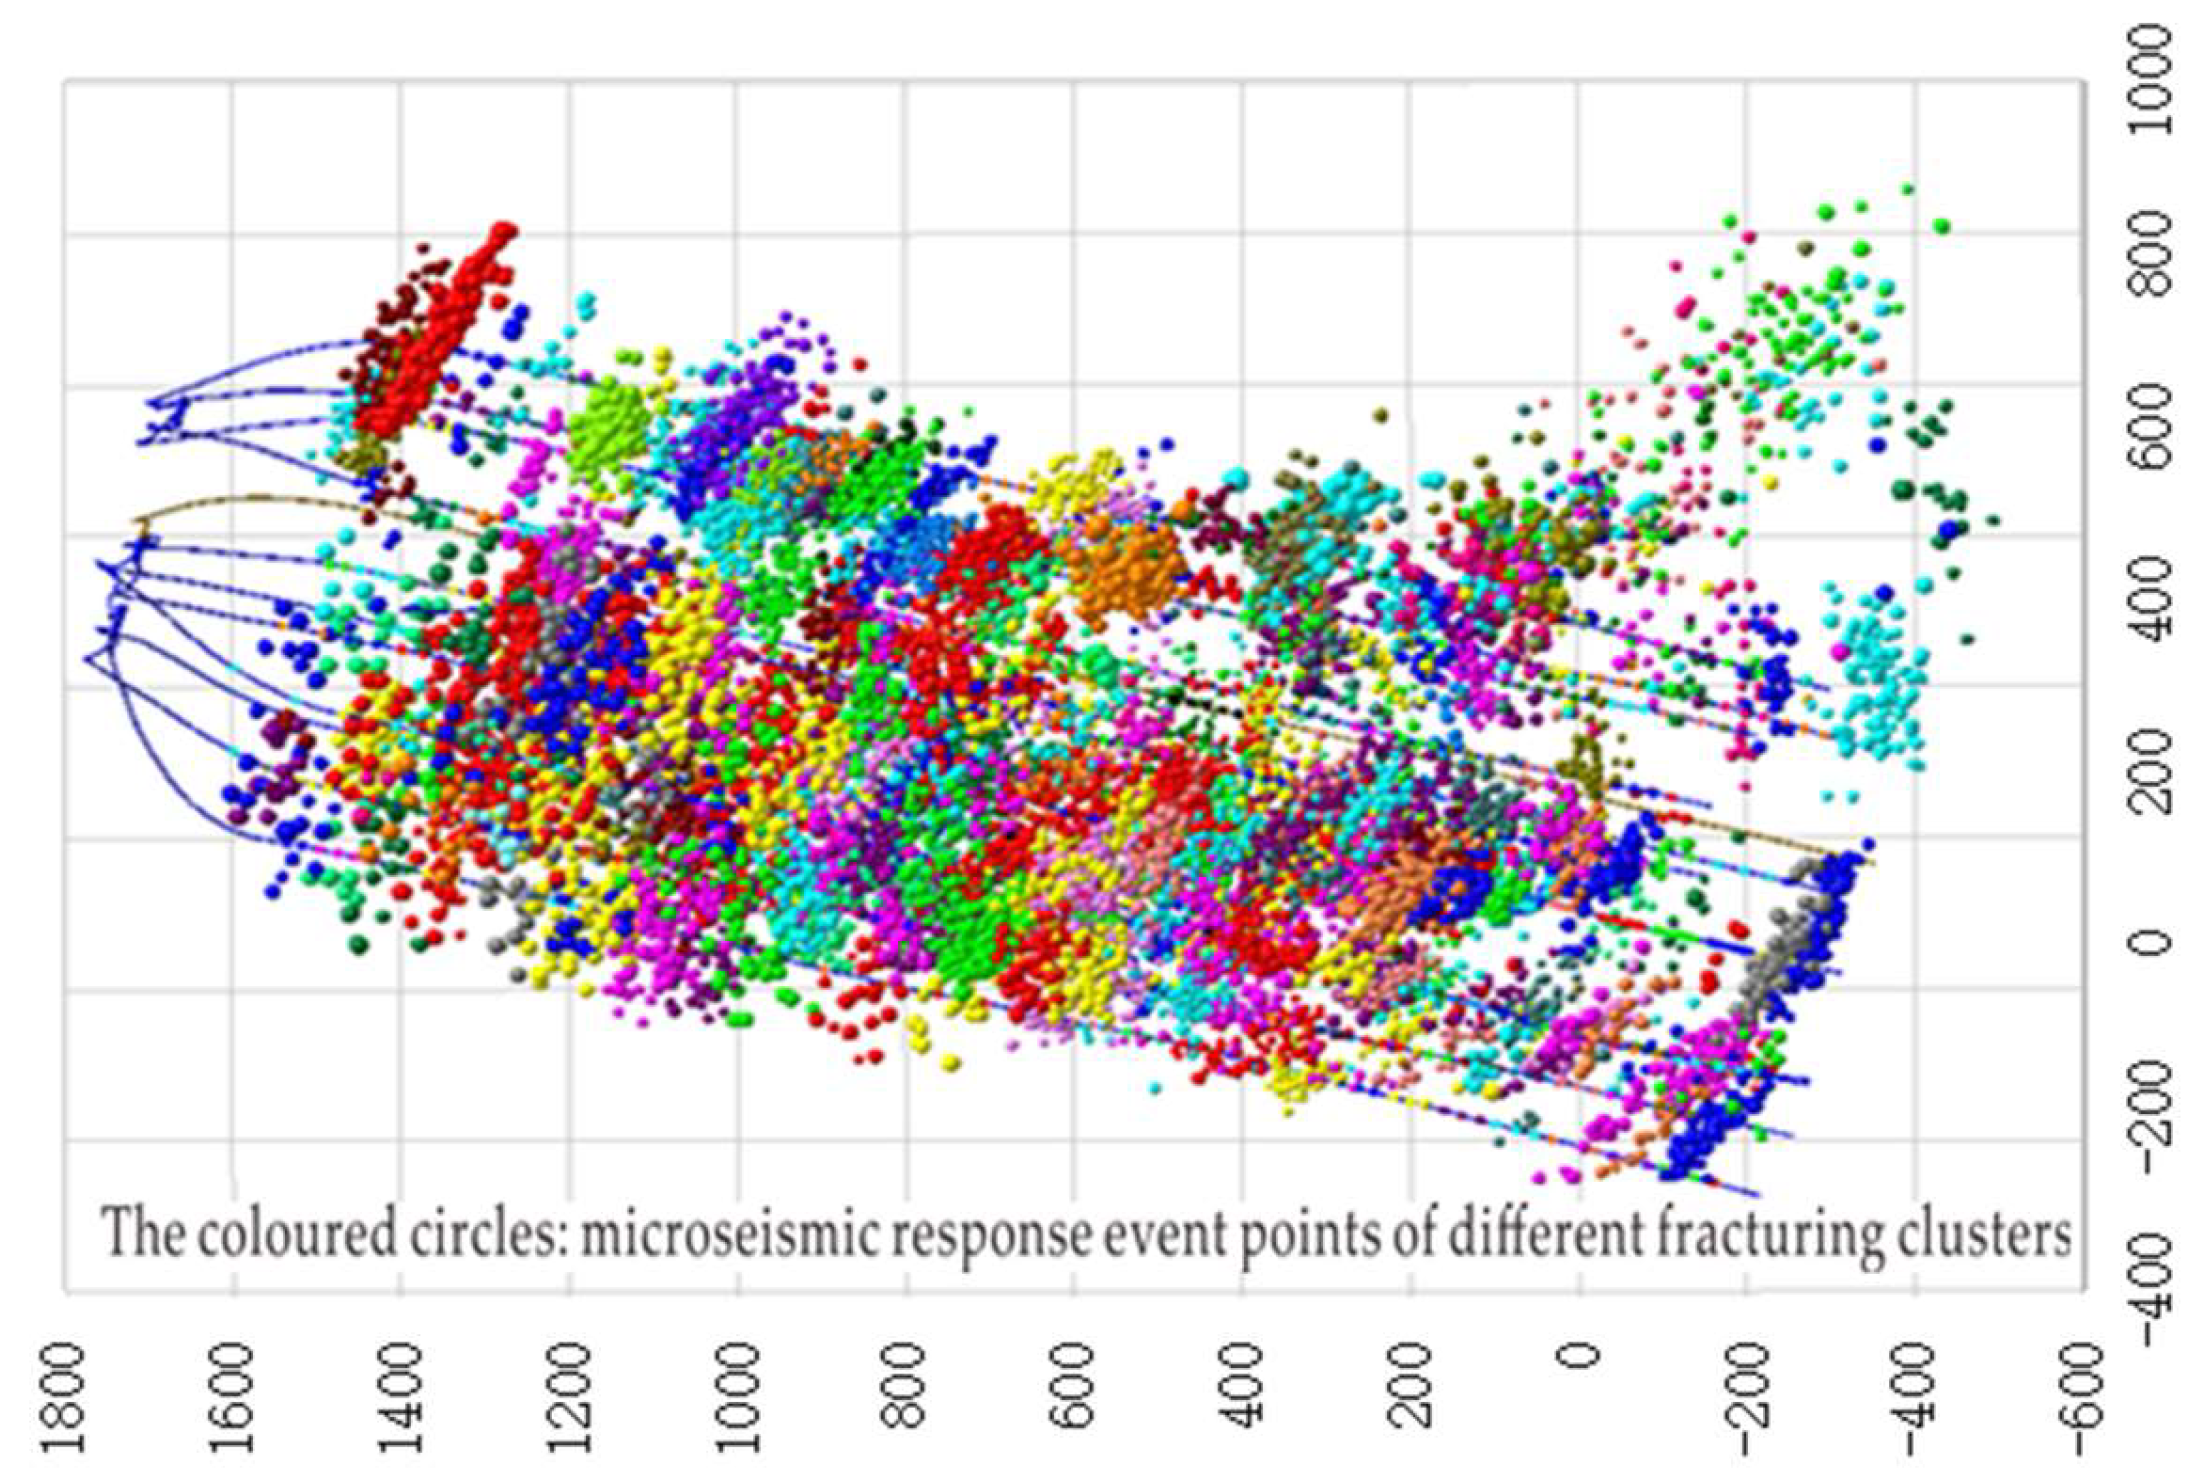
Figure 1. Microseismic interpretation of the M131 demonstration project.
Minerals 12 01433 g001
Figure 2. Core fracture experiment.
Minerals 12 01433 g002
Figure 3. Numerical simulation of conglomerate fracture network.
Minerals 12 01433 g003
Figure 4. (af) Thin sections of core samples from drilled wells.
Minerals 12 01433 g004
Figure 5. Schematic diagram of the complex fracture network in tight conglomerate reservoirs.
Minerals 12 01433 g005
Figure 6. Blasingame curves considering the fractal characteristic of the fracture network.
Minerals 12 01433 g006
Figure 7. The sensitivity analysis of fractal dimension for the branch fracture network.
Minerals 12 01433 g007
Figure 8. The sensitivity analysis of the anomalous diffusion exponent.
Minerals 12 01433 g008
Figure 9. The sensitivity analysis of the threshold pressure gradient in tight reservoirs.
Minerals 12 01433 g009
Figure 10. Application results of Blasingame curves based on the conventional SRV model.
Minerals 12 01433 g010
Figure 11. Application results of Blasingame curves based on the model presented in the paper.
Minerals 12 01433 g011
Table 1. Definitions of dimensionless variables.
Dimensionless ParametersDefinitions
Reservoir pressure p iD = 2 π K Fi h ( p 0 p i ) q F B μ ( i = m , g , f , F )
Production time t D = K Fi t μ x F 2 ( ϕ m C m + ϕ g C g + ϕ f C f )
Distance x D = x x F ,   y D = y x F ,   y eD = y e x F ,   r D = r x F , r RD = R x F
Fracture width w FD = w F x F
Permeability modulus γ FD = q F B μ γ F 2 π K Fi h
Permeability ratios k g , F = K g K Fi , k f , F = K fi K Fi
Pressure transfer coefficients η F = K Fi μ C F ϕ F , η f = K fi μ ( ϕ m C m + ϕ g C g + ϕ f C f )
Ratio of the pressure transfer coefficients η f , F = η f η F
Cross flow coefficient λ m = α m K m x F 2 K Fi
Elastic storativity ratios ω m = ϕ m C m ϕ m C m + ϕ g C g + ϕ f C f , ω g = ϕ g C g ϕ m C m + ϕ g C g + ϕ f C f
Less conductivity of main fractures C FD = K Fi w F K fi x F
Table 2. Interpretation results.
MethodFracture Half Length
(m)
Fracture
Conductivity (mD·m)
Skin FactorThreshold Pressure Gradient (MPa/cm)Fractal
Dimension
Anomalous Diffusion
Exponent
Well-Controlled Area
(km2)
Well-Controlled
Reserve (10,000 tons)
Software521520.003---0188.80
This research482560.010.211.730.300.178.11
Publisher’s Note: MDPI stays neutral with regard to jurisdictional claims in published maps and institutional affiliations.