Article

Microscopic Characteristics and Formation Mechanism of Effective Reservoirs in the Xihu Depression, China: The Important Role of the Poikilotopic Calcite Cements in Tide-Dominated Delta Systems

1
College of Earth Sciences, Jilin University, Changchun 130061, China
2
Hainan Branch, CNOOC China Limited, Haikou 570000, China
3
CNOOC Research Institute, Beijing 100028, China
*
Author to whom correspondence should be addressed.
Minerals 2022, 12(11), 1413; https://doi.org/10.3390/min12111413
Submission received: 12 September 2022 / Revised: 4 November 2022 / Accepted: 5 November 2022 / Published: 7 November 2022
(This article belongs to the Special Issue Genesis and Metallogeny of Non-ferrous and Precious Metal Deposits)

Abstract

:
The Xihu depression is an offshore sag located on the East China Sea Shelf Basin, which is currently one of the major oil and gas basins along the coast of China. In this study, an integrated approach using thin sections, scanning electron microscopy (SEM), X-ray diffraction (XRD), cathodoluminescence (CL), high-resolution 3D CT core scanning and stable isotope analysis was applied to examine the diagenetic evolution and investigate the microscopic characteristics and formation mechanisms associated with effective reservoirs. Four types were distinguished: upper conventional reservoirs (UC reservoirs), lower conventional reservoirs (LC reservoirs), “bottom calcium” low-permeability reservoirs (“bottom calcium” reservoirs) and “MI clay” low-permeability reservoirs (“MI clay” reservoirs). Poikilotopic calcite cements play an important role in the diagenetic alterations and reservoir quality evolution, precipitating during early eogenesis, provided a framework that retards the adverse impacts of UC reservoirs by compaction. Conversely, in LC reservoirs, with limited poikilotopic calcite, secondary porosity is mostly due to the dissolution of feldspar or unstable rock fragments. UC reservoirs normally develop in the middle of tidal channels and in subaqueous distributary channels, with the base of the sand-body being extensively cemented by carbonate cements, such as late calcite, Fe-calcite and dolomite, which formed the “bottom calcium” reservoir. Combined evidence from petrographic and geochemical analyses suggests that calcite precipitates from diagenetic fluids of mixed marine and meteoric waters, with additional external sources from calcareous siltstones and bioclasts. The carbon sources of calcite mostly originate from the dissolution of carbonates clacts or bioclasts within sandstone beds or adjacent silty mudstones, while dolomite cements have an isotopic composition that is more comparable to the generation of biogenic methane. This study demonstrates how poikilotopic calcite, developed in tide-dominated delta systems, affects the vertical heterogeneity. The results can be used to improve the reservoir evolution model of tide-dominated delta systems and provide a basic understanding for researchers conducting reservoir studies of similar sedimentary systems. Our results can act as a geological basis for further oil and gas exploration.

1. Introduction

The heterogeneity of sandstone reservoirs, which significantly affects hydrocarbon accumulation and producibility, is controlled by the geometry and internal structures of sand bodies, provenance, grain size, sorting and by the modes and distribution of diagenetic processes [1,2,3,4,5,6,7,8].
Calcite cementation, as a significant factor that controls the sandstone reservoir quality through reductions in porosity and permeability, has been the focus of reservoir studies [9,10,11,12,13,14,15]. The negative correlation between the calcite cement content and porosity suggests that pervasive calcite cementation is the dominant diagenetic factor affecting porosity reduction. For example, in the Flemish Pass Basin sandstone reservoir, over 75% original porosity loss was shown to be primarily due to calcite cementation [16]. However, the calcite precipitated during eogenesis could provide a framework that may reduce adverse impacts due to compaction overburden and retain porosity until the degradation of organic matter at greater depths [15,16,17]. Finally, the dissolution of calcite will become a key process that can be used to improve the reservoir quality through deep burial.
Recent studies have documented early-formed calcite cement and examined its origin and diagenetic environment by petrographic, microthermometric, fluid-inclusion gas ratios and geochemical (stable isotopes, major and rare earth elements) analyses. Such research has been conducted in offshore Norway [9], the Hibernia oil field [18], the Jeanne d’Basin [17], the Carnarvon Basin [19], the states of Wyoming and Utah, USA [20], the southeast Benue Trough [21], the St. George Group of Western Newfoundland [22], the Betic Cordillera [23], the Powder River Basin [14] and the Flemish Pass Basin [16].
The Xihu depression is one of the important petroleum locations in the coastal area of China. It is located in the eastern depression of the East China Sea Shelf Basin. It provides a powerful tool to predict the distribution of diagenetic alterations controlling quality and heterogeneity. Previous authors have conducted significant research and analyses on the physical reservoir properties and main factors controlling the Huagang Formation in the central inversion structural belt [24,25,26,27,28,29,30,31,32]. The most recent drilling results conducted in Xihu Sag indicate that coal, carbonaceous mudstone and mudstone in Pinghu Formation are essential source rocks [33,34], and the sand-body of the Pinghu Formation is theoretically rich in coalbed methane and shale gas. The current investigation mostly focuses on hydrocarbon generation [35,36], paleo-pressure evolution [37], geochemical characteristics and the sedimentary control of coal-bearing source rocks from the Pinghu Formation [38].
It has been confirmed by drilling results that the reservoirs in the Pinghu Formation are also strongly heterogeneous and are characterized by a complex fractal geometry and a range of pore sizes. Calcite has been reported to be the most prevalent cement [24], but no major petrographic and diagenetic studies have yet investigated the reservoir sandstones. Therefore, research on the reservoir characteristics, spatial differences and the intrinsic relationships between the reservoir quality and diagenesis evolution will provide an efficient approach for better understanding and predicting porosity distribution, which may therefore assist in future hydrocarbon exploration and production. The main objectives of the study were: (1) to reconstruct the paragenetic sequence and identify the effective reservoir characteristics of sandstone, and (2) to elucidate the formation mechanism of effective reservoirs, especially the influence of carbonate cements on porosity development and distribution.

2. Geological Setting

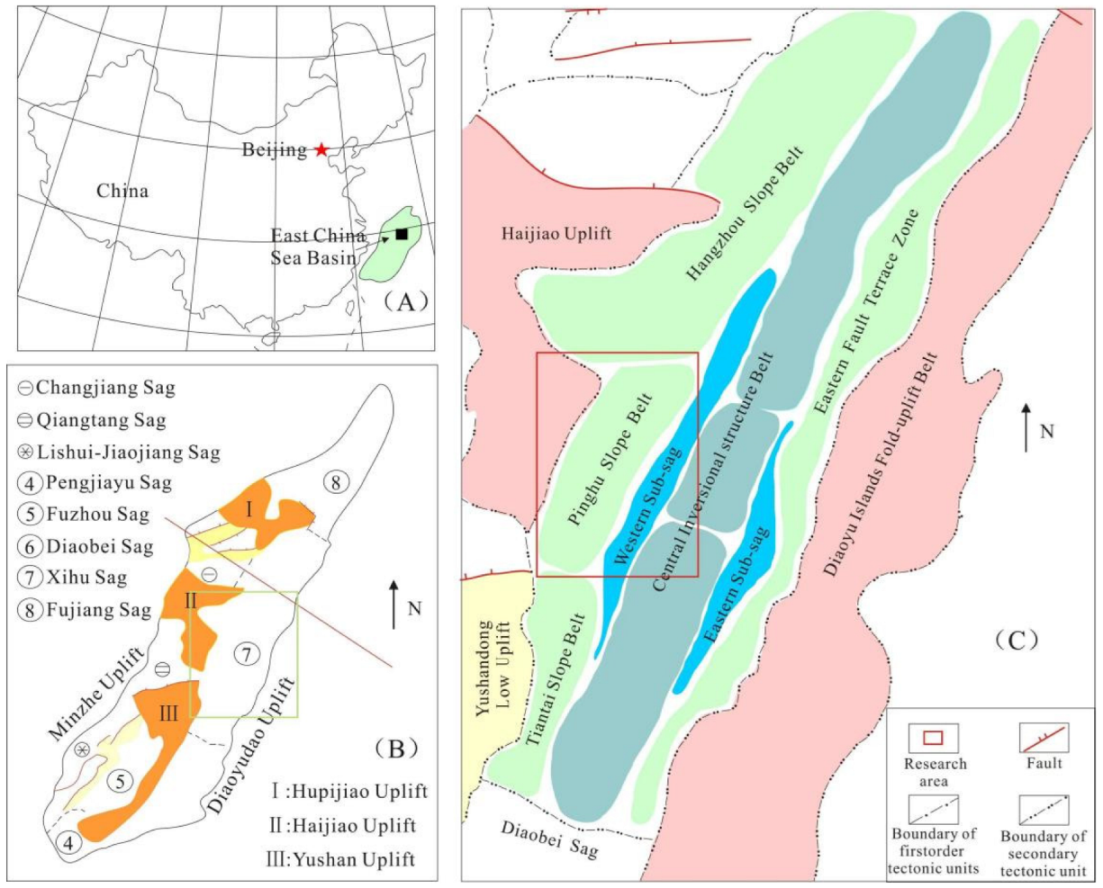
The East China Sea Shelf Basin (ECSSB) is located in the offshore eastern area (Figure 1) with a general NNE trend [39]. The basin was mainly formed from the Late Cretaceous to Pliocene and has an area of 26.7 × 10⁴ km2. Seven main secondary tectonic units developed, including the Yangte depression, Taipei depression and East Zhejiang depression, and several secondary depressions or uplifts developed in each depression [40,41,42,43]. The Xihu depression is adjacent to the Hupijiao Uplifts in the north, Diaoyubei Depression to the south, Haijiao and Yushandong Uplift to west, and the Diaoyudao Uplift to the east (Figure 1). The Xihu depression has undergone several stages of tectonic movement and can be divided into five zones. From west to east, there is the Western slope belt (WSB), Western subsag (WSS), Central anticline belt (CAB), Eastern subsag (ESS), and eastern fault zone (EF). The western slope can be further divided into Hangzhou, Pinghu and the Tiantai slope belt from north to south. The WSB and WS are important gas-producing regions in the central and western parts of the Xihu depression.
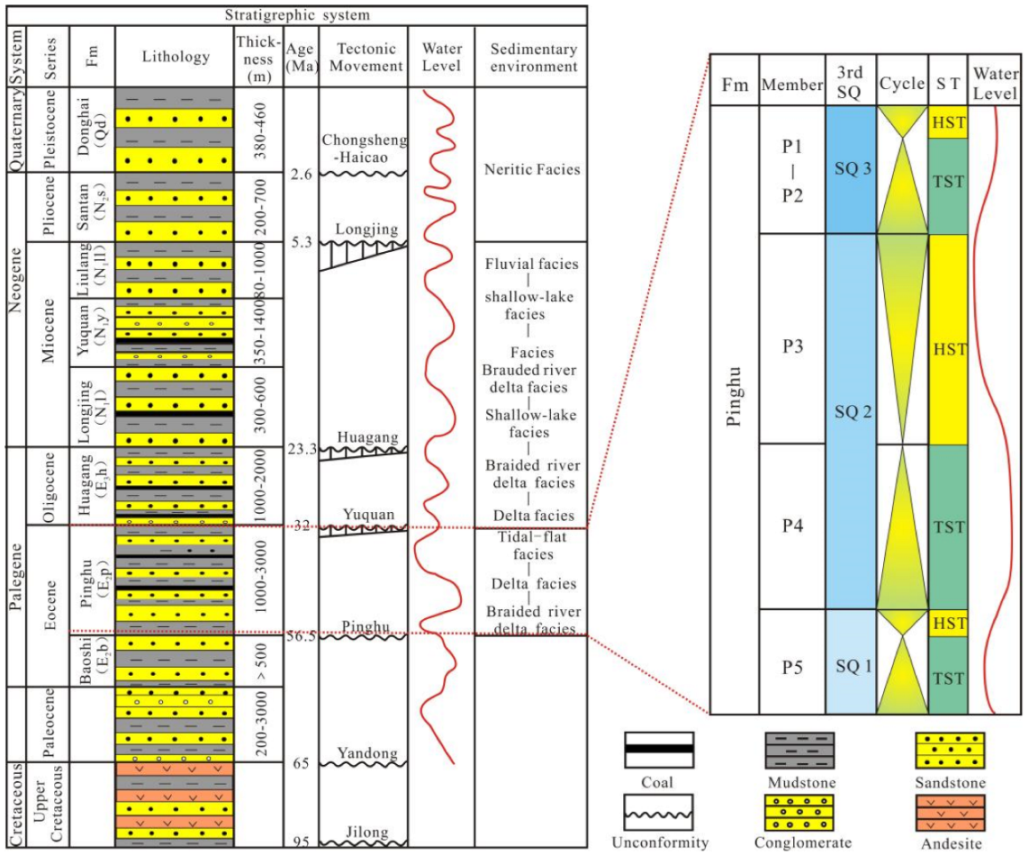
The structural evolution of the Pinghu slope belt has experienced a Late Cretaceous-Eocene rifting stage and an Oligocene-present post-rifting stage. Compressional tectonic events, including Yuquan, Huagang and Longjing movements, occurred in the depression stage. The Paleocene, Baoshi and Pinghu formations were deposited in the rifting stage. During the Oligocene-Middle Miocene, extension across bounding faults slowed significantly. The Huagang group, Longjing group, Yuquan group, and Liulang group were deposited in this stage. After the very intense Longjing movement, which was the most widespread movement, Xihu Sag entered a regional subsidence stage, and the Santan group and the Donghai group were deposited [24,43,44]. From the Paleocene to Quaternary, sedimentary succession in the Xihu depression typically comprised clastic rocks reaching a maximum thickness of nearly 15,000 m [45,46] (Figure 2).
Figure 1. Structural characteristics and geographical location of the study area. (A) Geographical location of the East China Sea Basin (modified from [47]). (B) Geographical location of the Xihu depression (modified from [48]). (C) Tectonic division of the Xihu Depression.
Minerals 12 01413 g001
The Eocene Pinghu Formation is a set of marine-continental transitional facies consisting of delta and tidal flats, which are characterized by sandstone, mudstone and coal interbed [49,50,51], The Pinghu Formation can be divided into three 3rd-order depositional sequences (SQ1–SQ3) (Figure 2). During SQ1, the sedimentary environment was a delta that was influenced by NE-SW-trending fault. During SQ2, it was a tidal flat and was greatly affected by tides. During SQ3, it was delta and tidal flat that were influenced by tides under wide backgrounds and gentle slopes [50].

3. Samples and Methods

This study focused on the Eocene Pinghu Formation (from P5 to P1) sandstones in the Xihu depression. Rock composition and section samples, reservoir porosity and permeability data from a total of 640 samples from the drill cores of 15 wells in the Pinghu slope belt were collected from the Shanghai Branch of CNOOC Ltd. Due to the constraints of the collected data, 24 core samples were selected from 9 wells and prepared for thin sections with depths ranging from 3445 to 4615 m.
Statistical analyses were carried out on sandstone framework compositions and the main cement components. The sandstone framework was quantified by counting 300–400 points per thin section, and the main composition of cement was marked by 10 views of straight lines with crosswire under a polarizing microscope as the reference. These uncovered thin sections were also stained with Alizazin Red-S and potassium ferricyanide solutions to recognize the carbonate cement types [52]. Ten selected samples were studied under cathodoluminescence (CL) with a Cambridge Image Technology instrument CL8200 and MK4 model. Cast thin sections were prepared on another 24 sections and filled with blue epoxy in order to identify the pores. Ten core samples were analyzed by scanning electron microscopy (SEM) in which they were observed under a scanning electron microscope at an acceleration voltage of 20 keV.
The whole rock mineral compositions of the samples were analyzed by X-ray diffraction at the Key Laboratory of Mineral Resources Evaluation in Northeast Asia Ministry of Natural Resources using DX-2700X ray diffraction, and the analysis was based on JY/009–1996 transtarget polycrystalline X-ray diffraction.
Analyses on carbon and oxygen stable isotope compositions were performed on 13 selected core samples using the MAT253 isotopic ratio mass spectrometer in the Institute of Geology and Geophysics, Chinese Academy of Sciences. The samples were selected on the basis that the carbonate minerals constituted in these 13 samples dominated in mesodiagenesis according to the petrographic observation. Whole powder samples were reacted with 100% orthophosphoric acid at 25 °C for 6 h and 48 h to extract CO2 [53]. The different reaction rates of the different carbonate minerals are responsible for the reaction time selection. Thus, CO2 from the 6 h reaction was prepared for the C and O isotopic analysis for calcite, and CO2 from the 48 h reaction was used for dolomite, respectively. The final isotope data are presented per mil with respect to the PDB standards for carbon (C) and oxygen (O).
High-resolution 3D CT core scanning was performed on three selected samples with significant different microscopic characteristics, to carry out three-dimensional (3D) visualization and to finely quantify the characterization of rock microstructures and pore connectivity. The scanning was conducted at the Institute of Geology, Chinese Academy of Geological Sciences with a NiKon XTG225ST Industrial CT.

4. Results

4.1. Sandstone Petrology

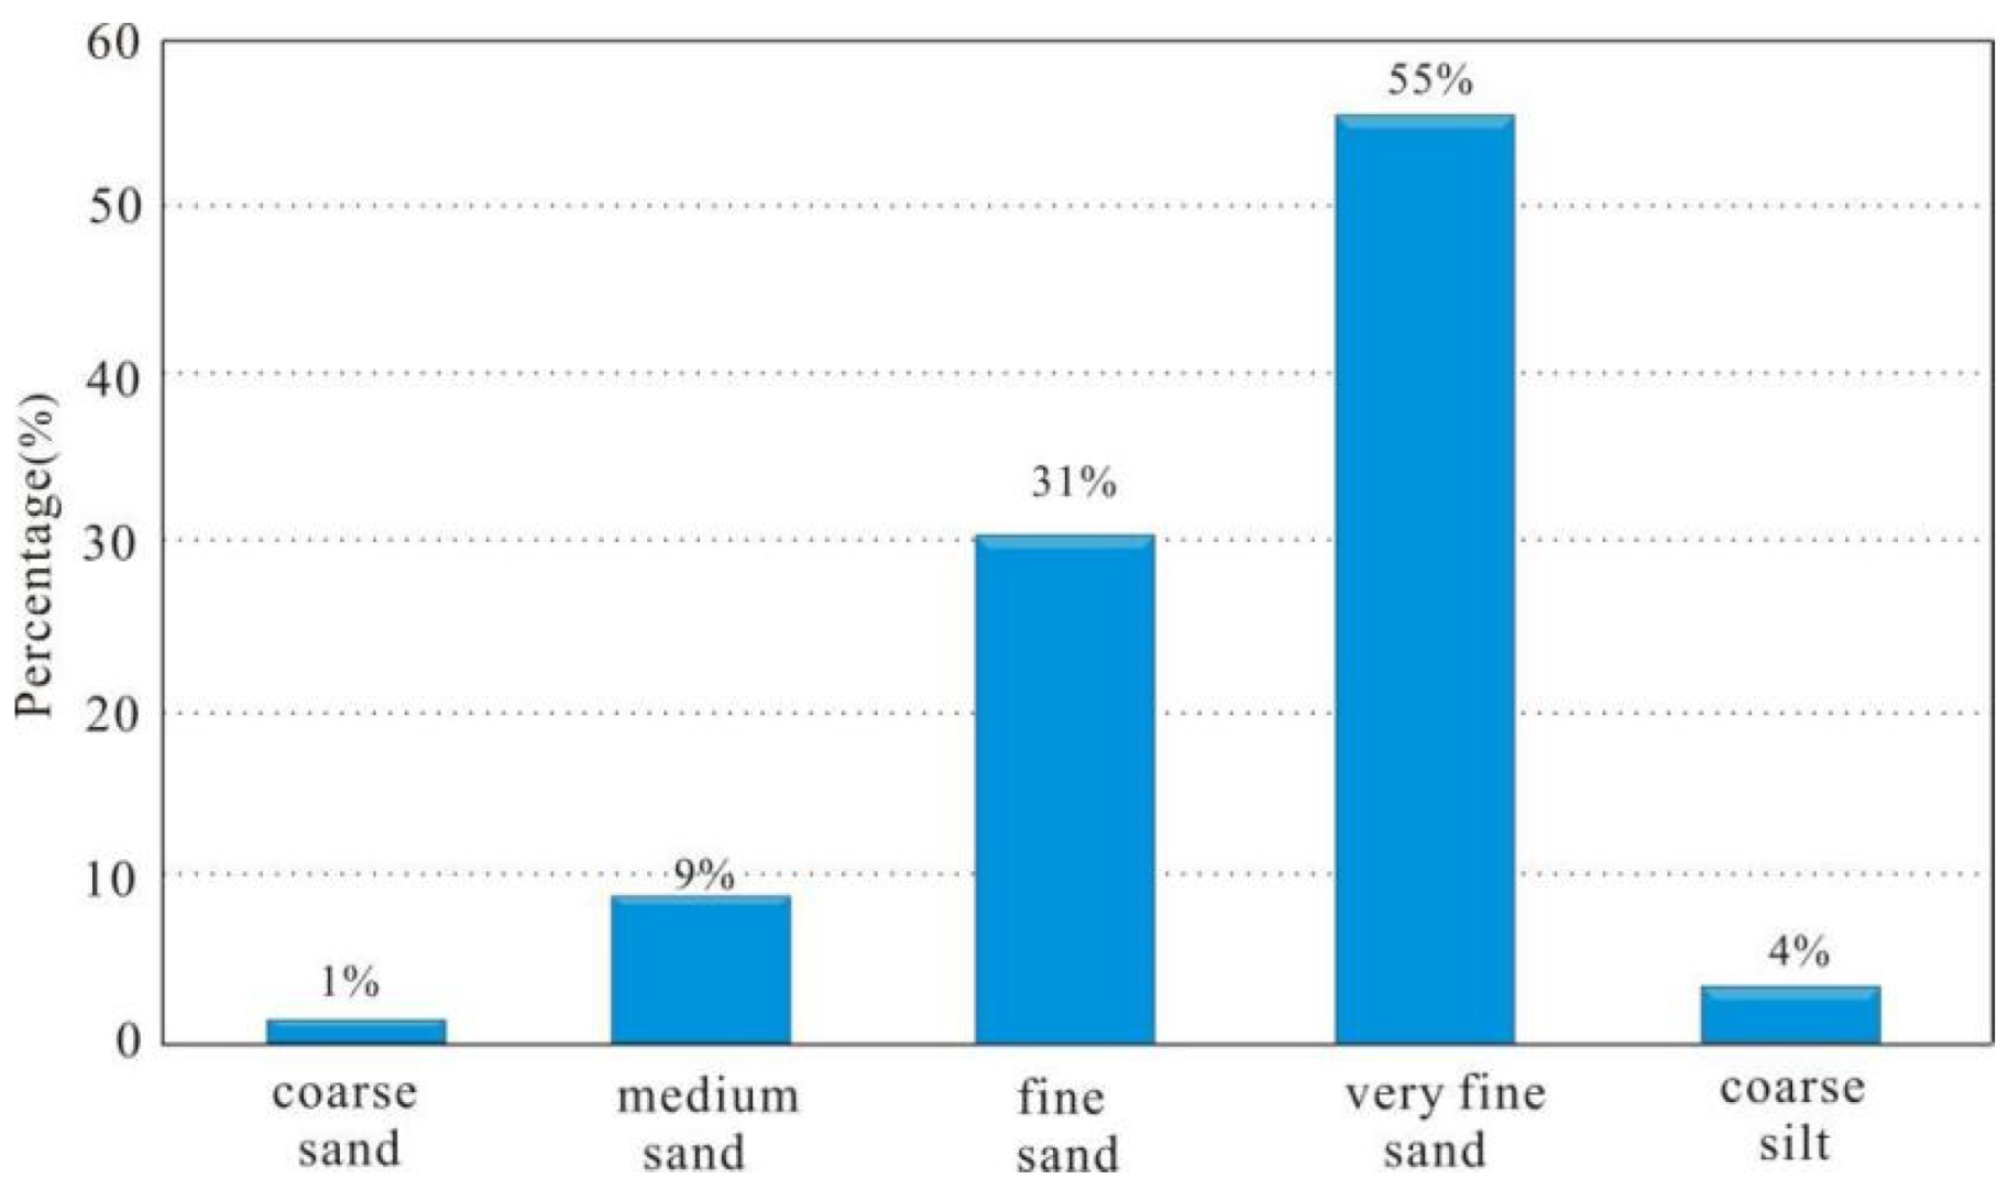
The sandstone is mainly fine to very fine-grained feldspathic litharenite and lithic arkose (Figure 3 and Figure 4) and some medium to coarse-grained sandstones are also found in P4 and P5. The most common detrital grains are quartz (30%~96% of the rock volume, average 68.95%), feldspar (2%~34%, average 12.55%) and rock fragments (2%~36% average 18.5%) (Table 1). The feldspar population is dominated by K-feldspar but also includes plagioclase. The rock fragments are mainly composed of granite, metamorphic and pyroclastic rock. The sorting degree of sandstone is medium to good, and the roundness is medium to poor, appearing as mainly subangular to subspherical grains.
① values performed from Jilin university; ② values performed from Key of Laboratory Mineral Resources Evaluation in Northeast Asia of the Ministry of Natural Resources.
Blue symbols represent results collected from the Shanghai Branch of CNOOC Ltd. (from 13 wells) and red symbols are visual estimates from thin section using a conventional optical microscope (from 7 wells).
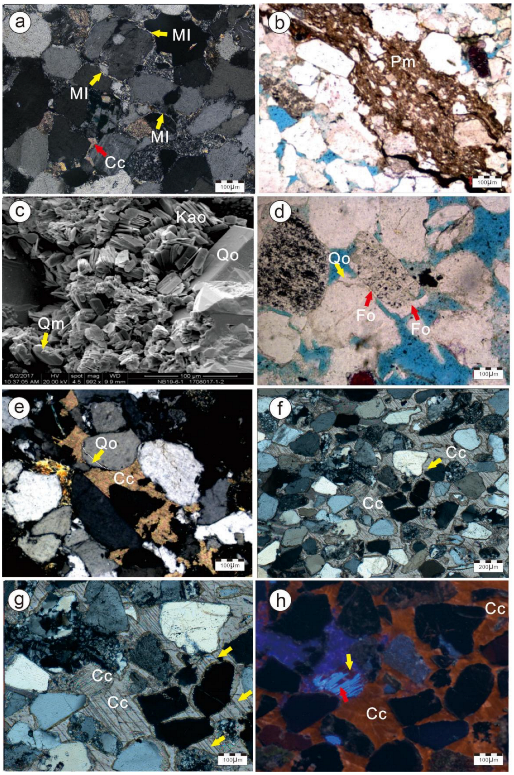
There are also grains that are typical of pseudomatrix and infiltrated clay minerals. Pseudomatrix consists of originally plastic particles (such as mudstone fragments) that have been plastically deformed or even broken under compaction, leading to a change in their original shape and the filling of pores between rigid particles, making them appear as interstitial clay materials (Figure 5a). Pseudomatrix mainly develops at the bottom of tidal flat deposits with a maximum content of 15%. Mechanically infiltrated clay (MI clay) was found to be mainly attached to the surface of clastic particles (Figure 5b). Sandstone with MI clay was mainly found in low-energy zones or in the transition zones from high energy to low energy, such as the subaqueous distributary bays and the top of subaqueous distributary channels in delta-front sediments.

4.2. Authigenic Minerals

Authigenic minerals include quartz, feldspar, kaolinite, illite-smectite, calcite, Fe-calcite and dolomite, which were observed under the optical microscope and with cathodoluminescence and SEM.
Quartz cements occur as overgrowth and microcrystalline pore-filling cements. The content of quartz overgrowth in the area was 0%–3%, with an average value of 0.84%. Microcrystalline quartz is associated with quartz overgrowth and kaolinite, and its formation time may be similar to that of quartz overgrowth (Figure 5c).
Feldspar overgrowth was found to represent <1% of the rock volume on average, appearing as a thin fringe on the edge of feldspar grains. Feldspar overgrowth enlargement occupies the growth positions of grains and restricts the development of quartz overgrowth (Figure 5d).
Kaolinite cements appear as book-like aggregates (Figure 5c) that mostly develop in places where feldspar has extensively dissolved. Quartz overgrowths, microcrystalline quartz and kaolinite are genetically related to dissolution of feldspar and are inferred to be para-simultaneous.
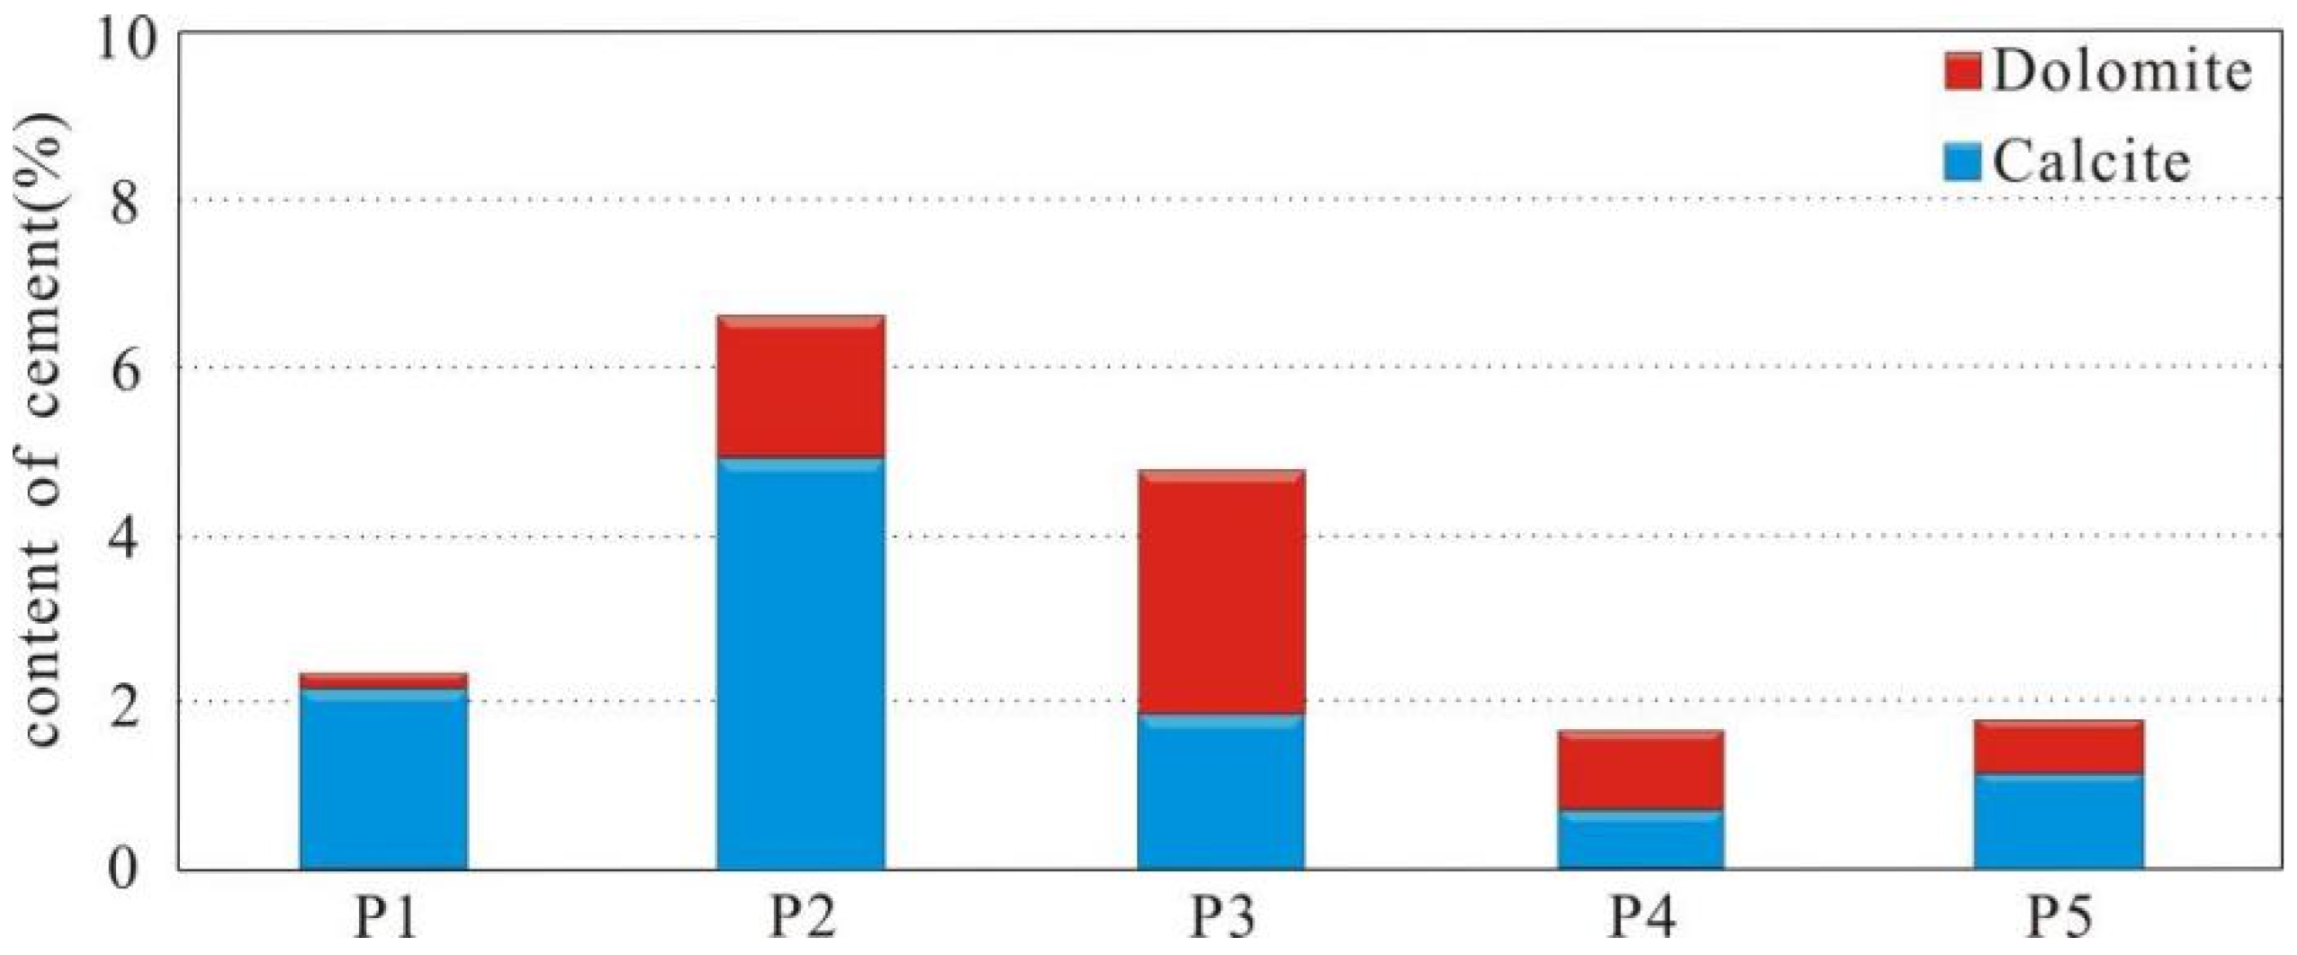
Carbonate minerals mainly include calcite, Fe-calcite and dolomite. The content of carbonate cements varies from top to bottom: that is, the upper part (P1–P3) is higher than the lower part (P4–P5) (Figure 6). The calcite cement content was found to range from 1% to 30% with an average of 5.6%. It appears pink after staining with alizarin red-S (Figure 5g), which distinguishes it from other carbonate cements. Calcite appears as pore-filling cements or replaces feldspar (Figure 5h). Two generations of calcite cements were distinguished: pokilitopic calcite, which completely fills intergranular pore areas and drastically reduces the porosity (Figure 5f,g); and the second calcite (Calcite II) which precipitates in the limited intergranular pores (Figure 5e). In addition, the poikilotopic calcite is normally well developed in P2 and P3 Formations.
Under the CL system, calcite cements can be classified into two generations. Calcite I is dull to non-luminescent, appearing around the edges of debris (Figure 7e), while Calcite II is bright red, filling the residual pores left by calcite I (Figure 7e).
Dolomite and Fe-calcite are late carbonate cements and were found to have average contents of 3% and 5%, respectively. They are mostly distributed between clastic particles with point and long contacts (Figure 7b,c). Fe-calcite usually grows at the edge of calcite (Figure 7a), suggesting that Fe-calcite grows after calcite cement. Dolomite fills the spaces between particles, developing euhedral crystal faces (Figure 7c,d). In the study area, no mineral was shown to have formed after the Fe-calcite and dolomite cements.

4.3. Dissolution

Two secondary pore development zones developed longitudinally: the upper dissolution zone (3200–3500 m) and the lower dissolution zone (4000–4400 m). This large-scale dissolution has also affected the framework grains and accessory minerals and therefore, altered the original composition of the sandstones.

4.4. Paragenesis

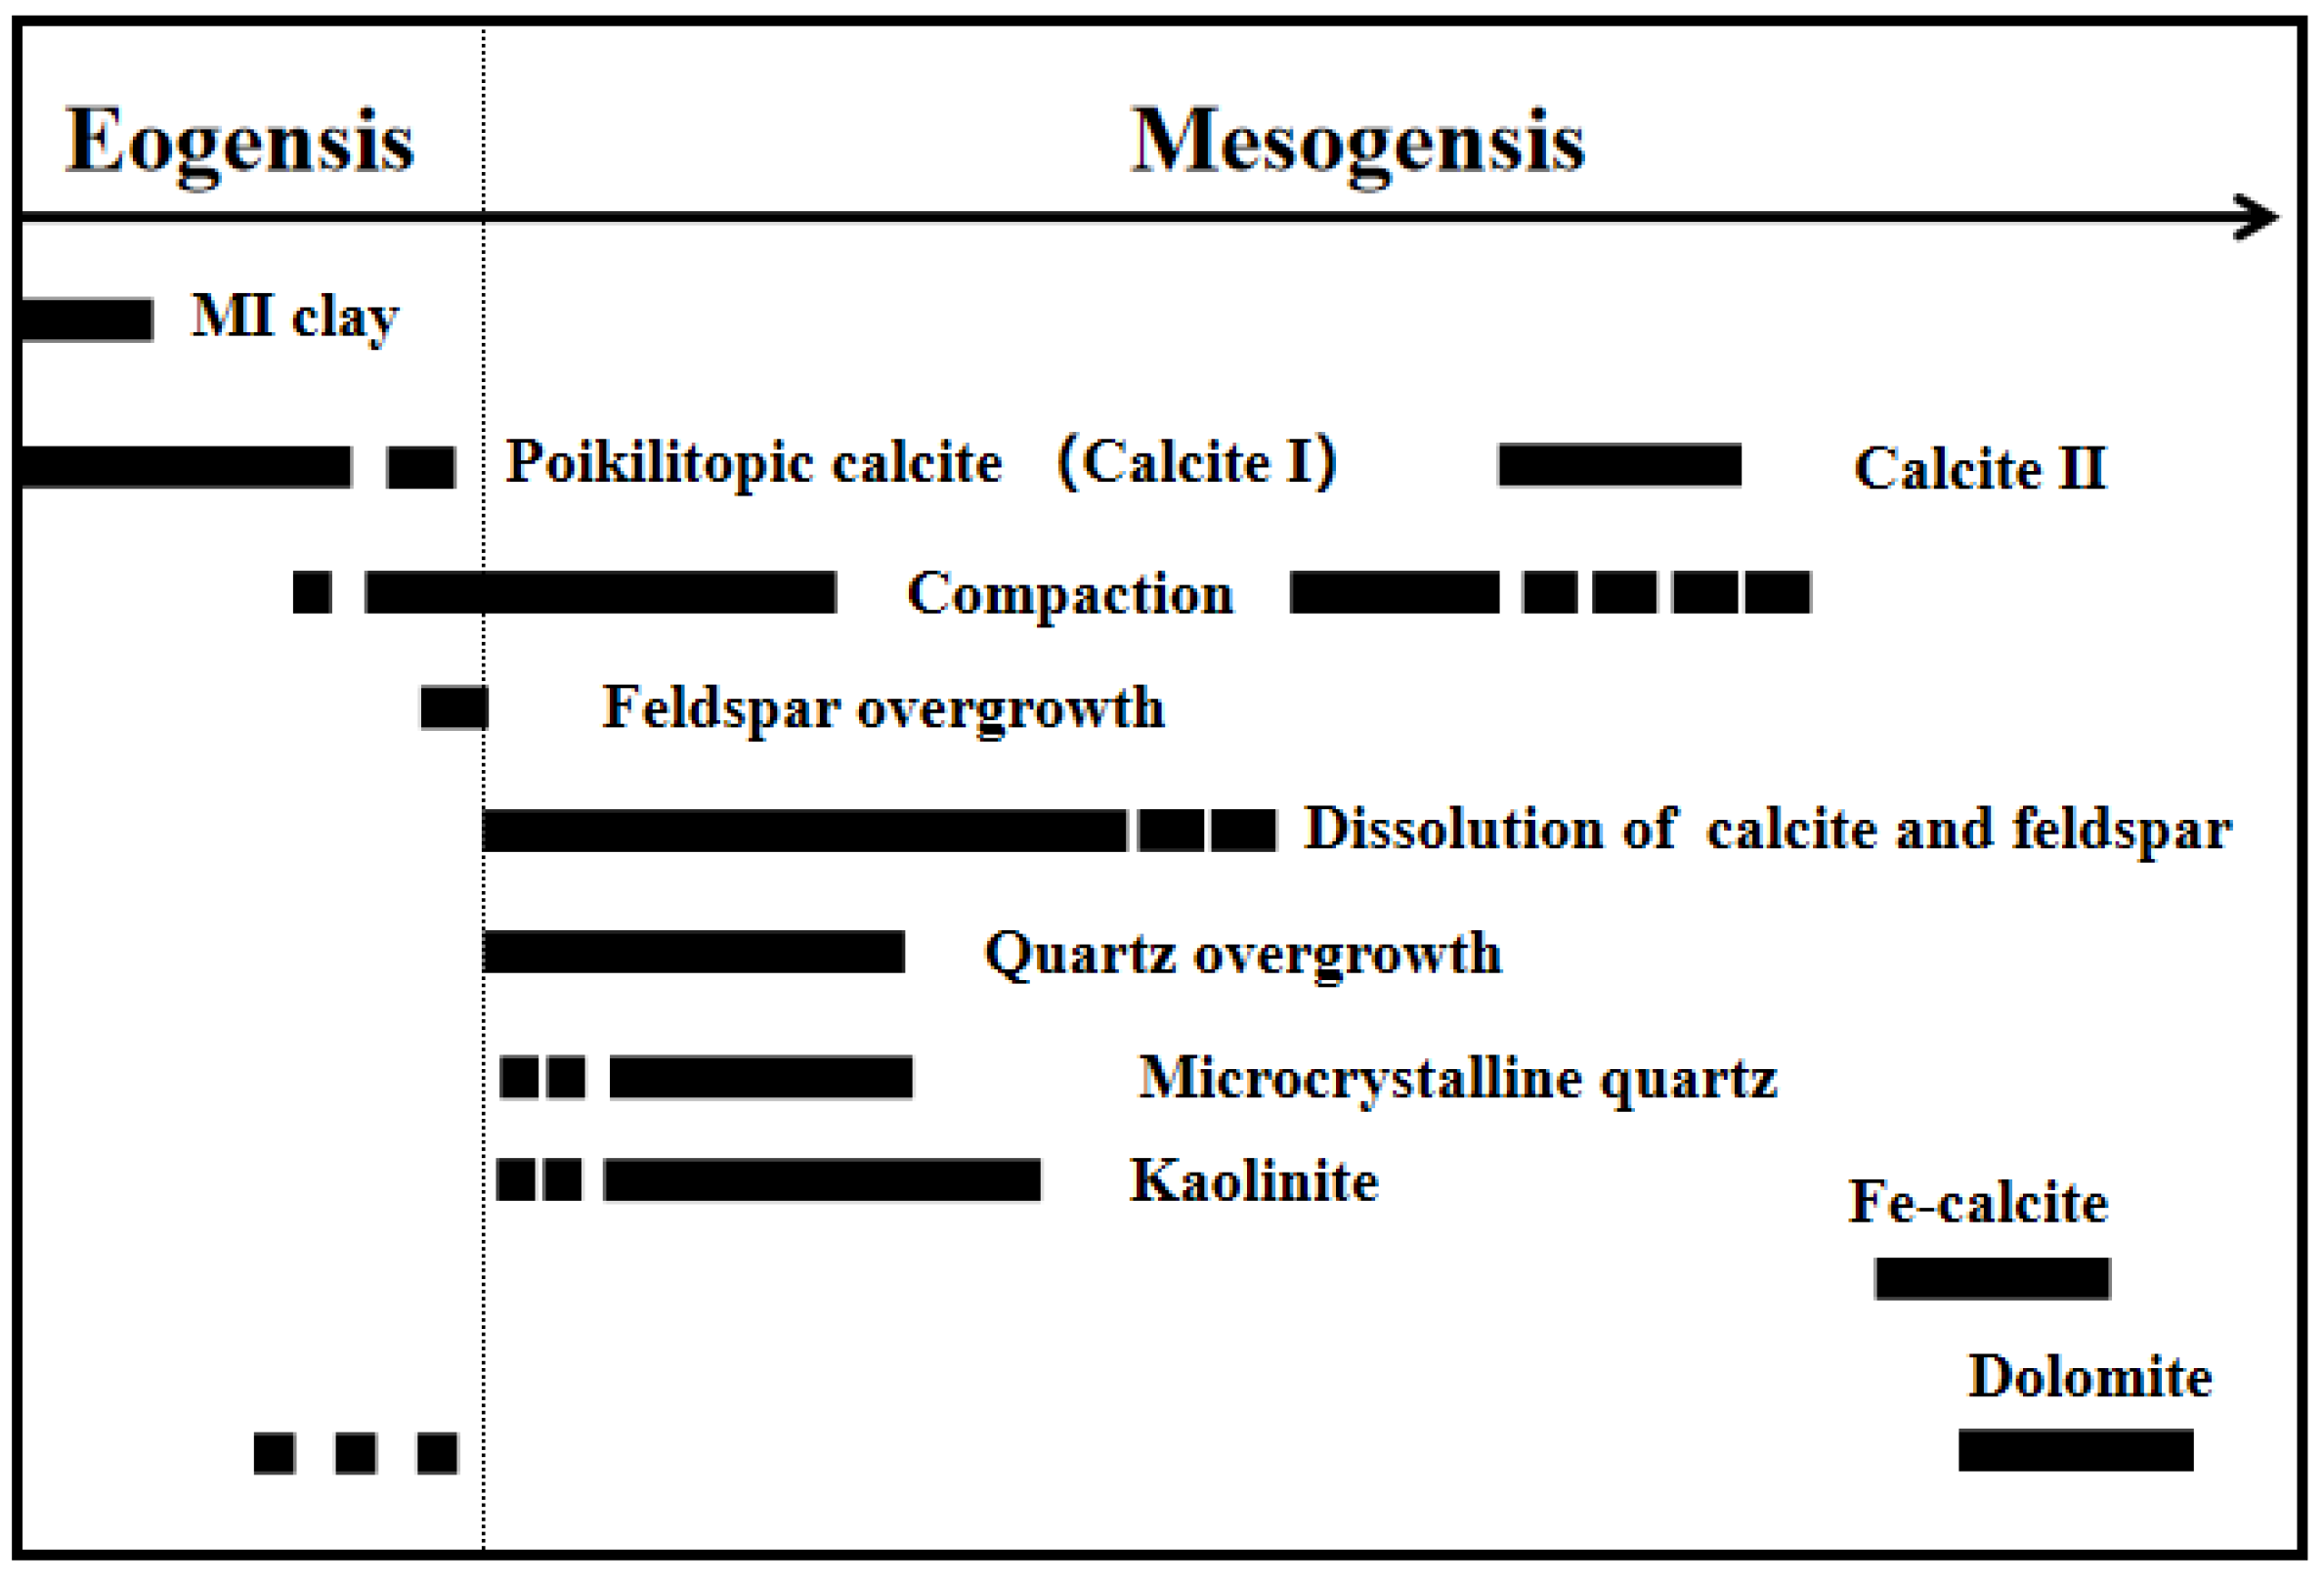
Figure 8 summarizes the paragenetic sequence of the sandstones based on petrographic relationships established from the petrographic examination as follows: (1) pervasive precipitation of early poikilotopic calcite cements in high-energy zones; (2) precipitation of feldspar overgrowth; (3) major feldspar dissolution followed by quartz cement and kaolinite precipitation; and (4) precipitation of Calcite II, Fe-calcite, and dolomite.

4.5. Effective Reservoir Characteristics

Effective reservoirs include conventional reservoirs (k > 10 md) and low-permeability reservoirs (k = 0.2–10 md) [54]. The microscopic characteristics and 3D CT scanning of conventional reservoirs and low-permeability reservoirs were comprehensively analyzed to provide evidence for further definition of the formation mechanisms of effective reservoirs.

4.5.1. Microscopic Characteristics

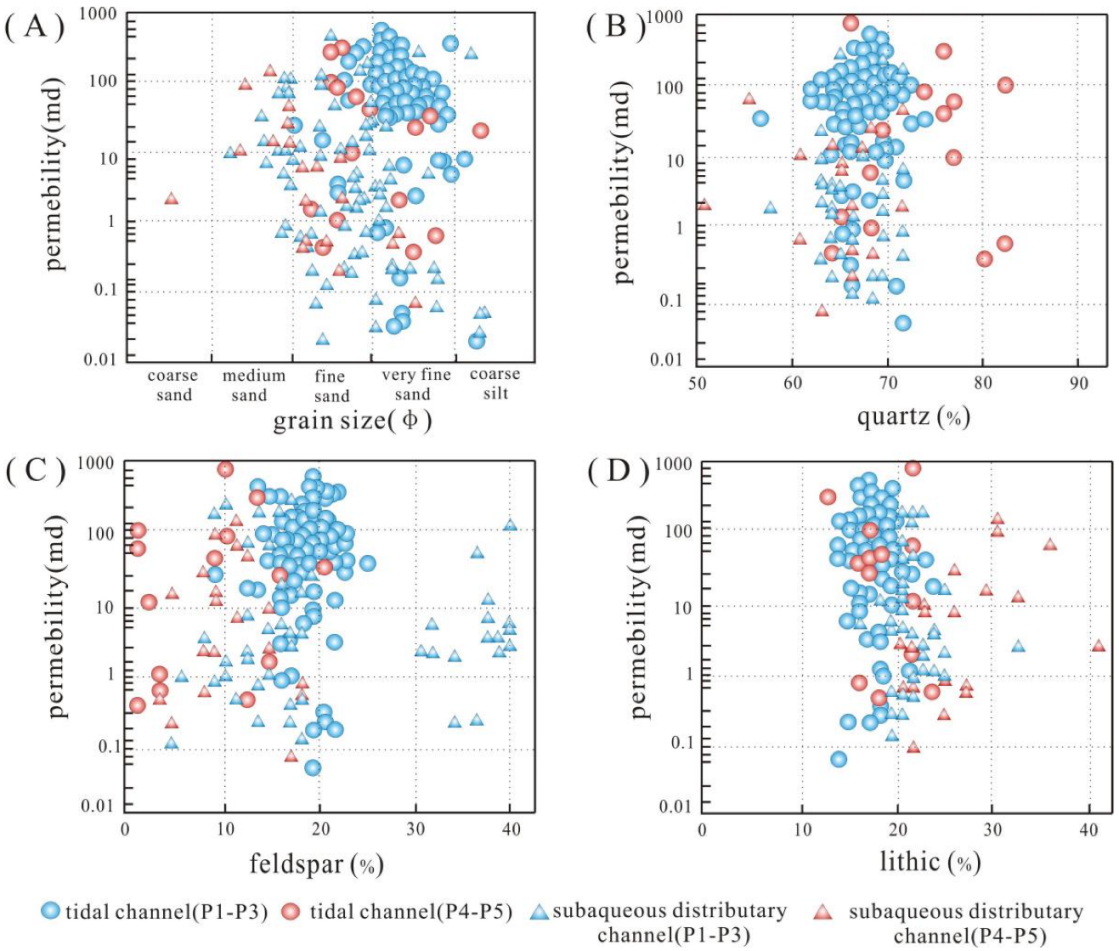
Conventional reservoirs with relatively high porosity and permeability mainly develop in tidal channels and subaqueous distributary channels and can be divided into two types, upper conventional reservoirs (UC reservoirs) and lower conventional reservoirs (LC reservoirs), based on their different microscopic characteristics. UC reservoirs with fine-grained sandstones mainly developed in P1 to P3, while LC reservoirs with mainly medium and coarse grains developed in P4 to P5. Compared with the UC reservoirs, LC reservoirs have significantly higher contents of lithic grains and lower contents of feldspar (Figure 9).
The detrital grains in UC reservoirs are mainly fine-grained, presenting point to long grain contacts (Figure 7g), while detrital grains in LC reservoirs are mainly medium and coarse, showing long to concave–convex grain contacts (Figure 7h). Extensive dissolution occurs in both types of reservoirs.
Low-permeability reservoirs can also be divided into two types: “bottom calcium” low-permeability reservoirs (“bottom calcium” reservoirs) and “MI clay” low-permeability reservoirs (“MI clay” reservoirs).
“Bottom calcium” is used to describe the carbonate minerals that mainly develop at the base of the permeable layer at the interphase between the sand layer and impermeable layer. These carbonate minerals completely fill the intergranular pore and enclose several grains, simultaneously reducing the porosity drastically. “Bottom calcium” reservoirs are normally characterized by low permeability and high porosity with poikilotopic carbonate and euhedral rhomb dolomite cements filling in the intergranular pores (Figure 5g and Figure 7a–f). They mainly develop at the bottom of tidal channels and subaqueous distributary channels. Poikilotopic carbonate cements include calcite and Fe-calcite. The debris grains are mainly point contacts. This indicates that without early effective compaction, cementation is the main factor that reduces the porosity and permeability.
“MI clay” reservoirs with low permeability and porosity have mainly developed in the low-energy zones and the transition zone from high energy to low energy, such as the subaqueous distributary bay and at the top of the subaqueous distributary channel. The most typical feature is the MI clay minerals that fill the intergranular pores (Figure 5a), with the clastic grains mainly in tangential, flattened contact and even concave–convex contact positions, which indicates effective compaction. Compaction and MI clay minerals filling are the main factors that will reduce porosity and permeability.

4.5.2. Pore Structure Based on High-Resolution 3D CT Scanning

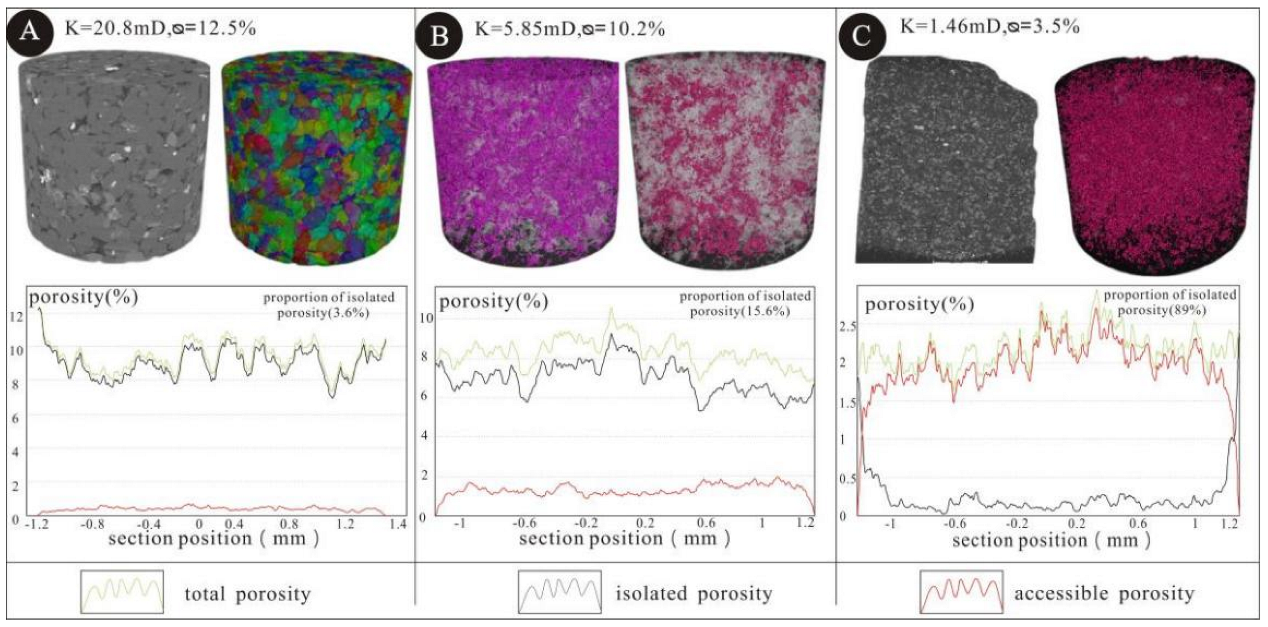
The three-dimensional (3D) visualization and pore connectivity results for the UC reservoir A1(4196.54 m) showed a porosity of 12.5% and a permeability of 20.8 mD, as shown in Figure 10A. After CT scanning, the total porosity was found to be 9.44% (Table 2), the isolated porosity was 0.39% and the accessible porosity was 9.04%, indicating that the pores are well connected.
For “bottom calcium” reservoir A5(4088.16 m) was found to have a porosity of 3.5% and a permeability of 2.19 mD, as shown in Figure 10C. After CT scanning, the total porosity was found to be 2.19%, the isolated porosity was 1.95% and the accessible porosity was 0.24% (Table 2), indicating that most pores were isolated.
The “MI clay” reservoir A7(4057.18 m) was found to have a porosity of 10.2% and a permeability of 5.85 mD, as shown in Figure 10B. After CT scanning, the total porosity was 8.3%, the isolated porosity was 1.3% and the accessible porosity was 7% (Table 2). Compared with the “bottom calcium” reservoir, the “MI clay” reservoir was found to have a larger pore radius and more connected pores.

4.6. C and O Isotopic Data

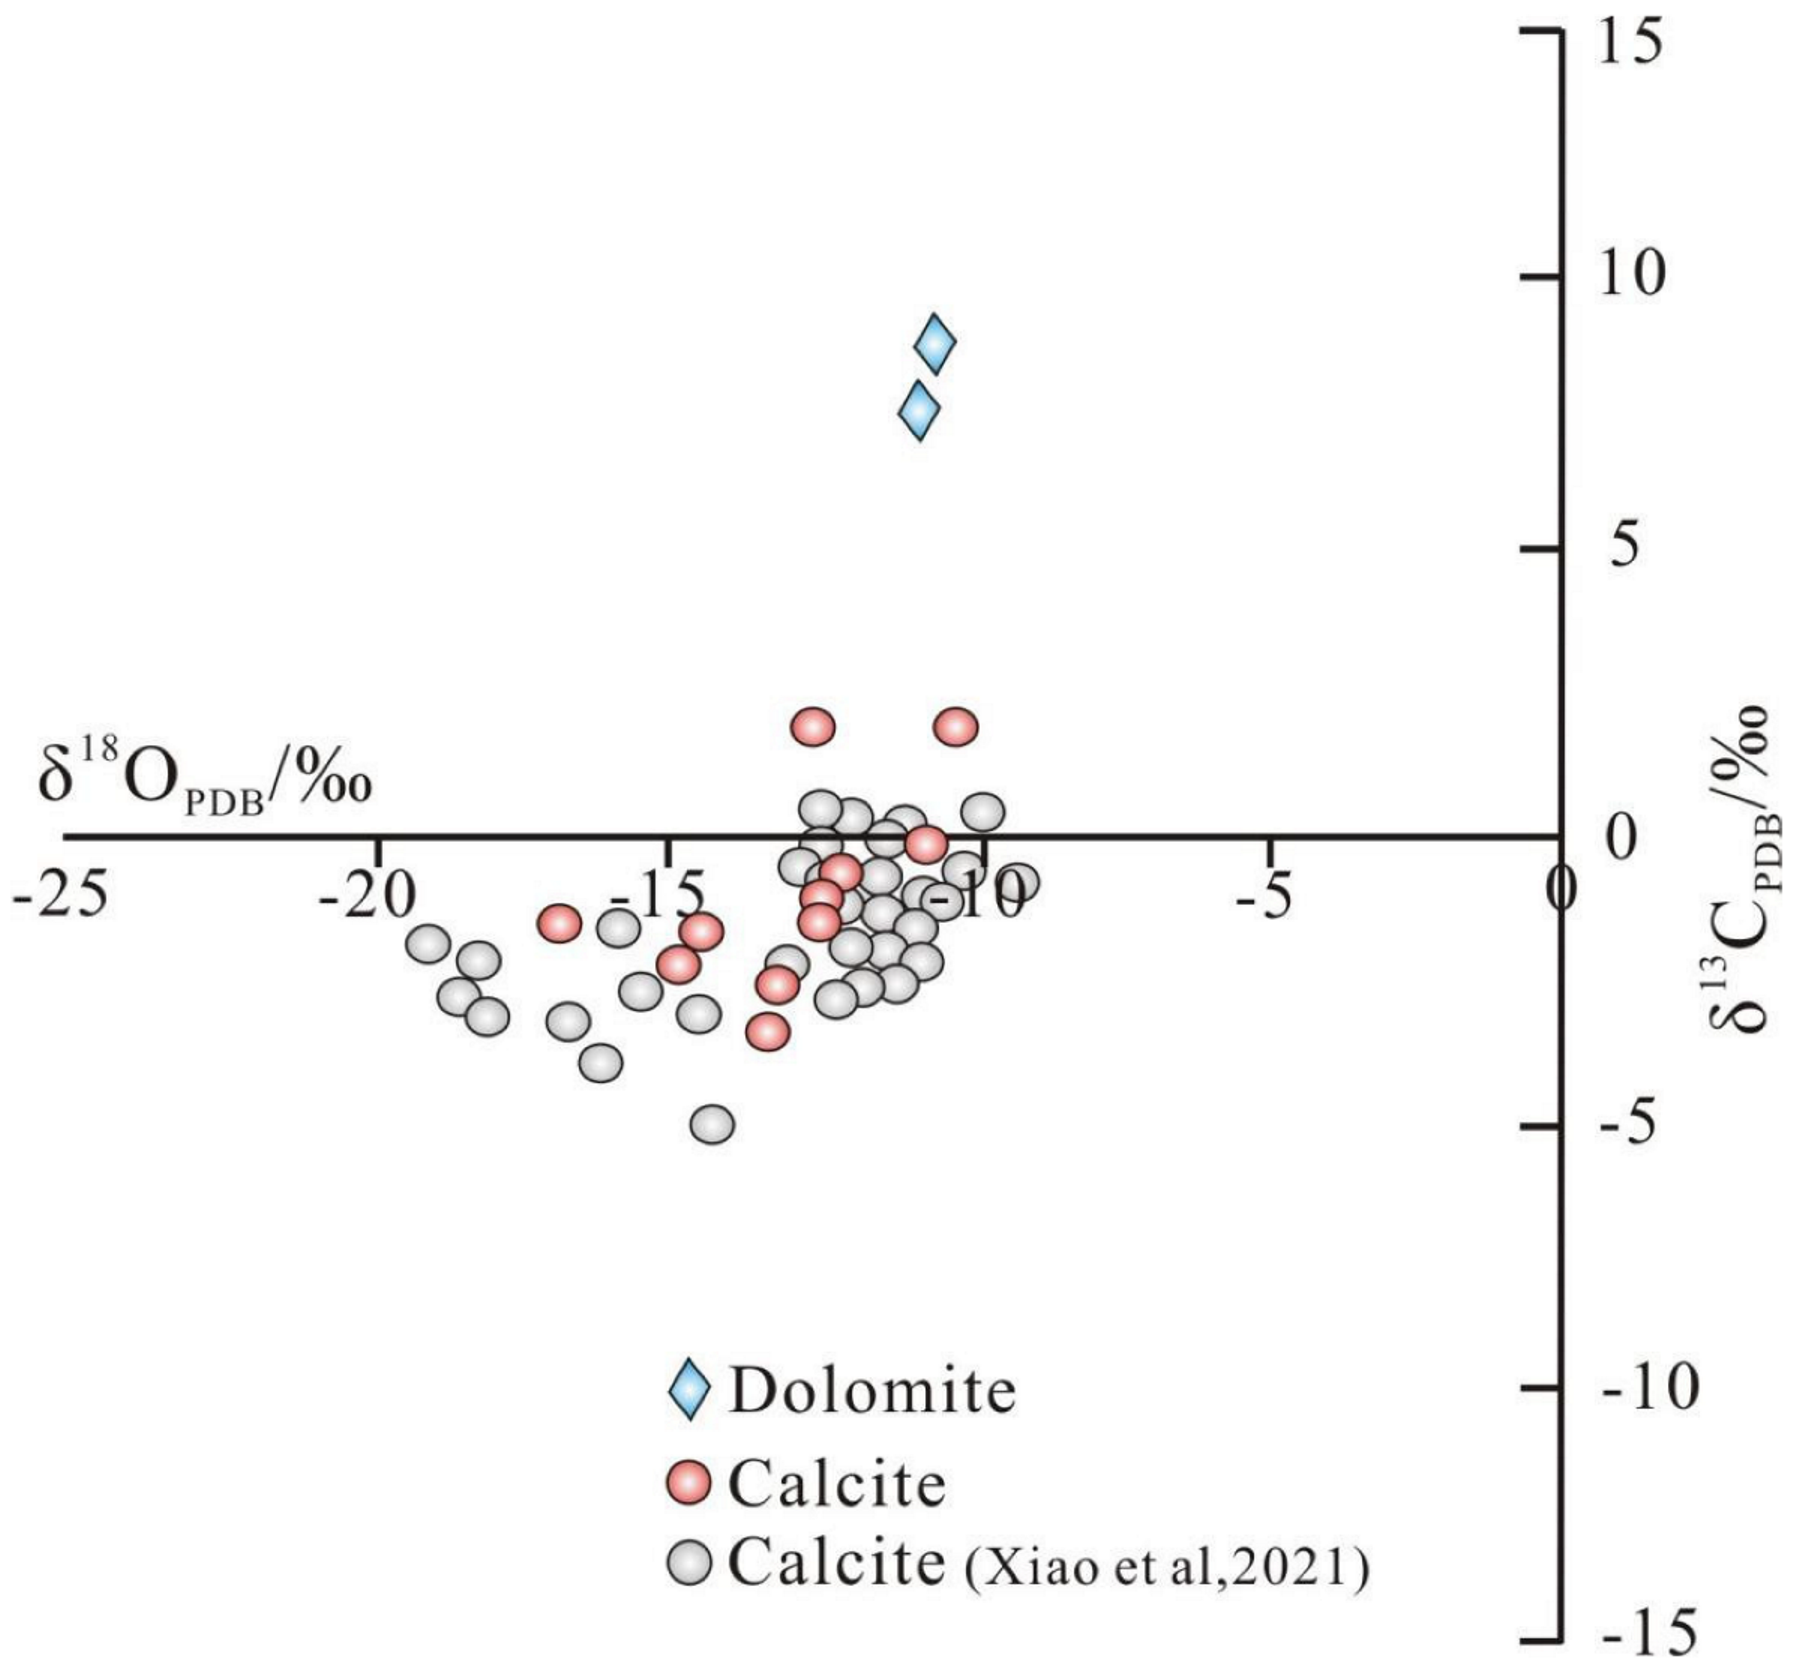
As shown in Table 3 and Figure 11, the calcite δ13C PDB values were from −3.3‰ to 3.3‰ and with an average value of 0.98‰; the δ18O PDB values for calcite were −17.5‰ to −10.2‰ with a mean value of −13.4‰. The dolomite δ13C PDB values were from 8.4‰ to 9.3‰, with an average value of 8.85%; The δ18O PDB values were −11.4‰ to −11.1‰ with a mean value of −11.25‰.

5. Discussions

5.1. Formation Mechanism of Effective Reservoir

5.1.1. The Upper Conventional Reservoir (UC Reservoir)

Calcite precipitated during eogenesis could provide a framework that may retard the adverse impacts of compaction, and the intergranular porosity keeps any potential increases during decarbonatization at greater depths [15,16,17]. Thus, the dissolution of early poikilotopic calcite will become a key process to improve reservoir quality through deep burial.
The petrographic examination conducted in this study suggests that poikilotopic calcite was precipitated during early eogenesis. The grains in the UC reservoir were found to be mainly point and long contacts (Figure 7g). This is significantly different from the LC reservoir, which was shown to have long to concave–convex grain contacts (Figure 7h). The main reason for this is that a large amount of calcite cement precipitated in the early diagenetic stage, occupying intergranular pores in advance, which retarded further compaction quartz overgrowth developed in the UC reservoir (Figure 5d and Figure 7g), while no quartz overgrowth was found in the “bottom calcium” reservoir (Figure 5f,g and Figure 7a–f). Some quartz grains were found to exhibit concave–convex contacts in the UC reservoir (Figure 7g), which is consistent with the expected continuous compaction with progressive burial. Some of the “bottom calcium” calcite cements were found to partially exhibit dull to non-luminescent characteristics (Figure 7e), suggesting that the calcite cements precipitated from a Fe-rich homogeneous fluid composition in a single event, while the late calcite presumably nucleated on earlier eogenetic calcite.
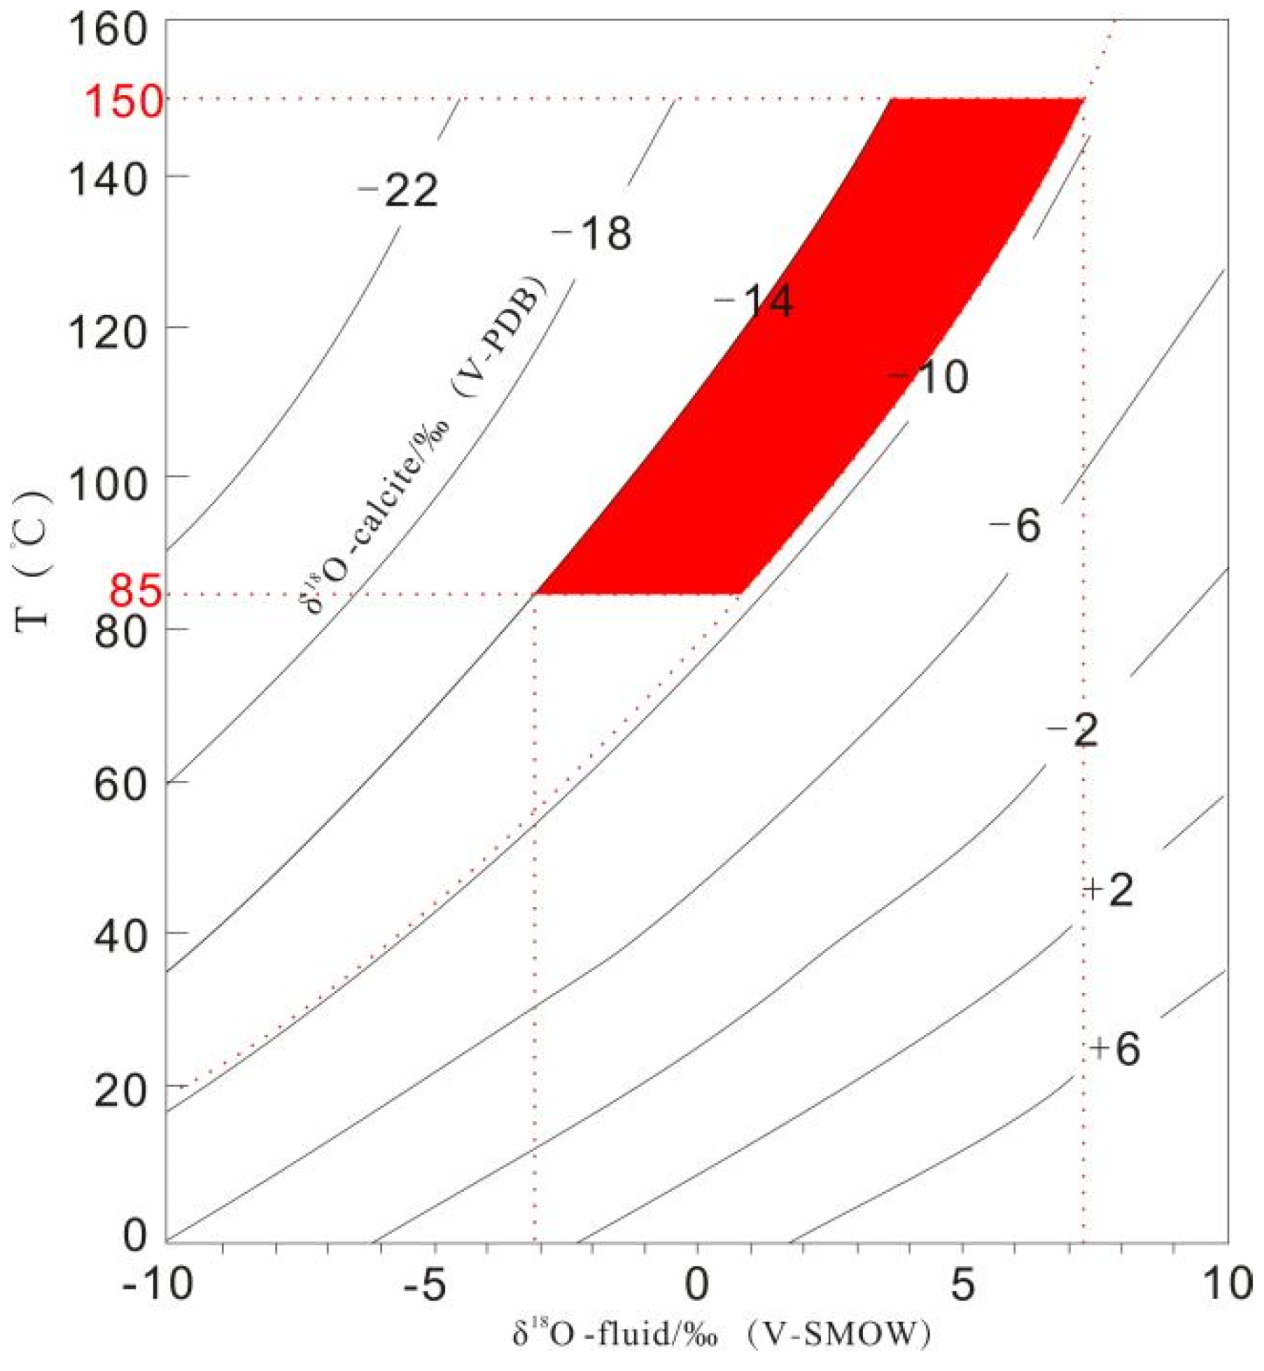
The oxygen isotopic compositions for intergranular calcite cements (−17.5‰~−10.2‰, PDB) were found to be significantly lower. It is suggested that the mixing of marine water with meteoric water might account for the similar depletion of δ18O values in offshore environments [16,56,57,58], and positive δ18O water could indicate evolved marine pore water due to interaction with silicate minerals during burial diagenesis [59]. The plot in Figure 12 gives an indication of oxygen isotope fractionation during calcite crystallization as a function of temperature and fluid composition [60,61]. The Pinghu Formation in the studied well has reached a maximum burial depth of ~4700 m, which corresponds to a temperature of approximately 150 °C by assuming a geothermal gradient of 35 °C/km. The calcite cements precipitated during mesodiagenesis would do so with the temperature being higher than 85 °C. The measured δ18O of calcite (−14‰~−10‰ PDB, as the main distribution interval) and their approximate temperature of precipitation (85 °C~150 °C), imply that the δ18O values of their parent diagenetic fluids were approximately between −1.5‰ and +7‰ SMOW (Figure 12), which corroborate the fluid evolution from marine and meteoric mixing water to basinal fluids. This implies that calcite cements formed in a later burial setting with a higher temperature.
The investigated late calcites δ13C ranged form −3.3‰ to 3.3‰ PDB, which implies that they are likely derived from mixed sources, possibly with a contribution from marine carbonate or bioclast. The abundance of carbonate clasts and bioclasts within the sandstones provides solid evidence. In addition, calcareous siltstones adjacent to the sandstones may provide additional sources for the calcite via pore fluids expelled by compaction [12,62]. The dissolution of carbonate clasts might be induced by hot basinal fluids (e.g., hydrocarbon and coals), which brings some negative δ13C signals [62,63,64].
The calcium involved in the formation of late diagenetic calcite can have several potential sources: the dissolution and re-precipitation of marine-derived bioclasts [65], the albitization of Ca-plagioclase [66] and the dissolution of volcano detrital fragments [67]. With the well-preserved carbonate clasts in the Pinghu Fm., it is, therefore, more likely that Ca was probably derived from the dissolution of the abundant bioclasts.
Early poikilotopic calcite normally develops in tidal channels and subaqueous distributary channels of tide-dominated delta fronts. Under the background of high-frequency fluctuations of the sea level, it was intermittently exposed to sea water. With the joint action of atmospheric fresh water and sea water, it is easy to have calcium cementation and a high content of carbonate cement. The TST tidal-dominated delta and HST tidal of sandstones have higher potential to be cemented by extensive calcite because of the abundance of carbonate bioclasts and organic matter [8,68,69]. A previous study [70] suggested that sediments were likely deposited in a TST system that was exposed to meteoric influence.
The development of secondary porosity (mostly enlarged pores) and throats by dissolution was the key process that improved the reservoir quality. The secondary porosity evolution might be related to the organic acids produced from the maturation of hydrocarbon and coals [68,71].
This early poikilotopic calcite has been also documented and studied by Hutcheon et al. (1985), Hesse and Abid (1998), Liu et al. (2014), and Xiong et al. (2016). In the Ti-3 sandstones of Flemish Pass Basin, over 75% of the initial porosity was lost through early calcite cementation, while the development of secondary porosity by later calcite dissolution improved the reservoir quality [16].

5.1.2. The Lower Conventional Reservoir (LC Reservoir)

LC reservoirs (developed in P4 and P5) are characterized by medium to coarse grains, extensive dissolution and long to concave–convex contacts. The sandstones in these areas have undergone effective compaction. LC reservoirs also develop in tidal channels and subaqueous distributary channel sandstones, with tidal channels providing better reservoirs than subaqueous distributary channels (according to 1203 data from 15 wells).
Secondary porosity (mostly enlarged, moldic pores) is extremely important in the LC reservoirs and is principally generated through the dissolution of detrital feldspar and later calcite due to the maturation of organic matter (e.g., hydrocarbon and coals). Compared with UC reservoirs, LC reservoirs have significantly higher lithic fragment contents and lower feldspar contents (Figure 9). We suggest that the sandstone variability in the quartz/feldspar ratio is related to differences in the degree of feldspar reaction and the locally associated secondary porosity, with most reactions being represented by low total feldspar contents. Secondary porosity produced by feldspar and carbonate dissolution has been noted by other authors in oversized pores, occurring locally in the Xihu depression [24,72]. However, as the content of late calcite is limited and the dissolution of substantial amounts of carbonate in pore spaces is harder to recognize, it is extremely difficult to provide unequivocal evidence for significant porosity generation by cement dissolution [73]. With the clear extensive generation of secondary porosity via feldspar dissolution, feldspar dissolution is considered to be the most important factor associated with the production of secondary porosity in LC reservoirs.

5.1.3. “Bottom Calcium” Low-Permeability Reservoir (“Bottom Calcium” Reservoir)

The clastic particles of “bottom calcium” reservoirs are mainly in point contacts, which indicates that, without early effective compaction, cementation is the main factor that reduces porosity and permeability. The connectivity between pores is poor, with most of the pores showing the isolated pores.
We consider that the source of carbon isotopes in “bottom calcium” reservoirs may differ between calcite and dolomite. The carbon sources of “bottom calcium” calcite are discussed in Section 5.1.1, and our results imply that calcite originated mostly from the diffusion of dissolved Ca2+ and HCO3 through carbonate clasts and bioclast dissolution induced by hot basinal fluids (e.g., hydrocarbon and coals). On the other hand, the dolomite cements have an isotopic composition that is more comparable with the generation of biogenic methane with the high positive values of δ13C [74]. Dominant generation of biogenic methane as the origin for dolomite is therefore favored here.
Poikilotopic calcite is inferred to have been, in some cases, precipitated early in the layers of the UC sandstones and then dissolved [16,69]. In addition, late-precipitated calcites formed a barrier and sealed the underlying hydrocarbons [69].
These “bottom calcium” reservoirs normally develop at the bottom of subaqueous distributary channels and tidal channels. According to the configuration relationship between “bottom calcium” reservoirs and UC reservoirs, high-quality reservoirs can be found overlying the “bottom calcium” reservoirs.

5.1.4. “MI Clay” Low-Permeability Reservoir (“MI Clay” Reservoir)

MI clay refers to the clastic clay attached to the surface of framework clastic particles [75]. The types of textures include ridges and bridges, geopetal fabrics, loose aggregates, cutans and massive aggregates [76]. Laboratory experiments and studies on Holocene Sands [75] have shown that the basis required for the development of MI clays are a high suspended sediment concentration, a fluctuating phreatic surface and minimal sediment disturbance. The development mechanism of MI clay involves a decline in the phreatic water level and the infiltration of clay-containing water [76]. The specific process is as follows: ① when the majority of the infiltrating water accumulates and evaporates above the phreatic level, the MI clays enrichment zone can develop within the vadose zone, giving rise to geopetal fabrics; ② when the infiltrating clay-containing water concentrates near the phreatic level, MI clays can accumulate in the phreatic zone to form an enrichment zone, characterized by the texture of cutans, which appear as lamellae oriented parallel to the grain surface; ③ When clay-containing water encounters an impermeable barrier (such as bedrock, shale layer, buried soils or caliche layers) during the process of infiltration, MI clays can accumulate at the base of the permeable layer as an enrichment zone; and ④ the above three modes are all controlled by the distance from the water source of the infiltrating water, where the closer the water source is, the greater the content of MI clays will be. The migration of the subaqueous channel will form a relatively thin MI clay enrichment zone with significant lateral extension. When the channel cuts deeper, it will form a relatively thick MI clay enrichment zone. At present, it has been recognized that ① the presence of MI clays reduces the initial porosity of sandstone [77]; ② MI clays form shrinkage pores [75]; and ③ the high content of MI clays greatly reduces the permeability and forms an impermeable barrier [8,75].
“MI clays” reservoirs develop in subaqueous distributary bays and at the top of subaqueous distributary channels.

5.2. Vertical Distribution of the “Bottom Calcium” Reservoir and the UC Reservoir

As the pervasive calcite cement has important effects on the reservoir quality, we tried to determine the vertical distribution of “bottom calcium” reservoir and UC reservoirs.
The typical distribution rule is that UC reservoirs normally develop in tidal channels and subaqueous distributaries, with the bottom of the sand-body being extensively cemented by carbonate cements (“bottom calcium” reservoir). The thickness of the “bottom calcium” is generally less than 1 m, with an average of 0.1–0.3 m. Taking well A2 as an example (Figure 13), the tidal channel sand-body developed at a depth of 4183.5–4184 m. Under the polarized light microscope, sandstone in the bottom of the tidal channel (4148 m) was shown to display typical “bottom calcium” cementation. The cement is dolomite, which fills almost all intergranular pores; at the depths between 4183.7 m and 4184 m, the intergranular pores are partly occupied by dolomite, and a certain number of intragranular dissolution pores and even moldic pores also occur. Therefore, the porosity in this layer can be relatively high but with few effective (connectable) pores, so the permeability is low. From 0.4 m above the bottom of the sand-body, the UC reservoir begins to develop, and the permeability rapidly increases from 10.9 mD (at 4183.6 m) to 141 mD (at 4183.5 m). The particles mainly have point and long contact characteristics. Both intergranular and intragranular pores are present, with effective connected pores accounting for a relatively high proportion of the total. The thickness of the “bottom calcium” in A2 can be estimated as 0.3 m. A similar configuration relationship was also seen at well A1 (Figure 14), with the subaqueous distributary channel developed at depths of 4190–4202 m.
The above vertical distribution characteristics of “bottom calcium” reservoirs and UC reservoirs further confirms that the carbonate cements in tide-dominated delta systems play an important role in the diagenetic alterations and the reservoir quality evolution. In UC reservoirs, it is the precipitation of early poikilotopic calcite that halts mechanical compaction. Conversely, for “bottom calcium” reservoirs, the retained bottom calcium cements (include calcite, Fe-calcite and dolomite) completely fill intergranular pore areas and drastically reduce the porosity. Simultaneously, the sample density increases with the decrease in porosity (Table 4).

5.3. Summary Model for the Diagenetic Alterations and Reservoir Quality Evolution

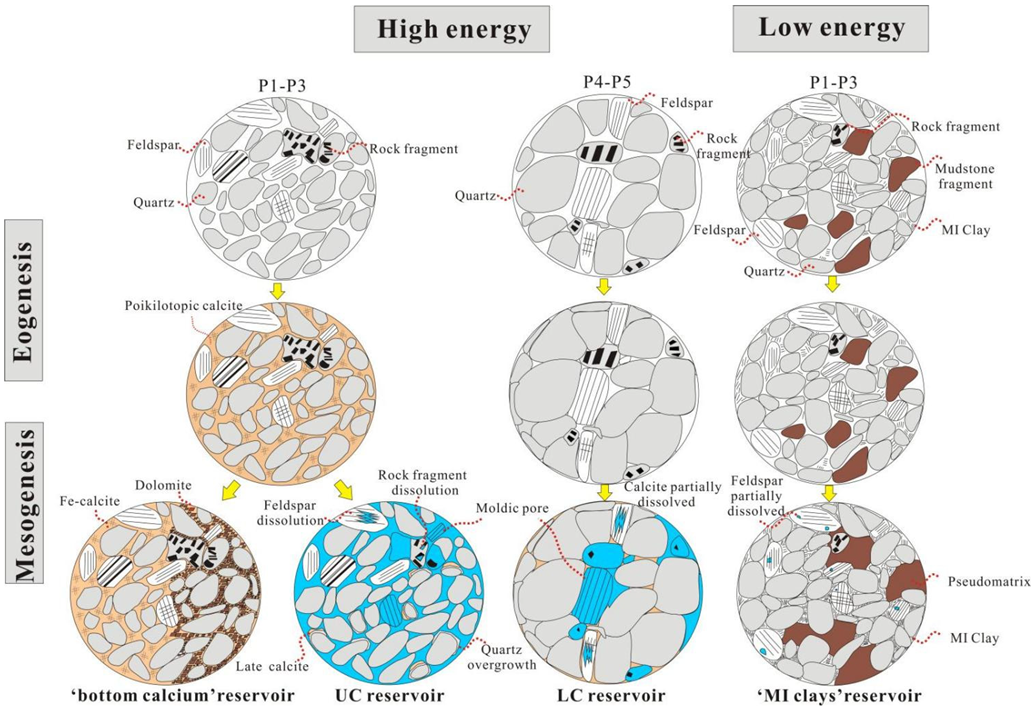
The model used for the diagenetic alterations and reservoir quality evolution is summarized in Figure 15. The formation mechanism of effective reservoir is generally controlled by sedimentary facies and the diagenetic evolution process. In particular, the depositional facies have a considerable impact on the distribution of eogenetic and mesogenetic alterations [8].
Firstly, the clastic components controlled by sedimentary facies and provenance differ in the early stage of deposition: in high-energy environments, such as subaqueous distributary channels and tidal channels, the level of hydrodynamic energy is high, and fine-grained argillaceous sediments cannot be deposited. The initial clasts are mainly quartz, feldspar and rock debris. In the early diagenetic stage, the upper reservoirs (P1–P3) are affected by sea level fluctuations, and early poikilotopic calcite precipitates, preventing the further compaction of particles, The particles are mainly in point line contact; eogenetic alterations exert substantial control on the deep-burial, mesogenetic evolution of sandstones, because burial diagenesis is constrained by the extent of the fluid flow through the remaining pores and is influenced by the presence of earlier diagenetic products [8]. In the middle diagenetic stage, early calcite is dissolved by acid fluids, leading to the formation of UC reservoirs. Dissolved pores are also seen in low-permeability reservoirs today, but due to the filling of bottom calcium cement between particles, the pore connectivity is poor and the permeability is low. The LC reservoirs (P4-P5) did not develop poikilotopic calcite during eogenesis and are mainly characterized by long contacts or concave–convex contacts of particles. In mesodiagenesis, the dissolution of feldspar or unstable rock debris provides an opportunity for the formation of secondary pores [78]. Therefore, LC reservoirs have certain requirements in terms of the particle sizes of the initial clastic components, which are mainly medium or coarse particles.
Secondly, the relatively low-energy facies belt mainly contains pseudomatrix and MI clays, and the tide-dominated delta is characterized by MI clays (formed by the downward percolation of suspended fine-grained clay under hydrostatic or weak hydrodynamic conditions). Tidal flat sediments are characterized by pseudomatrix, which is mostly developed on the mud flats. Because the hydrodynamic energy of the overall sedimentary environment is relatively weak, ion exchange in the pore water is also weak. Without sufficient calcium sources, the early poikilotopic calcite cannot be extensively precipitated. Therefore, low-permeability reservoirs are mainly composed of long and concave–convex contacts, and the particles are filled with MI clays and pseudomatrix.

6. Conclusions

  • The petrographic results suggest that the sandstones in the study area have undergone complex diagenetic processes. The dominant eogenetic features include the pervasive precipitation of early poikilotopic calcite cements in the high-energy zone. Subsequent mesogenetic events include: (i) the extensive dissolution of feldspars and calcite due to the emplacement of organic acids; (ii) the precipitation of kaolinites and quartz cements, and (iii) the late calcite, Fe-calcite and dolomite cements.
  • UC reservoirs are characterized by high intergranular porosity, normal fine to very fine grains with point to long contacts. LC reservoirs are characterized by medium to coarse grains, extensive dissolution of feldspar and long or even concave–convex grain contacts. Compared with UC reservoirs, LC reservoirs have significantly lower quartz/feldspar ratios, which is related to differences in the number of feldspar reactions and the associated local secondary porosity. UC reservoirs normally develop in the middle of tidal channels and subaqueous distributary channels, with the base of the sand-body being extensively cemented by poikilotopic calcite cements and euhedral rhomb dolomite cements.
  • Poikilotopic calcite cements normally develop in tidal channels and subaqueous distributary channels of tide-dominated delta. They may precipitate from diagenetic fluids of evolved mixed marine and meteoric waters that became hotter with progressive burial in the basin. The carbon sources of the “bottom calcium” calcite mostly originate from the dissolution of carbonate clasts and bioclast, while dolomite is more comparable to the generation of biogenic methane with high positive δ13C values.
  • The eogenesis of poikilotopic calcite provided a framework to retard the adverse impacts of compaction in the P1–P3 Formation. For the lower laryers (P4–P5), poikilotopic calcite cementation is limited, and the secondary pores that are mostly formed by the dissolution of feldspar or unstable rock fragments and LC reservoirs can only develop in coarser sandstone, which limits their regional distribution.

Author Contributions

Conceptualization, S.Z., K.W. and N.L.; experimental analysis, S.Z. and X.P.; validation, S.Z. and Y.C.; resources, K.W. and Y.C.; data curation, S.Z.; writing—original draft preparation, S.Z. and N.L.; writing—review and editing, N.L.; funding acquisition, N.L. All authors have read and agreed to the published version of the manuscript.

Funding

This work was financially supported by the National Natural Science Foundation of China (No.42272146, No.41202073). Formation mechanism and prediction of deep effective reservior in Xihu Sag (CCL2020RCPS0048ESN).

Data Availability Statement

The data is available on reasonable request from the corresponding author.

Acknowledgments

We would like to thank the geologists of CNOOC Research Institute and CNOOC’s Shanghai branch district for their support of essential data.

Conflicts of Interest

The authors declare no conflict of interest.

References

  1. Anovitz, L.M.; Cole, D.R.; Rother, G.; Allard, L.F.; Jackson, A.J.; Littrell, K.C. Diagenetic changes in macro-to nano-scale porosity in the St. Peter Sandstone: An (ultra) small angle neutron scattering and backscattered electron imaging analysis. Geochem. Cosmochim. Acta 2013, 102, 280–305. [Google Scholar] [CrossRef]
  2. Anovitz, L.M.; Cole, D.R.; Jackson, A.J.; Rother, G.; Littrell, K.C.; Allard, L.F.; Pollington, A.D.; Wesolowski, D.J. Effect of quartz overgrowth precipitation on the multiscale porosity of sandstone: A (U) SANS and imaging analysis. Geochem. Cosmochim. Acta 2015, 158, 199–222. [Google Scholar] [CrossRef] [Green Version]
  3. Anovitz, L.M.; Cole, D.R. Characterization and analysis of porosity and pore structures. Rev. Mineral. Geochem. 2015, 80, 61–164. [Google Scholar] [CrossRef] [Green Version]
  4. Golab, A.N.; Knackstedt, M.A.; Averdunk, H.; Senden, T.; Butcher, A.R.; Jaime, P. 3D porosity and mineralogy characterization in tight gas sandstones. Lead. Edge 2010, 29, 1476–1483. [Google Scholar] [CrossRef]
  5. Lai, J.; Wang, G.; Fan, Z.; Zhou, Z.; Chen, J.; Wang, S. Fractal analysis of tight shaly sandstones using nuclear magnetic resonance measurements. AAPG Bull. 2018, 102, 175–193. [Google Scholar] [CrossRef]
  6. Oluwadebi, A.G.; Taylor, K.G.; Ma, L. A case study on 3D characterisation of pore structure in a tight sandstone gas reservoir: The Collyhurst Sandstone, East Irish Sea Basin, northern England. J. Nat. Gas Sci. Eng. 2019, 68, 102917. [Google Scholar] [CrossRef]
  7. Tsakiroglou, C.D.; Payatakes, A.C. Characterization of the pore structure of reservoir rocks with the aid of serial sectioning analysis, mercury porosimetry and network simulation. Adv. Water Resour. 2000, 23, 773–789. [Google Scholar] [CrossRef]
  8. Morad, S.; Al-Ramadan, K.; Ketzer, J.M.; De Ros, L.F. The impact of diagenesis on the heterogeneity of sandstone reservoirs: A review of the role of depositional facies and sequence stratigraphy. AAPG Bull. 2010, 94, 1267–1309. [Google Scholar] [CrossRef]
  9. Saigal, G.C.; Bjørlykke, K. Carbonate cements in clastic reservoir rocks from offshore Norway- relationships between isotopic composition, textural development and burial depth. Geol. Soc. Lond. Spec. Publ. 1987, 36, 313–324. [Google Scholar] [CrossRef]
  10. Bjørlykke, K.; Ramm, M.; Saigal, G.C. Sandstone diagenesis and porosity modification during basin evolution. Geol. Rundsch. 1989, 78, 243–268. [Google Scholar] [CrossRef]
  11. Taylor, T.R. The influence of calcite dissolution on reservoir porosity in Miocene sandstones, Picaroon Field, offshore Texas Gulf Coast. J. Sediment. Res. 1990, 60, 322–334. [Google Scholar]
  12. Dutton, S.P.; Willins, B.J.; White, C.D.; Bhattacharya, J.P. Outcrop characterization of reservoir quality and interwell-scale cement distribution in a tideinfluenced delta, Frontier Formation, Wyoming, USA. Clay Miner. 2000, 35, 95–105. [Google Scholar] [CrossRef]
  13. Longstaffe, F.J.; Calvo, R.; Ayalon, A.; Donaldson, S. Stable isotope evidence for multiple fluid regimes during carbonate cementation of the Upper Tertiary Hazeva Formation, Dead Sea Graben, southern Israel. J. Geochem. Explor. 2003, 80, 151. [Google Scholar] [CrossRef]
  14. Nyman, S.L.; Gani, M.R.; Bhattacharya, J.P.; Lee, K. Origin and Distribution of Calcite Concretions in Cretaceous Wall Creek Member, Wyoming: Reservoirquality implication for shallow-marine deltaic strata. Cretac. Res. 2014, 48, 139–152. [Google Scholar] [CrossRef]
  15. Liu, S.; Huang, S.; Shen, Z.; Lü, Z.; Song, R. Diagenetic fluid evolution and water-rock interaction model of carbonate cements in sandstone: An example from the reservoir sandstone of the Fourth Member of the Xujiahe Formation of the Xiaoquan-Fenggu area, Sichuan Province, China. Sci. China (Earth Sci.) 2014, 57, 1077–1092. [Google Scholar] [CrossRef]
  16. Xiong, D.; Azmy, K.; Blamey, N.J.F. Diagenesis and origin of calcite cement in the Flemish Pass Basin sand- stone reservoir (Upper Jurassic): Implications for porosity development. Mar. Pet. Geol. 2016, 70, 93–118. [Google Scholar] [CrossRef]
  17. Hesse, R.; Abid, A. Carbonate cementation-the key to reservoir properties of four sandstone levels (Cretaceous) in the Hibernia Oilfield, Jeanne d’Arc Basin, Newfoundland, Canada. Spec. Publ. Int. Assoc. Sedimentol. 1998, 26, 141–3600. [Google Scholar]
  18. Brown, D.M.; McAlpine, K.D.; Yole, R.W. Sedimentology and sandstone diagenesis of Hibernia Formation in Hibernia oil field, Grand Banks of Newfoundland. AAPG Bull. 1989, 73, 557–575. [Google Scholar]
  19. Baker, J.C.; Havord, P.J.; Martin, K.R.; Ghori, K.A.R. Diagenesis and petrophysics of the early Permian Moogooloo sandstone, southern Carnarvon basin, western Australia. AAPG Bull. 2000, 84, 250–265. [Google Scholar]
  20. McBride, E.F.; Picard, M.D.; Milliken, K.L. Calcite-cemented concretions in Cretaceous sandstone, Wyoming and Utah, USA. J. Sediment. Res. 2003, 73, 462–483. [Google Scholar] [CrossRef]
  21. Odigi, M.I.; Amajor, L.C. Geochemistry of carbonate cements in Cretaceous sandstones, southeast Benue Trough, Nigeria: Implications for geochemical evolution of formation waters. J. Afr. Earth Sci. 2010, 57, 213–226. [Google Scholar] [CrossRef]
  22. Azomani, E.; Azmy, K.; Blamey, N.; Brand, U.; Al-Aasm, I. Origin of Lower Ordovician dolomites in eastern Laurentia: Controls on porosity and implications from geochemistry. Mar. Pet. Geol. 2013, 40, 99–114. [Google Scholar] [CrossRef] [Green Version]
  23. García-García, F.; Marfil, R.; De Gea, G.A.; Delgado, A.; Kobstädt, A.; Santos, A.; Mayoral, E. Reworked marine sandstone concretions: A record of highfrequency shallow burial to exhumation cycles. Facies 2013, 59, 843–861. [Google Scholar] [CrossRef]
  24. Su, A.; Chen, H.H.; Chen, X.; He, C.; Liu, H.P.; Li, Q.; Wang, C.W. The characteristics of low permeability reservoirs, gas origin, generation and charge in the central and western Xihu depression, East China Sea Basin. J. Pet. Sci. Eng. 2018, 53, 94–109. [Google Scholar] [CrossRef]
  25. Wang, W.G.; Lin, C.Y.; Zhang, X.G.; Dong, C.M.; Ren, L.H.; Lin, J.L. Effect of burial history on diagenetic and reservoir-forming process of the Oligocene sandstone in Xihu sag, East China Sea Basin. Mar. Pet. Geol. 2020, 112, 104034. [Google Scholar] [CrossRef]
  26. Xu, F.H.; Xu, G.S.; Liu, W.; Cui, H.Y.; Wang, Y.R. Factors controlling the development of tight sandstone reser- voirs in the Huagang Formation of the central inverted structural belt in Xihu sag, East China Sea Basin. Pet. Explor. Dev. 2020, 47, 101–113. [Google Scholar] [CrossRef]
  27. Wang, W.G.; Lin, C.Y.; Zhang, X.G.; Dong, C.M.; Ren, L.H.; Lin, J.L. Provenance, clastic composition and their impact on diagenesis A case study of the Oligocene sandstone in the Xihu sag, East China Sea Basin. Mar. Pet. Geol. 2021, 126, 10490. [Google Scholar] [CrossRef]
  28. Zeng, F.; Dong, C.M.; Lin, C.Y.; Wu, Y.Q.; Tian, S.S.; Zhang, X.G.; Lin, J.L. Analyzing the effects of multiscale pore systems on reservoir Properties—A case study on Xihu Depression, East China Sea Shelf Basin, China. J. Pet. Sci. Eng. 2021, 203, 108609. [Google Scholar] [CrossRef]
  29. Duan, D.P.; Zhang, X.G.; Liu, B.B.; Lin, J.L.; Wang, W.G. The Relationship between Chlorite and Reservoir Quality in the Huagang Formation, Xihu Depression, China. Energies 2022, 15, 3438. [Google Scholar] [CrossRef]
  30. Qian, W.D.; Sun, Q.L.; Jones, S.J.; Yin, T.J.; Zhang, C.M.; Xu, G.S.; Hou, G.W.; Zhang, B. Diagenesis and controlling factors of Oligocene Huagang Formation tight sandstone reservoir in the south of Xihu sag, the East China Sea Shelf Basin. J. Pet. Sci. Eng. 2022, 215, 110579. [Google Scholar] [CrossRef]
  31. Wang, Y.X.; Chen, J.F.; Pang, X.Q.; Zhang, T.; Zhu, X.J.; Liu, K.X. Hydrocarbon generation and expulsion of tertiary coaly source rocks and hydrocarbon accumulation in the Xihu Sag of the East China Sea Shelf Basin, China. J. Asian Earth Sci. 2022, 229, 105170. [Google Scholar] [CrossRef]
  32. Zeng, F.; Dong, C.W.; Lin, C.Y.; Tian, S.S.; Wu, Y.Q.; Lin, J.L.; Liu, B.B.; Zhang, X.G. Pore structure characteristics of reservoirs of Xihu Sag in East China Sea Shelf Basin based on dual resolution X-ray computed tomography and their influence on permeability. Energy 2022, 239, 122386. [Google Scholar] [CrossRef]
  33. Jiang, L.; Tian, H.Q.; Ma, Y.X.; Zhao, Y.S. Petroleum System and Target Evaluation in Xihu Sag, East China Sea Shelf Basin; Petroleum University Publishing House: Dongying, China, 2000; pp. 16–133, (In Chinese with English abstract). [Google Scholar]
  34. Zhu, X.J.; Chen, J.F.; Li, W.; Pei, L.X.; Liu, K.X.; Chen, X.D.; Zhang, T.L. Hydrocarbon generation potential of Paleogene coals and organic rich mudstones in Xihu sag, East China Sea Shelf basin, offshore eastern China. J. Pet. Sci. Eng. 2020, 184, 106450. [Google Scholar] [CrossRef]
  35. Wang, W.G.; Lin, C.Y.; Zhang, X.G.; Dong, C.M.; Ren, L.H.; Lin, J.L. Structural controls on sandstone compa- cation within the anticline crest and flank An example from the Xihu Sag, East China Sea Basin. J. Pet. Sci. Eng. 2022, 211, 110157. [Google Scholar] [CrossRef]
  36. Li, S.X.; Shao, L.Y.; Liu, J.S.; Qin, L.Z.; Kang, S.L.; Eriksson, K.A.; Chen, X.D.; Yu, Z.K.; Liu, J.Z. Oil generation model of the liptinite-rich coals Palaeogene in the Xihu Sag, East China Sea Shelf Basin. J. Pet. Sci. Eng. 2022, 209, 109844. [Google Scholar] [CrossRef]
  37. Su, A.; Chen, H.H.; Lei, M.Z.; Li, Q.; Wang, C.W. Paleo-pressure evolution and its origin in the Pinghu slope belt of the Xihu Depression, East China Sea Basin. Mar. Pet. Geol. 2019, 107, 198–213. [Google Scholar] [CrossRef]
  38. Shen, Y.L.; Qin, Y.; Cui, M.; Xie, G.L.; Guo, Y.H.; Qu, Z.H.; Yang, T.Y.; Yang, L. Geochemical Characteristics and Sedimentary Control of Pinghu Formation (Eocene) Coal-bearing Source Rocks in Xihu Depression, East China Sea Basin. Acta Geol. Sin. (Engl. Ed.) 2021, 95, 91–104. [Google Scholar] [CrossRef]
  39. Yang, C.Q.; Yang, Y.Q.; Yang, C.S. Tectono-sedimentary evolution of the Mesozoic in the southern East China Sea Shelf Basin and its bearing on petroleum exploration. Mar. Geol. Quat. Geol. 2019, 39, 30–40, (In Chinese with English abstract). [Google Scholar]
  40. Xu, F. Characteristics of Caenozoic Structure and Tectonic Miaration of the East China Sea Shelf Basin. J. Oil Gas Technol. 2012, 34, 1–7, (In Chinese with English abstract). [Google Scholar]
  41. Mi, C.Y. The Fault Characteristics and Evolution of Central Inversion Tectonic Belt and Pinghu Slope in Xihu Sag. Master’s Thesis, Ocean University of China, Qingdao, China, 2015. (In Chinese with English abstract). [Google Scholar]
  42. Zhou, Z.Y.; Jiang, J.Y.; Liao, Z.T. Basin inverssion in Xihu depression, East China Sea. Gondwana Res. 2001, 4, 844–845, (In Chinese with English abstract). [Google Scholar]
  43. Li, C.F.; Zhou, Z.Y.; Ge, H.P. Rifting process of the Xihu depression, East China Sea Basin. Tectonophysics 2009, 472, 135–147, (In Chinese with English abstract). [Google Scholar] [CrossRef]
  44. Yu, Z.K.; Ding, F.; Zhao, H. Characteristics of structural evolution and classifcation of hydrocarbon migration and accumulation units in Xihu Sag, China. Shanghai Land Resour. 2018, 39, 75–78, (In Chinese with English abstract). [Google Scholar]
  45. Zhu, Y.; Yu, Y.F.; Zhang, T.; Zhang, S.I.; Tang, X.J. Geochemical characteristics of Tertiary coal- bearing source rocks in Xihu depression, East China Sea Basin. Mar. Pet. Geol. 2012, 35, 154–165. [Google Scholar] [CrossRef]
  46. Su, A.; Chen, J.H.; Wang, C.W.; Li, P.J.; Zhang, H.; Xiong, W.L.; Lei, M.Z. Genesis and maturity identification of oil and gas in the Xihu Sag, East China Sea Basin. Pet. Explor. Dev. 2013, 40, 521–527, (In Chinese with English abstract). [Google Scholar] [CrossRef]
  47. Abbas, A.; Zhu, H.T.; Zeng, Z.W.; Zhou, X.H. Sedimentary facies analysis using sequence stratigraphy and seismic sedimentology in the Paleogene Pinghu Formation, Xihu depression, East China Sea Shelf Basin. Mar. Pet. Geol. 2018, 93, 287–297. [Google Scholar] [CrossRef]
  48. Zhu, W.; Zhong, K.; Fu, X.; Chen, C.; Zhang, M.; Gao, S. The formation and evolution of the East China Sea Shelf Basin: A new view. Earth Sci. Rev. 2019, 190, 89–111. [Google Scholar]
  49. Zhao, L.N.; Chen, J.W.; Zhang, Y.G. Sedimentary characteristics of Pinghu Formation in Pinghu structural belt of Xihu depression, East China Sea. World Geol. 2008, 27, 42–47, (In Chinese with English abstract). [Google Scholar]
  50. Jiang, Y.M.; Diao, H.; Zeng, W.Q. Coal source rock conditions and hydrocarbon generation model of Pinghu Formation in Xihu Depression, East China Sea Basin. Bull. Geol. Sci. Technol. 2020, 39, 30–39, (In Chinese with English abstract). [Google Scholar]
  51. Liu, Y.H.; Cai, H.; Duan, D.P. The sedimentary characteristics of tidal delta and tidal flat in transgressive system tract of Pinghu Formation in Pinghu area, Xihu Sag. Mar. Geol. Front. 2020, 38, 33–40, (In Chinese with English abstract). [Google Scholar] [CrossRef] [Green Version]
  52. Lindholm, R.C.; Finkelman, R.B. Calcite staining; semiquantitative determination of ferrous iron. J. Sediment. Res. 1972, 42, 239–242. [Google Scholar] [CrossRef]
  53. McCrea, J.M. The isotopic chemistry of carbonates and a paleotemperature scale. J. Chem. Phys. 1950, 18, 849–857. [Google Scholar] [CrossRef]
  54. Xie, X.J.; Xiong, L.Q.; Chen, Y.; Li, L.Z.; Zhang, C.Y.; Bai, H.Q.; Liao, J.H. Low permeability reservoir characteristics and controlling factor of “Sweet Points” of Pinghu Formation in Xihu Sag. Sci. Technol. Eng. 2021, 21, 12890–12900, (In Chinese with English abstract). [Google Scholar]
  55. Xiao, X.X.; Qin, L.Z.; Zhang, W.; Jiang, X.; Xie, J.J. The origin of carbonate cements and the influence on reservoir quality of Pinghu Formation in Xihu Sag. Chin. J. Geol. 2021, 56, 1062–1076. [Google Scholar]
  56. Land, L.S. Oxygen and carbon isotopic composition of Ordovician brachio pods: Implications for coeval seawater: Discussion. Geochim. Cosmochim. Acta 1995, 59, 2843–2844. [Google Scholar] [CrossRef]
  57. Hutcheon, I.; Nahnybida, C.; Rouse, H.R.K. The geochemistry of carbonate cements in the Avalon sand, grand Banks of Newfoundland. Mineral. Mag. 1985, 49, 457–467. [Google Scholar] [CrossRef]
  58. Scotchman, I.C. The geochemistry of concretions from the Kimmeridge Clay Formation of southern and eastern England. Sedimentology 1991, 38, 79–106. [Google Scholar] [CrossRef]
  59. Denny, A.C.; Fall, A.; Orland, I.J.; Valley, J.W.; Eichhubl, P.; Laubach, S.E. A history of pore water oxygen isotope evolution in the cretaceous travis peak formation in East Texas. Geol. Soc. Am. Bull. 2020, 132, 1626–1638. [Google Scholar] [CrossRef]
  60. Friedman, I.; O’Neil, J.R. Compilation of Stable Isotope Fractionation Factors of Geochemical Interest; US Government Printing Office: Washington, DC, USA, 1977; Volume 49. [Google Scholar]
  61. Zheng, Y.F. Oxygen isotope fractionation in carbonate and sulfate minerals. Geochem. J. 1999, 33, 109–126. [Google Scholar] [CrossRef] [Green Version]
  62. Irwin, H.; Coleman, M.; Curtis, C.D. Isotopic evidence for source of diagenetic carbonates formed during burial of organic-rich sediments. Nature 1977, 269, 209–213. [Google Scholar] [CrossRef]
  63. Morad, S. Carbonate Cementation in Sandstones: Distribution Patterns and Geochemical Evolution; Wiley-Blackwell: Hoboken, NJ, USA, 1998; Volume 26, pp. 1–26. [Google Scholar]
  64. Faure, G.; Mensing, T.M. Isotopes: Principles and Applications; John Wiley & Sons Inc.: Hoboken, NJ, USA, 2005. [Google Scholar]
  65. Worden, R.H.; Morrall, G.T.; Kelly, S.; Mc Ardle, P.; Barshep, D.V. A renwed look at calcite cement in Marine-deltaic sandstones: The Brent Reservoir, Heather Field, Northern North Sea, UK. Geol. Soc. Spec. Publ. 2020, 484, 305–335. [Google Scholar] [CrossRef] [Green Version]
  66. Schultz, J.L.; Boles, J.; Tilton, G.R. Tracking calcium in the San Joaquin Basin, California: A strontium isotopic study of carbonate cements at North Coles Levee. Geochim. Cosochim. Acta 1989, 53, 1991–1999. [Google Scholar] [CrossRef]
  67. Mtys, S. Ferenc Molnr: The Plays and the Wives (Katalin Varge and Tams Gajd, eds). Hungrarian Q. 2007, 188, 122–129. [Google Scholar]
  68. Taylor, K.G.; Gawthorpe, R.L.; Curtis, C.D.; Marshall, J.D.; Awwiller, D.N. Carbonate cementation in a sequence-stratigraphic framework: Upper Cretaceous sandstones, Book Cliffs, Utah-Colorado. J. Sediment. Res. 2000, 70, 360–372. [Google Scholar] [CrossRef]
  69. Al-Ramadan, K.S.; Morad, J.N.; Proust, I.S.; Al-Aasm. Distribution of diagenetic alterations in siliciclastic shoreface deposits within a sequence stratigraphic framework: Evidence from the Upper Jurassic, Boulonnais, NW France. J. Sediment. Res. 2005, 75, 943–959. [Google Scholar] [CrossRef]
  70. Haynes, S.R.; Marshall, J.; Imsland-Wathne, E.; Minielly, G.; Mortlock, E.; Walderhaug, O.; Johnson, T. Depositional interpretation and reservoir characterization of the tithonian in mizzen F-09, Flemish Pass Basin, Canada. In Proceedings of Abstracts of Integration: CSEG, CSPG and CWLS GeoConvention; AAPG: Calgary, AB, Canada, 2013. [Google Scholar]
  71. Dutton, S.P. Calcite cement in Permian deep-water sandstones, Delaware Basin, west Texas: Origin, distribution, and effect on reservoir properties. AAPG Bull. 2008, 92, 765–787. [Google Scholar] [CrossRef]
  72. Zhao, Z.X.; Dong, C.M.; Zhang, X.G.; Lin, C.Y.; Huang, X.; Duan, D.P.; Lin, J.L.; Fang, Z.; Li, D. Reservoir controlling factors of the Paleogene Oligocene Huagang Formation in the north central part of the Xihu Depression, East China Sea Basin, China. J. Pet. Sci. Eng. 2019, 175, 159–172. [Google Scholar]
  73. Higgs, K.E.; Funnell, R.H.; Reyes, A.G. Changes in reservoir heterogeneity and quality as a response to high partial pressures of CO2 in a gas reservoir, New Zealand. Mar. Pet. Geol. 2013, 48, 293–322. [Google Scholar] [CrossRef]
  74. Wang, Y. Photophysical properties of fullerenes and fullerene/N, N-diethylaniline charge-transfer complexes. J. Phys. Chem. 1992, 96, 764–767. [Google Scholar] [CrossRef]
  75. Matlack, K.S.; Houseknecht, D.W.; Applin, K.R. Emplacement of clay into sand by infiltration. J. Sediment. Res. 1989, 59, 77–87. [Google Scholar]
  76. Moraes, M.A.S.; De Ros, L.F. Infiltrated clays in fluvial Jurassic sandstones of Recôncavo Basin, northeastern Brazil. J. Sediment. Res. 1990, 60, 809–819. [Google Scholar]
  77. Wolela, A.M.; Gierlowski-Kordesch, E.H. Diagenetic history of fluvial and lacustrine sandstones of the Hartford Basin (Triassic–Jurassic), Newark Supergroup, USA. Sediment. Geol. 2007, 197, 99–126. [Google Scholar] [CrossRef]
  78. Morad, S.; Ketzer, J.M.; De Ros, L.F. Spatial and temporal distribution of diagenetic alterations in siliciclastic rocks: Implications for mass transfer in sedimentary basins. Sedimentology 2000, 47, 95–120. [Google Scholar] [CrossRef]
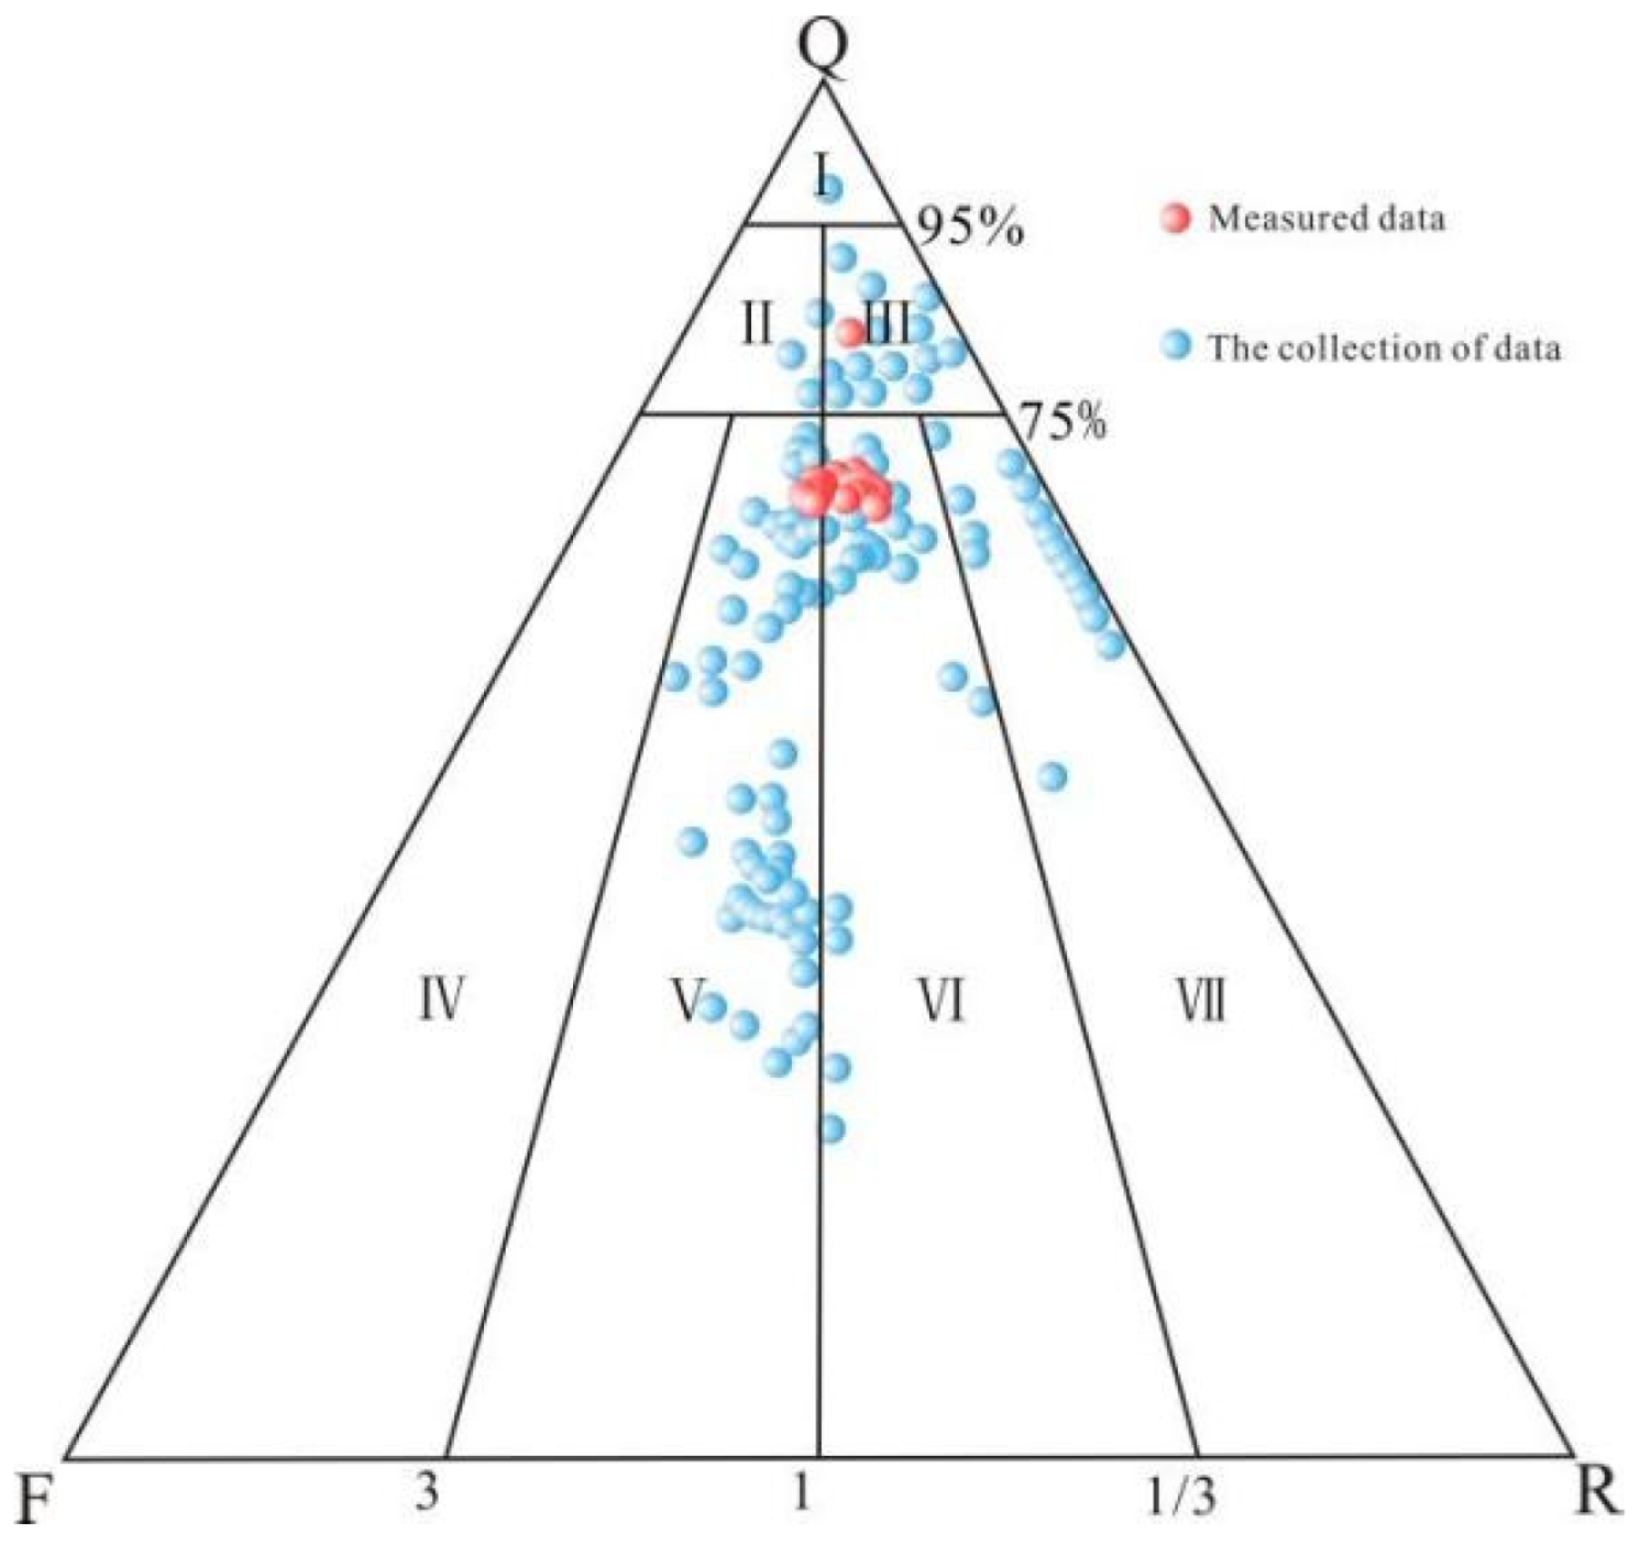
Figure 2. Schematic stratigraphic column of the Xihu Sag (modified from [24,31]).
Minerals 12 01413 g002
Figure 3. QFR triangular diagram of sandstone petrography showing the composition of the sandstones. Q, quartz; F, feldspar; R, rock fragments. Ⅰ, quartz arenite; Ⅱ, subarkose; Ⅲ, sublitharenite; Ⅳ, arkose; Ⅴ, lithic arkose; Ⅵ, feldspathic litharenite; Ⅶ, litharenite.
Minerals 12 01413 g003
Figure 4. Distribution of grain size of sandstones (collected from Shanghai Branch of CNOOC Ltd., in Pinghu Formation).
Minerals 12 01413 g004
Figure 5. Photomicrographs of petrographic features. (a) MI clay fills pores with effective compaction, well A7, 4569 m, P3, thin-section micrograph, crossed polars; (b) pseudomatrix (Pm) is plastically deformed under compaction, and changes the original shape, filling the pores between rigid particles, well A8, 3443.47 m, P3, thin-section micrograph, single polars; (c) kaolinite (Kao), microcrystalline quartz (Qm) and quartz overgrowth (Qo) fill the pores, well A5, 4183.5 m, P3; SEM; (d) feldspar overgrowth (Fo) appears as a thin fringe on the edge of feldspar grains, the growth of quartz overgrowth (Qo) was limited by feldspar overgrowth (Fo), well A8, 3440.57 m, P3, thin-section micrograph, crossed polars; (e) quartz overgrowth (Qo) developed as syntaxial overgrowth around the detrital quartz grain, calcite (Cc) fills the residual pores, well A2, 4471.5 m, P2, thin-section micrograph, crossed polars; (f) precipitation of calcite (Cc) cements completely filling intergranular pore areas and drastically reduced the porosity, framework grains exhibit contact relations ranging from point to line, indicating that compaction was not strong, well A1, 4202.77 m, P3,thin-section micrograph, crossed polars; (g) large calcite crystals present in the form of poikilotopic cement surrounding the detrital grains of the sandstones, twinning planes of calcite cements (marked by yellow arrows) occurring uninterruptedly on either side of the grains, well A1, 4202.77 m, P3,thin-section micrograph, crossed polars; (h) calcite cements, reddish in CL, fills the pores and replaced blue luminescent feldspar (yellow arrow), feldspar (red arrow), well A1, 4202.77 m, P3, CL. MI-mechanically infiltrated clay; Pm-pseudomatrix; Kao-kaolinite; Qm-microcrystalline quartz; Qo- quartz overgrowth; Cc-calcite cement.
Minerals 12 01413 g005
Figure 6. Content of carbonate cements in Pinghu Formation.
Minerals 12 01413 g006
Figure 7. Photomicrographs of characteristic petrography and conventional reservoir. (a) calcite (Cc) engulfed by Fe-calcite (FeCc), well A9, 4220 m, P3, stained thin-section micrograph, single polars; (b) Fe-calcite (stained as purple red) fills pores forms “bottom calcium”, the grain contacts are mainly point contacts indicating that compaction was not strong, well A7, 4202.7 m, P3, stained thin-section micrograph, single polars; (c) euhedral rhomb dolomite fills pores, note the development of secondary intergranular pores, well A4, 4183.8 m, thin-section micrograph, single polars; (d) euhedral rhomb dolomite among grains, well A2, 4183.87, P3, CL; (e) two generation of calcite cements with different luminescence characteristics, Calcite I (CcI) is dull to non-luminescent (green arrow), appearing around the edge of debris, Calcite II (CcII) is bright orange (yellow arrow), filling the residual pores, well A5, 4183.8 m, P3, CL; (f) the extensive developed of secondary intergranular and intragranular pores (red arrow), with some calcite cements stained as red, well A6, 4203 m, P3, stained thin-section micrograph, single polars; (g) the grains were in point to long contact, with extensive development of intergranular pores, partial dissolution of feldspar grains create oversize secondary porosity, few calcite (stained as red) can be seen in the pores, well A6, 4203 m, P3, thin-section micrograph, single polars; (h) the grains were in long and concave–convex grain contacts; note the development of moldic pore, well A6, 4203 m, P5, thin-section micrograph, single polars. FeCc- Fe-calcite; Cc- calcite; Dol- dolomite; MP-moldic pore; Qo-quartz overgrowth; F-feldspar.
Minerals 12 01413 g007
Figure 8. MI clay minerals and paragenetic sequence of the sandstones of the Pinghu Formation based on petrographic relationships.
Minerals 12 01413 g008
Figure 9. Cross plots of permeability versus (A) grains size; (B) quartz; (C) feldspar; (D) lithic.
Minerals 12 01413 g009
Figure 10. The three—dimensional (3D) visualization and the pore connectivity on three selected samples. (A) results for the UC reservoir, Well A1(4196.54 m). (B) results for “bottom calcium” reservoir, Well A5(4088.16 m). (C) results for “MI clay” reservoir, A7(4057.18 m).
Minerals 12 01413 g010
Figure 11. δ13C (PDB) versus δ13O (PDB) diagram of the carbonate cements (modified from [55]).
Minerals 12 01413 g011
Figure 12. Oxygen isotope values of calcite plotted on the temperature—dependent, calcite—water oxygen fractionation curve ([60,61]).
Minerals 12 01413 g012
Figure 13. Typical configuration between UC reservoir and “bottom calcium” reservoir developed in tidal channel for well A2 at the depth of 4183.5–4184 m. (A) UC reservoir in uncemented zone with extensive secondary intergranular pores, 4183.5 m; K = 141 mD; (B) UC reservoir in cemented zone with secondary intergranular pores and dolomite cement, 4183.6 m, K = 10.9 mD; (C) “bottom calcium” reservoir cemented by dolomite with isolated pores, 4183.7 m, K = 0.267 mD; (D) “bottom calcium” reservoir cemented by dolomite with isolated pores, 4183.8 m, K = 0.203 mD. The thickness of the “bottom calcium” in well A2 can be estimated as 0.3 m.
Minerals 12 01413 g013
Figure 14. Typical configuration between UC reservoir and “bottom calcium” reservoir developed the subaqueous distributary channel for well A1 with the depth of 4190–4202 m. (A) UC reservoir in uncemented zone with extensive secondary intergranular pores, 4192.7 m; K = 85.5 mD; (B) “bottom calcium” reservoir with abundant calcite cements, 4202 m, K = 9.5 mD.
Minerals 12 01413 g014
Figure 15. Schematic cartoon showing the diagenetic alterations and reservoir quality evolution.
Minerals 12 01413 g015
Table 1. XRD data of Pinghu Formation.
WellDepth (m)Sedimentary MicrofaciesQ (%)Kp (%)Pl (%)Cc (%)Dol (%)Bit (%)Clay (%)
A14202.46Subaqueous distributary channel6112230013
A14196.54Subaqueous distributary channel827100001
A14202.77Subaqueous distributary channel82232001
A14197.37Subaqueous distributary channel96201001
A24183.87Tidal channel606403000
A24183.62Tidal channel300506005
A24186.50Tidal channel5462801110
A33445.29Tidal channel30151253233
A33446.57Tidal channel704200024
A33447.27Tidal channel5129501500
A33443.67Tidal channel6714161002
A54088.16Mixed flat6022310212
A54089.26Mixed flat38112318316
A54087.06Tidal channel606227113
A74348.82Subaqueous distributary channel4052914228
A74057.18Subaqueous distributary channel702500005
A74055.64Subaqueous distributary channel673000003
A84343.57Subaqueous distributary channel4021540003
A84340.74Subaqueous distributary channel4942491112
A84342.54Subaqueous distributary channel682228000
A94220.00Subaqueous distributary channel50510121407
A94610.80Subaqueous distributary channel653000005
A94612.10Subaqueous distributary channel58101531112
A94615.00Subaqueous distributary channel6216146001
Q—quartz; Kp—K—fledspar; Pl—plagioclases; Cc—calcite; Dol—dolomite; Bit—biotite; Clay—MI clay.
Table 2. High-resolution 3D CT scanning of typical reservoirs in Pinghu Formation.
WellDepth
(m)
Average Diameter of Pore
(mm)
Diameter Standard
Deviation of Pore
(mm)
Accessible Volume
(mm2)
Isolated
Volume
(mm2)
Total
Volume
(mm2)
Accessible
Porosity
(%)
Isolated
Porosity
(%)
Total
Porosity
(%)
A14196.540.030.021.420.621.489.040.399.44
A54088.160.010.010.060.480.540.241.952.19
A74057.180.120.010.870.161.007.001.308.30
Institute of Geology, Chinese Academy of Geological Sciences.
Table 3. Carbon and oxygen isotopic composition for calcite and dolomite.
NumberWellDepth (m)Mineralδ13CV-PDB (%)δ18OV-PDB (%)Z
01A14202.77calcite−1.4−17.5115.72
02A24183.87dolomite9.3−11.1140.82
03A24183.62dolomite8.4−11.4138.83
04A33446.57calcite−1.4−12.6118.16
05A33447.27calcite2.5−10.2127.34
06A54088.16calcite−0.4−12.5120.26
07A54089.26calcite−3−15.3113.54
08A54087.06calcite3.3−12.6126.15
09A74348.82calcite−2.7−16.1113.75
10A94220.00calcite−2.9−13.4114.69
11A94610.80calcite−0.5−12.3120.15
12A94612.10calcite−0.1−10.6121.79
13A94615.00calcite−3.3−14.1113.52
Values per Center of Analysis, Beijing Research Institute of Uranium Geology.
Table 4. Porosity, permeability and sample density of A2 well.
Depth (m)Porosity (%)Permeability (mD)Grain DensitySample Density
4183.520.91412.632.08
4183.614.610.92.712.31
4183.711.10.2672.742.43
4183.88.80.2032.732.49
4183.98.20.1542.732.50
41843.32.712.812.72
Source: CNOOC’s Shanghai branch.
Publisher’s Note: MDPI stays neutral with regard to jurisdictional claims in published maps and institutional affiliations.